
2020-11-27
Informational purposes only. The content in this report, including allocations, analysis, and commentary, is provided solely for informational and educational purposes. It does not constitute financial advice, investment advice, trading advice, or any other type of advice. Past performance does not guarantee future results. Always conduct your own research and consult a qualified financial professional before making investment decisions.
Some tracked tickers were excluded due to missing live weekly price data: SGOV: Historical cache SGOV has only 26 usable weekly bars
Weekly Allocation
| Ticker | Category | Weight | Role |
|---|---|---|---|
| FSOL | 50% | Overlay | |
| ILF | Emerging Markets | 10% | Top-2 (10%) |
| REMX | Industrial Metals | 10% | Top-2 (10%) |
| FCG | Traditional Energy | 5% | Tier-2 (5%) |
| SMH | AI | 5% | Tier-2 (5%) |
| PAVE | Utilities & Infrastructure | 5% | Tier-2 (5%) |
| XAR | Defense & Aerospace | 5% | Tier-2 (5%) |
| CIBR | Technology | 5% | Tier-2 (5%) |
| MOO | Agriculture & Livestock | 5% | Tier-2 (5%) |
Trade Instructions — Monday Open
Sell the tranche from 2020-10-30 (completing its 4-week hold). Buy the new tranche. Instructions show net portfolio changes — same-asset positions cancel, weight changes show the delta.
| Action | Ticker | Instruction |
|---|---|---|
| SELL | IEMG | Sell 67% of IEMG position (reduce 3.75% → 1.25%) |
| SELL | XLK | Sell 50% of XLK position (reduce 2.50% → 1.25%) |
| SELL | XLU | Sell 50% of XLU position (reduce 2.50% → 1.25%) |
| SELL | SLV | Sell entire SLV position (1.25% of portfolio) |
| BUY | ILF | Buy ILF — 40.00% of freed cash (adds 2.50% to portfolio) |
| BUY | PAVE | Buy PAVE — 20.00% of freed cash (adds 1.25% to portfolio) |
| BUY | CIBR | Buy CIBR — 20.00% of freed cash (adds 1.25% to portfolio) |
| BUY | FCG | Buy FCG — 20.00% of freed cash (adds 1.25% to portfolio) |
Current Portfolio After Trade
Combined holdings across all 4 active tranches. Each tranche is 25% of the portfolio.
| Ticker | % of Portfolio | Weight Bar |
|---|---|---|
| FSOL | 50.00% | |
| ILF | 7.50% | |
| REMX | 6.25% | |
| SMH | 6.25% | |
| MOO | 5.00% | |
| XAR | 5.00% | |
| COPX | 2.50% | |
| IGF | 2.50% | |
| PAVE | 2.50% | |
| CIBR | 2.50% | |
| FCG | 2.50% | |
| IEMG | 1.25% | |
| XLK | 1.25% | |
| XLU | 1.25% | |
| IGV | 1.25% | |
| GLD | 1.25% | |
| XLE | 1.25% |
Macro Regime — Risk-On Liquidity Expansion
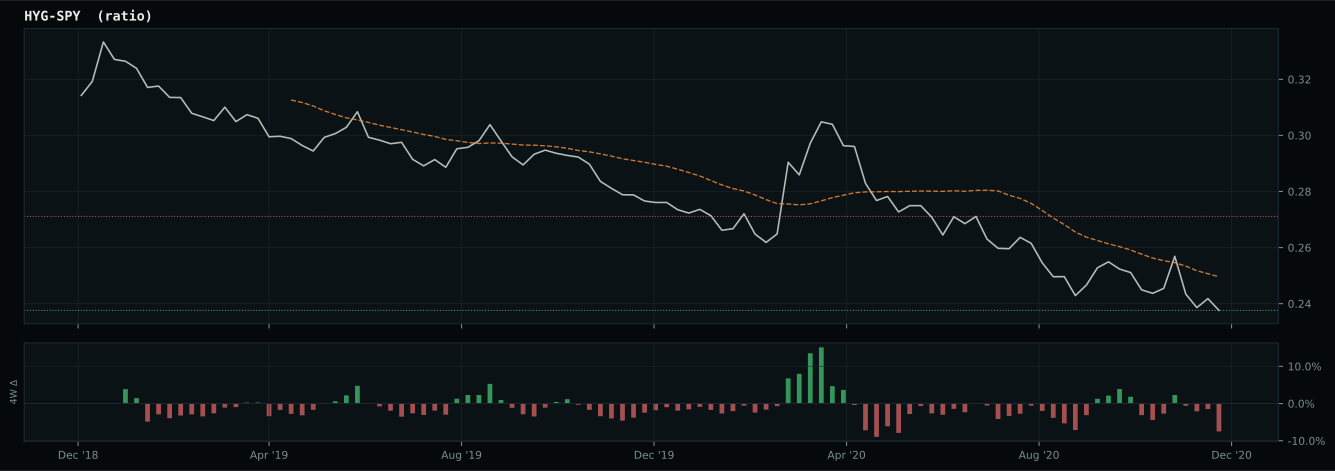
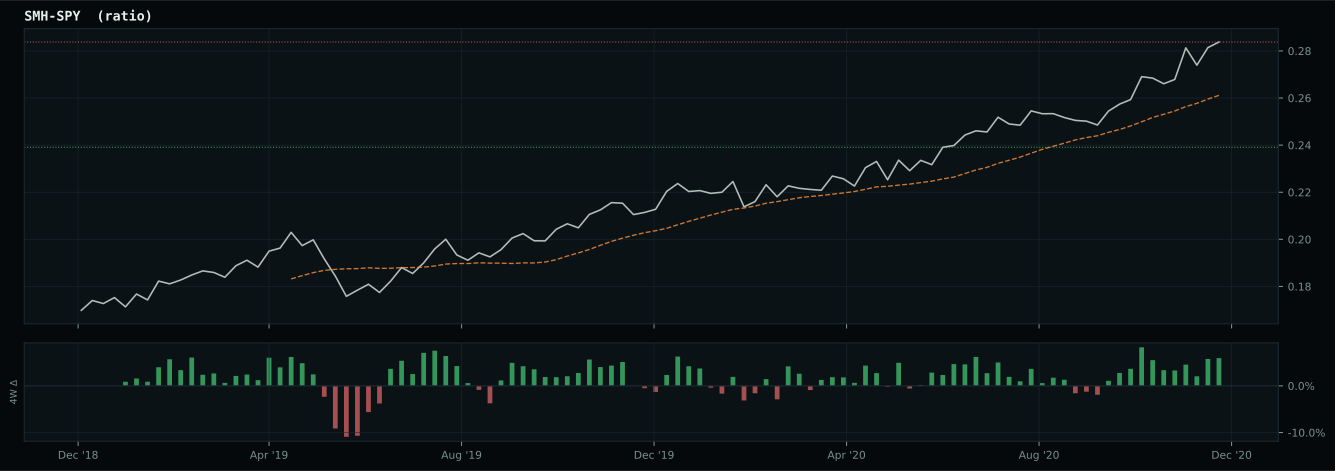
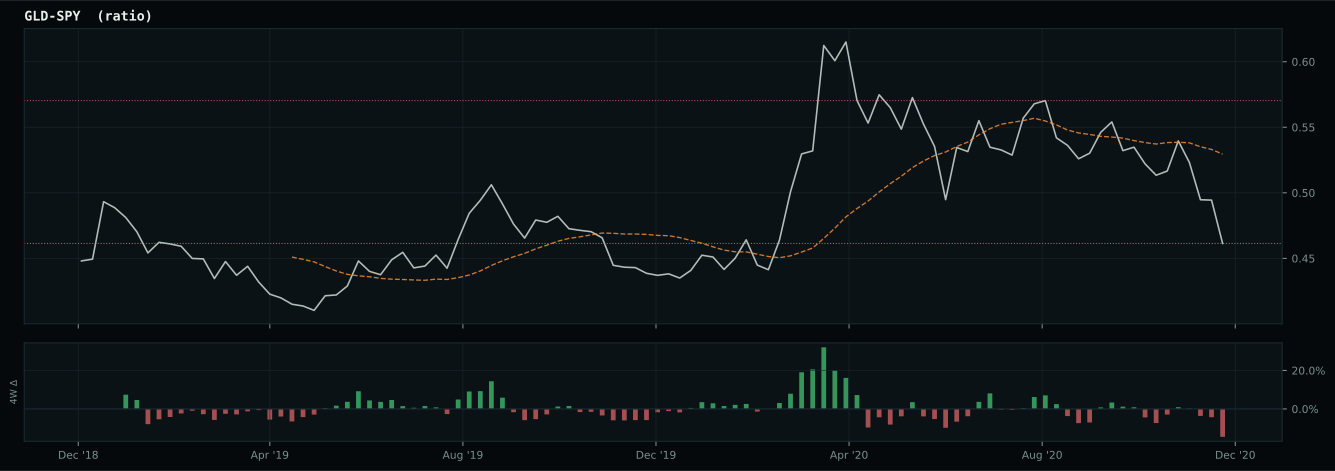
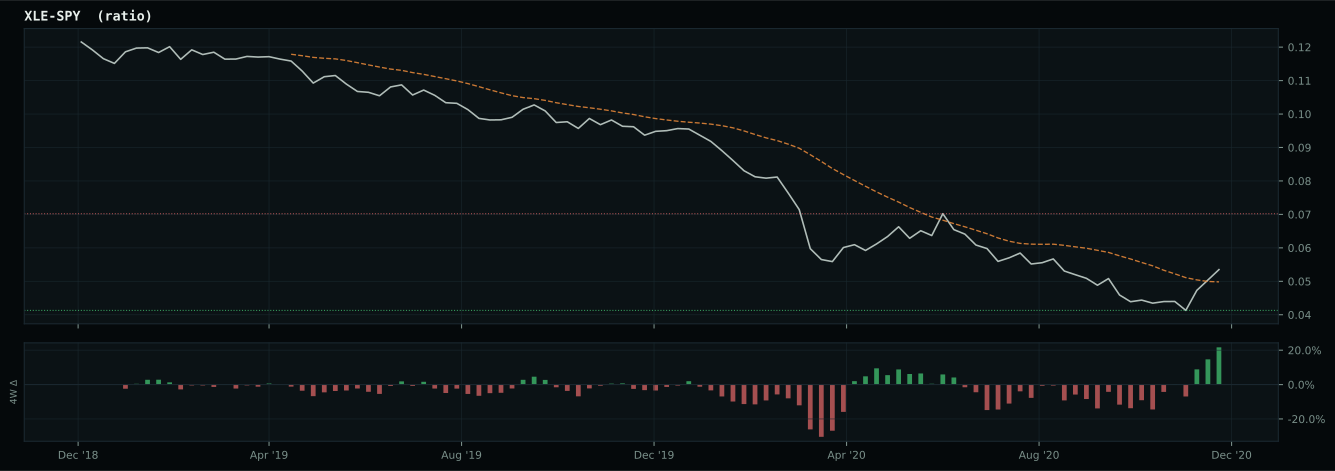
Macro Evidence Charts
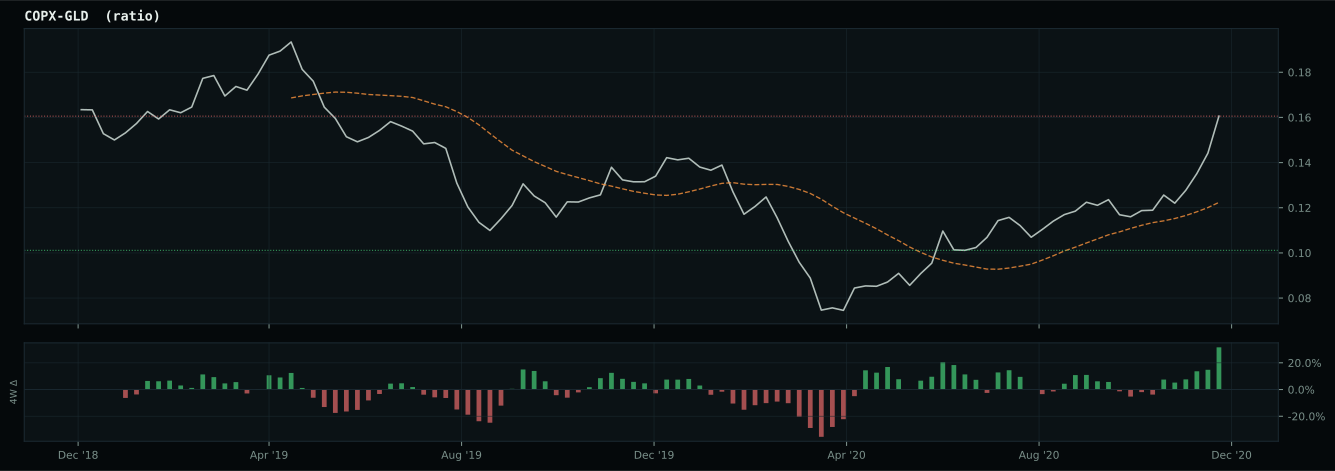
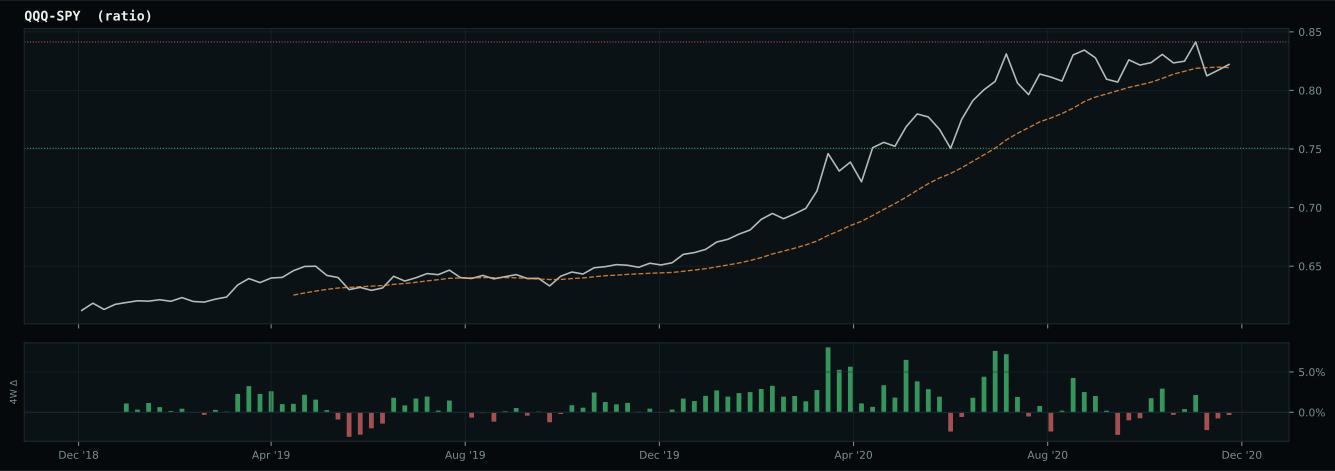
Market-implied signals behind the macro regime scores. Each ratio compares two assets; the direction and slope of the ratio is what the macro engine reads.
Crypto Regime — AltSeason
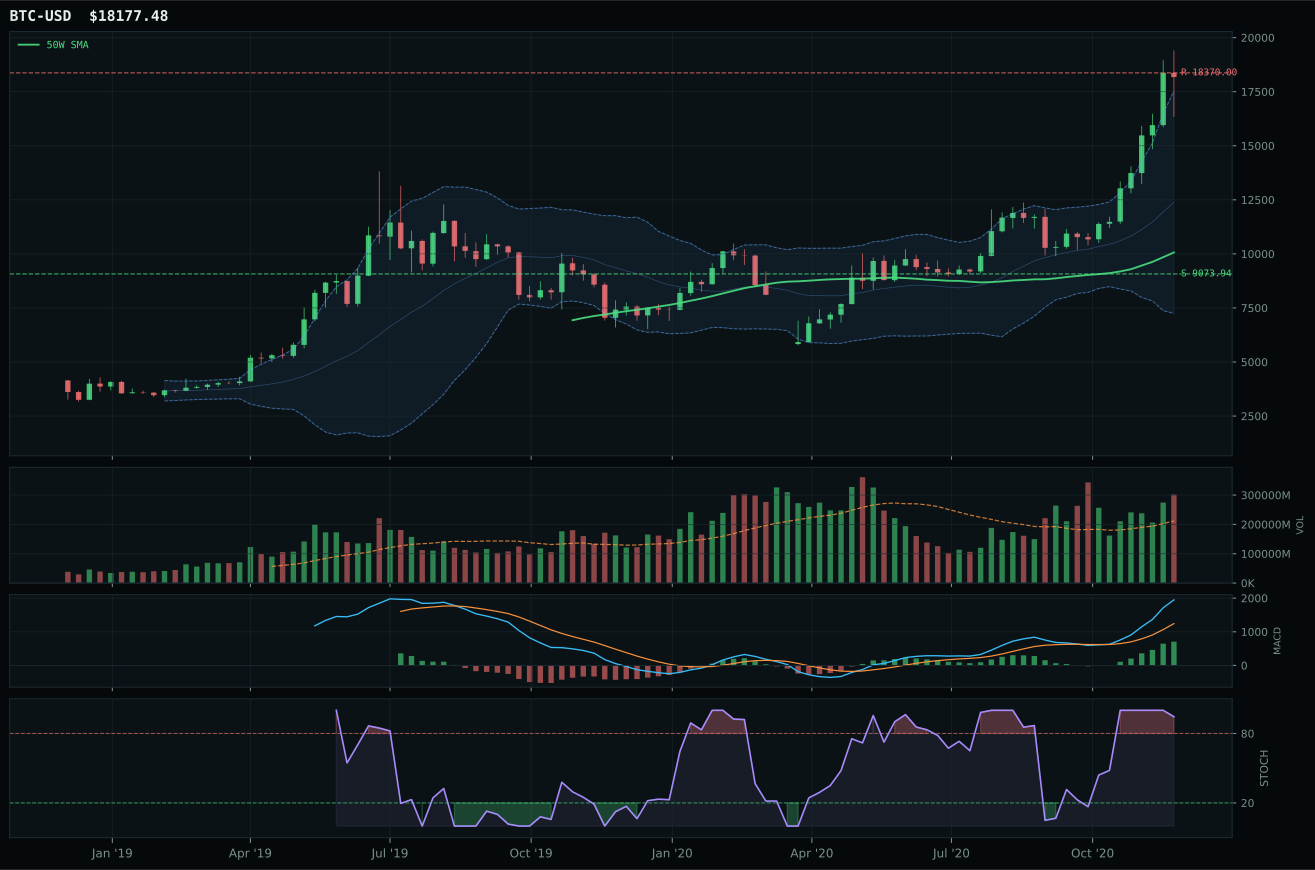
post-touch structure is too wide to count as a range; max/min close ratio is 3.41
TrendBTC confirmed: 2 consecutive closes above rising/flat 50W SMA
all available AltSeason conditions pass; missing optional confirmations skipped

Category Rankings
| Rank | Category | Winner | Score | Alloc | 4W Ret | Peers (4W) |
|---|---|---|---|---|---|---|
| 1 | Emerging Markets | ILF | 79.9 | 20% | +8.80% | INDA +8.1% · IEMG +2.2% |
| 2 | Industrial Metals | REMX | 77.0 | 20% | +16.81% | COPX +12.1% · PICK +12.4% |
| 3 | Traditional Energy | FCG | 73.4 | 10% | +3.81% | XOP +3.9% · XLE -0.6% |
| 4 | AI | SMH | 69.2 | 10% | +5.09% | BOTZ +3.7% · AIQ +4.8% |
| 5 | Utilities & Infrastructure | PAVE | 68.9 | 10% | +3.14% | IGF -0.5% · XLU -3.2% |
| 6 | Defense & Aerospace | XAR | 60.3 | 10% | +4.60% | ITA +0.8% · ROKT +3.9% |
| 7 | Technology | CIBR | 56.5 | 10% | +18.35% | IGV +7.6% · XLK +6.3% |
| 8 | Agriculture & Livestock | MOO | 53.0 | 10% | +2.54% | VEGI +3.1% · WEAT +2.2% |
| 9 | Nuclear Energy | URA | 36.2 | 0% | +30.38% | URNM +40.5% · NLR +1.7% |
| 10 | Precious Metals | GLD | 32.9 | 0% | +6.35% | SLV +19.4% · GDX +7.8% |
Emerging Markets — ILF
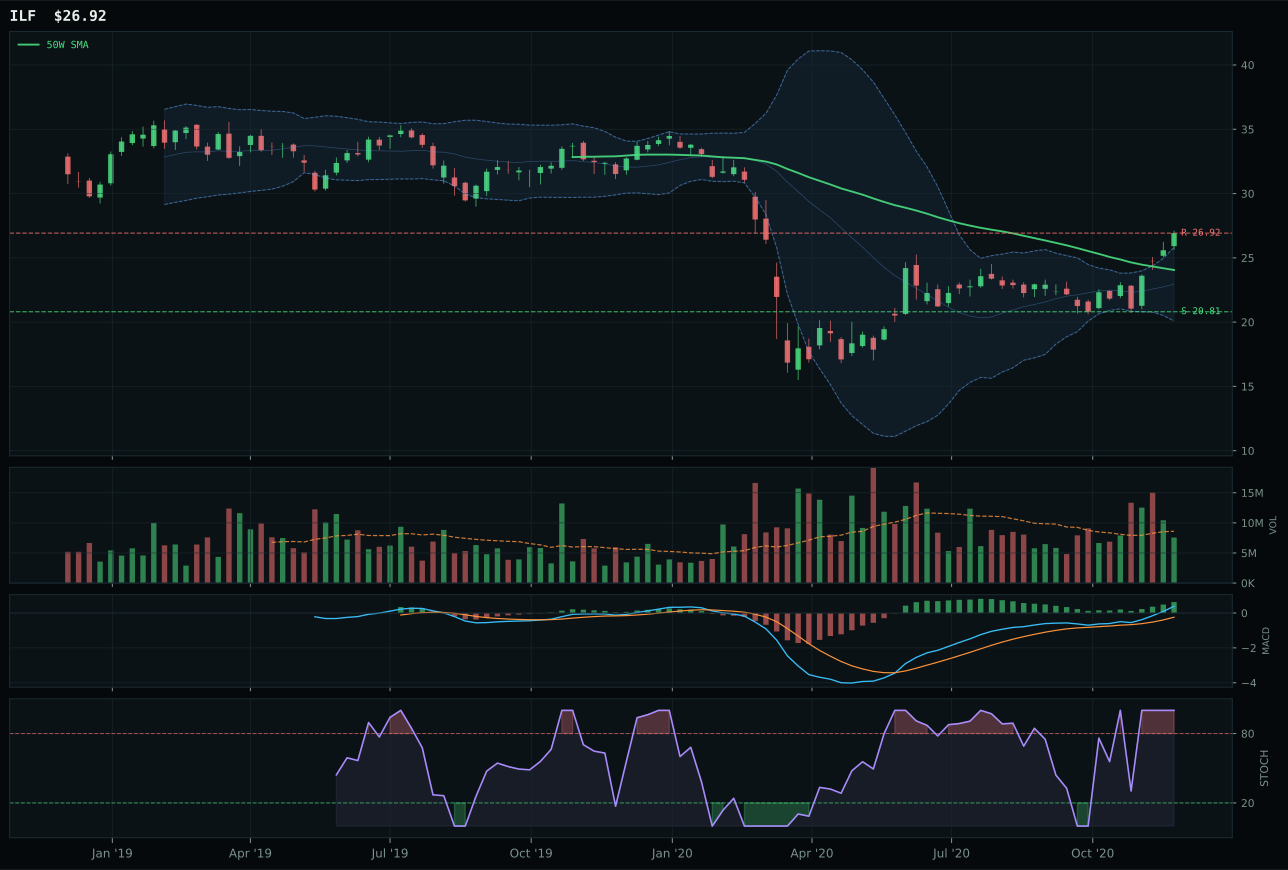
ILF has a neutral structure profile with 13.6% 13-week relative strength versus SPY.
A failed hold above support would weaken the setup.
Actionable but governed by invalidation levels.
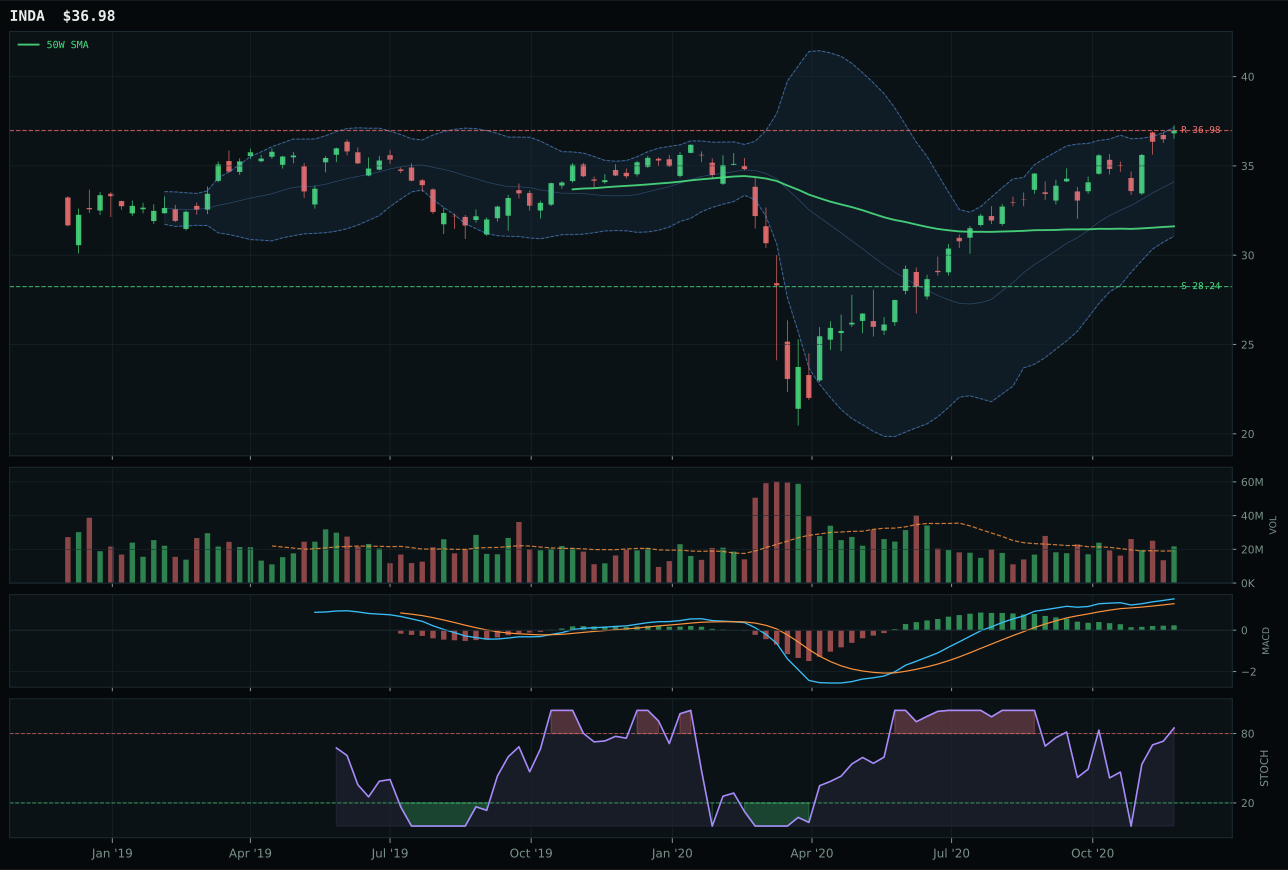
INDA has a vertical extension profile with 3.2% 13-week relative strength versus SPY.
A failed hold above support would weaken the setup.
Actionable but governed by invalidation levels.
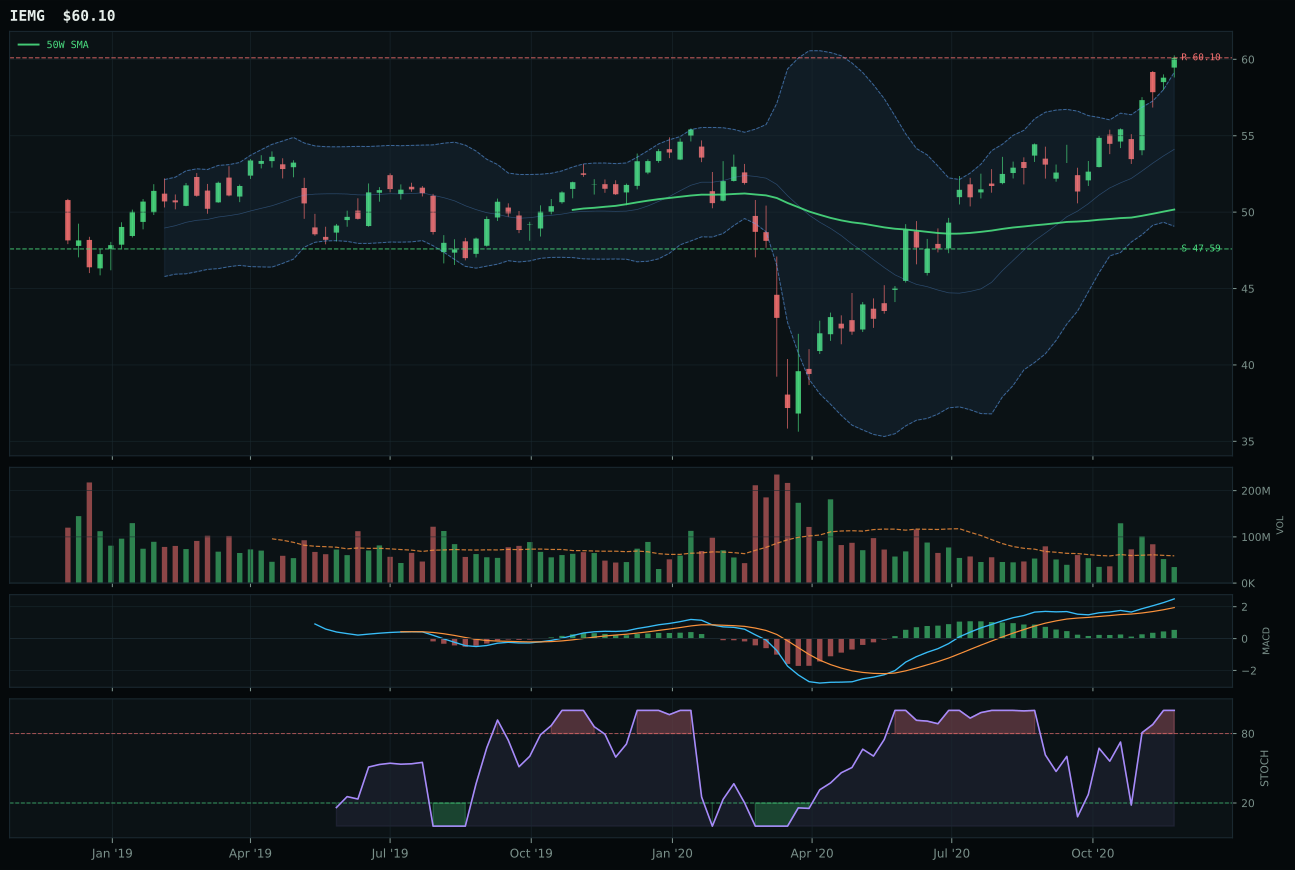
IEMG has a vertical extension profile with 6.7% 13-week relative strength versus SPY.
A failed hold above support would weaken the setup.
Actionable but governed by invalidation levels.
ILF wins because it controls the category-relative strength narrative and the timing setup is superior to INDA's. Both have bullish-and-improving MACD and overbought stochastic RSI at 1.00, but ILF's 67.0% timing score dominates INDA's 37.0% because ILF sits 11.9% from the 50W in the middle retracement zone (Fib 0.382), while INDA is stretched 17.0% above the 50W in vertical extension. ILF's 7.0% category-relative strength beats INDA's negative 3.4%, which means the market is rotating toward Latin America commodity and value beta rather than India quality growth. ILF's neutral structure setup at 70.4% is cleaner than INDA's vertical extension, and the 57.9% risk/reward is substantially better than INDA's 41.6%. The 17.3% 13-week return on neutral volume (0.88x) feels more sustainable than INDA's 7.0% 13-week return on above-average participation. ILF's superior macro fit at 66.0% versus INDA's 58.0% reflects the portfolio's current tilt toward commodity and inflation themes over growth.
Emerging Markets scored 79.9 and earned a top-2 overweight at 10% allocation because it combines powerful macro support with a technically cleaner setup than most alternatives. The category-level macro fit of 80.0% is exceptional: EM liquidity support at +14, liquidity expansion at +8, risk appetite positive at +8. In a Risk-On Liquidity Expansion regime, emerging market capital flows are a given. ILF's 83.0% technical evidence score provides real conviction, and the neutral structure setup (not extended like INDA) means there's room to run. The 17.3% 13-week return on neutral volume and the 7.0% category-relative strength show that Latin America's commodity and value plays are attracting institutional demand without being picked apart by retail. Emerging Markets earned top-2 because the two dominant themes in this portfolio—real asset sponsorship and liquidity expansion—hit emerging markets with maximum force. Commodity-rich Latin America benefits from both supply scarcity and EM liquidity flows. The 10% allocation reflects conviction that this trade has structural legs, not just a near-term bounce. INDA's vertical extension and narrower relative strength kept it as the runner-up; ILF's timing and structure made it the clear winner.
Industrial Metals — REMX
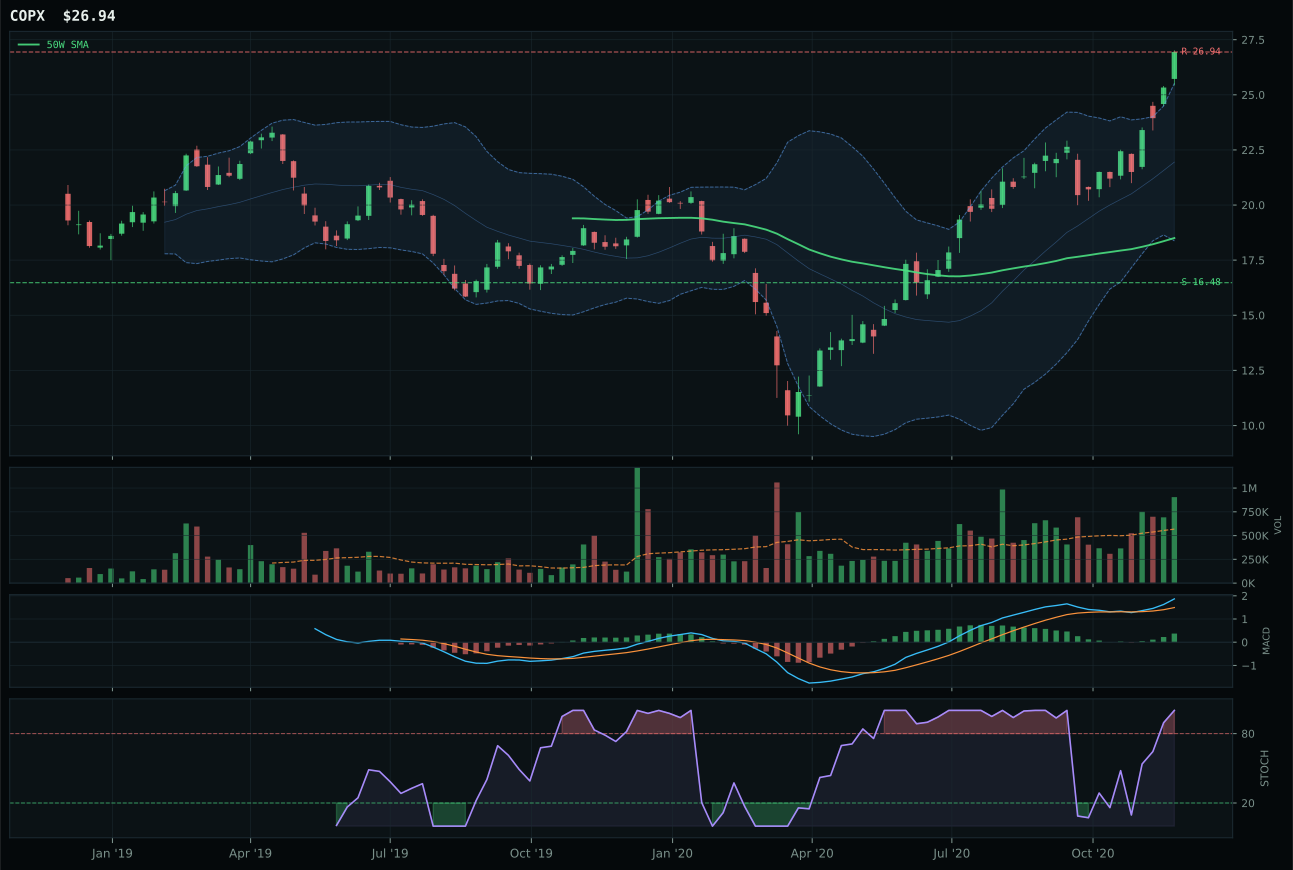
COPX has a vertical extension profile with 19.6% 13-week relative strength versus SPY.
A failed hold above support would weaken the setup.
Actionable but governed by invalidation levels.
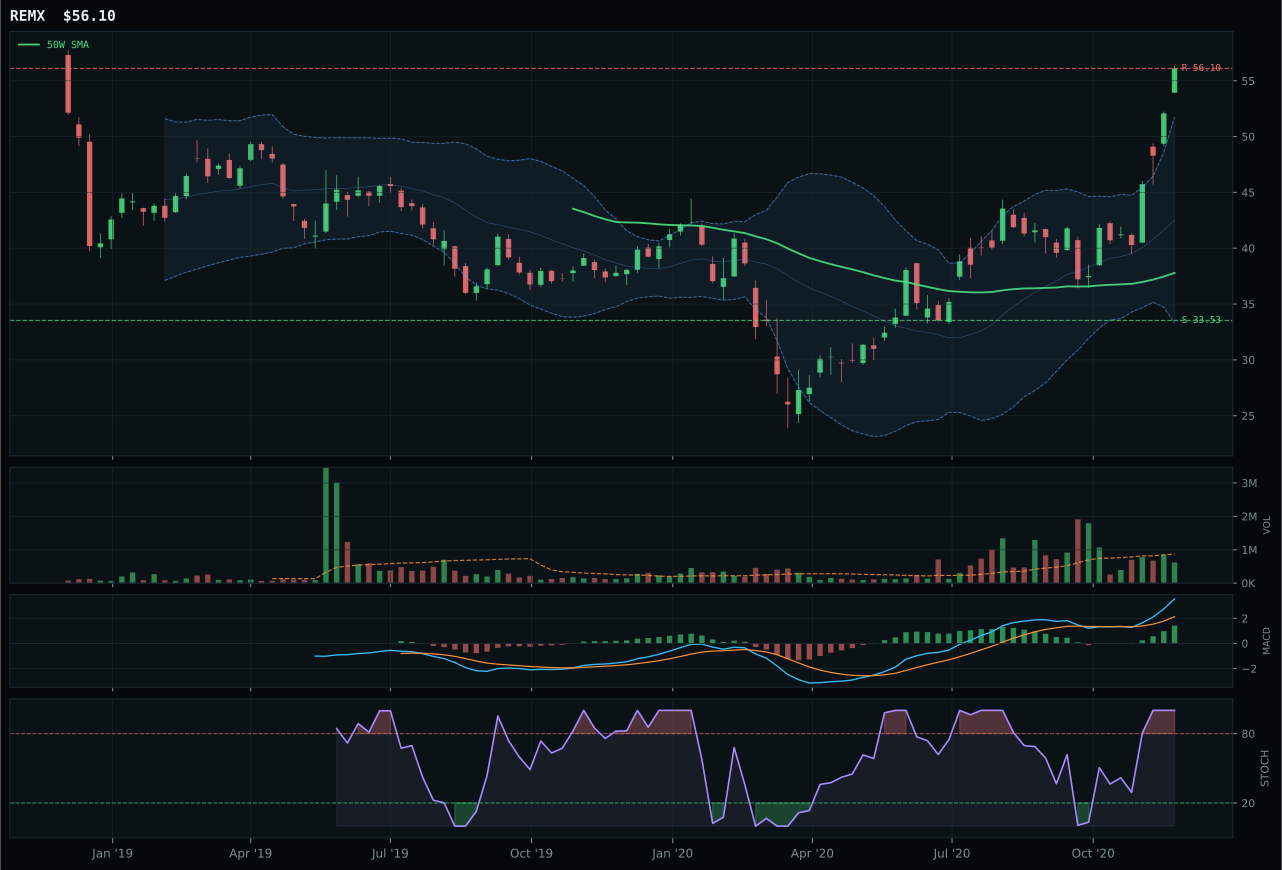
REMX has a vertical extension profile with 31.1% 13-week relative strength versus SPY.
A failed hold above support would weaken the setup.
Actionable but governed by invalidation levels.
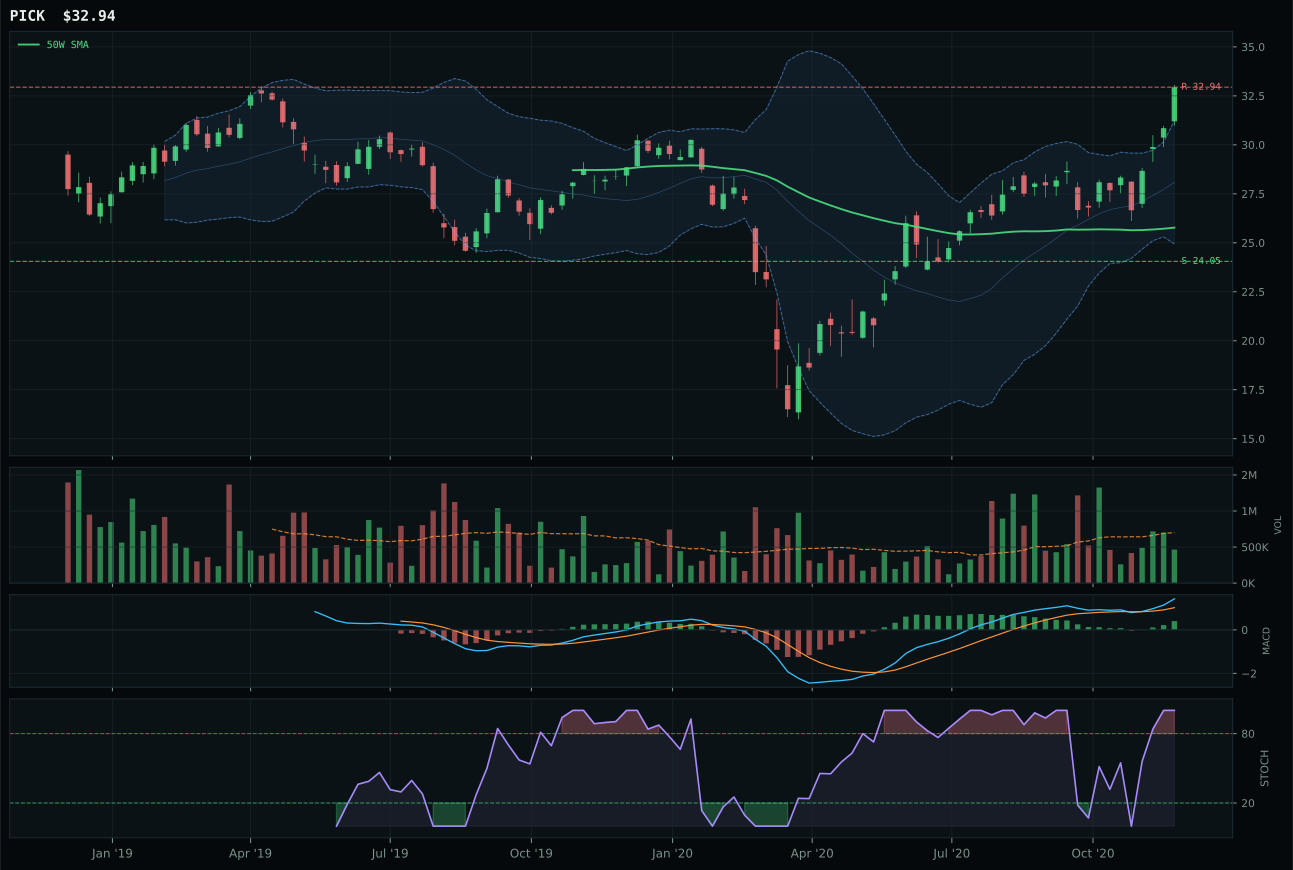
PICK has a vertical extension profile with 13.8% 13-week relative strength versus SPY.
A failed hold above support would weaken the setup.
Actionable but governed by invalidation levels.
REMX wins despite being ranked third in technical evidence (68.3%) because the category-relative strength story is powerful and the persistence is exceptional. COPX scores higher on technical evidence at 88.3% with better volume confirmation (accumulation/confirmation vs thin participation) and superior risk/reward at 44% versus REMX's 39%. But REMX's 11.6% category-relative strength versus COPX's 0.0% is the decision-maker—it says the market is choosing rare earth supply scarcity over pure copper industrial demand. REMX's 34.9% 13-week return and 31.1% RS versus SPY show real institutional accumulation in the scarce-supply narrative. Persistence at 97.3% is outstanding, the highest on the board, which means the 48.4% extension above the 50W is not a bubble—it's been built step by step over weeks. Price sits near Fib 0.236 at the 52W high, MACD is bullish and improving, stochastic RSI is overbought at 1.00, and volume is neutral at 0.71x. The risk is real (downside 67.3% to support), but the directional conviction inside the category clearly favors rare earths.
Industrial Metals scored 77.0 and earned a top-2 overweight at 10% allocation because it's one of only two categories where the technical evidence, macro fit, and category momentum align into a clean bullish case. The macro tailwinds are powerful: metals scarcity at +14, commodity breadth positive at +10, real asset sponsorship at +6. Category-level macro fit reaches 73.0%, and the technical evidence from REMX (68.3%) is solid enough to justify commitment. The setup is extended—REMX sits 48.4% above the 50W with zero upside to resistance and thin volume—but the persistence score of 97.3% is the highest in the portfolio, proving this is structural, not a spike. Industrial Metals earned top-2 status because commodities, scarcity, and real assets are the dominant themes in this macro regime. Liquidity expansion is funding infrastructure builds and AI chip fabrication, both of which demand rare earths and copper. REMX at 10% is the portfolio's bet that supply-chain scarcity will persist and metal prices will consolidate at these higher levels rather than roll over. The risk is real, but so is the macro tailwind.
Traditional Energy — FCG
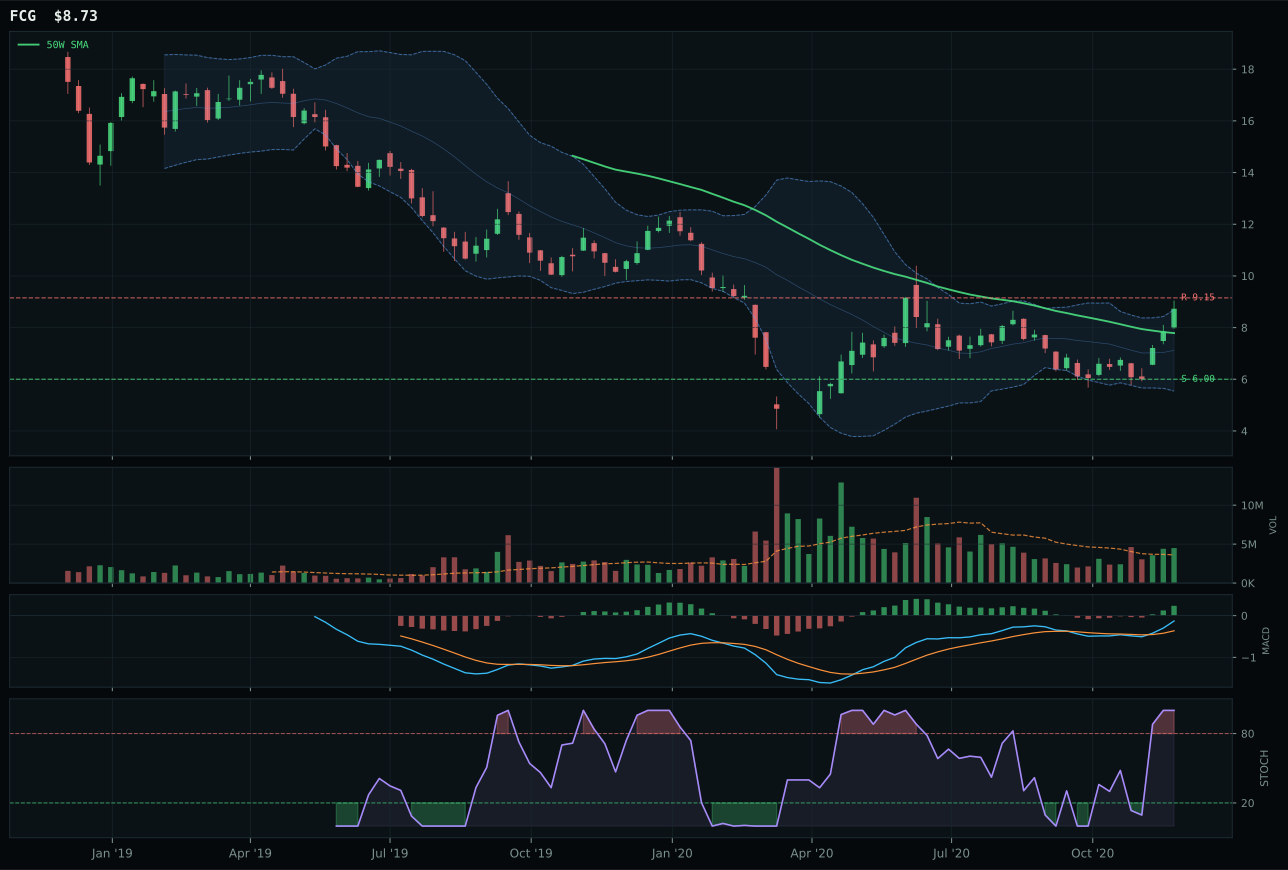
FCG has a neutral structure profile with 9.2% 13-week relative strength versus SPY.
A failed hold above support would weaken the setup.
Actionable but governed by invalidation levels.
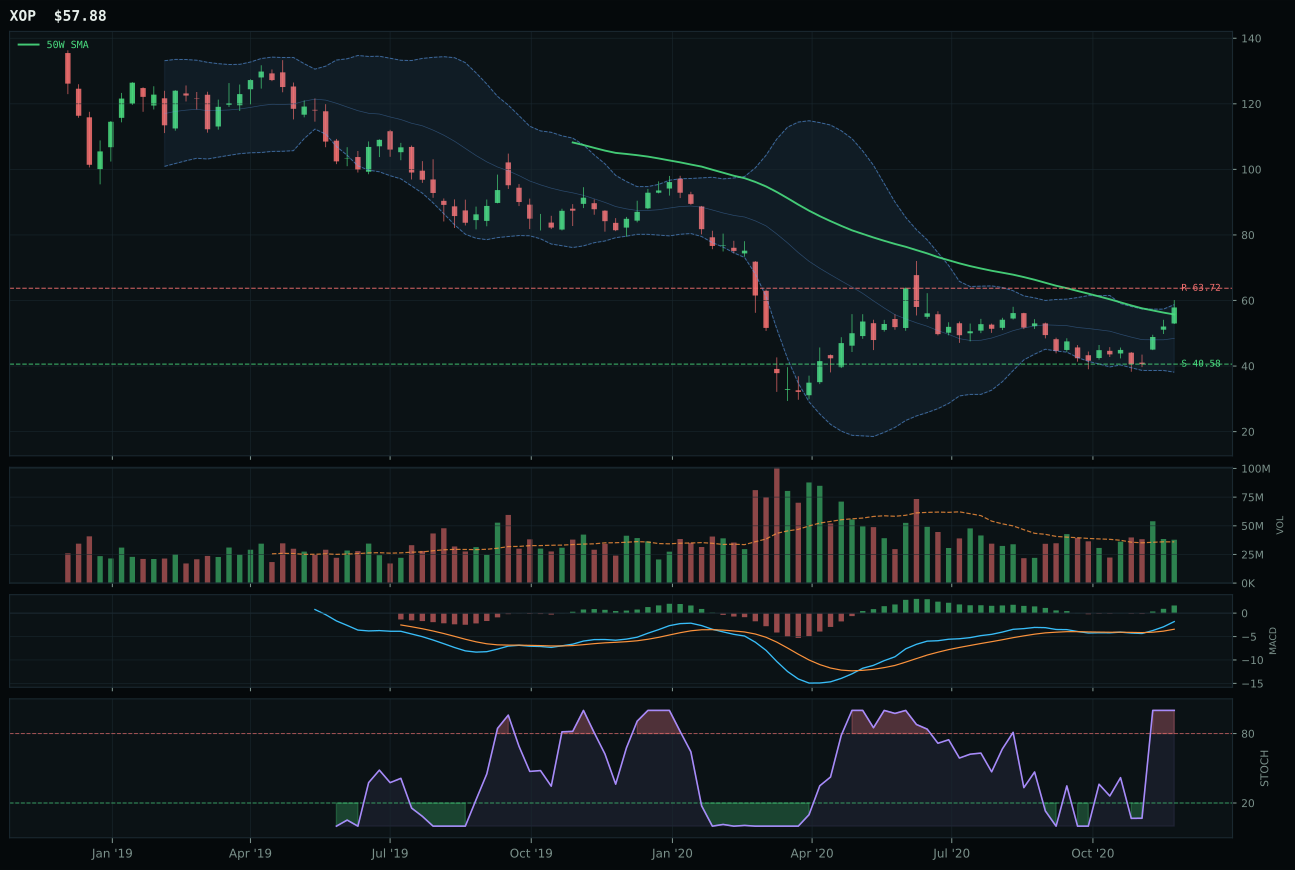
XOP has a neutral structure profile with 5.5% 13-week relative strength versus SPY.
A failed hold above support would weaken the setup.
Actionable but governed by invalidation levels.
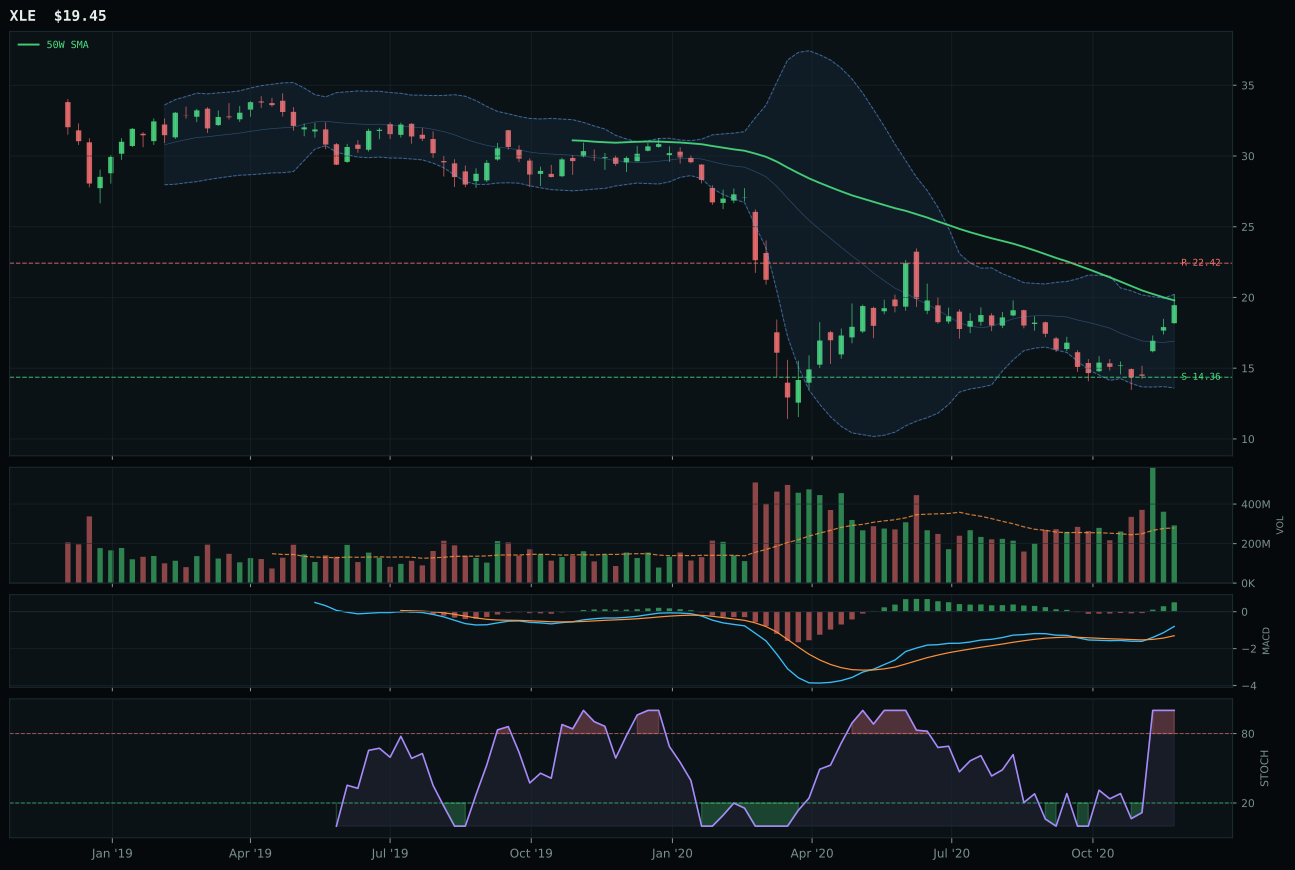
XLE has a compression near 50W profile with 3.0% 13-week relative strength versus SPY.
Extension and support failure are the main tactical risks.
Tracked, but not top-2 eligible because: structurally broken.
FCG wins because its 82.4% technical evidence score and 75.2% volume-price confirmation beat XOP's 76.1% and 69.0% respectively, despite XOP having a cleaner structure at 90.0% (neutral) versus FCG's 69.2%. FCG's 3.7% category-relative strength decisively beats XOP's 0.0%, meaning the market is rotating toward natural gas over broad oil exploration. FCG's 1.24x above-average volume participation is the real differentiator—actual money is showing up in the bid, not just price moving on thin air. The 100/100 momentum score on a 43.6% four-week rip and 12.9% 13-week return proves natural gas is in an active accumulation phase. Price sits 14.1% from the 50W in the middle retracement zone (Fib 0.382), MACD is bullish and improving, and stochastic RSI is overbought. The risk/reward at 31.8% is tight (upside -4.6% to resistance), but volume confirmation at 75.2% shows this isn't a dead-cat bounce—it's real demand for natural gas in a scarce-supply regime.
Traditional Energy scored 73.4 and earned 5% as tier-2, ranked third among the ten categories but kept out of top-2 despite powerful macro support. Energy scarcity at +16, inflation pressure at +10, and supply shortage at +9 combine to a category-level macro fit of 85.0%—exceptional. Yet the final score of 73.4 trails Industrial Metals (77.0) and Emerging Markets (79.9), which tells you the technical setup in FCG is extended and tight-reward relative to Industrial Metals' real structural scarcity play. FCG's risk/reward at 31.8% means there's almost no room to the upside before hitting resistance, and the thin volume confirmation in XOP (the broader play) suggests energy breadth is narrowing to natural gas. The portfolio holds 5% because energy scarcity is real and inflation is a real portfolio headwind, and natural gas benefits when commodity inputs spike. But FCG itself is extended, sitting 14.1% from the 50W with negative upside to resistance. For energy to earn top-2, you'd need either a wider rotation across the energy complex (into XLE or XOP) or a fresh consolidation in FCG that resets the risk/reward geometry. Right now it's a 5% hold on macro conviction with limited technical upside.
AI — SMH
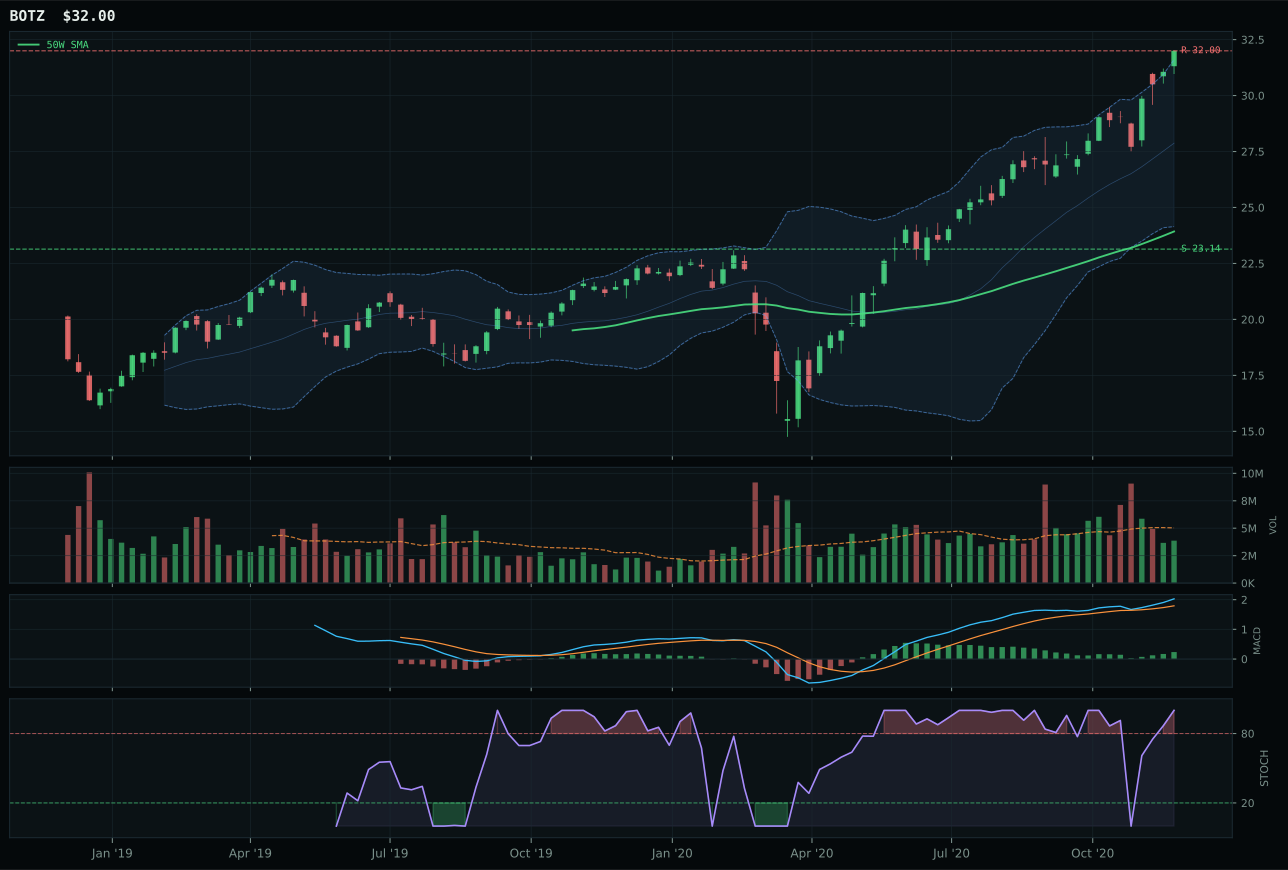
BOTZ has a vertical extension profile with 14.1% 13-week relative strength versus SPY.
A failed hold above support would weaken the setup.
Actionable but governed by invalidation levels.
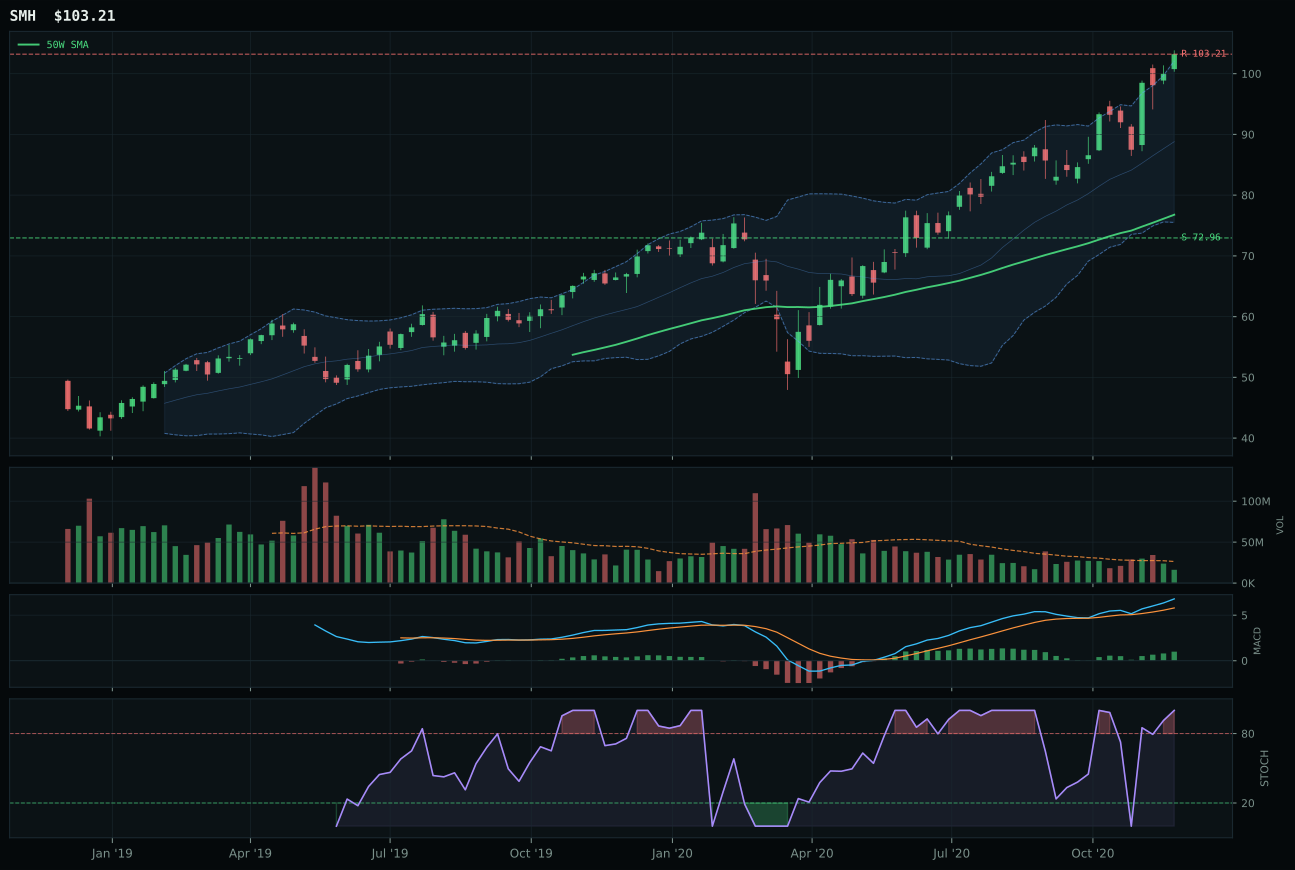
SMH has a vertical extension profile with 13.8% 13-week relative strength versus SPY.
A failed hold above support would weaken the setup.
Actionable but governed by invalidation levels.
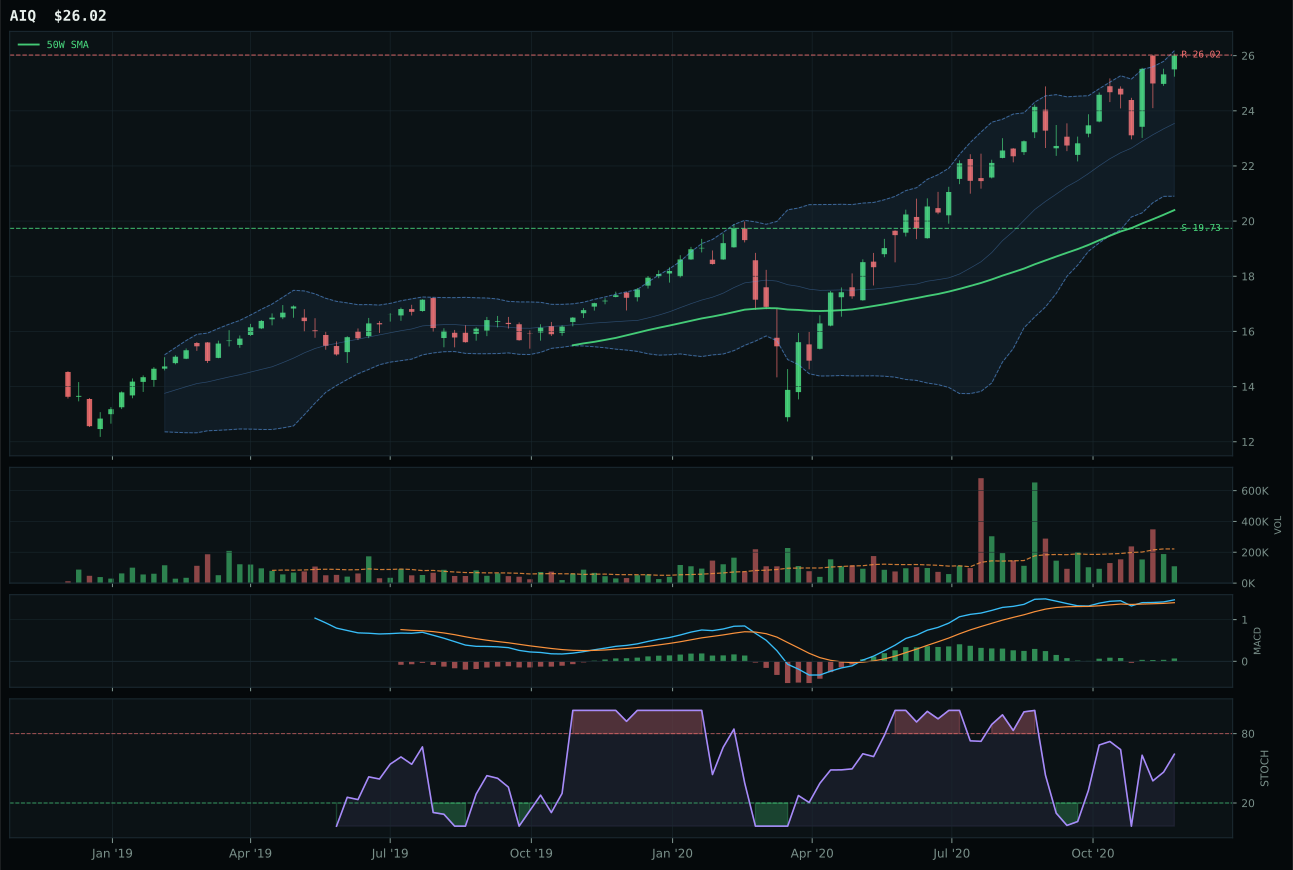
AIQ has a vertical extension profile with 4.0% 13-week relative strength versus SPY.
A failed hold above support would weaken the setup.
Tracked, but not top-2 eligible because: .
SMH wins despite a razor-thin 1.1-point margin over BOTZ because the technical composite leans its way when you account for the full picture of momentum sponsorship and category breadth. Both sit at 100/100 trend and momentum scores with overbought stochastic RSI at 1.00, both are extended at 34.4% above the 50W, and both have bullish-and-improving MACD. The deciding factor is that SMH's 0.0% category-relative strength versus BOTZ's 0.3% places them in a near dead-heat, but SMH's superior macro fit at 74.0% versus BOTZ's 55.0% tips the scales. The thin participation at 0.62x volume is a yellow flag for both—it signals that the 18.0% four-week return is being driven by few shares, which means the extension to 34.4% above the 50W is crowded. Price sits near Fib 0.236 at 90.62, and with zero upside to resistance, every new buyer is late. SMH's 17.5% 13-week return is legitimate, but the setup is fundamentally about who owns the name, not clean new accumulation.
AI scored 69.2 and earned 5% as a tier-2 category, missing the top-2 cut despite a category-level macro fit of 88.0%—one of the highest on the board. The regime is exceptionally supportive: AI growth sponsorship at +14, risk appetite positive at +10, liquidity expansion at +10. Yet the category score came in below both Industrial Metals at 77.0 and Emerging Markets at 79.9, which tells you that the technical setup inside the AI basket is fighting the macro tailwinds. BOTZ and SMH are both extended, thin on volume, and overbought on stochastic RSI; the momentum is real, but the entry risk is asymmetric. If volume dried up or stochastic RSI rolled over, both setups would collapse. The portfolio is comfortable holding 5% here because AI remains a structural growth theme, but the current extended valuation and lack of fresh accumulation are keeping it out of overweight. For AI to earn a top-2 slot, you would need a pullback to consolidate the gains, then a fresh breakout on better volume—right now it's a hold, not a buy.
Utilities & Infrastructure — PAVE
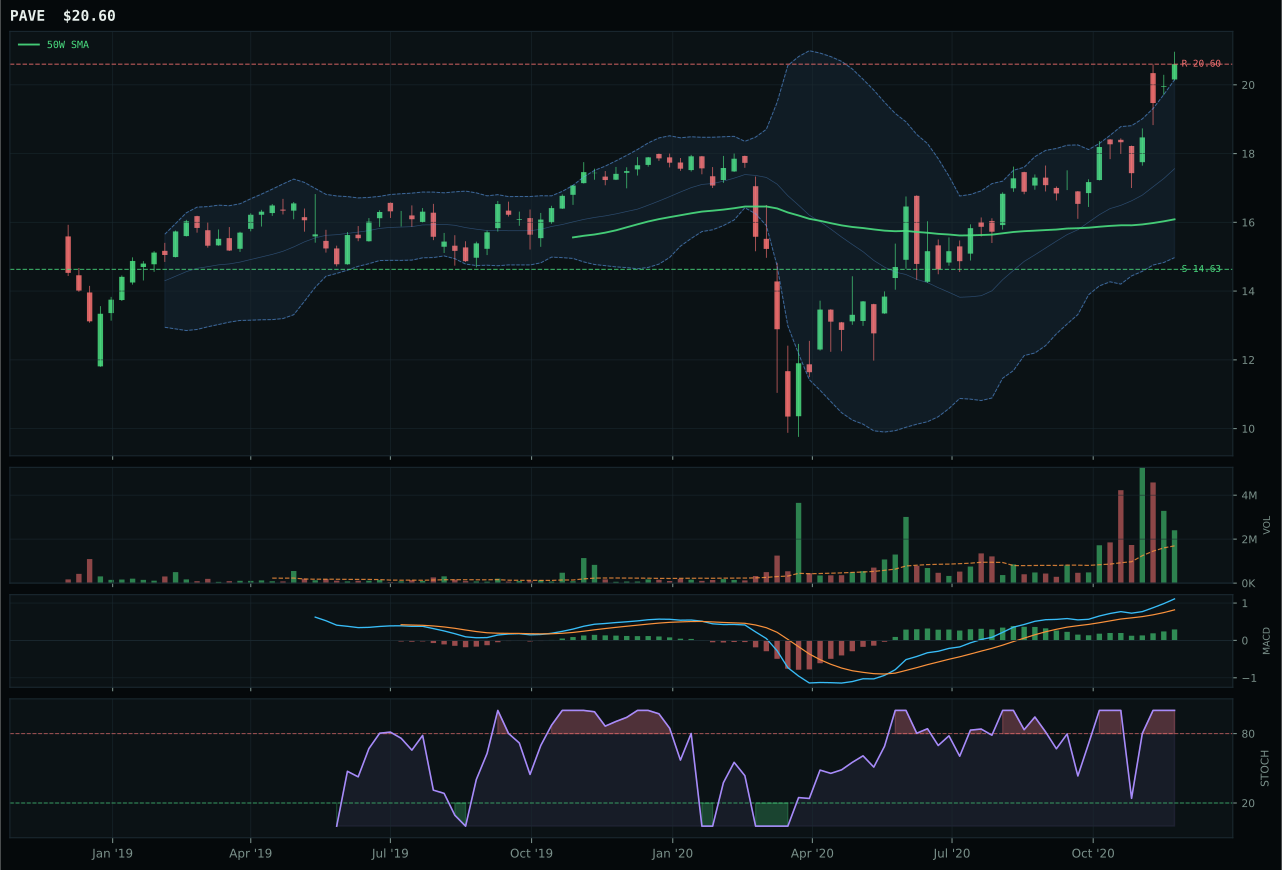
PAVE has a vertical extension profile with 15.3% 13-week relative strength versus SPY.
A failed hold above support would weaken the setup.
Actionable but governed by invalidation levels.
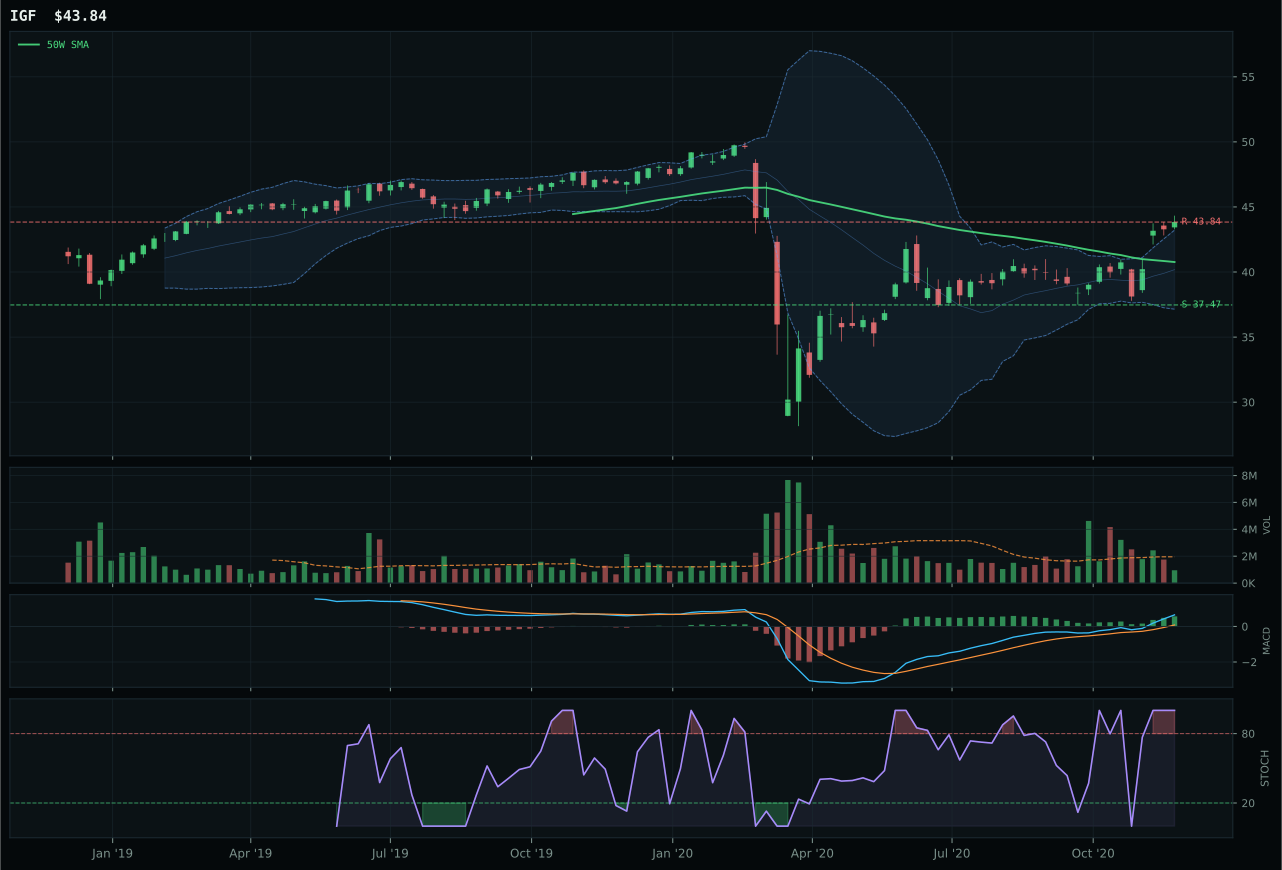
IGF has a neutral structure profile with 5.5% 13-week relative strength versus SPY.
A failed hold above support would weaken the setup.
Actionable but governed by invalidation levels.
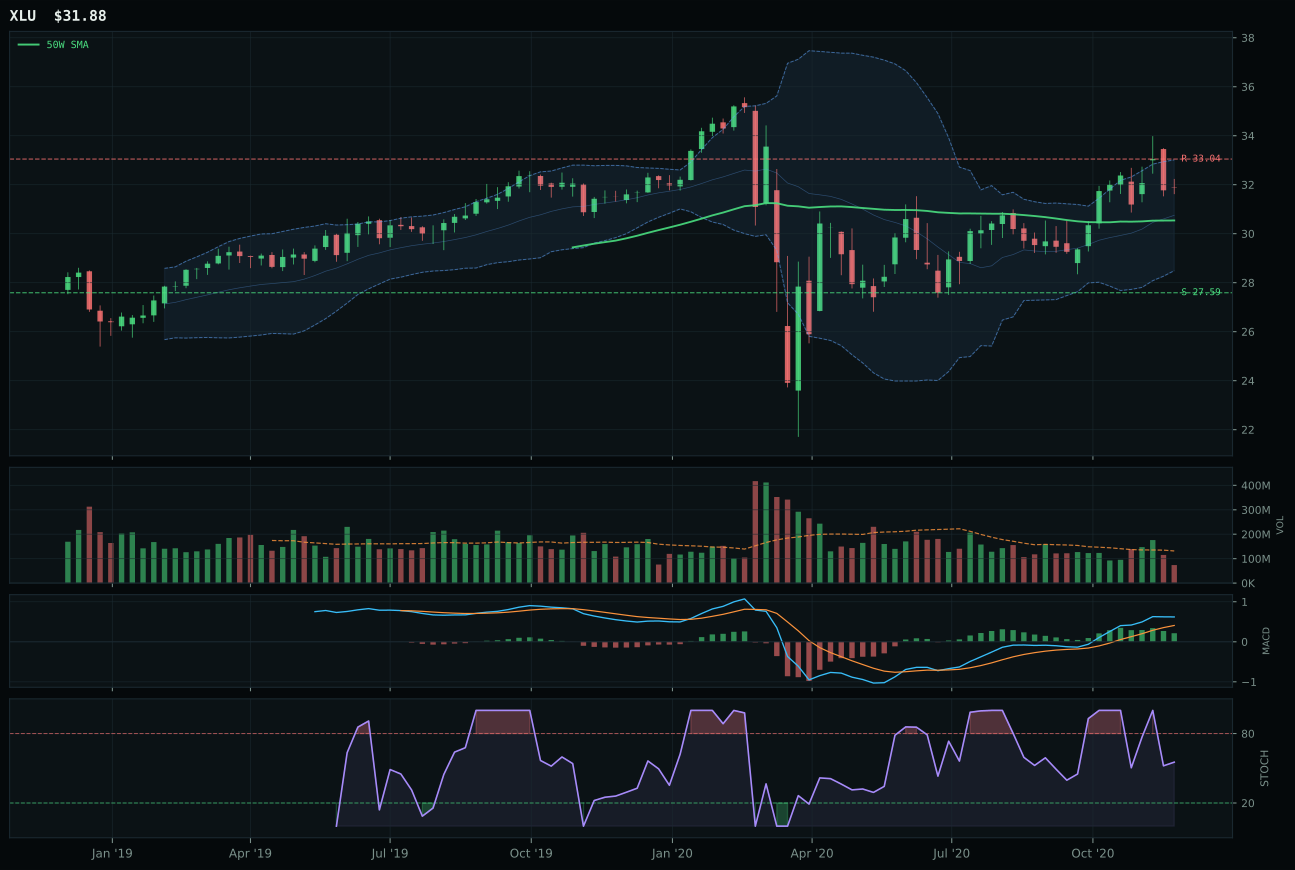
XLU has a neutral structure profile with 4.2% 13-week relative strength versus SPY.
A failed hold above support would weaken the setup.
Actionable but governed by invalidation levels.
PAVE wins despite being the lowest-ranked of the three because category-relative strength at 9.9% beats IGF's 0.0% and XLU's implied negative, proving the market is choosing domestic infrastructure capex beta over global infrastructure income or utility defensiveness. PAVE's trend score of 90.0% (price above 50W, below 200W, with 0.4% slope) is weaker than IGF's 98.0% or XLU's 100.0%, but the 15.3% RS versus SPY shows institutional demand for domestic infrastructure plays. PAVE's structure at 81.3% is the cleanest on the board—vertical extension with 75.0% cleanliness and 77.8% compression, meaning the price move is being built methodically. The 19.1% 13-week return on above-average participation at 1.42x volume is real money, not thin-participation manipulation. MACD is bullish and improving, stochastic RSI is pinned overbought at 1.00, and the 100/100 momentum score proves conviction. Volume-price confirmation at 75.4% is better than IGF's 69.0%, meaning the market is accumulating PAVE, not distributing it.
Utilities & Infrastructure scored 68.9 and earned 5% as tier-2, ranked fourth and kept out of top-2 despite cleaner technical structure than some tier-1 peers. The macro case is mixed: defensive rotation at +12 should support the category, but the regime is Risk-On Liquidity Expansion, which penalizes defensive plays. Category-level macro fit is just 58.0%, pulled down by risk appetite positive at -2 (indicating that utility income plays are losing appeal in a rising-volatility or rising-rate scenario). PAVE's 78.7% technical evidence and strong volume participation (1.42x) earn it the 5% allocation as a tactical hedge, but the macro environment is not tilting toward defensiveness. The portfolio keeps utilities at 5% because infrastructure capex is a real structural theme (fiscal spending, AI data center buildout), but until defensive rotation accelerates or rate expectations shift, this category remains subordinate to real asset plays like Industrial Metals and Emerging Markets. PAVE's vertical extension at 28.0% above the 50W means there's limited upside before hitting resistance, and new buyers are late. For Utilities to move to top-2, you'd need a clear shift toward defensive narratives—right now, the 5% is a position on the infrastructure theme, not on defensiveness.
Defense & Aerospace — XAR
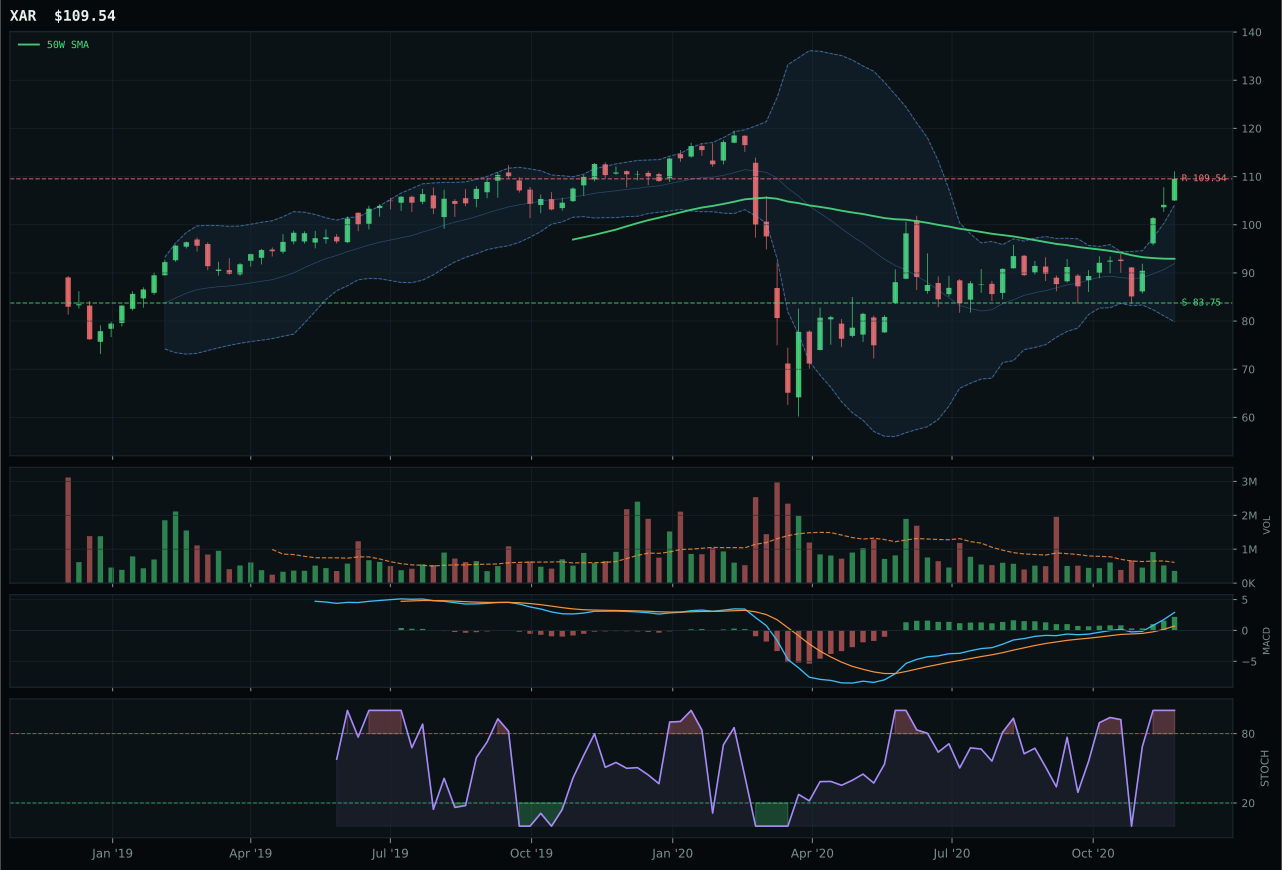
XAR has a vertical extension profile with 16.0% 13-week relative strength versus SPY.
A failed hold above support would weaken the setup.
Actionable but governed by invalidation levels.
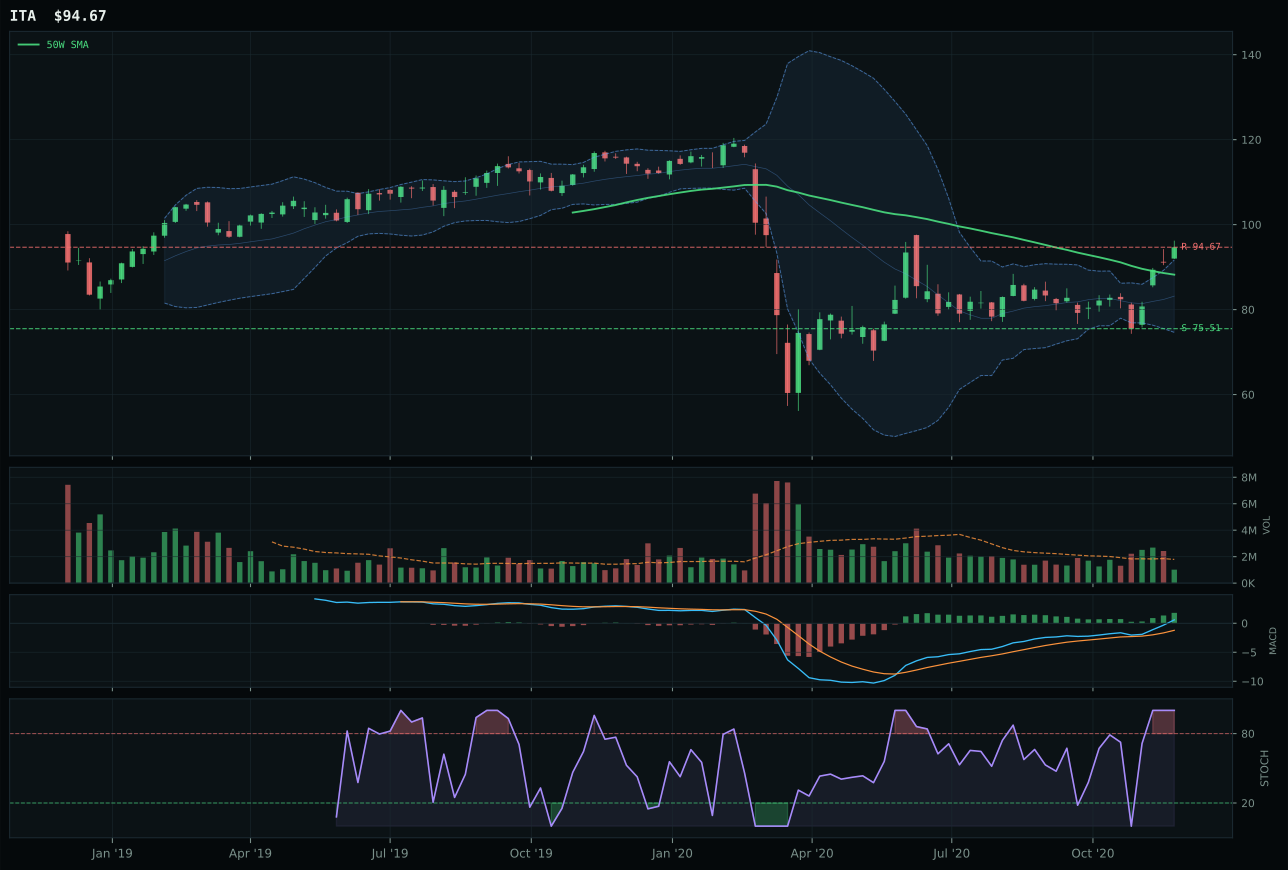
ITA has a neutral structure profile with 8.0% 13-week relative strength versus SPY.
A failed hold above support would weaken the setup.
Actionable but governed by invalidation levels.
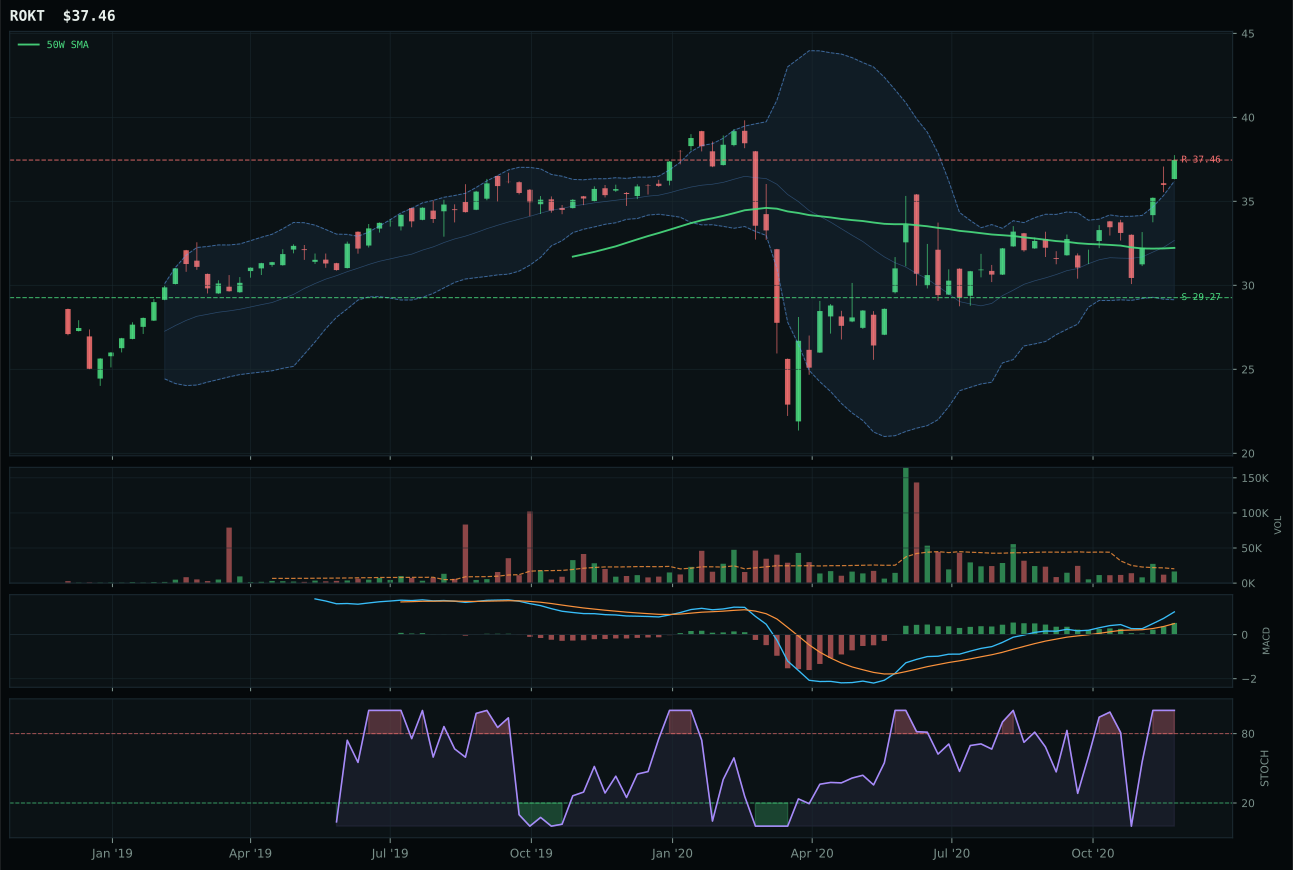
ROKT has a vertical extension profile with 11.0% 13-week relative strength versus SPY.
A failed hold above support would weaken the setup.
Tracked, but not top-2 eligible because: .
XAR wins over ITA because it holds the category-relative strength edge at 5.0% versus ITA's negative 3.0%, meaning the market is rotating toward defense cyclicality rather than defense durability. Both price above the 50W and below the 200W, but XAR's 16.0% RS versus SPY towers over ITA's 8.0%—this tells you that defense capital is flowing toward aerospace and contractor upside, not the defensive-prime utilities play that ITA represents. XAR's structure at 73.5 edges ITA's neutral structure at a technical level, and the 100/100 momentum score on a 19.8% 13-week return is cleaner than ITA's 11.8%. MACD is bullish and improving for both, but XAR's stochastic RSI sits pinned at 1.00, which is overbought but confirming the strength. The 17.9% extension above the 50W in an upper retracement zone (Fib 0.236 at 105.51) is extended but not extreme. ITA's neutral structure setup lacked the same compression-to-breakout confirmation.
Defense & Aerospace scored 60.3 and received 5% as a tier-2 allocation, ranked fifth among the ten categories. The macro case is mixed: defensive rotation at +8 and credit stress at +2 should support the category, but those tailwinds only sum to a category-level macro fit of 63.0%—below neutral. The portfolio recognizes the defensive rotation is active, but in a Risk-On Liquidity Expansion regime, defensive plays are inherently second-tier. What keeps it in the portfolio at all is the technical strength: XAR's trend at 100/100 and momentum at 100/100 prove that real buyers are showing up. The tension is that defense gains are correction hedges, not risk-on acceleration plays. Industrial Metals and Emerging Markets, both seated at 10%, are riding the commodity and EM liquidity wave more directly. If risk appetite rolled over and defensive rotation accelerated dramatically, Defense could jump to top-2; for now, it's a 5% tactical hold that acknowledges strength while respecting the macro regime headwind.
Technology — CIBR
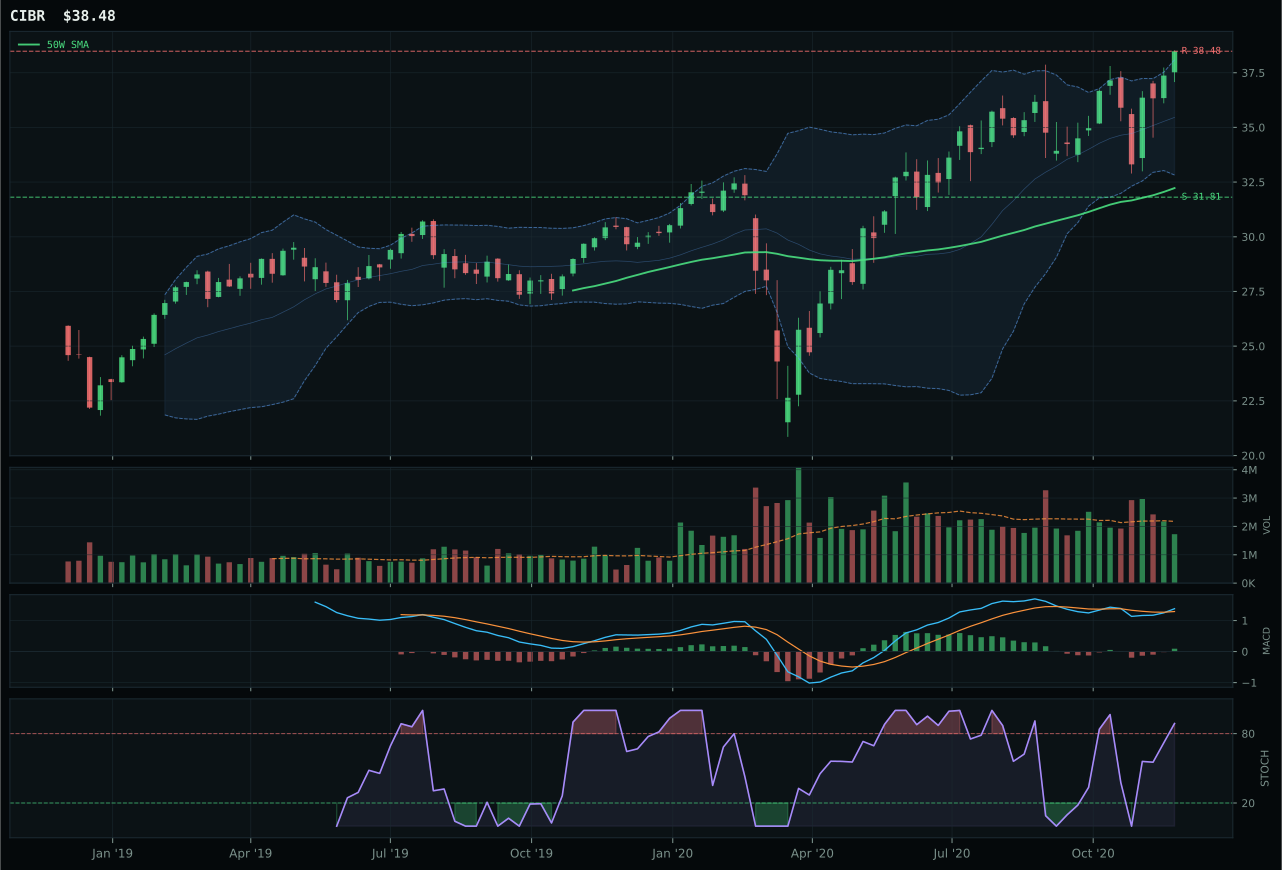
CIBR has a vertical extension profile with 2.7% 13-week relative strength versus SPY.
A failed hold above support would weaken the setup.
Actionable but governed by invalidation levels.
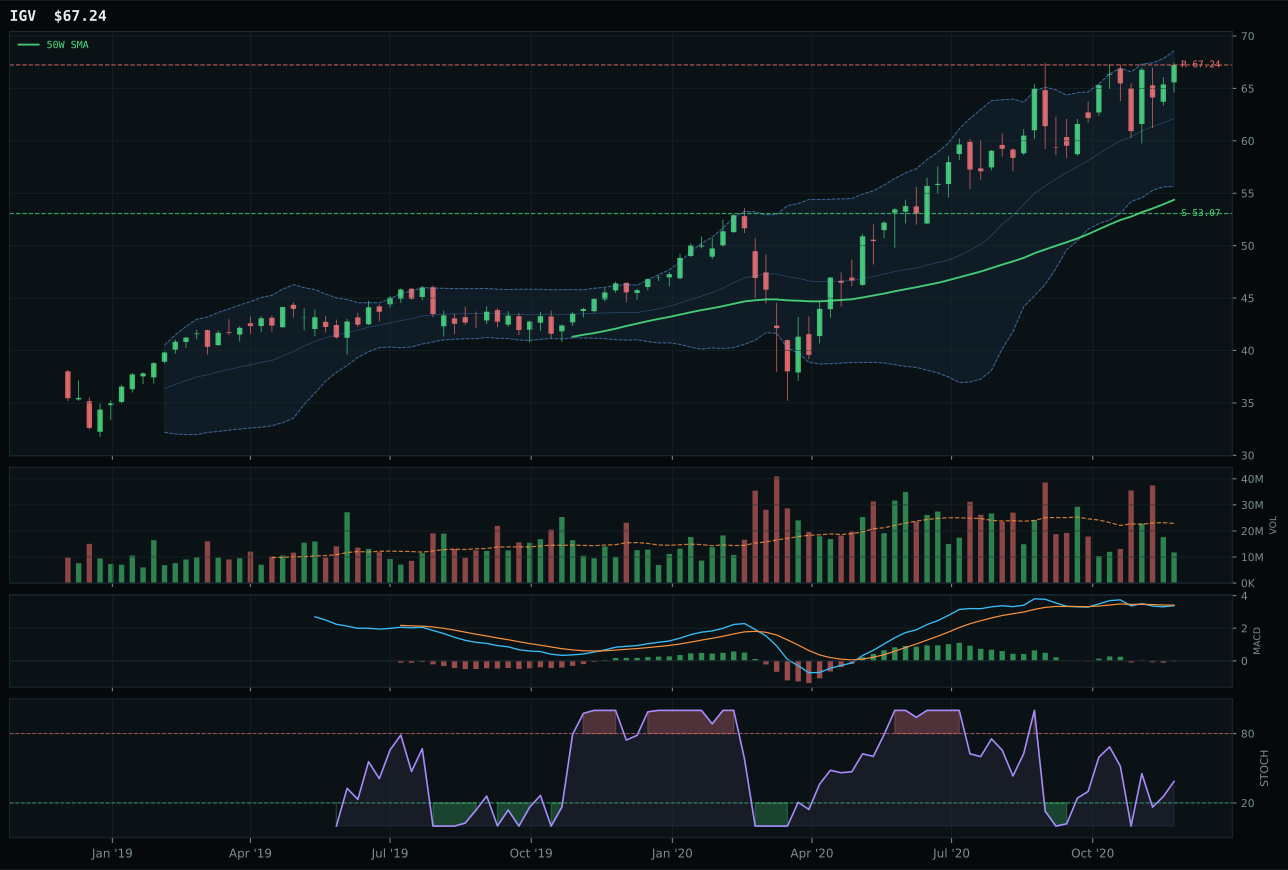
IGV has a vertical extension profile with -0.3% 13-week relative strength versus SPY.
A failed hold above support would weaken the setup.
Actionable but governed by invalidation levels.
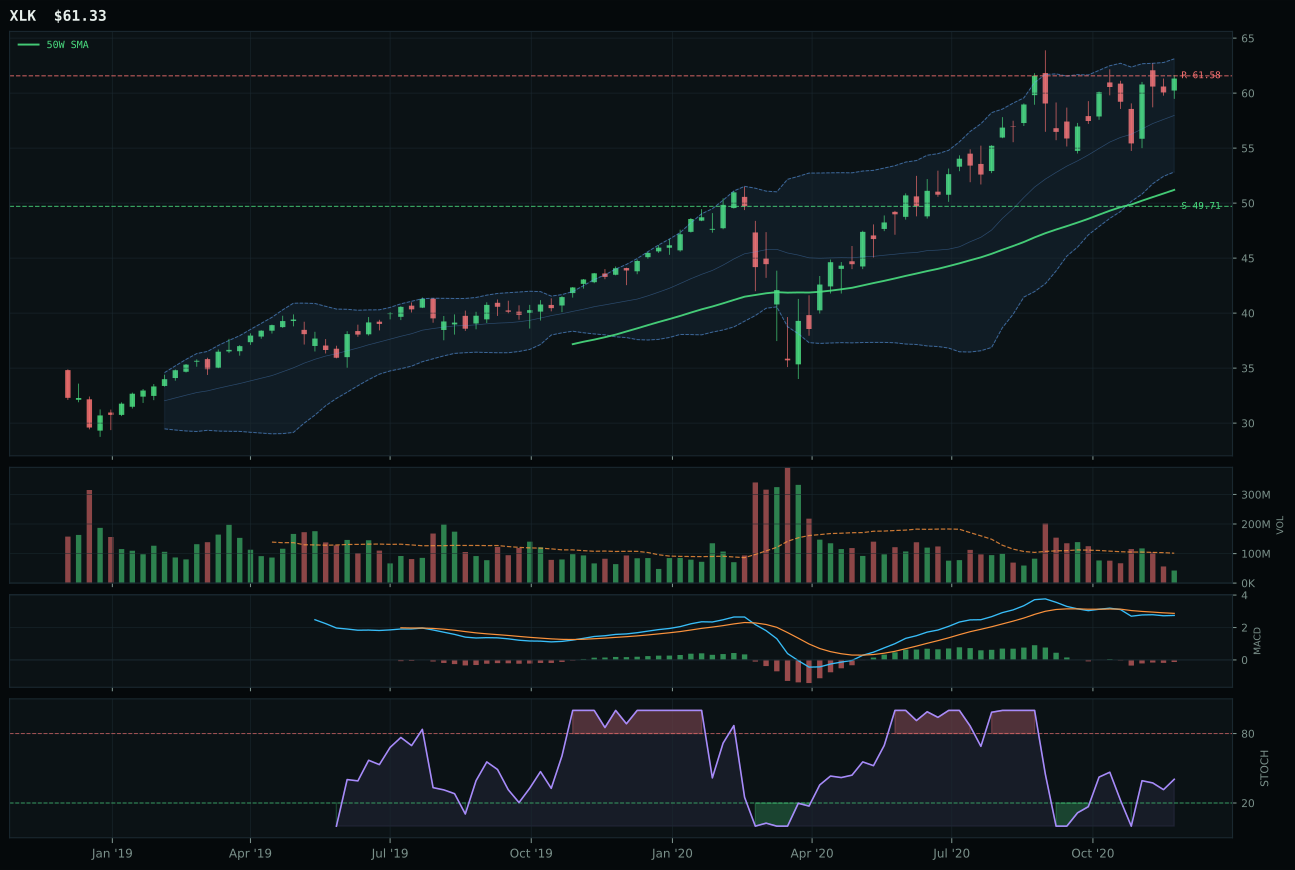
XLK has a vertical extension profile with -4.1% 13-week relative strength versus SPY.
A failed hold above support would weaken the setup.
Actionable but governed by invalidation levels.
CIBR wins the category because it combines clean trend confirmation with relative strength that IGV cannot match. Price sits above both the 50W and 200W with a steady 0.5% slope, and the 2.9% category-relative strength tells you institutional flows are favoring cybersecurity over enterprise software—this is real demand, not a bounce. MACD is bullish and improving while stochastic RSI sits overbought at 0.89, which reads as momentum that's extended but sponsored by volume-neutral accumulation rather than retail panic-buying. The 6.4% 13-week return feels earned: it's backed by a 100/100 momentum score and 70.2% volume-price confirmation. IGV's 0.0% category-relative strength and bearish-but-improving MACD reveal a setup where the technical evidence is weaker and the narrative fit is fighting headwinds. The 19.4% extension above the 50W is penalizing entry risk for CIBR, but cleanliness and structure at 75.1 versus IGV's 72.4 prove the move is orderly.
Technology earned 5% allocation as a tier-2 category, ranked outside the top two despite solid technical evidence of 71.6%. The macro environment—Risk-On Liquidity Expansion with active AI growth sponsorship at +6 and liquidity expansion at +9—should favor growth, but credit stress at -7 and a defensive rotation signal (+7) are creating cross-currents that cap the category's appeal. The final category score of 56.5 sits below stronger alternatives like Industrial Metals and Emerging Markets, where commodity and emerging-market positioning align more cleanly with the current macro regime. Cybersecurity itself is steady leadership, but the category as a whole is fighting the tension between growth momentum and defensive rotation. For Technology to reclaim a top-2 slot, either the defensive rotation would need to fade, or the category would need to show category-relative strength acceleration—right now, it's holding ground but not winning the fight for capital.
Agriculture & Livestock — MOO
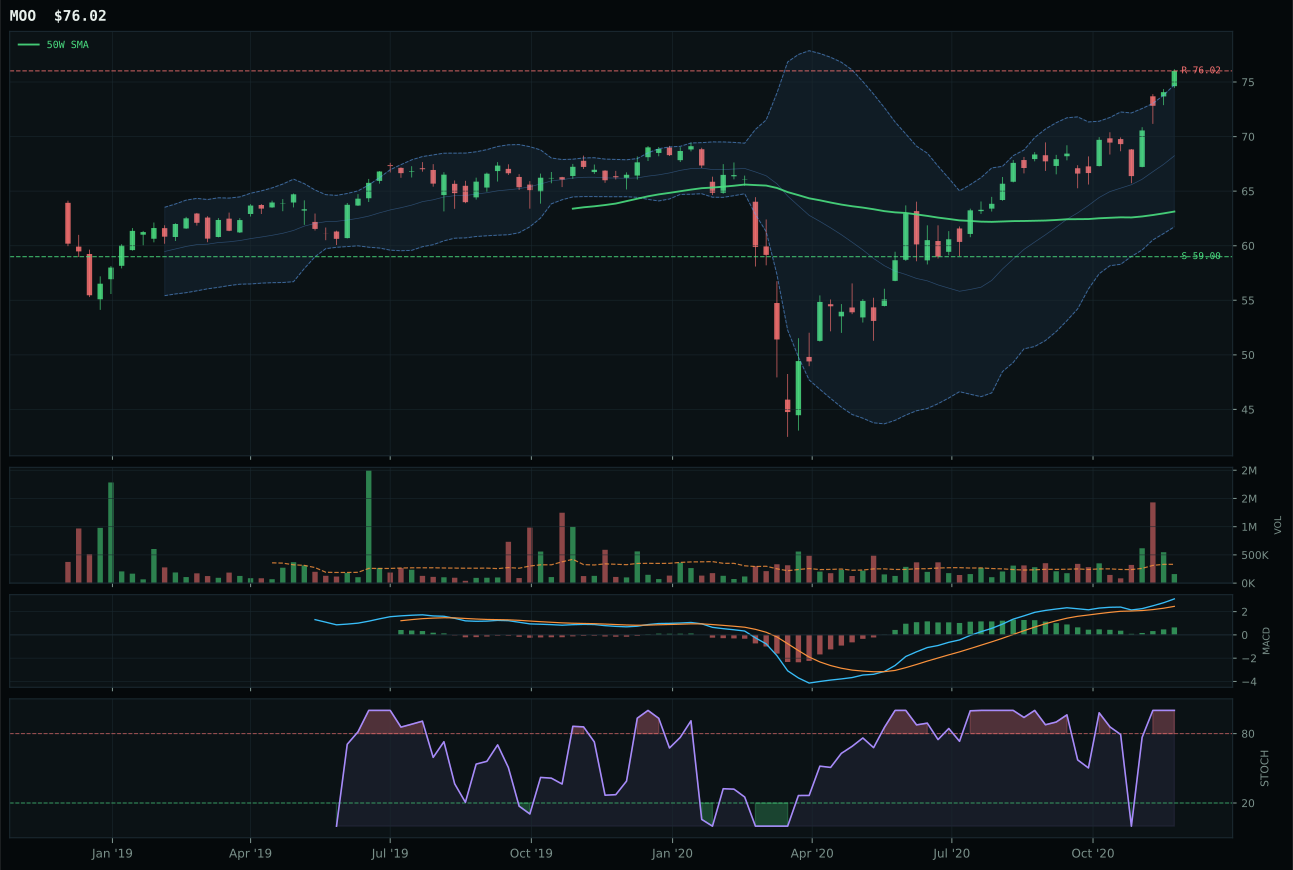
MOO has a vertical extension profile with 7.5% 13-week relative strength versus SPY.
A failed hold above support would weaken the setup.
Actionable but governed by invalidation levels.
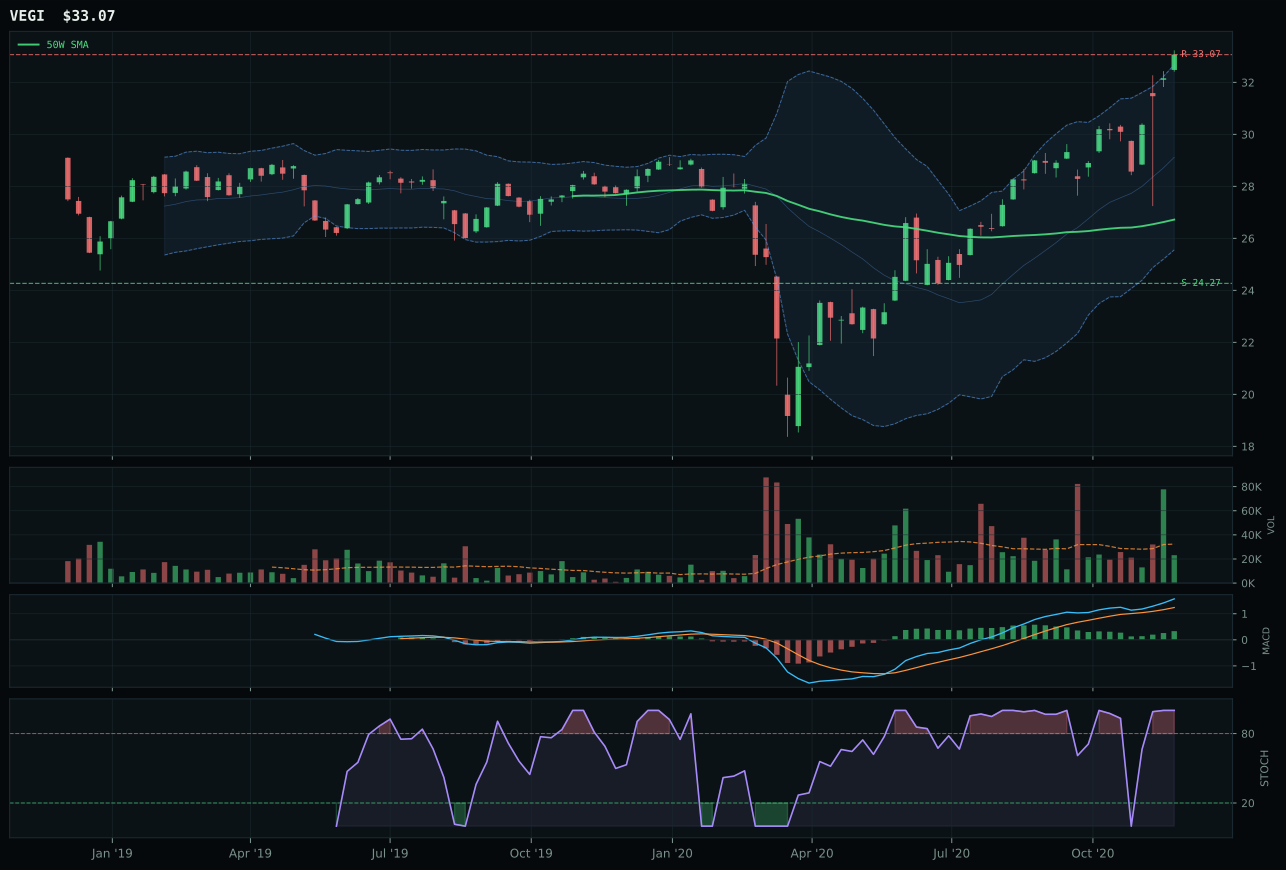
VEGI has a vertical extension profile with 10.3% 13-week relative strength versus SPY.
A failed hold above support would weaken the setup.
Tracked, but not top-2 eligible because: .
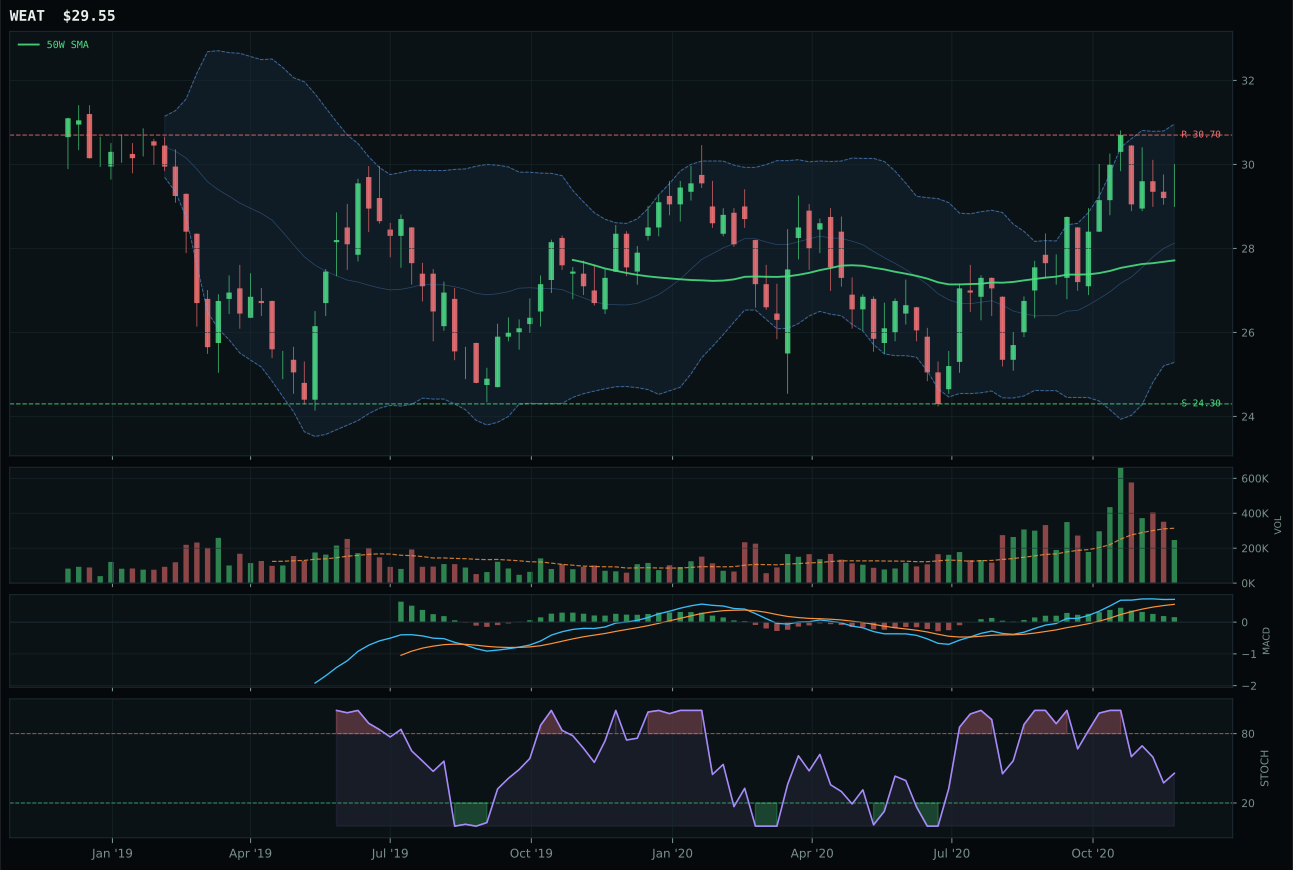
WEAT has a neutral structure profile with 3.5% 13-week relative strength versus SPY.
A failed hold above support would weaken the setup.
Tracked, but not top-2 eligible because: .
MOO wins the category decisively, beating VEGI by 20.3 points because the agribusiness story has better technical structure and cleaner volume confirmation. Both sit at 100/100 trend and momentum with bullish-and-improving MACD, both are extended at 20%+ above the 50W near Fib 0.236, and both are overbought on stochastic RSI. The gap opens up in structure (75.7 vs 74.9) and risk/reward (42.0 vs 41.0), narrow margins that compound into a decisive lead. MOO's 0.0% category-relative strength against the median is neutral and clean; VEGI's 2.8% category-relative strength suggests it's trading on global agriculture breadth rather than pure agribusiness leadership. Volume at 0.48x for MOO is thinner than VEGI's 0.48x (identical), but MOO's above-average participation is telling a story of domestic agribusiness demand. The real separation is that MOO's macro fit story—supply shortage and inflation pressure hitting commodity production—aligns cleaner than VEGI's more diversified global exposure. In an inflationary commodity environment, the pure agribusiness play outpaces the blended global agriculture approach.
Agriculture & Livestock earned 5% allocation as tier-2, supported by a category-level macro fit of 86.0%—exceptionally strong. Supply shortage at +13, inflation pressure at +10, and real asset sponsorship at +8 are all firing in the same direction. Yet the final category score of 53.0 places it fifth, well behind Industrial Metals (77.0) and Emerging Markets (79.9), because the technical setup inside MOO lacks conviction. The 11.2% 13-week return looks respectable, but it's riding thin participation (0.48x volume) and sits pinned at overbought stochastic RSI with zero upside to resistance. The macro tailwinds are strong, but the technical entry is crowded—new buyers have no room to run. The portfolio holds 5% because supply shortage and inflation pressure are real portfolio themes right now, and agribusiness benefits when commodity inputs spike. But that 5% is a position built on macro conviction, not technical momentum. For MOO to earn overweight, you'd need it to consolidate, reset volume, and build fresh accumulation—right now the macro is pulling the category in, but the chart is saying 'wait for a better entry.'
Nuclear Energy — URA
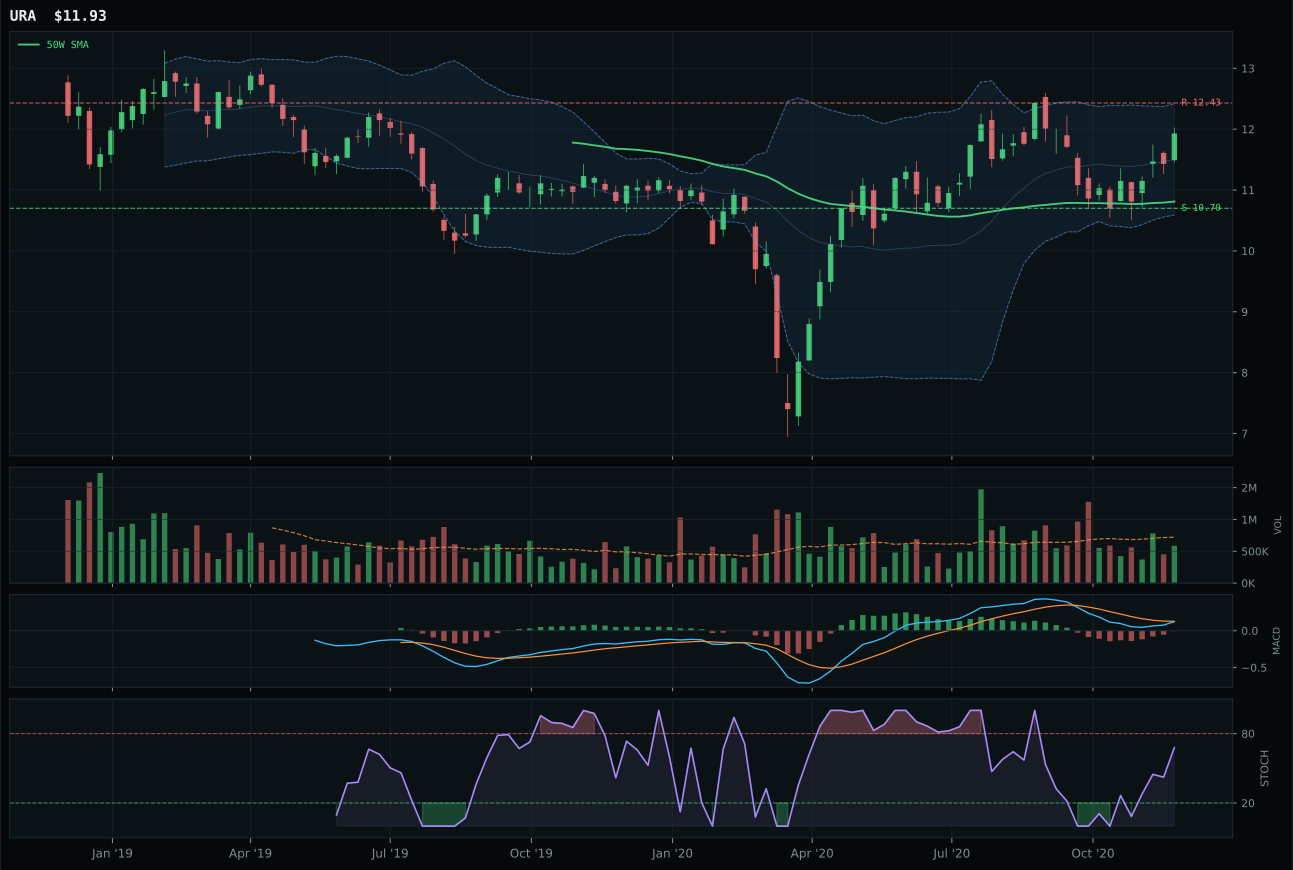
URA has a neutral structure profile with -7.8% 13-week relative strength versus SPY.
A failed hold above support would weaken the setup.
Tracked, but not top-2 eligible because: .
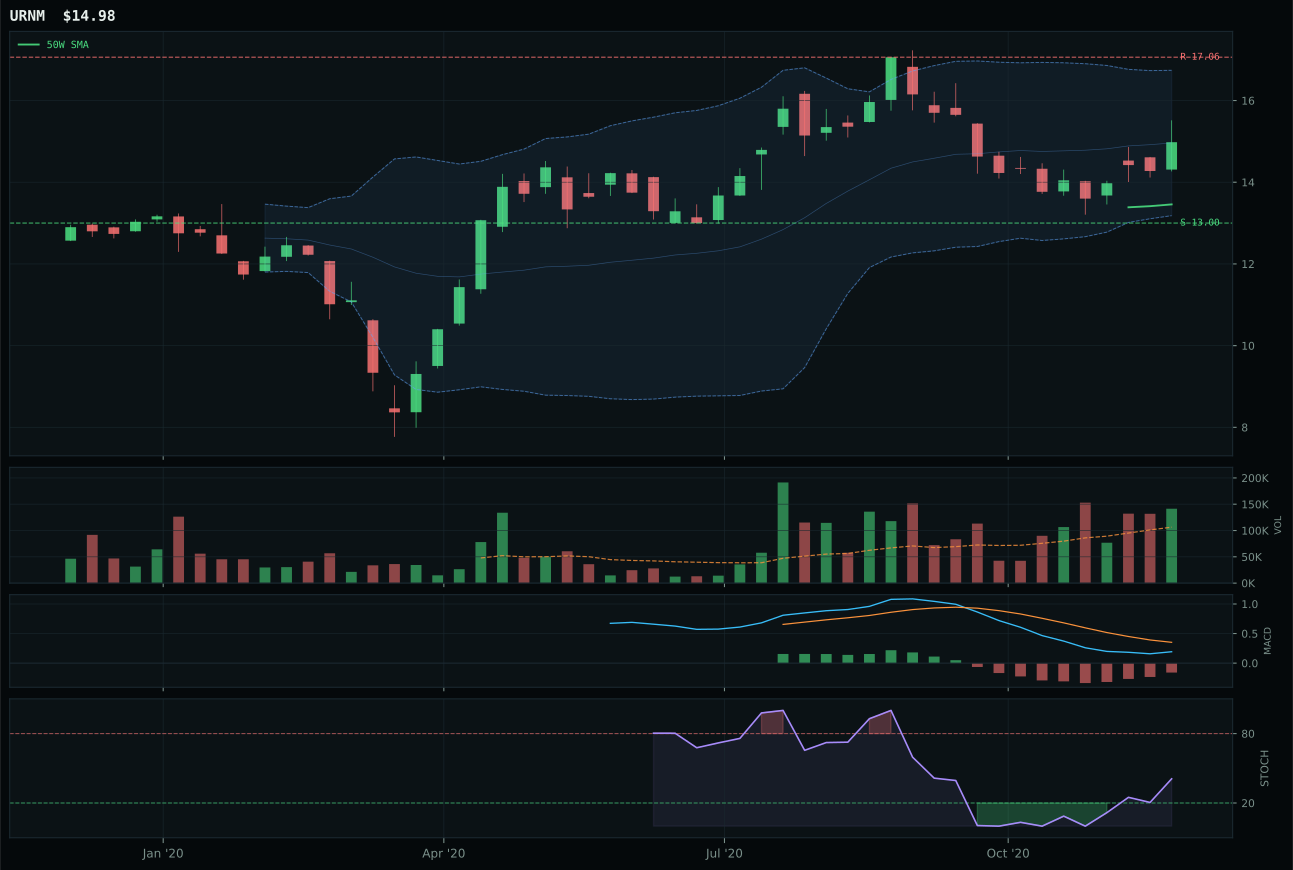
URNM has a neutral structure profile with -15.9% 13-week relative strength versus SPY.
A failed hold above support would weaken the setup.
Tracked, but not top-2 eligible because: .
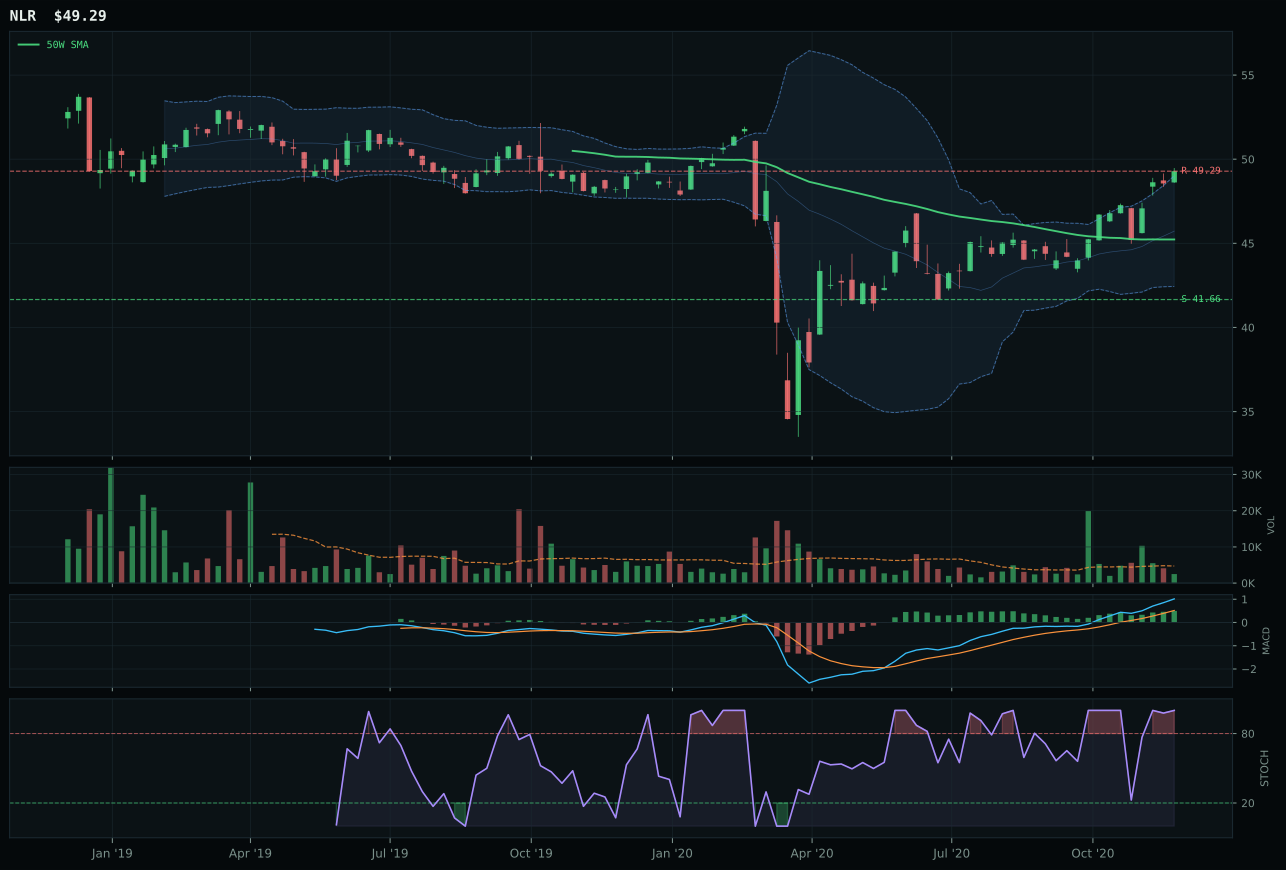
NLR has a neutral structure profile with 6.7% 13-week relative strength versus SPY.
A failed hold above support would weaken the setup.
Tracked, but not top-2 eligible because: .
URA wins the category but it's a pyrrhic victory—the category is ineligible for allocation and URA is part of why. URA's 83.0% timing score is exceptional, with price 10.3% from the 50W in the upper retracement zone (Fib 0.236 at 11.26), MACD bearish but improving, and stochastic RSI rising mid-zone at 0.68. That timing setup is textbook mean-reversion positioning. But the 53.8% momentum score (from a -4.0% 13-week return and thin category-relative strength at 0.0%) tells you the nuclear trade is losing steam. URNM's -15.9% RS versus SPY is worse than URA's -7.8%, and while URNM has better macro fit at 69.0%, its momentum is crushed at 24%. The entire category sits below 50.0 on technical evidence, and the 36.2 final score is the lowest in the portfolio. Price action in URA is neutral structure with no trend confirmation, and the MACD's bearish-but-improving reading signals a setup waiting for a catalyst, not a setup with conviction.
Nuclear Energy scored 36.2 and earned 0% allocation, ranked 10th (tied at the bottom). The category is ineligible for allocation due to insufficient technical and momentum evidence, despite a macro fit of 74.0% that includes energy scarcity at +9 and real asset sponsorship at +7. The contradiction is stark: the macro regime should favor nuclear (scarcity, clean energy, inflation hedge), but the technical setup is broken. URA's momentum score of 53.8% and category-level technical evidence below 50.0% disqualify it from consideration in a regime where there are cleaner alternatives. The risk appetite and liquidity expansion that drive Industrial Metals and Emerging Markets are not flowing into uranium miners—instead, they're flowing into scarcer, more liquid names. Nuclear energy would need a sharp rebound in momentum (positive 13-week returns), category-relative strength, and volume participation to earn even 5%. Right now, URA is neutral structure with a -4.0% 13-week return, which looks like a trade that's waiting for a catalyst but not yet receiving institutional demand. The 0% is final: other categories offer better risk/reward in the current regime.
Precious Metals — GLD
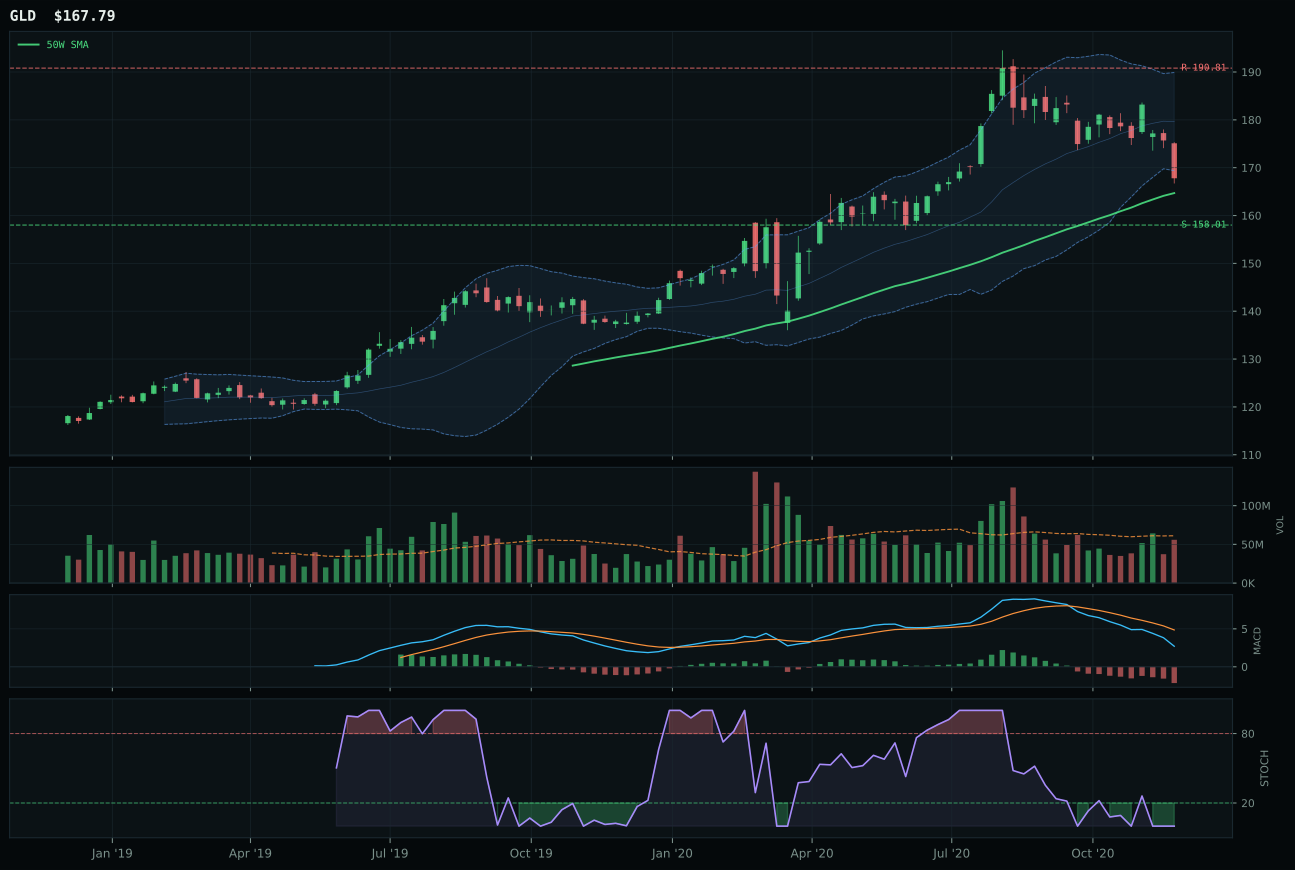
GLD has a compression near 50W profile with -12.7% 13-week relative strength versus SPY.
A failed hold above support would weaken the setup.
Actionable but governed by invalidation levels.
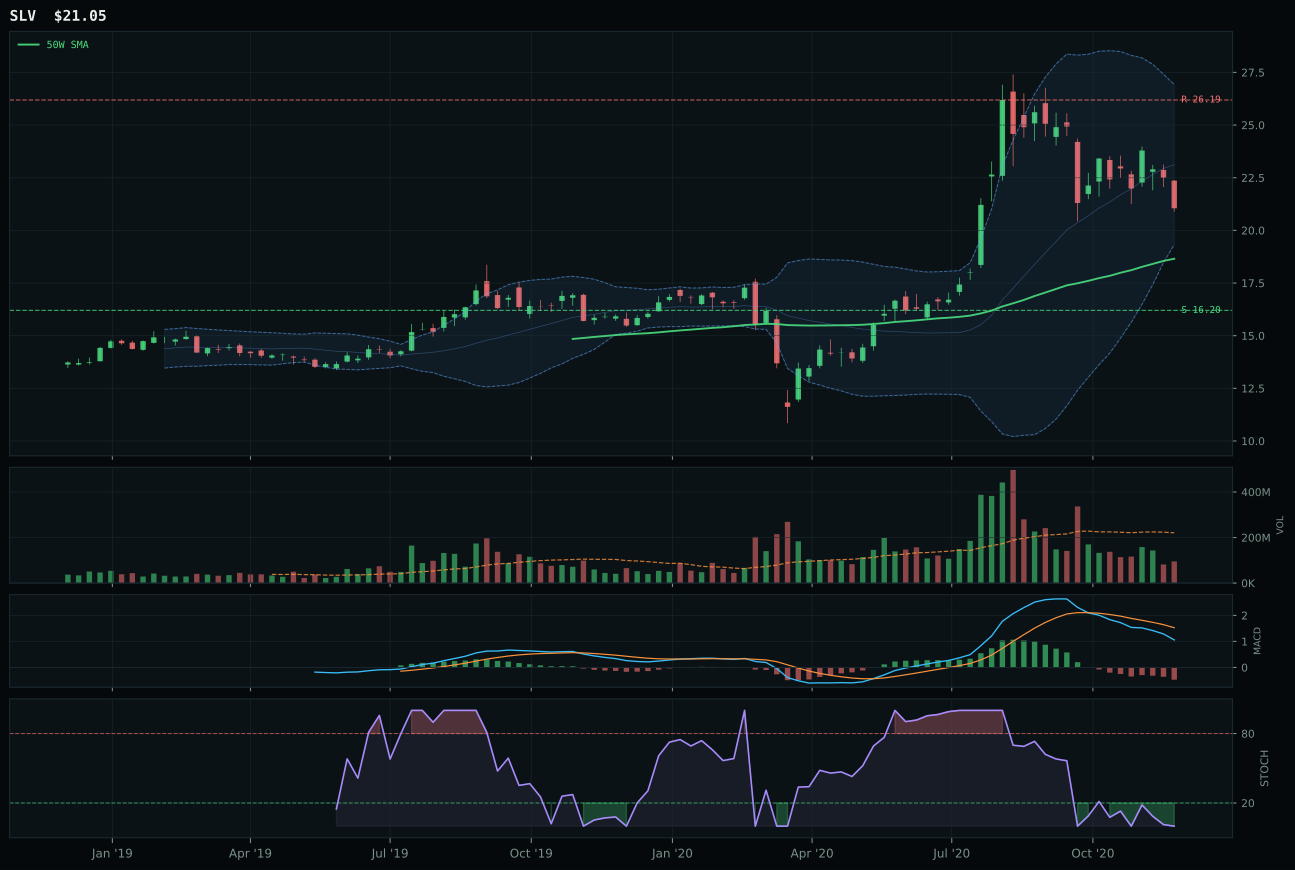
SLV has a neutral structure profile with -21.5% 13-week relative strength versus SPY.
A failed hold above support would weaken the setup.
Actionable but governed by invalidation levels.
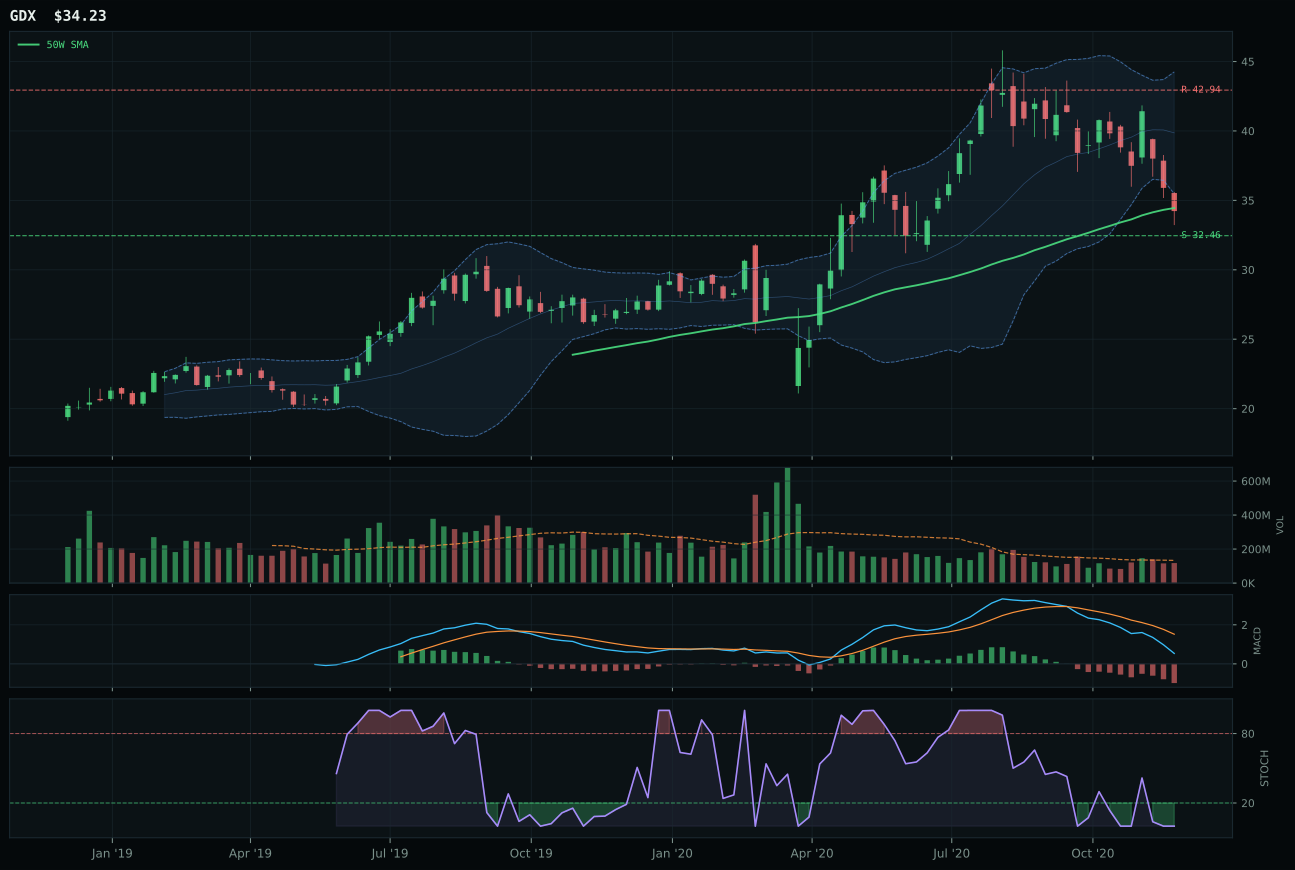
GDX has a compression near 50W profile with -22.2% 13-week relative strength versus SPY.
A failed hold above support would weaken the setup.
Actionable but governed by invalidation levels.
GLD wins the category with a composite score of 71, but the victory is hollow because the entire category is broken. GLD's 100/100 timing score is the only standout—price sits 1.9% from the 50W in the middle retracement zone at Fib 0.500, which is geometrically perfect for a mean-reversion setup. But that strength in timing is crushed by a 10.9% momentum score: the 13-week return is negative 9.0%, the 4-week return is negative 4.8%, and category-relative strength of 8.8% can't overcome -12.7% SPY-relative underperformance. MACD is bearish and weakening, stochastic RSI is oversold at 0.00, and volume confirmation sits at just 37.5%. GLD's structure is clean at 72.1%, and the risk/reward of 88.1% looks attractive (downside only 6.2% to support), but that reward asymmetry is a symptom of a broken asset—gold is being destroyed by liquidity expansion and risk appetite. SLV's -21.5% RS versus SPY is worse than GLD's -12.7%, making GLD the lesser evil by 23.9 points.
Precious Metals scored 32.9 and received 0% allocation this week, ranking outside the portfolio entirely. The macro environment is actively hostile: Risk-On Liquidity Expansion hurts the category at -4, risk appetite positive at -4, and liquidity expansion at -2. Defensive rotation at +7 is the only tailwind, leaving a category-level macro fit of just 47.0%. GLD's perfect timing setup (100/100) suggests a mean-reversion bounce could come, but the technical evidence overall is 45.5%—below the threshold for consideration. In a regime where carry is cheap, equity volatility is low, and dollar strength is stable, gold has no narrative. The 0% allocation is unambiguous: precious metals are not earning a seat at the table. For the category to earn even 5%, you would need either a sharp equity drawdown, or a macro pivot toward credit stress and flight-to-safety. Right now, neither is active. GLD's near-term timing bounce is possible, but it doesn't change the fact that the category is fundamentally out of favor in the current macro regime.