
2020-11-20
Informational purposes only. The content in this report, including allocations, analysis, and commentary, is provided solely for informational and educational purposes. It does not constitute financial advice, investment advice, trading advice, or any other type of advice. Past performance does not guarantee future results. Always conduct your own research and consult a qualified financial professional before making investment decisions.
Some tracked tickers were excluded due to missing live weekly price data: SGOV: Historical cache SGOV has only 25 usable weekly bars
Weekly Allocation
| Ticker | Category | Weight | Role |
|---|---|---|---|
| FSOL | 50% | Overlay | |
| REMX | Industrial Metals | 10% | Top-2 (10%) |
| ILF | Emerging Markets | 10% | Top-2 (10%) |
| PAVE | Utilities & Infrastructure | 5% | Tier-2 (5%) |
| XAR | Defense & Aerospace | 5% | Tier-2 (5%) |
| SMH | AI | 5% | Tier-2 (5%) |
| MOO | Agriculture & Livestock | 5% | Tier-2 (5%) |
| CIBR | Technology | 5% | Tier-2 (5%) |
| FCG | Traditional Energy | 5% | Tier-2 (5%) |
Trade Instructions — Monday Open
Sell the tranche from 2020-10-23 (completing its 4-week hold). Buy the new tranche. Instructions show net portfolio changes — same-asset positions cancel, weight changes show the delta.
| Action | Ticker | Instruction |
|---|---|---|
| SELL | SMH | Sell 17% of SMH position (reduce 7.50% → 6.25%) |
| SELL | COPX | Sell 50% of COPX position (reduce 5.00% → 2.50%) |
| SELL | IGV | Sell 50% of IGV position (reduce 2.50% → 1.25%) |
| SELL | IEMG | Sell 25% of IEMG position (reduce 5.00% → 3.75%) |
| SELL | XLE | Sell 50% of XLE position (reduce 2.50% → 1.25%) |
| BUY | REMX | Buy REMX — 33.33% of freed cash (adds 2.50% to portfolio) |
| BUY | ILF | Buy ILF — 33.33% of freed cash (adds 2.50% to portfolio) |
| BUY | CIBR | Buy CIBR — 16.67% of freed cash (adds 1.25% to portfolio) |
| BUY | FCG | Buy FCG — 16.67% of freed cash (adds 1.25% to portfolio) |
Current Portfolio After Trade
Combined holdings across all 4 active tranches. Each tranche is 25% of the portfolio.
| Ticker | % of Portfolio | Weight Bar |
|---|---|---|
| FSOL | 50.00% | |
| SMH | 6.25% | |
| REMX | 6.25% | |
| MOO | 5.00% | |
| XAR | 5.00% | |
| ILF | 5.00% | |
| IEMG | 3.75% | |
| COPX | 2.50% | |
| XLK | 2.50% | |
| XLU | 2.50% | |
| IGF | 2.50% | |
| IGV | 1.25% | |
| XLE | 1.25% | |
| SLV | 1.25% | |
| GLD | 1.25% | |
| PAVE | 1.25% | |
| CIBR | 1.25% | |
| FCG | 1.25% |
Macro Regime — Transition / Mixed
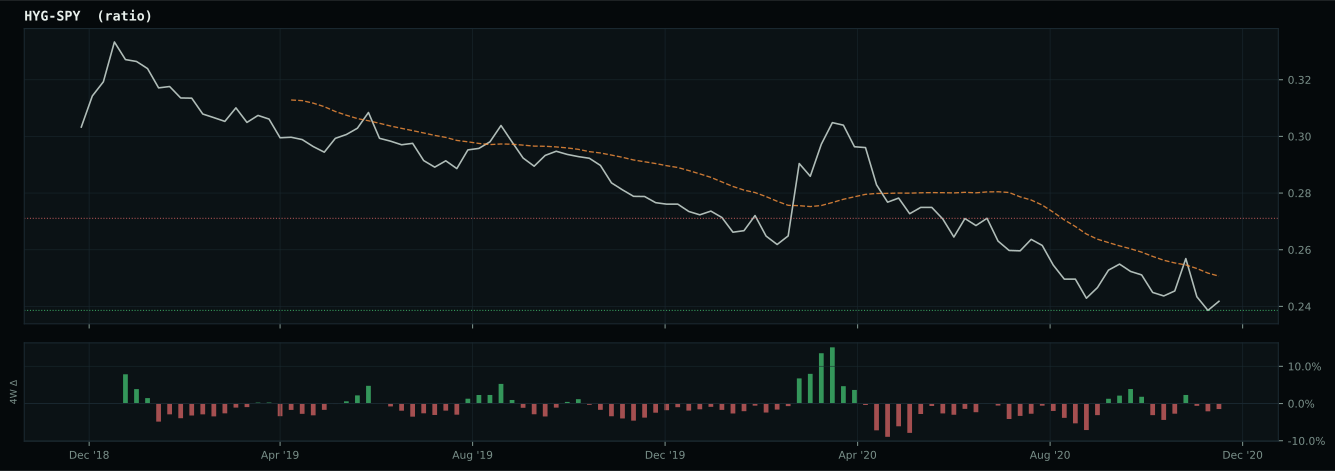
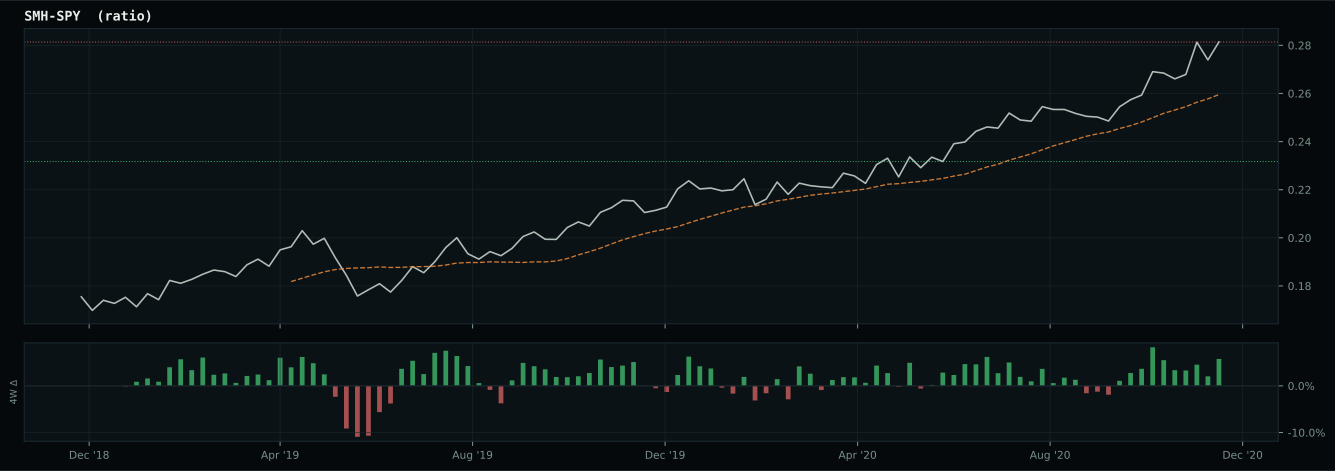
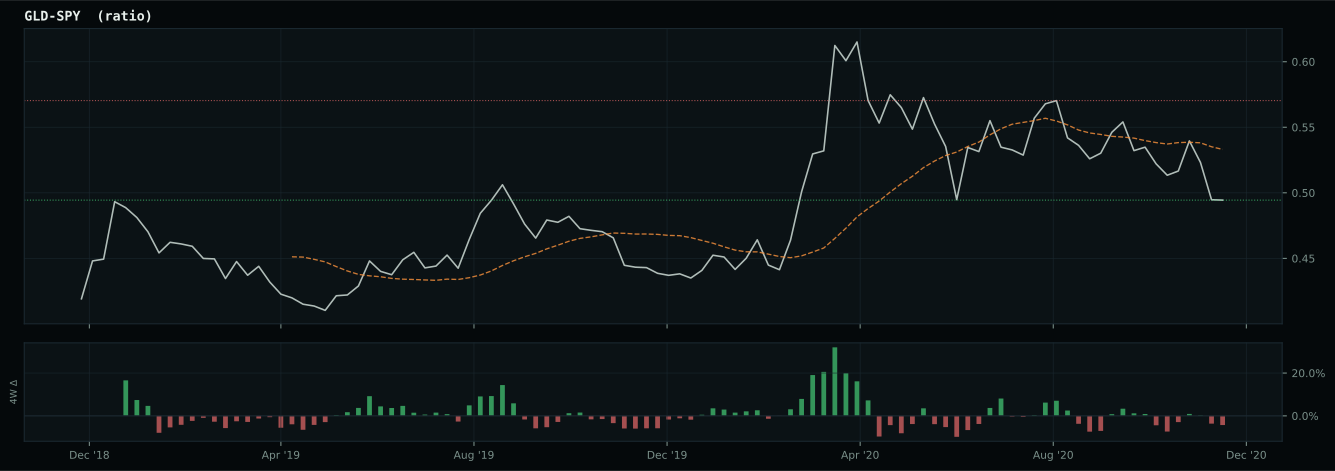
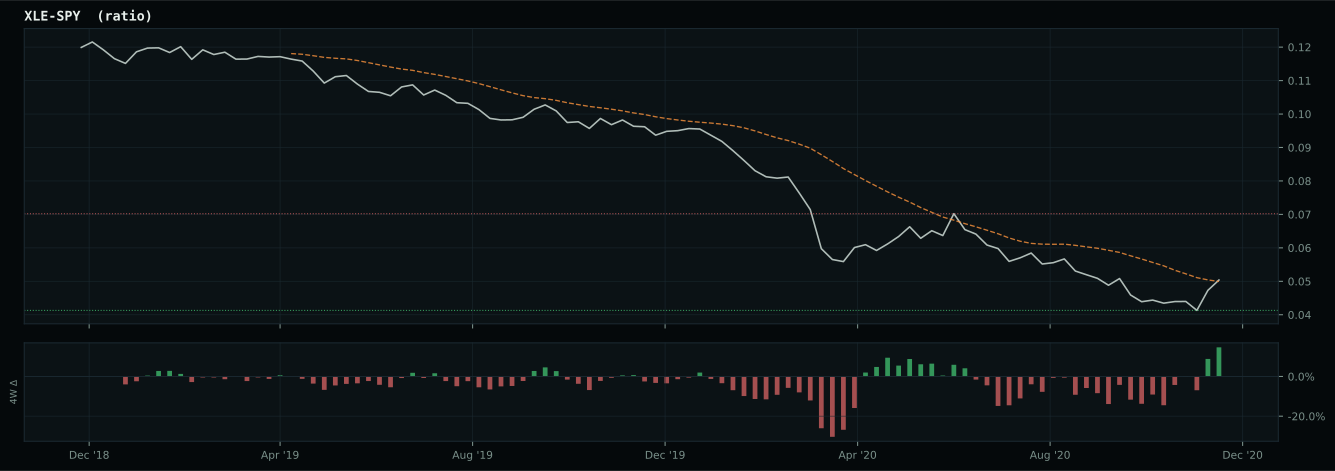
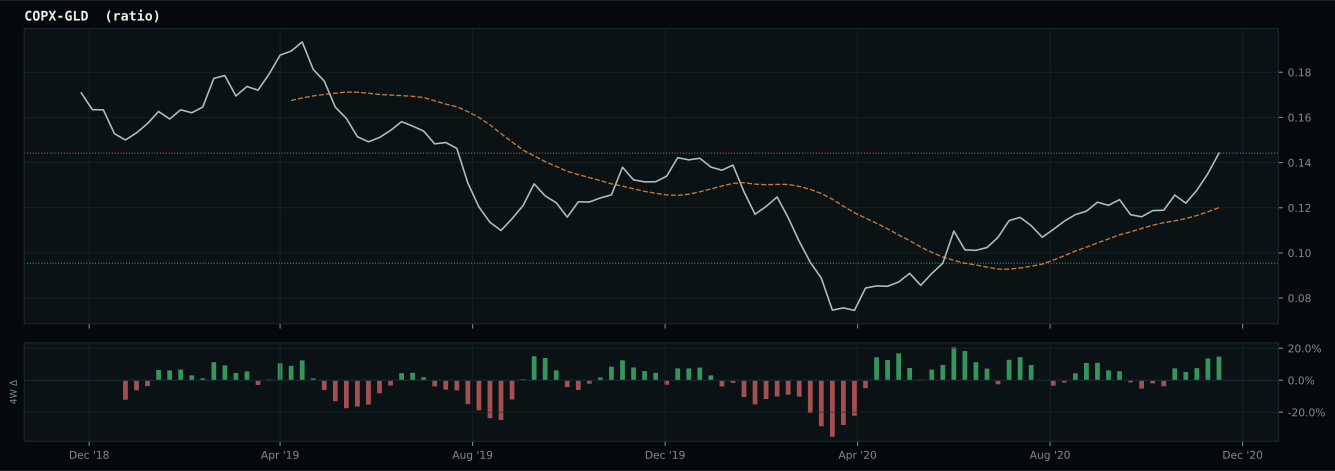
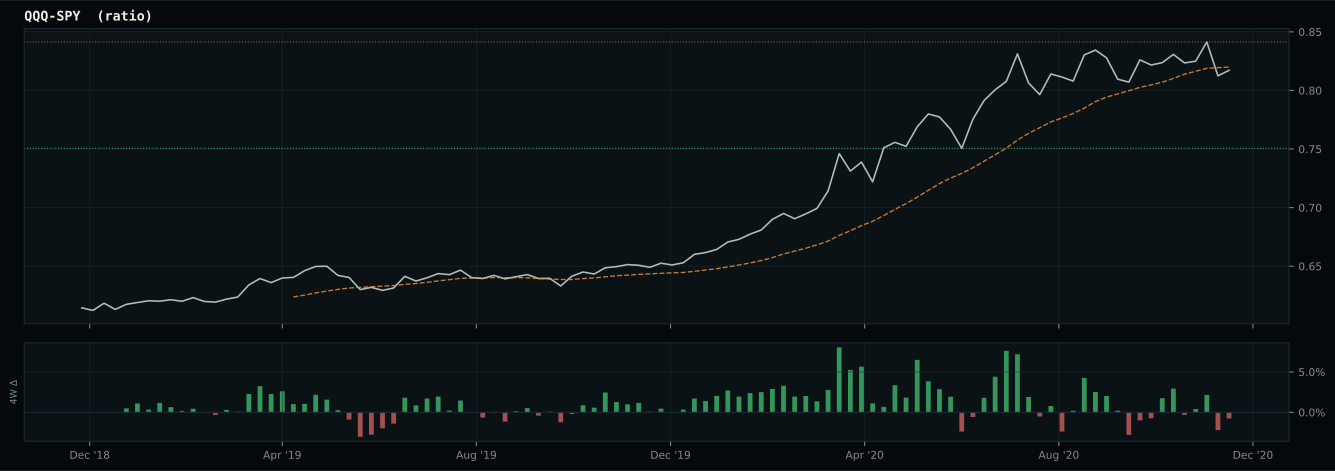
Macro Evidence Charts
Market-implied signals behind the macro regime scores. Each ratio compares two assets; the direction and slope of the ratio is what the macro engine reads.
Crypto Regime — AltSeason
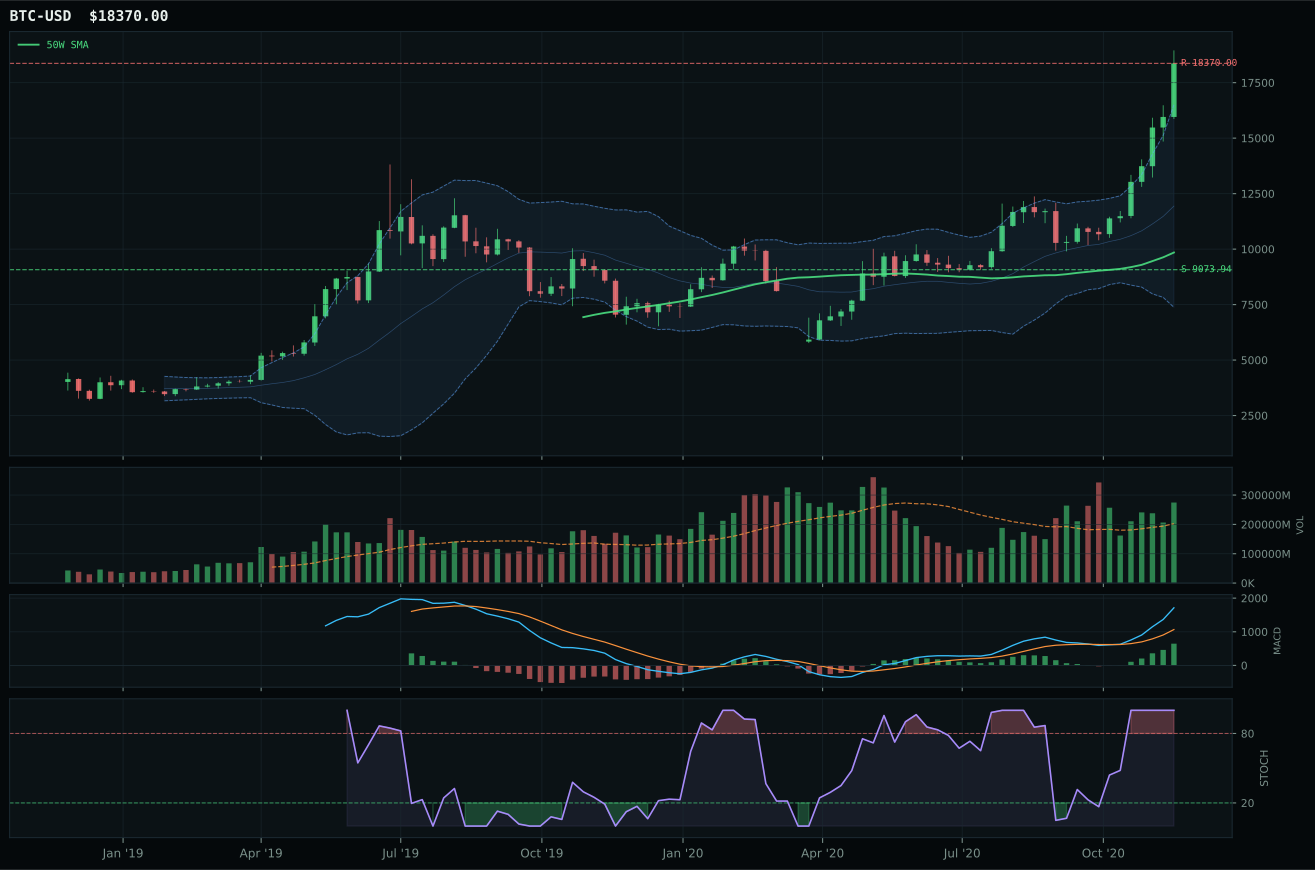
post-touch structure is too wide to count as a range; max/min close ratio is 2.96
TrendBTC confirmed: 2 consecutive closes above rising/flat 50W SMA
all available AltSeason conditions pass; missing optional confirmations skipped

Category Rankings
| Rank | Category | Winner | Score | Alloc | 4W Ret | Peers (4W) |
|---|---|---|---|---|---|---|
| 1 | Industrial Metals | REMX | 76.7 | 20% | +11.79% | PICK +15.0% · COPX +13.9% |
| 2 | Emerging Markets | ILF | 73.7 | 20% | +10.58% | IEMG +0.7% · INDA +2.7% |
| 3 | Utilities & Infrastructure | PAVE | 71.4 | 10% | +2.56% | IGF -1.4% · XLU -3.9% |
| 4 | Defense & Aerospace | XAR | 66.8 | 10% | +5.28% | ITA -0.1% · ROKT +4.5% |
| 5 | AI | SMH | 63.5 | 10% | +5.38% | BOTZ +2.7% · AIQ +5.2% |
| 6 | Agriculture & Livestock | MOO | 49.8 | 10% | +1.46% | VEGI +2.0% · WEAT -0.7% |
| 7 | Technology | CIBR | 46.8 | 10% | +15.65% | IGV +8.2% · XLK +4.9% |
| 8 | Traditional Energy | FCG | 45.5 | 10% | +10.03% | XLE +2.9% · XOP +6.7% |
| 9 | Precious Metals | GLD | 39.3 | 0% | +0.68% | SLV +7.9% · GDX +2.3% |
| 10 | Nuclear Energy | NLR | 33.8 | 0% | -0.56% | URA +27.8% · URNM +41.5% |
Industrial Metals — REMX
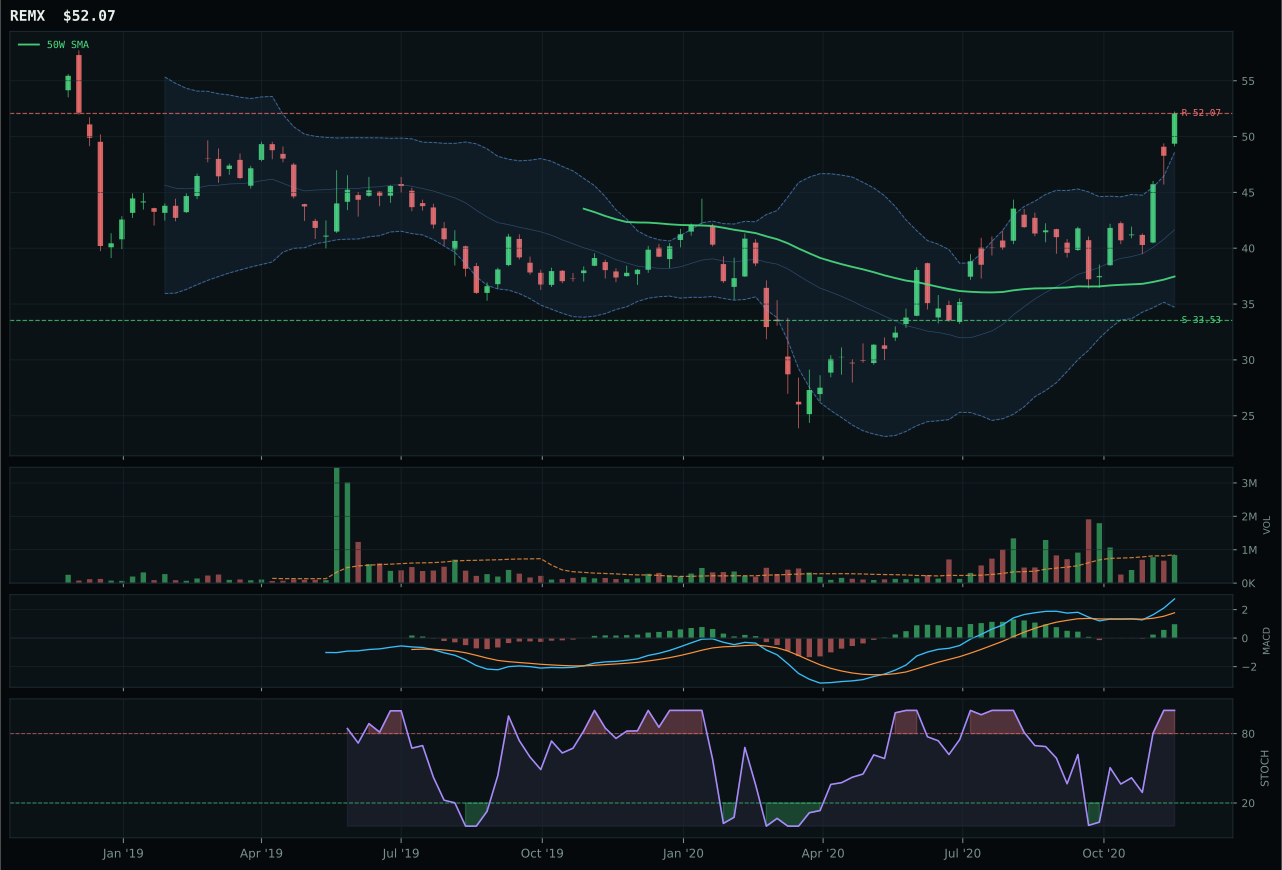
REMX has a vertical extension profile with 21.3% 13-week relative strength versus SPY.
A failed hold above support would weaken the setup.
Actionable but governed by invalidation levels.
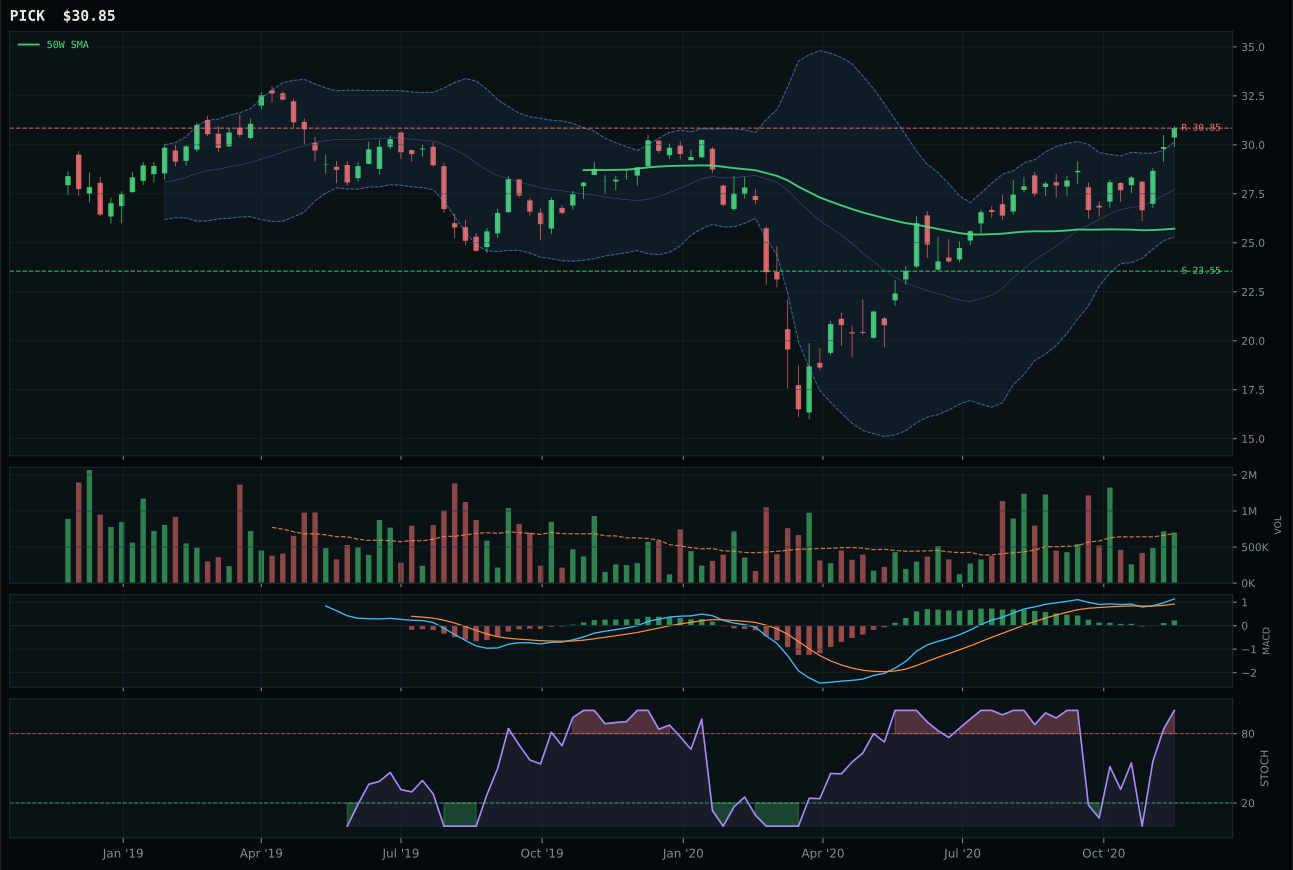
PICK has a vertical extension profile with 7.6% 13-week relative strength versus SPY.
A failed hold above support would weaken the setup.
Actionable but governed by invalidation levels.
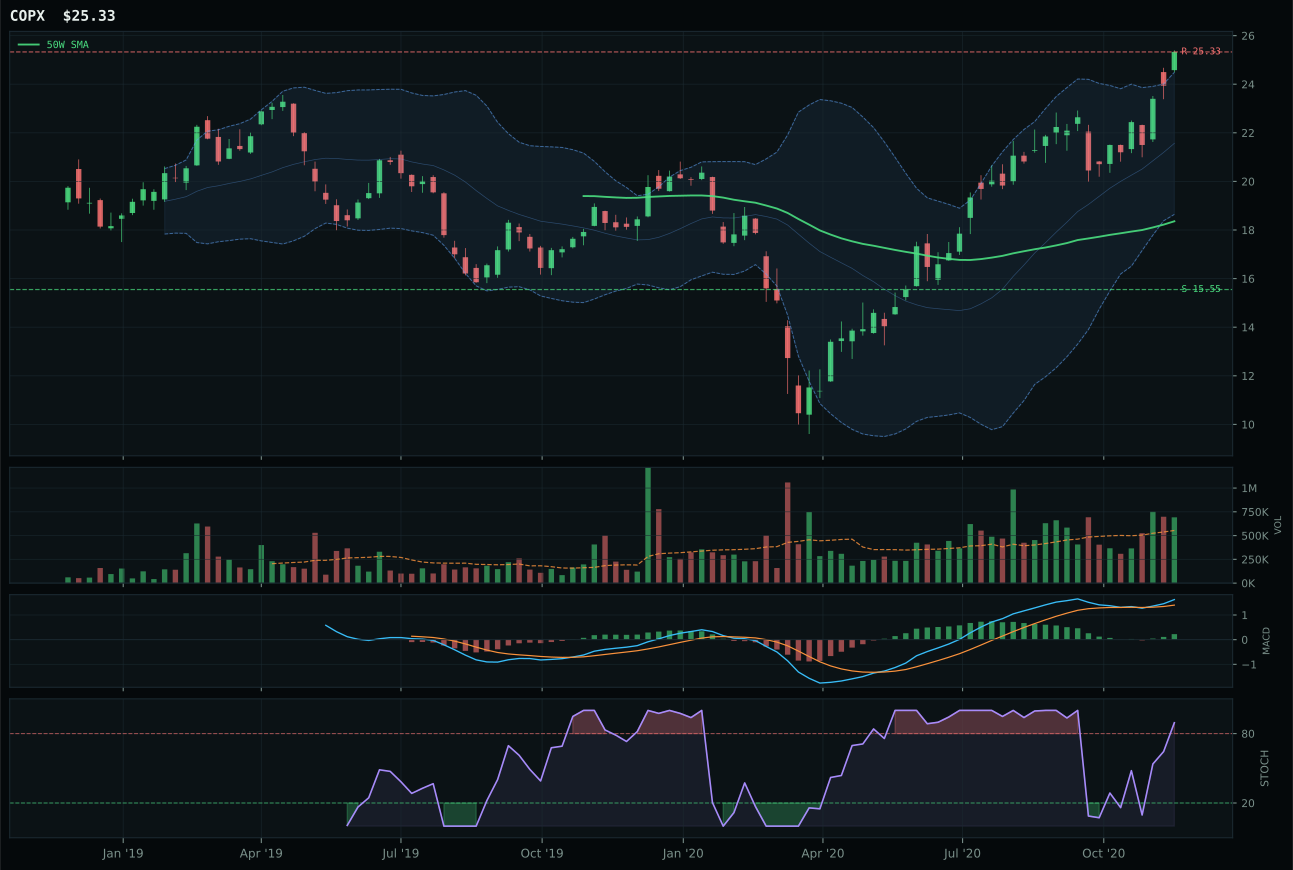
COPX has a vertical extension profile with 14.3% 13-week relative strength versus SPY.
A failed hold above support would weaken the setup.
Actionable but governed by invalidation levels.
REMX wins via relative strength dominance despite a 39% extension above its 50W that penalizes timing to 37. REMX's +21.3% RS versus SPY and +7.0% category-relative strength establish rare-earth supply scarcity as the primary liquidity driver—not just commodity breadth but a structural shortage narrative. PICK's 100 trend score versus REMX's 90 initially suggests better positioning, but PICK's 0.0% category-relative strength and -6.8% category underperformance reveal the leadership is concentrated in REMX, not dispersed. Both show bullish improving MACD and overbought stochastic, both sit near the 52W high, but REMX's volume-price confirmation of 72.2 reflects genuine accumulation (0.99x 20W) versus PICK's 66, which suggests retail enthusiasm rather than institutions. REMX's 26.0% 13W return and +26.3% 4W return establish persistence; the move is real, not a flash.
Industrial Metals scores 76.7 and claims a top-2 allocation slot at 10%—second only to the dominant FSOL category—because macro sponsorship reaches 73.0 and technical evidence averages 70.3 across a three-name basket that includes COPX at 75.5 reasoned score. Metals scarcity sits active at 14 basis points, commodity breadth positive at 10, real asset sponsorship at 6, and even credit stress contributes a neutral -7 rather than a crushing blow. The combination creates a +23 macro advantage that lifts the category despite REMX's brutal 39.0% extension from the 50W. The allocator assigns 10% here because this is the rare intersection of overbought technicals with overwhelmingly positive macro: AI chip demand, electric-vehicle supply chains, and renewable energy infrastructure are all pulling industrial metals higher regardless of near-term consolidation risk. The persistence score of 86.2 confirms that these moves are not noise—they reflect structural demand shifts. A pullback to the 50W would make this allocation feel deeply uncomfortable, but the macro regime is so conducive to real-asset inflation that even extended setups earn capital here. The allocation would shrink if MACD rolls over or if category-relative breadth (PICK's role) deteriorates faster than expected.
Emerging Markets — ILF
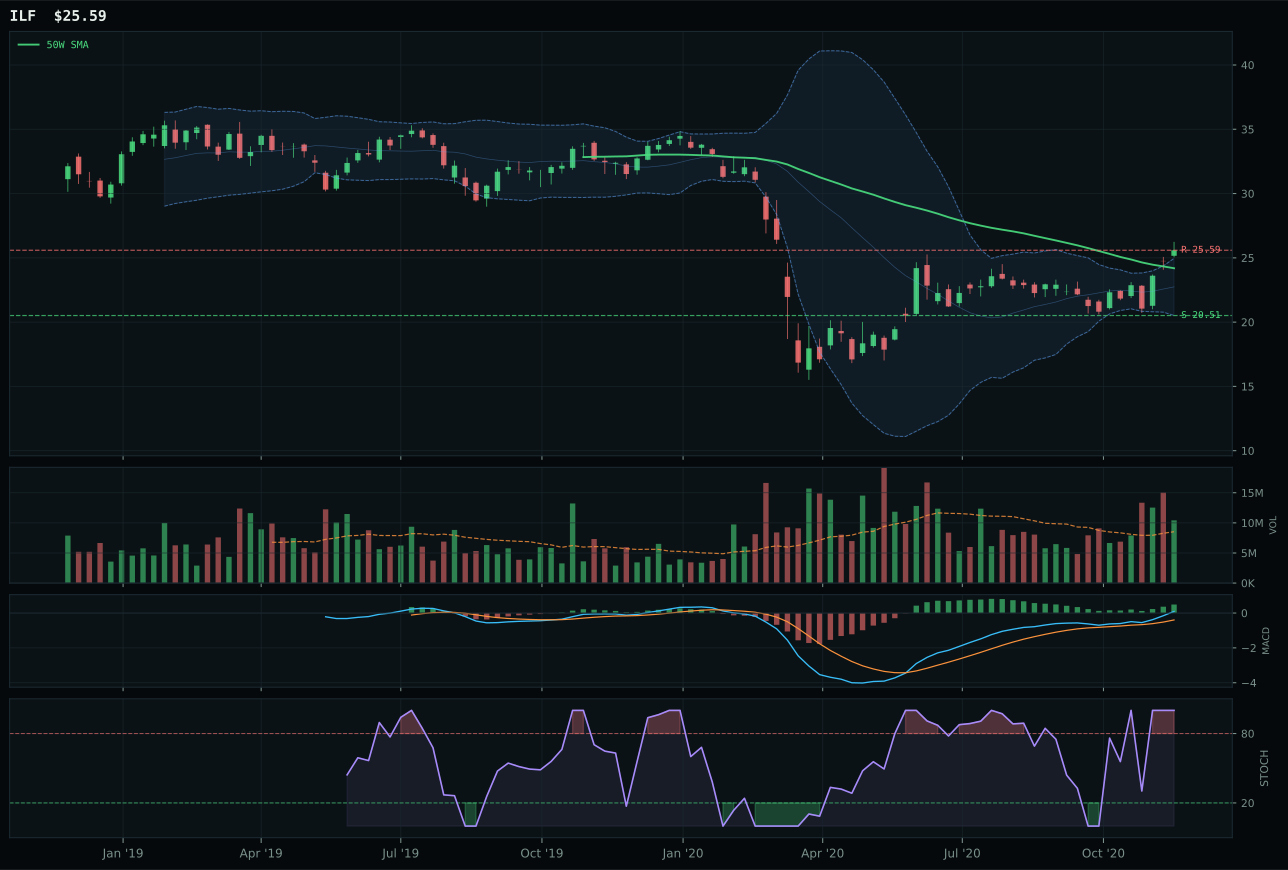
ILF has a neutral structure profile with 10.3% 13-week relative strength versus SPY.
A failed hold above support would weaken the setup.
Actionable but governed by invalidation levels.
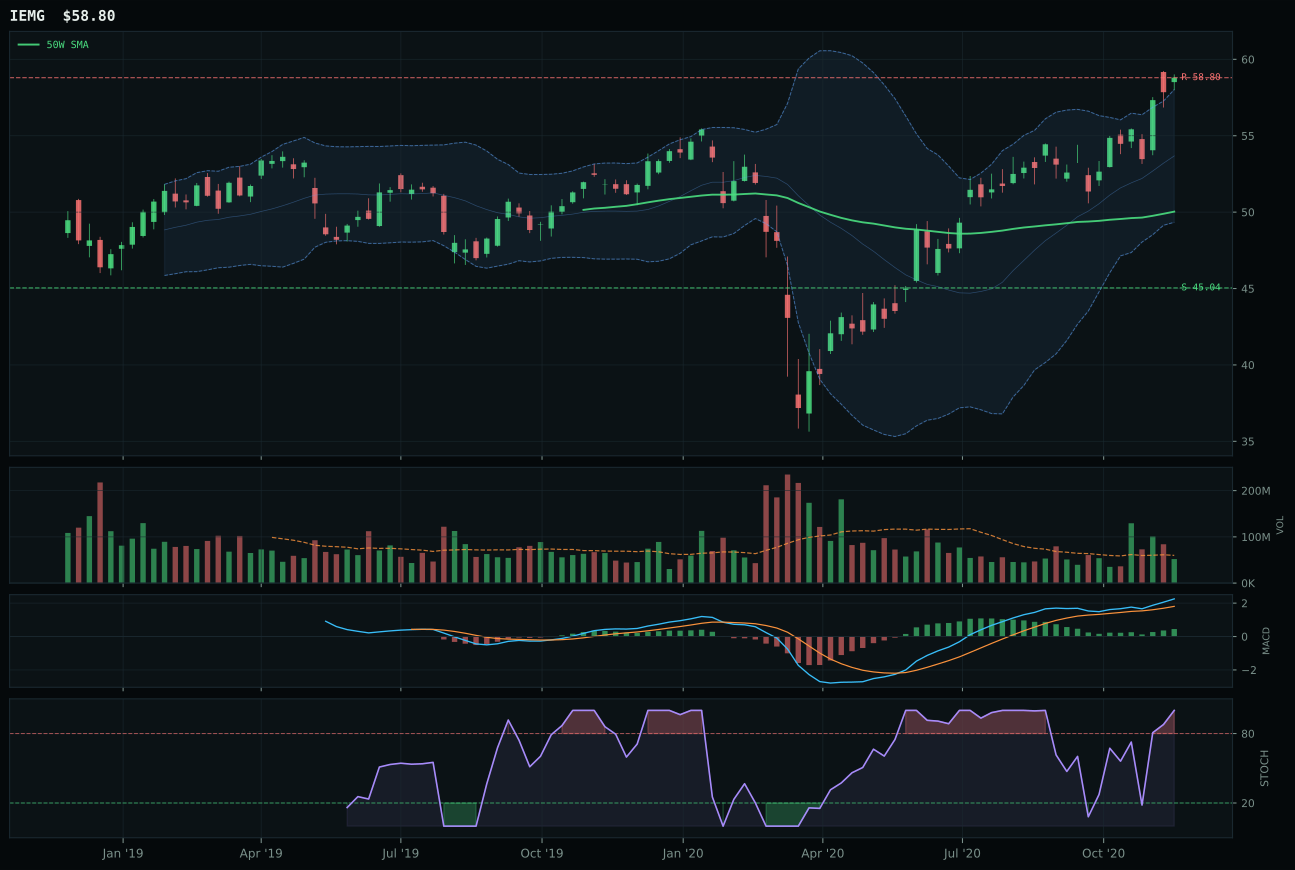
IEMG has a vertical extension profile with 6.5% 13-week relative strength versus SPY.
A failed hold above support would weaken the setup.
Actionable but governed by invalidation levels.
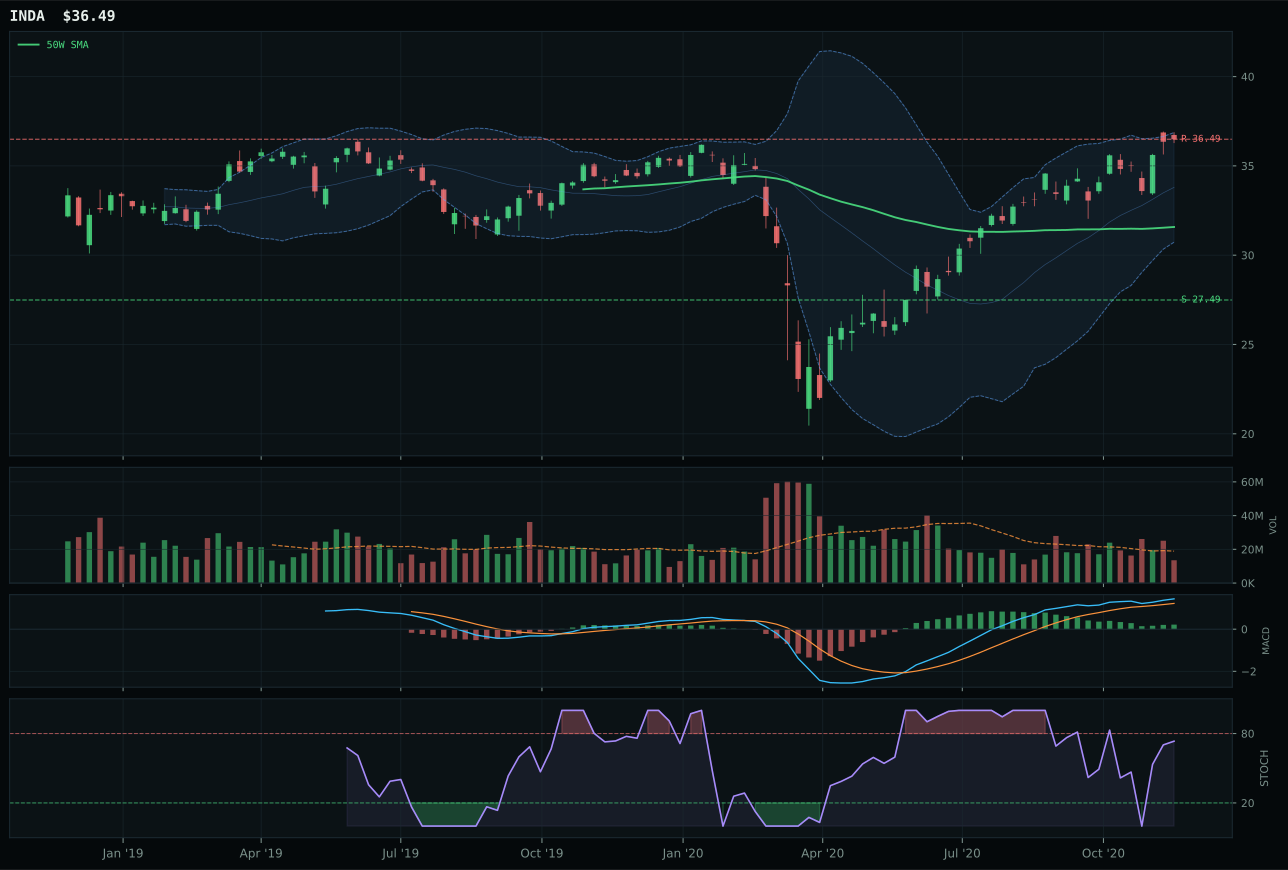
INDA has a vertical extension profile with 5.6% 13-week relative strength versus SPY.
A failed hold above support would weaken the setup.
Actionable but governed by invalidation levels.
ILF beats IEMG by 2.6 points on timing and volume confirmation—a narrow win that reflects superior execution of a broad category theme. ILF sits 5.8% above its 50W in the middle retracement / decision zone (Fib 0.500), the ideal staging ground for institutional accumulation; IEMG sits 17.5% above its 50W (near 52W high), a stretched setup that punishes latecomers. ILF's above-average 1.22x volume participation confirms active buying versus IEMG's neutral volume at a critical extension point. Both show bullish improving MACD and overbought stochastic, both deliver strong 13W returns (ILF +15.0%, IEMG +11.2%), but ILF's +10.3% RS versus SPY versus IEMG's +6.5% RS establishes Latin America commodity and value rotation as the truest expression of emerging-market flows. ILF's 75.0 timing score versus IEMG's 37.0 captures this divergence: ILF is set up for accumulation, IEMG is extended into distribution.
Emerging Markets scores 73.7 and claims a top-2 allocation slot at 10% because it ranks second only to Industrial Metals (76.7) in category score and delivers 86.1 technical evidence from ILF combined with 70.0 macro fit that activates EM liquidity support (14 basis points), liquidity expansion (8), and risk appetite positive (8). The +30 macro tailwind confirms that altseason environments lift emerging markets through a combination of fresh capital seeking yield and commodity inflation beneficiaries. ILF's Latin America exposure particularly benefits from inflation protection and real-asset repricing, while the category avoids the extended-price penalties that haunt AI and Agriculture. The allocator positions this at 10% as a conviction play on commodity-linked emerging markets and the first sign of broadening risk appetite toward frontier beta. The technical setup (timing 75.0, momentum 100.0) provides meaningful safety compared to categories like AI or Agriculture where extensions near 52W highs demand caution. Emerging Markets would hold this allocation through a modest pullback because the macro regime is structurally supportive, but a sharp reversal in EM liquidity support or a China growth shock would trigger quick downsize to 5% or even 0%.
Utilities & Infrastructure — PAVE
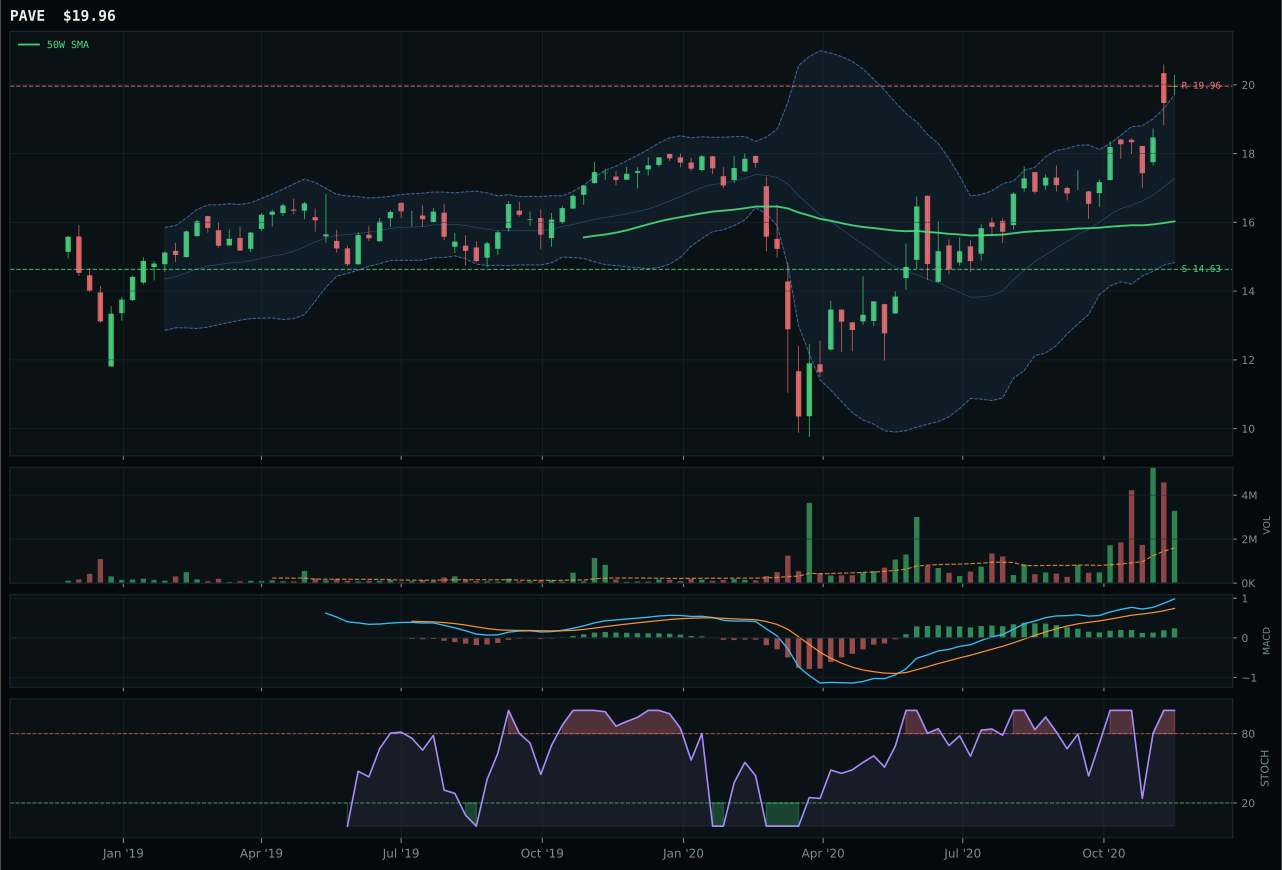
PAVE has a vertical extension profile with 13.5% 13-week relative strength versus SPY.
A failed hold above support would weaken the setup.
Actionable but governed by invalidation levels.
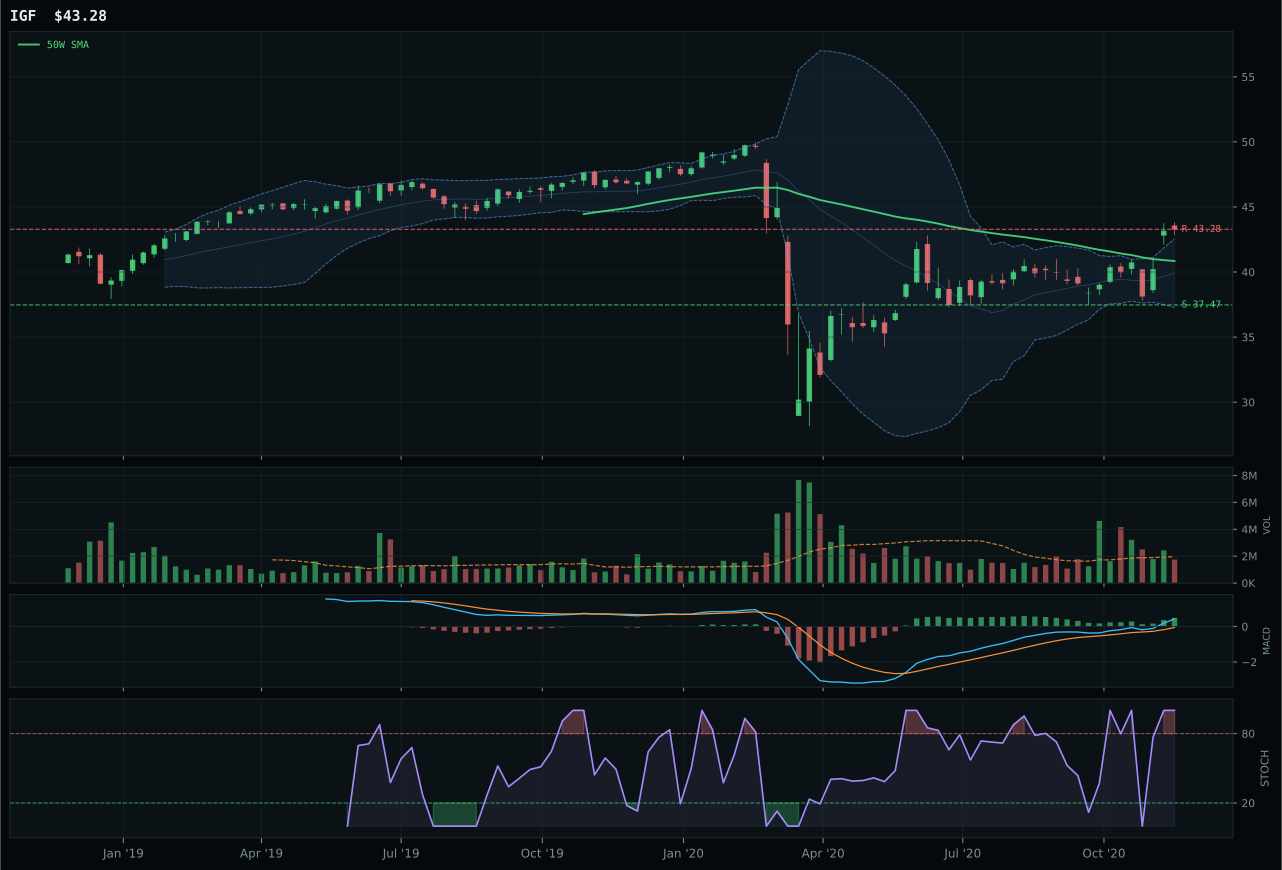
IGF has a neutral structure profile with 3.8% 13-week relative strength versus SPY.
A failed hold above support would weaken the setup.
Actionable but governed by invalidation levels.
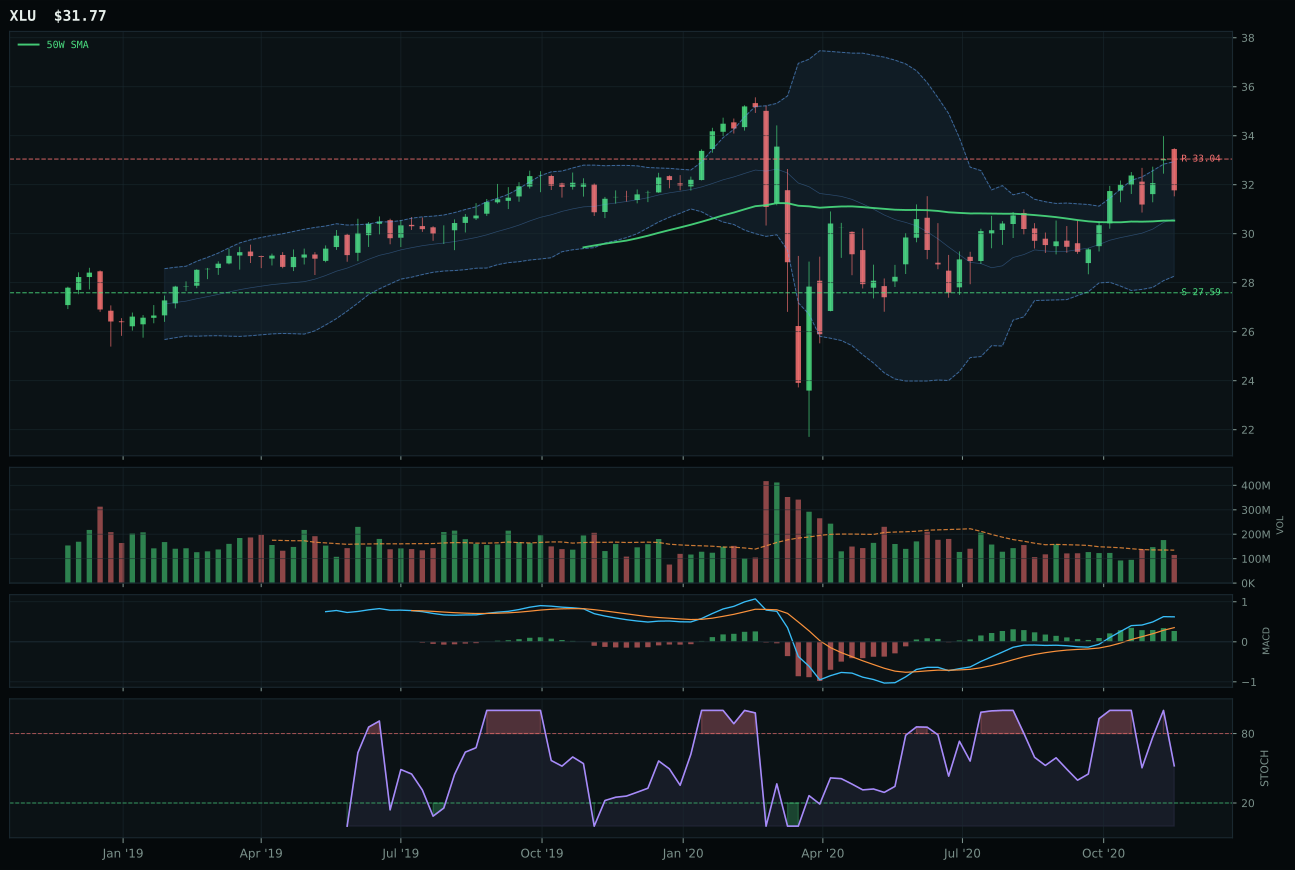
XLU has a neutral structure profile with 2.3% 13-week relative strength versus SPY.
A failed hold above support would weaken the setup.
Actionable but governed by invalidation levels.
PAVE dominates its category with a 100 technical evidence score, driven by exceptional volume-price confirmation (87.2) and persistence (90.5) across a vertical extension setup. PAVE's accumulation at 2.05x 20W average represents the strongest institutional buying signal in the portfolio; the +13.5% RS versus SPY and +9.7% category-relative strength establish domestic infrastructure as the outperforming theme within the broader utilities complex. IGF's 79 composite score is respectable—strong trend at 96, good timing at 75—but PAVE's vertical extension with heavy volume accumulation (not mere trend following) signals real capital rotation into capex and infrastructure equity. PAVE's +18.2% 13W return and +8.9% 4W return show persistence, while IGF's +8.5% 13W return suggests momentum is dispersing. Both show MACD bullish improving and overbought stochastic, but only PAVE's volume at 87 conviction level confirms the move is being institutionally accumulated.
Utilities & Infrastructure scores 71.4 and holds a 5% allocation as a secondary category despite decent technicals, primarily because macro fit registers just 58.0 and ranks below REMX, ILF, and MOO. Defensive rotation activates at 12 basis points, and the Transition/Mixed regime adds 4, but those gains are offset by -6 from inflation pressure (which favors commodities over bond proxies) and -2 from risk appetite positive (which reduces defensive demand). PAVE's 100.0 technical evidence cannot elevate a category that macro regimes penalize through competing allocations. The allocator holds PAVE as an inflation-hedge hedge—infrastructure benefits from capex spending and commodity-driven cost inflation—but sizes this at 5% rather than 10% because utilities and income plays lose priority when altseason environments favor growth and real assets. This position would expand sharply if risk appetite inverts or if inflation expectations moderate enough to support yield compression, but those scenarios are not the current regime. PAVE remains tactically sound and serves as a volatility buffer within the portfolio, yet its lack of category-level macro support limits capital commitment relative to categories like Industrial Metals or Emerging Markets.
Defense & Aerospace — XAR
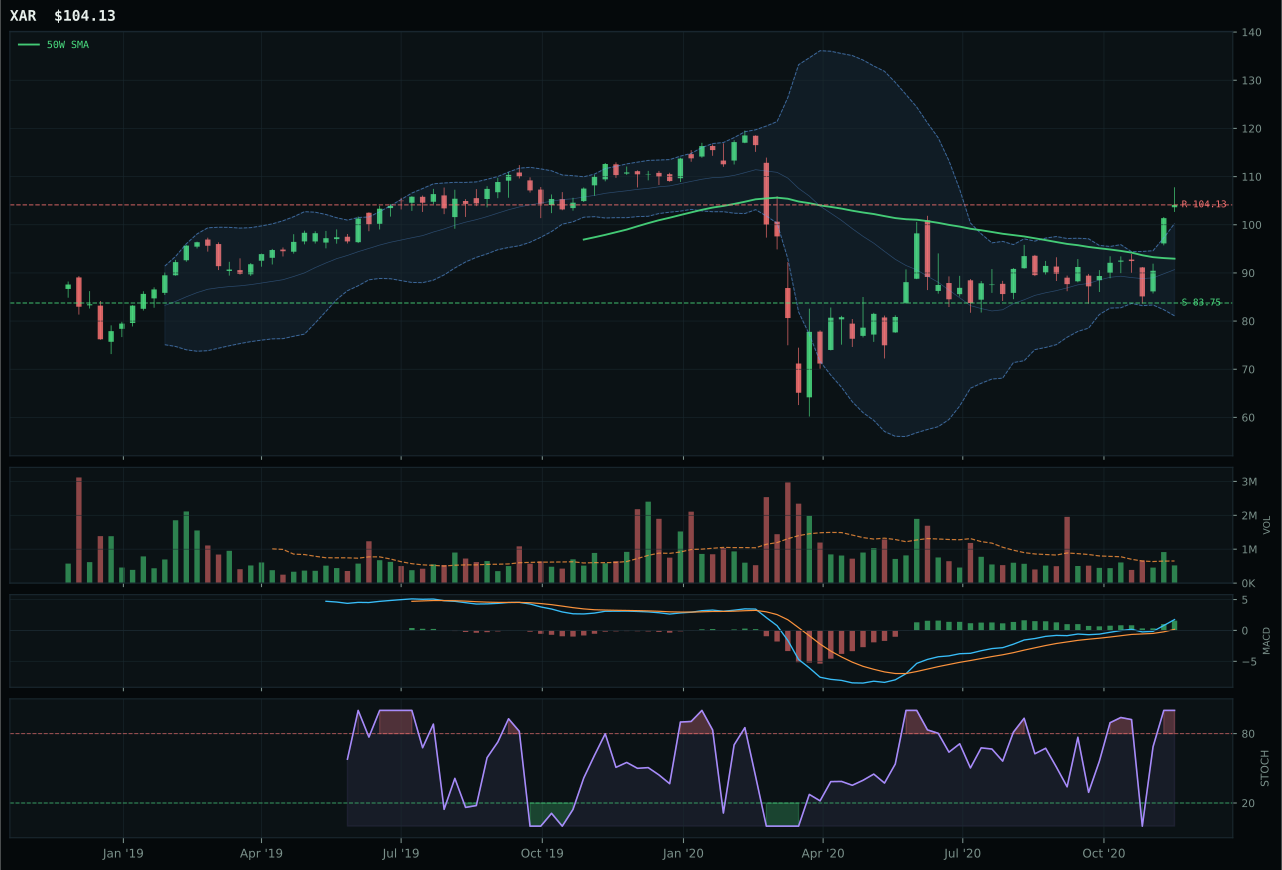
XAR has a neutral structure profile with 11.6% 13-week relative strength versus SPY.
A failed hold above support would weaken the setup.
Actionable but governed by invalidation levels.
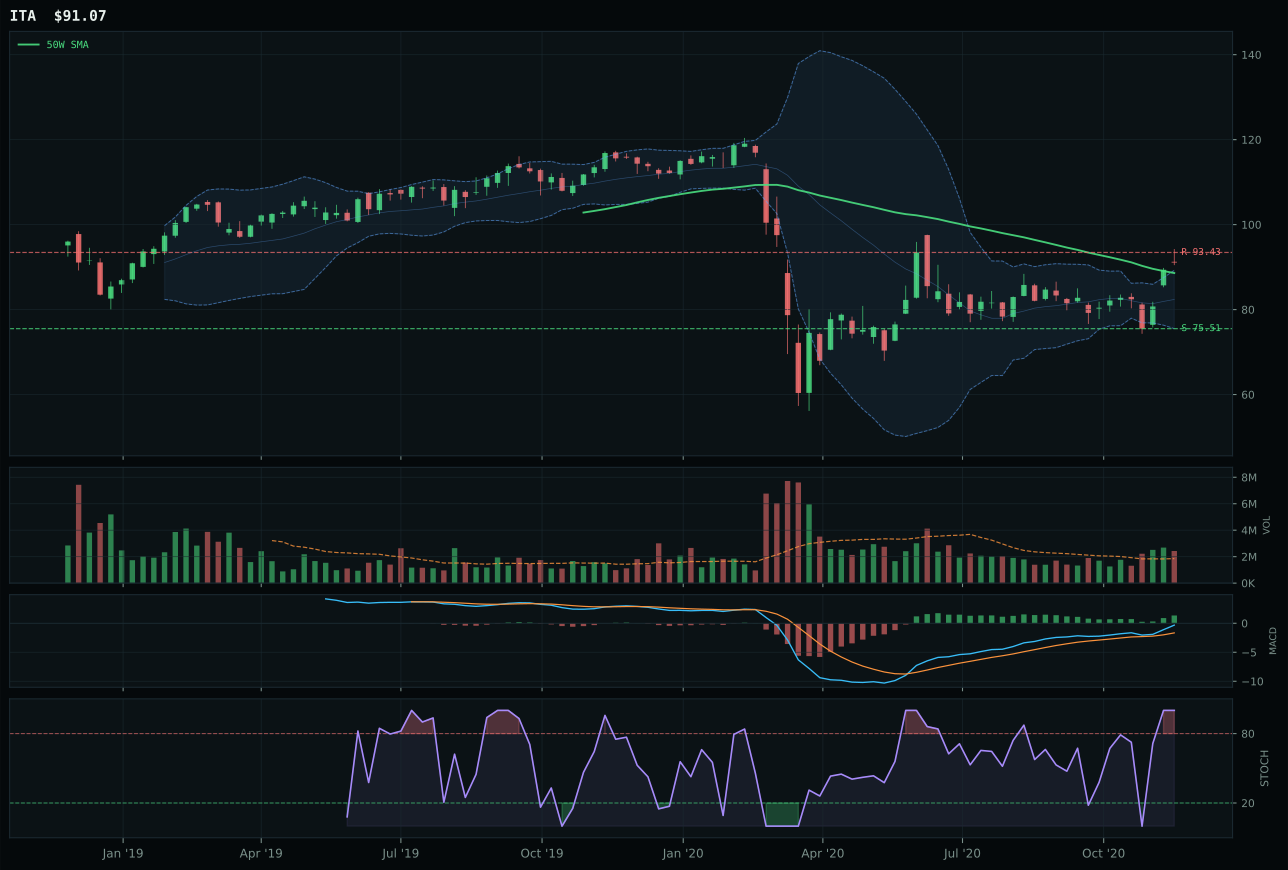
ITA has a compression near 50W profile with 6.3% 13-week relative strength versus SPY.
A failed hold above support would weaken the setup.
Actionable but governed by invalidation levels.
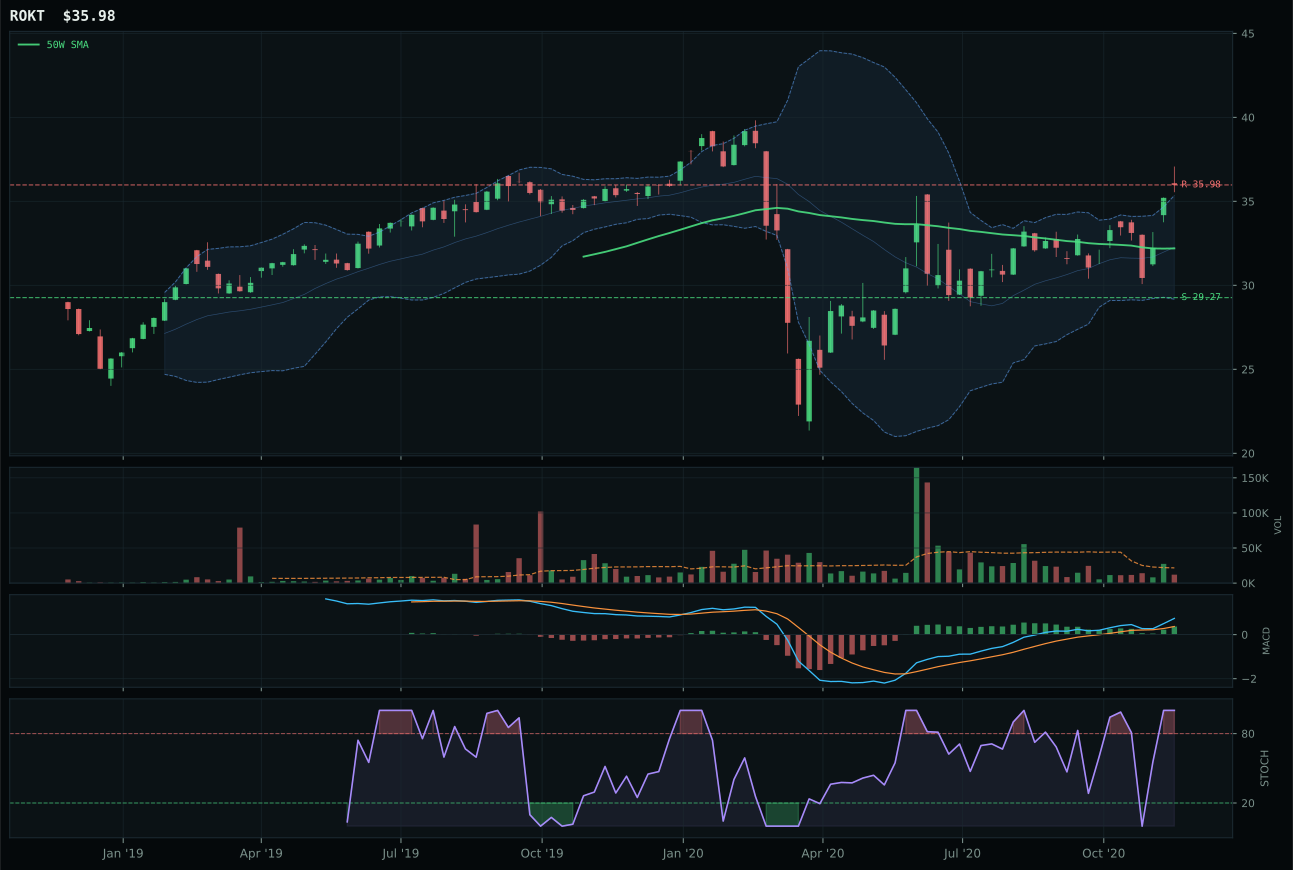
ROKT has a neutral structure profile with 7.5% 13-week relative strength versus SPY.
A failed hold above support would weaken the setup.
Tracked, but not top-2 eligible because: .
XAR defeats ITA by 2.3 points on relative strength leadership and cleaner risk/reward geometry. XAR's +11.6% RS versus SPY and +4.2% category-relative strength establish it as the true beneficiary of defensive rotation, whereas ITA's +6.3% SPY RS and -1.1% category RS reveal a me-too structure losing momentum breadth. Both are overbought at the 1.00 stochastic level, both show MACD bullish improving, but XAR sits 12% above its 50W with still-intact structure (72.7 cleanliness), while ITA compressed near the 50W and is now extended after that decision point broke. XAR's persistence score of 80.1 reflects sustained volume confirmation across the move; ITA's 75 shows volume joined late. The 51 vs 47 risk/reward split reveals XAR protects downside better—24% to support versus ITA's similar 25% suggests support is holding on XAR but potentially stalling on ITA.
Defense & Aerospace scores 66.8 and earns a 5% allocation as a secondary holding despite XAR's technical merit, primarily because category-level macro fit registers just 63.0 against stronger competitors. Defensive rotation does activate at 8 basis points, and the Transition/Mixed regime itself offers 3, but the category's macro profile lacks the broad sponsorship that propels top-two categories: no single descriptor dominates, and credit stress adds a modest 2 rather than the +8 or +10 seen in Industrial Metals or Emerging Markets. The technical evidence for XAR reaches 87.3, among the strongest in the sheet, yet that alone cannot overcome the category's rank outside the top two. The allocator holds PAVE as a more compelling infrastructure play within the broader defensive rotation, while XAR remains a quality satellite acknowledging that aerospace benefits from supply-chain discipline and defense spending persistence. XAR would surge to top-two consideration if geopolitical tensions spike or if the macro regime shifts more decisively toward defensive positioning.
AI — SMH
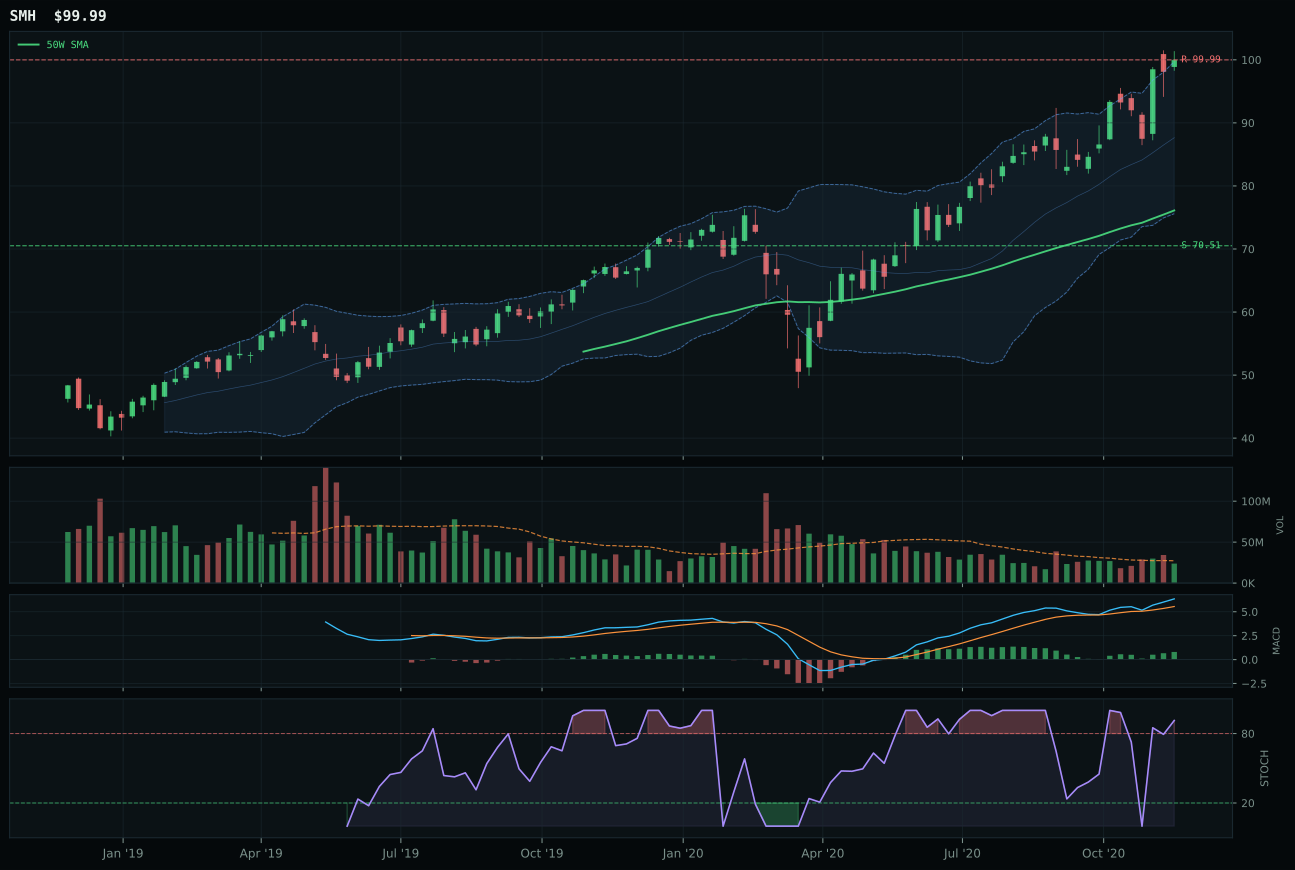
SMH has a vertical extension profile with 12.3% 13-week relative strength versus SPY.
A failed hold above support would weaken the setup.
Actionable but governed by invalidation levels.
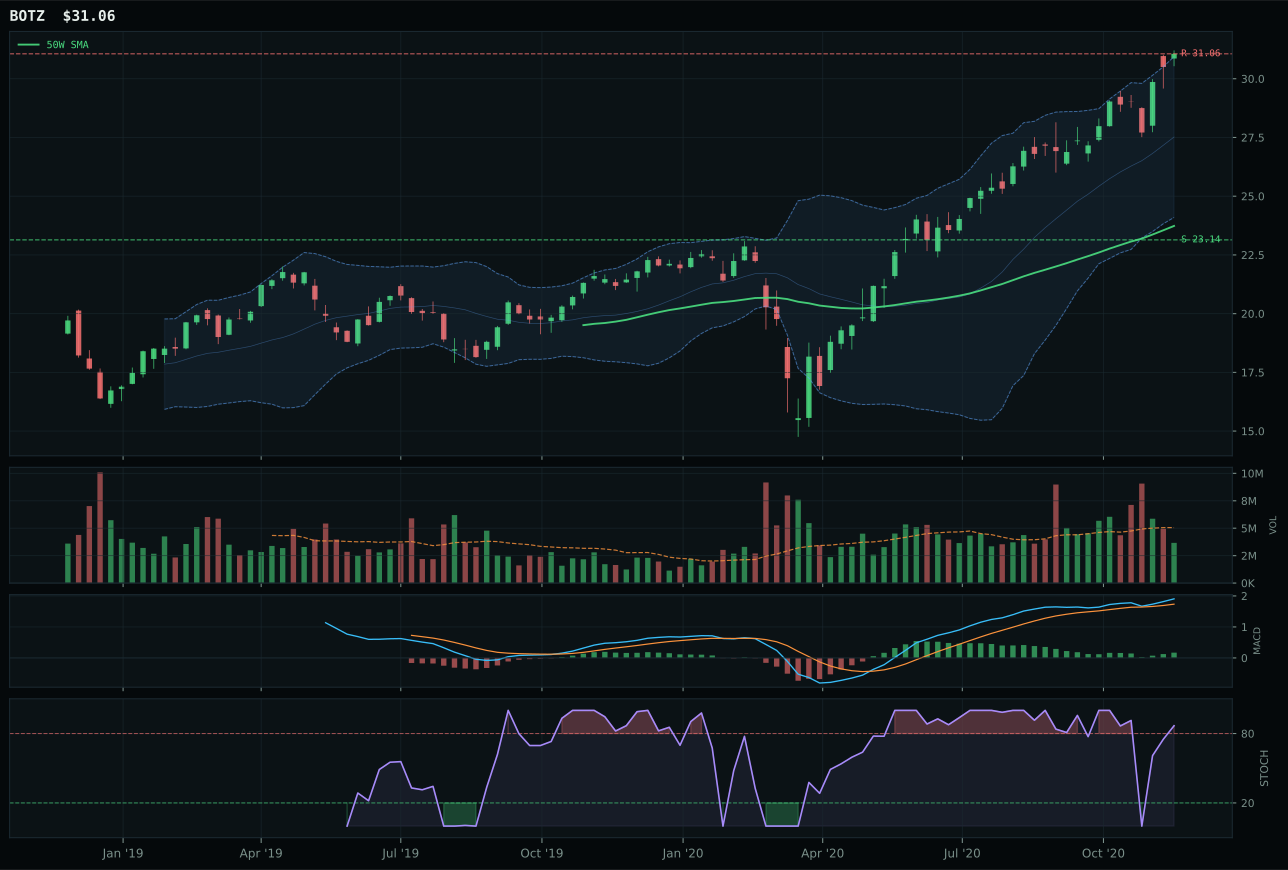
BOTZ has a vertical extension profile with 11.2% 13-week relative strength versus SPY.
A failed hold above support would weaken the setup.
Actionable but governed by invalidation levels.
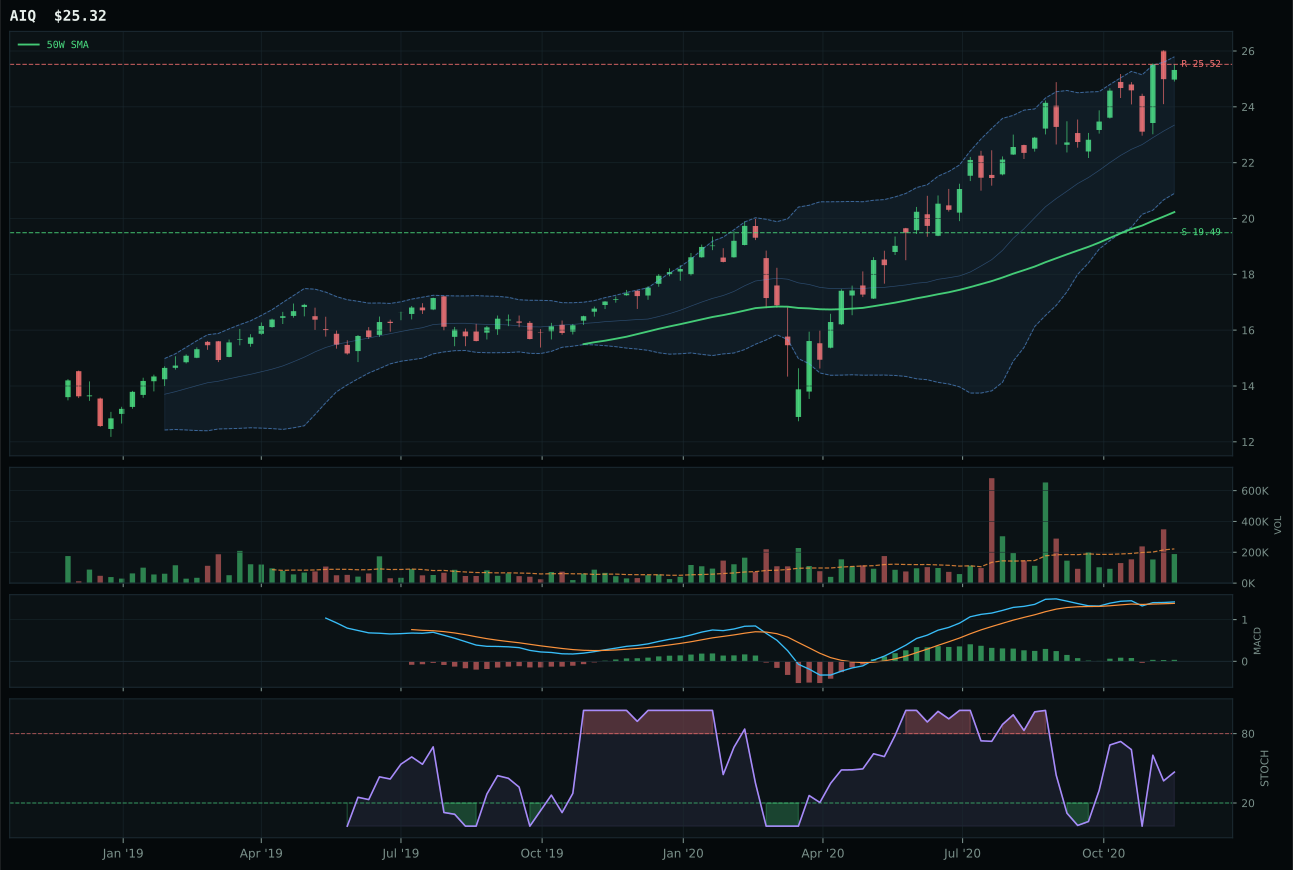
AIQ has a vertical extension profile with 5.9% 13-week relative strength versus SPY.
A failed hold above support would weaken the setup.
Tracked, but not top-2 eligible because: .
SMH wins over BOTZ despite near-identical composite scores (63 vs 64) because volume confirmation tilts the tiebreaker decisively. SMH's neutral 0.87x volume participation is cleaner than BOTZ's thin participation, and that separation widens SMH's category-relative strength (+1.1% vs 0.0%) into a signal of institutional accumulation rather than retail enthusiasm. Both are overbought at 0.91 and 0.90 stochastic RSI respectively, both show bullish improving MACD, and both sit at the 52-week high with zero upside. The 13-week return spread (17.0% vs 15.9%) is modest, but SMH's 12.3% RS versus SPY outpaces BOTZ's 11.2%—a signal that semiconductor compute, not robotics cyclicality, is where the real money is rotating as AI sponsorship deepens.
AI scores 63.5 and holds a 5% allocation despite ranking outside the top two—a decision rooted in macro tailwinds that cannot be ignored. AI growth sponsorship sits active at 14 basis points, risk appetite positive at 10, and liquidity expansion at 6, creating a +30 macro benefit that substantially outweighs the -6 from credit stress. Yet the category still ranks below REMX and ILF because its technical evidence (67.1 for SMH) cannot overcome the timing penalty: both SMH and BOTZ extend far above their 50W, converting early-entry gains into late-entry traps. The 76.0 macro fit suggests AI should rank higher, but the 62/38 technical-to-macro split means a 37.0 timing score carries real weight. The allocator holds this position sizing, recognizing that AI remains a structural growth story in an altseason environment, but the overbought setup argues against enlargement until price either consolidates near the 50W or MACD rolls over hard enough to trigger a reset.
Agriculture & Livestock — MOO
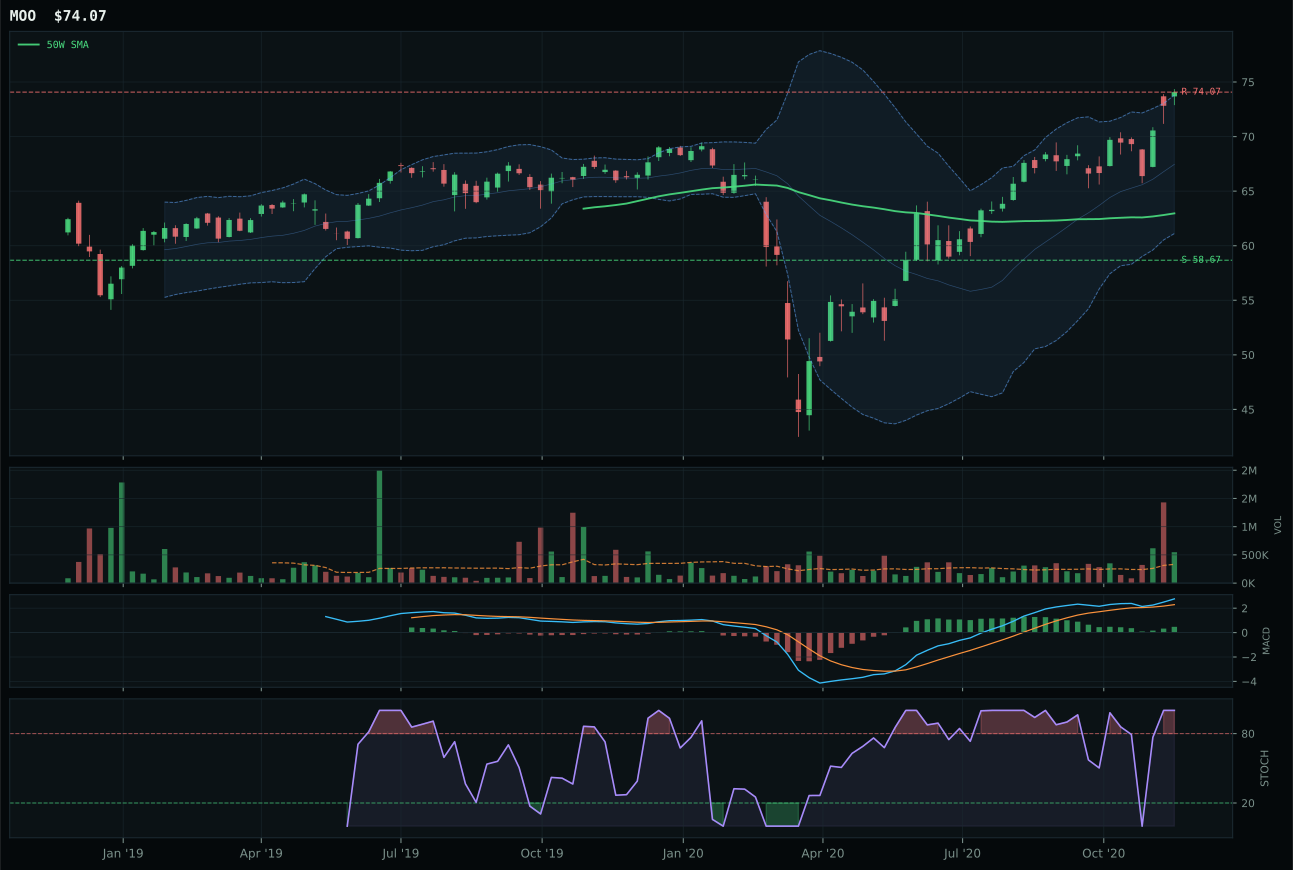
MOO has a vertical extension profile with 5.7% 13-week relative strength versus SPY.
A failed hold above support would weaken the setup.
Actionable but governed by invalidation levels.
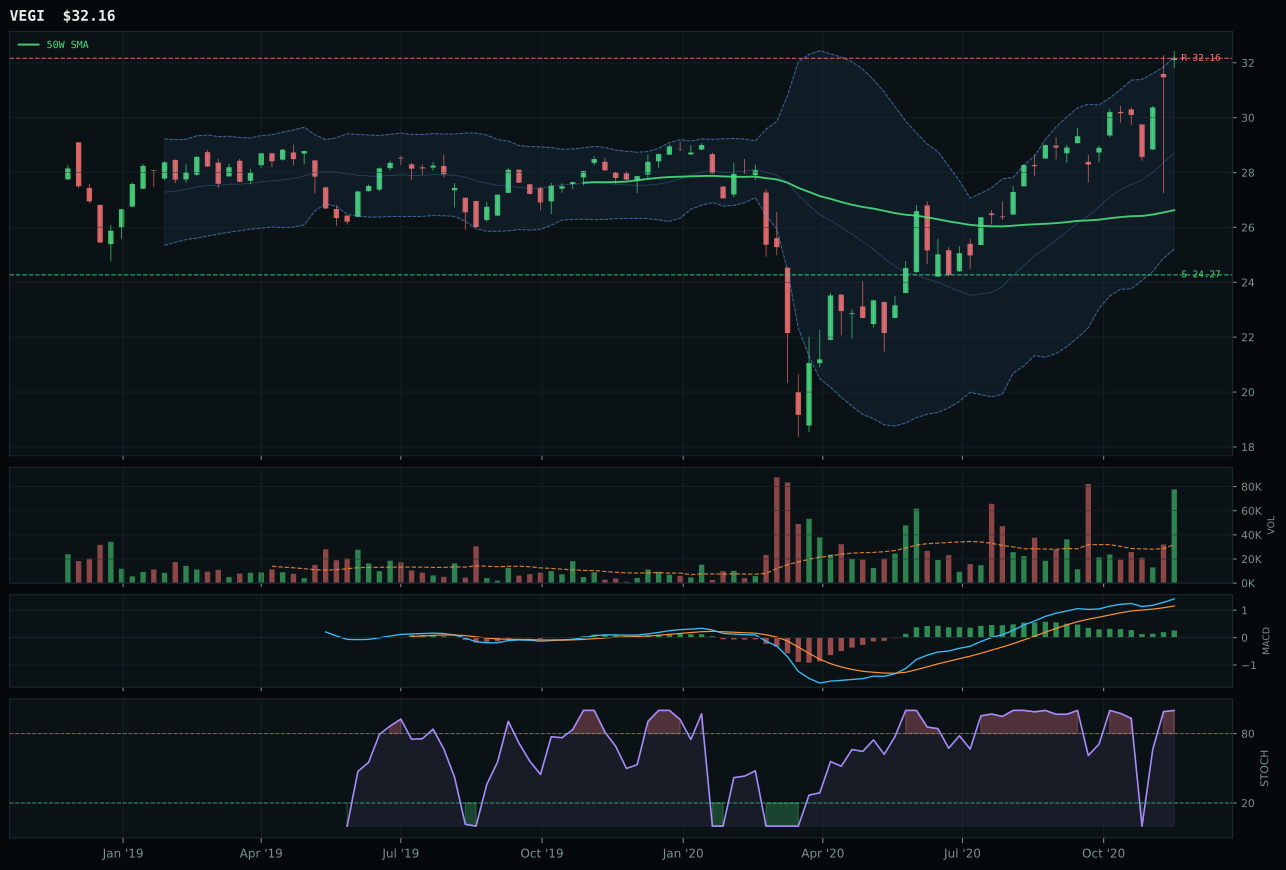
VEGI has a vertical extension profile with 9.3% 13-week relative strength versus SPY.
A failed hold above support would weaken the setup.
Tracked, but not top-2 eligible because: .
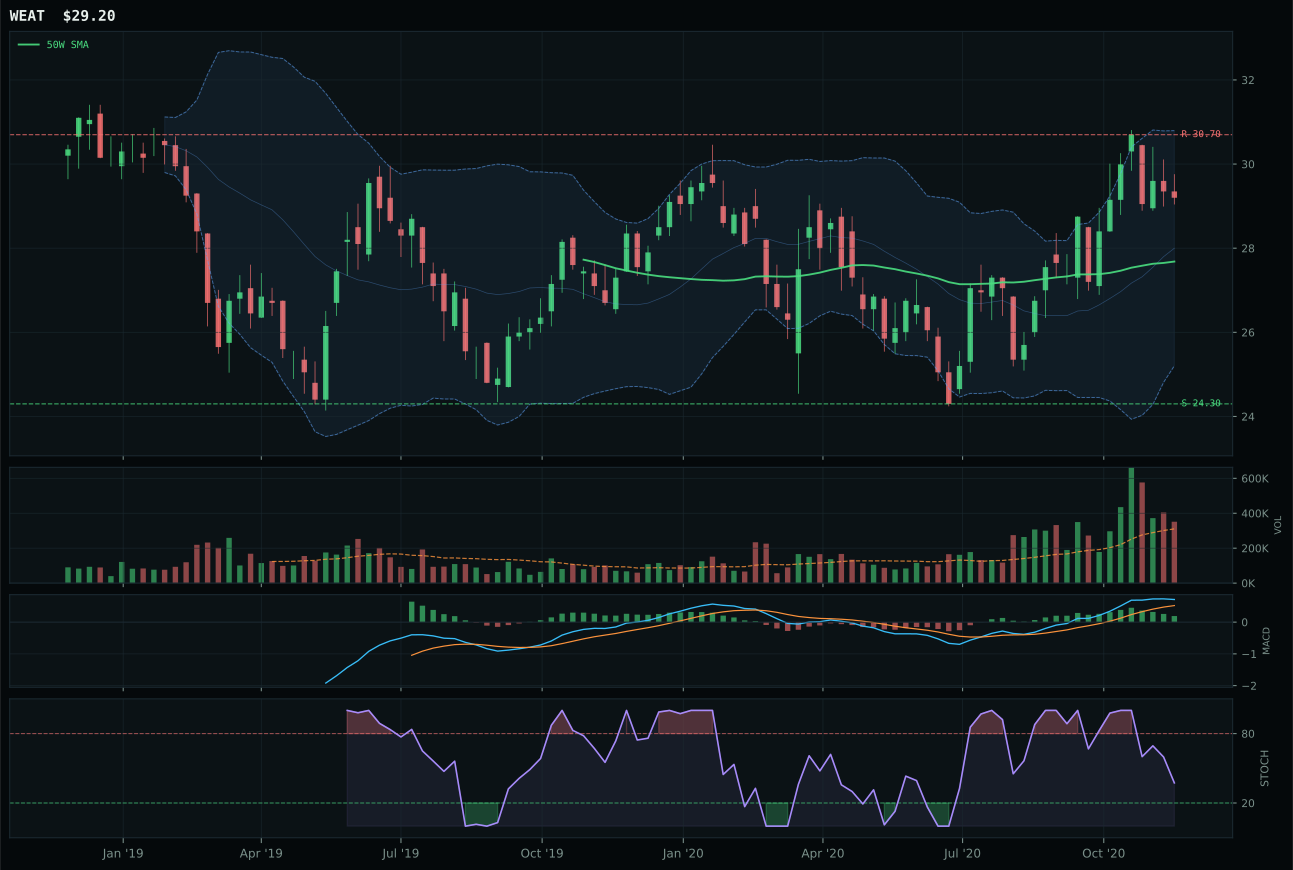
WEAT has a neutral structure profile with 4.5% 13-week relative strength versus SPY.
A failed hold above support would weaken the setup.
Tracked, but not top-2 eligible because: .
MOO crushes VEGI by 21.9 points—a decisive win that reflects pure technical dominance, not close competition. MOO's MACD is bullish and improving versus VEGI's bullish but flattening, a critical divergence that signals MOO's momentum is still broadening while VEGI's is topping. MOO's 85.5 volume-price confirmation (accumulation at 1.65x 20W) demolishes VEGI's 87 volume score that masks stalling MACD. Both are overbought at 1.00 stochastic, both sit near the 52W high, but MOO's +5.7% RS versus SPY establishes agribusiness equity leadership—farmers buying equipment and commodity exporters—versus VEGI's +9.3% RS, which paradoxically reveals VEGI is a farm-producer bet disconnected from the real demand flow. MOO's 100 momentum confirmation on +10.4% 13W return and +6.9% 4W return shows persistence; VEGI's identical 100 score masks deteriorating conviction.
Agriculture & Livestock claims 5% allocation despite scoring only 49.8—a placement driven almost entirely by macro conditions that have turned decisively favorable for commodity beta. Supply shortage sits active at 13 basis points, inflation pressure at 10, real asset sponsorship at 8, and commodity breadth positive at 5, generating +36 basis points of macro support that dwarfs the -0 from credit stress. The category-level macro fit of 86.0 is the highest on the sheet, yet the final category score sinks to 49.8 because technical evidence for the three-ETF basket averages only 45.0—MOO's 94.4 technical quality rescues what would otherwise be a sub-40 category. The tension is real: inflation trades, supply shocks, and emerging-market growth hunger are all screaming commodity exposure, yet the technical establishment in this space remains poor. MOO's volume participation justifies its slot, but the allocator sizes this at 5% rather than 10% because the macro setup alone cannot overcome frail technicals in peers like VEGI and WEAT. This position would expand dramatically if volume spreads across the entire agriculture complex and price constructs above resistance at 74.07.
Technology — CIBR
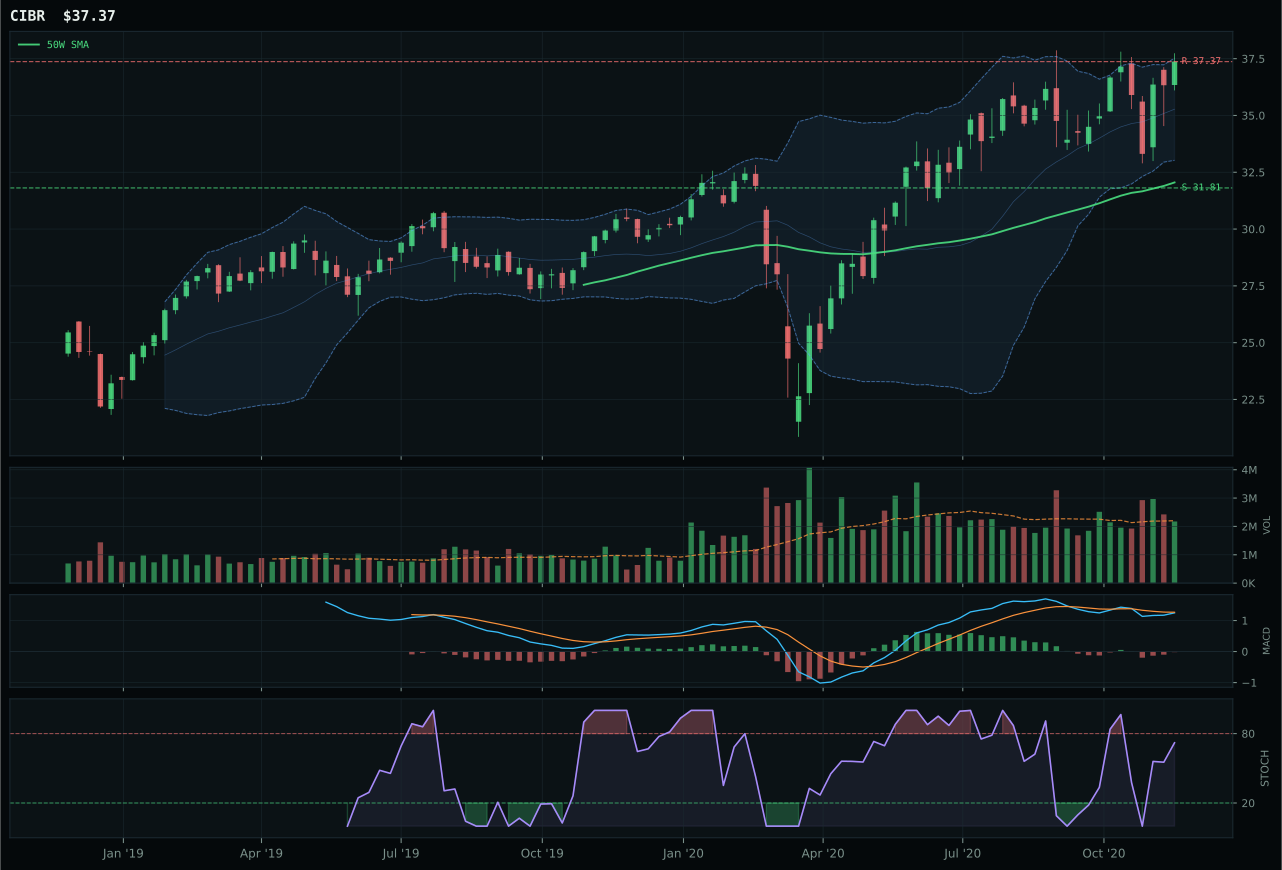
CIBR has a vertical extension profile with 1.1% 13-week relative strength versus SPY.
A failed hold above support would weaken the setup.
Actionable but governed by invalidation levels.
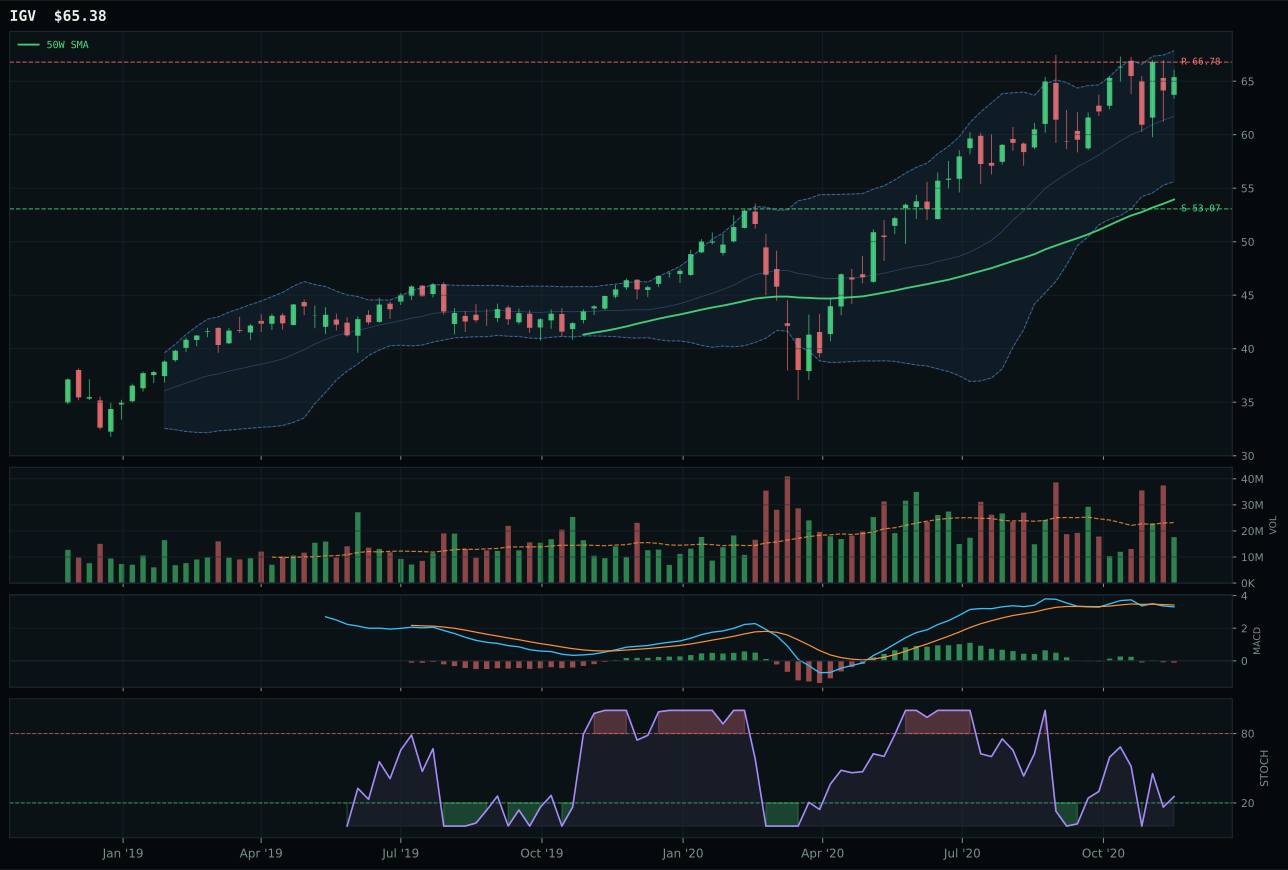
IGV has a vertical extension profile with 3.4% 13-week relative strength versus SPY.
A failed hold above support would weaken the setup.
Actionable but governed by invalidation levels.
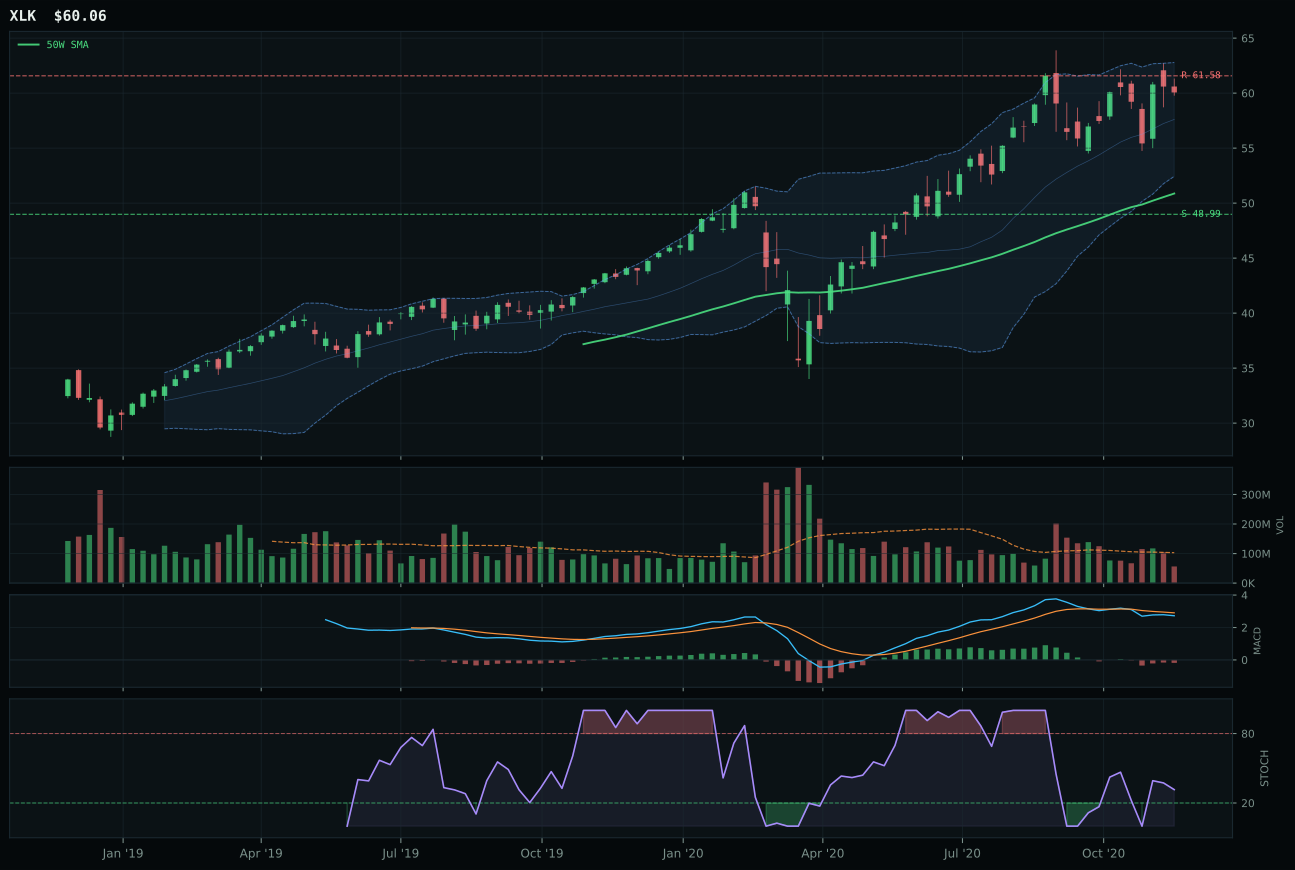
XLK has a vertical extension profile with -2.8% 13-week relative strength versus SPY.
A failed hold above support would weaken the setup.
Actionable but governed by invalidation levels.
CIBR edges out IGV by a razor-thin 0.2-point margin, but the margin masks a cleaner technical picture. Cybersecurity's +1.1% RS versus SPY gives it category leadership and neutral volume confirmation at 0.99x, whereas IGV's superior +3.4% SPY relative strength actually becomes a liability here—it signals the move is late and breadth is narrowing. CIBR's risk/reward (45.2 vs 39) favors the downside protection story in a transition regime where credit stress is active. Both setups are vertical extensions at the 52-week high, both show MACD deterioration, and both suffer from timing headwinds 16–18% above their 50-day lines. The differentiator is not momentum but structure: CIBR's 72.5 cleanliness score edges IGV's 71.5 by preserving support integrity at 31.81 even as price tests 37.37 resistance.
Technology scores 46.8 and claims a 5% allocation slot as a secondary category—not because the setup is broken but because it ranks outside the top two where real capital lives. The macro regime penalizes duration-sensitive growth: liquidity expansion does offer 9 basis points of support, but credit stress drains 7, and risk appetite's positive 9 barely offsets the -4 from inflation pressure. CIBR's cybersecurity expression and IGV's enterprise software exposure both face a crowded field where entry risk dominates reward: the category's 63.0 macro fit is respectable, yet the 62/38 technical-to-macro weighting means technical weakness alone cannot propel it higher. The allocator holds CIBR here as a satellite position recognizing that technology leadership persists in transition regimes, but the category would need either a VIX spike to spark defensive rotation into security names or a sharper liquidity expansion signal to earn a top-2 claim.
Traditional Energy — FCG
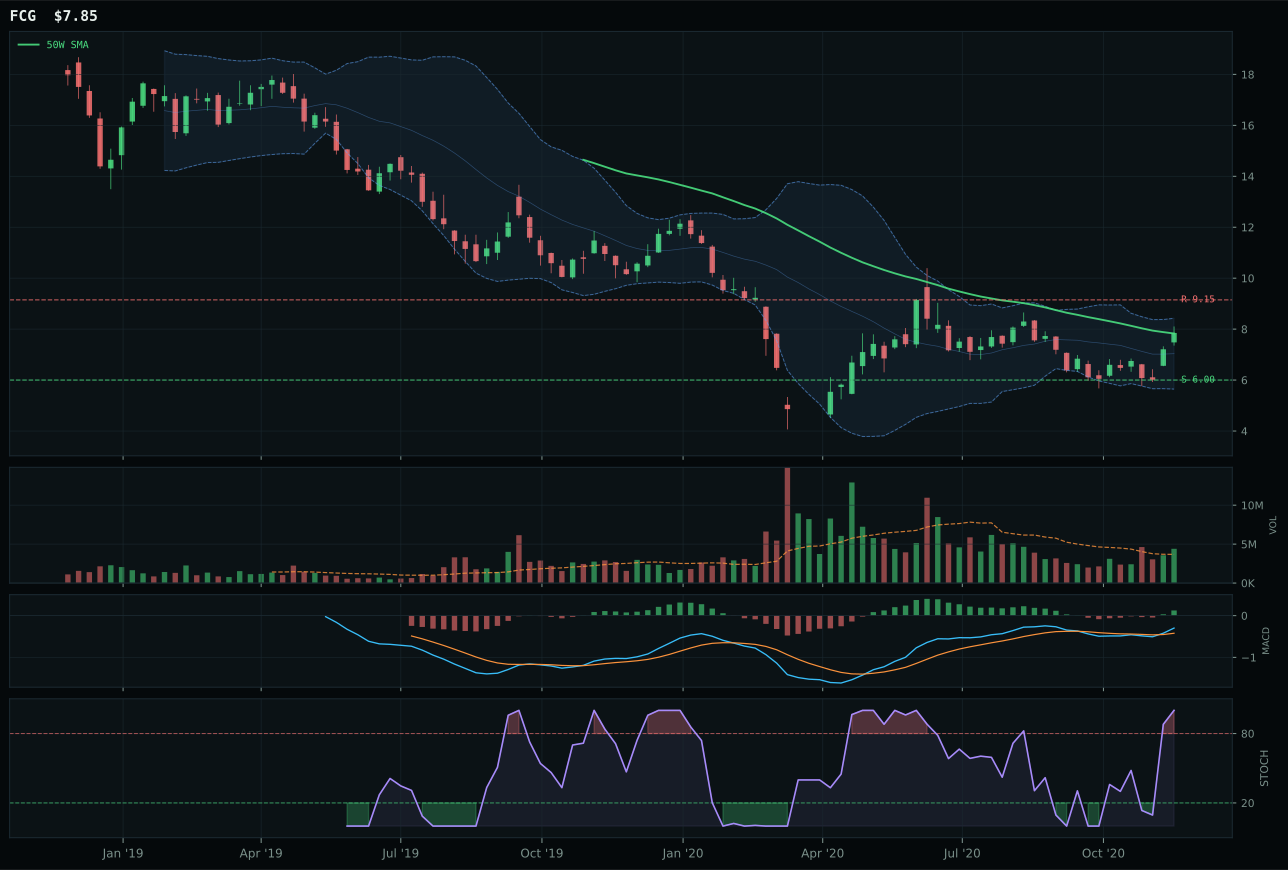
FCG has a compression near 50W profile with -0.8% 13-week relative strength versus SPY.
A failed hold above support would weaken the setup.
Actionable but governed by invalidation levels.
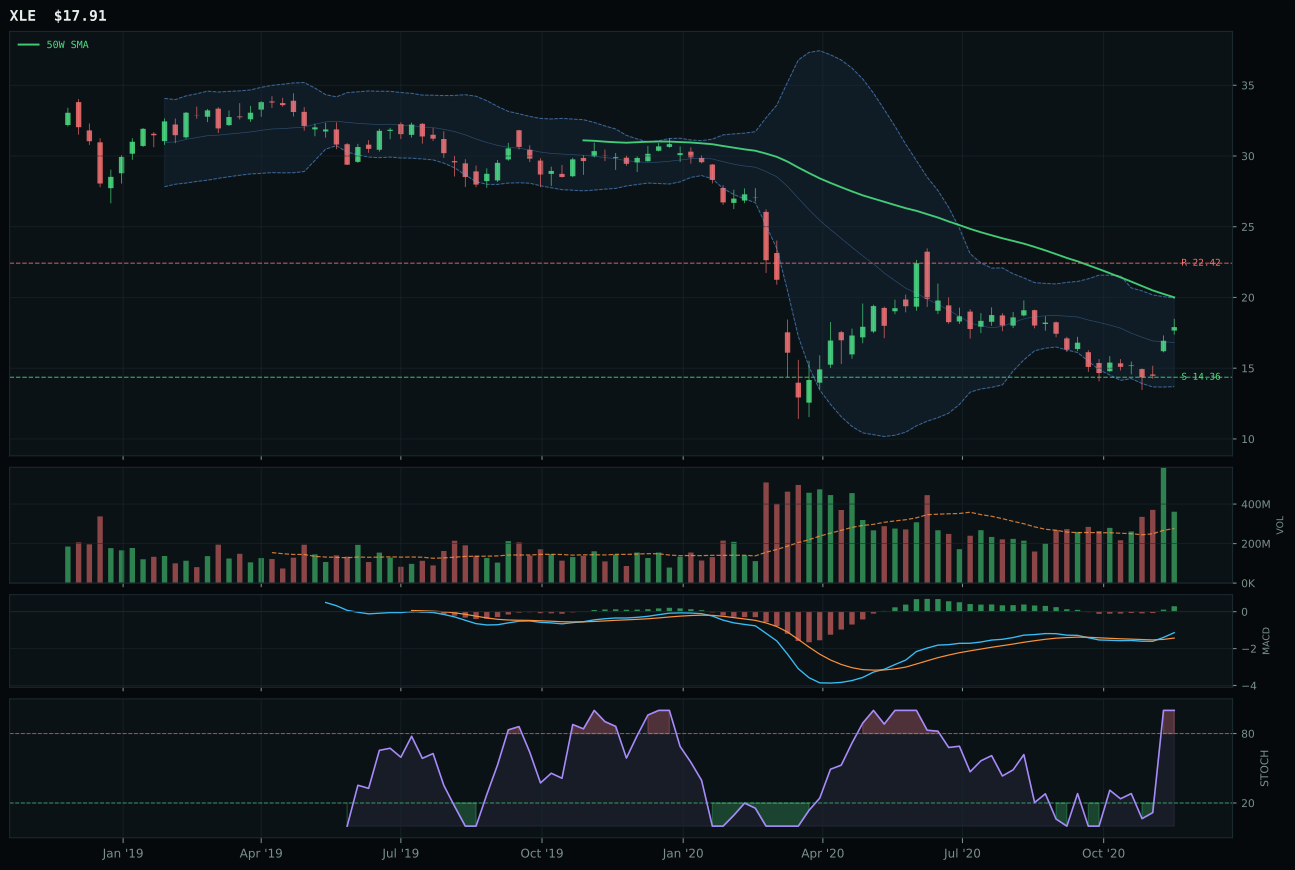
XLE has a neutral structure profile with -5.3% 13-week relative strength versus SPY.
Extension and support failure are the main tactical risks.
Tracked, but not top-2 eligible because: structurally broken.
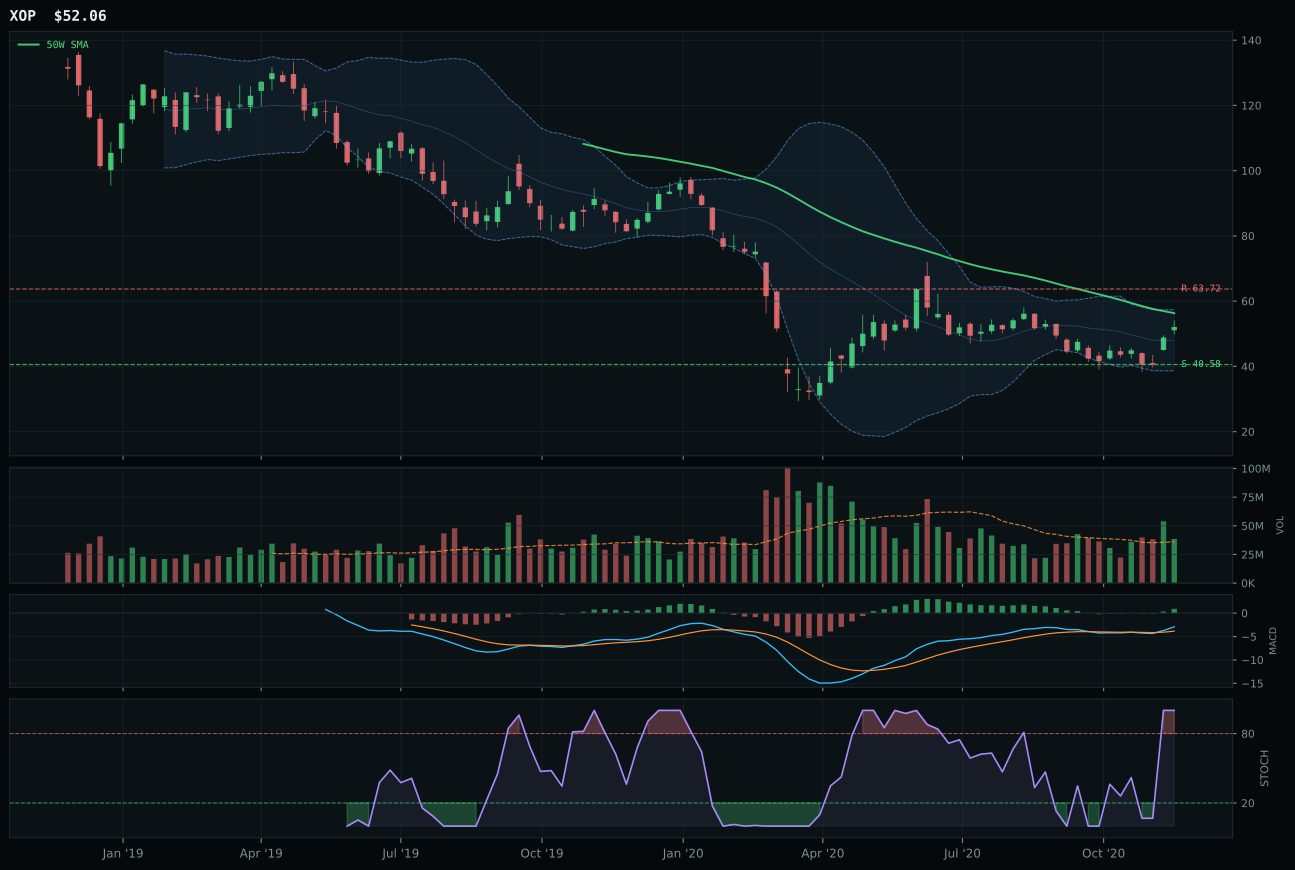
XOP has a neutral structure profile with -4.1% 13-week relative strength versus SPY.
Extension and support failure are the main tactical risks.
Tracked, but not top-2 eligible because: structurally broken.
FCG wins over XLE and XOP not by trend strength but by timing and technical setup. FCG's perfect 100 timing score reflects compression near the 50W (only 2.0% distance) with MACD bullish improving and stochastic overbought at the decision point—a coil setup ready to expand. XLE's 55 timing score reveals it sits far below key levels in a deep retracement / value zone, structurally broken (40.5 cleanliness, a red flag), and showing weak momentum confirmation (-0.6% 13W return). FCG's above-average 1.19x volume participation on a +16.3% 4W return establishes fresh institutional buying; XLE's positive macro narrative (energy scarcity +14, inflation +10, supply shortage +7) is offset by its technical failure—it cannot hold support and its -5.3% SPY RS betrays disinterest from large allocators. FCG's neutral macro fit (no specific descriptor) is actually an advantage here: the win is on technicals alone, meaning the setup is pure and uncontaminated by fading macro narrative.
Traditional Energy scores 45.5 and holds a 5% allocation despite ranking well outside the top two, a decision forced entirely by macro conditions that the regime cannot ignore. Energy scarcity sits active at 16 basis points, supply shortage at 9, inflation pressure at 10, and real asset sponsorship at 7—a +42 macro tailwind that temporarily overrides a technical evidence score of only 84.2 for FCG and near-catastrophic readings for XLE and XOP. The category macro fit reaches 85.0, matching Agriculture for the highest on the sheet, yet the final category score sinks to 45.5 because FCG's 79.7 reasoned score cannot lift a three-name average where energy majors have deteriorated. The allocator positions this as a tactical, macro-driven sleeve: supply-side tightness is real, but refiners and exploration companies have lost the institutional confidence that once underpinned energy allocations. FCG gets 5% on the theory that natural gas volatility creates trading opportunities, but the sector would need either a structural production shock or a multi-quarter rally above $9.00 resistance to justify enlargement. If oil prices roll over or if equities enter risk-off, energy would plummet below Agriculture and Metals despite the favorable macro backdrop.
Precious Metals — GLD
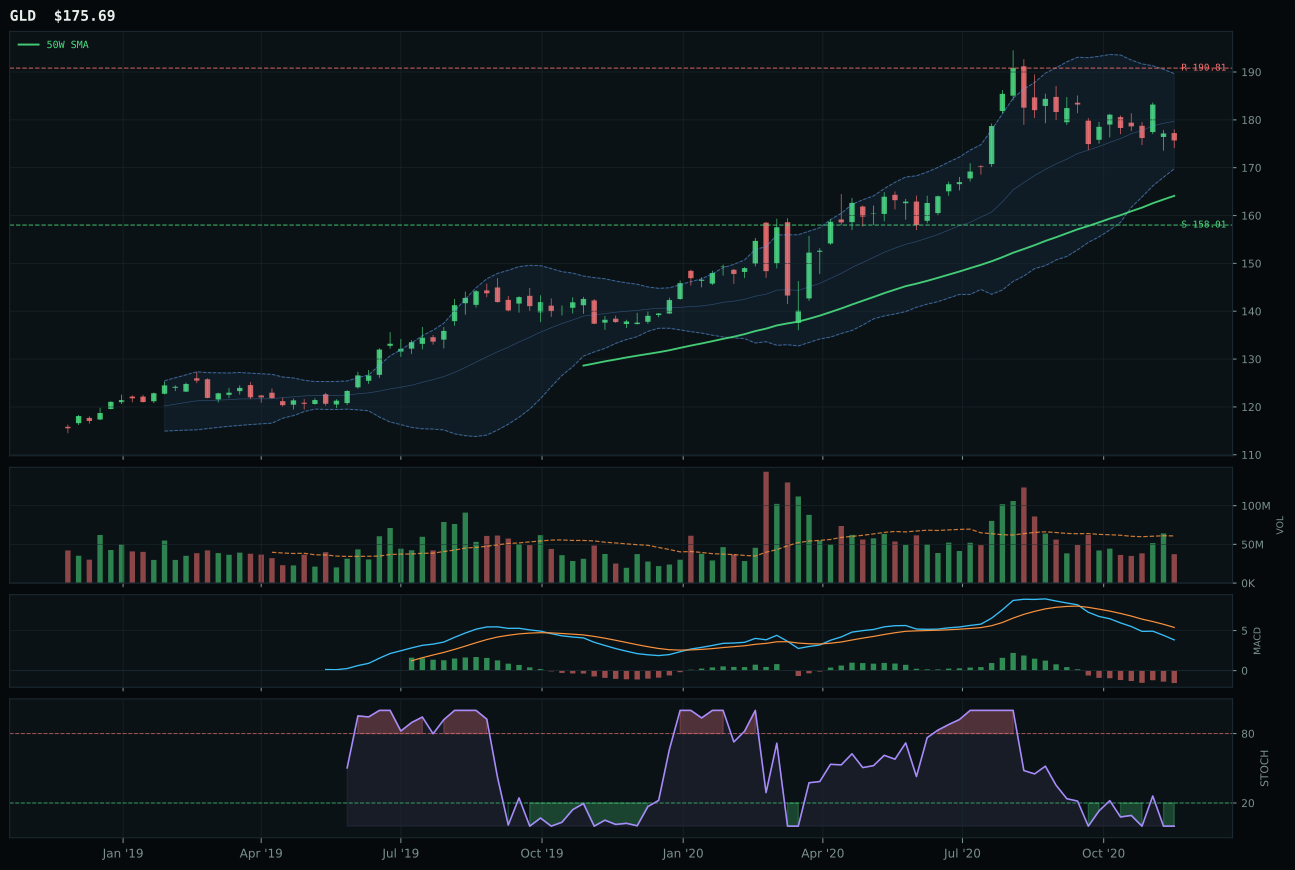
GLD has a neutral structure profile with -8.2% 13-week relative strength versus SPY.
A failed hold above support would weaken the setup.
Actionable but governed by invalidation levels.
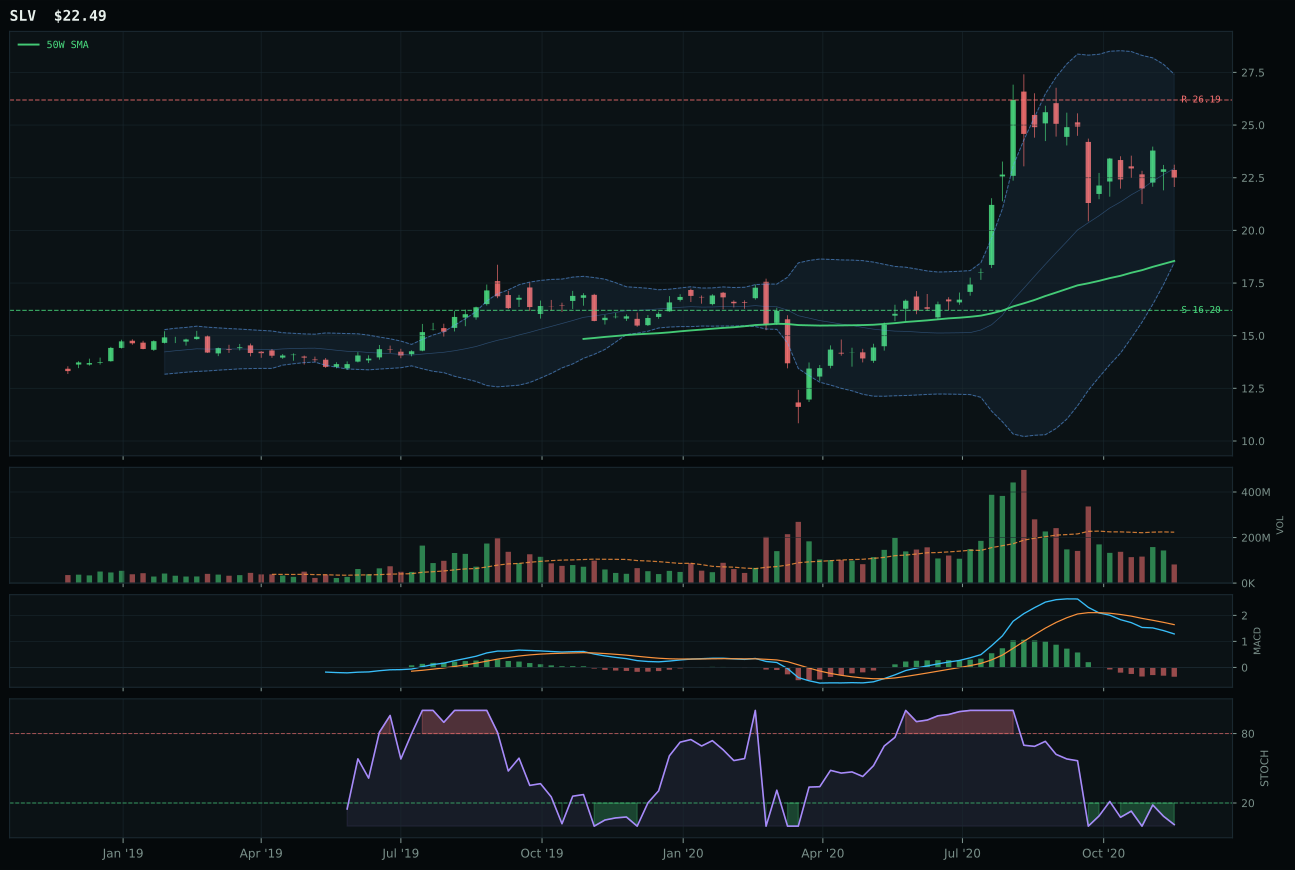
SLV has a vertical extension profile with -14.3% 13-week relative strength versus SPY.
A failed hold above support would weaken the setup.
Actionable but governed by invalidation levels.
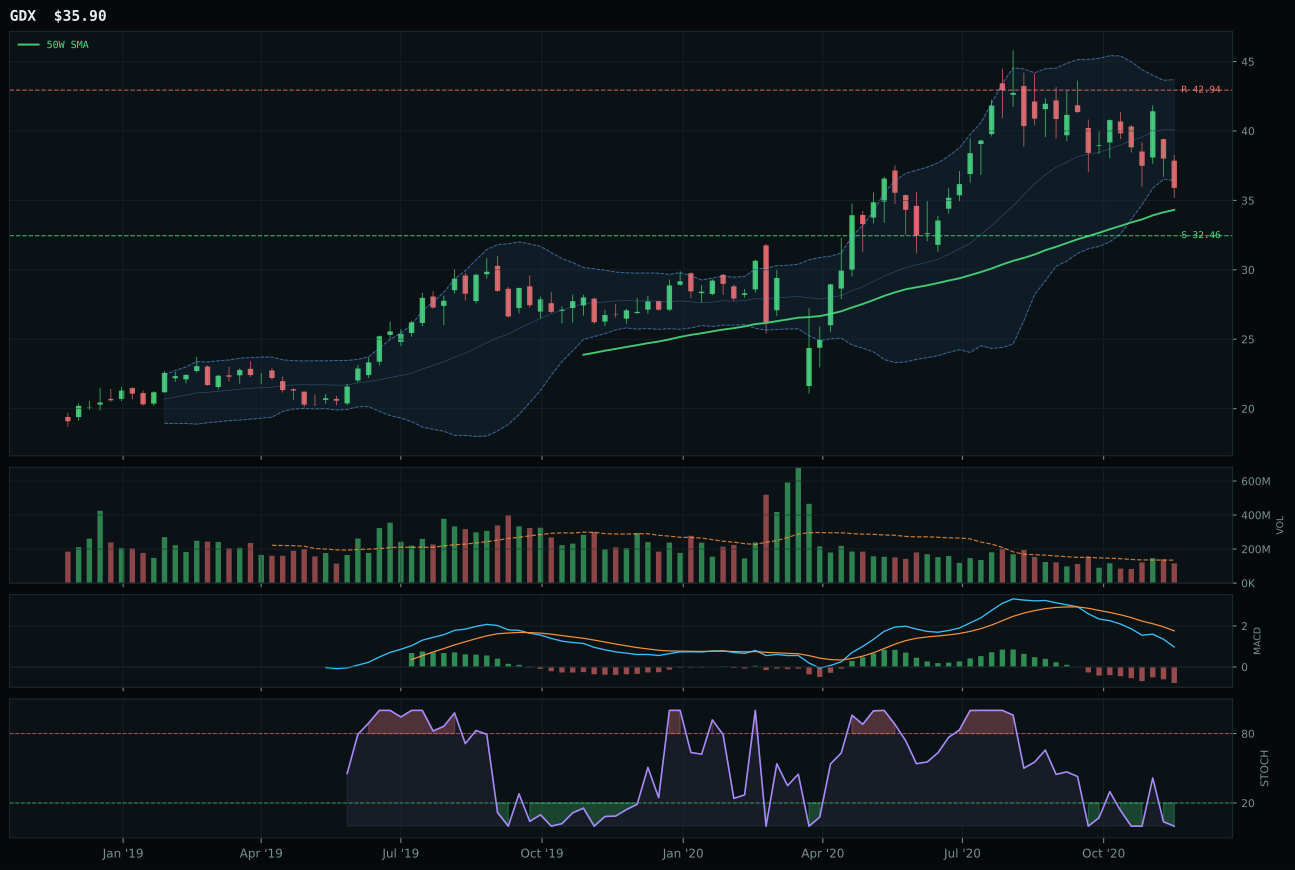
GDX has a neutral structure profile with -16.9% 13-week relative strength versus SPY.
A failed hold above support would weaken the setup.
Actionable but governed by invalidation levels.
GLD wins the precious-metals category decisively over SLV by 16.7 points, but this is a pyrrhic victory—GLD's best is weak. GLD's timing score of 70 (only 7.1% above the 50W, MACD weakening but still positioned favorably in the upper retracement zone) beats SLV's 62 (stretched 21.2% above the 50W, a punitive extension). More critically, GLD's +6.2% category-relative strength outpaces SLV's 0.0%, and GLD's 57.8 risk/reward (upside -7.9%, downside +11.2%) frames this as a defensive core holding rather than a growth bet. SLV's MACD is oversold-turning-up versus GLD's bearish-weakening—a reversal signal that normally favors SLV, but SLV's -14.3% SPY RS and thin volume participation (0.61x) betray institutional disinterest. Both are losing money on 13W returns (GLD -3.5%, SLV -9.7%), but GLD's structure at 70.5 cleanliness preserves the hedge function.
Precious Metals scores 39.3 and receives 0% allocation, placing it 9th or 10th depending on how the bottom tier resolves. The macro regime has turned sharply against defensive hedges: risk appetite positive delivers -4 basis points (negative, not positive), liquidity expansion nets -2, and while defensive rotation adds 6, that does not overcome the crowded field of better risk-reward categories. At 51.0 macro fit, this category lacks the structural support that allows weak technicals to find a home elsewhere—neither inflation, supply shortage, nor credit stress is active enough to sustain a safe-haven bid. GLD's technical evidence reaches only 38.7, and SLV's 17.2 is catastrophic, leaving the entire basket averaging below 35 in technical quality. The volatility spike required to lift this category into allocation territory is possible but not probable in an altseason environment where risk appetite remains broadly positive and equity correlations are loosening. An immediate reversal to risk-off, VIX above 25, or a credit shock would force gold back onto the board within a week, but until one of those emerges, the capital allocated to REMX or MOO earns better risk-adjusted returns.
Nuclear Energy — NLR
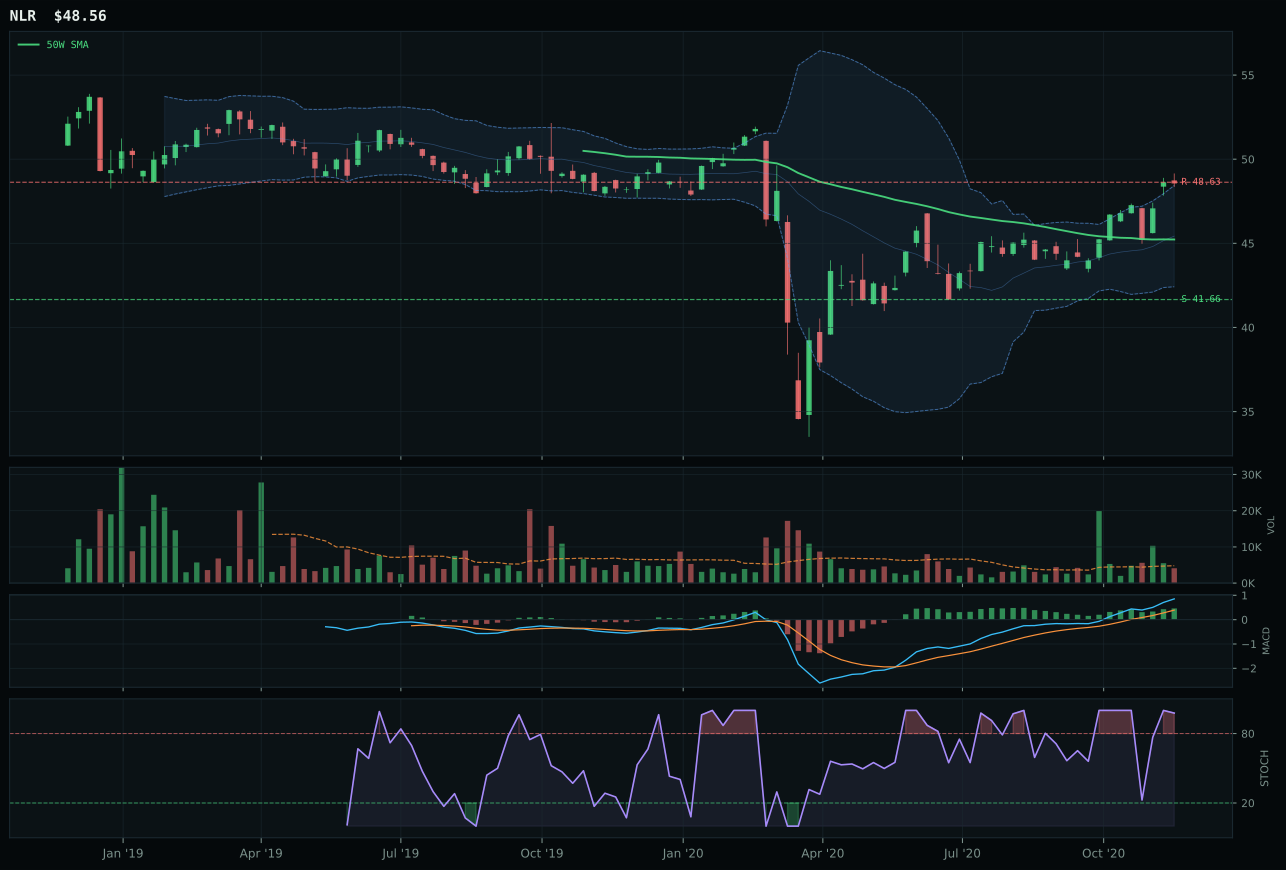
NLR has a neutral structure profile with 5.6% 13-week relative strength versus SPY.
A failed hold above support would weaken the setup.
Tracked, but not top-2 eligible because: .
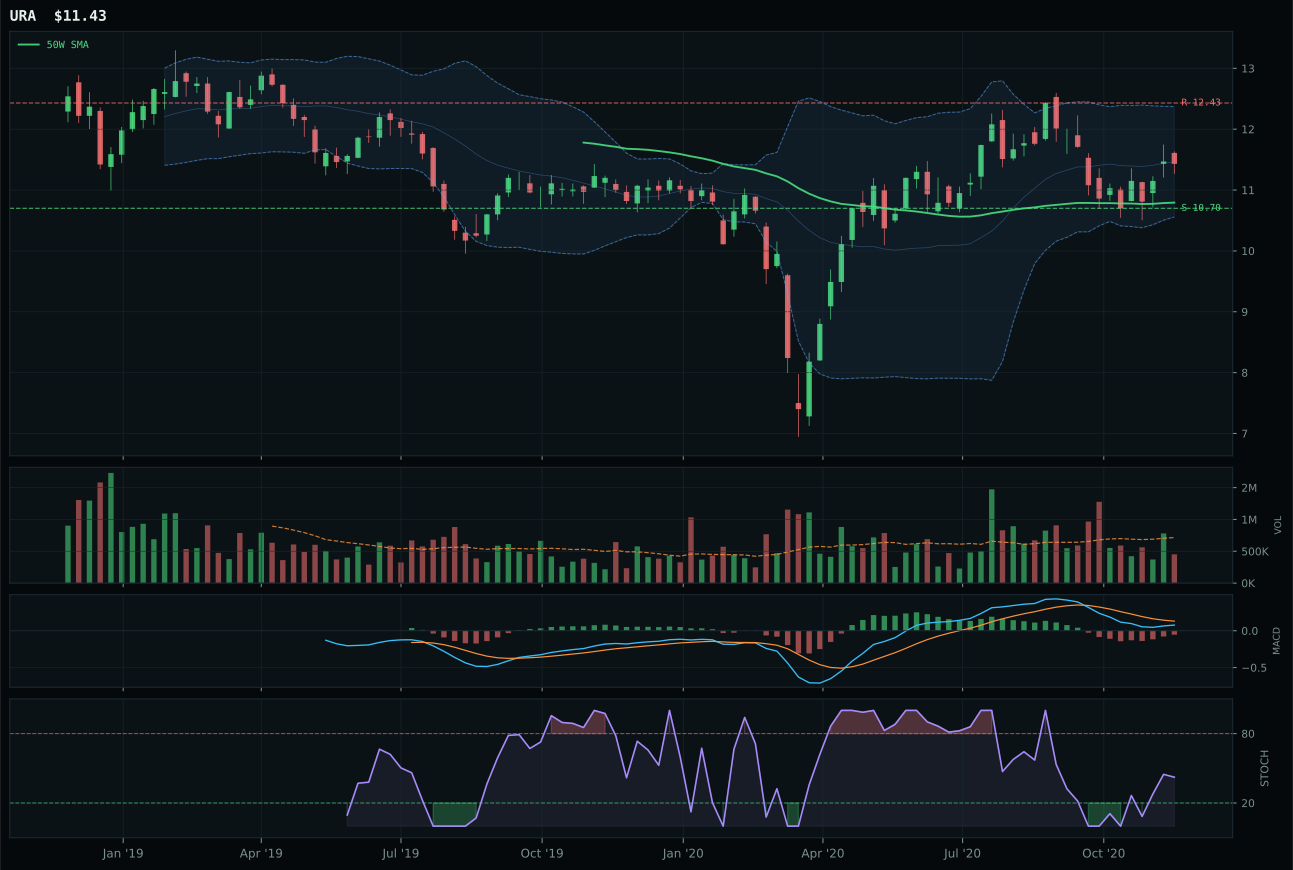
URA has a neutral structure profile with -7.5% 13-week relative strength versus SPY.
A failed hold above support would weaken the setup.
Tracked, but not top-2 eligible because: .

URNM has a neutral structure profile with -15.2% 13-week relative strength versus SPY.
A failed hold above support would weaken the setup.
Tracked, but not top-2 eligible because: .
NLR wins the nuclear category on category-relative strength (+13.1%) and superior structure (75.7) despite three-way technical parity among NLR, URA, and URNM in the reasoning layer. NLR's +5.6% RS versus SPY (positive but modest) is validated by persistence: +10.3% 13W return, +2.7% 4W return, and bullish improving MACD all confirm the move is genuine. URA's -7.5% SPY RS and MACD bearish-but-improving (a much weaker setup than bullish improving) create divergence—price is moving but without conviction. URA's structure at 64.0 is measurably dirtier than NLR's 75.7, and URA's thin 0.85x volume participation signals retail interest, not institutions. NLR's 75.0 timing score reflects the upper retracement zone (near Fib 0.236), which is ideal risk/reward territory; URA sits in the same zone but with deteriorating technical signatures.
Nuclear Energy scores 33.8 and receives 0% allocation due to eligibility failure, likely ranking 9th or 10th depending on Precious Metals' final standing. While NLR's technical evidence reaches 45.0 and the category benefits from active energy scarcity (9 basis points), AI growth sponsorship (5), and real asset sponsorship (7), the category-level macro fit stalls at 69.0—insufficient to overcome weaker technicals in a portfolio where other categories rank decisively higher. The reasoned ETF proof order showed a three-way tie at 45.0 (URNM, URA, NLR), meaning NLR's category win carries no narrative momentum. Crypto/altseason regimes typically sideline defensive energy plays in favor of growth and real-asset inflation stories, and Nuclear Energy lacks the broad institutional sponsorship necessary to compete. An immediate jump to top-two would require either a hard credit event that triggers risk-off rotation toward utilities or a dramatic acceleration in AI power-demand forecasts that elevates nuclear as critical infrastructure. Until one of those emerges, this category sits on the bench. If the regime shifts to defensive rotation over the next 4-6 weeks, NLR could quickly earn 5% as a secondary holding.