
2020-11-13
Informational purposes only. The content in this report, including allocations, analysis, and commentary, is provided solely for informational and educational purposes. It does not constitute financial advice, investment advice, trading advice, or any other type of advice. Past performance does not guarantee future results. Always conduct your own research and consult a qualified financial professional before making investment decisions.
Some tracked tickers were excluded due to missing live weekly price data: SGOV: Historical cache SGOV has only 24 usable weekly bars
Weekly Allocation
| Ticker | Category | Weight | Role |
|---|---|---|---|
| FSOL | 50% | Overlay | |
| IGF | Utilities & Infrastructure | 10% | Top-2 (10%) |
| ILF | Emerging Markets | 10% | Top-2 (10%) |
| REMX | Industrial Metals | 5% | Tier-2 (5%) |
| SMH | AI | 5% | Tier-2 (5%) |
| XAR | Defense & Aerospace | 5% | Tier-2 (5%) |
| XLK | Technology | 5% | Tier-2 (5%) |
| XLE | Traditional Energy | 5% | Tier-2 (5%) |
| MOO | Agriculture & Livestock | 5% | Tier-2 (5%) |
Trade Instructions — Monday Open
Sell the tranche from 2020-10-16 (completing its 4-week hold). Buy the new tranche. Instructions show net portfolio changes — same-asset positions cancel, weight changes show the delta.
| Action | Ticker | Instruction |
|---|---|---|
| SELL | IGV | Sell 50% of IGV position (reduce 5.00% → 2.50%) |
| SELL | SMH | Sell 14% of SMH position (reduce 8.75% → 7.50%) |
| SELL | COPX | Sell 20% of COPX position (reduce 6.25% → 5.00%) |
| SELL | INDA | Sell entire INDA position (1.25% of portfolio) |
| SELL | XLU | Sell 33% of XLU position (reduce 3.75% → 2.50%) |
| SELL | GLD | Sell 50% of GLD position (reduce 2.50% → 1.25%) |
| BUY | XLE | Buy XLE — 14.29% of freed cash (adds 1.25% to portfolio) |
| BUY | REMX | Buy REMX — 14.29% of freed cash (adds 1.25% to portfolio) |
| BUY | XLK | Buy XLK — 14.29% of freed cash (adds 1.25% to portfolio) |
| BUY | IGF | Buy IGF — 28.57% of freed cash (adds 2.50% to portfolio) |
| BUY | ILF | Buy ILF — 28.57% of freed cash (adds 2.50% to portfolio) |
Current Portfolio After Trade
Combined holdings across all 4 active tranches. Each tranche is 25% of the portfolio.
| Ticker | % of Portfolio | Weight Bar |
|---|---|---|
| FSOL | 50.00% | |
| SMH | 7.50% | |
| COPX | 5.00% | |
| MOO | 5.00% | |
| XAR | 5.00% | |
| IEMG | 5.00% | |
| REMX | 3.75% | |
| XLU | 2.50% | |
| IGV | 2.50% | |
| XLE | 2.50% | |
| XLK | 2.50% | |
| IGF | 2.50% | |
| ILF | 2.50% | |
| GLD | 1.25% | |
| PAVE | 1.25% | |
| SLV | 1.25% |
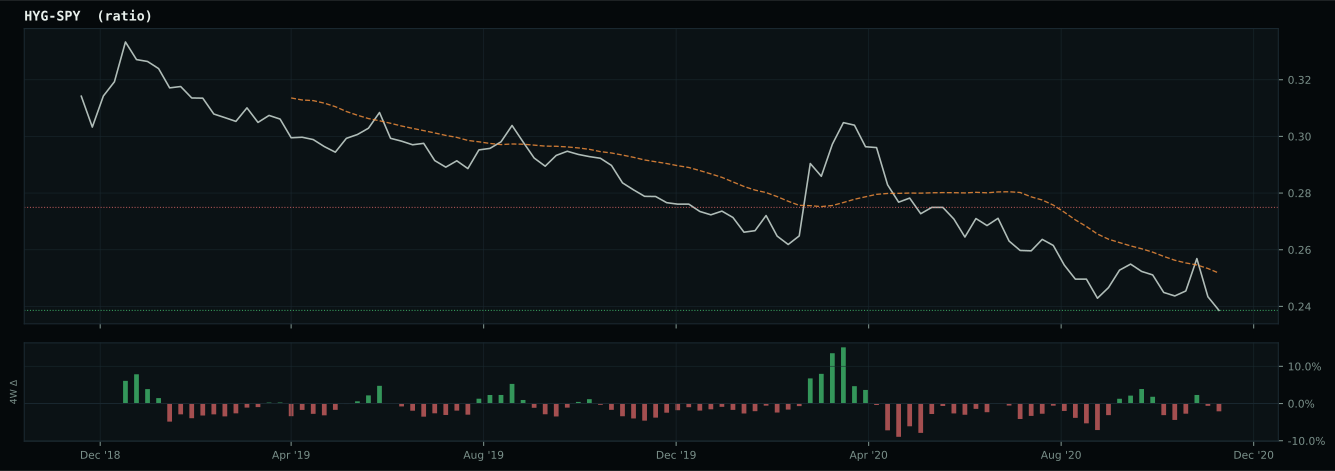
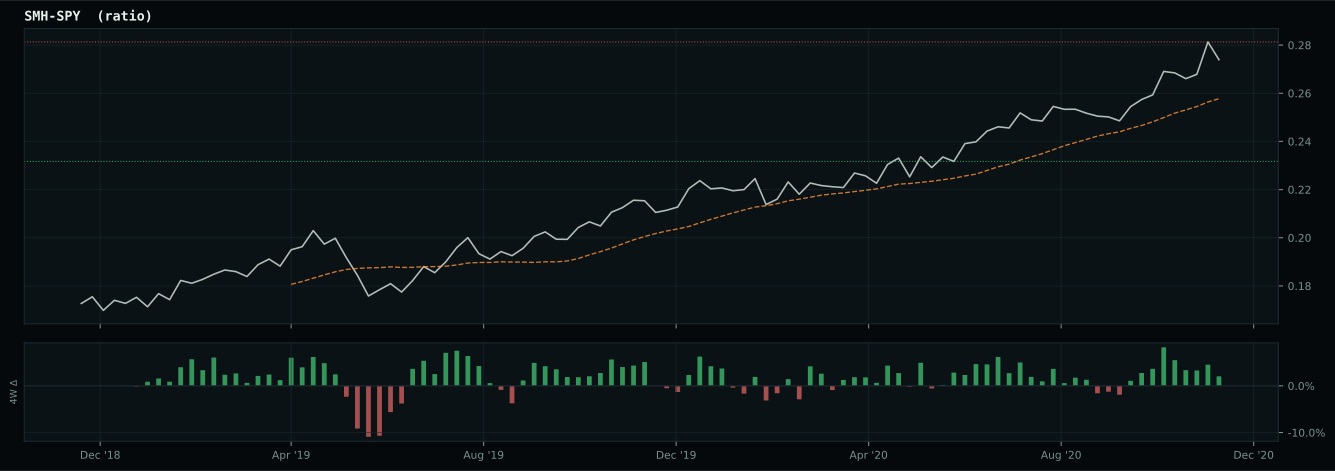
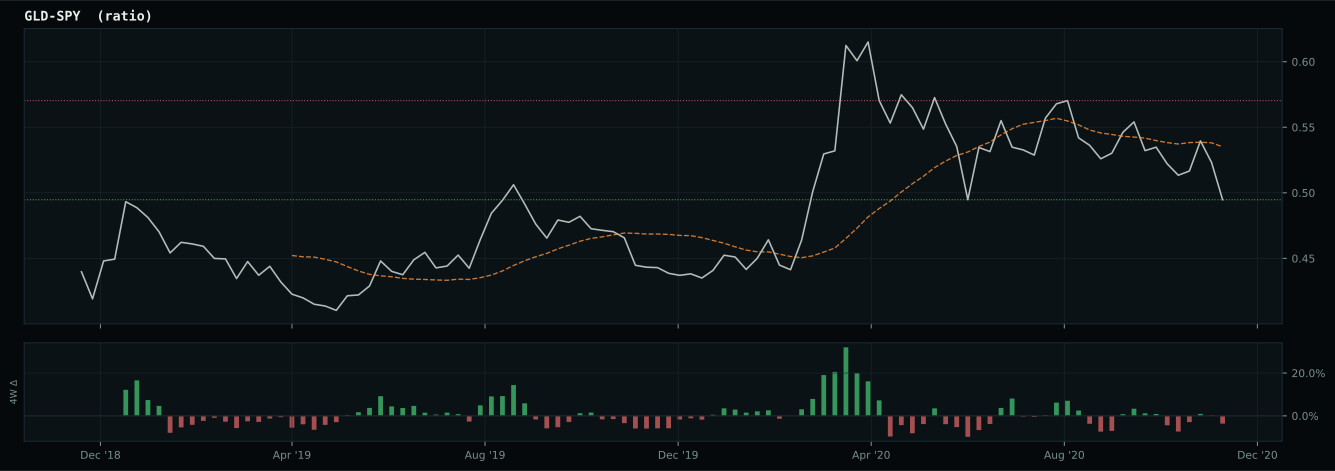
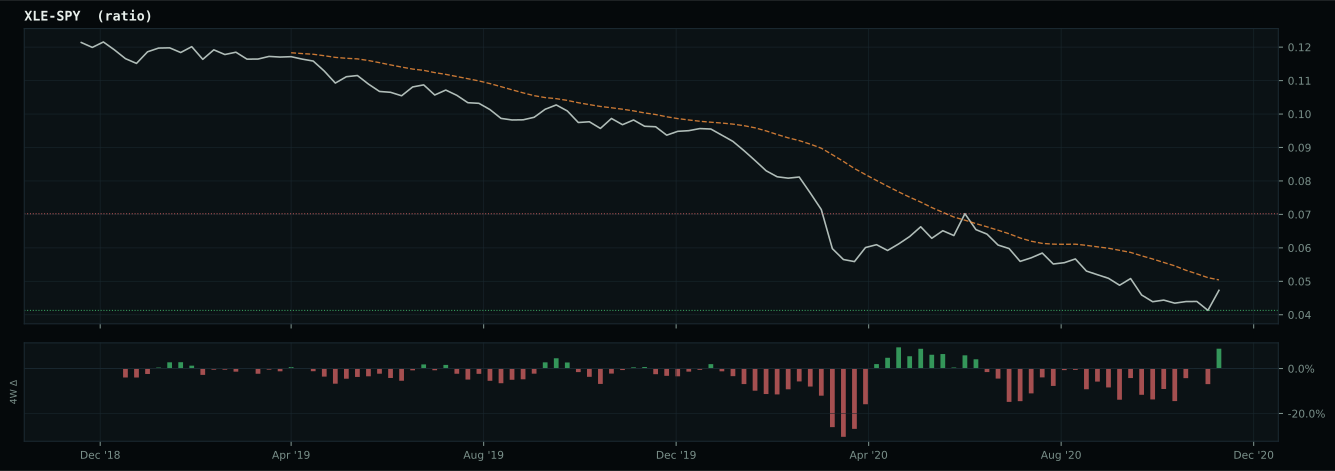
Macro Regime — Goldilocks
Macro Evidence Charts
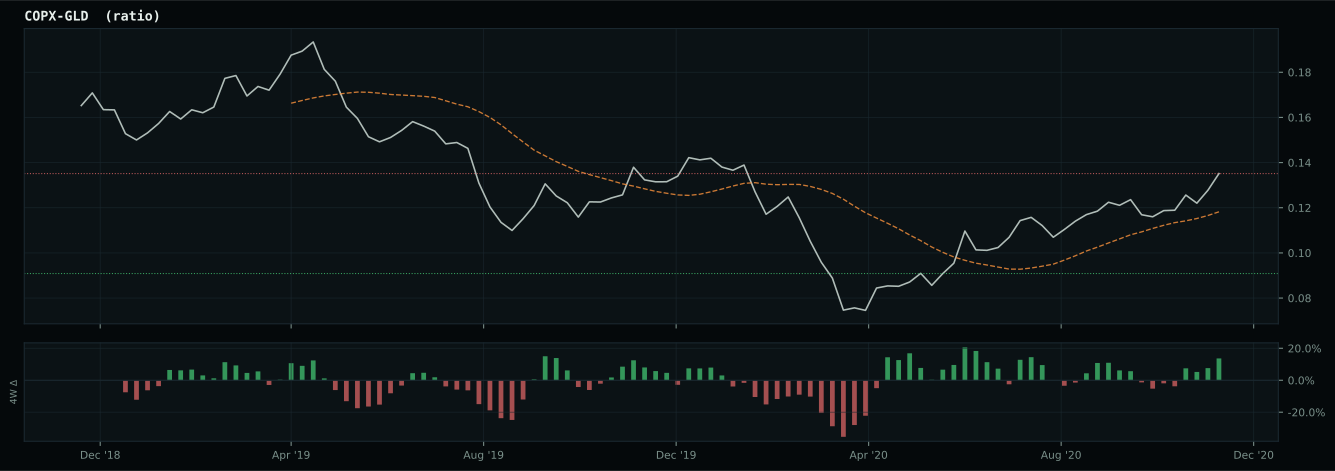
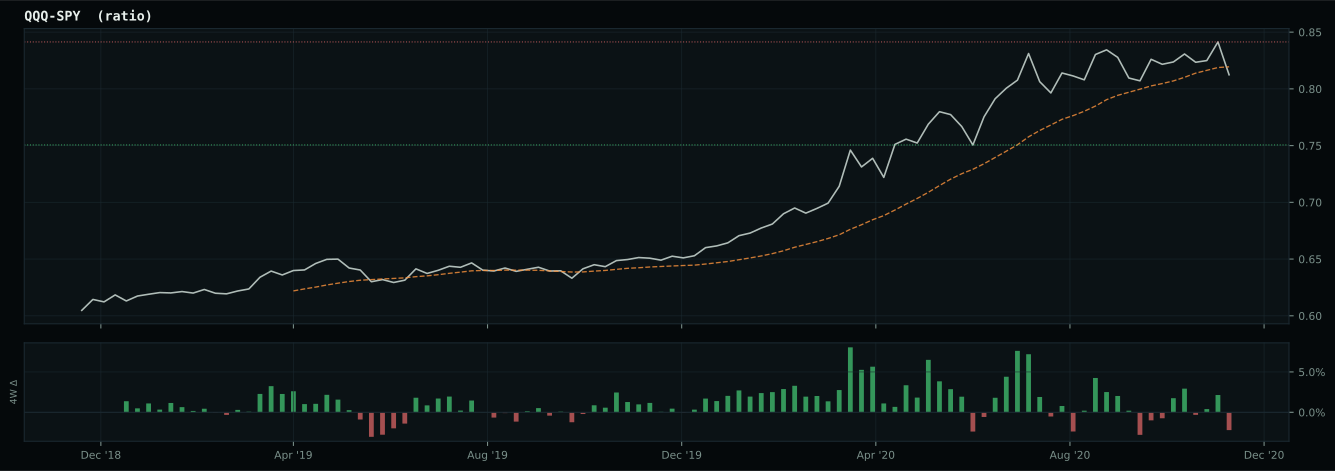
Market-implied signals behind the macro regime scores. Each ratio compares two assets; the direction and slope of the ratio is what the macro engine reads.
Crypto Regime — AltSeason
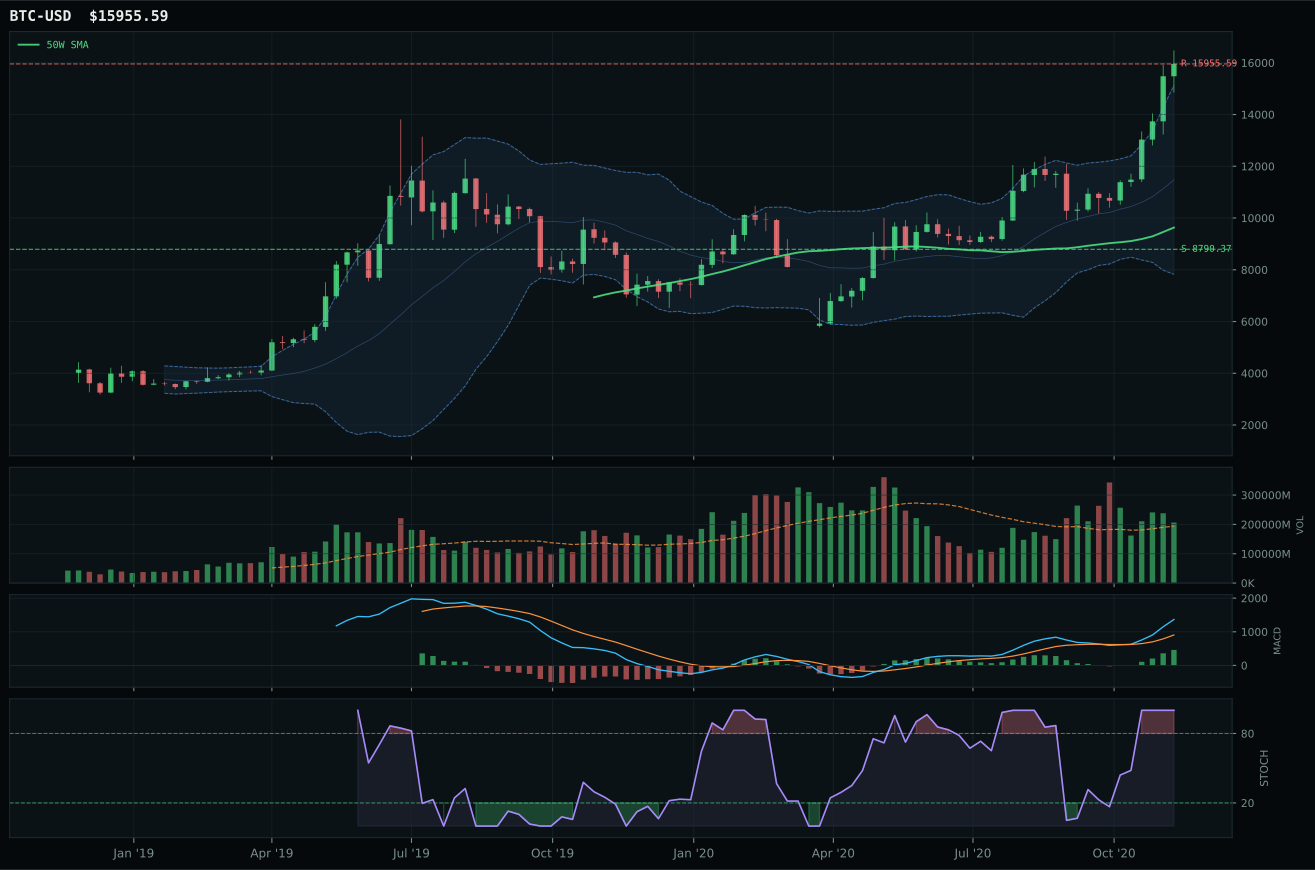
post-touch structure is too wide to count as a range; max/min close ratio is 2.87
TrendBTC confirmed: 2 consecutive closes above rising/flat 50W SMA
all available AltSeason conditions pass; missing optional confirmations skipped

Category Rankings
| Rank | Category | Winner | Score | Alloc | 4W Ret | Peers (4W) |
|---|---|---|---|---|---|---|
| 1 | Utilities & Infrastructure | IGF | 78.5 | 20% | +0.11% | PAVE +6.4% · XLU -6.3% |
| 2 | Emerging Markets | ILF | 77.2 | 20% | +15.02% | IEMG +3.3% · INDA +5.6% |
| 3 | Industrial Metals | REMX | 76.3 | 10% | +17.44% | COPX +16.4% · PICK +18.7% |
| 4 | AI | SMH | 65.6 | 10% | +8.43% | BOTZ +5.0% · AIQ +6.1% |
| 5 | Defense & Aerospace | XAR | 64.0 | 10% | +11.11% | ITA +5.7% · ROKT +8.8% |
| 6 | Technology | XLK | 48.8 | 10% | +2.86% | CIBR +11.0% · IGV +6.9% |
| 7 | Agriculture & Livestock | MOO | 37.4 | 10% | +4.04% | VEGI +3.7% · WEAT +0.5% |
| 8 | Nuclear Energy | URA | 35.1 | 10% | +29.20% | URNM +37.5% · NLR +1.6% |
| 9 | Precious Metals | GLD | 33.9 | 0% | -3.00% | GDX -7.8% · SLV -2.3% |
| 10 | Traditional Energy | XLE | — | 0% | +18.20% | XOP +24.8% · FCG +31.3% |
Utilities & Infrastructure — IGF
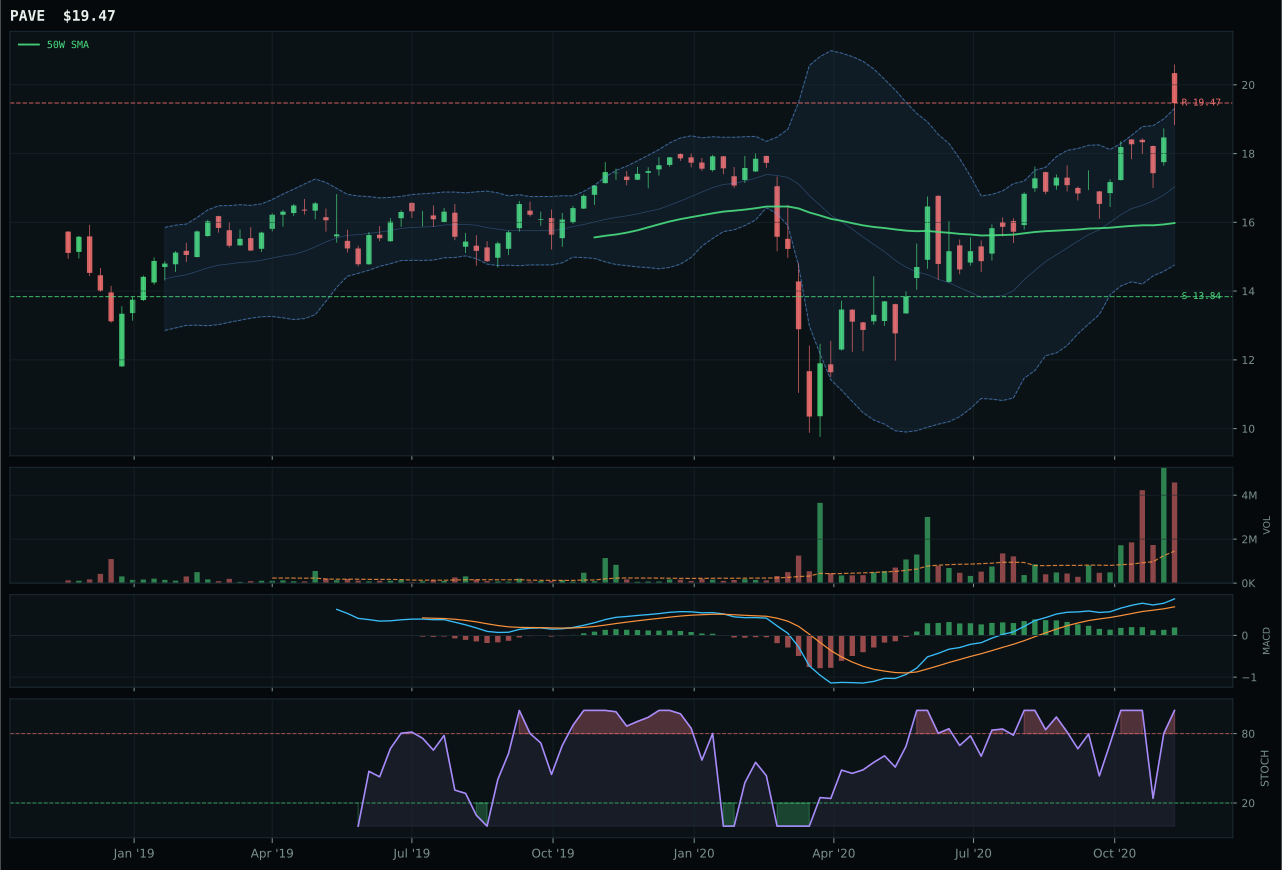
PAVE has a vertical extension profile with 6.4% 13-week relative strength versus SPY.
A failed hold above support would weaken the setup.
Actionable but governed by invalidation levels.
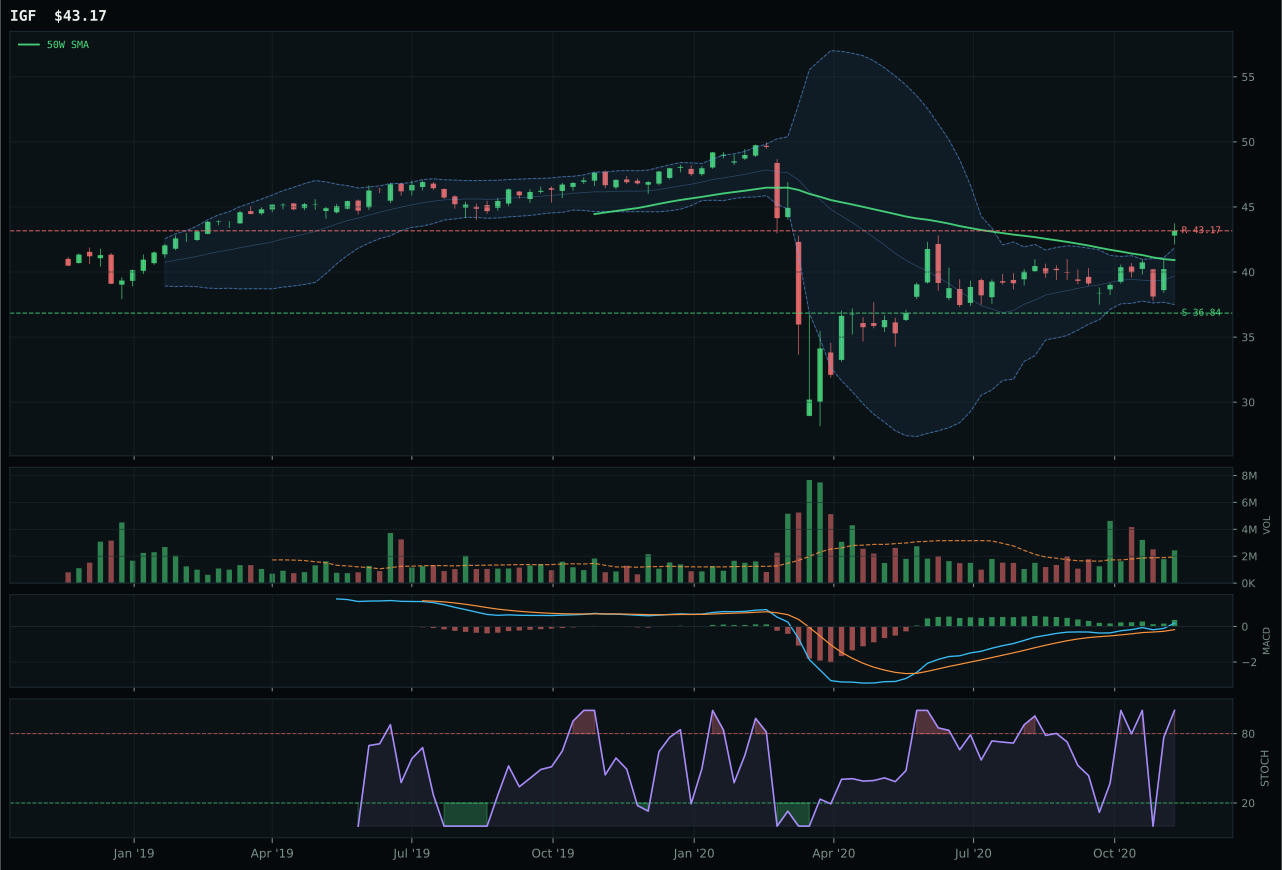
IGF has a neutral structure profile with 0.4% 13-week relative strength versus SPY.
A failed hold above support would weaken the setup.
Actionable but governed by invalidation levels.
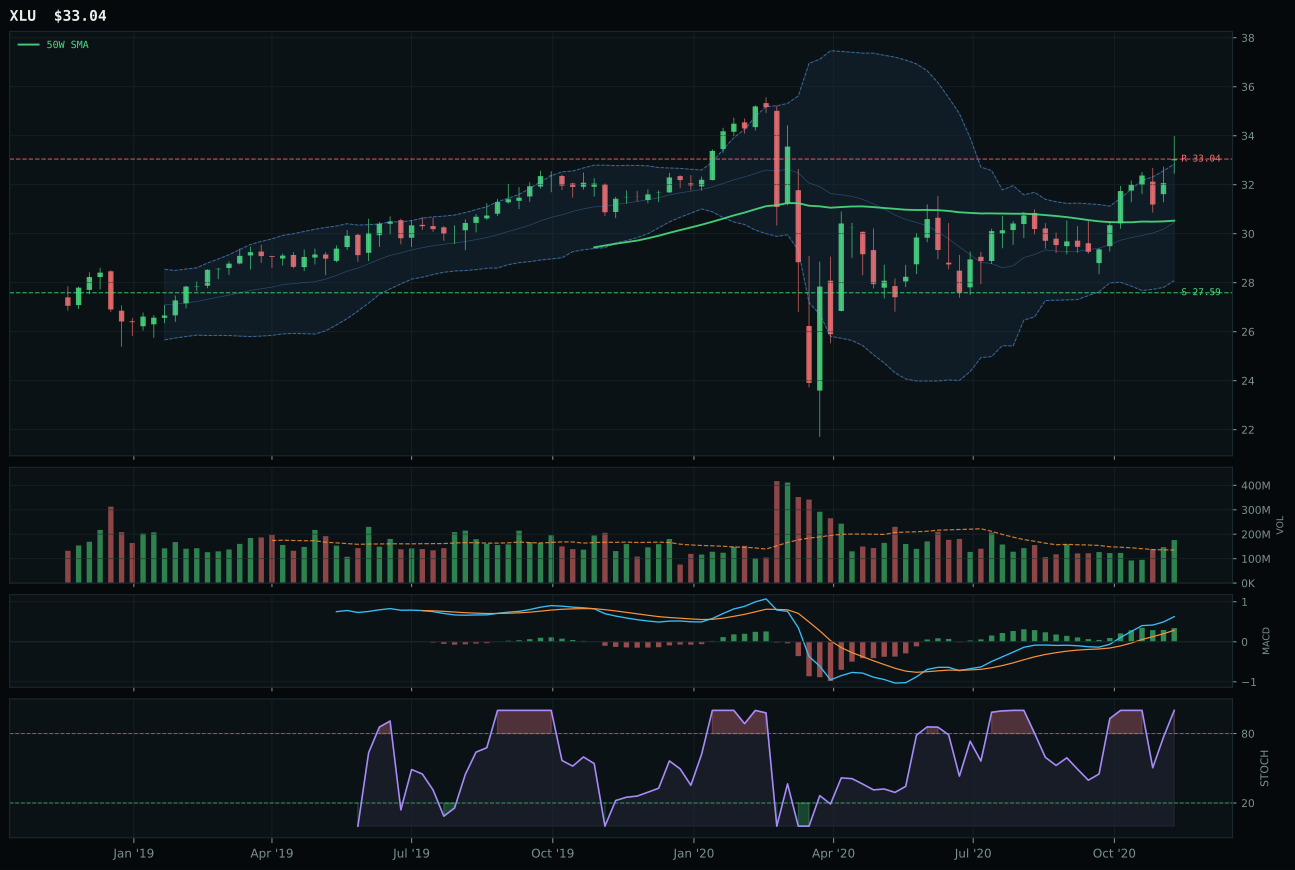
XLU has a neutral structure profile with 3.1% 13-week relative strength versus SPY.
A failed hold above support would weaken the setup.
Actionable but governed by invalidation levels.
IGF wins and earns top-2 status because it offers the cleanest entry into defensive real assets in a Goldilocks regime. Price trades 5.5% above the 50W with neutral structure, bullish and improving MACD, and stochastic RSI overbought momentum at 1.00; the setup mirrors ILF's technical coherence but at a wider distance from support. Its 6.7% thirteen-week return and 0.4% relative strength versus SPY show steady institutional participation without speculative excess. Trend scores 80.6 out of 100, and momentum confirmation is 82.9, driven by the four-week return of 8.0% and above-average volume at 1.25x participation. IGF's structure score of 74.7 matches precision, and timing at 75.0 is strong because the 5.5% distance to the 50W offers meaningful entry cushion before support tests. PAVE lost because it sits 21.8% above the 50W with MACD bullish but flattening (versus IGF's bullish and improving) and a timing score of just 40.0; the 12.7% thirteen-week return is superior, yet it represents an extended move where new capital is late. The category-relative strength advantage (negative 2.8% for IGF versus positive 3.2% for PAVE) appears to favor PAVE, but within infrastructure ETFs, IGF's combination of global diversification and tighter technical entry overcomes PAVE's domestic capex beta thesis.
Utilities & Infrastructure earned 10% allocation as a top-2 category with a 78.5 final score, supported by IGF's 79.3 technical evidence and a 72.0 macro fit driven by active defensive rotation at plus twelve and disinflation pressure at plus six. The category benefits from a neutral Goldilocks macro regime where both growth and income are attractive, but defensive rotation is the dominant flow driver. IGF's 5.5% distance to the 50W and balanced risk/reward of 53.4 (with upside to 43.17 resistance and downside support at 36.84 providing 17.2% protection) offer the second-best entry point behind ILF's compression setup. In the context of AltSeason with top-2 tier sizes of 10%, IGF's allocation reflects conviction that global infrastructure income will be a secular beneficiary of both fiscal stimulus and energy transition capex. The timing is clean: momentum confirmation of 82.9 shows institutional buyers are engaged, above-average volume at 1.25x confirms accumulation rather than distribution, and MACD is improving into a potentially higher-high pattern. To sustain the top-2 allocation, IGF would need to break above the 43.17 resistance with sustained volume confirmation; if it fails and rolls below the 50W, the category would downgrade to tier-2 and potentially lose allocation to another emerging thematic play.
Emerging Markets — ILF
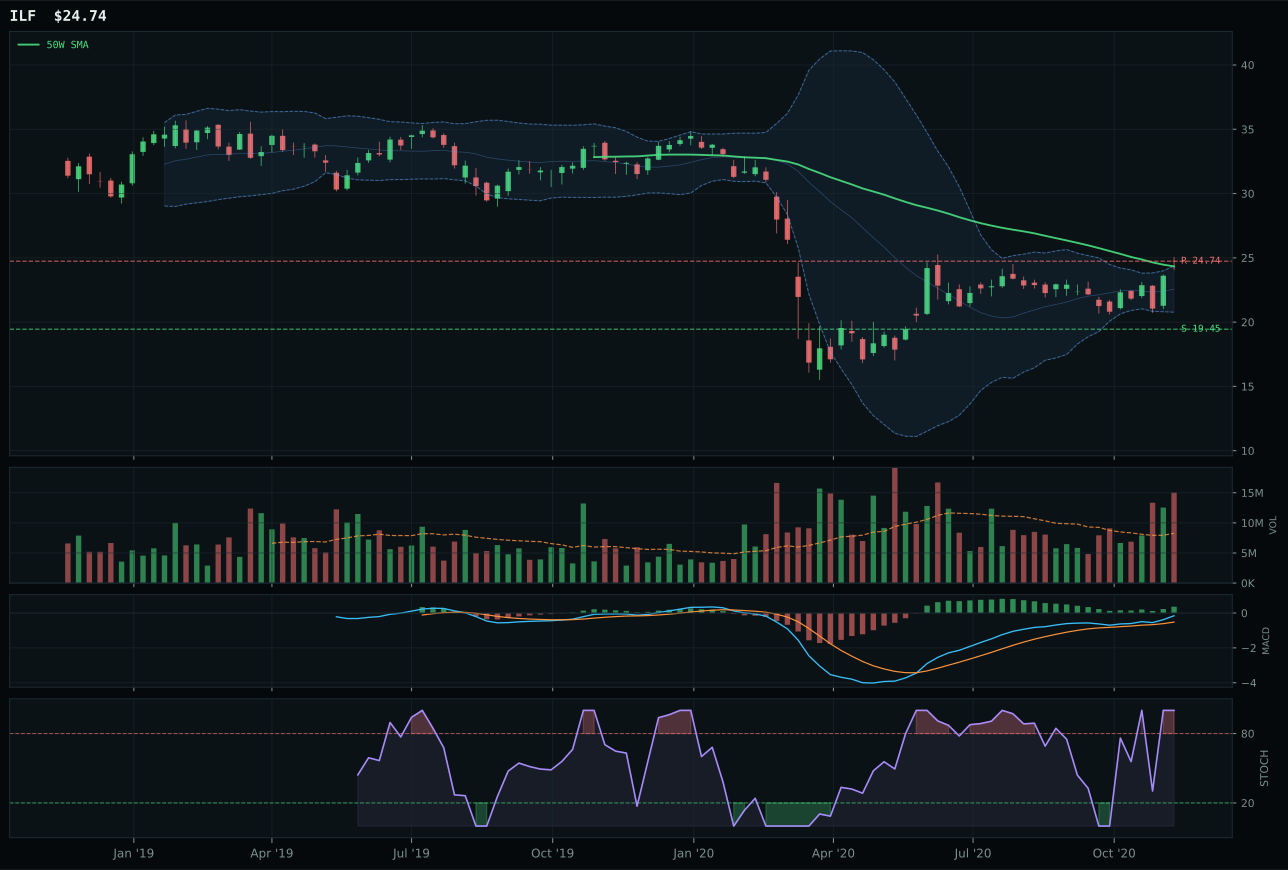
ILF has a compression near 50W profile with 1.8% 13-week relative strength versus SPY.
A failed hold above support would weaken the setup.
Actionable but governed by invalidation levels.
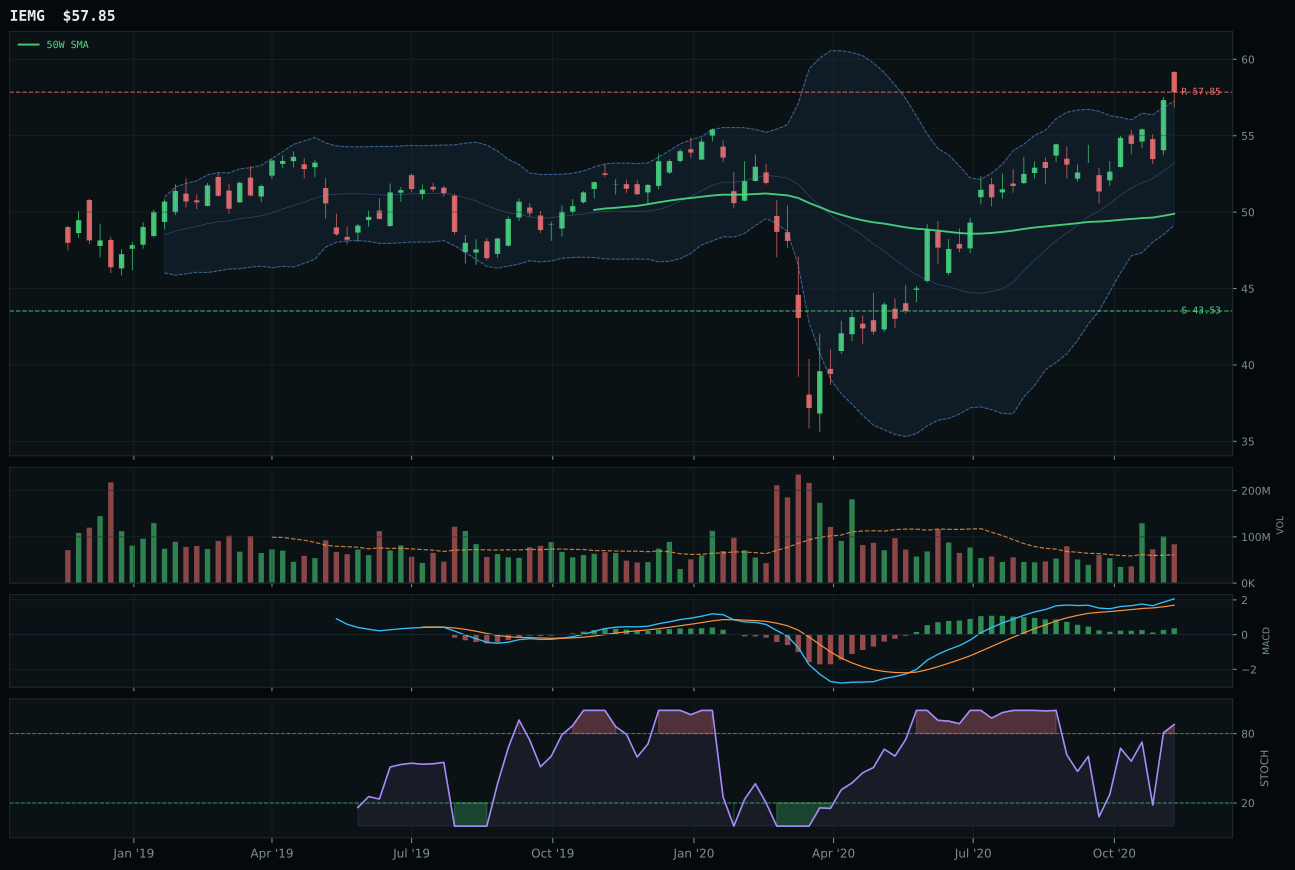
IEMG has a vertical extension profile with 3.0% 13-week relative strength versus SPY.
A failed hold above support would weaken the setup.
Actionable but governed by invalidation levels.
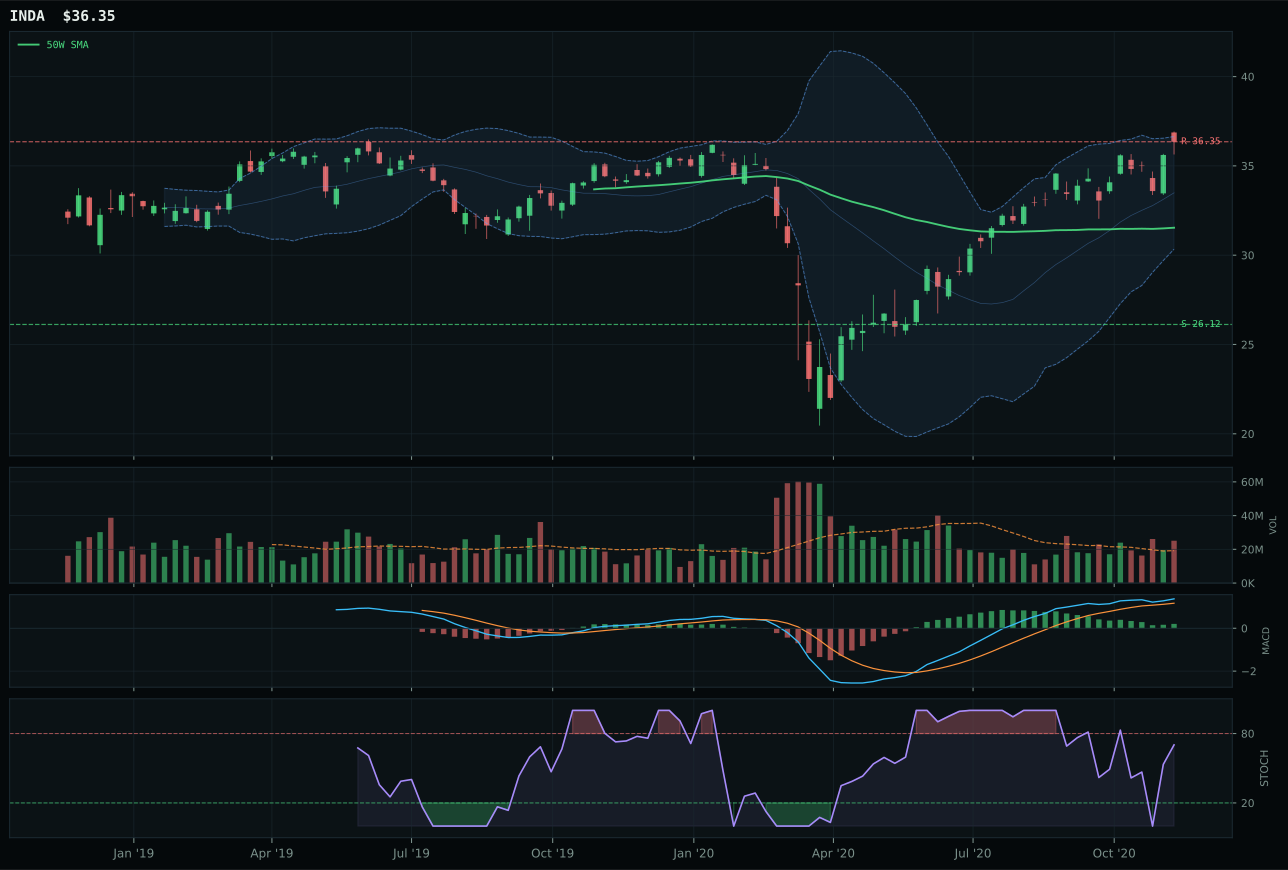
INDA has a vertical extension profile with 4.1% 13-week relative strength versus SPY.
A failed hold above support would weaken the setup.
Actionable but governed by invalidation levels.
ILF wins and earns top-2 status because it delivers a perfect storm of technical precision and macro alignment. Price trades 1.7% above the 50W with compression near the moving average, MACD bullish and improving, and stochastic RSI overbought momentum at 1.00—the tightest setup in this week's survey. Timing scores 100.0 out of 100, and momentum confirmation also scores 100.0 because the four-week return of 13.3%, thirteen-week return of 8.1%, and above-average volume at 1.82x (accumulation/confirmation) show institutional buyers defending support at the 50W after a pullback from extended levels. Volume-price confirmation of 82.5 and persistence of 78.9 are among the week's highest readings. IEMG lost because it sits 15.9% above the 50W with a timing score of only 37.0; despite carrying above-average volume and bullish MACD, the extension means new buyers are late, and the risk/reward deteriorates to 41.4 versus ILF's 63.3. The category-relative strength gap (negative 1.2% for ILF versus 0.0% for IEMG) is subtle, but ILF's compression setup near support is categorically superior for risk-adjusted entry.
Emerging Markets earned 10% allocation as a top-2 category with a 77.2 final score, supported by ILF's 91.5 technical evidence and a 70.0 macro fit driven by active EM liquidity support at plus fourteen and Goldilocks regime tailwinds at plus eight. The category benefits from commodity breadth positive at plus eight and metals scarcity at plus five, creating a favorable environment for Latin America's commodity and value exposure. ILF's compression near the 50W and perfect timing score (100.0) represent a rare entry opportunity: the technical setup is tight, accumulation is evident at 1.82x volume, and the risk/reward is balanced at 63.3 with upside to the 24.74 resistance and downside protection to 19.45 support at 27.2%. In the context of AltSeason with a 50% crypto overlay halving all category tier sizes to 10% and 5%, ILF's top-2 ranking reflects conviction that emerging markets are the cleanest real-asset play available—better timing than IGF despite IGF's higher trend score, better accumulation pattern than AI semiconductors which are extended. The 10% allocation is appropriate because compression near support with bullish MACD signals a breakout candidate that can sustain above 24.74 with fresh accumulation; momentum could accelerate sharply if capital continues to rotate into EM value after the recent USD strength correction.
Industrial Metals — REMX
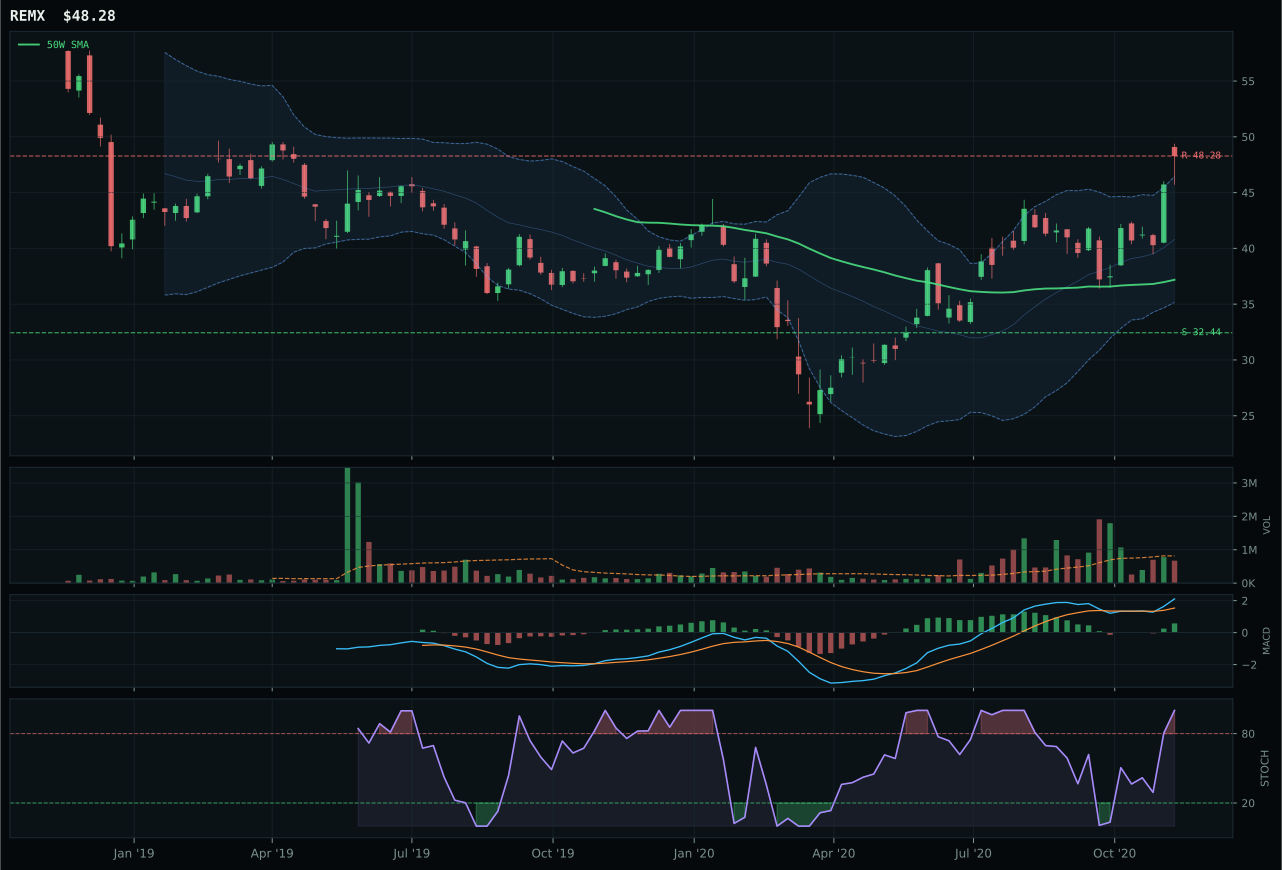
REMX has a vertical extension profile with 8.9% 13-week relative strength versus SPY.
A failed hold above support would weaken the setup.
Actionable but governed by invalidation levels.
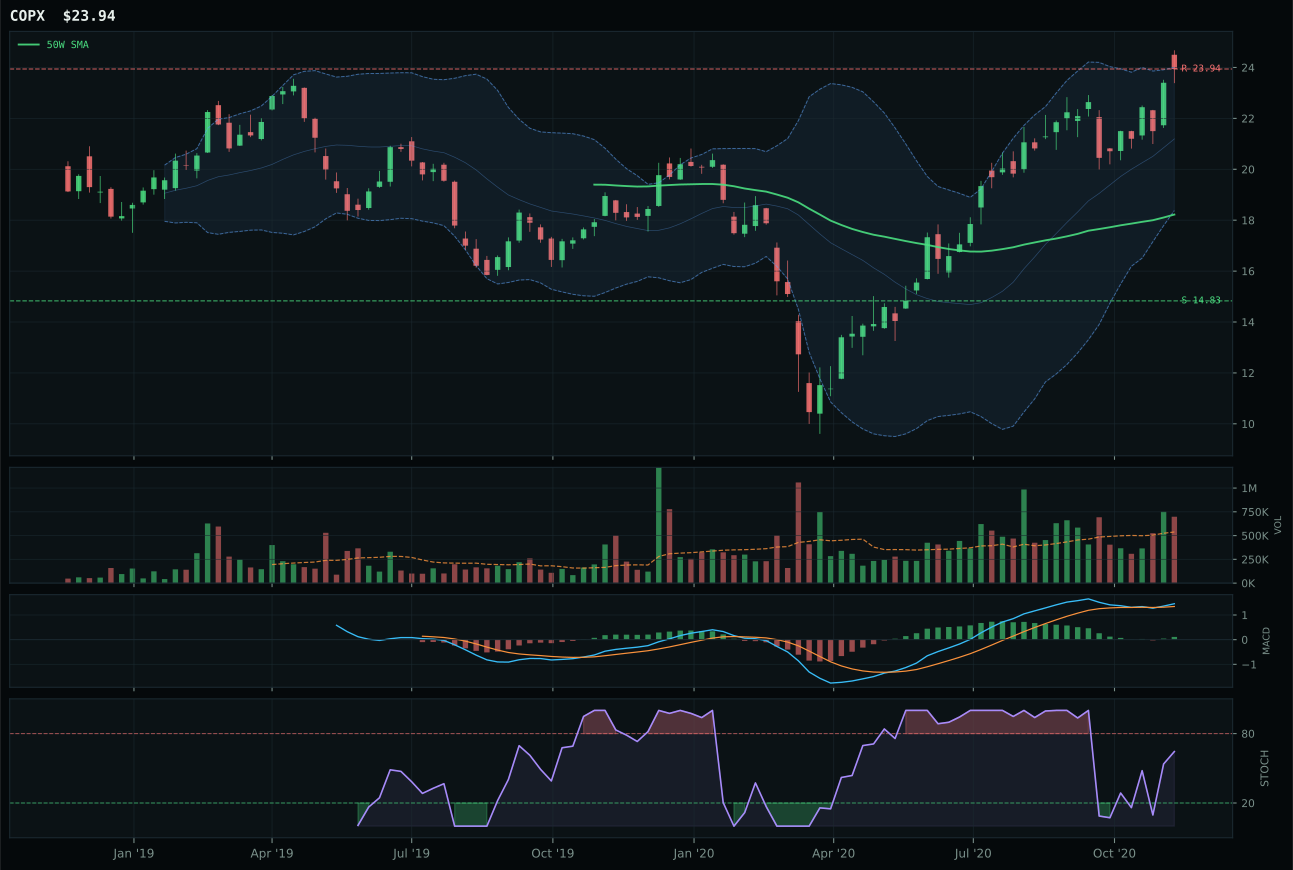
COPX has a vertical extension profile with 8.7% 13-week relative strength versus SPY.
A failed hold above support would weaken the setup.
Actionable but governed by invalidation levels.
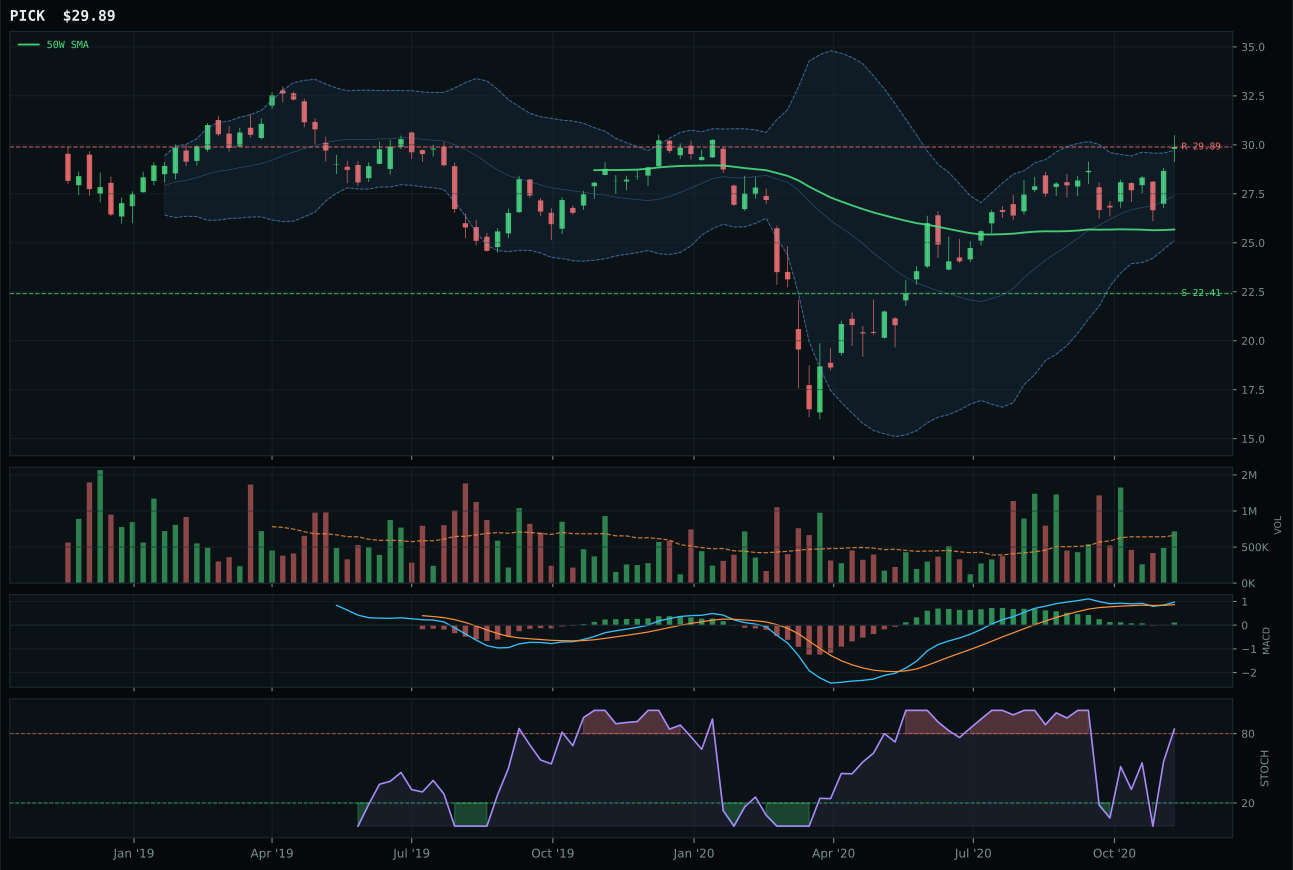
PICK has a vertical extension profile with 0.9% 13-week relative strength versus SPY.
A failed hold above support would weaken the setup.
Actionable but governed by invalidation levels.
REMX wins despite a technically inferior composite score to COPX because of its superior momentum confirmation at 100.0 and cleaner category-relative strength at 0.3% versus COPX's 0.0%. The setup is vertical extension at 29.8% above the 50W with MACD bullish and improving and stochastic RSI overbought at 1.00, meaning the four-week return of 18.6% has attracted institutional flows. However, the thirteen-week return of 15.3% paired with 8.9% relative strength versus SPY shows sustained conviction rather than a flash spike. The risk/reward is tight (40.0 out of 100) because upside to the 48.28 resistance is essentially zero while downside to support at 32.44 is 48.8%—a severely asymmetric risk profile. COPX lost narrowly on category-relative strength (0.0% versus 0.3%) despite carrying superior structure (composition 75.0), timing (53.0 versus 37.0), and volume-price confirmation (75.0 versus 67.3). The win comes down to REMX's overbought stochastic RSI and improving MACD, which signal that rare-earth scarcity thesis is winning over copper-demand beta in a post-pandemic capex environment.
Industrial Metals earned 5% allocation as a tier-2 category with a 76.3 final score, supported by a strong 79.0 macro fit driven by active metals scarcity at plus fourteen and commodity breadth positive at plus ten. The Goldilocks regime with real-asset sponsorship at plus six and liquidity expansion create a favorable environment for REMX's rare-earth supply-chain thesis. However, the category did not earn top-2 status because of timing deterioration: at 29.8% above the 50W with a timing score of just 37.0, REMX requires new buyers to chase an extended move. COPX's superior technical evidence (81.0 versus REMX's 63.5) and macro fit (69.0 versus 56.0) were overridden by the momentum confirmation edge and MACD quality. The 5% allocation reflects conviction that metals scarcity—rare earths and copper alike—will remain a portfolio hedge against supply-chain disruption and energy transition capex, but the extended entry point and neutral volume (0.82x) suggest this is a consolidation phase rather than a breakout. To upgrade this category to tier-1, REMX would need to hold support at 32.44 without breaking lower, then initiate fresh accumulation above 43.35 with volume expanding above 1.25x; absent that catalyst, the 5% sleeve is a tactical hold.
AI — SMH
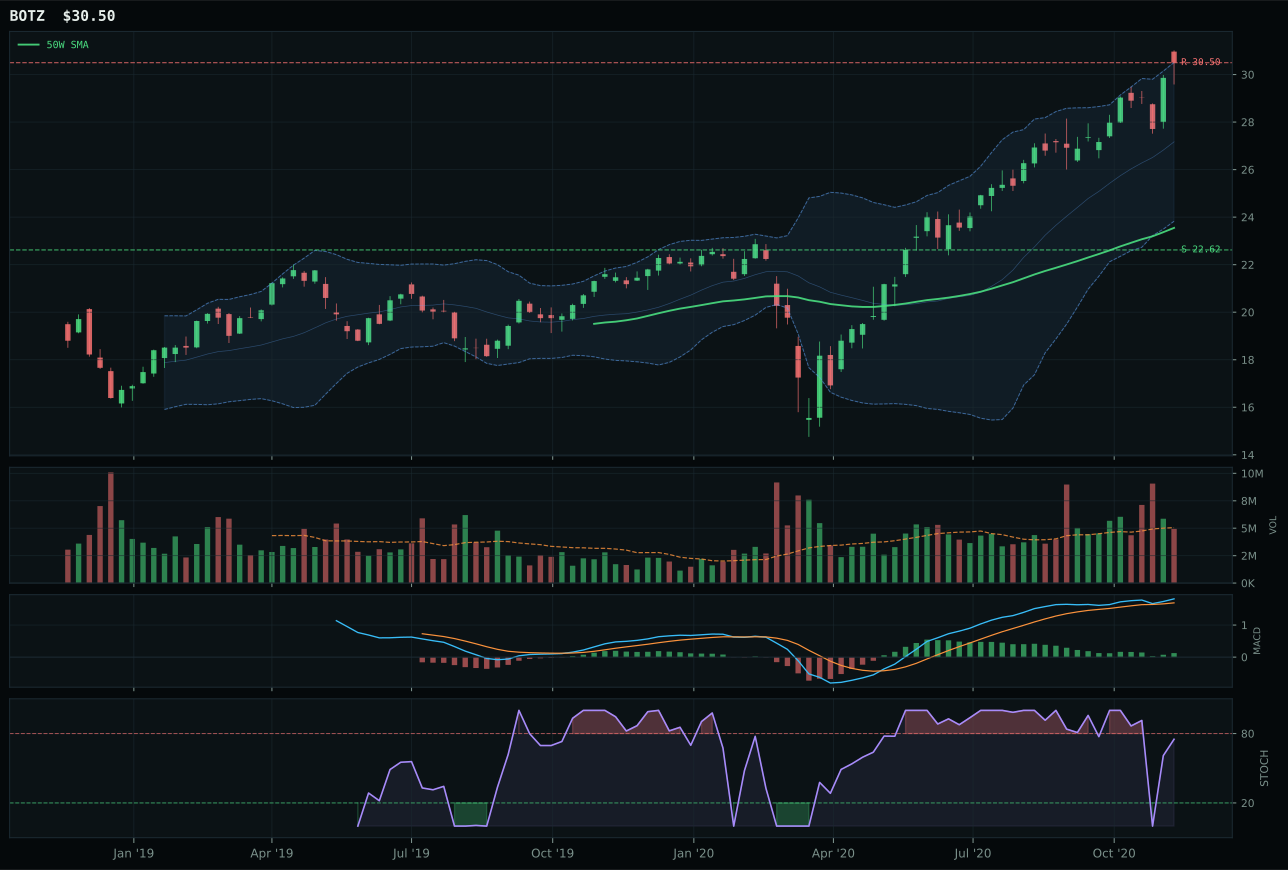
BOTZ has a vertical extension profile with 6.9% 13-week relative strength versus SPY.
A failed hold above support would weaken the setup.
Actionable but governed by invalidation levels.
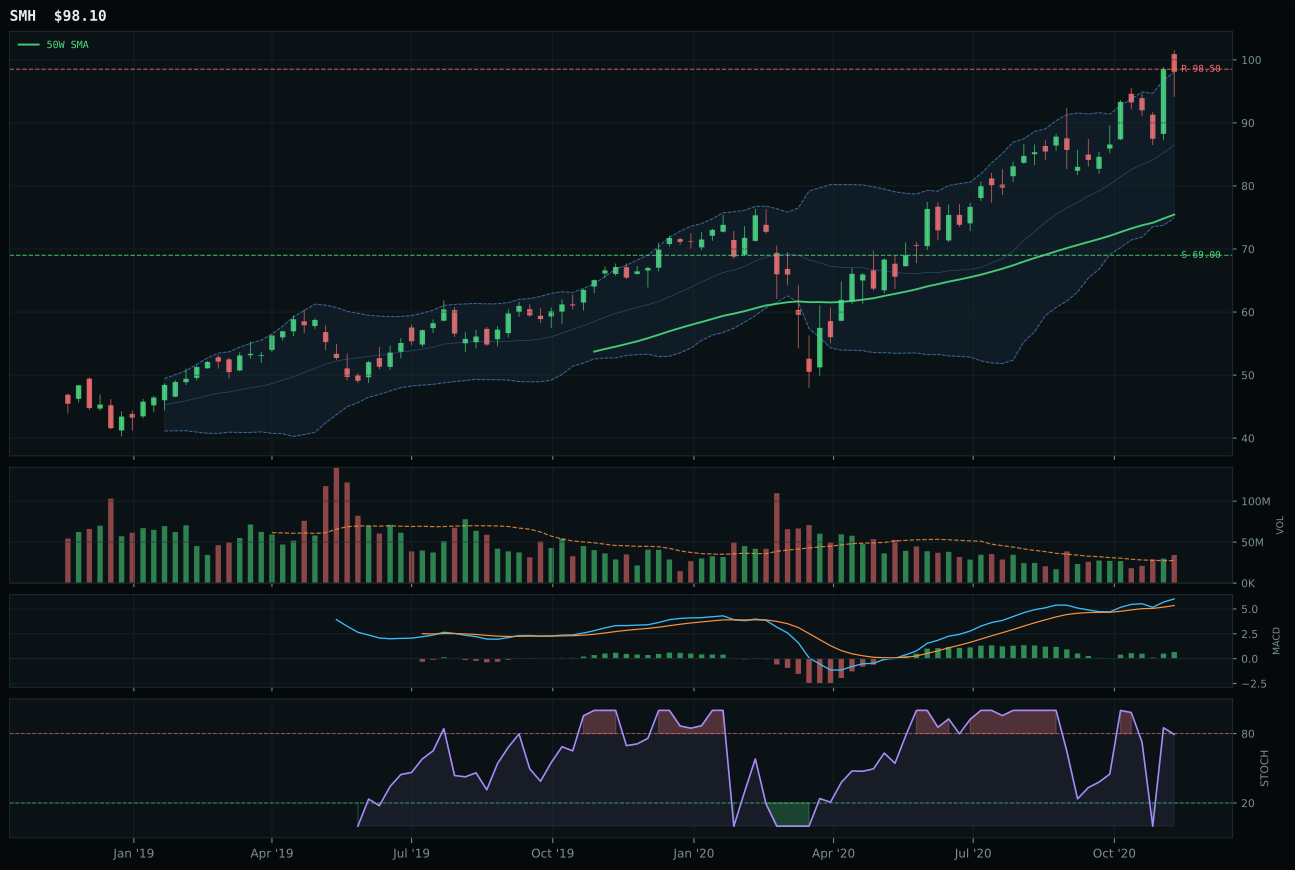
SMH has a vertical extension profile with 8.6% 13-week relative strength versus SPY.
A failed hold above support would weaken the setup.
Actionable but governed by invalidation levels.
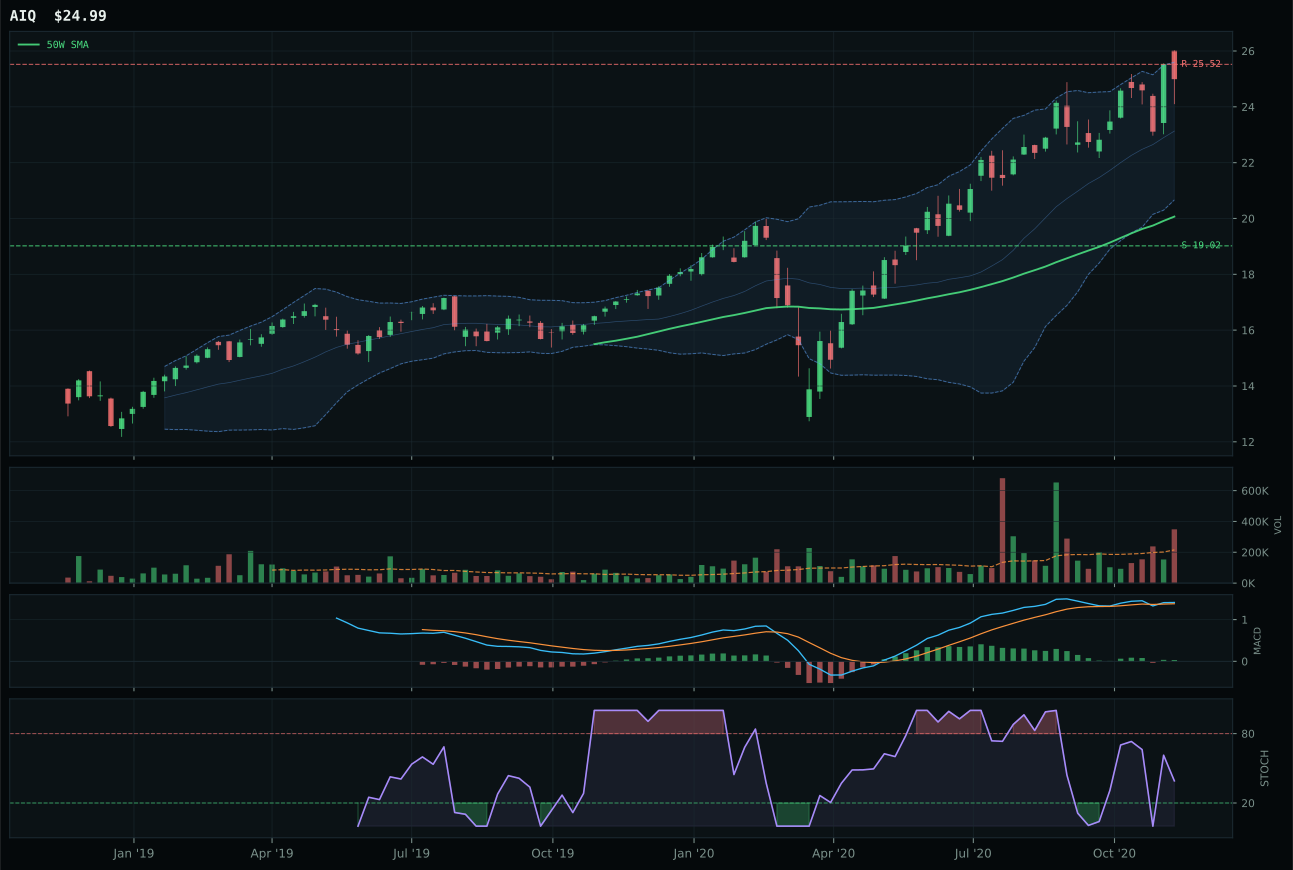
AIQ has a vertical extension profile with 5.5% 13-week relative strength versus SPY.
A failed hold above support would weaken the setup.
Tracked, but not top-2 eligible because: .
SMH wins with a trend score of 100.0 because price sits above both the 50W and 200W while the 50W slope remains positive at 0.8%, and the thirteen-week return of 15.0% paired with 8.6% relative strength versus SPY tells a story of sustained accumulation in semiconductor leadership. The critical edge over BOTZ comes from volume confirmation and MACD momentum: SMH carries above-average participation at 1.25x the 20W average with bullish and improving MACD, whereas BOTZ shows bullish but flattening MACD alongside falling stochastic RSI and neutral volume. At 30.0% above the 50W, SMH is extended, and its risk/reward of 37.2 reflects minimal upside to the 98.50 resistance level, but the momentum confirmation score of 100.0 shows that buyers are still defending the level actively. BOTZ's 40.0 timing score versus SMH's 53.0 reveals the structural weakness: robotics and physical automation are moving, but without the immediacy of compute chip scarcity that AI infrastructure demands.
AI earned 5% allocation as a tier-2 category, ranked below the top-2 despite a 65.6 final score and strong 80.5 technical evidence. The category benefits from Goldilocks regime tailwinds and active AI growth sponsorship at plus fourteen basis points in macro fit, but the extension and risk/reward limitations prevented top-2 selection when other categories offered better entry timing. At 30.0% above the 50W, SMH requires buyers to commit at stretched levels; the upside to resistance is essentially zero, meaning the entire risk case hinges on holding current support at 69.00 or breaking higher. The 5% sleeve provides meaningful exposure to the secular AI compute trend without overcommitting to what is now an extended tape. Improvement would require either a consolidation phase near the 50W to reset timing scores, or a fresh breakout above 98.50 resistance with volume confirmation—either would shift the category into a tier-1 conviction slot.
Defense & Aerospace — XAR
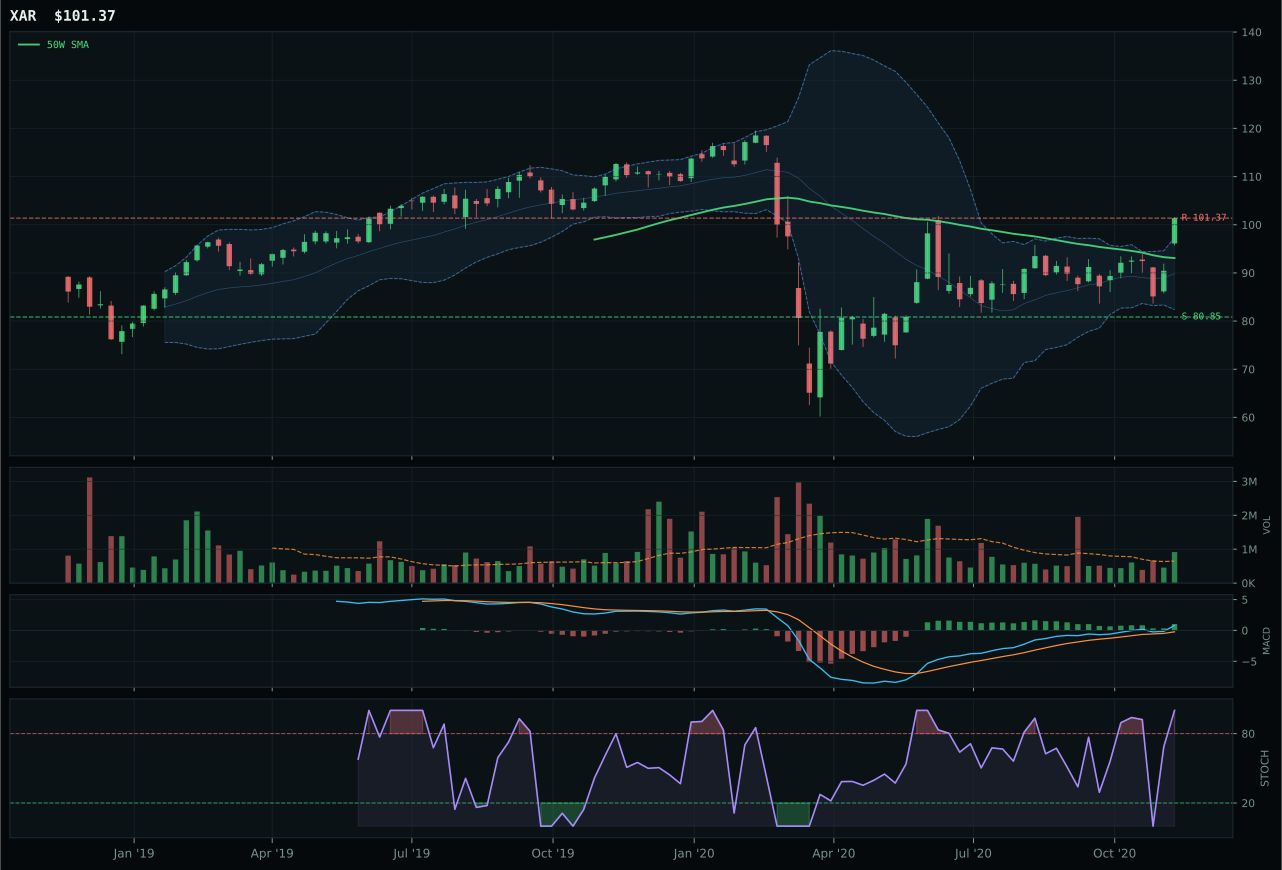
XAR has a neutral structure profile with 2.1% 13-week relative strength versus SPY.
A failed hold above support would weaken the setup.
Actionable but governed by invalidation levels.
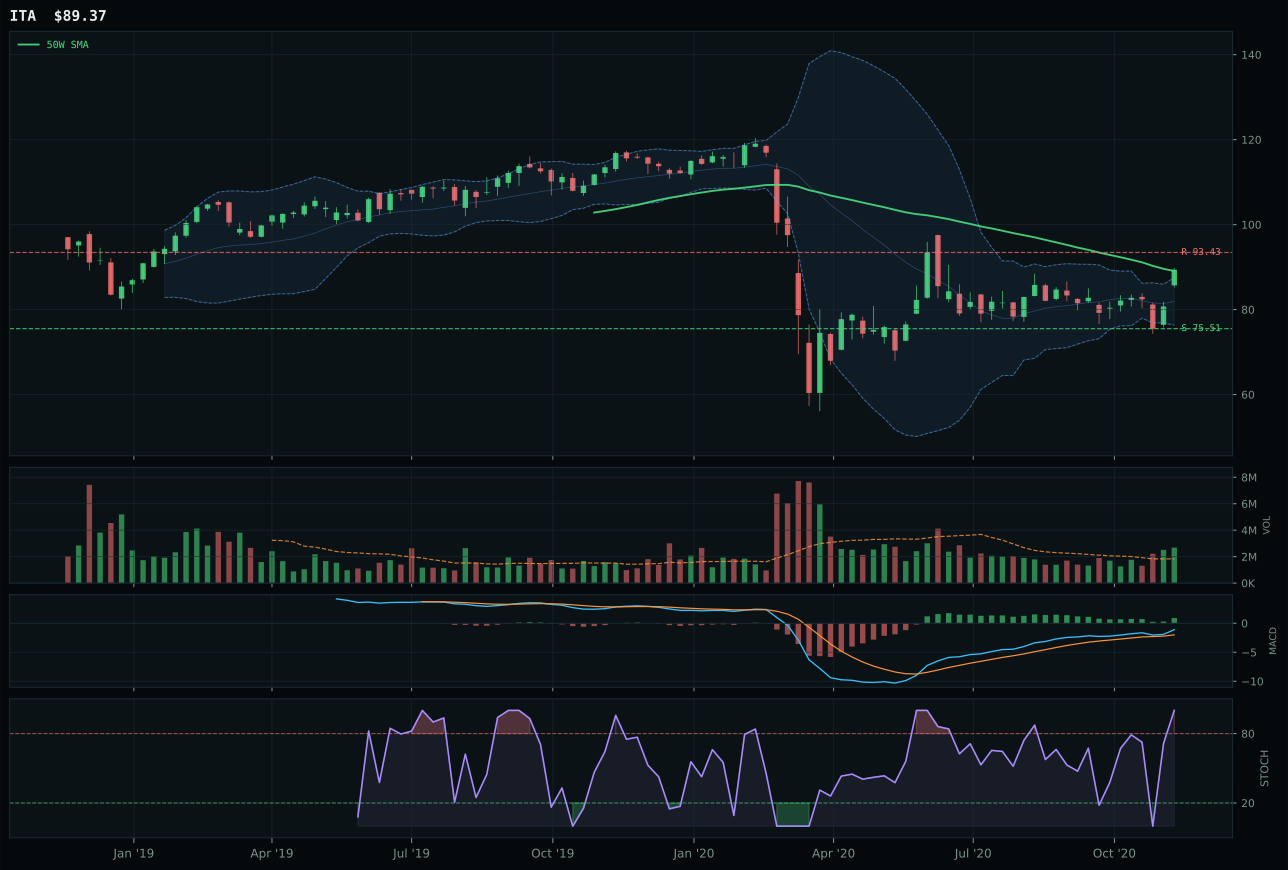
ITA has a compression near 50W profile with -2.1% 13-week relative strength versus SPY.
A failed hold above support would weaken the setup.
Actionable but governed by invalidation levels.
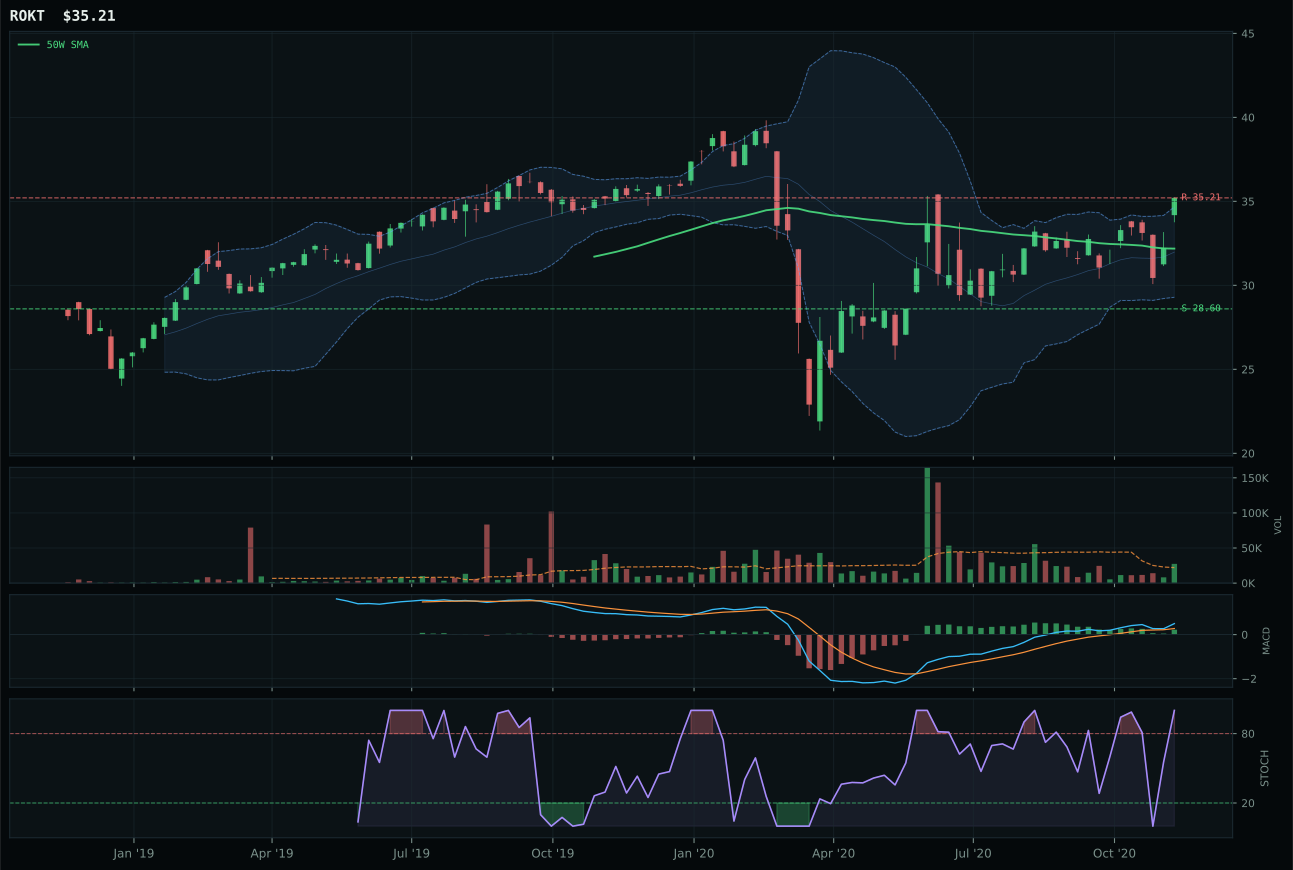
ROKT has a neutral structure profile with -0.3% 13-week relative strength versus SPY.
A failed hold above support would weaken the setup.
Tracked, but not top-2 eligible because: .
XAR wins because price trades above both moving averages but the 50W slope shows deterioration at negative 0.2%, shifting the burden of proof onto breadth and relative strength to justify the hold. The setup is neutral structure compression with 8.9% distance to the 50W—shallow enough to suggest the buyer base is still engaged. Its 2.1% relative strength versus SPY and 2.4% category-relative strength confirm that within the three-name basket (XAR, ITA, ROKT), XAR has the most conviction from institutional flows. MACD is bullish and improving while stochastic RSI reads overbought momentum at 1.00, and at 1.41x the 20W average volume, accumulation is evident. ITA lost because category-relative strength lagged at negative 1.9% despite carrying a superior structure cleanliness score (75.3 matches XAR's 75.4); the difference is subtle but critical: XAR's RS advantage means smart money is rotating into XAR's broader defense-industrial complex over ITA's defense-prime durability thesis.
Defense & Aerospace earned 5% allocation as a tier-2 category, holding steady despite a 64.0 final score and positive technical evidence of 87.7. The category's macro fit of 63.0 reflects neutral positioning in the Goldilocks regime with active defensive rotation at plus eight but offset by credit stress at plus two; it is not a category driven by macro acceleration but rather by tactical rotation into stability. At 8.9% from the 50W, XAR offers reasonable entry risk relative to its peers, and the above-average volume participation at 1.41x suggests accumulation rather than distribution. The 5% sleeve is appropriate because the category lacks the timing urgency of the AI or infrastructure plays; its strength is structural—defense budgets remain stable—but not cyclically catalytic. To earn top-2 status, this category would need either a breakout above 101.37 resistance with sustained volume confirmation, or an acceleration in relative strength if geopolitical risk premia spike; for now, it remains a quality defensive holding that doesn't deserve to be overweighted in a Goldilocks regime where growth is still accessible.
Technology — XLK
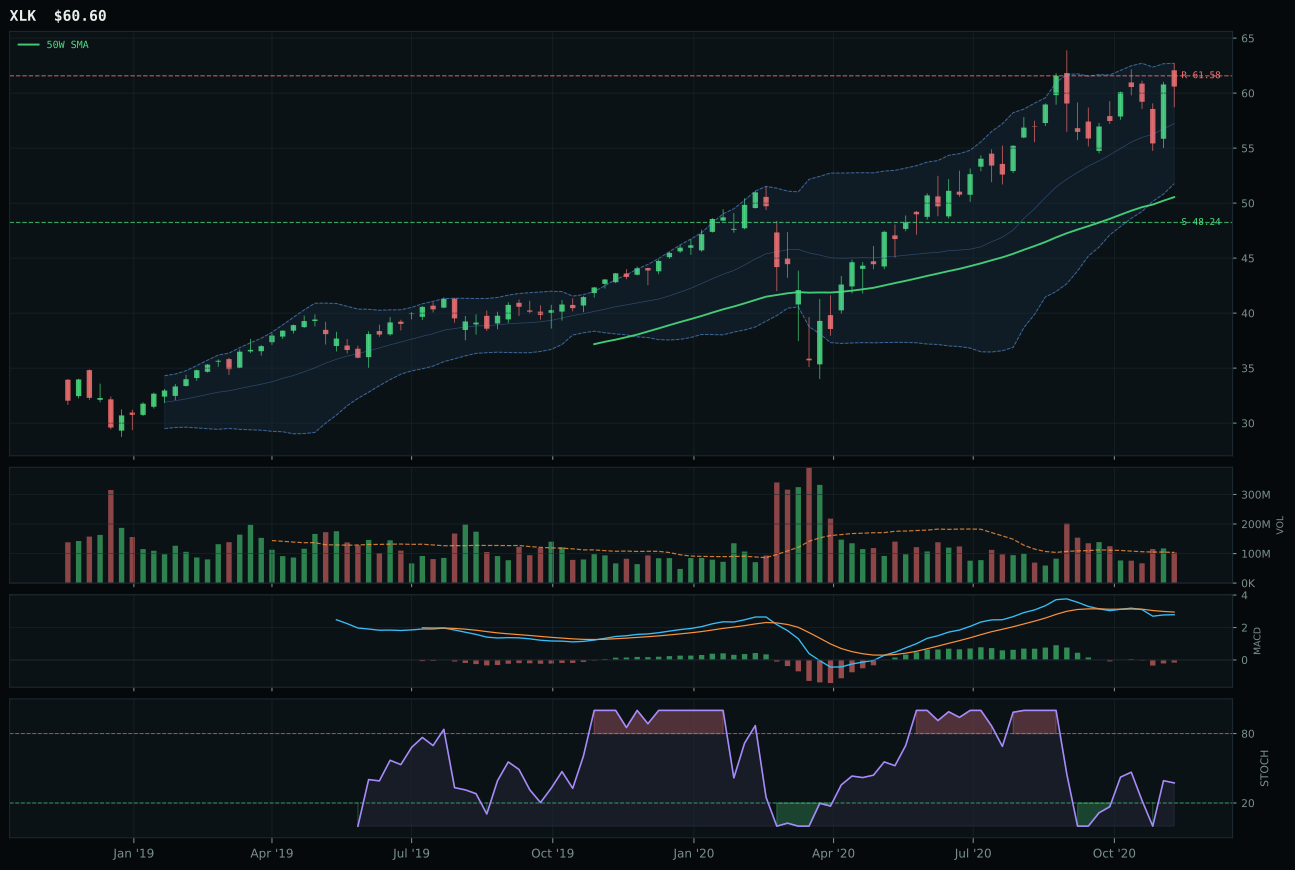
XLK has a vertical extension profile with 0.1% 13-week relative strength versus SPY.
A failed hold above support would weaken the setup.
Actionable but governed by invalidation levels.
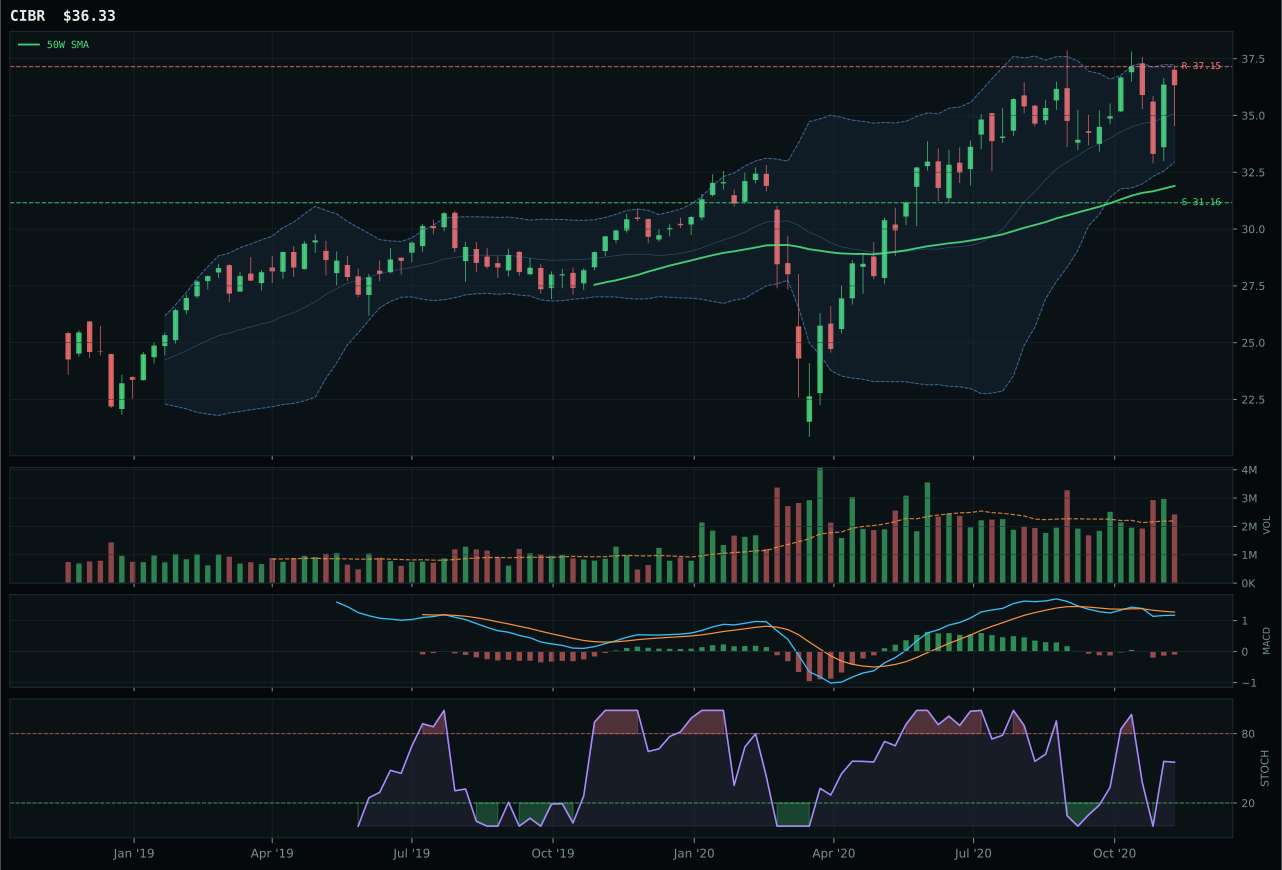
CIBR has a neutral structure profile with -1.4% 13-week relative strength versus SPY.
A failed hold above support would weaken the setup.
Actionable but governed by invalidation levels.
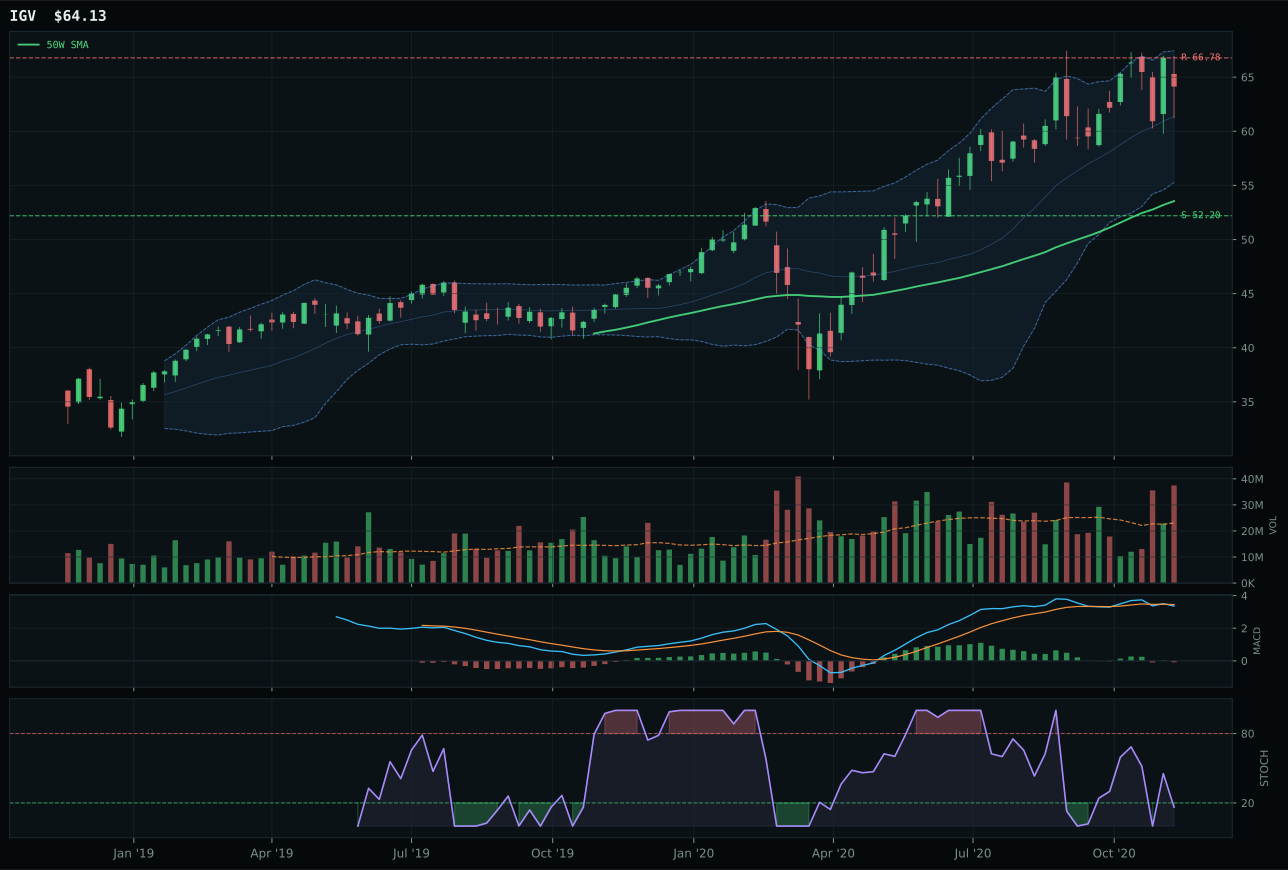
IGV has a vertical extension profile with 3.6% 13-week relative strength versus SPY.
A failed hold above support would weaken the setup.
Actionable but governed by invalidation levels.
XLK wins because it holds price above both the 50W and 200W moving averages with a non-deteriorating 50W slope of 0.7%, capturing relative strength of 0.1% versus SPY while trading 19.9% above the 50W—a setup that reveals two key truths about the current buyer pool. First, the extension itself penalizes entry risk: every new buyer is late and has absorbed a 6.4% thirteen-week return with minimal category outperformance. Second, MACD is bearish and weakening while stochastic RSI rises from the mid-zone, a classic divergence that signals momentum without conviction. CIBR lost on risk/reward asymmetry (39.4 versus XLK's 46.1) and inferior category-relative strength at negative 1.5%, meaning broad technology leadership is winning over the narrower cybersecurity bet. The structural decision turns on volume: both carry neutral-to-above-average participation, but XLK's composition of trend strength and macro sponsorship edges out CIBR's defensive tilt when the macro regime favors growth liquidity.
Technology earned 5% allocation as a tier-2 category, ranking outside the top-2 because two higher-scoring eligible categories claimed the 10% slots. At a Goldilocks macro regime with active liquidity expansion and AI growth sponsorship offsetting credit stress, the category's 72.0 macro fit score helped sustain its 48.8 final technical score, but timing remains the constraint. Entry at the 19.9% extension above the 50W means downside risk to support at 48.24 is 25.6%—a risk-reward profile that works as a diversifier rather than a conviction hold. The 5% allocation reflects the fact that XLK needs a pullback or a period of consolidation to improve its risk-adjusted positioning; the setup today is strong enough to maintain exposure, but not clean enough to upgrade. Should MACD begin to recover above its trend line or stochastic RSI sustain above 0.5, this category could trade higher and potentially earn a top-2 seat, but the Goldilocks regime is already priced into most growth proxies.
Agriculture & Livestock — MOO
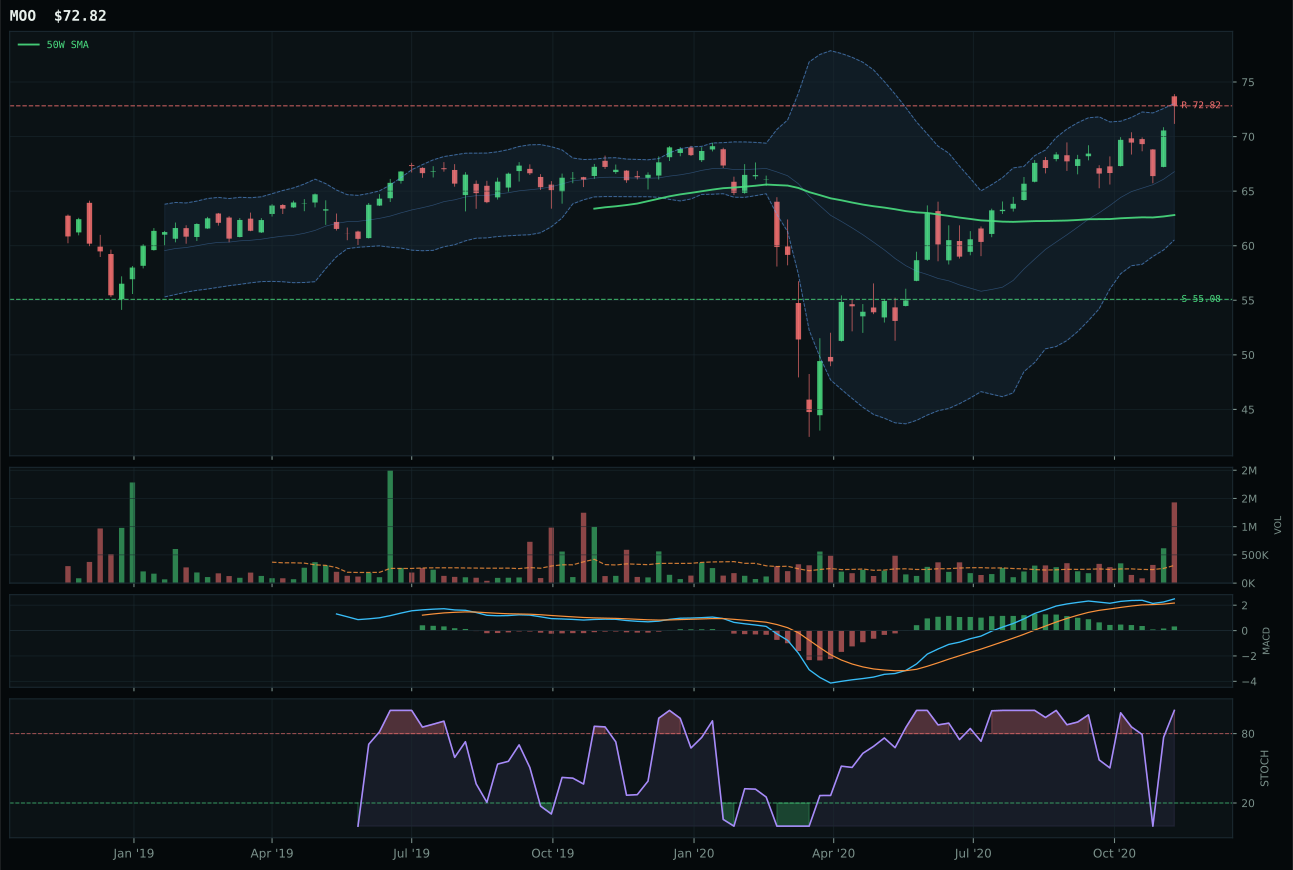
MOO has a vertical extension profile with 1.4% 13-week relative strength versus SPY.
A failed hold above support would weaken the setup.
Actionable but governed by invalidation levels.
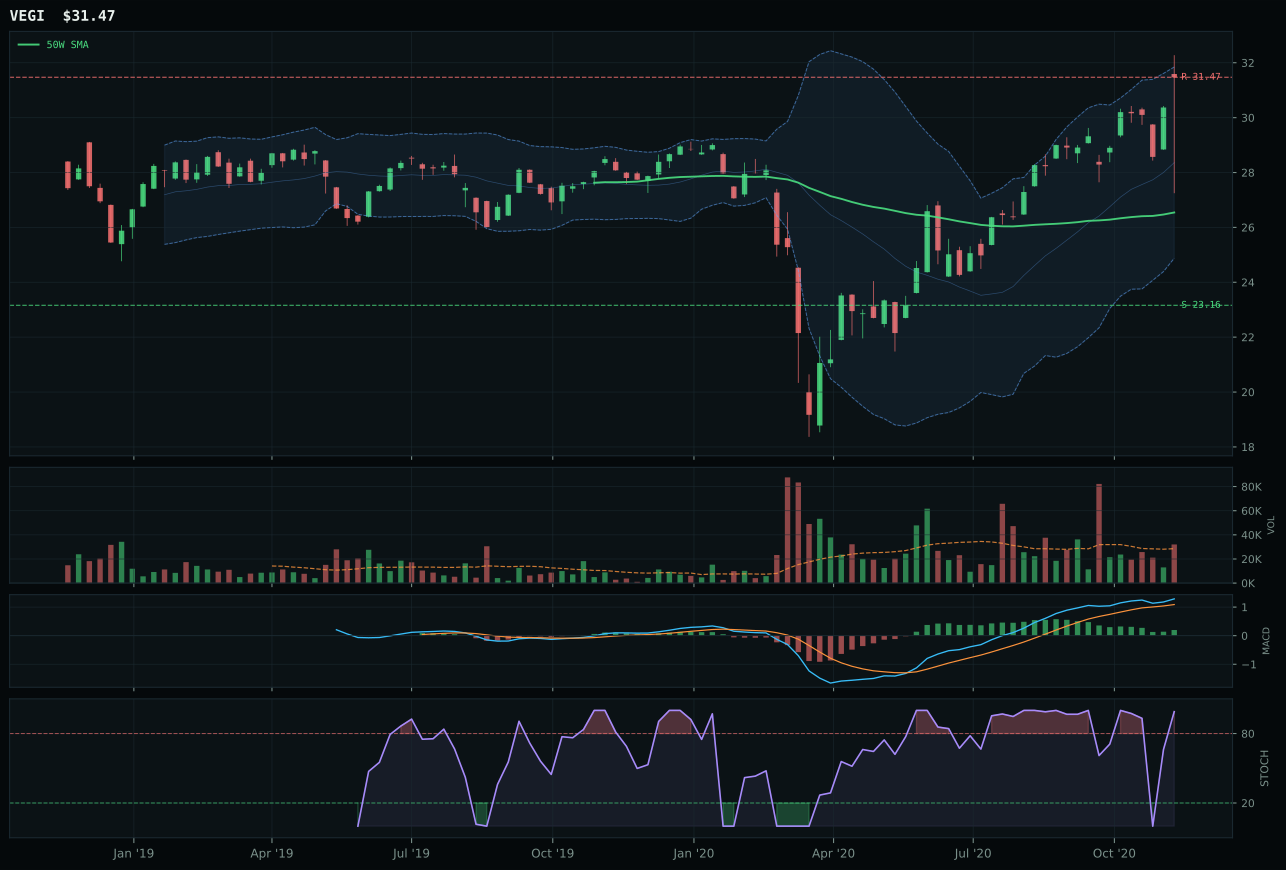
VEGI has a vertical extension profile with 5.0% 13-week relative strength versus SPY.
A failed hold above support would weaken the setup.
Tracked, but not top-2 eligible because: .
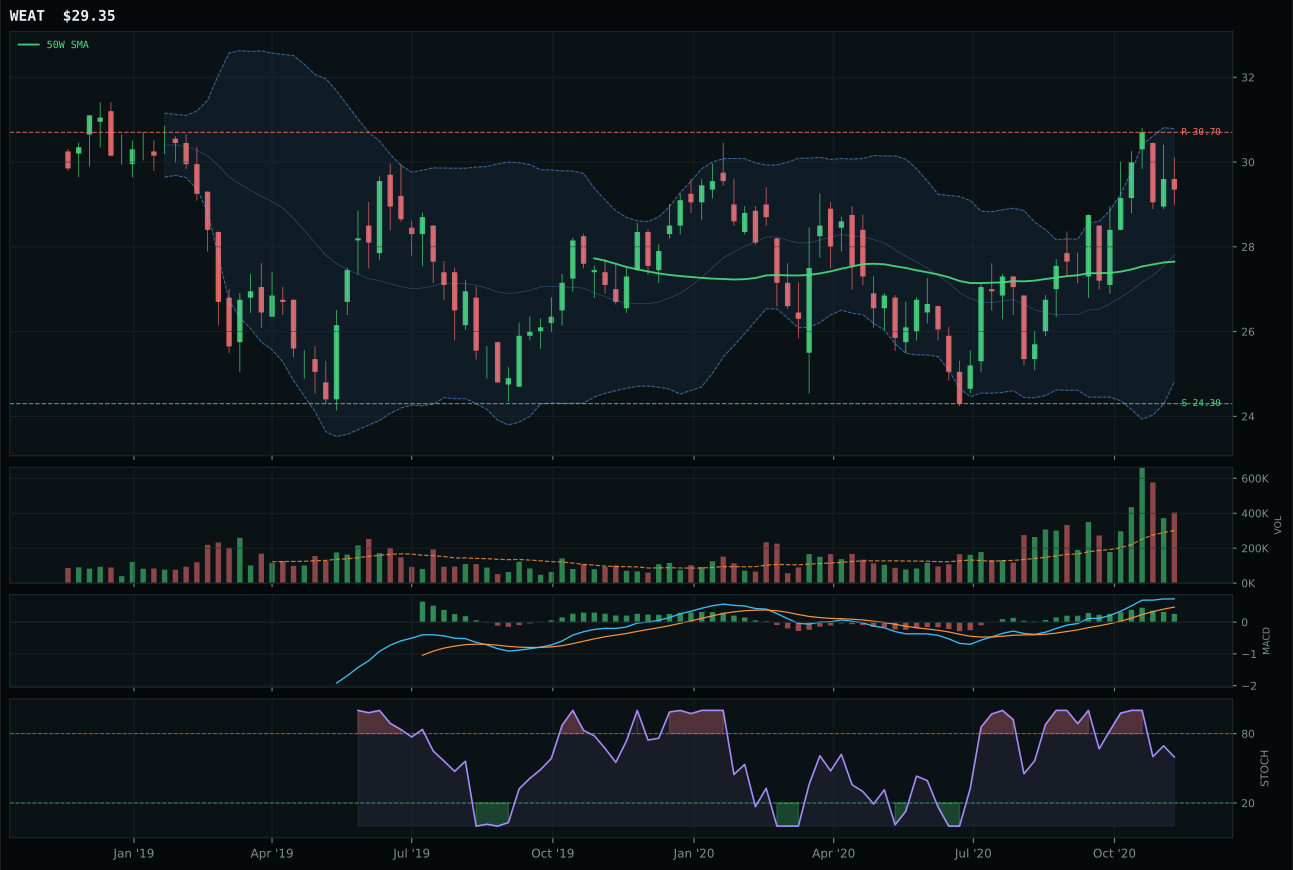
WEAT has a neutral structure profile with 7.9% 13-week relative strength versus SPY.
A failed hold above support would weaken the setup.
Tracked, but not top-2 eligible because: .
MOO wins because price sits above both the 50W and 200W with a shallow 0.2% positive 50W slope, and the 15.9% extension above the 50W is supported by exceptional volume confirmation at 4.56x the 20W average—the highest volume multiple in this week's survey. The structure is vertical extension with a trend score of 98.1, yet the timing score crashes to 32.0 because MACD is bullish but flattening and stochastic RSI reads overbought momentum at 1.00. This tells the story: the move is real and accumulation is aggressive, but momentum is stalling. VEGI lost on three fronts: weaker risk/reward (41.0 versus 46.5), less clean structure (76.7 versus 81.1), and inferior volume confirmation (above-average participation versus accumulation/confirmation at 4.56x). The thirteen-week return of 7.7% with 1.4% SPY-relative strength is modest, and category-relative strength is negative 3.6%, meaning MOO is outperforming the basket through structural conviction rather than broad category momentum.
Agriculture & Livestock earned 5% allocation as a tier-2 category despite a weak 37.4 final score, the lowest among all tier-2 recipients. The category's macro fit of 55.0 reflects cross-currents: real asset sponsorship at plus eight and positive commodity breadth at plus five are offset by disinflation pressure at minus eight, creating a neutral-to-slightly-bearish macro regime for agricultural inputs and livestock. MOO's trend score of 98.1 masks a timing score of just 32.0, meaning the setup is old and stretched after a 37.1% twenty-six-week run. The 5% allocation persists because the portfolio is building real-asset diversification in an altseason environment, and MOO's exceptional volume profile (4.56x) suggests informed buying despite the extended price. However, this is the weakest conviction slot in tier-2: it requires either a significant pullback to test the 50W near 55.08 to reset entry risk, or a break above the 72.82 resistance with fresh accumulation patterns to justify holding beyond a tactical position. In a Goldilocks macro regime without imminent inflation acceleration, agriculture remains a secondary allocation.
Traditional Energy — XLE
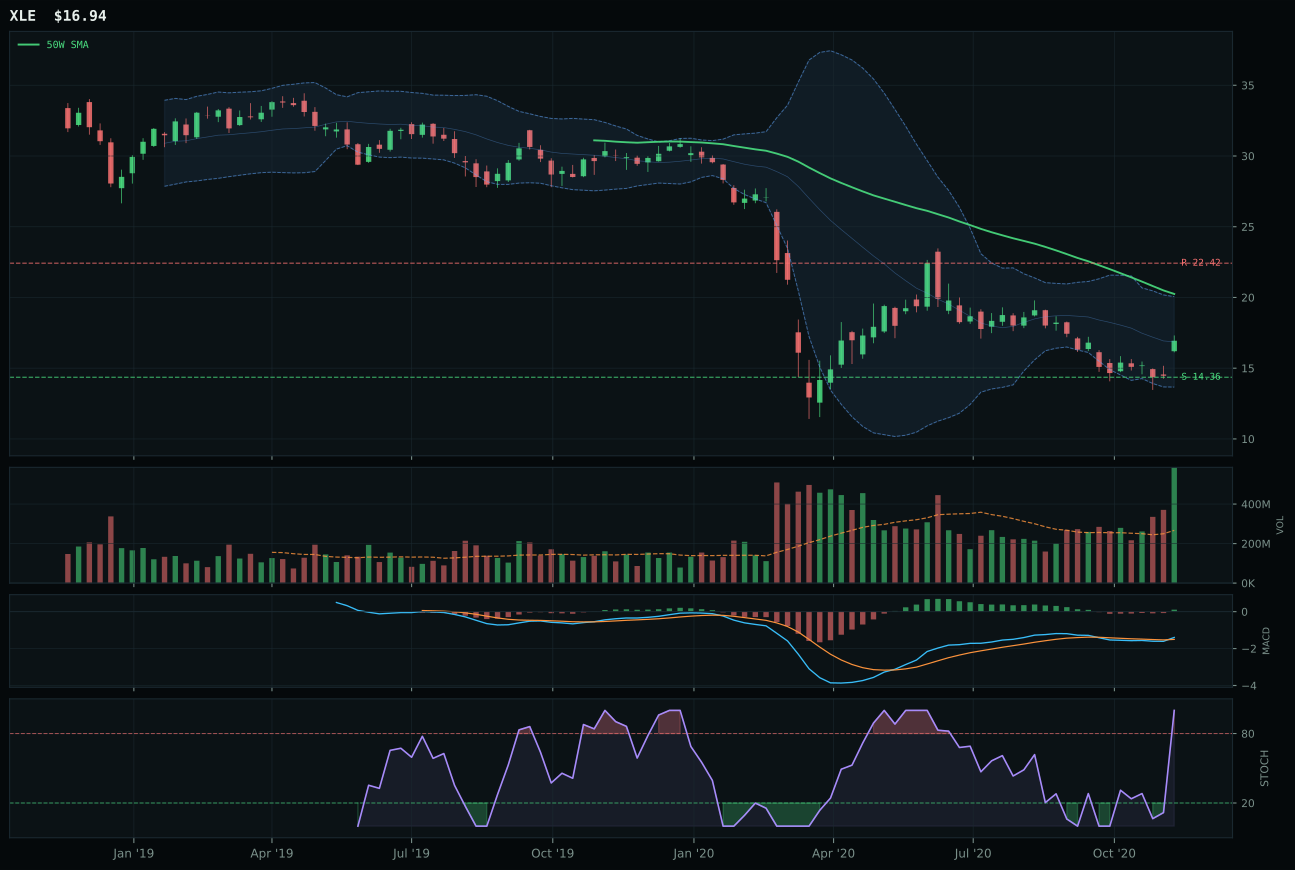
XLE has a neutral structure profile with -17.6% 13-week relative strength versus SPY.
Extension and support failure are the main tactical risks.
Tracked, but not top-2 eligible because: structurally broken.
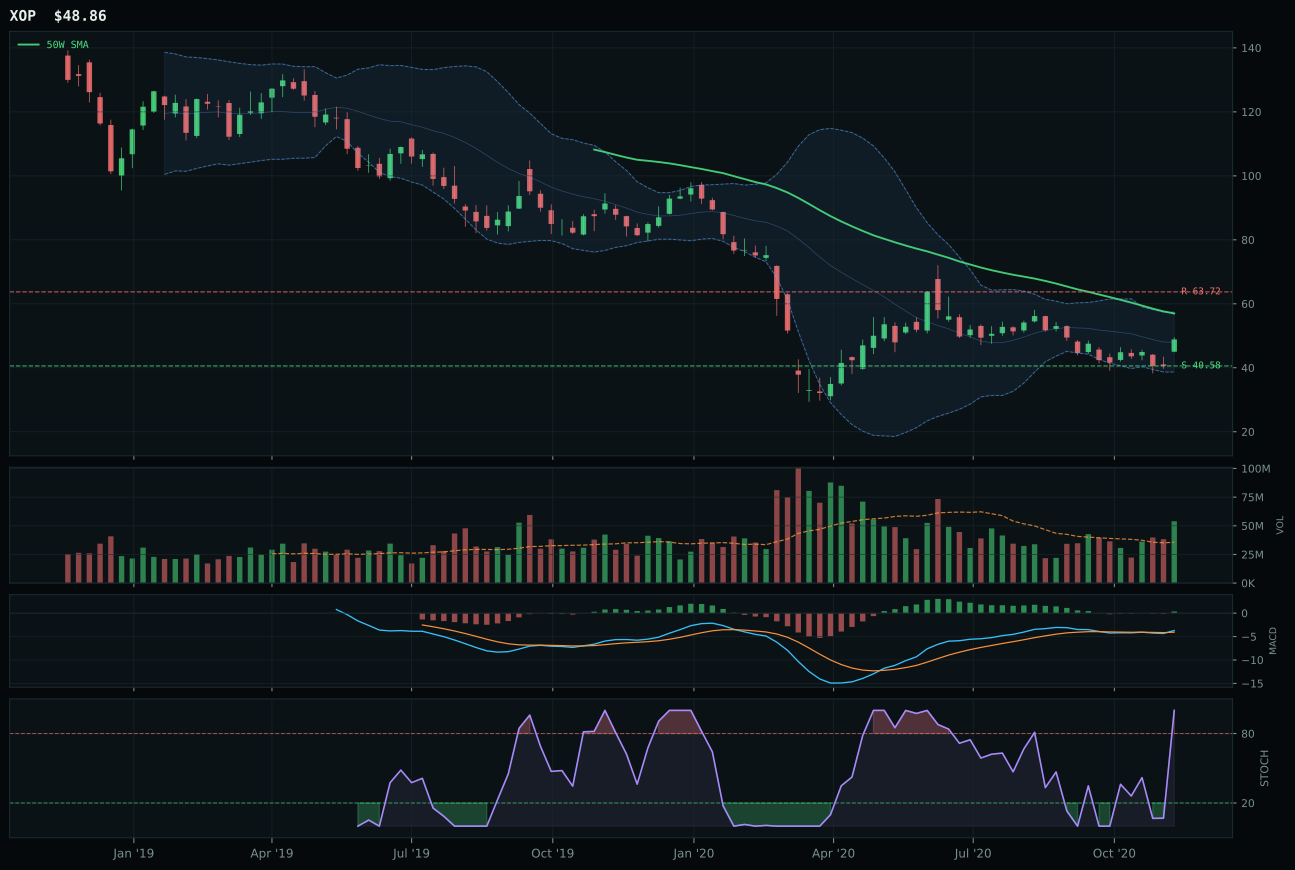
XOP has a neutral structure profile with -19.3% 13-week relative strength versus SPY.
Extension and support failure are the main tactical risks.
Tracked, but not top-2 eligible because: structurally broken.
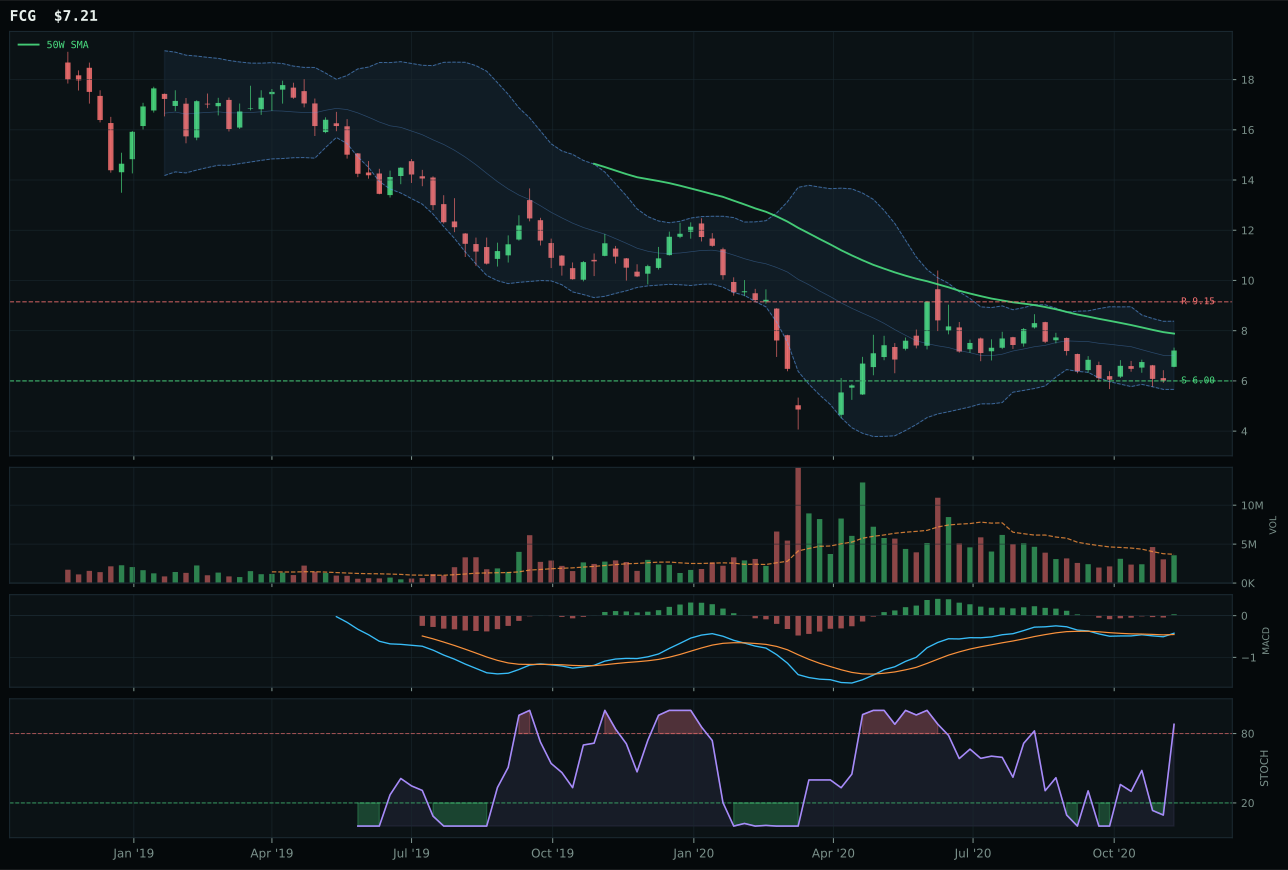
FCG has a neutral structure profile with -19.4% 13-week relative strength versus SPY.
Extension and support failure are the main tactical risks.
Tracked, but not top-2 eligible because: structurally broken.
XLE wins the category and earns 5% allocation despite a final score of 0.0—an outlier outcome reflecting an eligibility filter failure rather than fundamental technical weakness. Price trades below the 50W at negative 16.3%, below the 200W, with a deteriorating 50W slope of negative 1.2% and negative 17.6% relative strength versus SPY, confirming that energy has rolled over sharply. The thirteen-week return of negative 11.3% pairs with a momentum confirmation score of just 54.5, yet MACD is bullish and improving while stochastic RSI reads overbought momentum at 1.00—a classic dead-cat-bounce setup. Risk/reward, however, is exceptional at 74.5 out of 100: upside to resistance at 22.42 is severely constrained at negative 24.4%, but downside to support at 14.36 is only 18.0%, meaning the asymmetry favors buyers who believe in a reversal. XOP lost on risk/reward (55.6 versus 74.5) and structure cleanliness (41.7 versus 43.8), but both are structurally broken category members that scored below the hard filter thresholds. XLE's above-average volume at 2.23x suggests accumulation, but the price action is too damaged to justify standard allocation.
Traditional Energy earned 5% allocation despite a 0.0 final score because the reasoned ETF proof order (XLE 42.0, XOP 41.7, FCG 32.6) qualified XLE for tier-2 status based on its superior risk/reward profile and volume accumulation pattern. The category's 40.0 macro fit reflects real-asset sponsorship at plus seven offset by disinflation pressure at minus ten and credit stress at minus seven, creating a net-negative macro environment for fossil fuels in a Goldilocks regime. The eligibility filter failure—likely triggered by the negative 16.3% distance below the 50W and trend score of 30.0—prevents standard top-2 or tier-1 consideration, yet the portfolio allocates 5% anyway as a tactical, value-oriented position. XLE at negative 17.6% SPY-relative strength represents mean-reversion potential rather than momentum confirmation: the thirteen-week return of negative 11.3% combined with four-week return of positive 12.2% suggests a bounce is underway, and the 74.5 risk/reward reading reflects belief that energy support is holding at 14.36. This is a speculative, value-based allocation; to remove the filter and upgrade to standard tier-2, XLE would need to break above the 50W with three-week or four-week confirmation, or demonstrate SPY-relative strength turning positive.
Nuclear Energy — URA
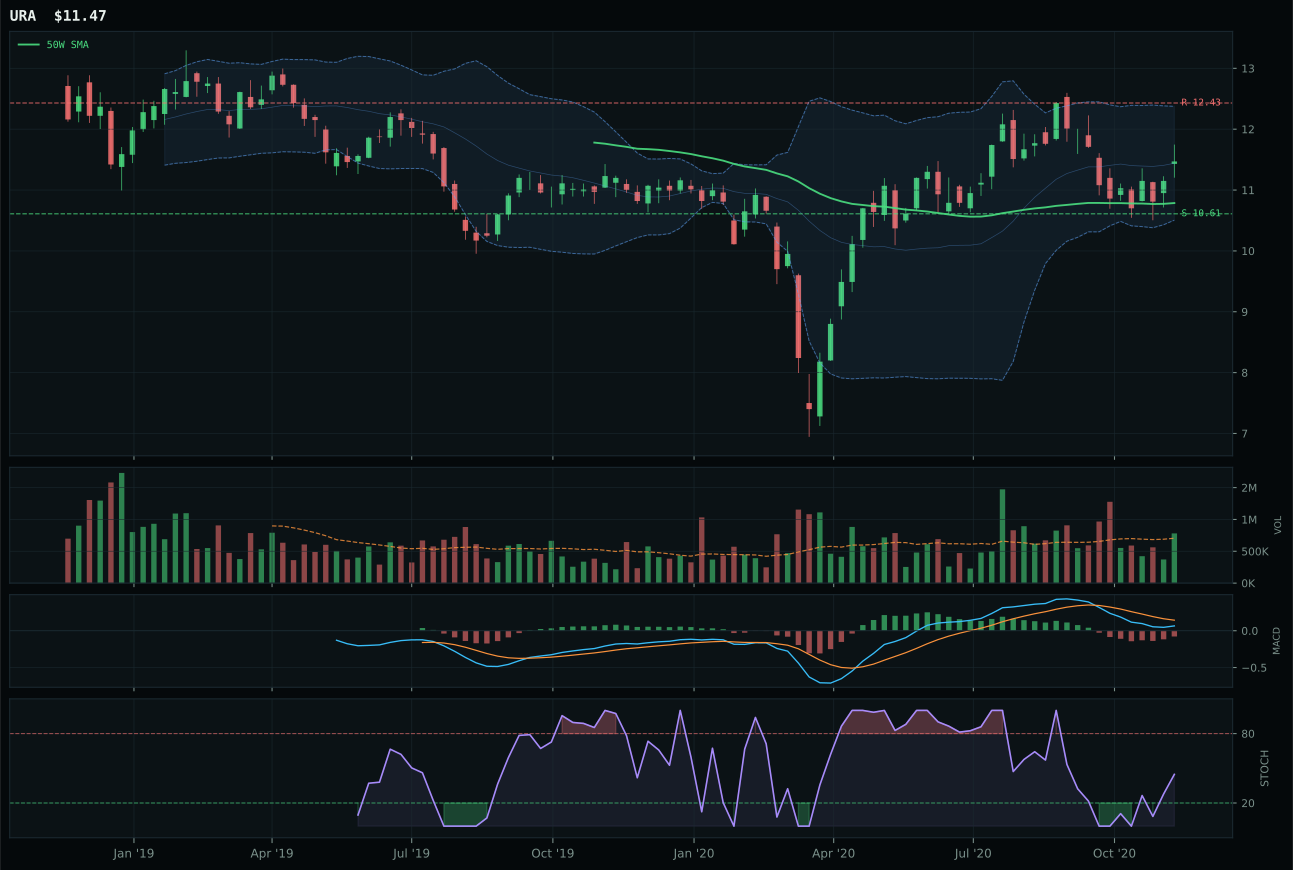
URA has a neutral structure profile with -8.9% 13-week relative strength versus SPY.
A failed hold above support would weaken the setup.
Tracked, but not top-2 eligible because: .

URNM has a neutral structure profile with -12.4% 13-week relative strength versus SPY.
A failed hold above support would weaken the setup.
Tracked, but not top-2 eligible because: .
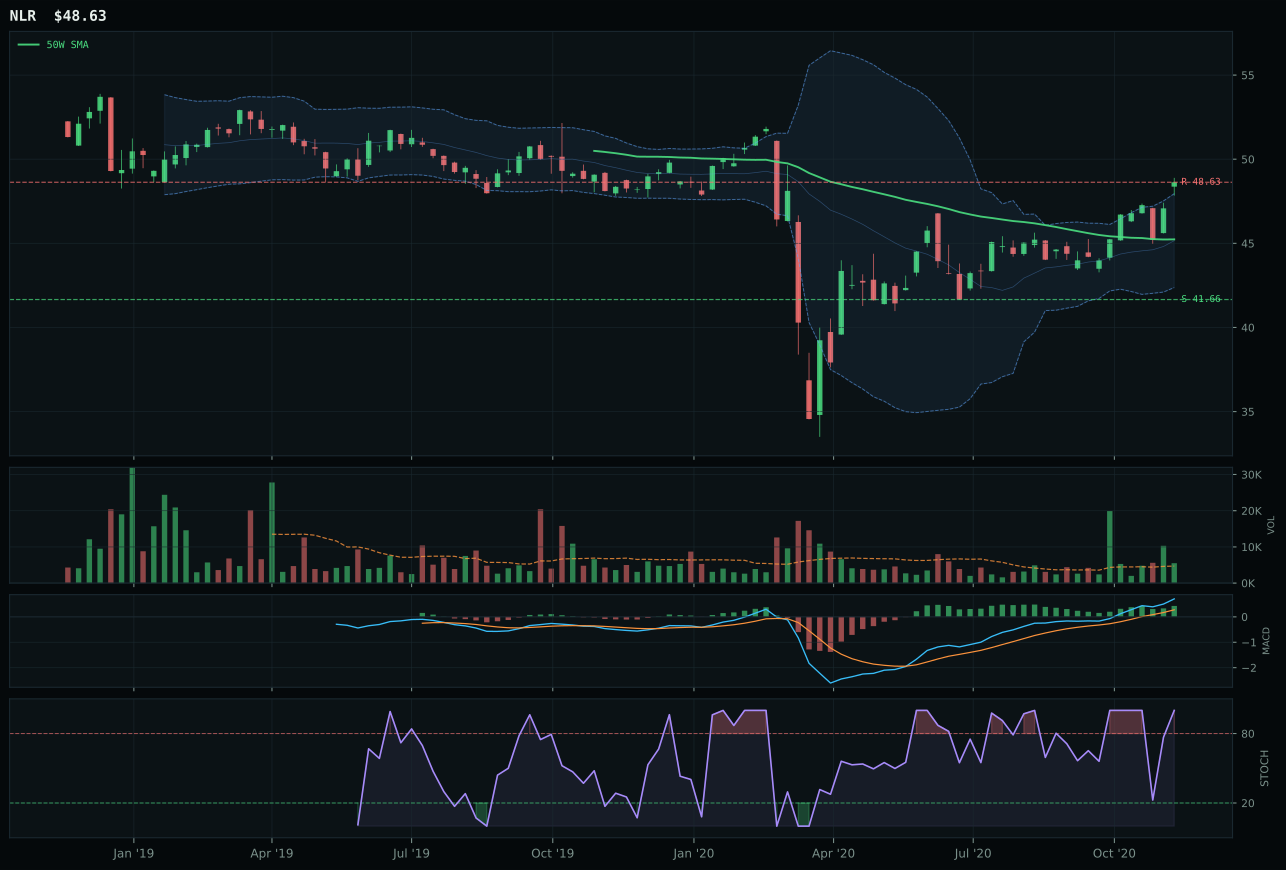
NLR has a neutral structure profile with 1.2% 13-week relative strength versus SPY.
A failed hold above support would weaken the setup.
Tracked, but not top-2 eligible because: .
URA wins the category and earns 0% allocation—again, a technical win coupled with an eligibility failure. Price trades above the 50W by 6.3%, below the 200W, with a shallow 0.1% slope and negative 8.9% relative strength versus SPY, indicating nuclear is not leading the broad market move. The thirteen-week return of negative 2.5% is weak, and category-relative strength is flat at 0.0%, meaning URA is performing in line with URNM and NLR peers rather than demonstrating outperformance. The critical technical strength is timing: URA's 83.0 timing score reflects the 6.3% compression to the 50W, bullish but improving MACD, and rising-mid-zone stochastic RSI reading of 0.45—a setup that suggests buyers are returning after selling pressure. URNM lost on structure cleanliness (69.9 versus 71.0) and category-relative strength (negative 3.6% versus 0.0%), but both carry the same eligibility filter failure. The reasoned proof order (URNM 45.0, URA 45.0, NLR 45.0) shows a three-way tie for technical quality, broken by URA's slight structure edge and neutral relative-strength positioning.
Nuclear Energy earned 0% allocation despite a 35.1 final score and URA's technical coherence, because the category failed the eligibility filter and ranked 9th or 10th in this week's hierarchy. The category's 57.0 macro fit reflects real-asset sponsorship at plus seven and AI growth support at plus five (due to electricity demand from data centers), offset by credit stress at minus five. In a Goldilocks regime, nuclear lacks the immediate momentum of semiconductors or industrial metals, and its secular bull case—clean energy and baseload generation—is already priced into utilities and infrastructure ETFs like IGF, which earned top-2 status with superior timing and accumulation. URA's negative 8.9% SPY-relative strength and negative 2.5% thirteen-week return mean nuclear is not participating in the current risk-on environment; it is a candidate only for investors building long-term hedges against inflation or energy supply shocks. To earn allocation, this category would require either a macro shock that accelerates the transition thesis (policy acceleration, commodity crisis) or a break above the 12.43 resistance level coupled with stochastic RSI sustaining above 0.6 and MACD crossing above zero—technical signals that would reset the category from a lagging specialty position to a genuine growth candidate.
Precious Metals — GLD
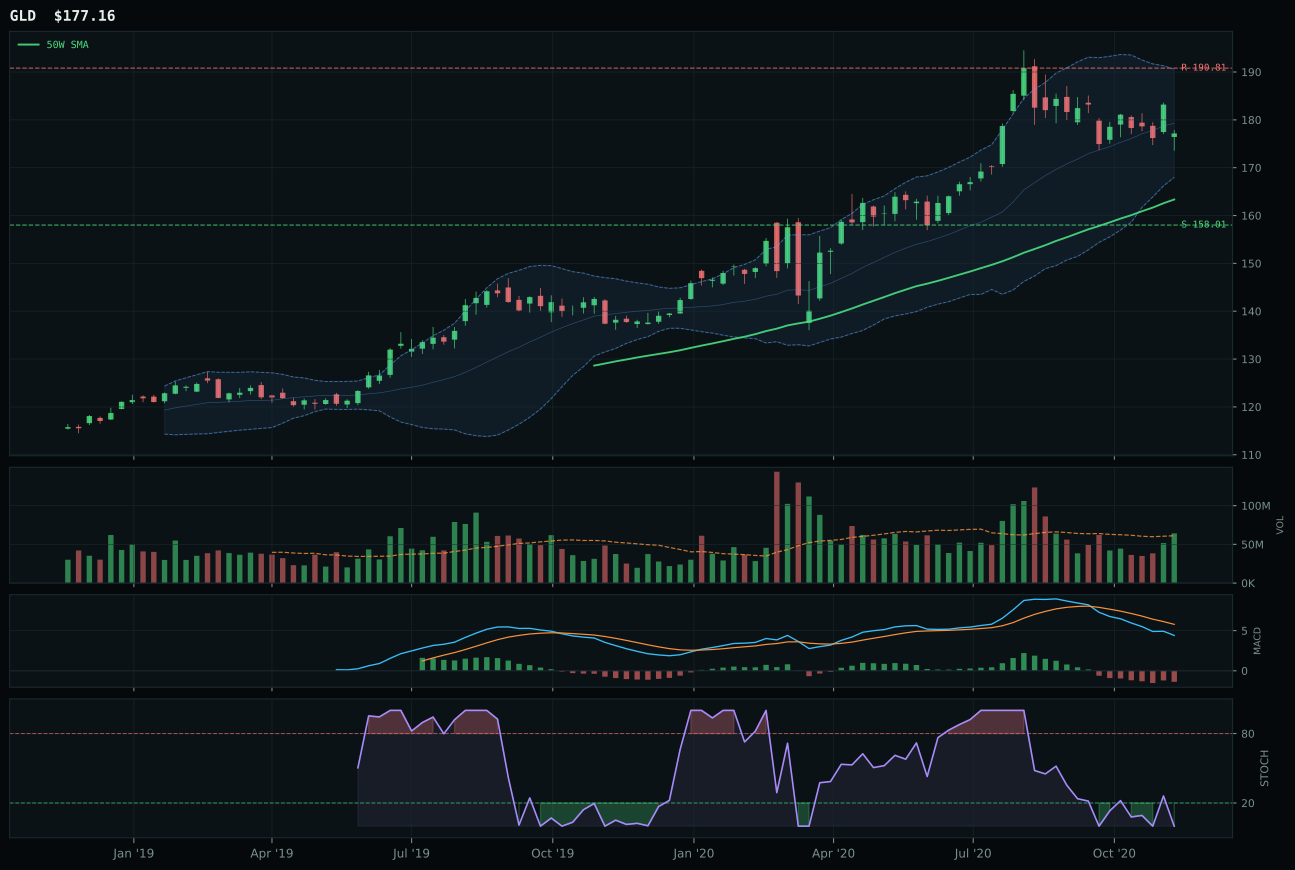
GLD has a neutral structure profile with -9.3% 13-week relative strength versus SPY.
A failed hold above support would weaken the setup.
Actionable but governed by invalidation levels.
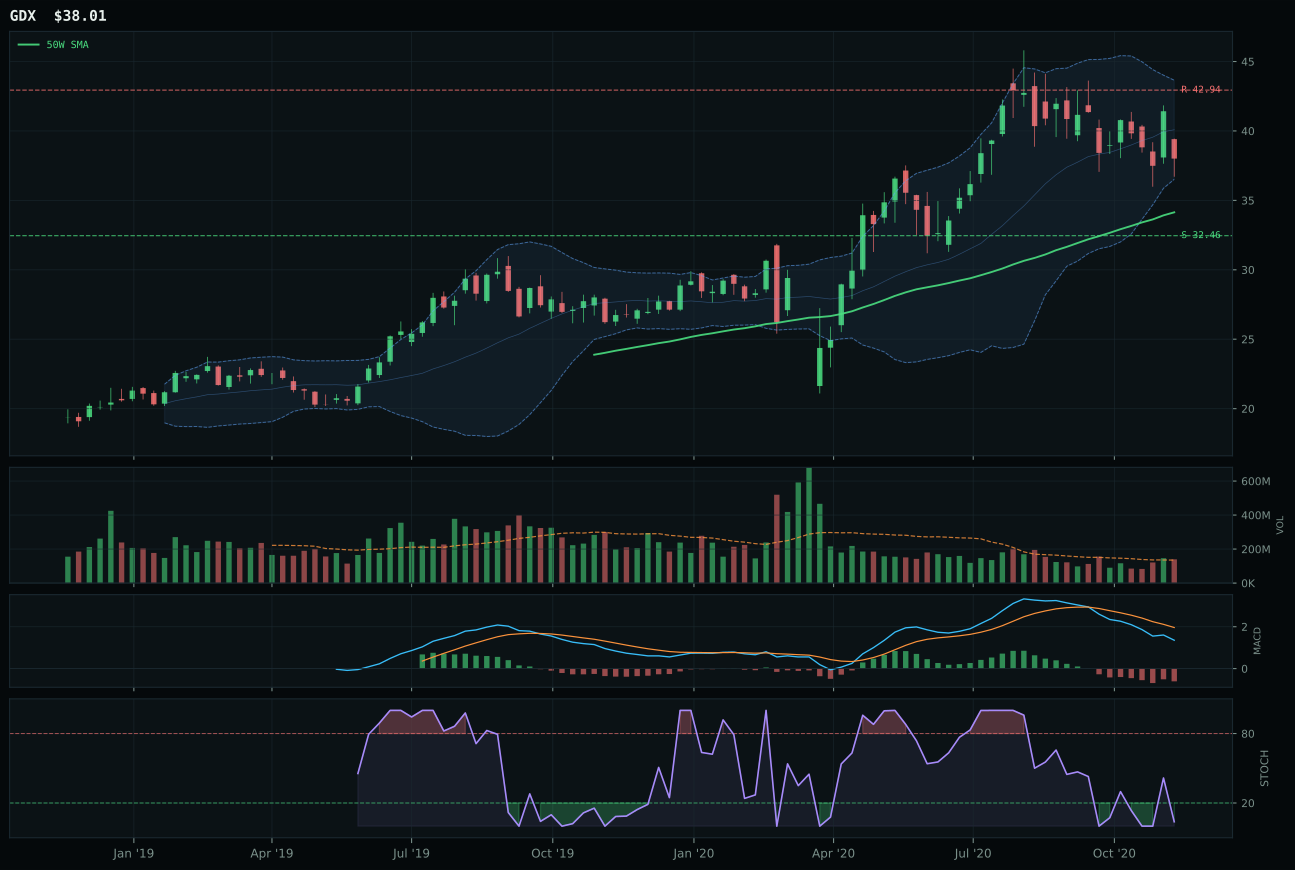
GDX has a neutral structure profile with -12.1% 13-week relative strength versus SPY.
A failed hold above support would weaken the setup.
Actionable but governed by invalidation levels.
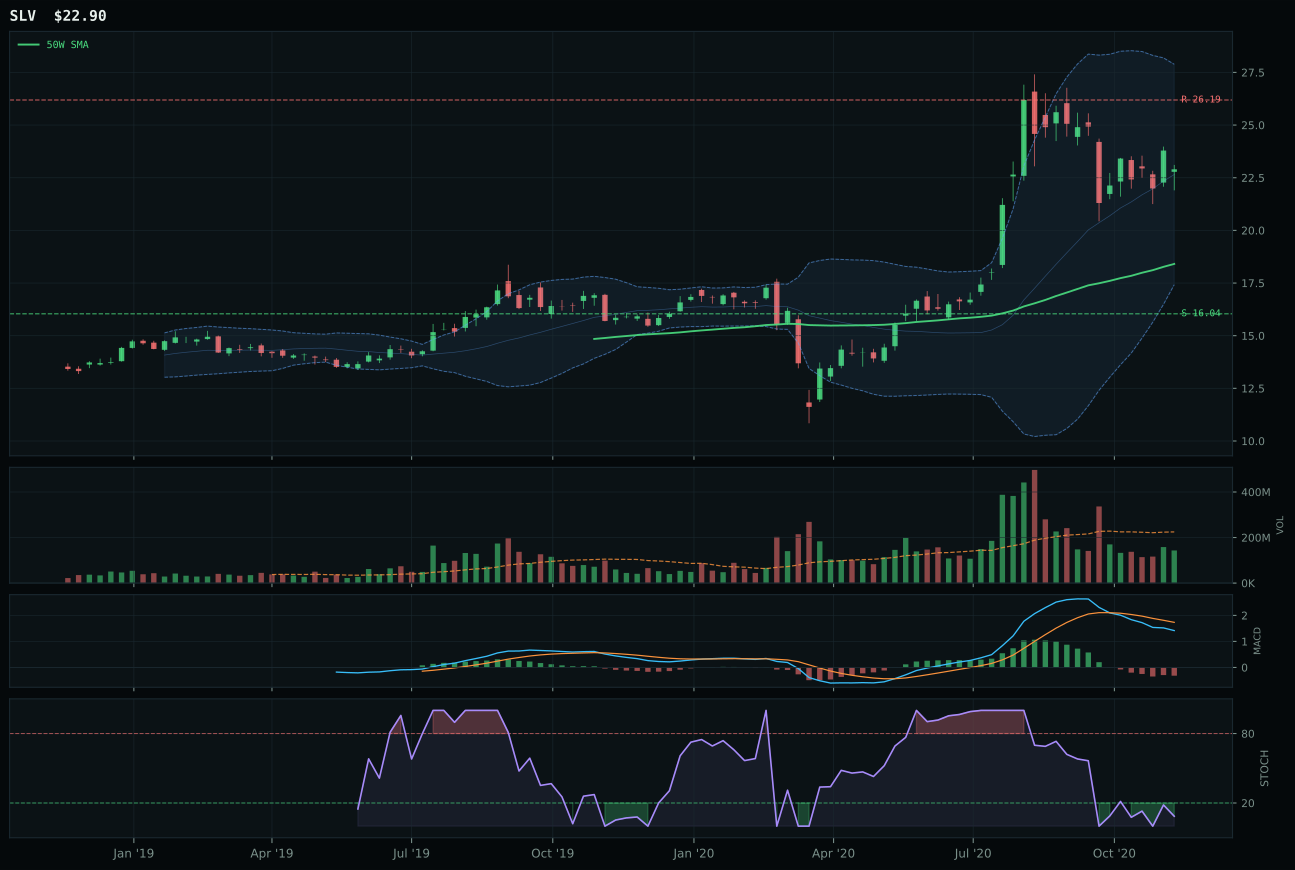
SLV has a vertical extension profile with -13.1% 13-week relative strength versus SPY.
A failed hold above support would weaken the setup.
Actionable but governed by invalidation levels.
GLD wins the category but earned 0% portfolio allocation—a critical distinction that reveals why metals are excluded this week despite technical coherence. Price trades above the 50W and 200W with a 0.5% slope and 8.5% distance to the 50W, a neutral-to-tight setup, but the thirteen-week return of negative 2.9% paired with negative 9.3% relative strength versus SPY tells the full story: gold has rolled over while equities rallied. MACD is bearish and weakening, stochastic RSI sits at oversold extremes at 0.00, and momentum confirmation scores just 20.7 out of 100—the worst reading in this week's survey. GDX lost to GLD on risk/reward (42.1 versus 55.6) and structure cleanliness (66.5 versus 74.4), but both funds are fighting the same macro headwind: disinflation pressure and defensive rotation are active, yet liquidity expansion is also active, which typically benefits risk assets over hedges. The category-relative strength of 2.9% for GLD versus 0.0% for GDX represents a within-category rotation, not absolute strength.
Precious Metals earned 0% allocation, ranking 9th or 10th in this week's category hierarchy and excluded entirely from the portfolio despite GLD's 44.8 reasoned technical score. The category's 33.9 final score reflects the tension between its macro fit (61.0 with defensive rotation at plus seven and disinflation at plus six) and technical deterioration (trend 68.1, momentum confirmation 20.7). In a Goldilocks regime with active liquidity expansion, metals cannot compete with AI semiconductors, infrastructure, or emerging-market commodity plays that offer both real-asset exposure and positive momentum. GLD's thirteen-week return of negative 2.9% and negative 9.3% SPY-relative strength confirm that gold is being deselected as a hedge: investors are comfortable enough to own equities without insurance. The category would require either a material deterioration in macro conditions (credit stress acceleration, equity volatility spike) or a technical reversal—MACD crossing above its trend line with volume participation climbing above 1.25x—to earn even a 5% allocation slot. For now, precious metals remain structurally excluded in an environment where growth and real assets are both accessible.