
2020-11-06
Informational purposes only. The content in this report, including allocations, analysis, and commentary, is provided solely for informational and educational purposes. It does not constitute financial advice, investment advice, trading advice, or any other type of advice. Past performance does not guarantee future results. Always conduct your own research and consult a qualified financial professional before making investment decisions.
Some tracked tickers were excluded due to missing live weekly price data: SGOV: Historical cache SGOV has only 23 usable weekly bars
Weekly Allocation
| Ticker | Category | Weight | Role |
|---|---|---|---|
| FSOL | 50% | Overlay | |
| COPX | Industrial Metals | 10% | Top-2 (10%) |
| SMH | AI | 10% | Top-2 (10%) |
| IEMG | Emerging Markets | 5% | Tier-2 (5%) |
| IGV | Technology | 5% | Tier-2 (5%) |
| XLU | Utilities & Infrastructure | 5% | Tier-2 (5%) |
| MOO | Agriculture & Livestock | 5% | Tier-2 (5%) |
| XAR | Defense & Aerospace | 5% | Tier-2 (5%) |
| GLD | Precious Metals | 5% | Tier-2 (5%) |
Trade Instructions — Monday Open
Sell the tranche from 2020-10-09 (completing its 4-week hold). Buy the new tranche. Instructions show net portfolio changes — same-asset positions cancel, weight changes show the delta.
| Action | Ticker | Instruction |
|---|---|---|
| SELL | PAVE | Sell 67% of PAVE position (reduce 3.75% → 1.25%) |
| SELL | INDA | Sell 50% of INDA position (reduce 2.50% → 1.25%) |
| SELL | REMX | Sell 33% of REMX position (reduce 3.75% → 2.50%) |
| BUY | COPX | Buy COPX — 50.00% of freed cash (adds 2.50% to portfolio) |
| BUY | XLU | Buy XLU — 25.00% of freed cash (adds 1.25% to portfolio) |
| BUY | IEMG | Buy IEMG — 25.00% of freed cash (adds 1.25% to portfolio) |
Current Portfolio After Trade
Combined holdings across all 4 active tranches. Each tranche is 25% of the portfolio.
| Ticker | % of Portfolio | Weight Bar |
|---|---|---|
| FSOL | 50.00% | |
| SMH | 8.75% | |
| COPX | 6.25% | |
| IGV | 5.00% | |
| MOO | 5.00% | |
| XAR | 5.00% | |
| IEMG | 5.00% | |
| XLU | 3.75% | |
| REMX | 2.50% | |
| GLD | 2.50% | |
| PAVE | 1.25% | |
| INDA | 1.25% | |
| XLE | 1.25% | |
| XLK | 1.25% | |
| SLV | 1.25% |
Macro Regime — Goldilocks
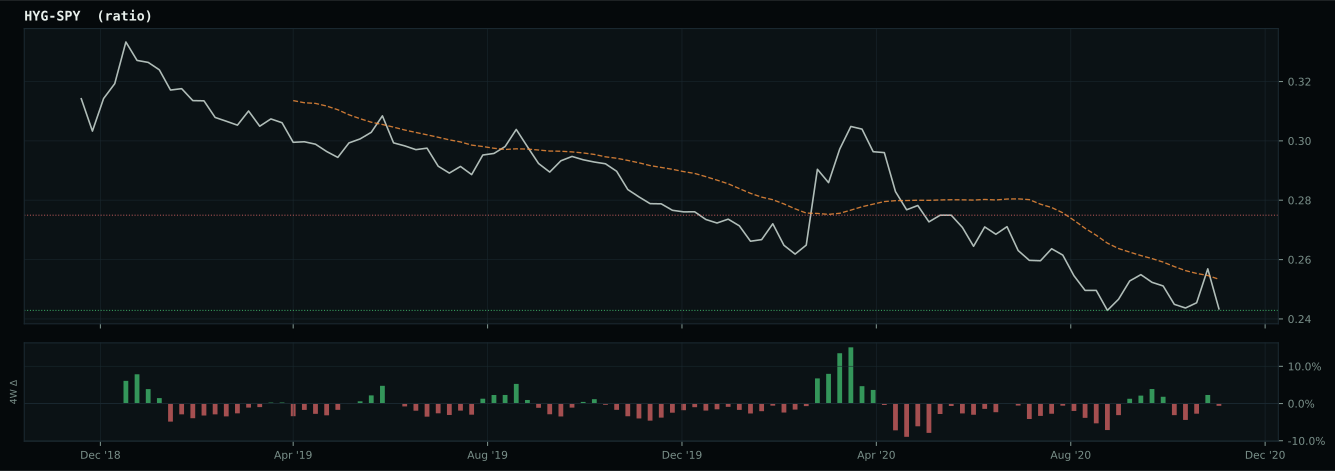
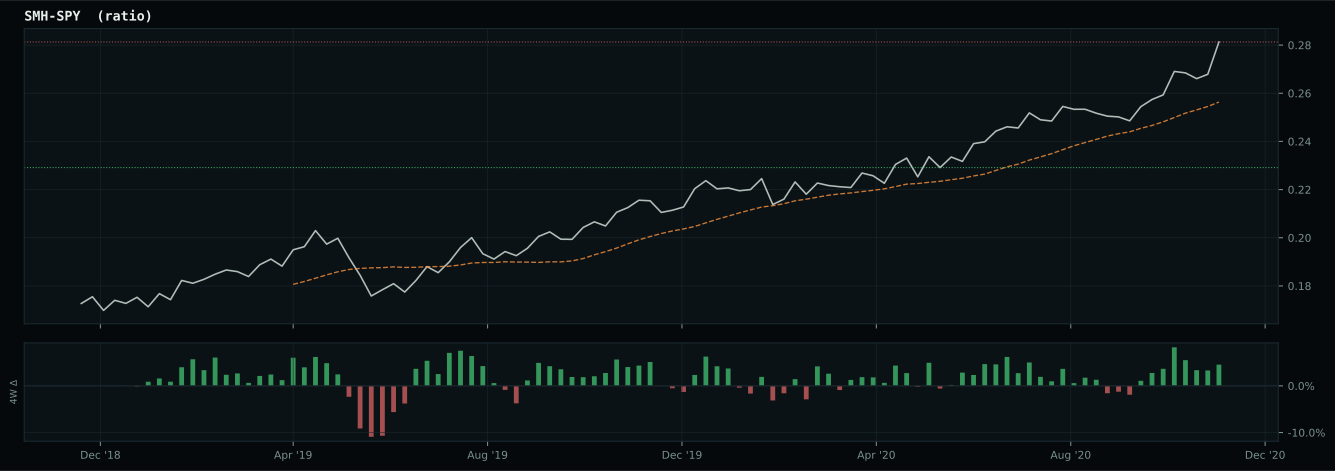
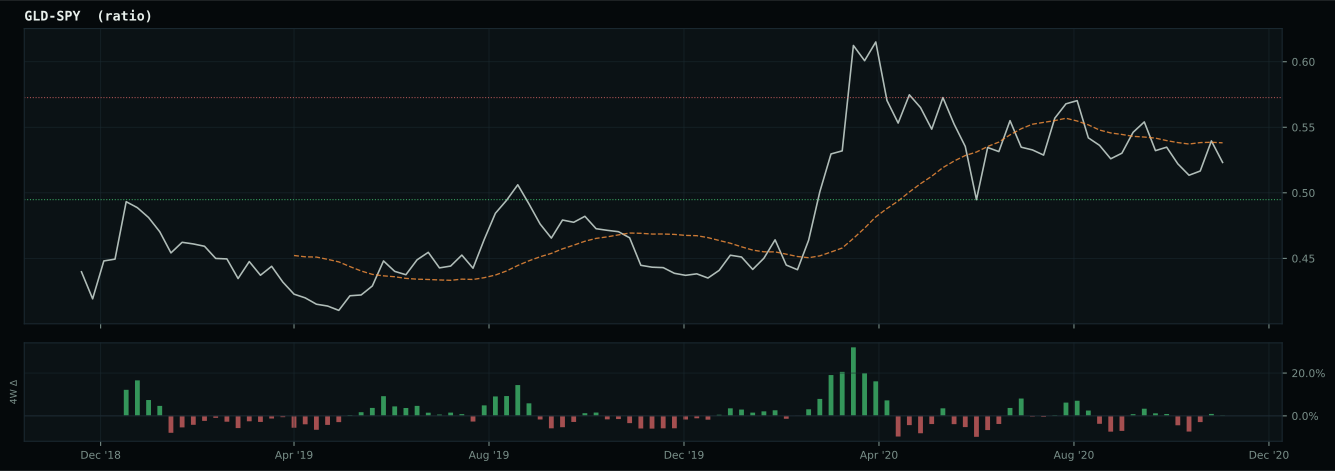
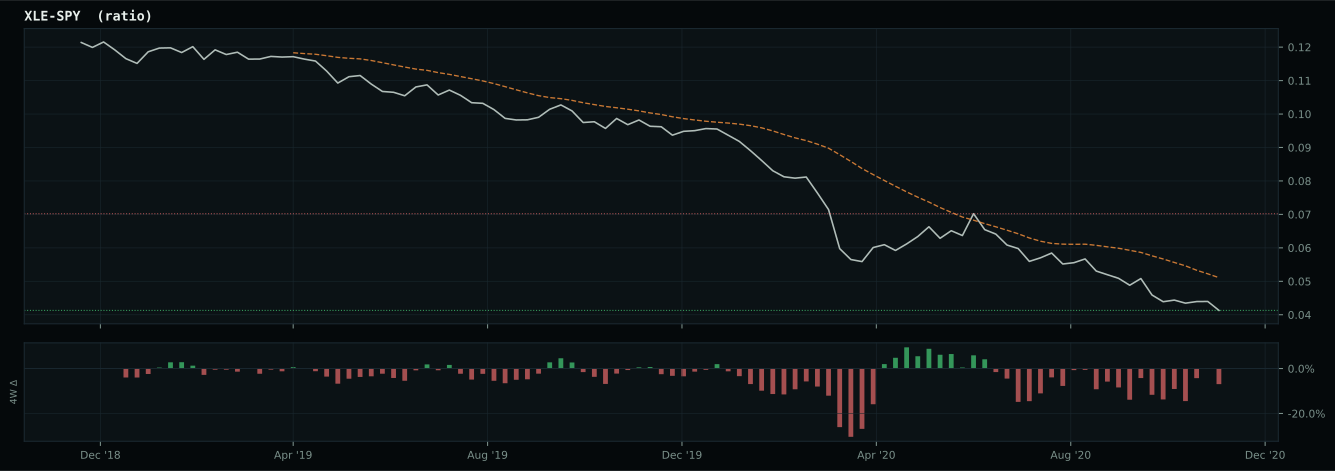
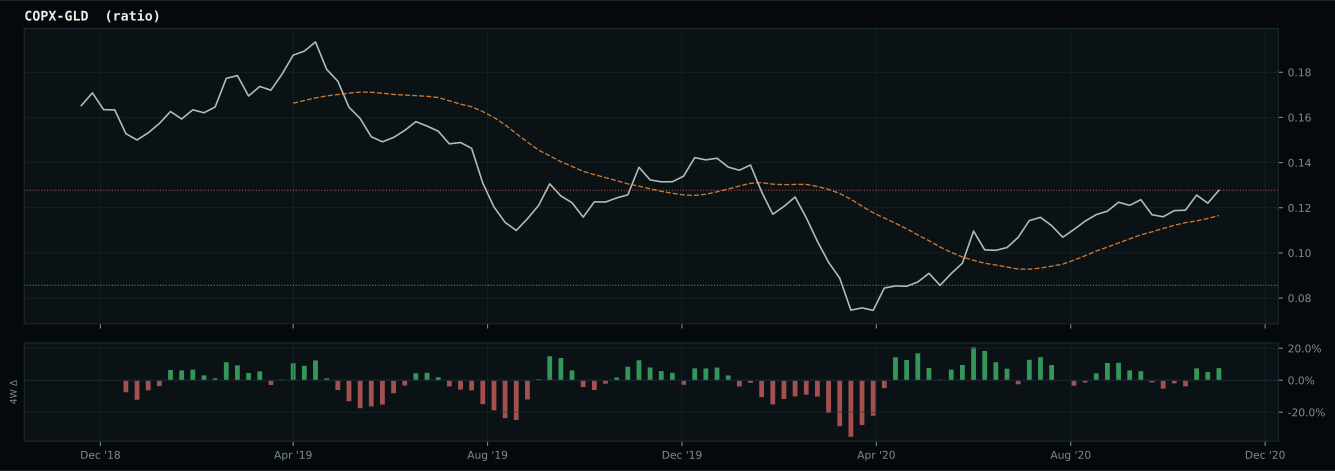
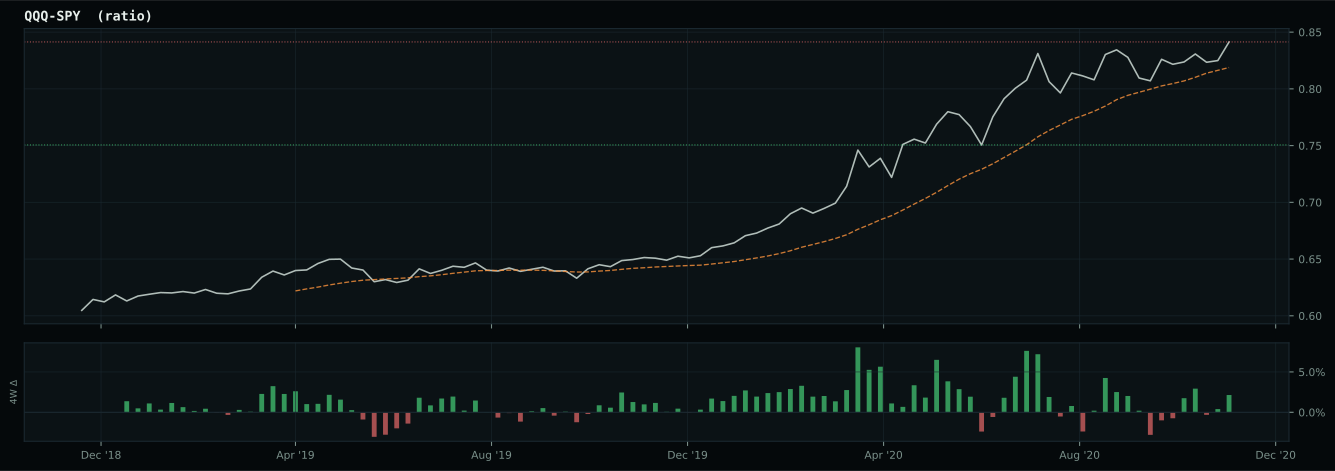
Macro Evidence Charts
Market-implied signals behind the macro regime scores. Each ratio compares two assets; the direction and slope of the ratio is what the macro engine reads.
Crypto Regime — AltSeason
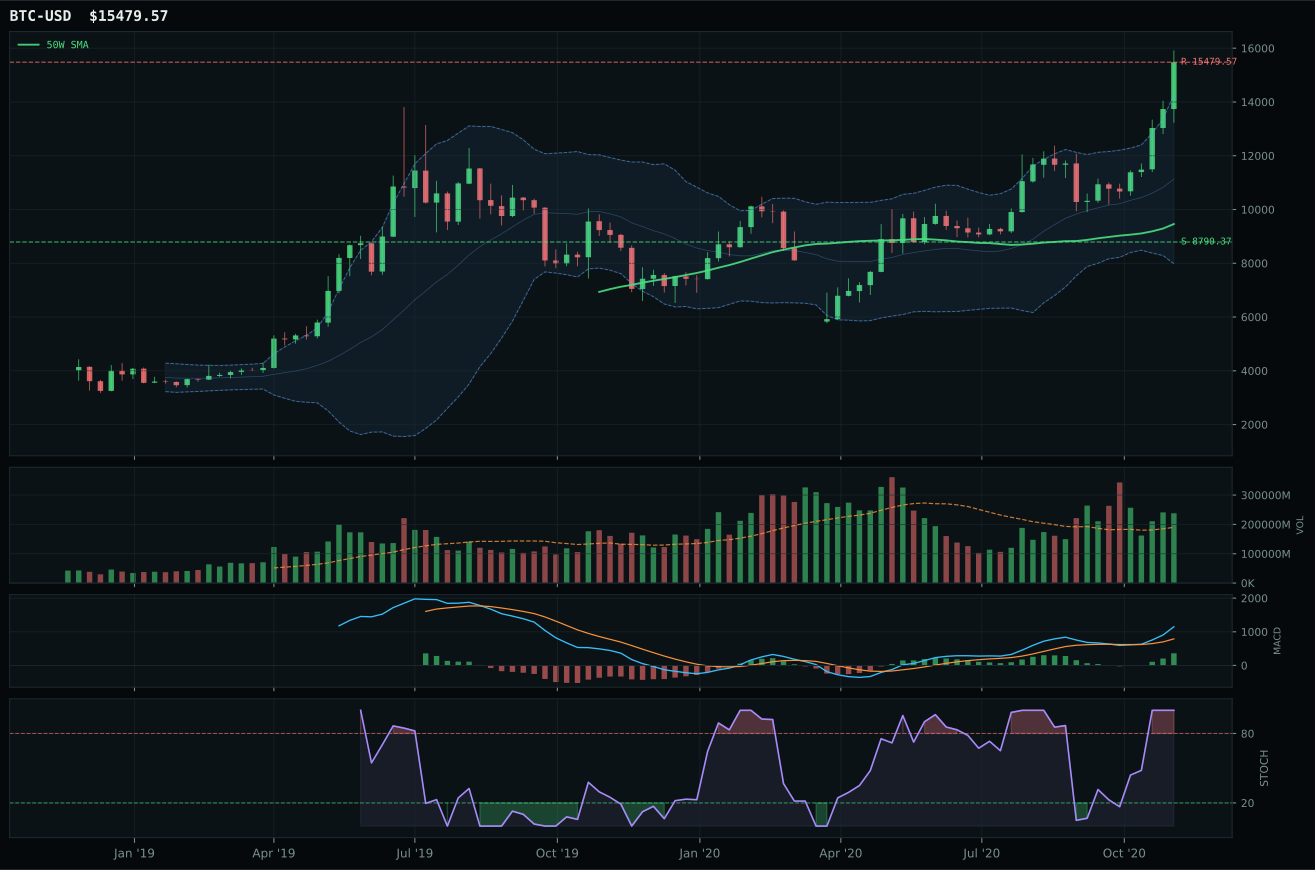
post-touch structure is too wide to count as a range; max/min close ratio is 2.55
TrendBTC confirmed: 2 consecutive closes above rising/flat 50W SMA
all available AltSeason conditions pass; missing optional confirmations skipped

Category Rankings
| Rank | Category | Winner | Score | Alloc | 4W Ret | Peers (4W) |
|---|---|---|---|---|---|---|
| 1 | Industrial Metals | COPX | 75.7 | 20% | +18.61% | REMX +17.8% · PICK +21.0% |
| 2 | AI | SMH | 71.2 | 20% | +9.41% | BOTZ +4.5% · AIQ +2.4% |
| 3 | Emerging Markets | IEMG | 70.8 | 10% | +3.11% | INDA +3.8% · ILF +16.8% |
| 4 | Technology | IGV | 59.9 | 10% | +3.87% | XLK +1.6% · CIBR +7.2% |
| 5 | Utilities & Infrastructure | XLU | 58.5 | 10% | -5.74% | PAVE +3.3% · IGF +2.7% |
| 6 | Agriculture & Livestock | MOO | 37.7 | 10% | +3.41% | WEAT -5.6% · VEGI +5.3% |
| 7 | Defense & Aerospace | XAR | 33.7 | 10% | +19.33% | ROKT +12.6% · ITA +13.0% |
| 8 | Precious Metals | GLD | 33.5 | 10% | -2.19% | GDX -10.4% · SLV -2.3% |
| 9 | Nuclear Energy | URA | 28.1 | 0% | +18.90% | NLR +0.4% · URNM +21.8% |
| 10 | Traditional Energy | XLE | — | 0% | +23.92% | FCG +40.2% · XOP +33.4% |
Industrial Metals — COPX
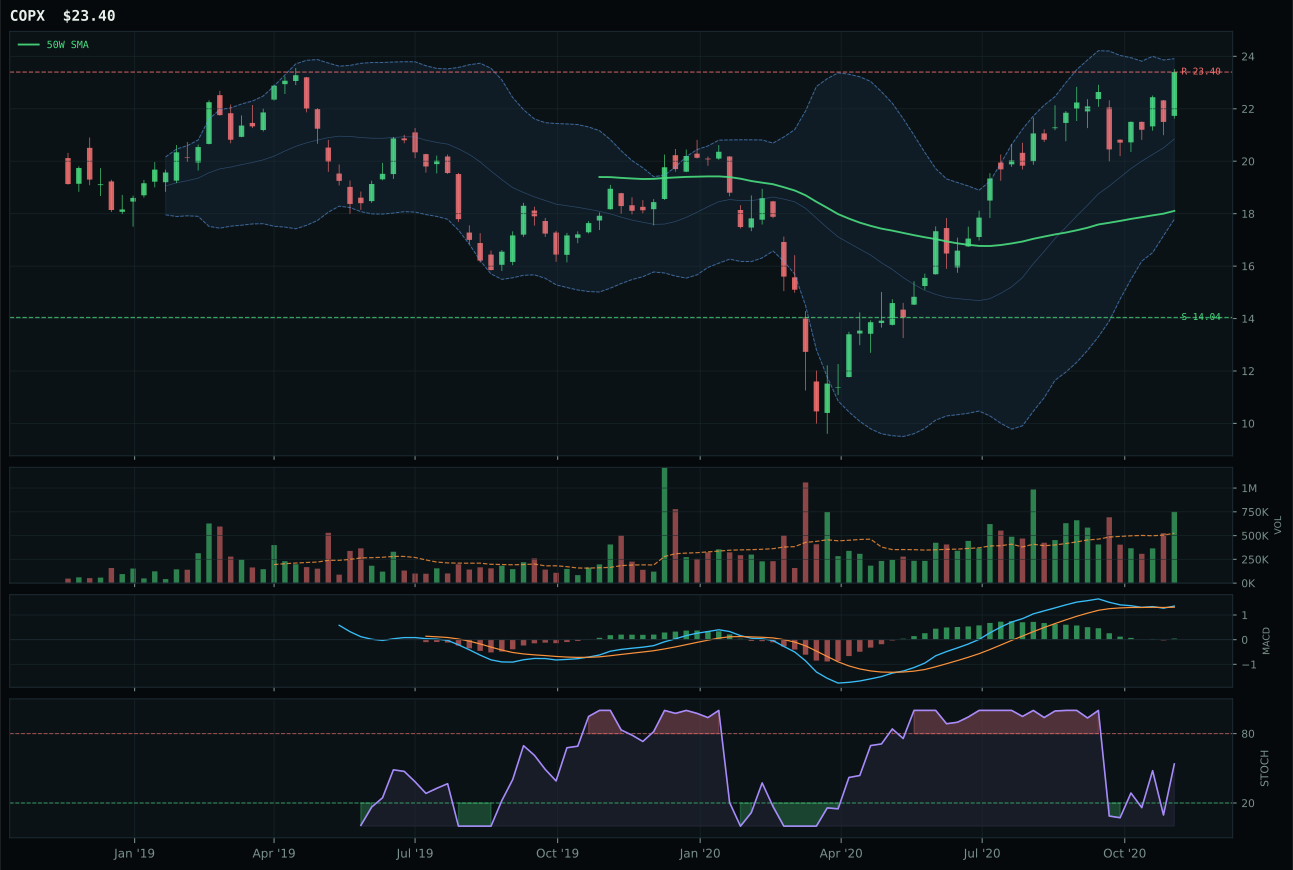
COPX has a vertical extension profile with 6.5% 13-week relative strength versus SPY.
A failed hold above support would weaken the setup.
Actionable but governed by invalidation levels.
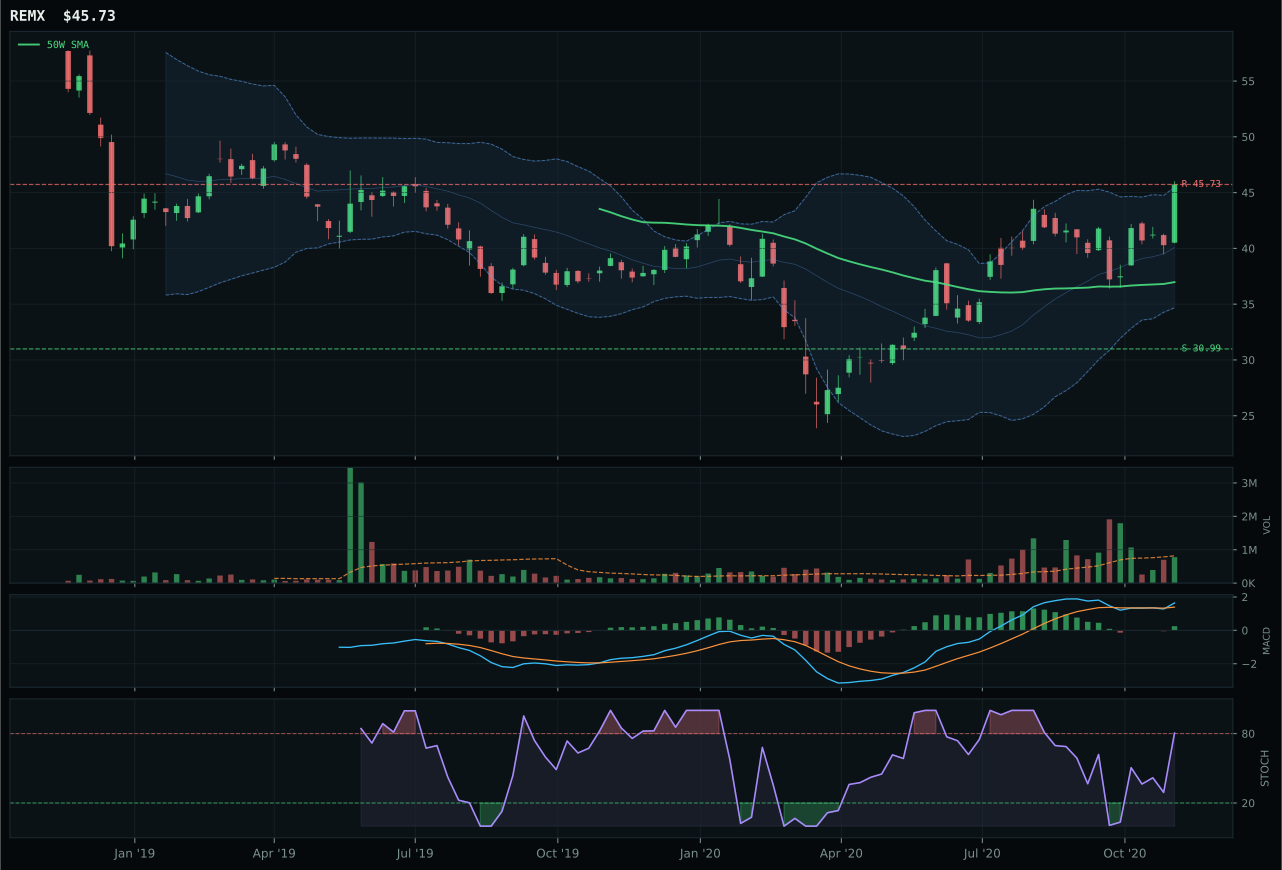
REMX has a vertical extension profile with 0.3% 13-week relative strength versus SPY.
A failed hold above support would weaken the setup.
Actionable but governed by invalidation levels.
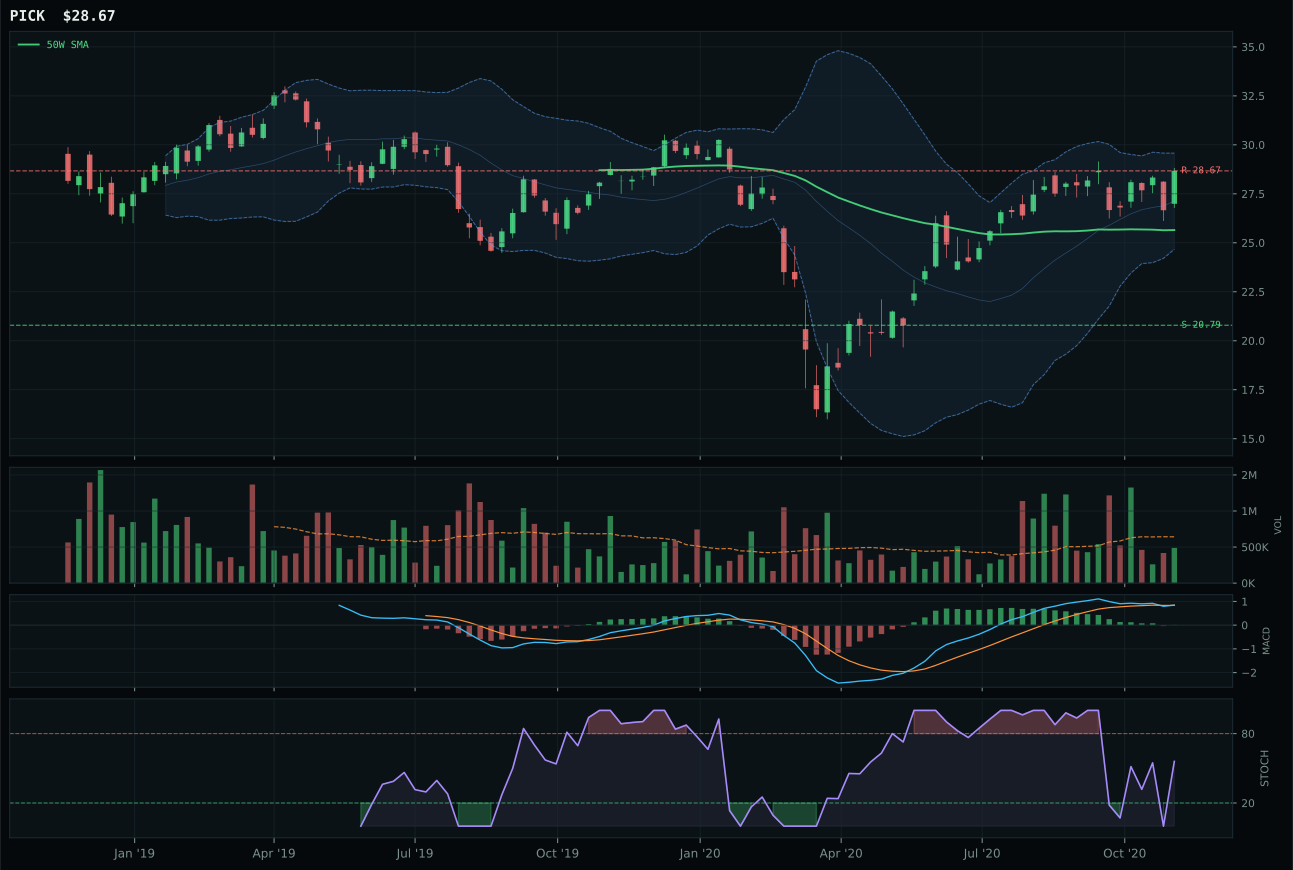
PICK has a neutral structure profile with -0.3% 13-week relative strength versus SPY.
A failed hold above support would weaken the setup.
Actionable but governed by invalidation levels.
COPX wins because it combines a perfect 100 trend score with a momentum confirmation score of 100 out of 100, anchored by 11.1% thirteen-week returns, 6.5% relative strength versus SPY, and above-average volume participation at 1.43x the twenty-week average. The 29.2% extension above the 50-week is penalized for entry risk in the timing score, but the category-relative strength of 6.1% proves COPX is winning within its peer set and not just benefiting from a rising tide. MACD is bullish but flattening and stochastic RSI sits at 0.54 rising mid-zone, showing momentum has room to run without being overextended into overbought territory like some tech peers. REMX lost because timing deteriorated to 37 out of 100 due to deeper extension and stochastic RSI rolling into overbought momentum, while category-relative strength flatlined at 0.0% and volume confirmation fell to neutral participation. The 6.5-point score gap reflects COPX's superior combination of clean trend structure and institutional accumulation underneath.
Industrial Metals earned 10% allocation as a top-2 overweight category with the highest final score of 75.7, ranking it as the portfolio's primary risk-on conviction. Metals scarcity is the most active macro descriptor at +14, paired with commodity breadth positive at +10 and real asset sponsorship at +6—a macro backdrop that actively rewards copper and industrial metals exposure in a Goldilocks regime where growth and inflation expectations are both constructive. COPX's 100 momentum confirmation score reflects genuine sponsorship from buyers who understand supply constraints and infrastructure deployment cycles. The risk is real: 29.2% extension above the 50-week and a timing score of only 48 out of 100 mean entry here is late, and the risk-reward is compressed to 39.2 out of 100 with 66.7% downside to support and 0% upside to resistance. But this is precisely why COPX earned a top-2 slot—the market is paying for scarcity in real time, and Goldilocks plus active metals scarcity descriptors justify holding the late-stage momentum rather than waiting for a pullback that may never come as long as macro sponsorship holds.
AI — SMH
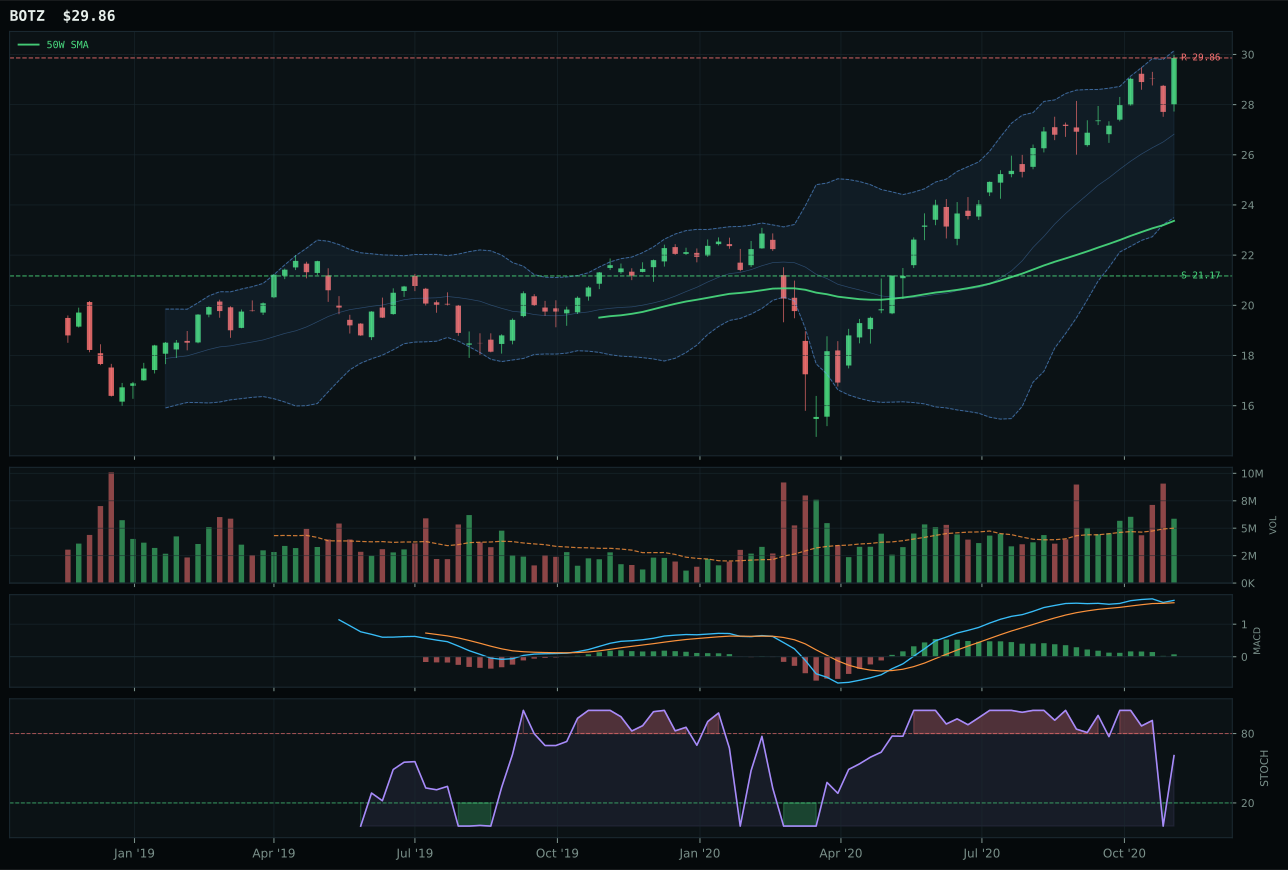
BOTZ has a vertical extension profile with 9.0% 13-week relative strength versus SPY.
A failed hold above support would weaken the setup.
Actionable but governed by invalidation levels.
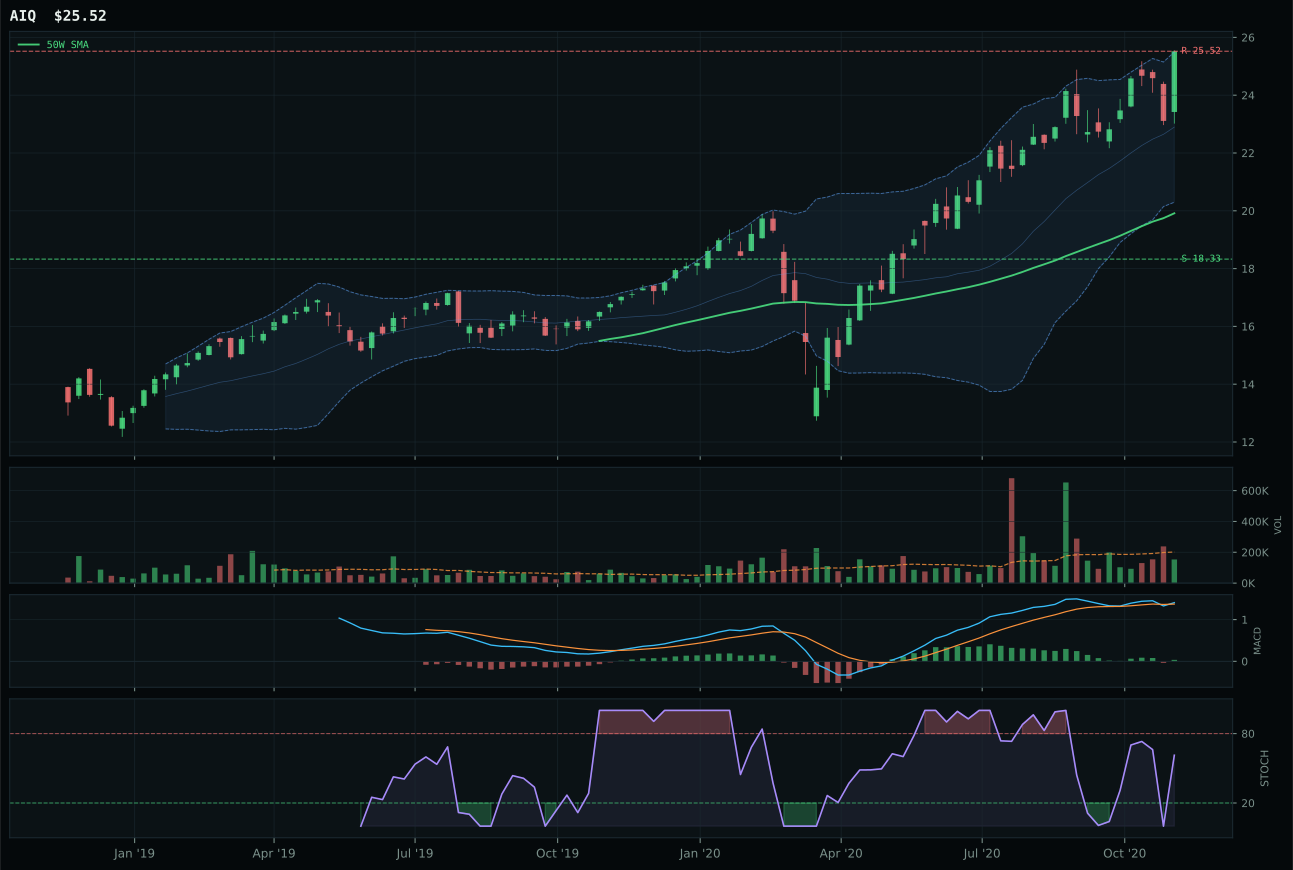
AIQ has a vertical extension profile with 8.5% 13-week relative strength versus SPY.
A failed hold above support would weaken the setup.
Tracked, but not top-2 eligible because: .
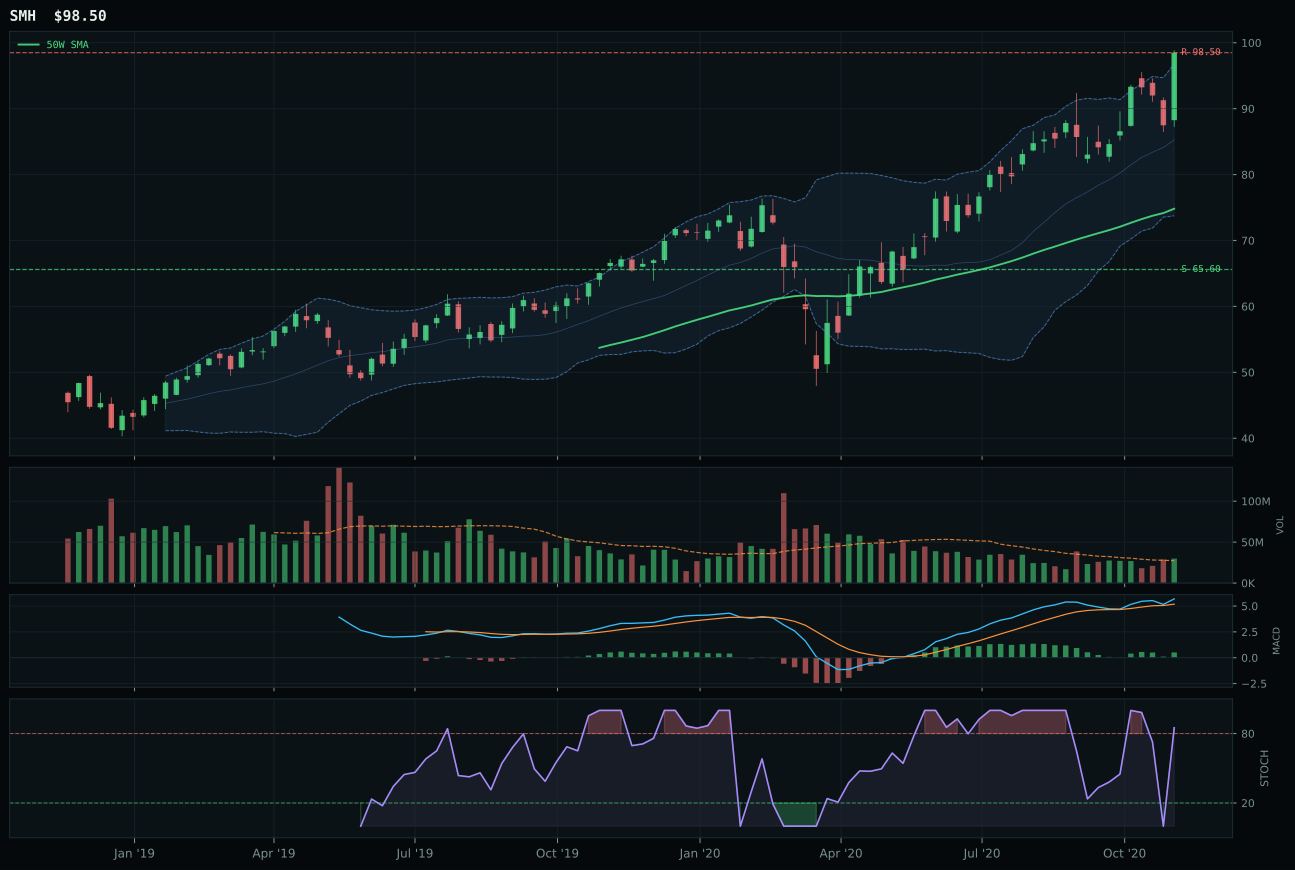
SMH has a vertical extension profile with 11.6% 13-week relative strength versus SPY.
A failed hold above support would weaken the setup.
Actionable but governed by invalidation levels.
SMH wins because it is the only one of the three AI peers with MACD bullish and improving—a critical edge when stochastic RSI is already overbought rolling over at 0.85, signaling that momentum oscillators are mature but fresh buying pressure is still evident on the MACD histogram. The 16.2% thirteen-week return and 11.6% relative strength versus SPY are the highest in the category, and category-relative strength of 2.5% shows SMH is winning on the relative basis that matters most. BOTZ posted 9.0% SPY-relative strength and 13.7% thirteen-week returns but its MACD only flattened while stochastic RSI fell neutral, meaning it peaked ahead of SMH and lacks the confirmation needed to argue it deserves the top slot despite having nearly identical trend and structure scores. The margin between the two was razor-thin at only 0.1 points on the composite, but MACD quality decided it.
AI earned 10% allocation as a top-2 overweight category with a final score of 71.2, ranking it as the second-highest opportunity in the portfolio after Industrial Metals. The Goldilocks macro regime provides ideal conditions for AI compute-led semi strength, with active ai growth sponsorship descriptor adding +14 points of macro confirmation on top of clean technical evidence. SMH's momentum confirmation score of 100 out of 100 and volume-price confirmation of 64.9 reflect genuine sponsorship from professional buyers accumulating into the extended position. Risk is present—the 27 timing score penalizes the 31.6% gap from the 50-week average and stochastic overbought state—but the improving MACD and category-relative leadership justify holding this in the top tier where capital is rewarded for accepting near-term extension risk in exchange for momentum that remains unbroken.
Emerging Markets — IEMG
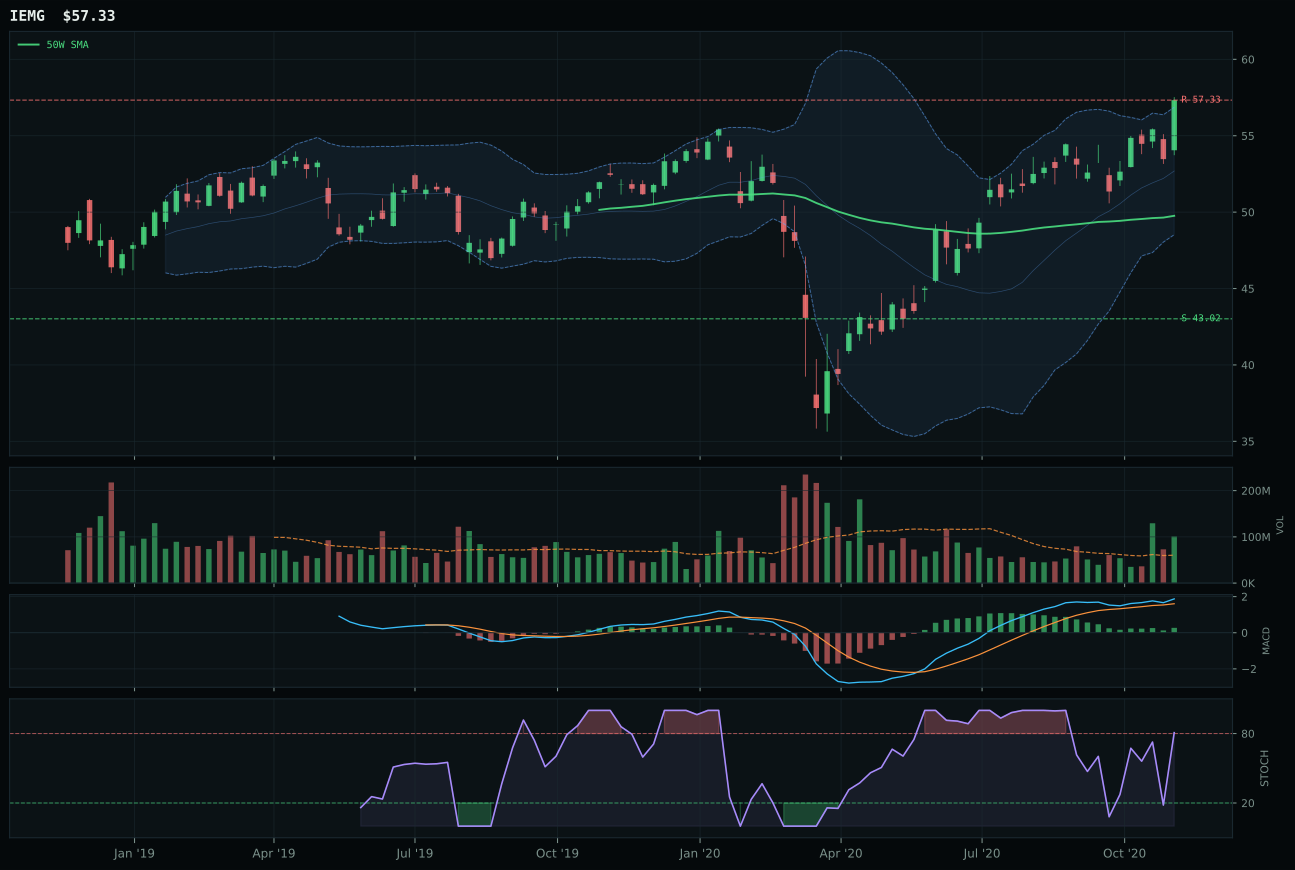
IEMG has a vertical extension profile with 4.5% 13-week relative strength versus SPY.
A failed hold above support would weaken the setup.
Actionable but governed by invalidation levels.
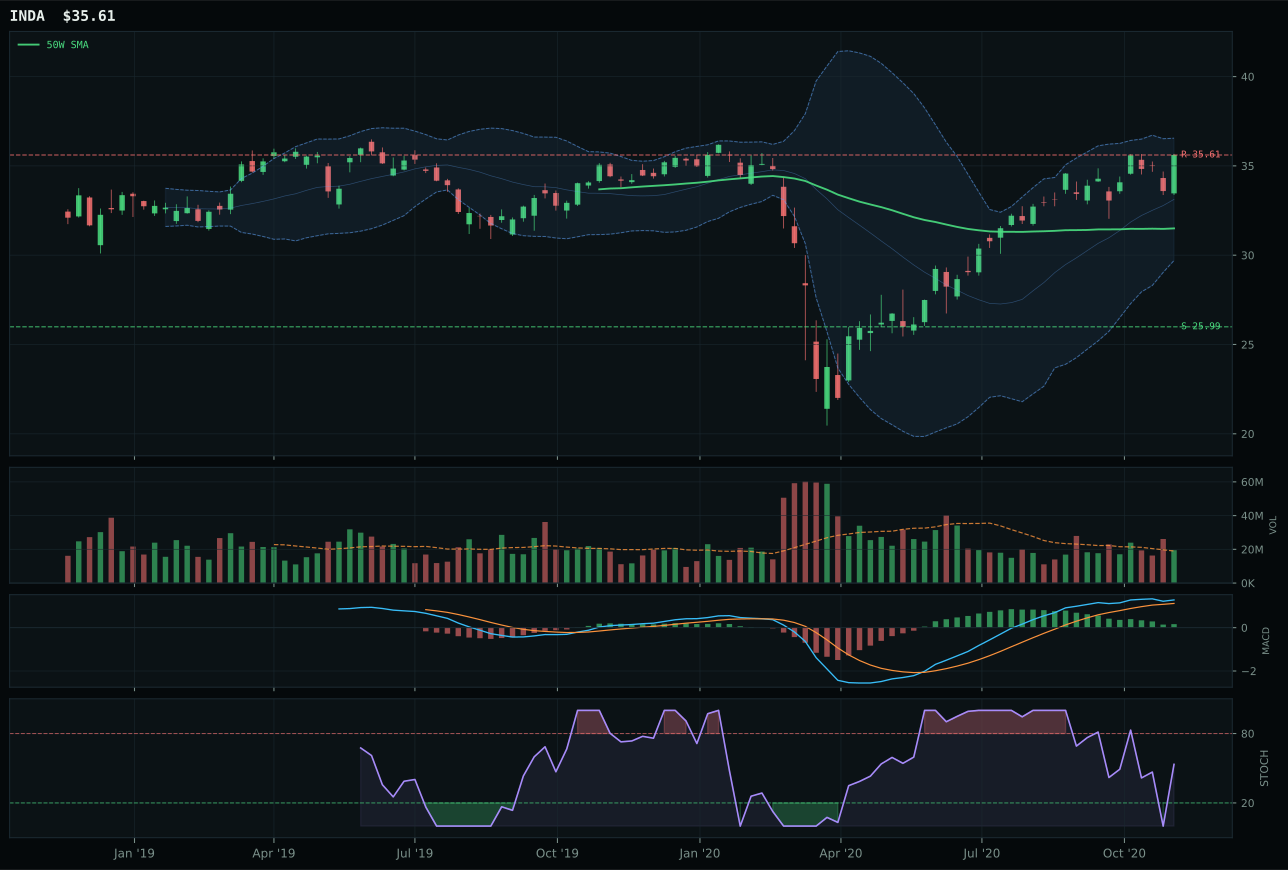
INDA has a neutral structure profile with 4.2% 13-week relative strength versus SPY.
A failed hold above support would weaken the setup.
Actionable but governed by invalidation levels.
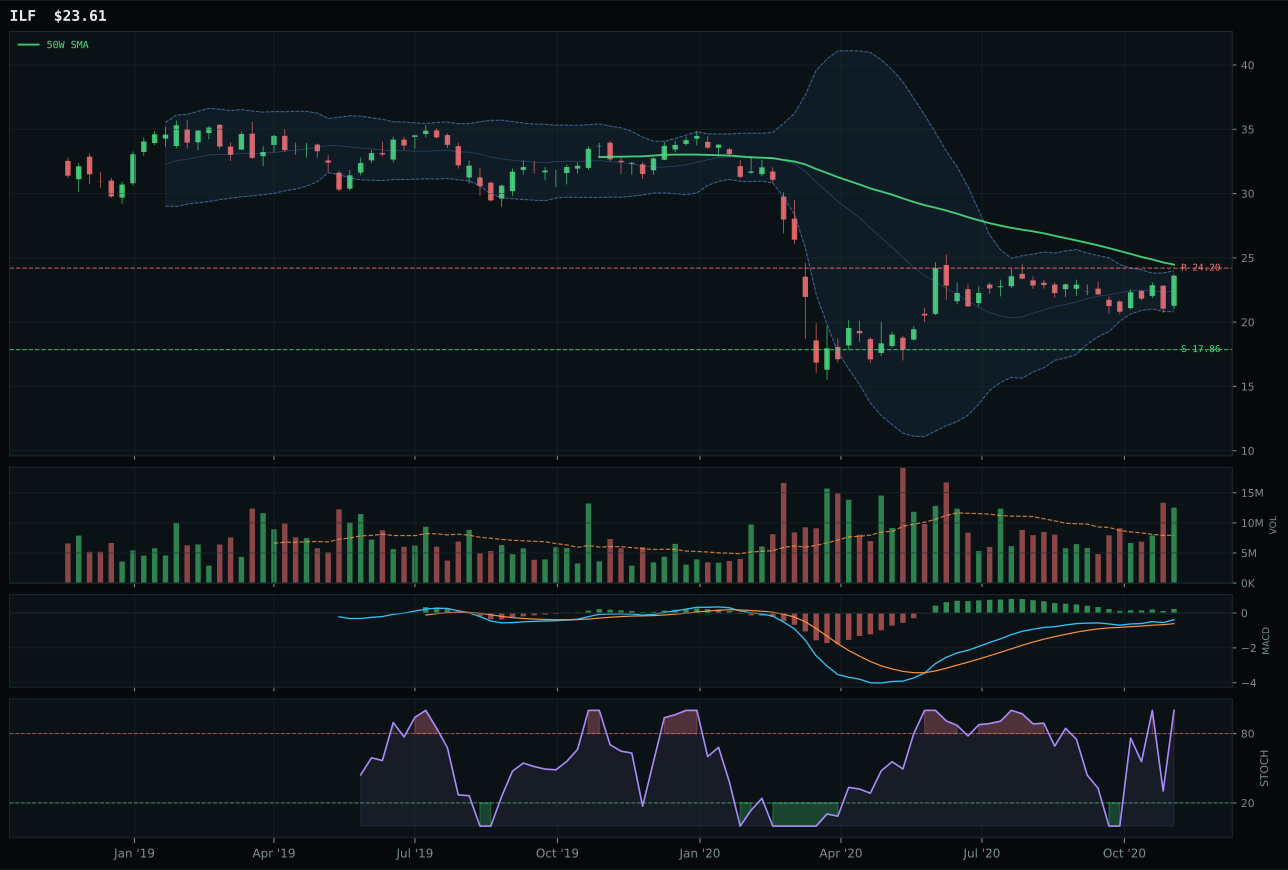
ILF has a neutral structure profile with -1.3% 13-week relative strength versus SPY.
Extension and support failure are the main tactical risks.
Tracked, but not top-2 eligible because: structurally broken.
IEMG wins because it is the only peer with accumulation-level volume participation at 1.68x the twenty-week average, validating that the 15.2% extension above the 50-week is genuine accumulation and not retail chasing. The volume-price confirmation score of 83.6 out of 100 is exceptional, paired with a momentum confirmation of 94.7 that reflects a bullish and improving MACD even as stochastic RSI reaches overbought momentum at 0.81. The nine-point thirteen-week return of 9.2% and 4.5% relative strength versus SPY are solid middle-of-pack numbers, but they matter because they are backed by institutional sponsorship. INDA posted identical 4.2% relative strength and 8.8% thirteen-week return but lacked the same volume foundation, with neutral participation replacing IEMG's accumulation signal. The score gap of six points is driven entirely by volume quality and MACD condition; INDA's bullish but flattening MACD cannot match IEMG's bullish and improving signal when both are extended into similar Fibonacci zones.
Emerging Markets earned 5% allocation as a tier-2 holding with a final score of 70.8, ranking it 3rd among the ten categories but outside the top-2 due to higher scores from AI and Industrial Metals. The em liquidity support descriptor is active at +14, paired with liquidity expansion at +8 and risk appetite positive at +8, creating genuine macro sponsorship for EM exposure in Goldilocks. IEMG's technical evidence score of 95.8 out of 100 is exceptional and reflects near-perfect trend and volume confirmation. However, the timing score of 37 out of 100 penalizes the 15.2% extension from the 50-week and stochastic overbought state, creating tension between strong momentum and poor entry timing. IEMG would be promoted to top-2 if risk appetite deteriorated and defensive rotation began, or if the em liquidity support descriptor strengthened further; until then, the allocation slot reflects genuine sponsorship but late entry risk that requires acceptance that new capital is supporting an extended move rather than building a fresh foundation. This is a holding, not an add.
Technology — IGV
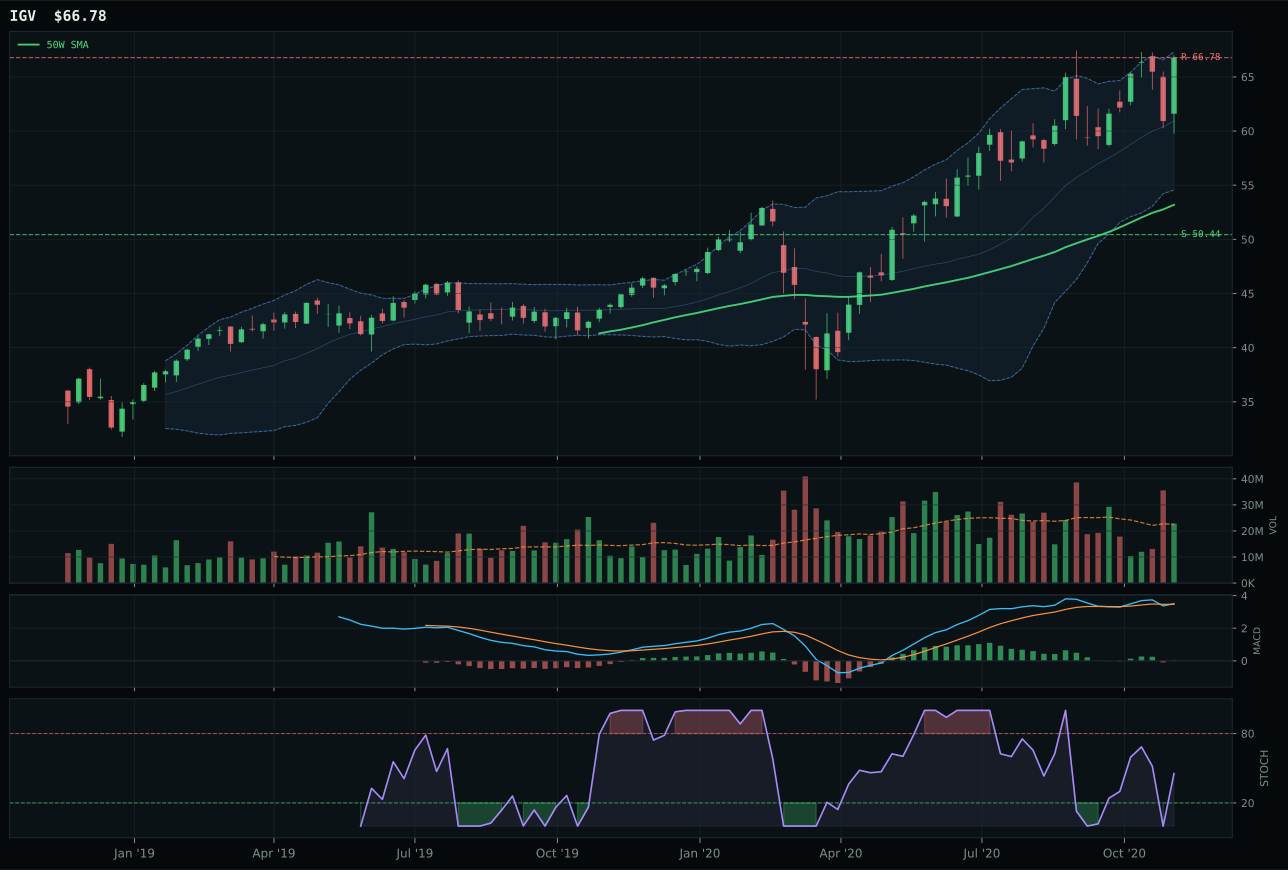
IGV has a vertical extension profile with 8.1% 13-week relative strength versus SPY.
A failed hold above support would weaken the setup.
Actionable but governed by invalidation levels.
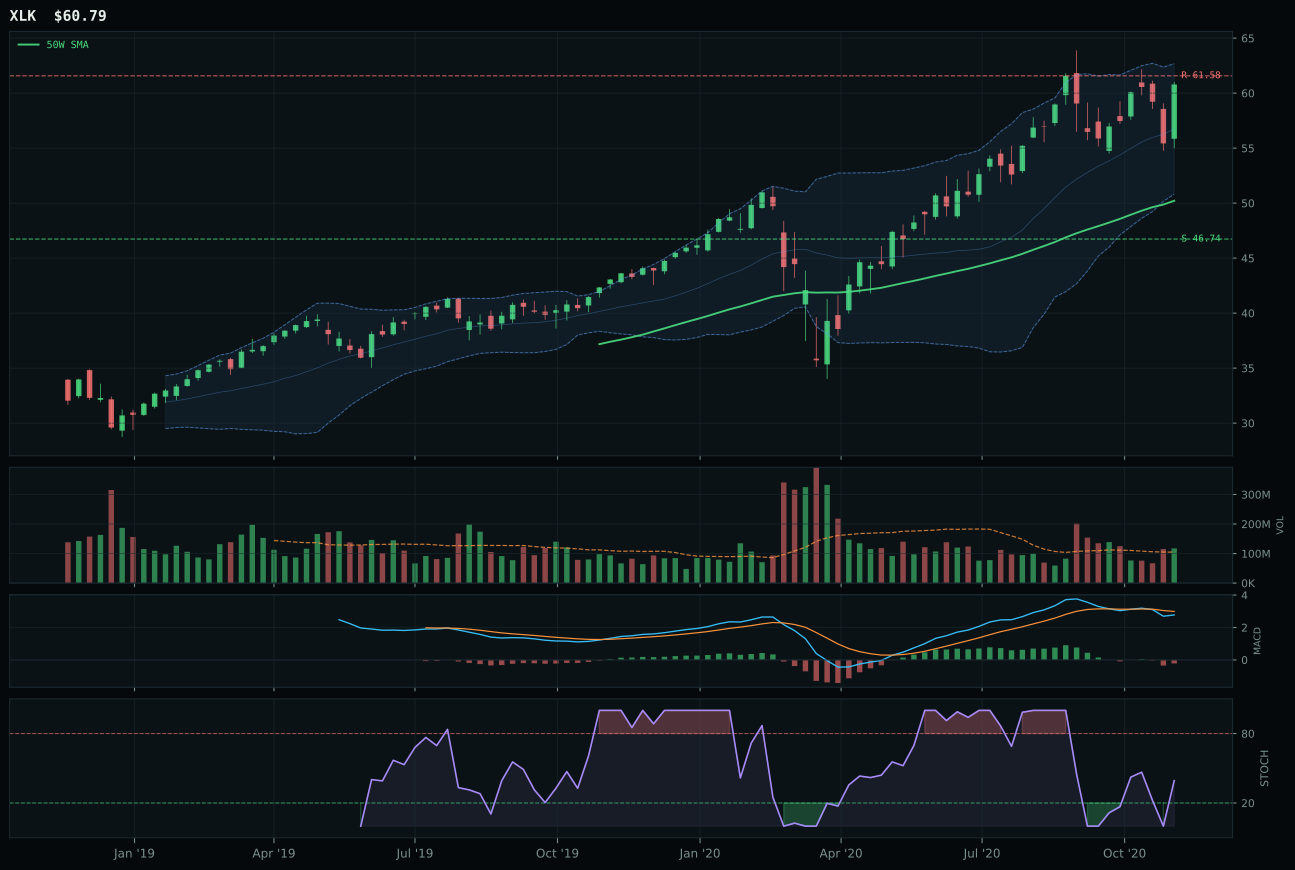
XLK has a vertical extension profile with 2.2% 13-week relative strength versus SPY.
A failed hold above support would weaken the setup.
Actionable but governed by invalidation levels.
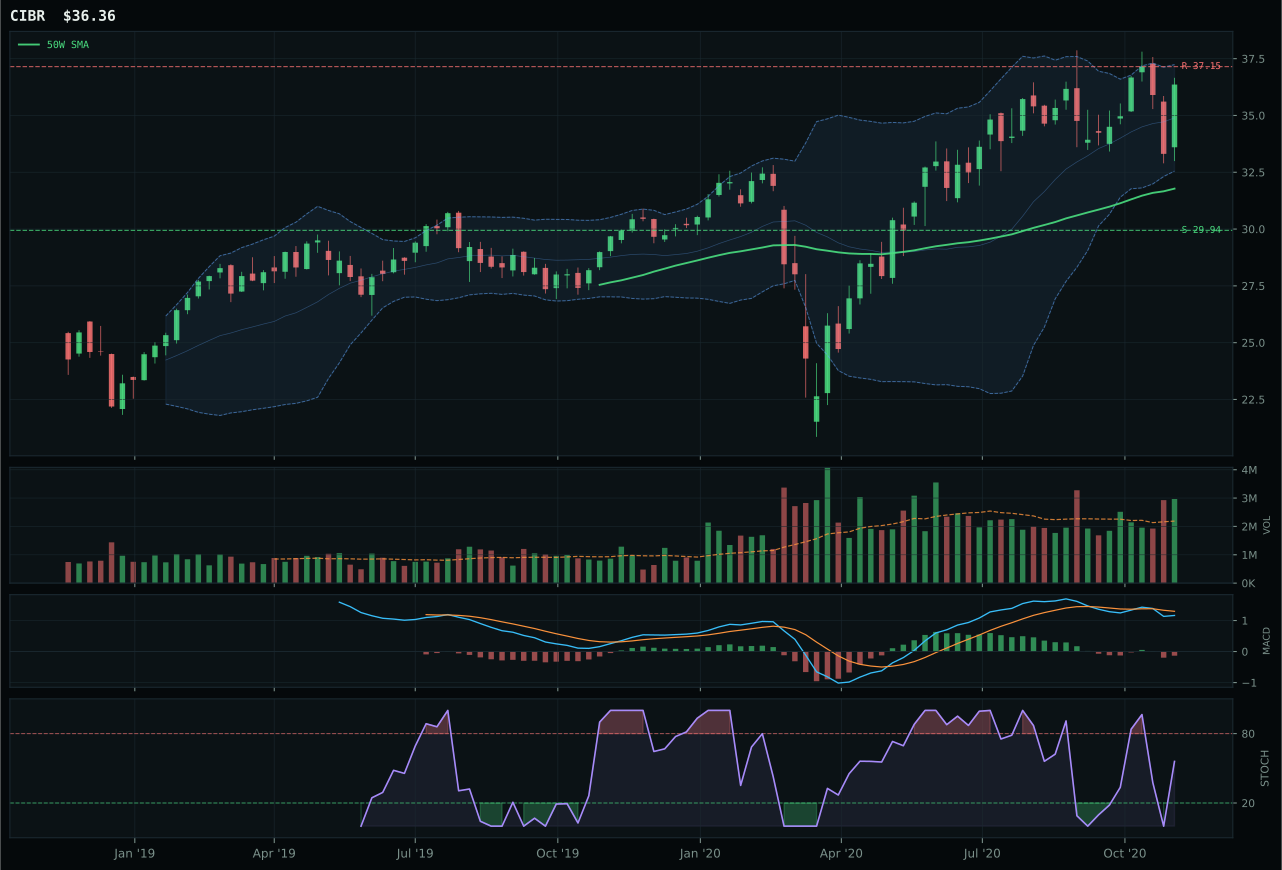
CIBR has a neutral structure profile with -1.9% 13-week relative strength versus SPY.
A failed hold above support would weaken the setup.
Actionable but governed by invalidation levels.
IGV wins the category because it has established clean uptrend structure with price 25.5% above the 50-week moving average, paired with a 50-week slope of 0.8% that shows the trend is still constructive rather than rolling over. The 8.1% relative strength versus SPY and 5.8% outperformance of the category median demonstrate genuine institutional accumulation, not retail momentum chasing. MACD is bullish but flattening and stochastic RSI sits at 0.45 falling/neutral, which tells us the move has momentum but lacks fresh buying force—this is why the timing score of 40 out of 100 penalizes what would otherwise be a cleanly formed rally. XLK lost the decision because its MACD deteriorated to bearish/weakening territory while category-relative strength completely flatlined at 0.0%, meaning it failed to keep pace even within its own three-ETF peer set despite trading in the same extended setup.
Technology earned 5% allocation as a tier-2 holding in a Goldilocks regime where liquidity expansion and risk appetite are both active tailwinds. The final category score of 59.9 ranked it outside the top-2 because two higher-scoring categories (AI at 71.2 and Industrial Metals at 75.7) command the full allocation available within the 50% overlay constraint. While IGV's 12.7% thirteen-week return and bullish MACD setup are legitimate, the 25.5% extension above the 50-week mean new buyers are absorbing risk near peak extension; the asymmetry favors waiting for a pullback or watching for MACD to prove itself by improving rather than flattening. The allocation holds because technology leadership remains intact under Goldilocks, but the category's rank reflects timing risk that outweighs pure momentum strength.
Utilities & Infrastructure — XLU
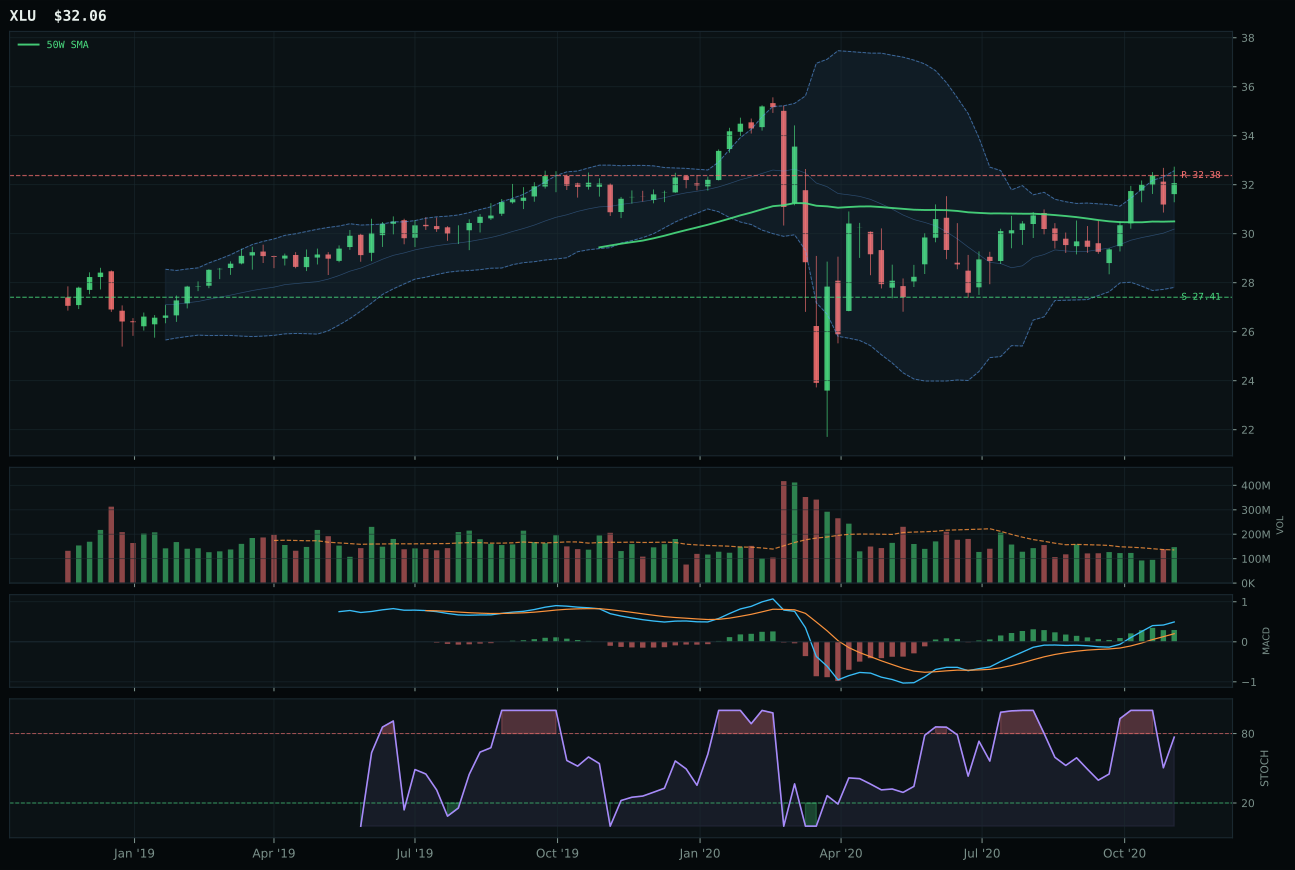
XLU has a neutral structure profile with -0.4% 13-week relative strength versus SPY.
A failed hold above support would weaken the setup.
Actionable but governed by invalidation levels.
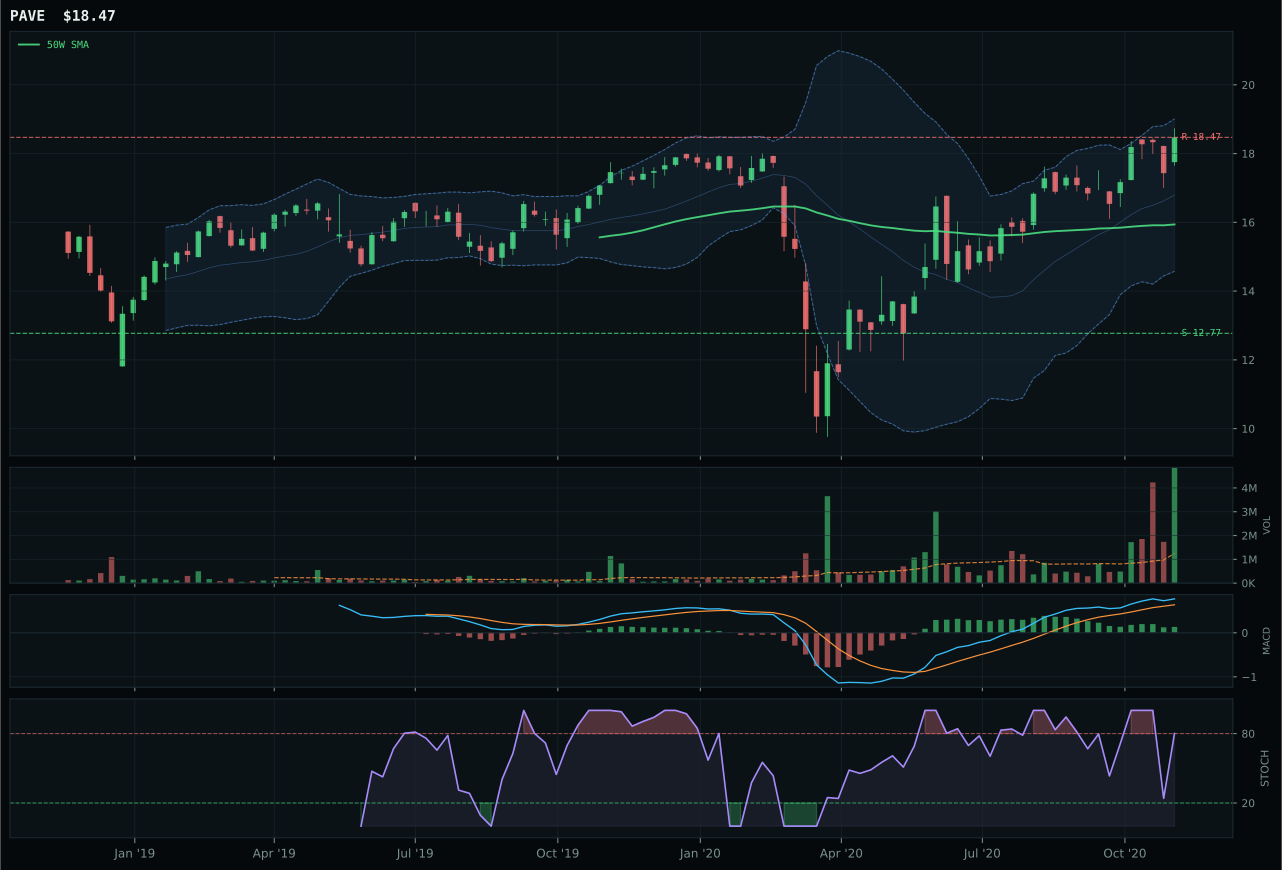
PAVE has a vertical extension profile with 5.1% 13-week relative strength versus SPY.
A failed hold above support would weaken the setup.
Actionable but governed by invalidation levels.
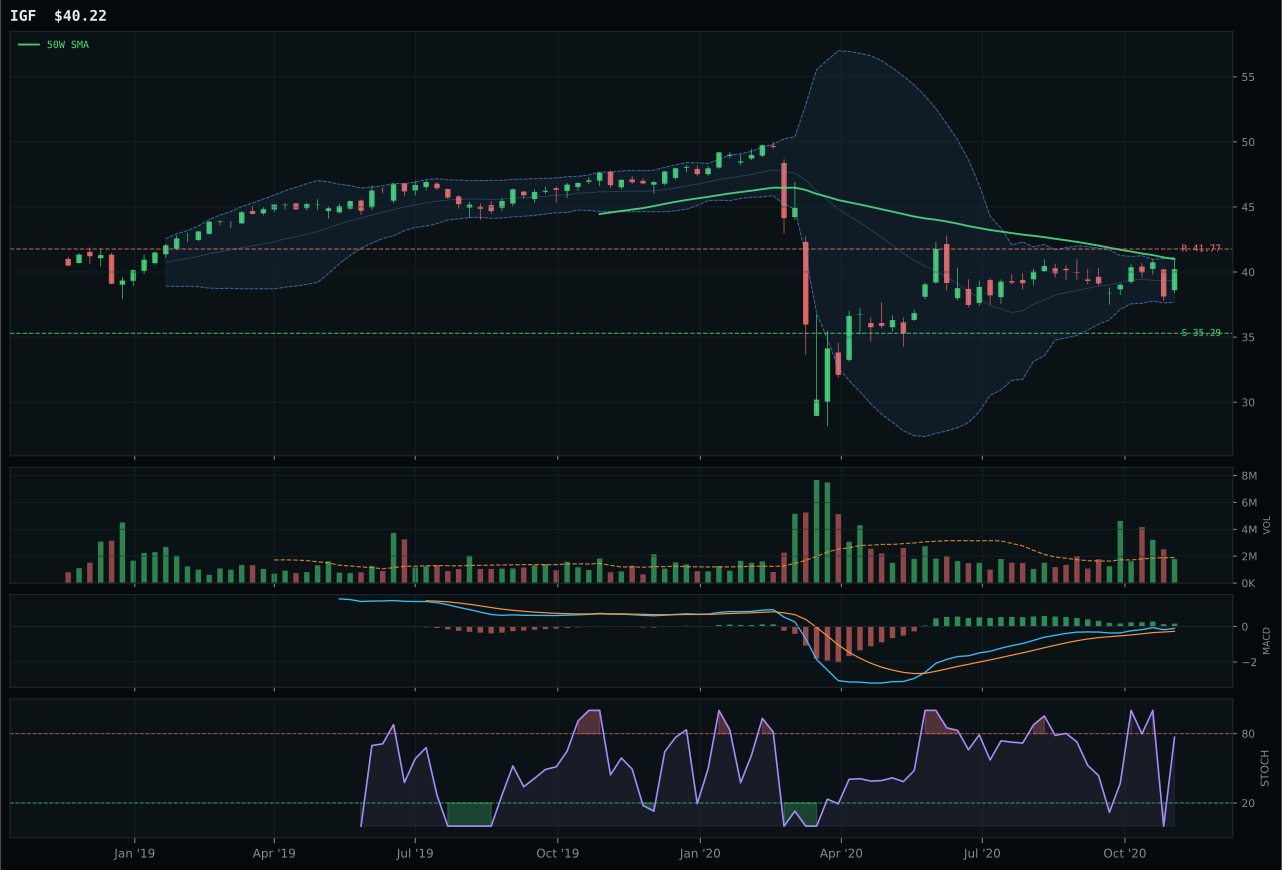
IGF has a compression near 50W profile with -4.2% 13-week relative strength versus SPY.
Extension and support failure are the main tactical risks.
Tracked, but not top-2 eligible because: structurally broken.
XLU wins because it sits in the optimal pullback setup just 5.1% above the 50-week moving average with a timing score of 75 out of 100, providing the cleanest entry point in the category without sacrificing trend strength. The 99.5 trend score reflects price above both the 50-week and 200-week moving averages with a near-zero slope, meaning XLU is in true trend without extended momentum blow-off. MACD is bullish and improving—a critical edge that PAVE lacked—while stochastic RSI remains in falling/neutral at 0.77, showing momentum oscillators are mature but not overbought. PAVE posted superior momentum confirmation at 85 out of 100 and 9.7% thirteen-week returns, but it is extended to 15.9% above the 50-week with stochastic RSI rolling over overbought at a momentum extreme, and MACD only flattened. The 16.4-point score gap reflects XLU's superior timing and entry setup; PAVE's vertical extension is a liability when utilities offer a pullback alternative.
Utilities & Infrastructure earned 5% allocation as a tier-2 holding with a final score of 58.5, ranking it 8th among the ten categories and reflecting a defensive profile that does not rate in an offensive Goldilocks regime. XLU's 76 technical evidence score and bullish and improving MACD provide legitimate support, but the -0.4% relative strength versus SPY and 4.3% thirteen-week return are weak by portfolio standards. Disinflation pressure is a +6 tailwind for regulated utilities, but risk appetite positive is a -2 headwind that directly contradicts the growth dynamics favoring cyclical leadership. XLU would be promoted to tier-1 if risk appetite deteriorated, credit stress turned significantly positive, or if equity indices began a risk-off correction; until then, the allocation reflects a portfolio insurance function similar to precious metals—a low-return drag that provides diversification value rather than alpha. The setup is technically sound and MACD improving, so the position holds, but new capital would be better deployed to AI and Industrial Metals where momentum and macro alignment are both strong.
Agriculture & Livestock — MOO
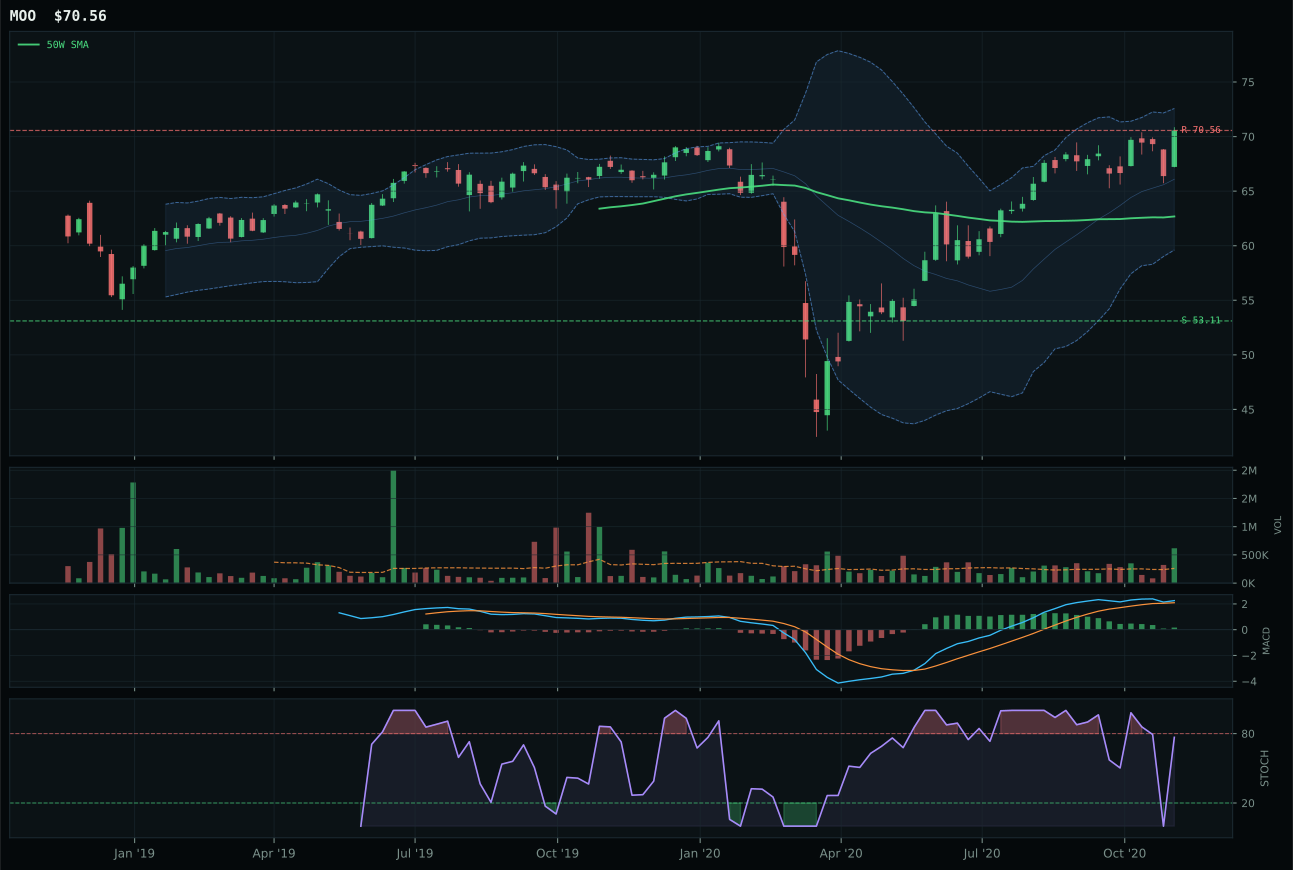
MOO has a neutral structure profile with 2.8% 13-week relative strength versus SPY.
A failed hold above support would weaken the setup.
Actionable but governed by invalidation levels.
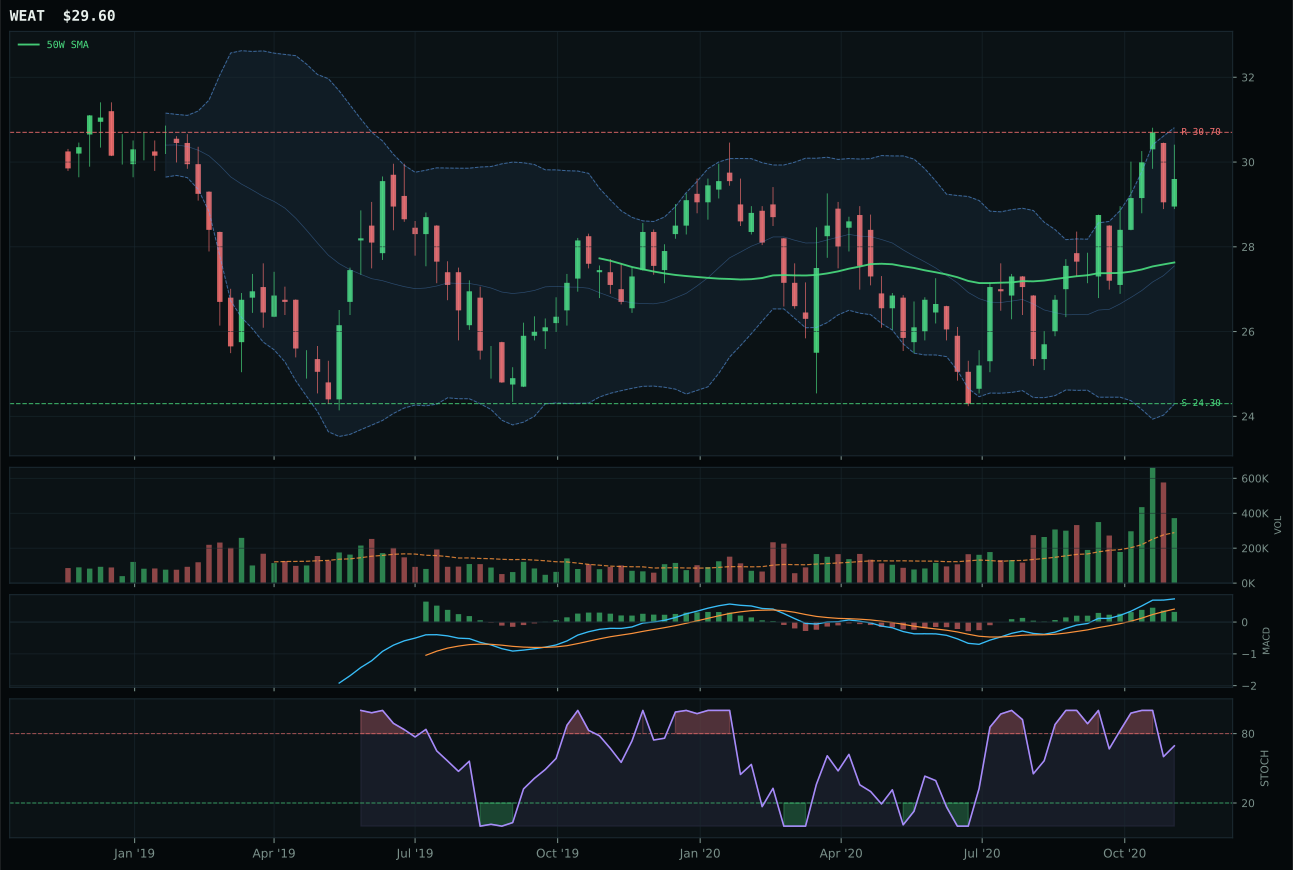
WEAT has a neutral structure profile with 12.1% 13-week relative strength versus SPY.
A failed hold above support would weaken the setup.
Tracked, but not top-2 eligible because: .
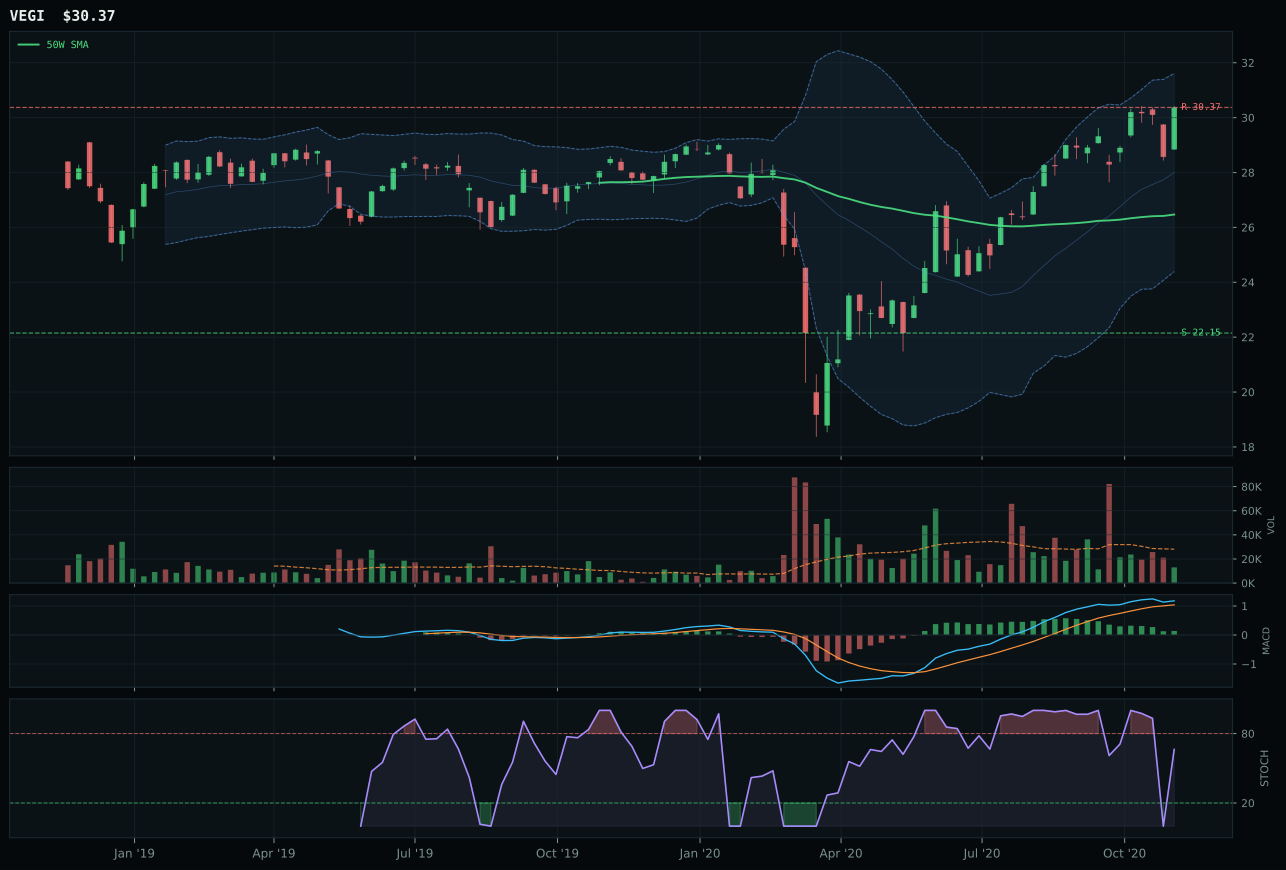
VEGI has a neutral structure profile with 6.6% 13-week relative strength versus SPY.
A failed hold above support would weaken the setup.
Tracked, but not top-2 eligible because: .
MOO wins because it is the only peer with accumulation-level volume participation at 2.37x the twenty-week average, confirming that the 12.6% extension above the 50-week is being accumulated rather than distributed. The volume-price confirmation score of 81.8 out of 100 is exceptional and explains why MOO's trend score of 100 carries real conviction despite its 7.4% thirteen-week return being merely average inside the category. MACD bullish but flattening and stochastic RSI falling/neutral at 0.77 show momentum is cooling, but the massive volume underneath means smart money is still working bids into the offer even as technicals mature. WEAT posted superior relative strength at 12.1% versus SPY and a higher thirteen-week return of 16.8%, but its MACD only improved to bullish and improving while volume was just above-average participation, meaning the move lacked the same sponsorship foundation. MOO's 16.6-point score gap is decisive because it reflects volume quality mattering more than raw momentum numbers.
Agriculture & Livestock earned 5% allocation as a tier-2 holding despite a final score of 37.7 that sits well below the top-2 threshold. Real asset sponsorship is active at +8 and commodity breadth positive at +5, but disinflation pressure is working against the category at -8, creating a mixed macro backdrop that offers no clear directional bias. MOO's exceptional volume confirmation and neutral structure setup create a genuine coil for further accumulation, but the 2.8% relative strength versus SPY is weak and the -3.9% category-relative strength means MOO is only winning because it has the most institutional accumulation—not because it is outperforming. The allocation slot reflects the Goldilocks regime's openness to real assets, but the category rank (5th) and weak relative strength mean capital would move if either traditional energy stabilized or metals momentum accelerated further. MOO provides portfolio ballast and diversification, not alpha.
Defense & Aerospace — XAR
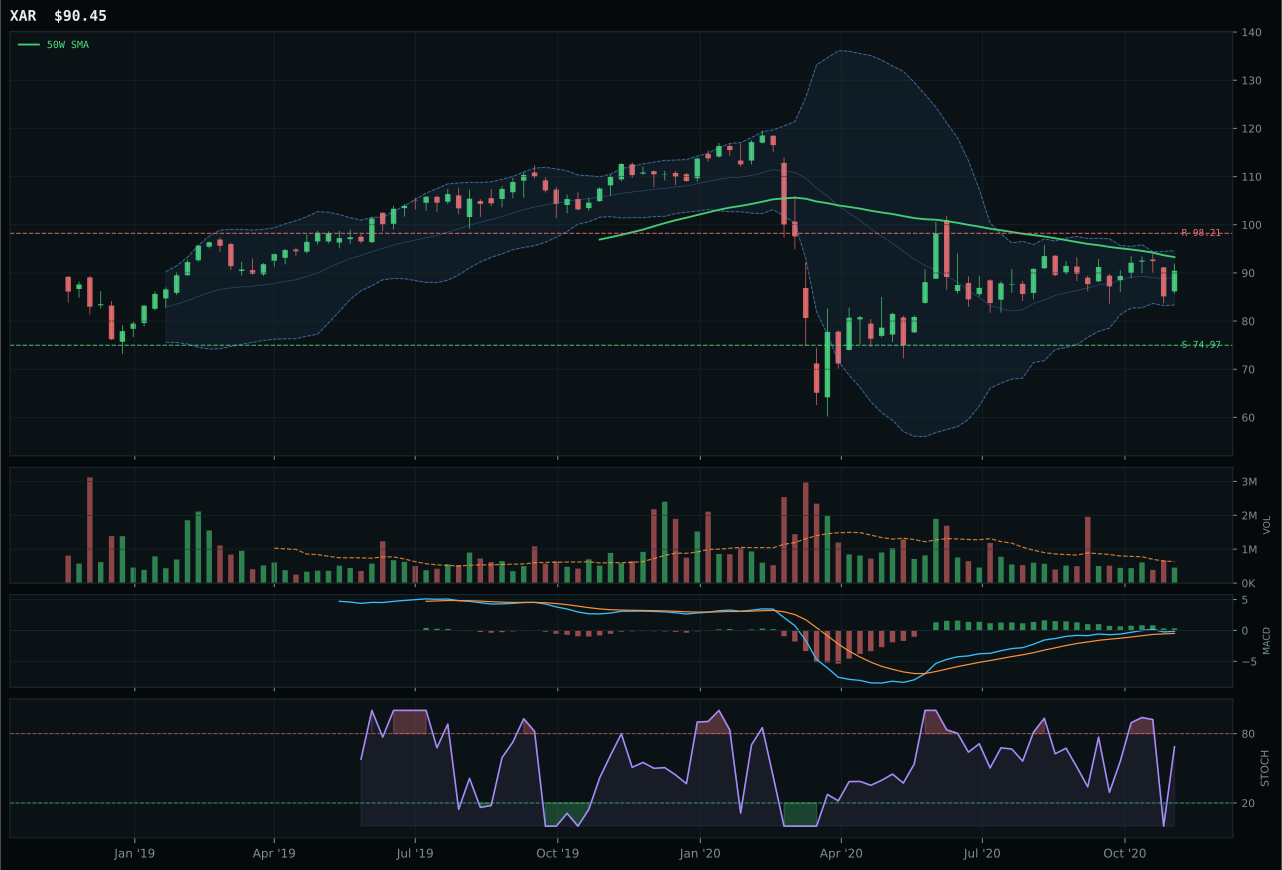
XAR has a neutral structure profile with -5.1% 13-week relative strength versus SPY.
A failed hold above support would weaken the setup.
Actionable but governed by invalidation levels.
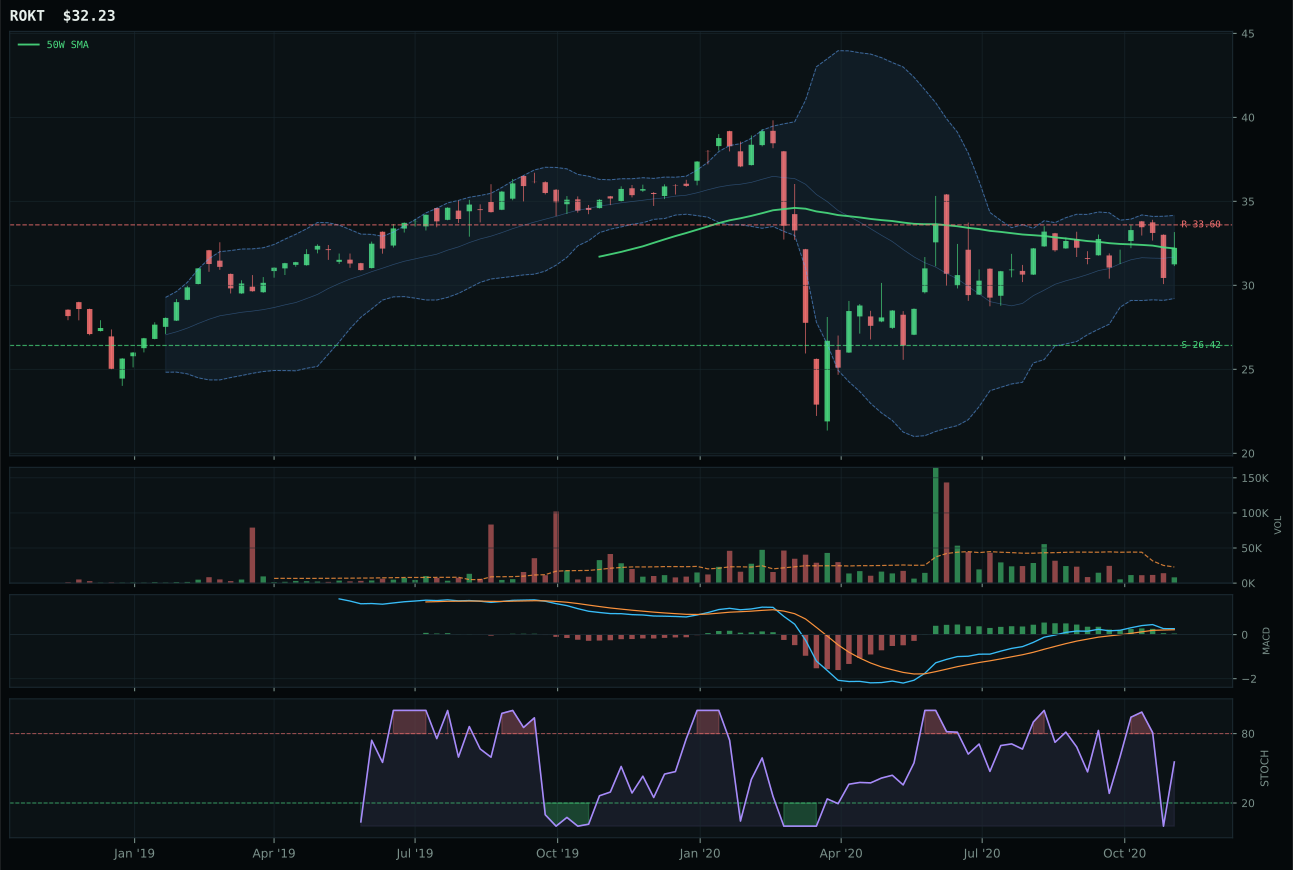
ROKT has a compression near 50W profile with -4.6% 13-week relative strength versus SPY.
A failed hold above support would weaken the setup.
Tracked, but not top-2 eligible because: .
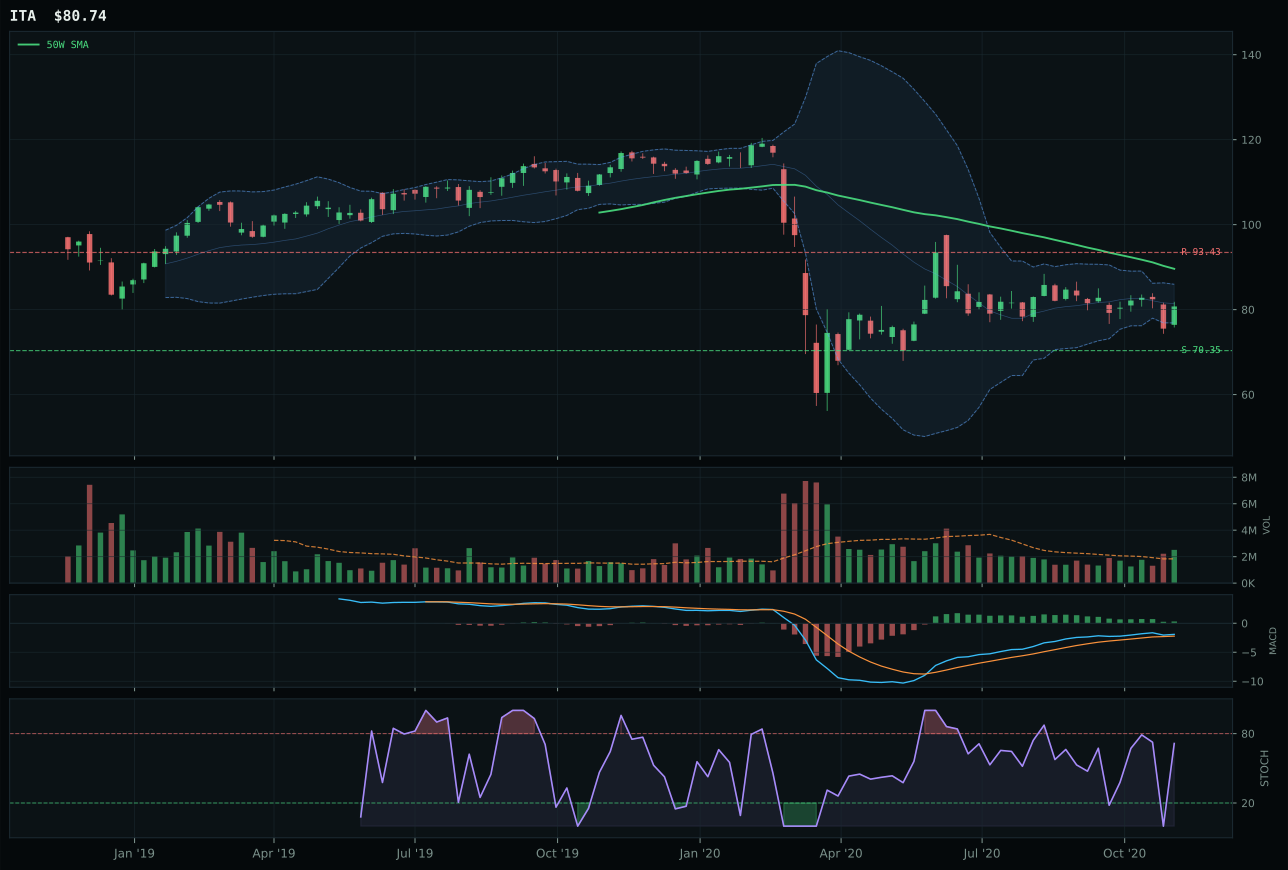
ITA has a neutral structure profile with -7.3% 13-week relative strength versus SPY.
Extension and support failure are the main tactical risks.
Tracked, but not top-2 eligible because: structurally broken.
XAR wins because it sits at a pullback into support near the 50-week moving average, just 3% below it, rather than extended into the stratosphere like other equity positions. The timing score of 92 out of 100 reflects this decision-zone setup, and the Fibonacci location at the 0.500 middle retracement gives XAR a clean invalidation level if support at 74.97 breaks. The risk-reward of 59.9 out of 100 shows there is 20.6% downside to support but only 7.9% upside to resistance, a ratio that normally rejects the trade—except the structure is neutral and not deteriorating, so XAR is genuinely coiling rather than rolling over. ROKT lost because its risk-reward was slightly worse at 56.3 and it sat in compression nearer to the 50-week, giving it less definition. Both carry thin volume participation at 0.72x and 0.68x, respectively, which is why neither scores high on momentum confirmation despite MACD being bullish.
Defense & Aerospace earned 5% allocation as a tier-2 holding in a Goldilocks regime where credit stress is modestly positive (+2) but provides no real sponsorship. The final category score of 33.7 ranks it 6th among the 10 categories, far below the cutoff for top-2 consideration and only holding a tier-2 slot because the allocation framework reserves 5% per tier. XAR's -5.1% relative strength versus SPY and -0.4% thirteen-week return are genuine headwinds that no amount of technical repair setup can fully overcome in a risk-on environment. What keeps it allocated is the timing score of 92 and the defined support level, offering a coil structure that would work well if risk appetite stays intact and defense rotation begins. However, the category would need MACD to improve to bullish and improving, volume to confirm with above-average participation, and SPY-relative strength to turn positive to earn promotion to tier-1; until then, this is a tactical hold for macro diversification rather than a conviction trade.
Precious Metals — GLD
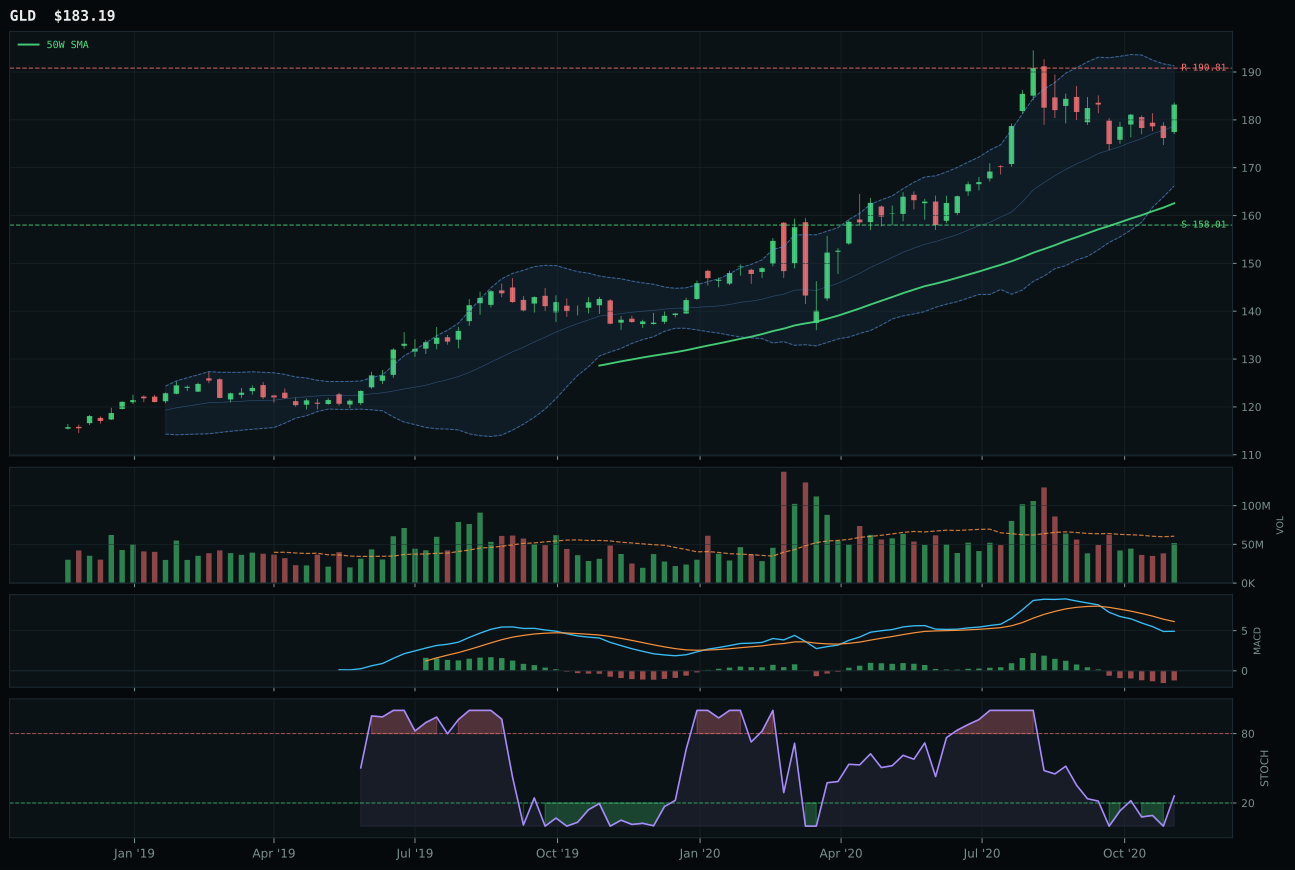
GLD has a neutral structure profile with -8.7% 13-week relative strength versus SPY.
A failed hold above support would weaken the setup.
Actionable but governed by invalidation levels.
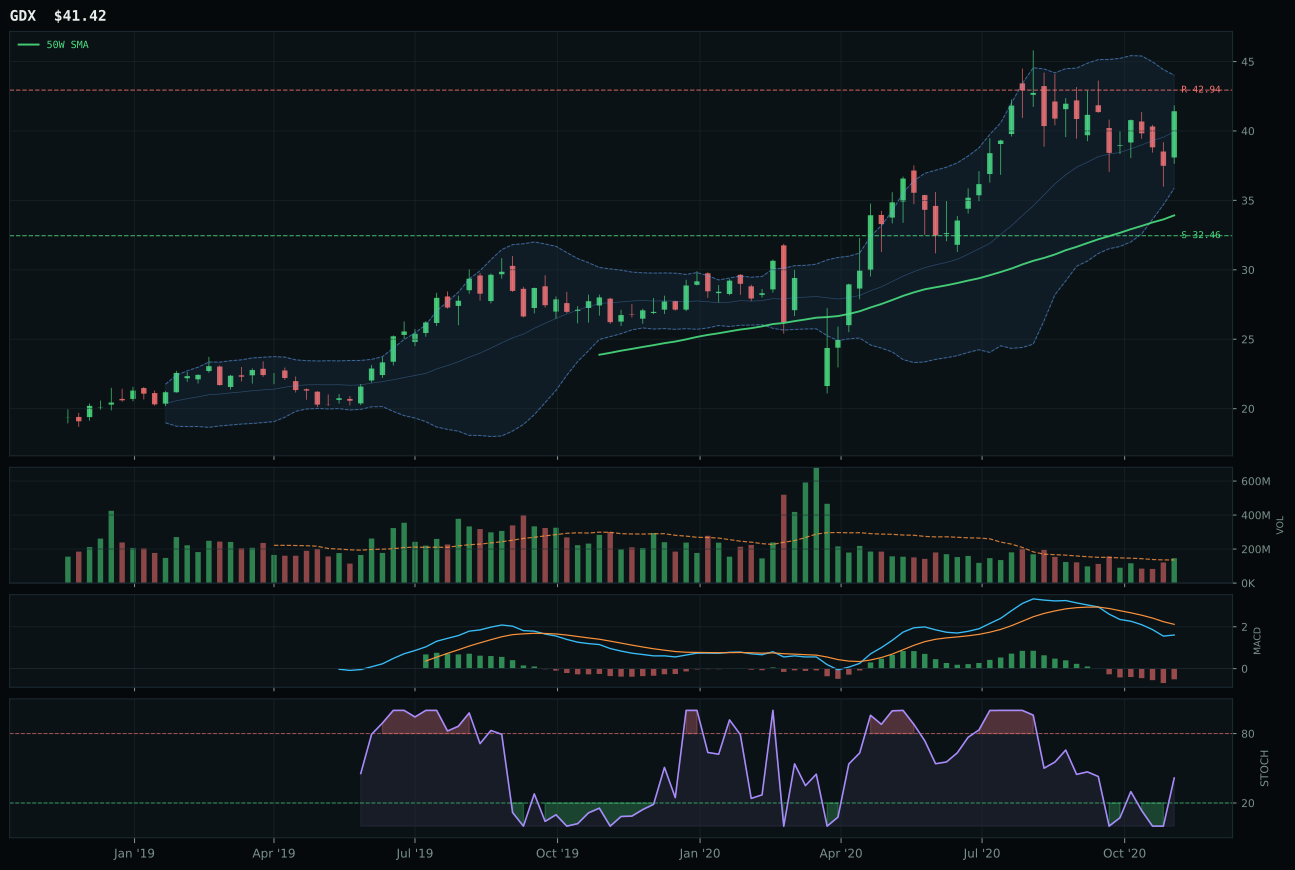
GDX has a vertical extension profile with -7.7% 13-week relative strength versus SPY.
A failed hold above support would weaken the setup.
Actionable but governed by invalidation levels.
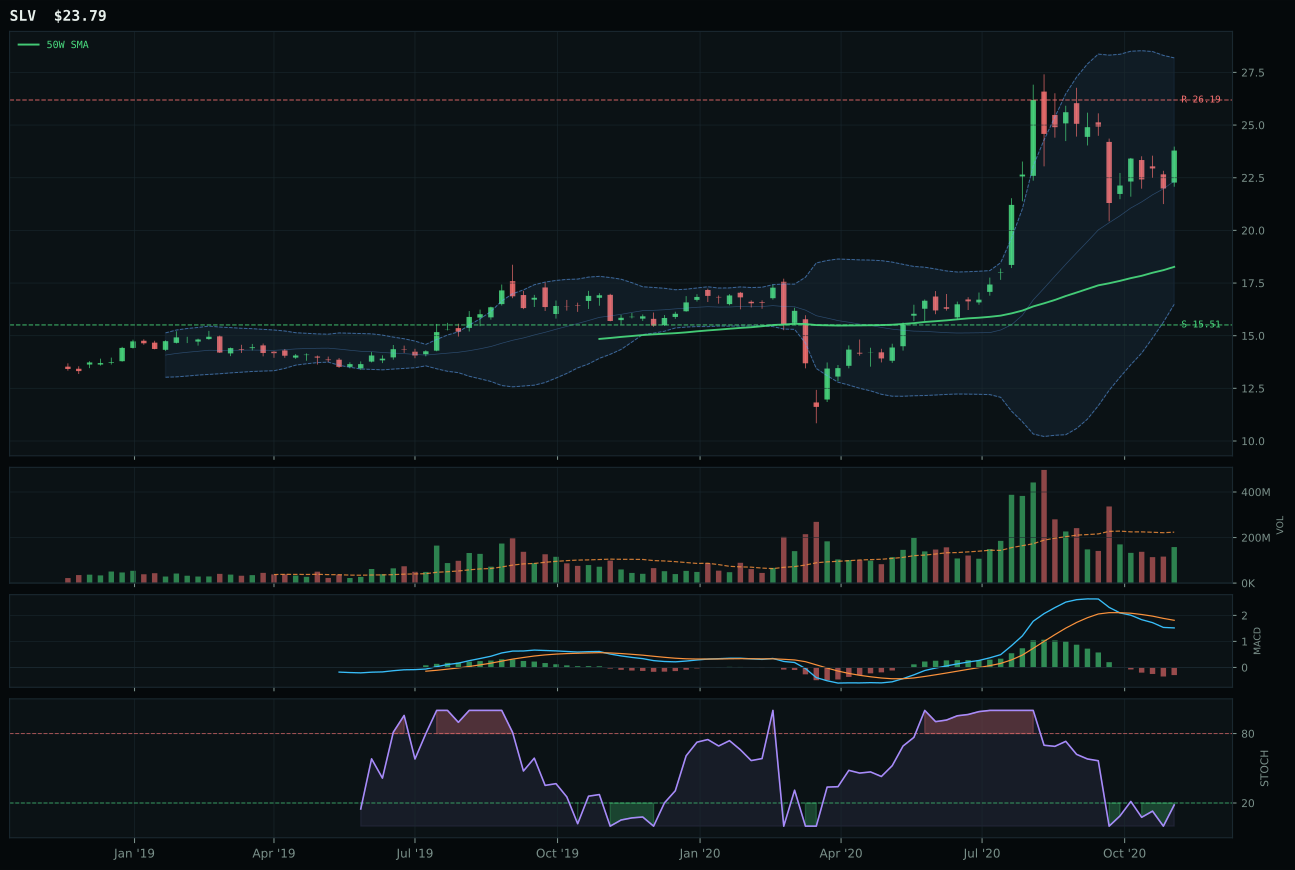
SLV has a vertical extension profile with -13.8% 13-week relative strength versus SPY.
A failed hold above support would weaken the setup.
Actionable but governed by invalidation levels.
GLD wins because timing is superior at 78 out of 100, reflecting a pullback into the upper retracement zone and middle Fibonacci levels that offer better risk-reward definition than the more extended GDX setup. GLD sits 12.7% above the 50-week while GDX is stretched to 23.4%, meaning GLD offers a fresher entry point even though both carry bearish/weakening MACD and a category-relative strength of 0.0%. The structure score of 74.5 for GLD versus 69.9 for GDX shows GLD's pullback is cleaner and less compressed, offering better visibility into where this trade will live if gold continues consolidating. Both face the fundamental problem that thirteen-week returns are negative (GLD at -4.0%, GDX at -3.1%) and SPY-relative strength is weak at -8.7% and -7.7%, but GLD's pullback setup means it has room to improve technically without requiring an immediate macro regime shift. GDX's vertical extension in a weak momentum environment is harder to defend.
Precious Metals earned 5% allocation as a tier-2 holding with a final score of 33.5, ranking it 7th among the ten categories and well outside serious consideration for top-2 status. The macro fit is 50 out of 100, and while disinflation pressure is a +6 tailwind for gold, risk appetite positive is a -4 headwind in the current Goldilocks regime. GLD's bearish/weakening MACD and zero category-relative momentum are genuine weaknesses that allocation acknowledges rather than ignores—this is a portfolio insurance position held because deflation tail risks exist, not because the setup is winning. The allocation would immediately come under pressure if risk appetite truly turned positive across equity markets and disinflation fears subsided. GLD needs MACD to improve to bullish and improving, volume to confirm with above-average participation, and thirteen-week returns to turn positive to justify promotion; without those changes, this is a four-percent real insurance cost in a portfolio that is betting on Goldilocks to hold.
Nuclear Energy — URA
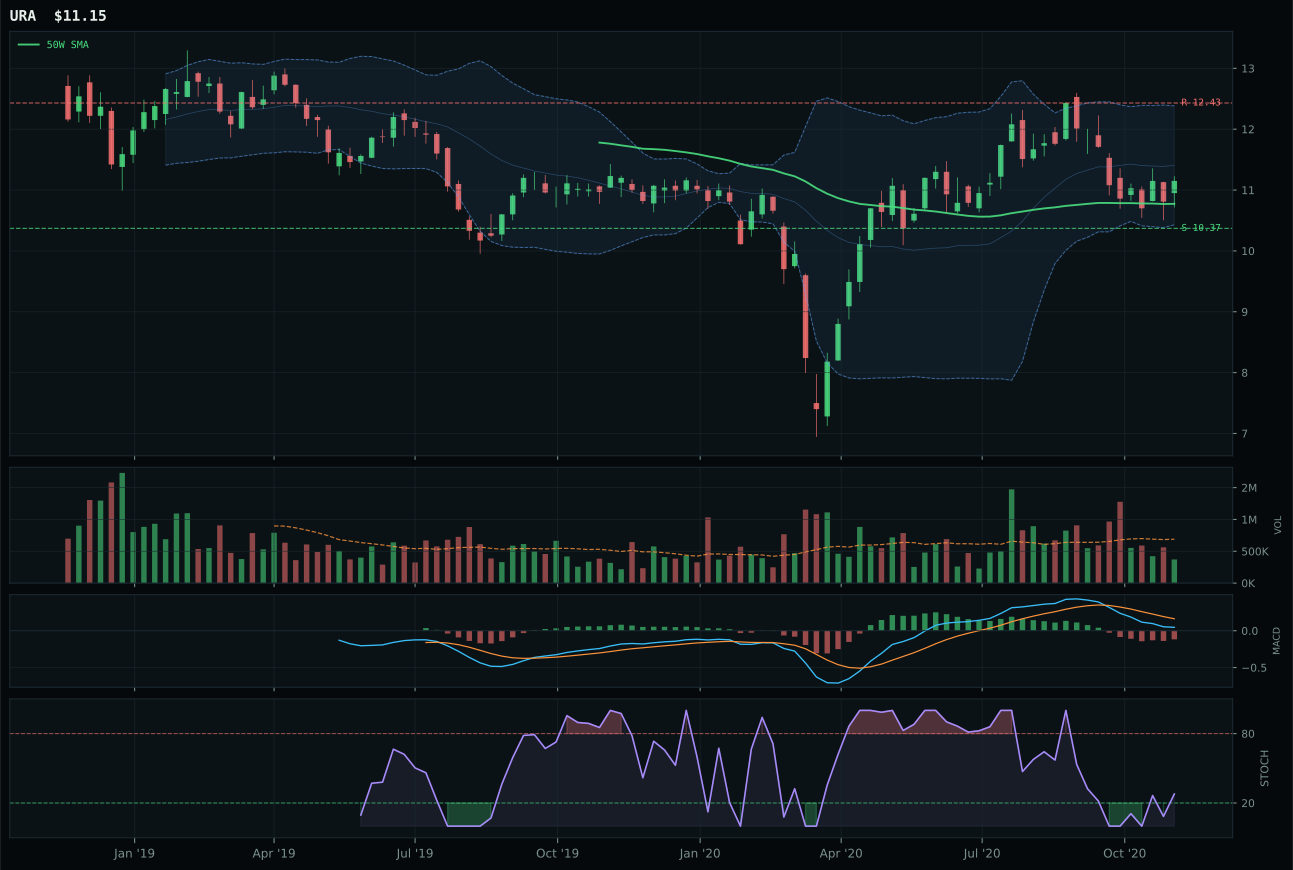
URA has a neutral structure profile with -9.1% 13-week relative strength versus SPY.
A failed hold above support would weaken the setup.
Tracked, but not top-2 eligible because: .
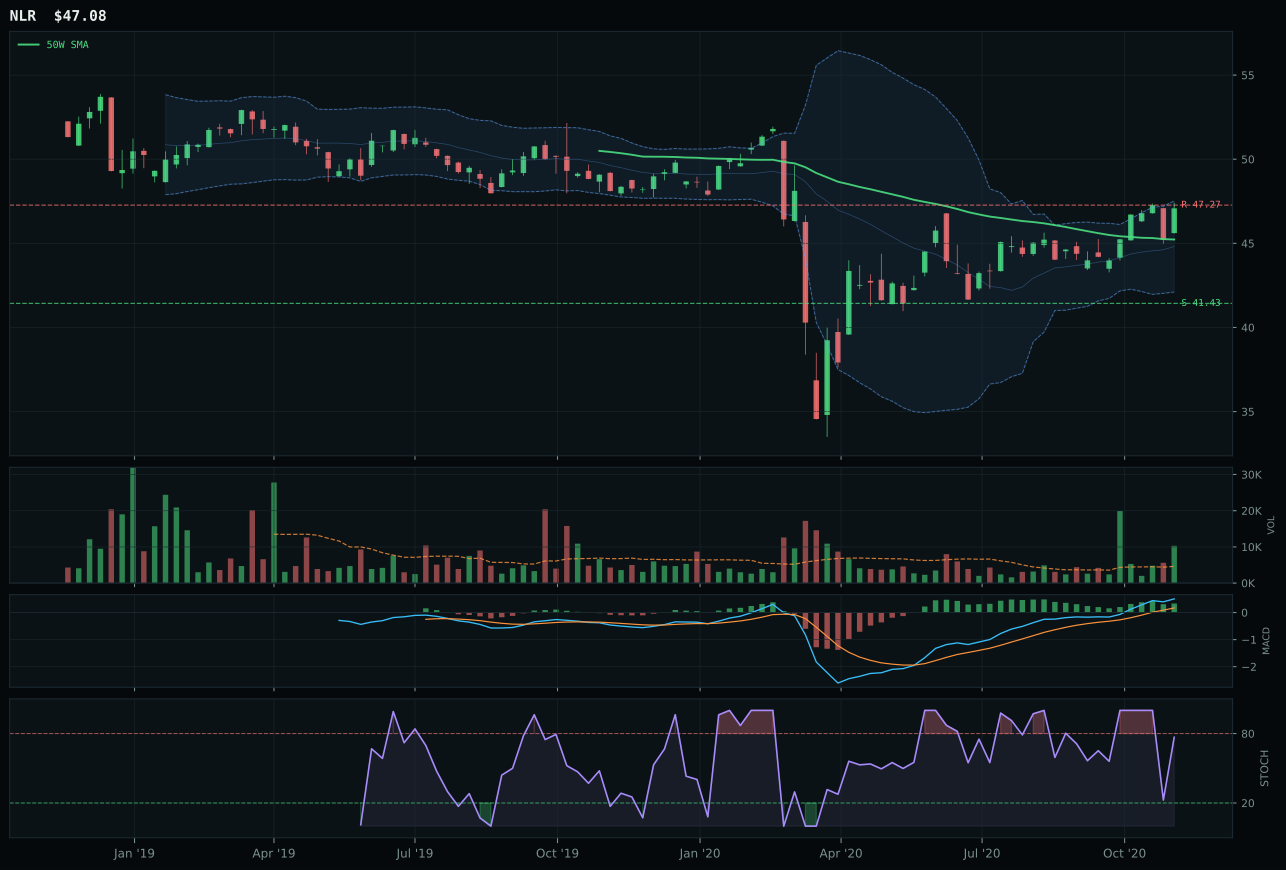
NLR has a neutral structure profile with -0.1% 13-week relative strength versus SPY.
A failed hold above support would weaken the setup.
Tracked, but not top-2 eligible because: .

URNM has a neutral structure profile with -13.6% 13-week relative strength versus SPY.
A failed hold above support would weaken the setup.
Tracked, but not top-2 eligible because: .
URA wins because timing is exceptional at 93 out of 100, reflecting a tight pullback just 3.5% below the 50-week moving average in the upper retracement zone where the risk-reward is balanced at 69.6. The structure is neutral and the support level at 10.37 is well-defined, offering a clear invalidation point if this trade fails. However, URA's thirteen-week return of -4.5%, SPY-relative strength of -9.1%, and momentum confirmation score of only 13.4 out of 100 are disqualifying weaknesses that no amount of timing perfection can overcome. NLR posted superior trend, momentum, and volume participation with a positive 4.5% thirteen-week return and bullish and improving MACD, but its timing score fell to 90 out of 100 and risk-reward deteriorated to 50.5 out of 100 because it is more extended from support. Neither setup has institutional conviction, and the category's final score of 28.1 reflects that both URA and NLR are coils waiting for catalysts rather than flowing trades with directional sponsors.
Nuclear Energy earned 0% allocation and was excluded from the portfolio entirely, ranking 10th among the ten categories with a hard-filter eligibility failure. The final score of 28.1 reflects broken momentum fundamentals despite passable technical structure; URA and NLR lack the thirteen-week returns, relative strength, or MACD conviction needed to justify capital deployment even in a supportive macro environment. The category's macro fit is 57 out of 100 with no dedicated sponsor—real asset sponsorship at +7 and ai growth sponsorship at +5 offer only modest support that cannot offset the lack of technical evidence. For Nuclear Energy to earn allocation, URA would need to post positive thirteen-week and twenty-six-week returns, print a bullish MACD confirmation, and demonstrate category-relative strength above 0.0%; NLR would need momentum confirmation to rise from 89 out of 100 to near-perfect levels to justify holding an extended setup. More fundamentally, the Goldilocks regime favors growth and risk assets over defensive nuclear exposure, so even excellent technicals would face macro headwinds. This category is entirely out of the portfolio pending a regime shift toward stagflation or risk-off.
Traditional Energy — XLE
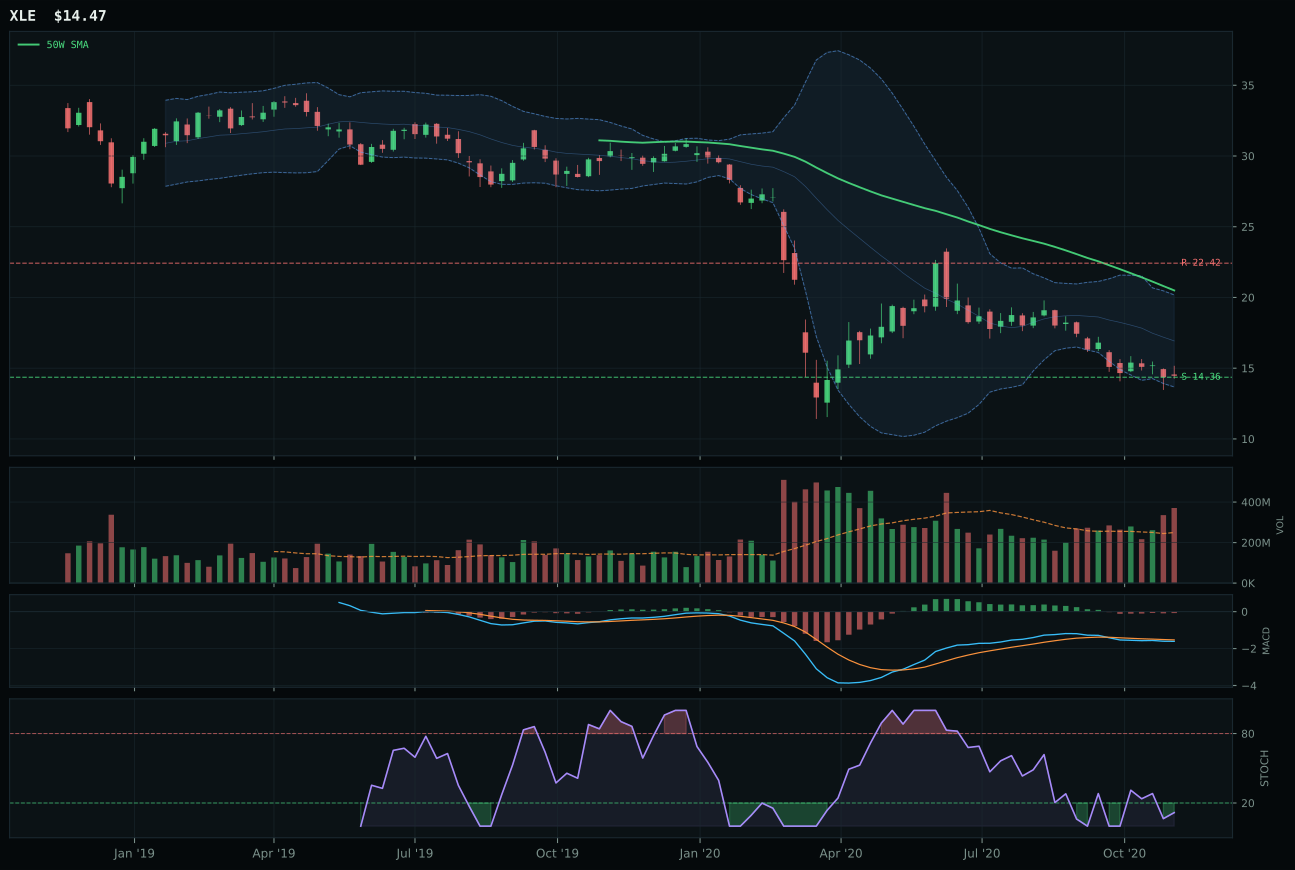
XLE has a pullback into support profile with -26.8% 13-week relative strength versus SPY.
Extension and support failure are the main tactical risks.
Tracked, but not top-2 eligible because: structurally broken.
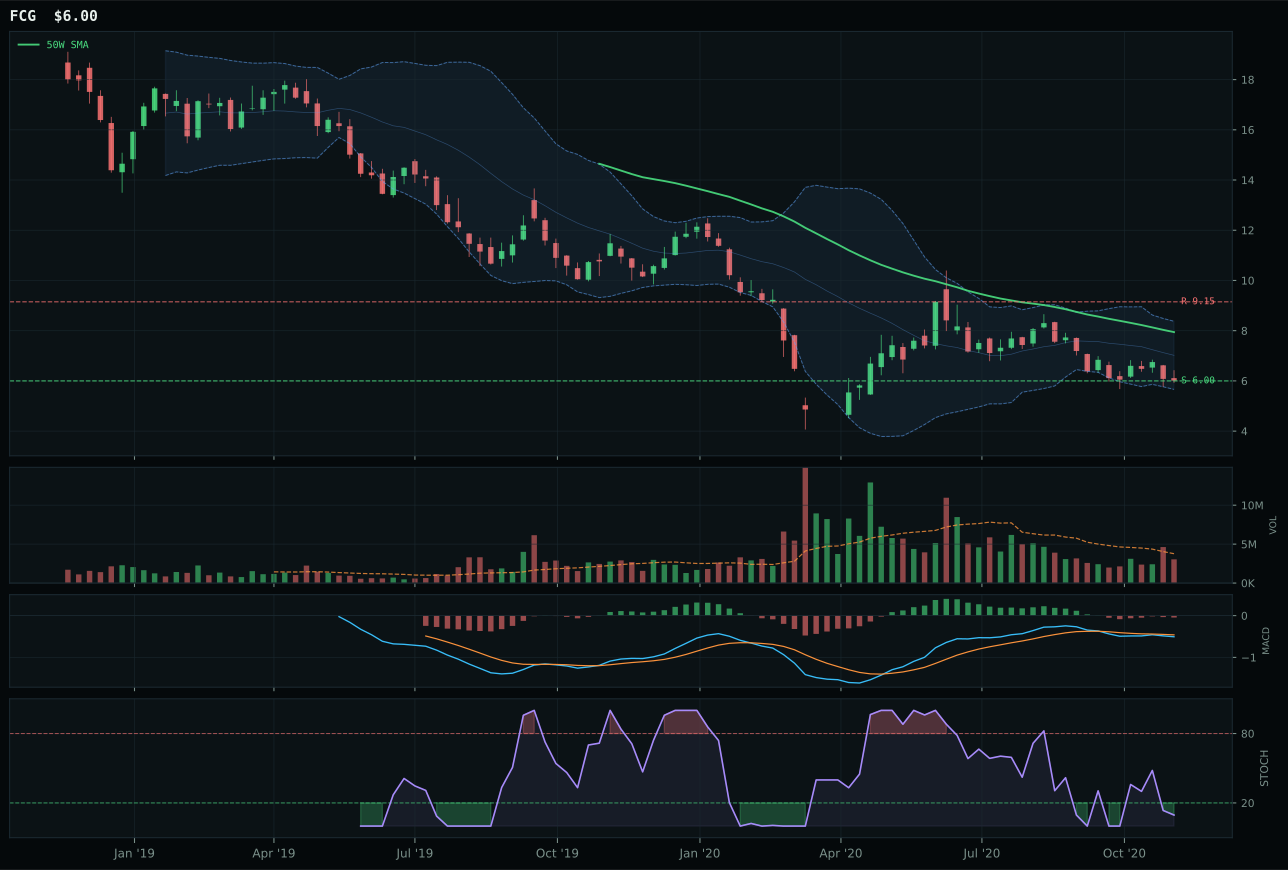
FCG has a pullback into support profile with -30.2% 13-week relative strength versus SPY.
Extension and support failure are the main tactical risks.
Tracked, but not top-2 eligible because: structurally broken.
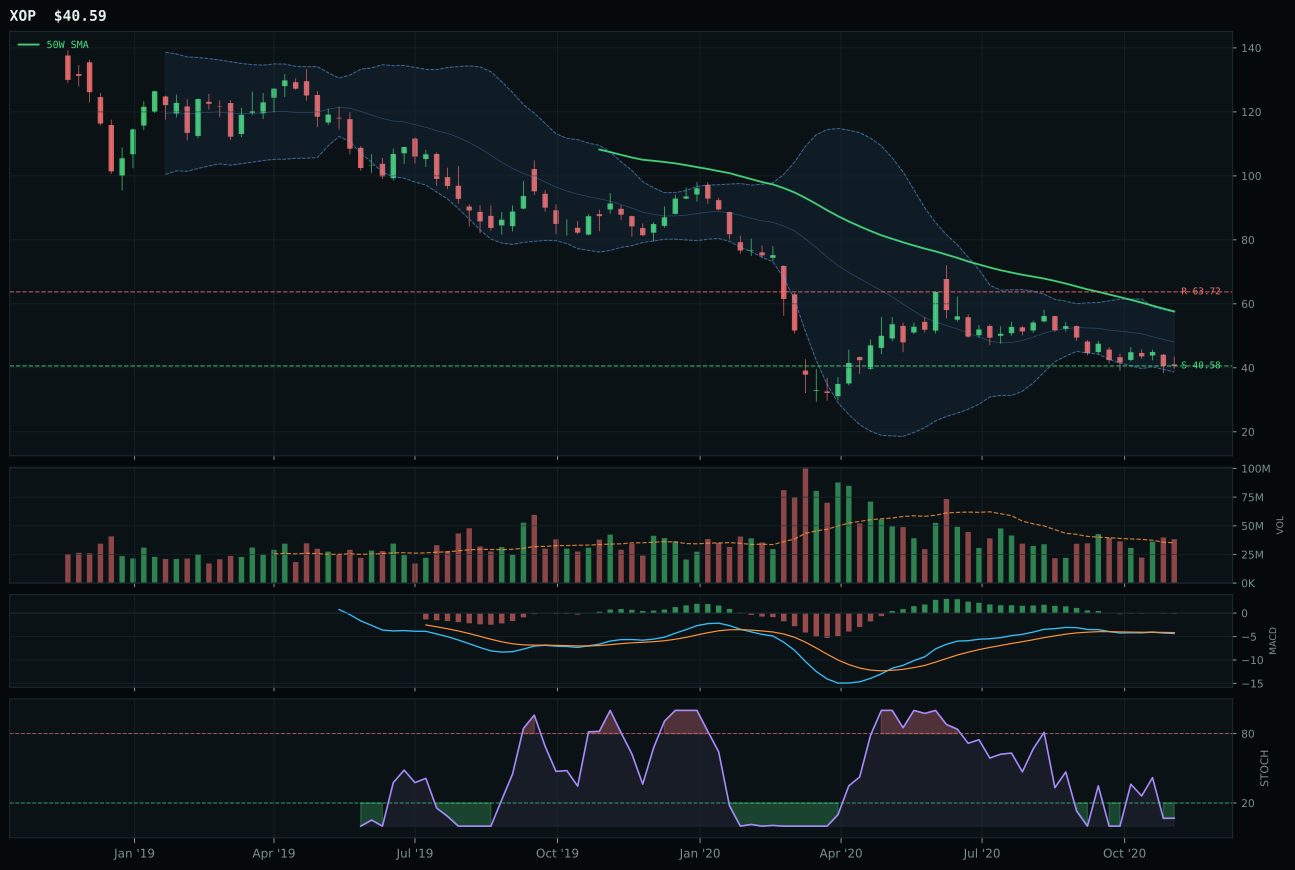
XOP has a pullback into support profile with -29.7% 13-week relative strength versus SPY.
Extension and support failure are the main tactical risks.
Tracked, but not top-2 eligible because: structurally broken.
XLE wins by default in a category that earned 0% allocation because all three peers—XLE, FCG, XOP—are structurally broken with momentum confirmation scores of 0 out of 100 and a combined category score that failed hard-filter eligibility. XLE's thirteen-week return of -22.2% and -26.8% relative strength versus SPY would normally be disqualifying on their own, but the portfolio system evaluated XLE marginally less damaged than its peers because it holds above the 200-week moving average and has above-average volume participation at 1.48x, offering at least the theoretical setup of a potential bounce into support. The timing score of 65 reflects a pullback into an oversold stochastic RSI at 0.12 near the 52-week low, creating a defined support level at 14.36 if this trade were ever to be considered. However, MACD is only bearish but improving, not bullish, and the risk-reward of 75 out of 100 is inverted—35.5% upside to resistance versus only 0.7% downside to support—which signals this is a classic down-trap setup where rallies get sold.
Traditional Energy earned 0% allocation and was excluded from the portfolio entirely, ranking 9th among the ten categories. The final score of 0.0 reflects a hard-filter failure on eligibility due to structurally broken technical conditions and zero momentum confirmation, meaning the system explicitly rejected this trade rather than marking it down to a low tier-2 allocation. Disinflation pressure at -10 and credit stress at -7 are macro headwinds that directly contradict the growth assumptions needed to justify energy exposure in Goldilocks. XLE's five-year, twenty-six-week return of -25.4% and thirteen-week return of -22.2% indicate this is a structural bear market, not a tactical pullback. For Traditional Energy to earn even a 5% allocation, XLE would need to print a bullish MACD confirmation with improving histogram, post positive thirteen-week and twenty-six-week returns, and demonstrate category-relative strength of at least 0% on a relative basis. More importantly, the macro regime would need to shift away from disinflation and risk-appetite strength; until those two conditions change, energy remains toxic in this allocation framework regardless of technical repair.