
2020-10-30
Informational purposes only. The content in this report, including allocations, analysis, and commentary, is provided solely for informational and educational purposes. It does not constitute financial advice, investment advice, trading advice, or any other type of advice. Past performance does not guarantee future results. Always conduct your own research and consult a qualified financial professional before making investment decisions.
Some tracked tickers were excluded due to missing live weekly price data: SGOV: Historical cache SGOV has only 22 usable weekly bars
Weekly Allocation
| Ticker | Category | Weight | Role |
|---|---|---|---|
| FSOL | 50% | Overlay | |
| REMX | Industrial Metals | 10% | Top-2 (10%) |
| IEMG | Emerging Markets | 10% | Top-2 (10%) |
| SMH | AI | 5% | Tier-2 (5%) |
| XLK | Technology | 5% | Tier-2 (5%) |
| XLU | Utilities & Infrastructure | 5% | Tier-2 (5%) |
| MOO | Agriculture & Livestock | 5% | Tier-2 (5%) |
| SLV | Precious Metals | 5% | Tier-2 (5%) |
| XAR | Defense & Aerospace | 5% | Tier-2 (5%) |
Trade Instructions — Monday Open
Sell the tranche from 2020-10-02 (completing its 4-week hold). Buy the new tranche. Instructions show net portfolio changes — same-asset positions cancel, weight changes show the delta.
| Action | Ticker | Instruction |
|---|---|---|
| SELL | BOTZ | Sell entire BOTZ position (2.50% of portfolio) |
| SELL | INDA | Sell 50% of INDA position (reduce 5.00% → 2.50%) |
| SELL | IGV | Sell 20% of IGV position (reduce 6.25% → 5.00%) |
| SELL | PICK | Sell entire PICK position (1.25% of portfolio) |
| SELL | GLD | Sell 33% of GLD position (reduce 3.75% → 2.50%) |
| BUY | SMH | Buy SMH — 14.29% of freed cash (adds 1.25% to portfolio) |
| BUY | REMX | Buy REMX — 28.57% of freed cash (adds 2.50% to portfolio) |
| BUY | IEMG | Buy IEMG — 28.57% of freed cash (adds 2.50% to portfolio) |
| BUY | XLK | Buy XLK — 14.29% of freed cash (adds 1.25% to portfolio) |
| BUY | SLV | Buy SLV — 14.29% of freed cash (adds 1.25% to portfolio) |
Current Portfolio After Trade
Combined holdings across all 4 active tranches. Each tranche is 25% of the portfolio.
| Ticker | % of Portfolio | Weight Bar |
|---|---|---|
| FSOL | 50.00% | |
| SMH | 8.75% | |
| IGV | 5.00% | |
| MOO | 5.00% | |
| XAR | 5.00% | |
| PAVE | 3.75% | |
| REMX | 3.75% | |
| COPX | 3.75% | |
| IEMG | 3.75% | |
| GLD | 2.50% | |
| INDA | 2.50% | |
| XLU | 2.50% | |
| XLE | 1.25% | |
| XLK | 1.25% | |
| SLV | 1.25% |
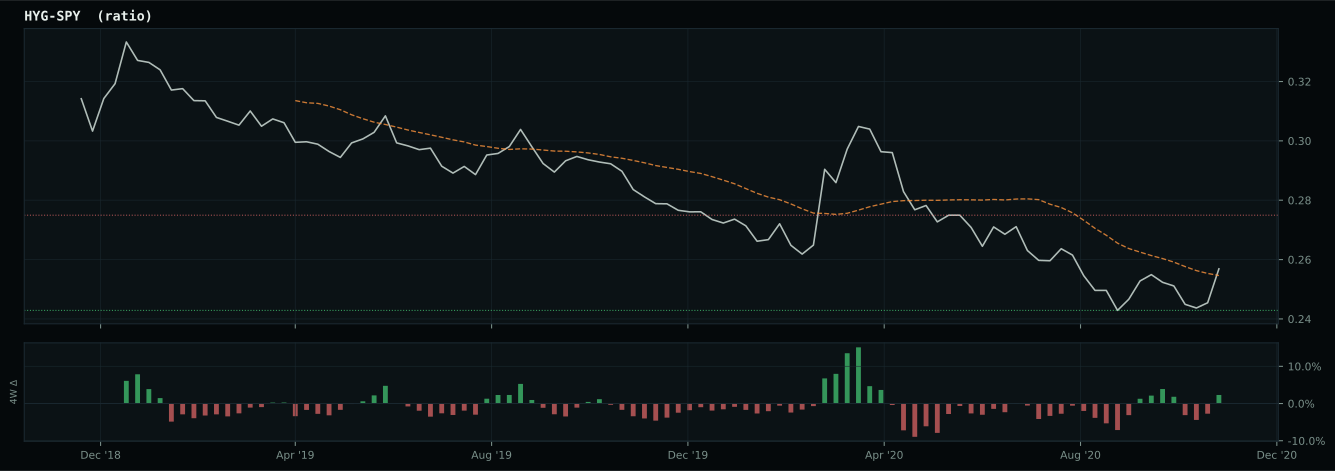
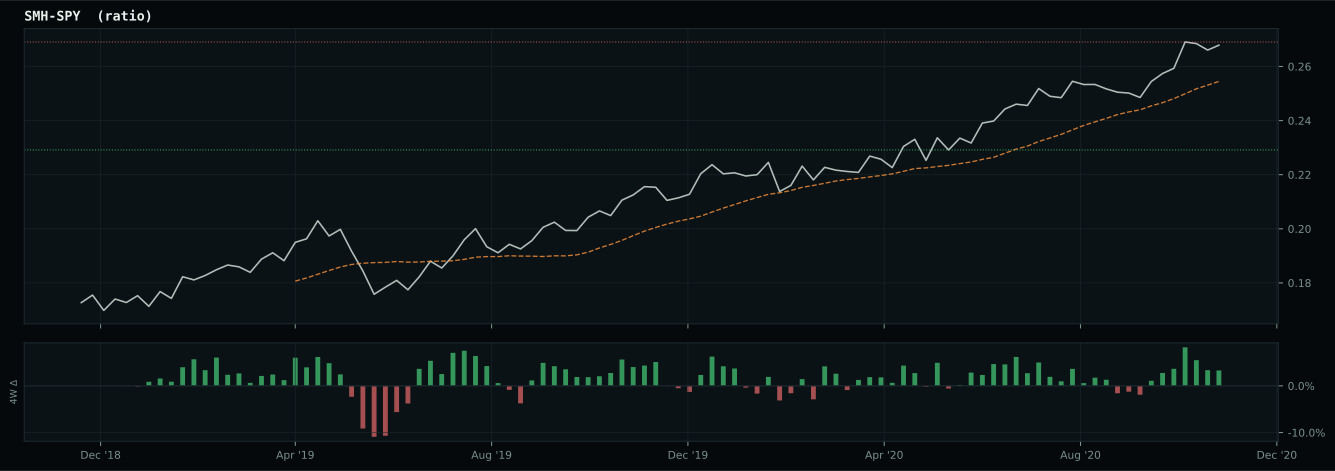
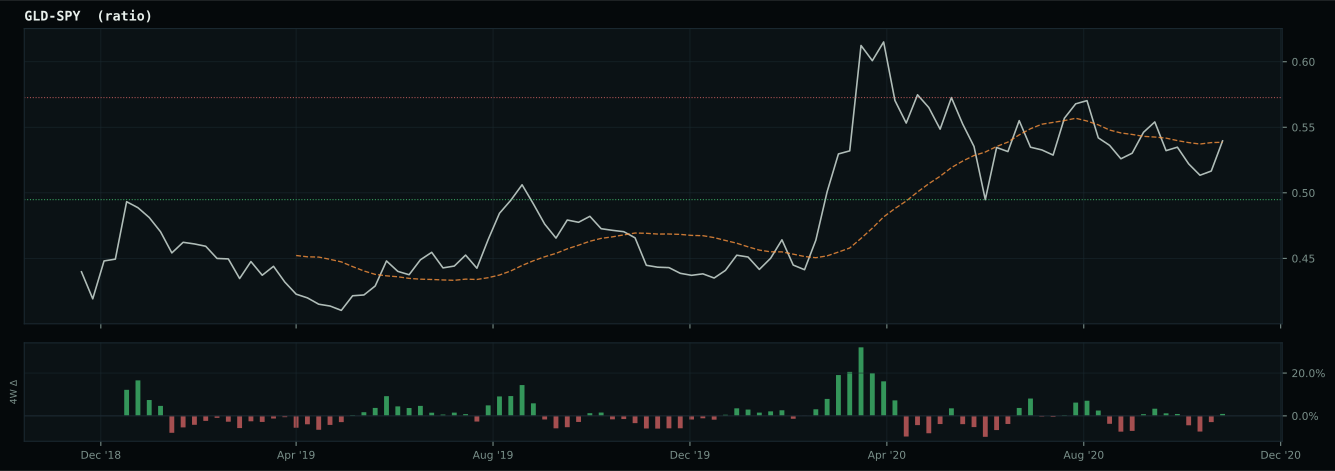
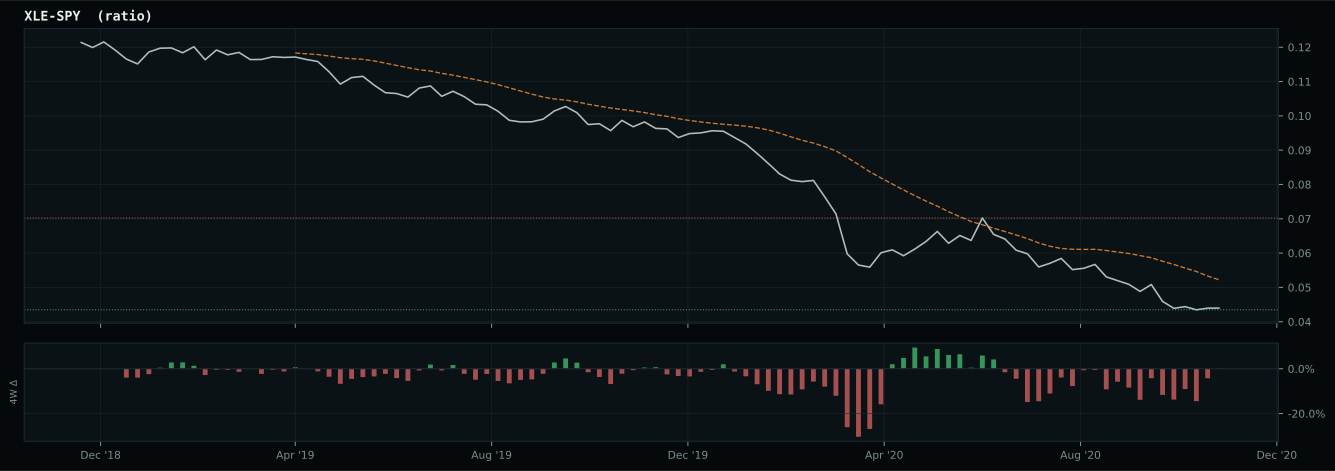
Macro Regime — Goldilocks
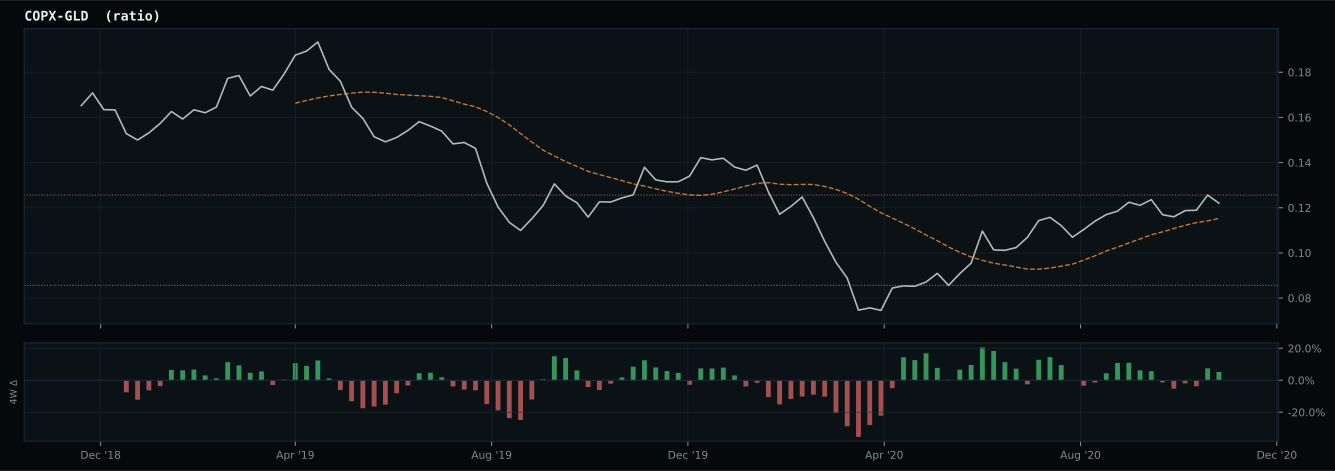
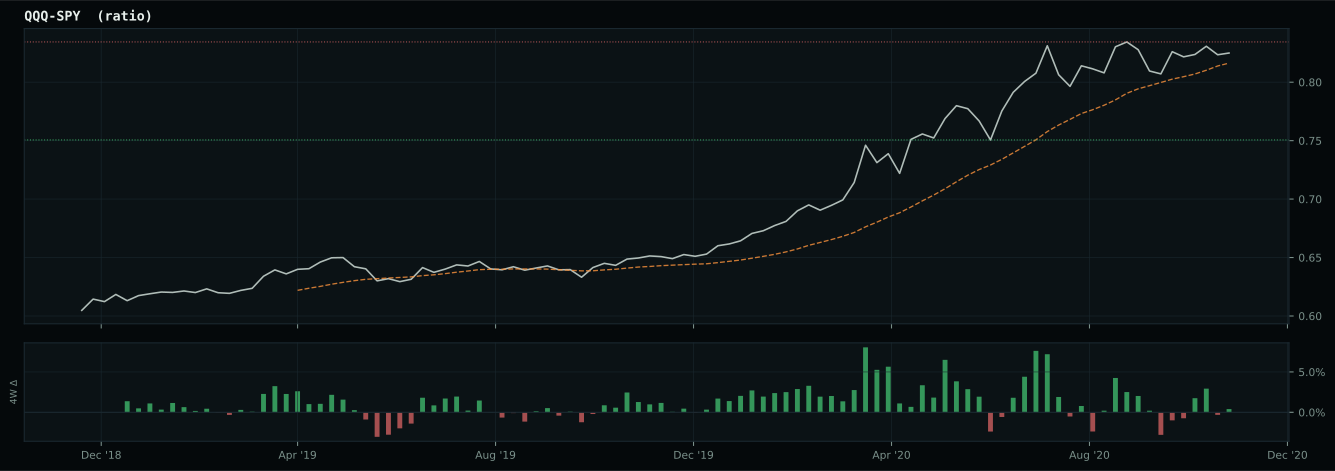
Macro Evidence Charts
Market-implied signals behind the macro regime scores. Each ratio compares two assets; the direction and slope of the ratio is what the macro engine reads.
Crypto Regime — AltSeason
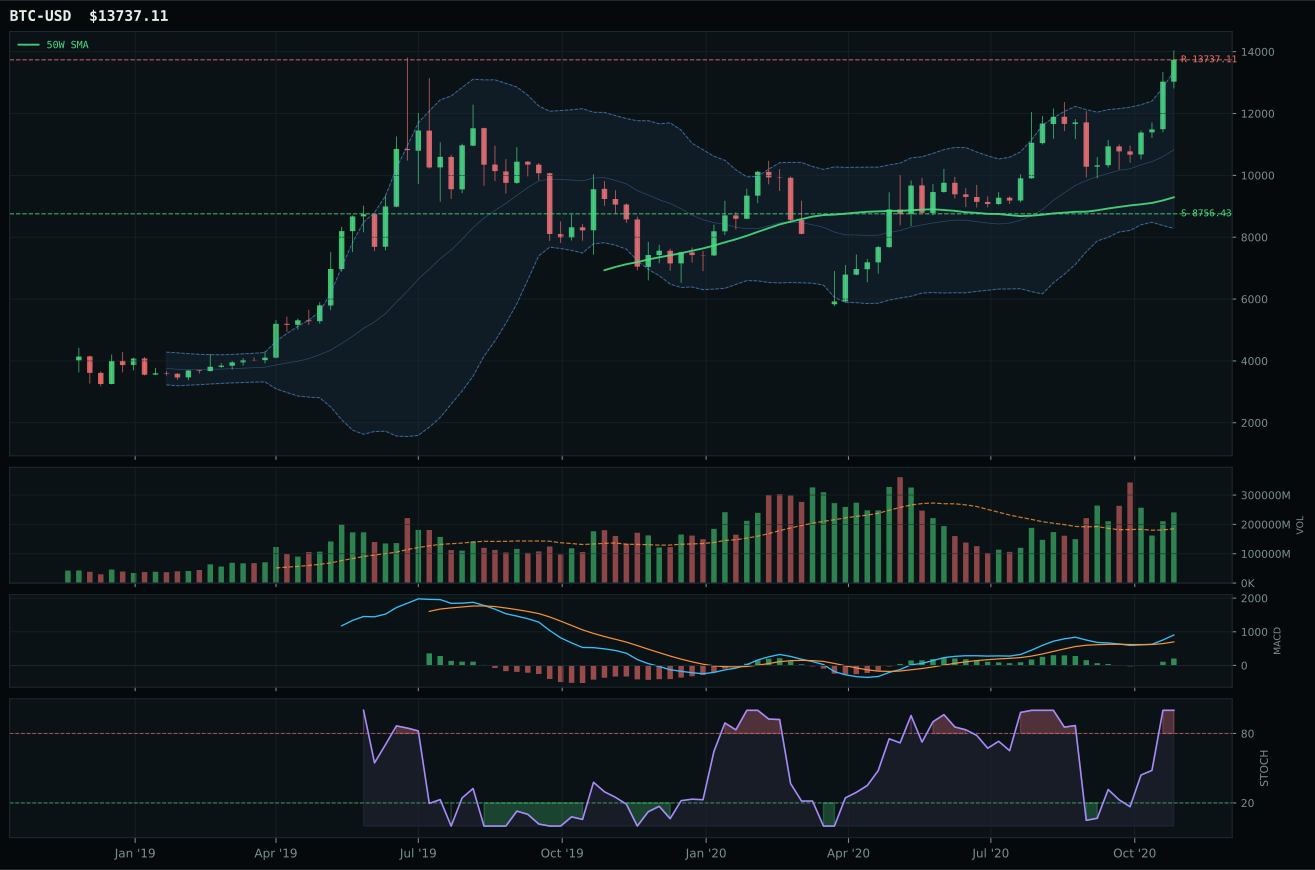
post-touch structure is too wide to count as a range; max/min close ratio is 2.42
TrendBTC confirmed: 2 consecutive closes above rising/flat 50W SMA
all available AltSeason conditions pass; missing optional confirmations skipped

Category Rankings
| Rank | Category | Winner | Score | Alloc | 4W Ret | Peers (4W) |
|---|---|---|---|---|---|---|
| 1 | Industrial Metals | REMX | 59.8 | 20% | +37.60% | COPX +24.3% · PICK +22.0% |
| 2 | Emerging Markets | IEMG | 59.0 | 20% | +9.64% | INDA +9.9% · ILF +26.1% |
| 3 | AI | SMH | 50.8 | 10% | +17.14% | BOTZ +14.5% · AIQ +11.1% |
| 4 | Technology | XLK | 46.1 | 10% | +9.77% | IGV +9.5% · CIBR +14.9% |
| 5 | Utilities & Infrastructure | XLU | 43.6 | 10% | +0.55% | PAVE +16.5% · IGF +13.5% |
| 6 | Agriculture & Livestock | MOO | 38.1 | 10% | +12.66% | WEAT +1.4% · VEGI +14.5% |
| 7 | Precious Metals | SLV | 33.8 | 10% | -7.18% | GLD -6.1% · GDX -10.8% |
| 8 | Defense & Aerospace | XAR | 32.7 | 10% | +26.81% | ROKT +19.5% · ITA +23.1% |
| 9 | Nuclear Energy | URA | 27.2 | 0% | +8.22% | NLR +5.9% · URNM +10.6% |
| 10 | Traditional Energy | XLE | — | 0% | +32.19% | FCG +41.7% · XOP +39.3% |
Industrial Metals — REMX
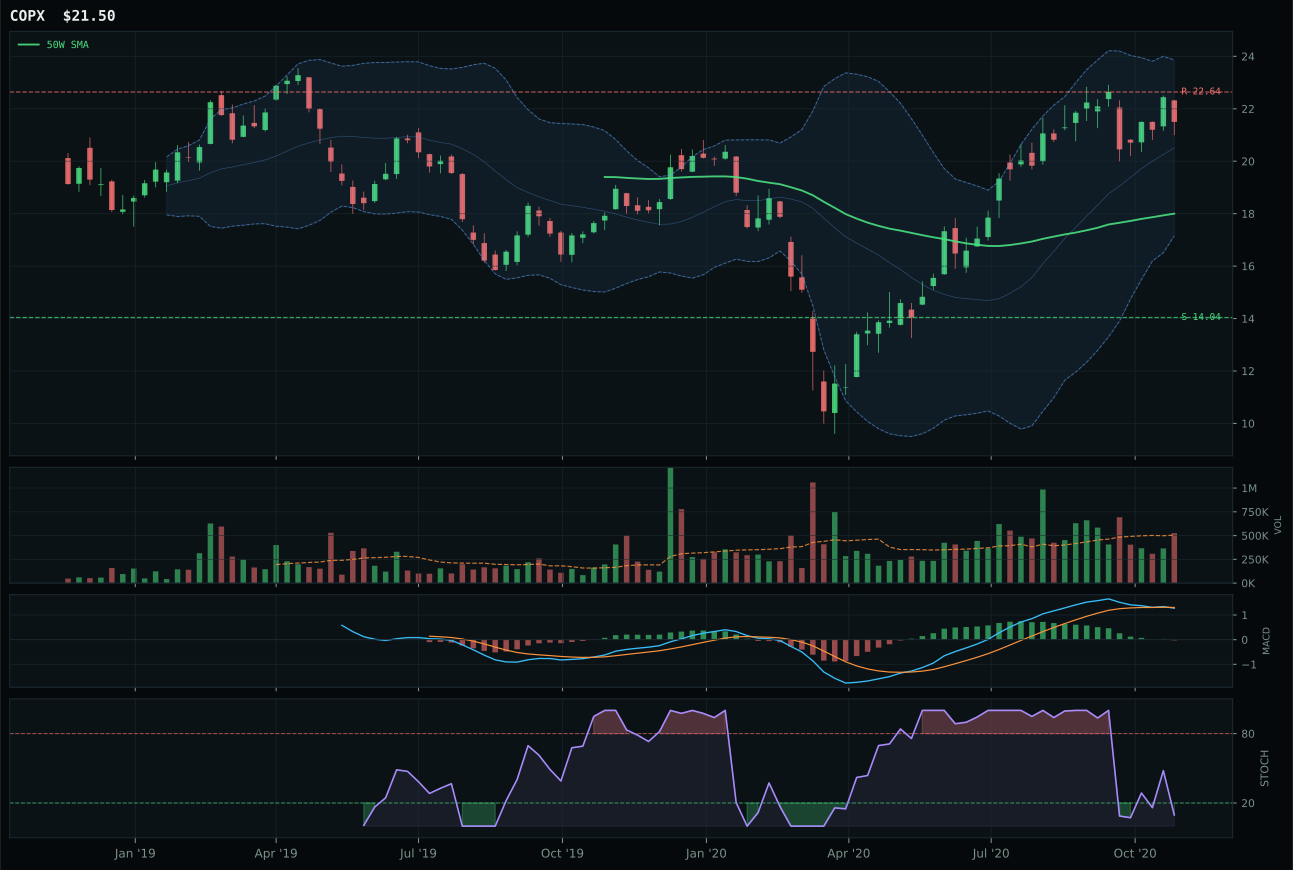
COPX has a vertical extension profile with 8.4% 13-week relative strength versus SPY.
A failed hold above support would weaken the setup.
Actionable but governed by invalidation levels.
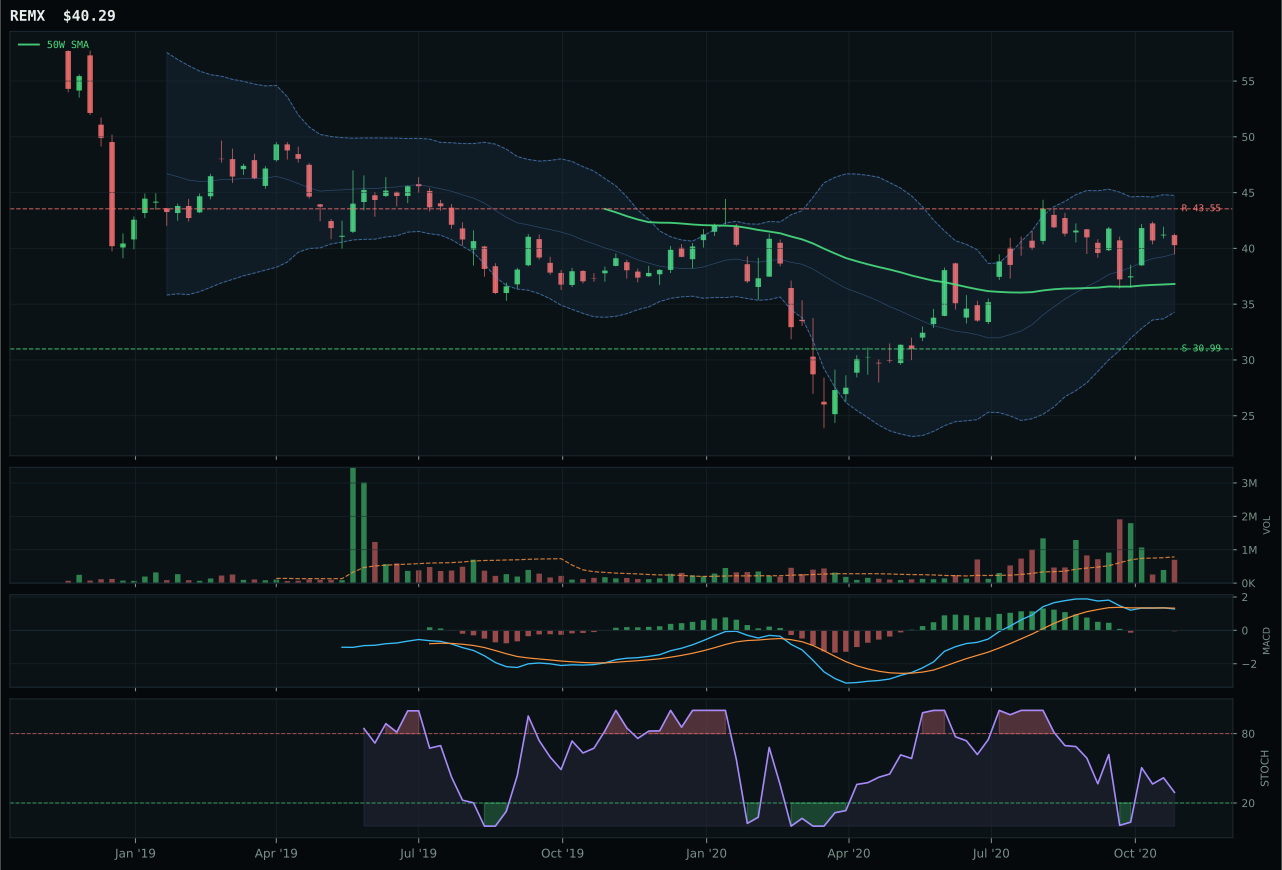
REMX has a neutral structure profile with 0.6% 13-week relative strength versus SPY.
A failed hold above support would weaken the setup.
Actionable but governed by invalidation levels.
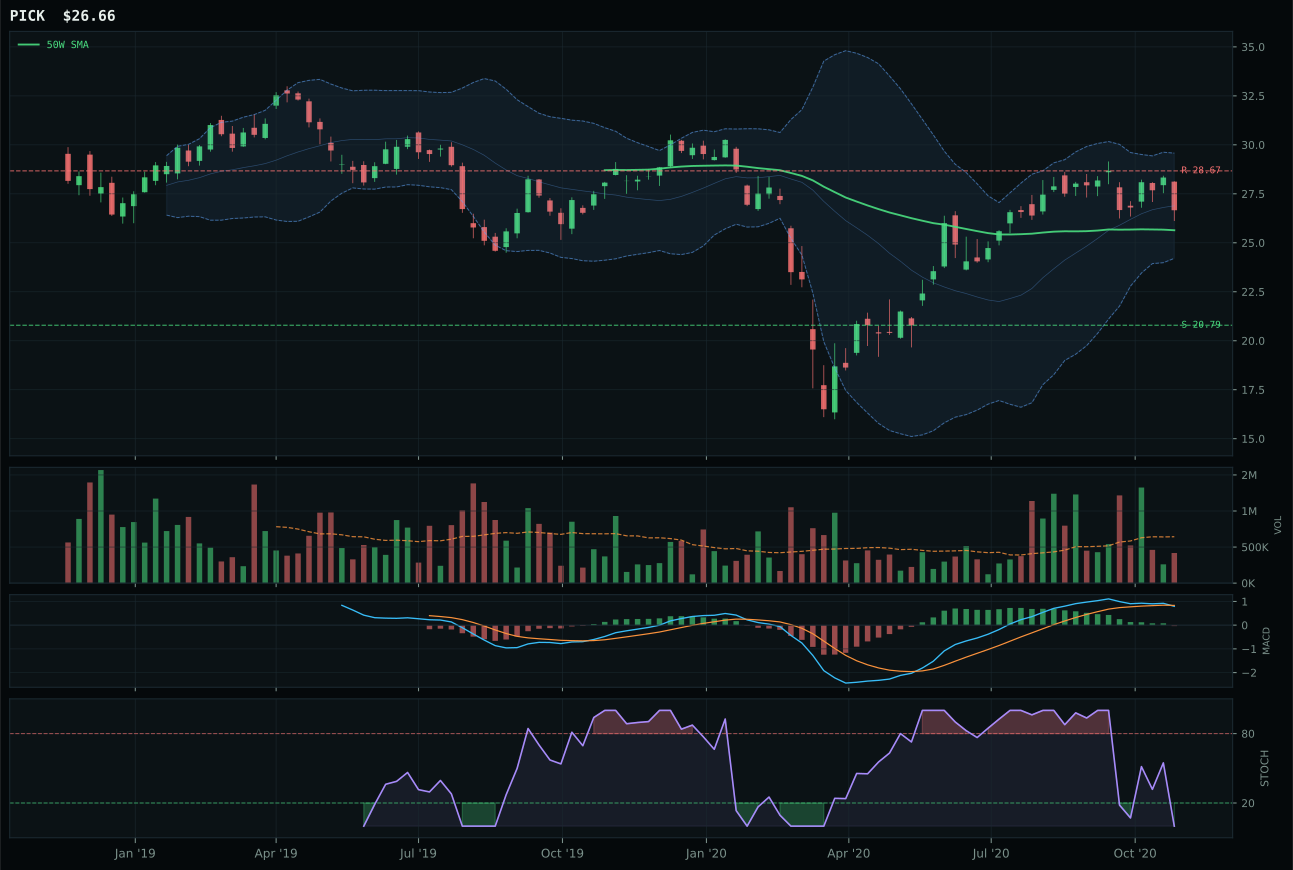
PICK has a neutral structure profile with 1.0% 13-week relative strength versus SPY.
A failed hold above support would weaken the setup.
Actionable but governed by invalidation levels.
REMX earned top-2 status by presenting a disciplined mean-reversion setup that directly counters the extended posture of COPX. Trading 9.5% below the 50W with MACD bearish but actively improving—not flattening—REMX offers the risk asymmetry that COPX sacrificed through its 19.4% extension. Both metals scarcity descriptors favor COPX's copper exposure, yet REMX's neutral structure and falling stochastic RSI (0.29 versus COPX's oversold 0.00) reveal a setup with further compression and recovery room. The 75.0 timing score reflects REMX's proximity to support and MACD improvement phase; COPX's 48.0 timing penalty for vertical extension is the technical price of its 8.4% relative strength. Category-relative strength sits nearly flat, meaning neither is leading internally—REMX won by resisting extension, not by chasing momentum.
Industrial Metals scores 59.8 and earns top-2 selection with 10% allocation, representing the strongest macro sponsorship in the portfolio this week. The 79.0 macro-fit reading is exceptional: metals scarcity (+14), commodity breadth positive (+10), and real asset sponsorship (+6) create a trinity of support that outweighs credit stress (-7). Goldilocks regime adds +6, pushing the macro narrative to near-conviction levels. REMX's technical evidence of 62.3 is solid rather than dominant—trend at 73.8 is healthy but structure at 66.8 reveals consolidation, not breakout—yet the timing score of 75.0 demonstrates that the setup is ready for directional resolution. Momentum confirmation at 66.2 is sufficient; persistence at 59.8 anchors the category score itself. REMX's 0.6% SPY-relative strength is neutral, but that neutrality inside an altseason regime means the category is being accumulated by macro players rather than chase-momentum traders. Industrial Metals ranks second among all categories because macro tailwinds are strongest here, technical setup is mature (neither stretched nor oversold), and volume participation is building from neutral baseline. This is a core conviction position.
Emerging Markets — IEMG
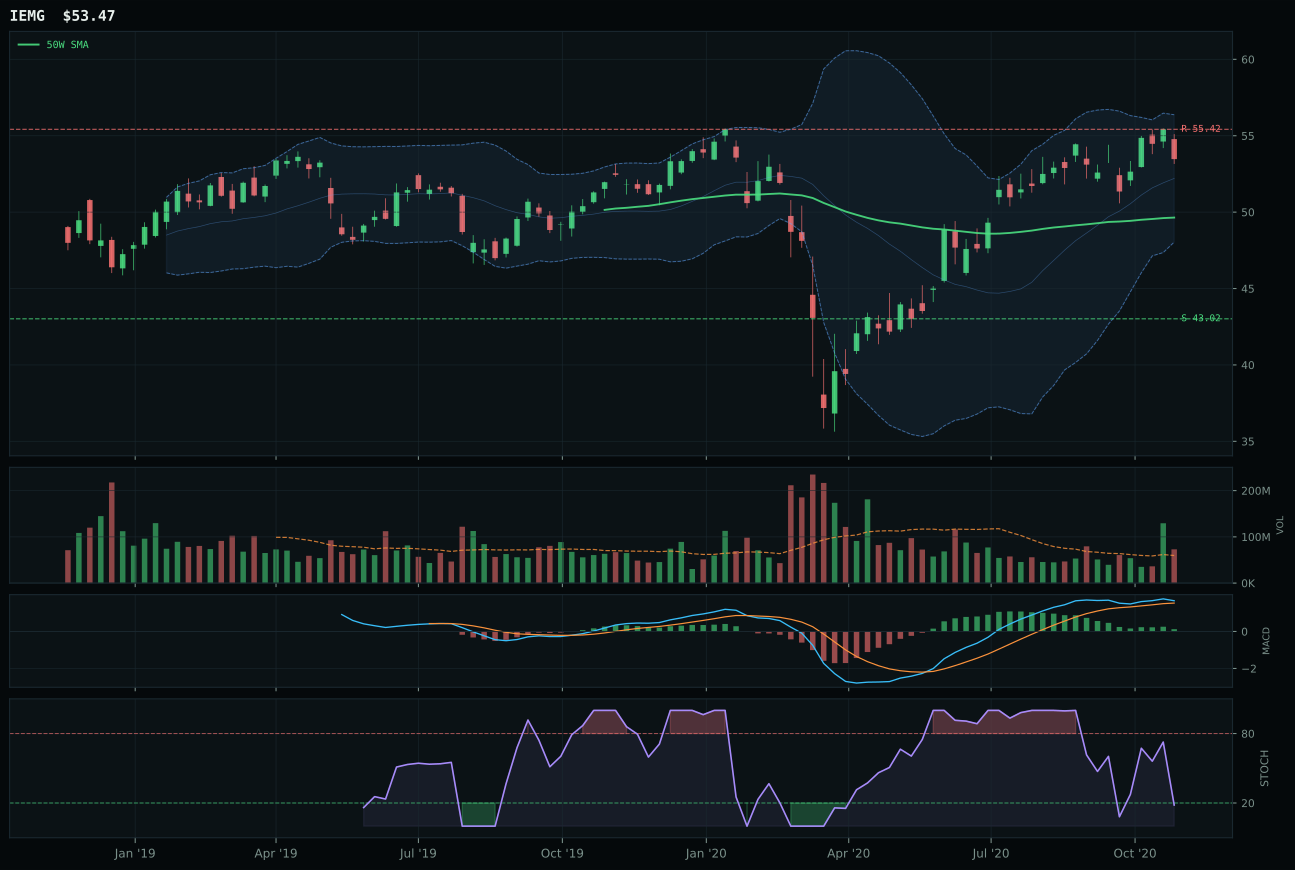
IEMG has a neutral structure profile with 3.4% 13-week relative strength versus SPY.
A failed hold above support would weaken the setup.
Actionable but governed by invalidation levels.
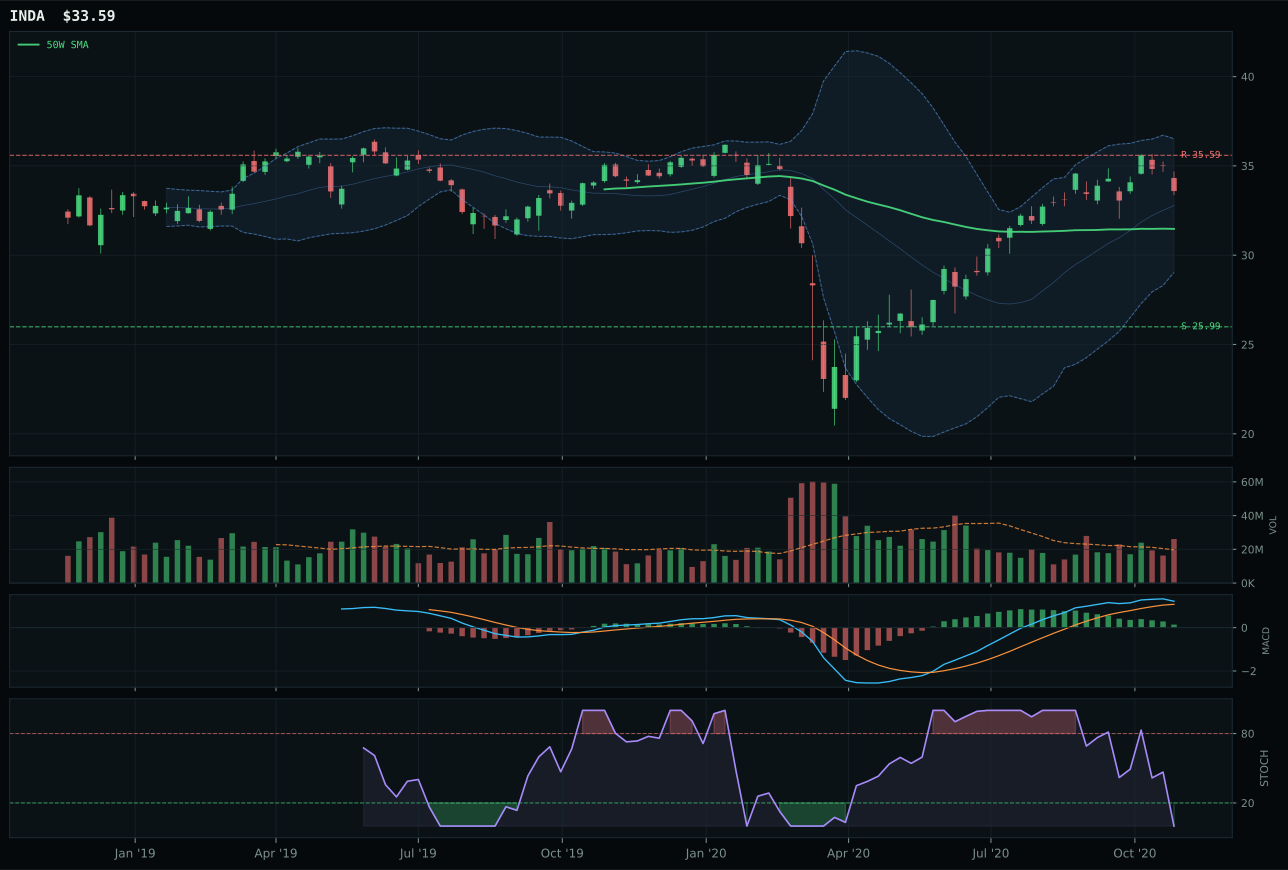
INDA has a neutral structure profile with 5.2% 13-week relative strength versus SPY.
A failed hold above support would weaken the setup.
Actionable but governed by invalidation levels.
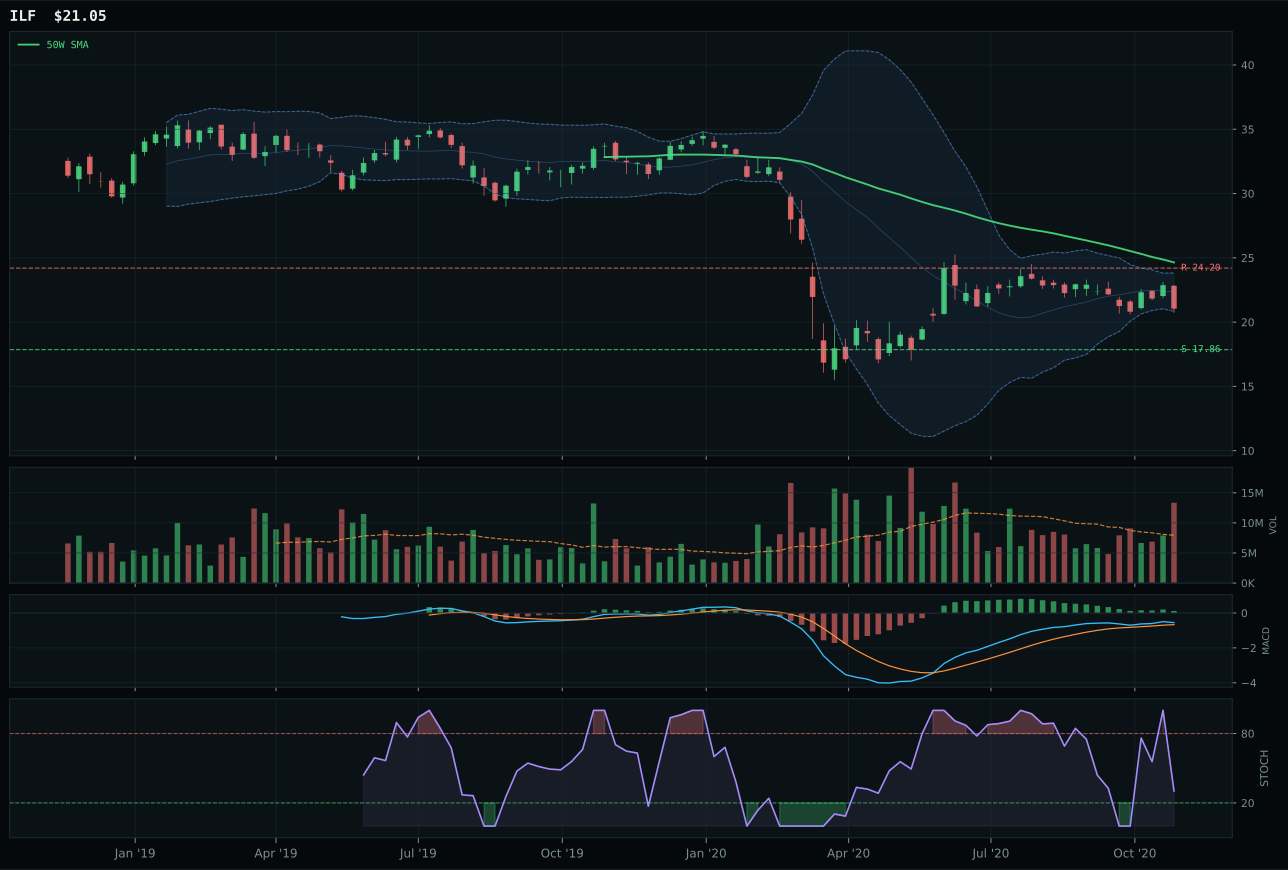
ILF has a neutral structure profile with -10.0% 13-week relative strength versus SPY.
Extension and support failure are the main tactical risks.
Tracked, but not top-2 eligible because: structurally broken.
IEMG secured top-2 status by presenting the cleanest risk-adjusted setup in the entire category: trend at an elite 100.0, structure neutral with solid compression, and timing optimized at just 7.7% from the 50W. The 3.4% relative strength isn't flashy, but combined with above-average volume participation and bullish MACD that's flattening (not deteriorating), it signals genuine accumulation into the move. INDA came within 1.1 points of matching this score, yet that margin reflects IEMG's superior macro fit: em liquidity support is described at +14 for IEMG versus +12 for INDA, a small but consistent advantage that compounds across the scoring rubric. Both face identical 70.0 timing and matching stochastic RSI oversold readings, but IEMG's perfect trend combined with structural cleanliness creates the category's best entry asymmetry.
Emerging Markets scores 59.0 and earns top-2 selection with 10% allocation, representing the second-strongest macro sponsorship and technical readiness in the portfolio. The 70.0 macro-fit score leans heavily on EM liquidity support (+14) and general liquidity expansion (+8), creating a tailwind specific to emerging-market flows in altseason. IEMG's technical evidence of 71.7 is strong across the board: trend at 100.0 is perfect, structure at 75.0 is clean neutral, and timing at 70.0 signals price is neither extended nor oversold. Momentum confirmation at 72.6 and persistence at 70.5 demonstrate that buyers are accumulated steadily, not in violent spikes. The 3.4% SPY-relative strength is modest—this is not a momentum chase—but in a Goldilocks regime with liquidity expansion active, emerging-market beta provides structural participation without requiring timing precision. IEMG ranks second among all categories because the macro narrative (EM liquidity, risk-on altseason) combines with solid technical confirmation and volume participation. The 10% allocation reflects core conviction that emerging-market capital flows are being re-engaged this week, with IEMG's broad index approach offering diversification over single-country concentration. This category joins Industrial Metals as the portfolio's two growth accelerators.
AI — SMH
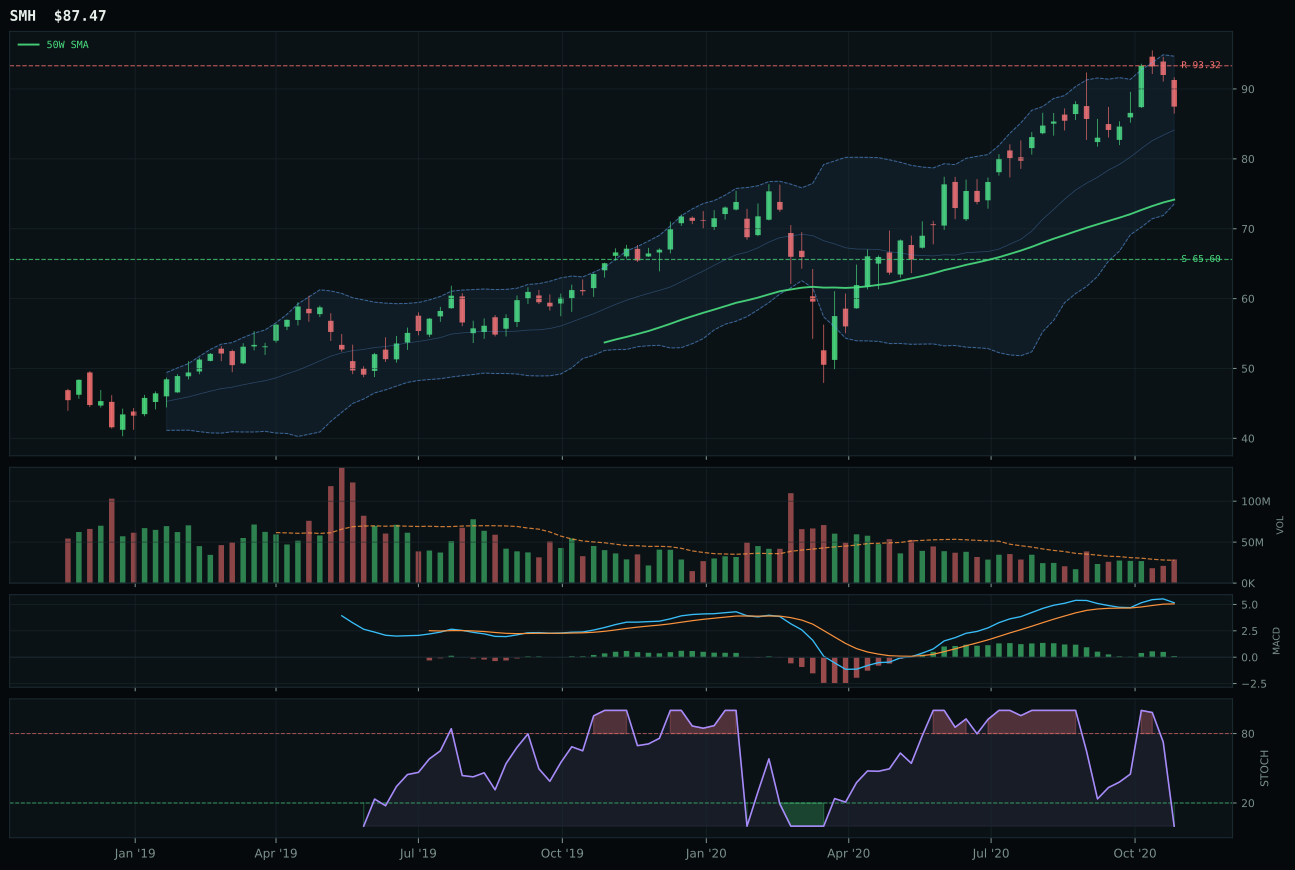
SMH has a vertical extension profile with 5.2% 13-week relative strength versus SPY.
A failed hold above support would weaken the setup.
Actionable but governed by invalidation levels.
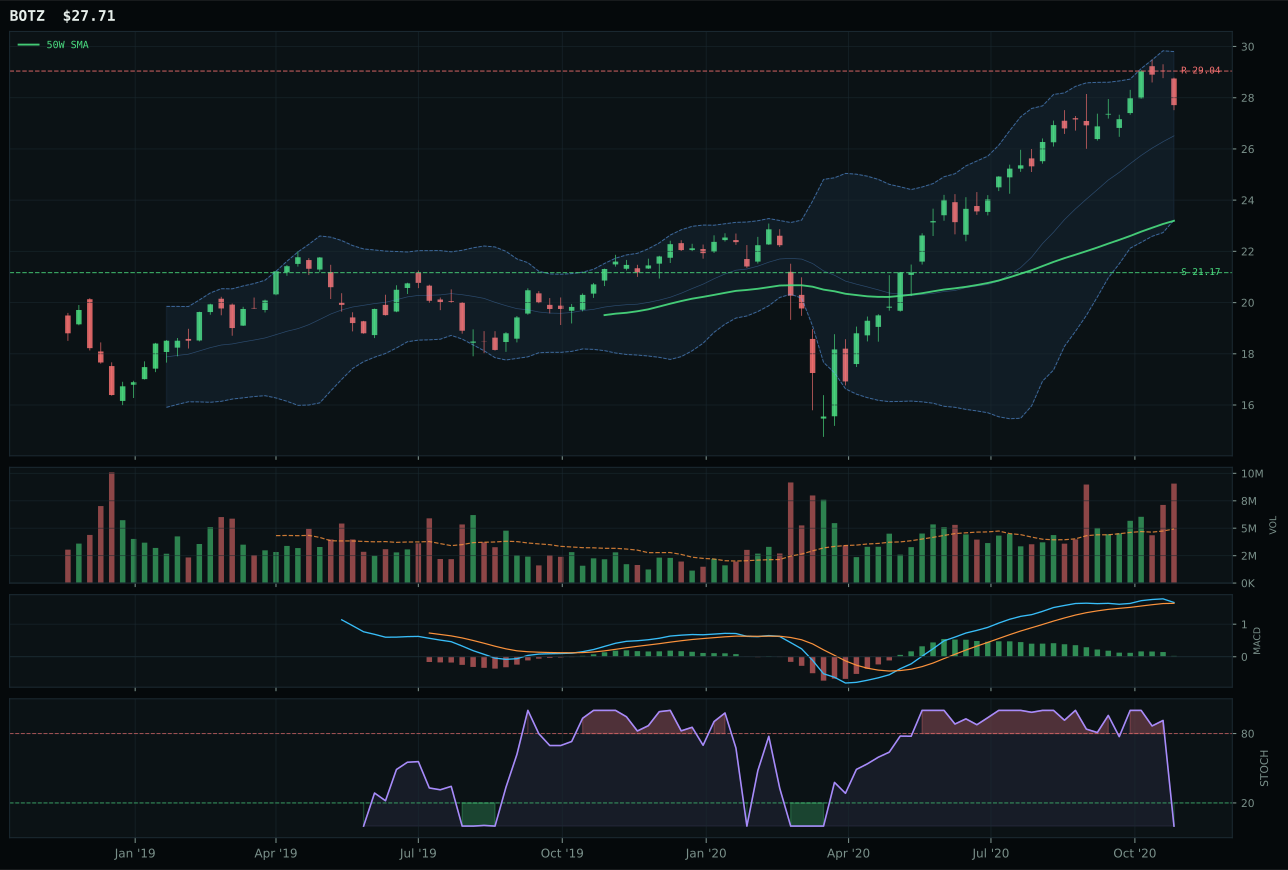
BOTZ has a vertical extension profile with 9.4% 13-week relative strength versus SPY.
A failed hold above support would weaken the setup.
Actionable but governed by invalidation levels.
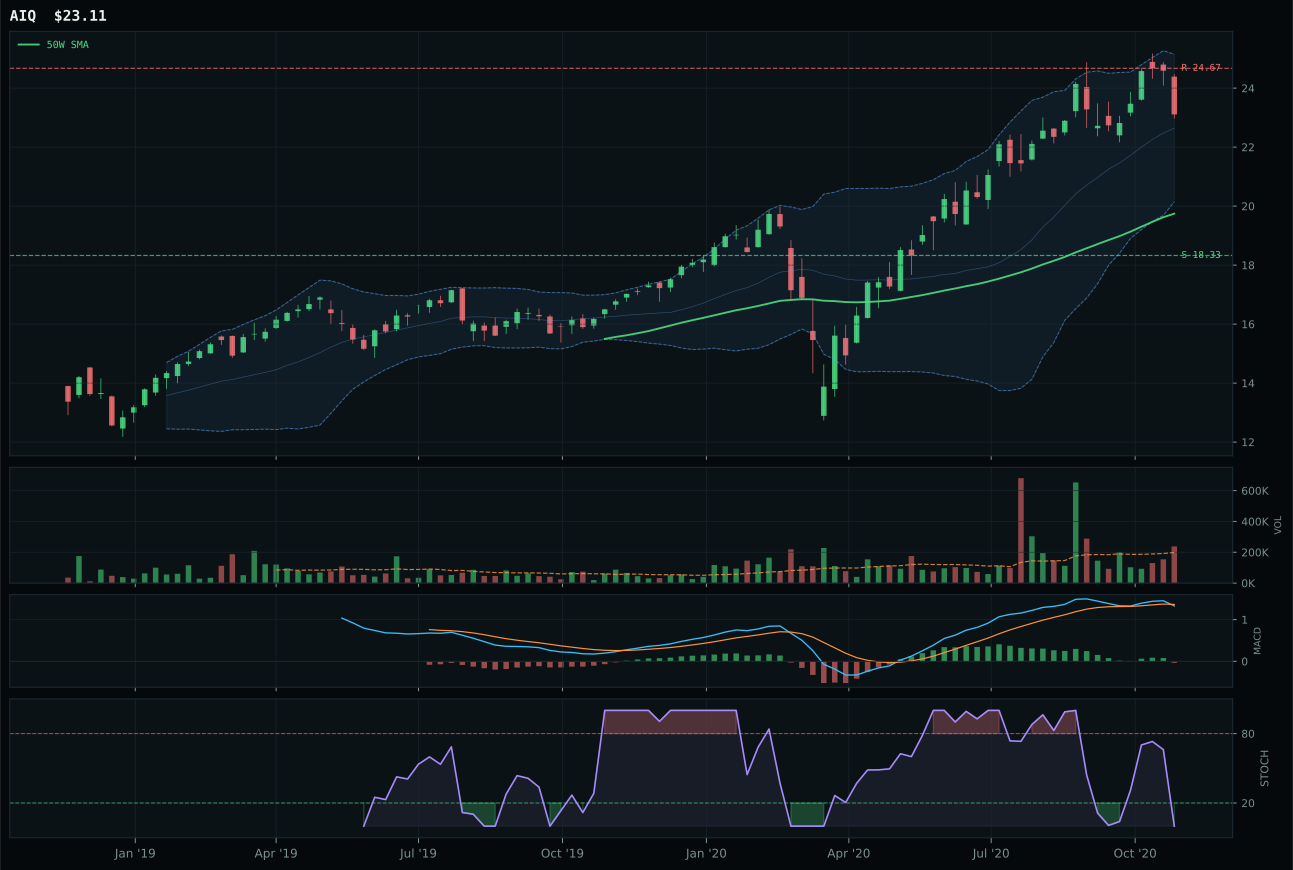
AIQ has a vertical extension profile with 4.5% 13-week relative strength versus SPY.
A failed hold above support would weaken the setup.
Tracked, but not top-2 eligible because: .
SMH dominated this category through perfect technical alignment with the macro narrative: a perfect 100.0 trend score combined with bullish MACD that is actively improving, not merely flattening. The 5.3% 13W return and 5.2% SPY-relative strength establish genuine leadership, and critically, BOTZ's MACD is only flattening while SMH's is still grinding higher, a distinction that matters enormously in momentum verification. Both faced the same -6.3% headwind to resistance and shared vertical extension setup, but SMH's neutral volume backdrop versus BOTZ's distribution pressure revealed which buyers were committed and which were already exiting. The 3.8-point score victory reflects disciplined setup analysis: SMH trades at legitimate momentum expansion, not extension into exhaustion.
AI scores 50.8 and receives 5% allocation—a solid secondary position that reflects top-tier technical strength meeting moderate macro fit. The category's 76.0 macro-fit reading receives the highest AI growth sponsorship score available (+14), yet this advantage does not translate to top-2 status because two categories posted higher composite scores. SMH's technical evidence of 69.2 is strong, but risk-reward at only 48.4 signals that upside to resistance is constrained to 6.3% while support sits 33.3% away—an inverted payoff structure in an extended regime. The Goldilocks macro state helps all growth categories equally, so AI does not benefit from regime differentiation relative to Industrial Metals or Emerging Markets. SMH remains in the portfolio because momentum confirmation (77.5) and persistence (73.2) are nearly alpha-level—the move has conviction—but the 5% sleeve acknowledges that entry-risk asymmetry prevents this from being a core conviction position in a rotation-heavy environment.
Technology — XLK
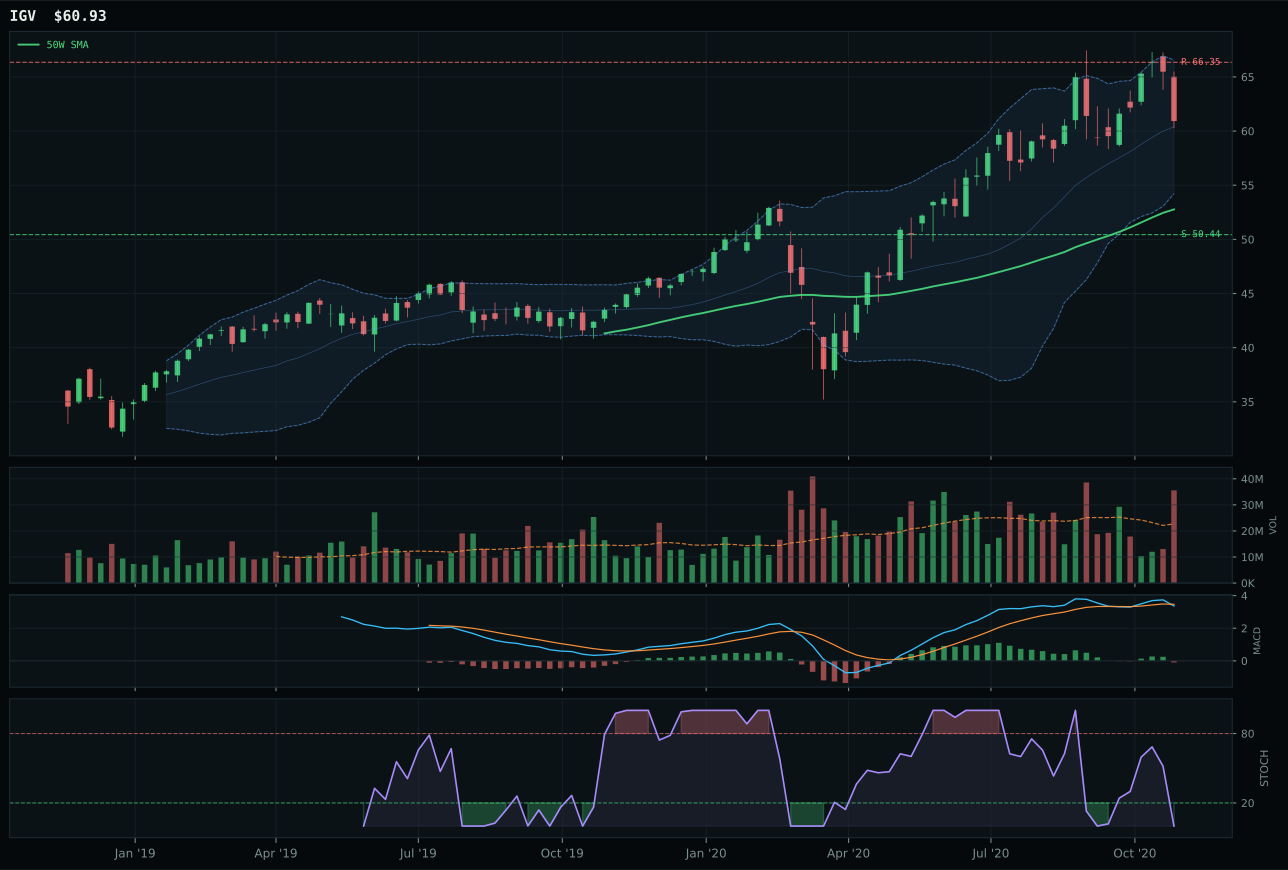
IGV has a vertical extension profile with 3.2% 13-week relative strength versus SPY.
A failed hold above support would weaken the setup.
Actionable but governed by invalidation levels.
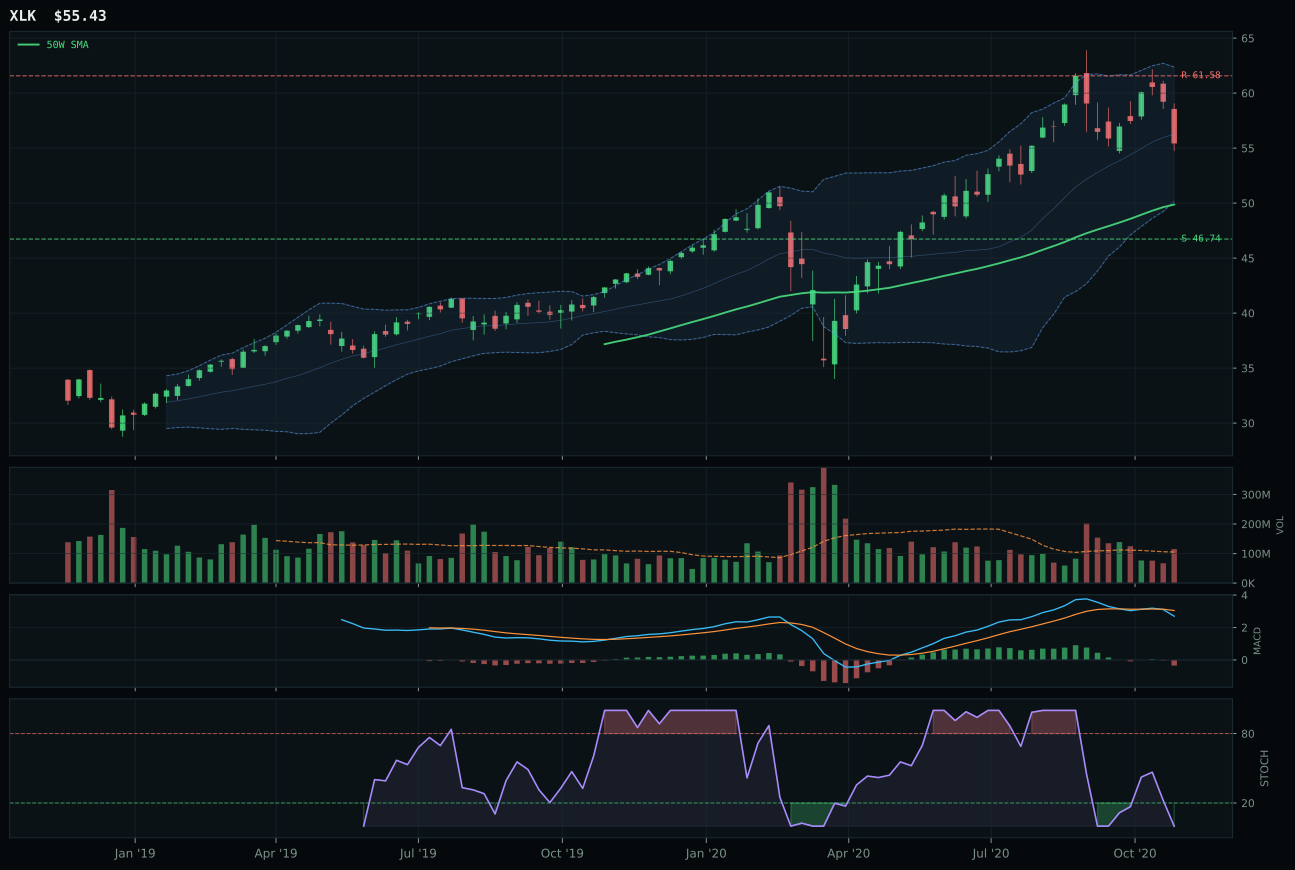
XLK has a neutral structure profile with 0.4% 13-week relative strength versus SPY.
A failed hold above support would weaken the setup.
Actionable but governed by invalidation levels.
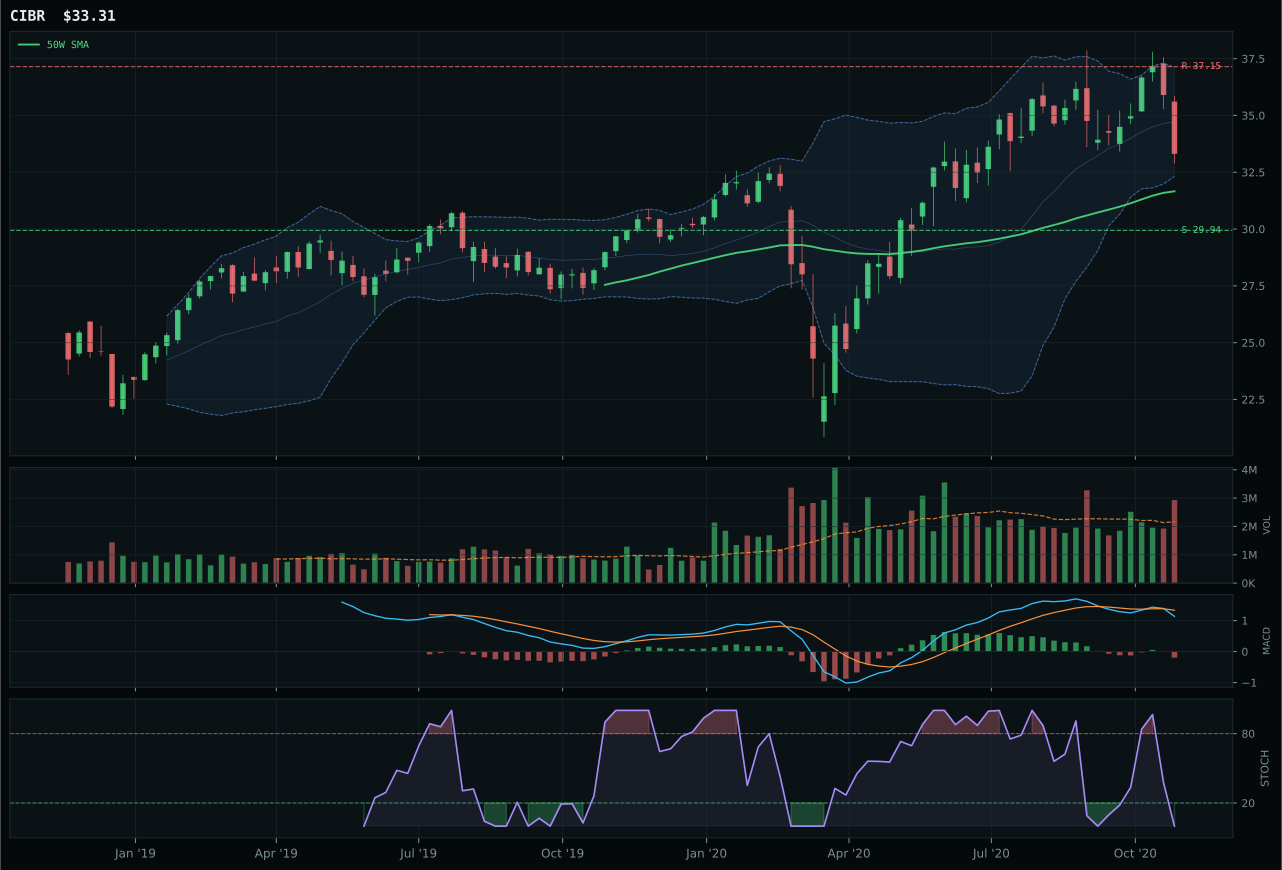
CIBR has a neutral structure profile with -6.8% 13-week relative strength versus SPY.
A failed hold above support would weaken the setup.
Actionable but governed by invalidation levels.
XLK prevailed over IGV by combining neutral structure with defensive positioning rather than chasing extension. The 0.4% relative strength versus SPY and matching 13W return masks what the setup reveals: XLK sits 11.1% above its 50W with MACD weakening and stochastic RSI deeply oversold, a configuration that rewards patience over entry urgency. IGV's 3.2% SPY-relative outperformance looked attractive on the surface, but its vertical extension combined with distribution-pressure volume and a weaker timing score of 48 versus XLK's 70 exposed it as the late buyer in the rotation. The 10.8-point score gap reflects a fundamental difference in setup quality—XLK is consolidating with risk/reward asymmetry still present, while IGV is extended into resistance with deteriorating confirmation.
Technology scores 46.1 and receives 5% allocation—a secondary tier position reflecting solid technical proof but insufficient macro tailwind to push into top-2 status this week. The category's 72.0 macro-fit score benefits from active liquidity expansion and AI growth sponsorship, but those descriptors cannot overcome a 62/38 technical-to-macro weighting that demands stronger chart evidence. XLK's trend score of 82.6 is robust, yet momentum confirmation at only 30.6 reveals the disconnect: near-term participation is thin despite the intermediate-term setup being reasonable. In a Goldilocks regime with altseason active, Technology faces structural headwinds—the category ranks below both Industrial Metals (59.8) and Emerging Markets (59.0), both of which marry better macro sponsorship with cleaner technical setups. XLK stays in the portfolio because it avoids hard filters and its neutral compression offers re-accumulation potential, but the weak momentum confirmation means technology leadership this week is either stale or contested.
Utilities & Infrastructure — XLU
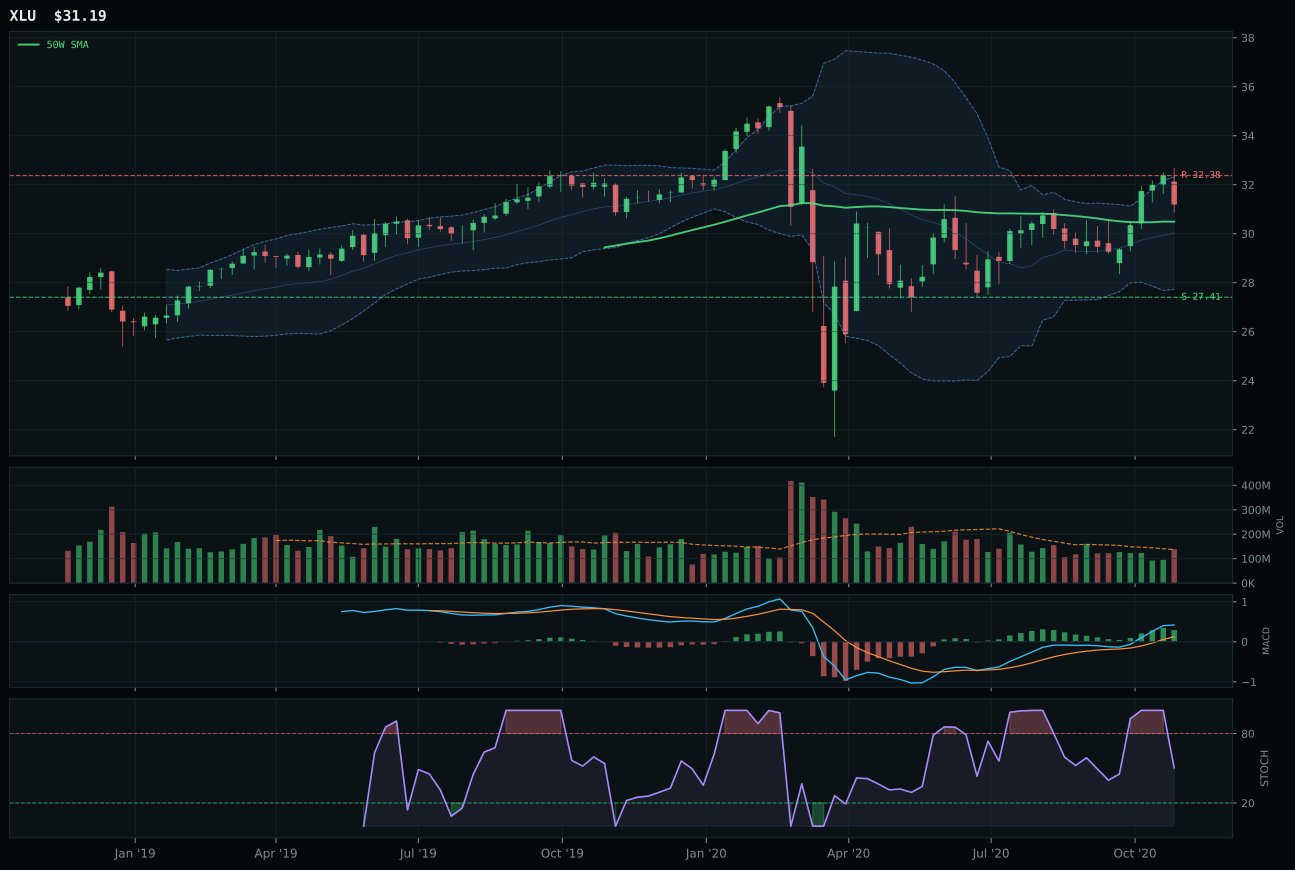
XLU has a compression near 50W profile with 2.5% 13-week relative strength versus SPY.
A failed hold above support would weaken the setup.
Actionable but governed by invalidation levels.
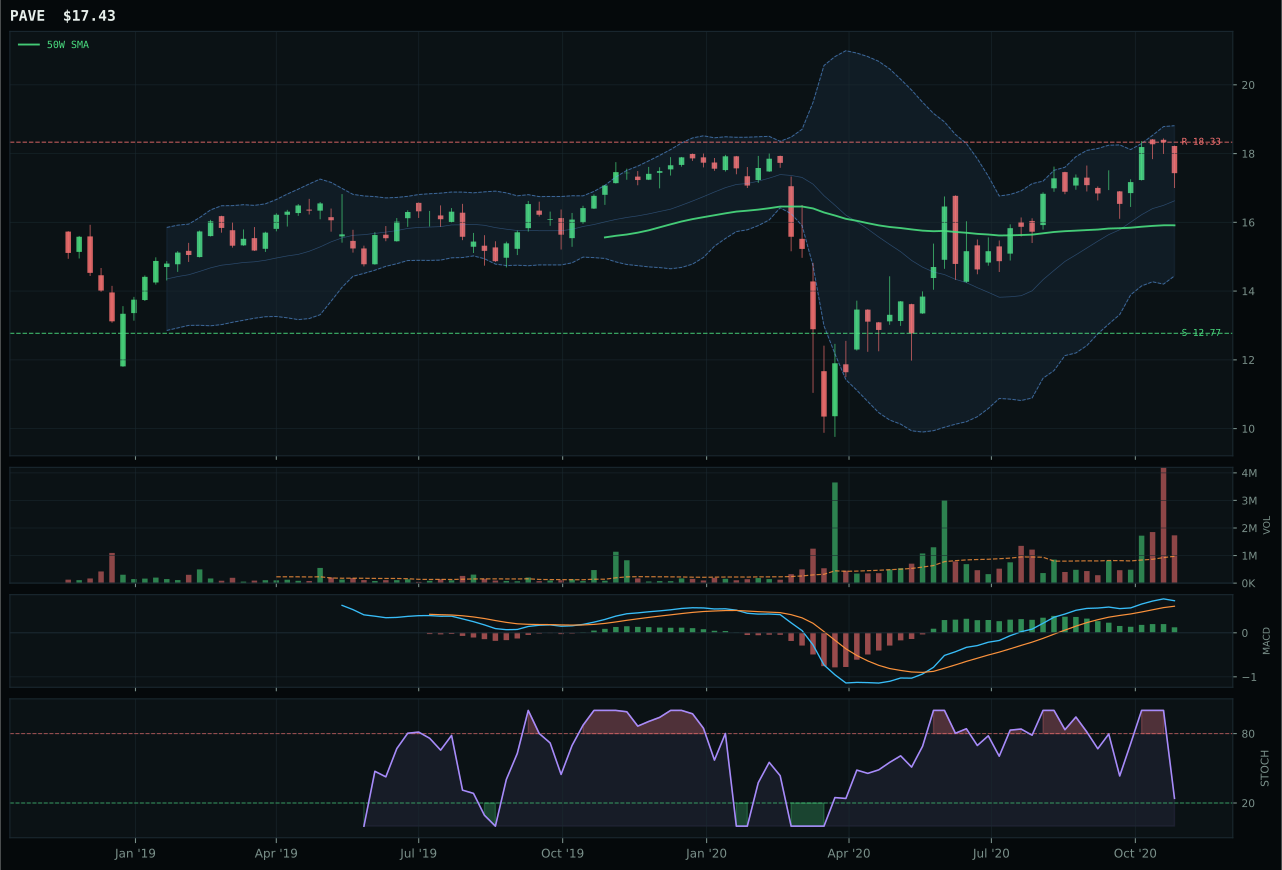
PAVE has a neutral structure profile with 10.8% 13-week relative strength versus SPY.
A failed hold above support would weaken the setup.
Actionable but governed by invalidation levels.
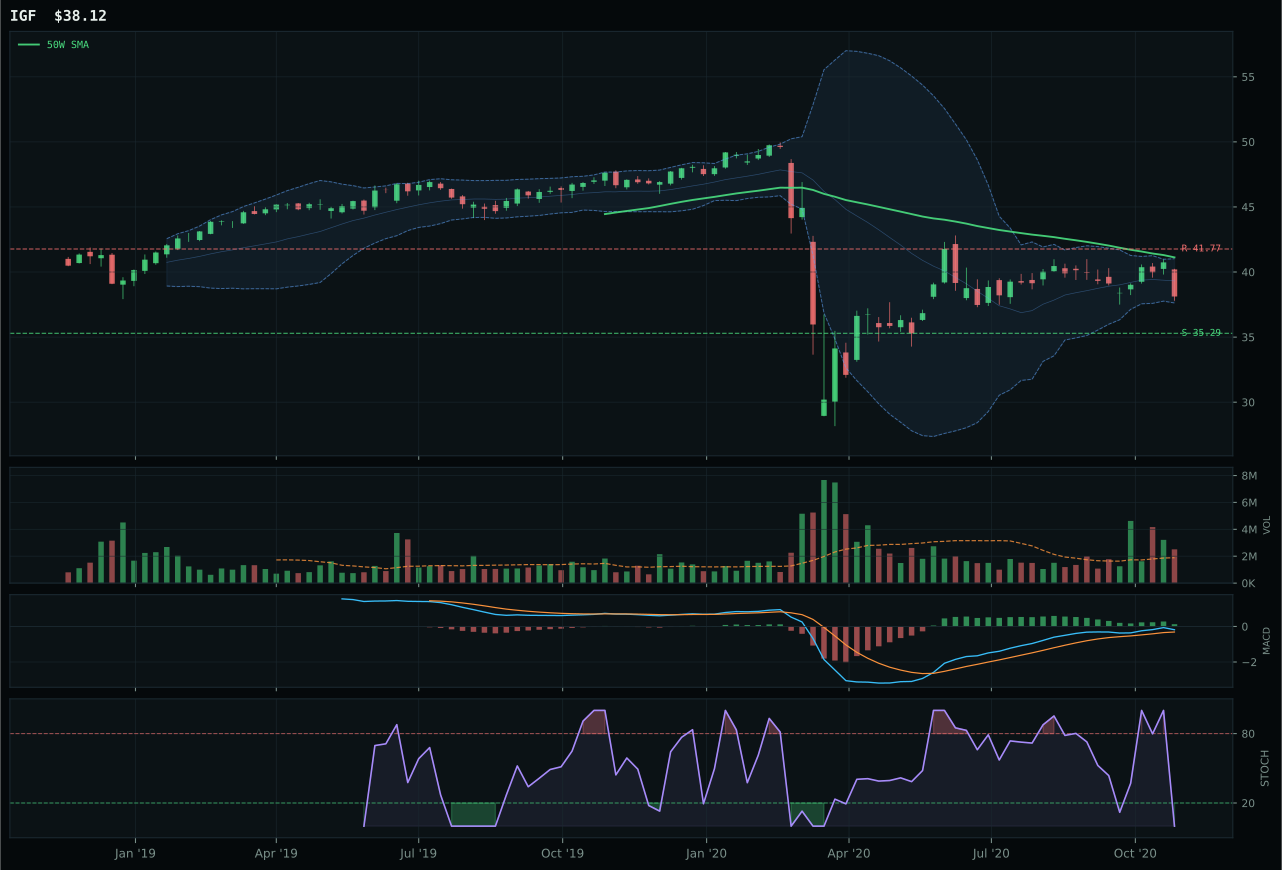
IGF has a neutral structure profile with -2.6% 13-week relative strength versus SPY.
Extension and support failure are the main tactical risks.
Tracked, but not top-2 eligible because: structurally broken.
XLU dominated by combining perfect timing (100.0) with bullish MACD that's actively improving, a rare synchronization that created minimal competitive pressure from PAVE or IGF. Trading just 2.3% above the 50W with compression structure and falling stochastic RSI (0.50, neutral territory), XLU presents controlled entry geometry: defenders of the 50W would signal continued accumulation, while rejection would offer additional entry zones. PAVE's 10.8% relative strength appeared attractive until volume analysis revealed distribution pressure—the move was being paid for, not accumulated—while MACD merely flattened rather than improved. The 13.8-point gap versus PAVE reflects setup discipline: XLU waits for expansion from compression, PAVE chases from extension.
Utilities & Infrastructure scores 43.6 and receives 5% allocation—a tertiary category reflecting strong technical merit meeting macro headwinds that prevent top-2 consideration. The 72.0 macro-fit score benefits from defensive rotation (+12) and disinflation pressure (+6), yet this is insufficient to compete with Industrial Metals (79.0) and Emerging Markets (70.0) when technical evidence is weighted 62%. XLU's technical evidence of 78.3 is excellent: trend 93.8, timing 100.0, momentum 73.6 represent near-conviction technicals, yet risk-reward at 49.8 reveals upside is constrained to 3.7% while downside is 13.8%—an unfavorable payoff structure that limits position sizing. The category's defensive narrative fits Goldilocks regime (no inflation shock), but with altseason active and commodity breadth positive, growth-tilted categories (Industrial Metals, Emerging Markets) capture capital priority. XLU holds its 5% allocation because the compression setup with improving MACD offers optionality—buyers defending the 50-week can trigger extension if conviction builds—but the tight upside cap and defensive theme prevent larger allocation in a regime rewarding real assets and EM exposure. This position is held for rotation potential, not conviction accumulation.
Agriculture & Livestock — MOO
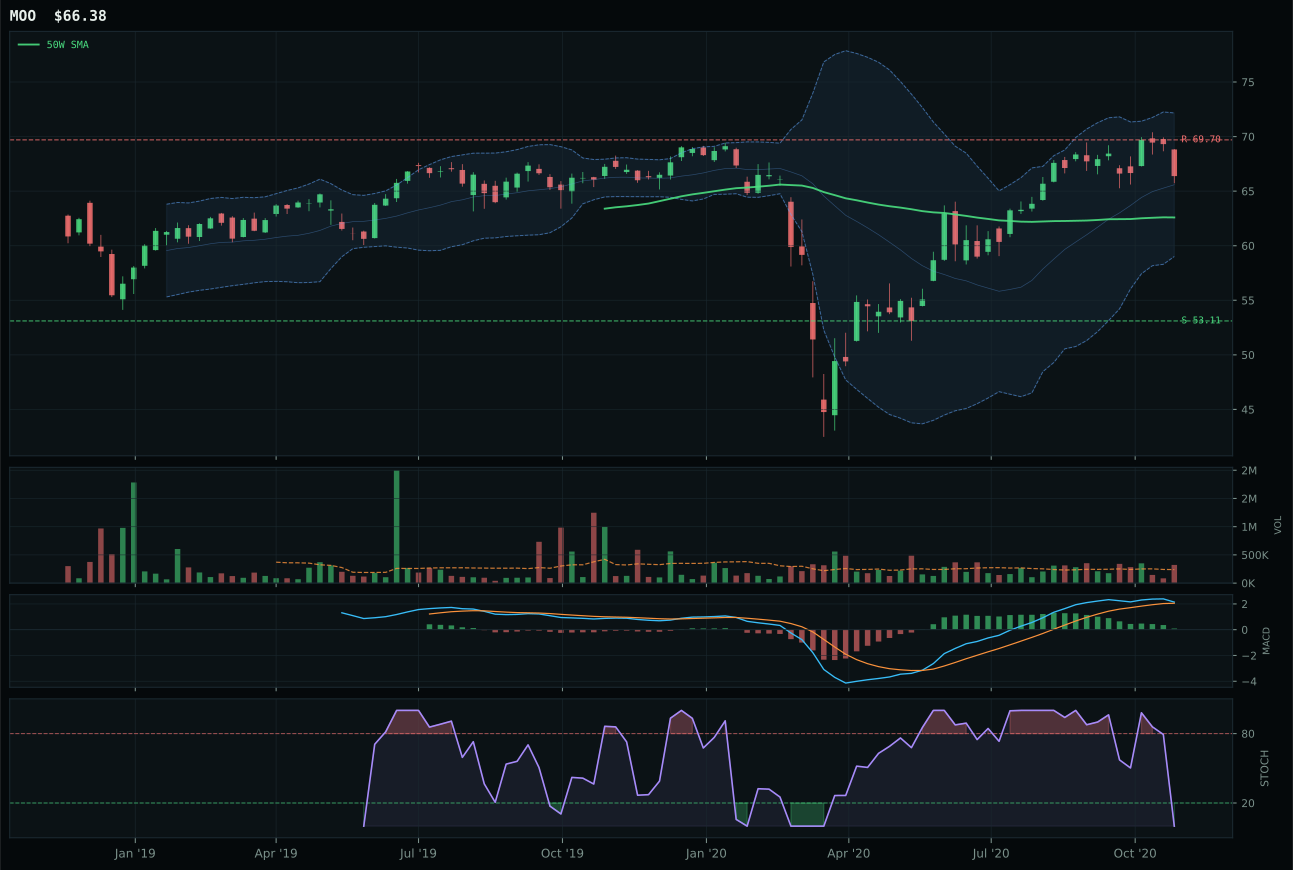
MOO has a neutral structure profile with 4.0% 13-week relative strength versus SPY.
A failed hold above support would weaken the setup.
Actionable but governed by invalidation levels.
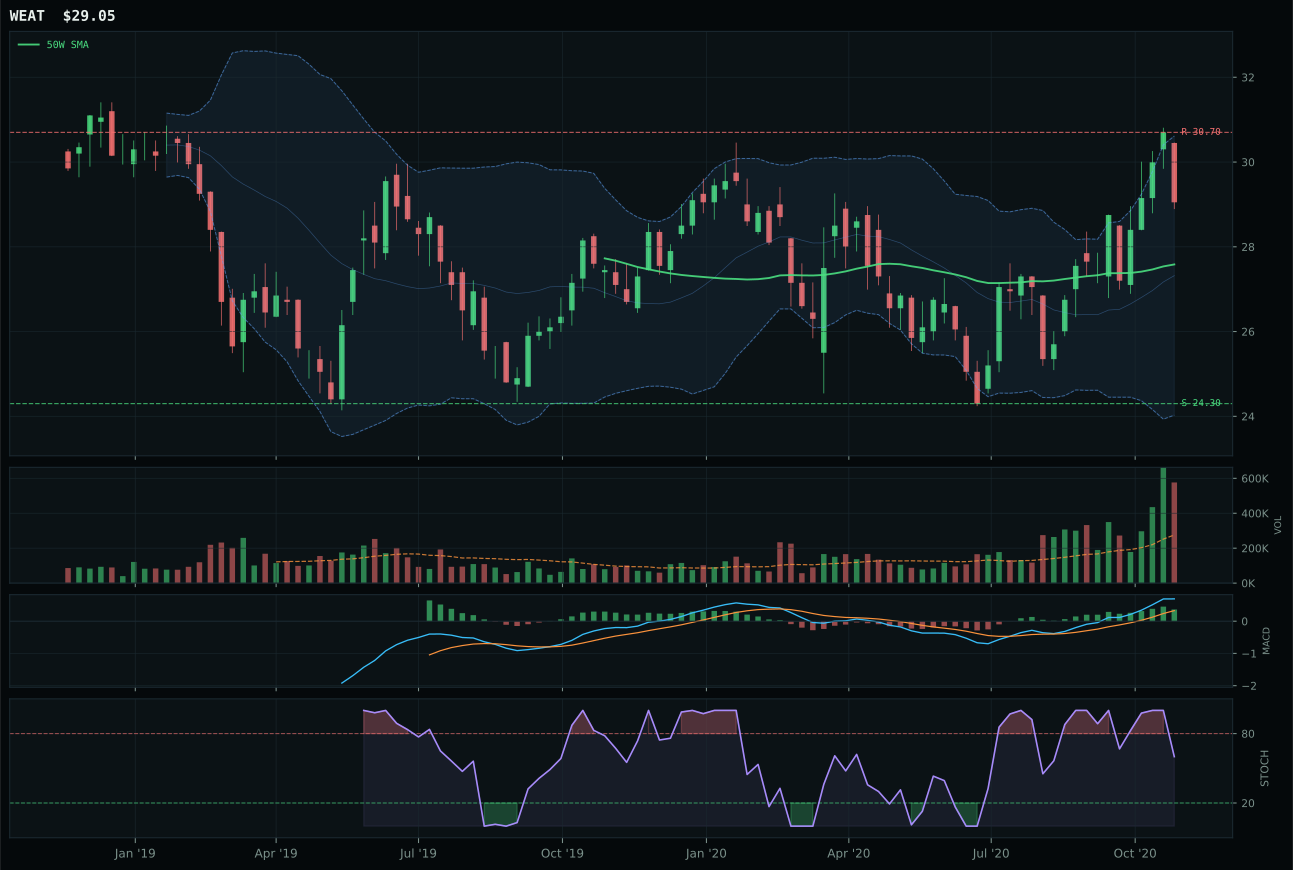
WEAT has a neutral structure profile with 7.4% 13-week relative strength versus SPY.
A failed hold above support would weaken the setup.
Tracked, but not top-2 eligible because: .
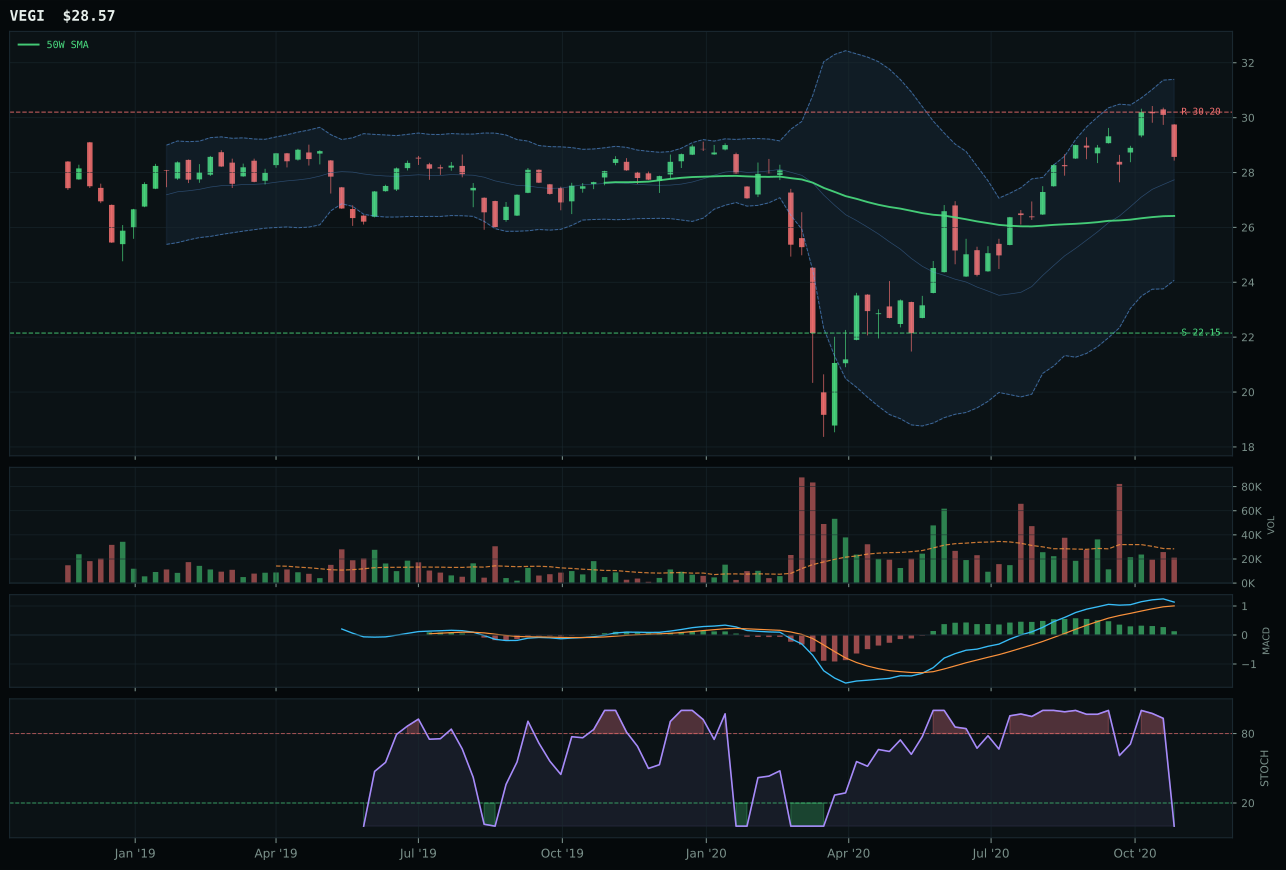
VEGI has a neutral structure profile with 8.3% 13-week relative strength versus SPY.
A failed hold above support would weaken the setup.
Tracked, but not top-2 eligible because: .
MOO secured category leadership by presenting trend power combined with reasonable entry conditions, a rare combination that IGV and XLK lacked in their respective categories. Above both the 50W and 200W with a near-zero slope, MOO offers technical stability, and its 4.0% SPY-relative return with above-average volume participation proves the move is being accumulated rather than distributed. WEAT's superior 7.4% relative strength initially appears stronger, but its MACD is improving while flattening, and critically, volume turned to distribution pressure—the setup lacks conviction. MOO's 19.6-point advantage reflects a simple insight: both are extended, but MOO's volume behavior and MACD pattern suggest the move has further room versus WEAT's early distribution signal.
Agriculture & Livestock scores 38.1 and receives 5% allocation—a tertiary category position reflecting competent technicals meeting weak macro fit. The 55.0 macro-fit score reveals the bind: commodity breadth is positive (+5) but disinflation pressure is active (-8), and MOO's real asset sponsorship (+5) cannot overcome the deflationary headwind. MOO's technical evidence of 65.8 is solid, yet rank relative to Industrial Metals (59.8) and Emerging Markets (59.0) is competitive but losing. The category nominates MOO based on trend strength (92.0) and structure quality (75.2), but momentum confirmation at only 65.5 and risk-reward at 48.4 signal that buyers are testing support rather than accelerating. Agriculture holds its 5% because the neutral structure and above-average participation offer re-accumulation potential, but the disinflation macro backdrop prevents this category from attracting meaningful capital when alternatives offer both trend and macro alignment. This is a hold-for-rotation position.
Precious Metals — SLV
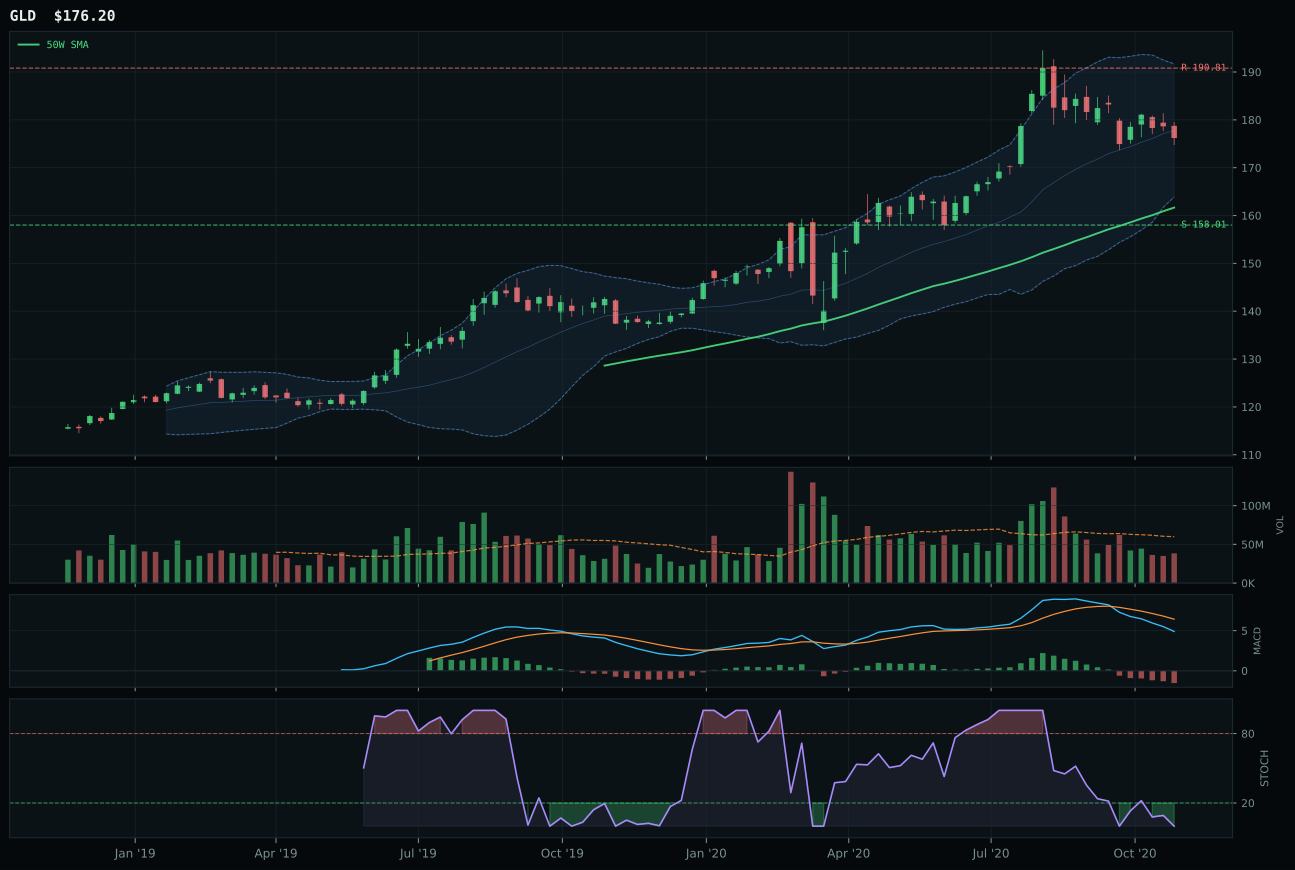
GLD has a neutral structure profile with -5.0% 13-week relative strength versus SPY.
A failed hold above support would weaken the setup.
Actionable but governed by invalidation levels.
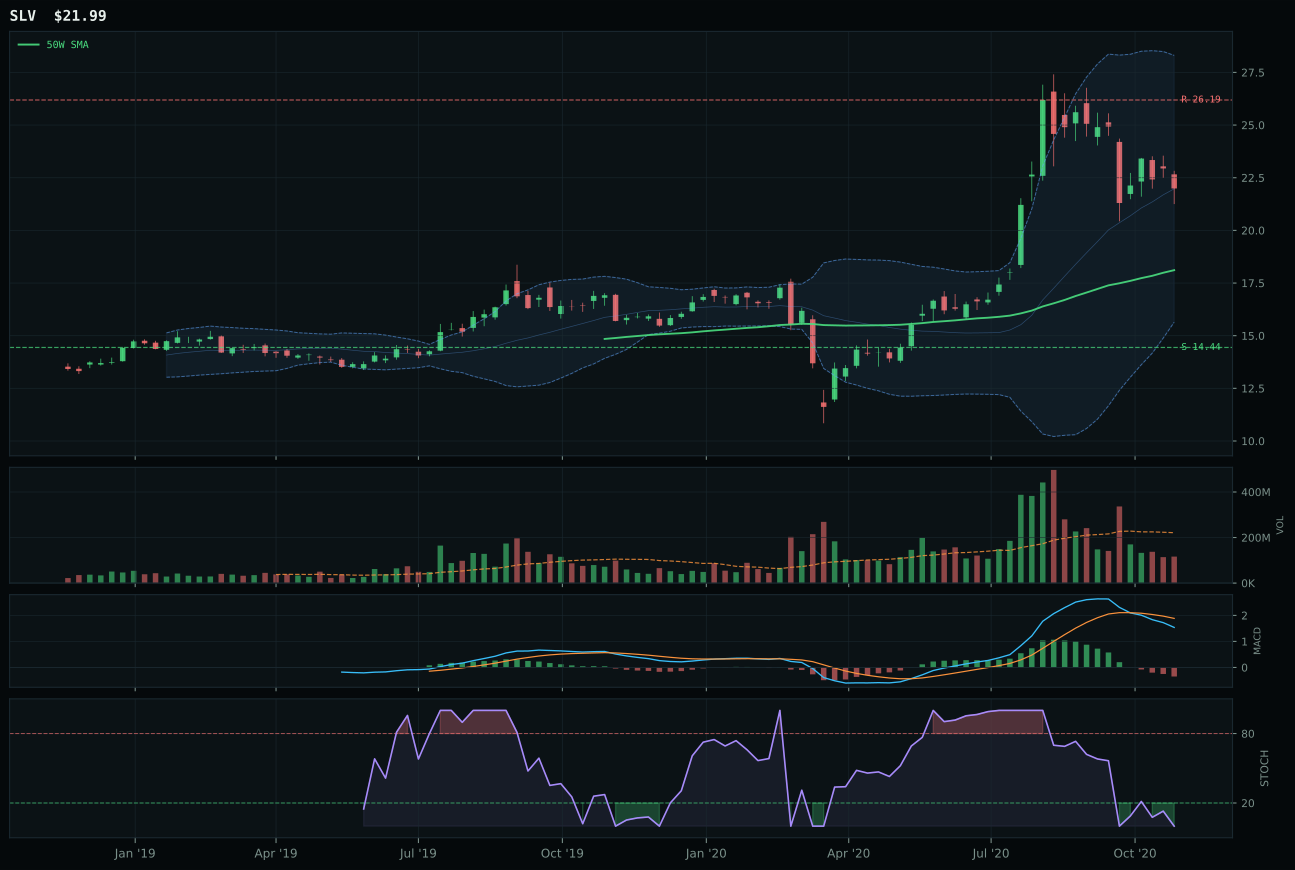
SLV has a vertical extension profile with -2.9% 13-week relative strength versus SPY.
A failed hold above support would weaken the setup.
Actionable but governed by invalidation levels.
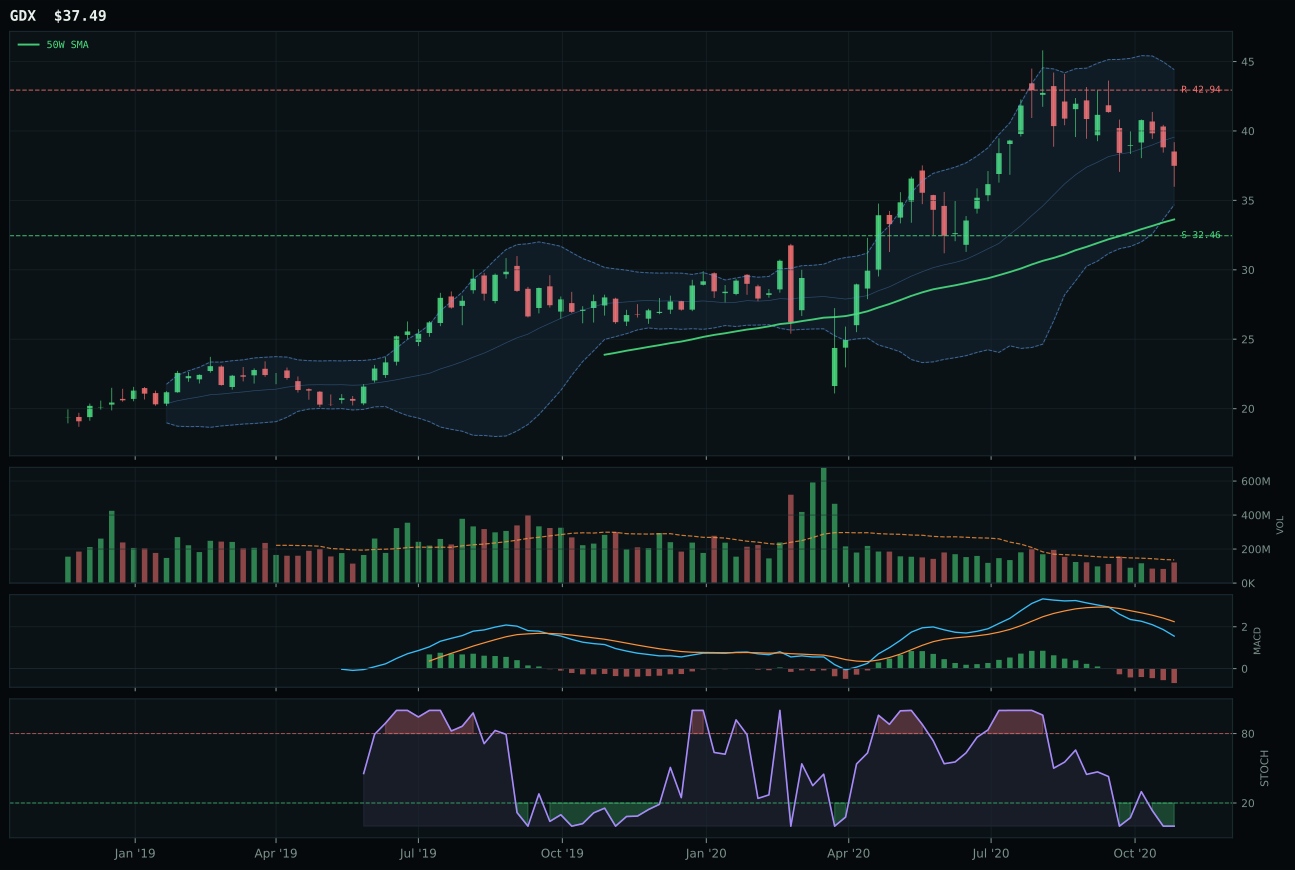
GDX has a neutral structure profile with -12.7% 13-week relative strength versus SPY.
A failed hold above support would weaken the setup.
Actionable but governed by invalidation levels.
SLV won a weak category contest primarily because it maintained 2.1% category-relative strength while GLD posted 0.0%, a marginal distinction in a field where both are technically compromised. Both face identical macro headwinds—MACD bearish/weakening across the category, stochastic RSI deeply oversold—yet SLV's 21.4% extension above the 50W, while risky, at least demonstrates that buyers paid up to accumulate it. GLD's neutral structure and -5.0% SPY-relative underperformance expose it as the laggard even within metals. The honest read: neither setup is compelling, and the -12.3-point gap versus GLD suggests the system is reluctant to assign confidence to any metals representative right now.
Precious Metals scores 33.8 and receives 5% allocation—a low-conviction position reflecting category rank of 8th among ten, well below competitive thresholds. SLV's technical evidence of only 19.2 is near-disqualifying; momentum confirmation at 25.4 and persistence at 45.0 reveal minimal participation behind the move. The 61.0 macro-fit score relies on metals scarcity being active (+7), but that descriptor struggles against disinflation pressure (+6 for GLD, likely similar environment) and defensive rotation (+7 for GLD), which together argue for gold's stability over silver's volatility. Risk-reward at 35.5 is the worst in portfolio: 16% downside, 52.3% upside flip, which means any real deterioration vaporizes the setup while any strength requires a parabolic continuation. Precious Metals holds its 5% slot because neither XLE nor URA qualify (0% allocations), forcing secondary categories into the remaining sleeves; SLV stays purely as a diversifier against tail-risk scenarios, not because its chart or macro profile merits conviction. The category is parked, awaiting technical invalidation or a shift toward inflation narratives.
Defense & Aerospace — XAR
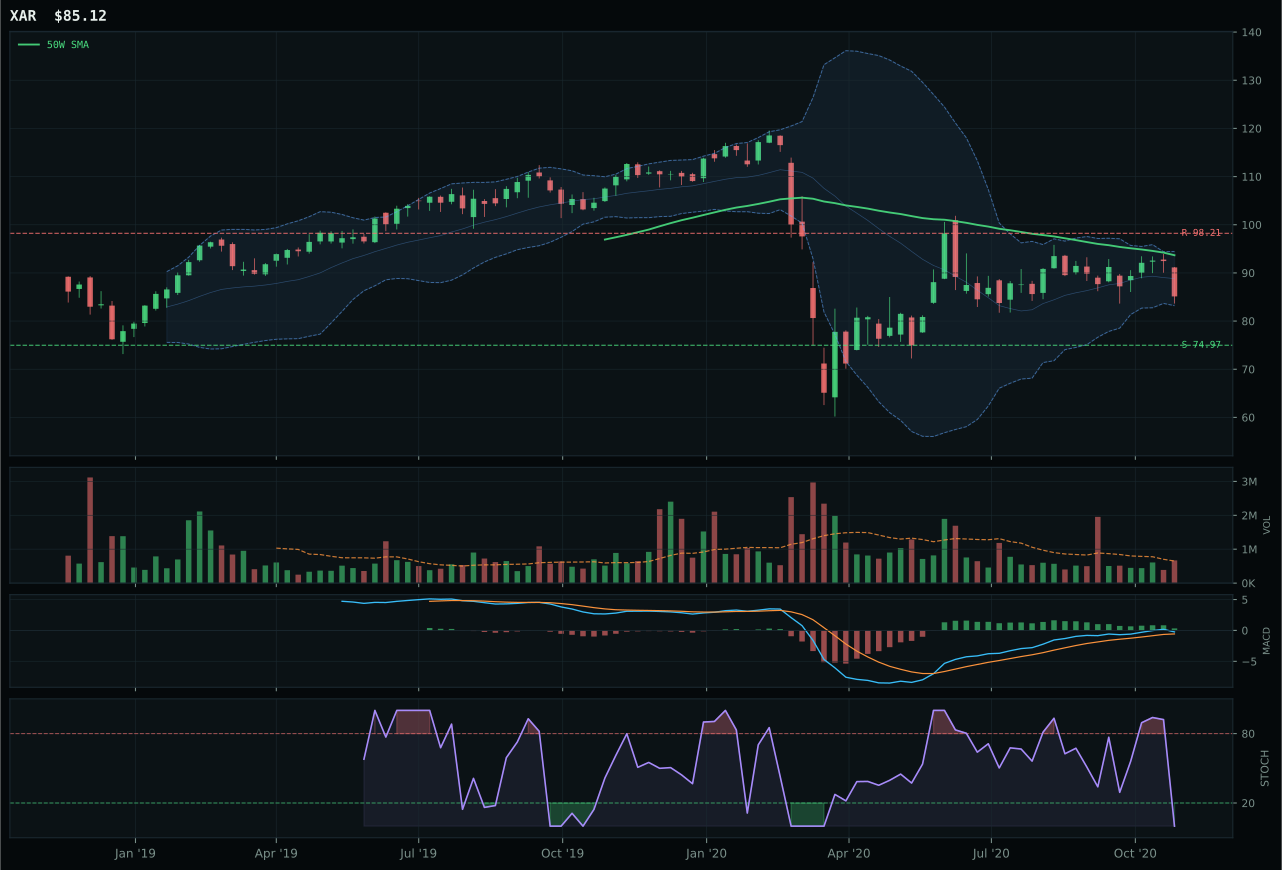
XAR has a neutral structure profile with -0.6% 13-week relative strength versus SPY.
A failed hold above support would weaken the setup.
Actionable but governed by invalidation levels.
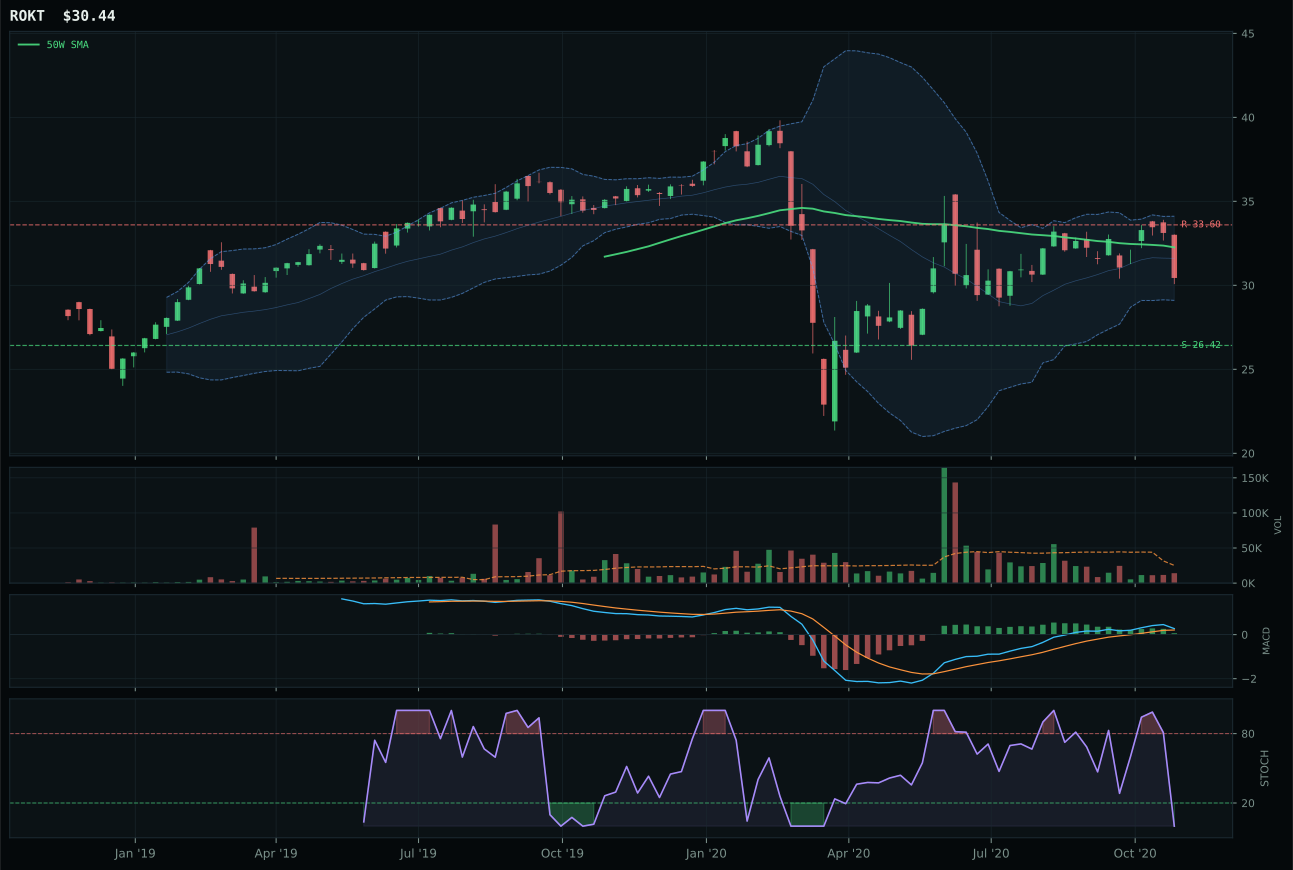
ROKT has a neutral structure profile with -0.7% 13-week relative strength versus SPY.
A failed hold above support would weaken the setup.
Tracked, but not top-2 eligible because: .
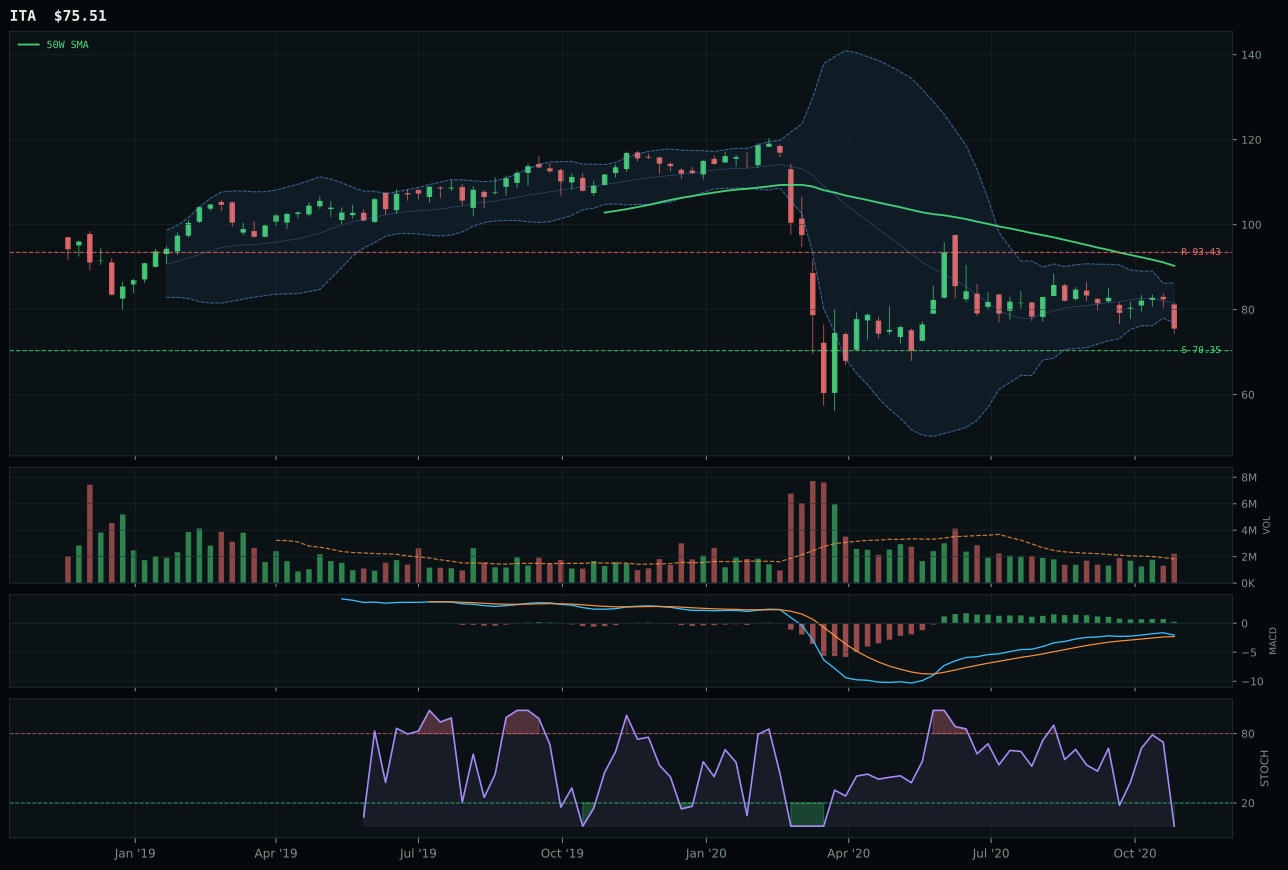
ITA has a neutral structure profile with -3.6% 13-week relative strength versus SPY.
Extension and support failure are the main tactical risks.
Tracked, but not top-2 eligible because: structurally broken.
XAR won this category by default rather than brilliance, which itself explains why it earned only 5% allocation. Price sits 9.1% below the 50W with negative trend across both momentum axes, yet it still won because ROKT and ITA were even more compromised—ROKT's thin volume participation and ITA's material lagging relative strength made XAR the least broken option. XAR's real strength lies in its risk/reward calculation: 70.7/100 reflects 13.5% downside to support and the opportunity to prove the setup if buyers defend that level. The 32.2-point score gap versus ROKT matters less than understanding what it signals: this entire category is locked in a repair pattern with no obvious leadership, making it a placeholder position rather than a conviction trade.
Defense & Aerospace scores 32.7 and receives 5% allocation—a minimal position acknowledging the category ranks 7th among ten, well below the threshold for top-2 consideration. The 63.0 macro-fit score masks a fundamental tension: defensive rotation is active (+8) but credit stress is marginally positive (+2), diluting the defensive case. XAR's technical evidence of only 54.3 reflects a below-50W chart with trend score of 50.1—the namesake category weakness—paired with momentum confirmation of 47.1, indicating no real participation yet. The 50/50 payoff structure (13.5% down, 13.3% up) offers no edge; this is a coin-flip entry that relies entirely on support holding without confirming volume or momentum. Defense & Aerospace holds its 5% slot because XAR avoids hard disqualifiers and the structure is at least rational, but in a Goldilocks regime where liquidity expansion and commodity breadth are active, a defensive sub-50W setup cannot compete with categories offering both trend confirmation and macro sponsorship. The slot is a placeholder pending technical invalidation or bullish reversal.
Nuclear Energy — URA
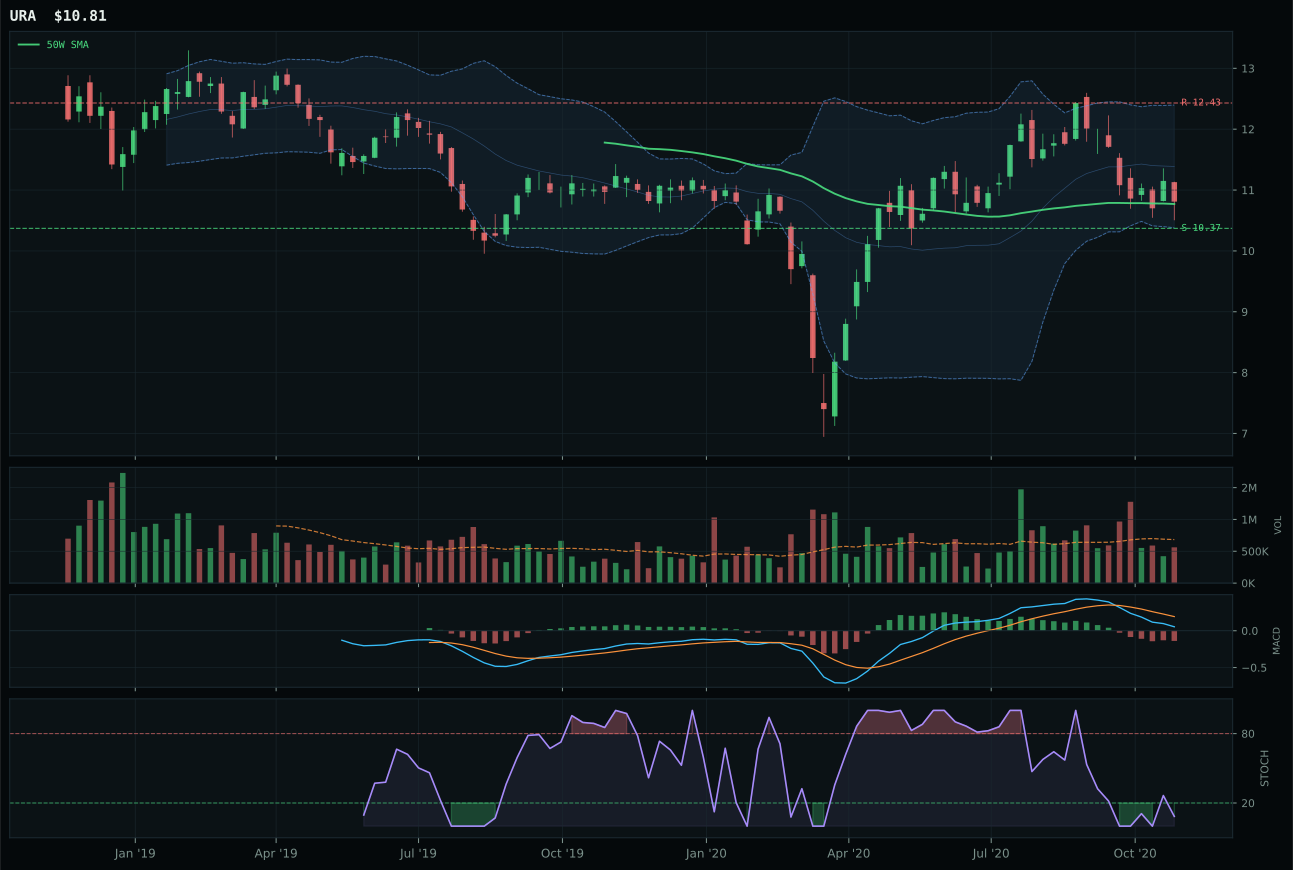
URA has a pullback into support profile with -6.1% 13-week relative strength versus SPY.
A failed hold above support would weaken the setup.
Tracked, but not top-2 eligible because: .
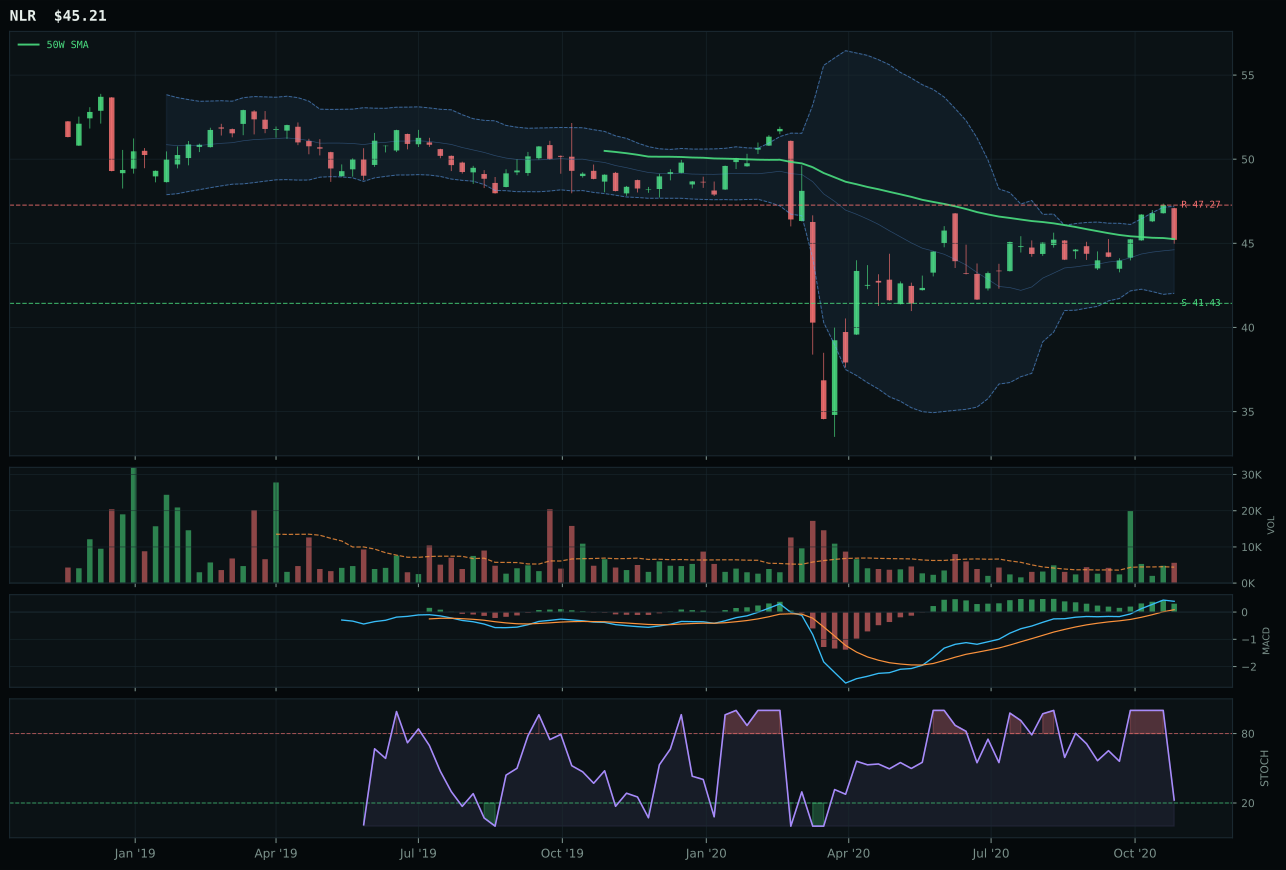
NLR has a compression near 50W profile with 1.9% 13-week relative strength versus SPY.
Extension and support failure are the main tactical risks.
Tracked, but not top-2 eligible because: structurally broken.

URNM has a pullback into support profile with -10.2% 13-week relative strength versus SPY.
A failed hold above support would weaken the setup.
Tracked, but not top-2 eligible because: .
URA won category leadership by leveraging the best risk/reward calculation in its basket, a rare technical advantage in a category where both URA and NLR failed eligibility. Trading essentially at the 50W (0.4% distance) with 90.0 risk/reward and 95.0 timing scores, URA presents a textbook mean-reversion setup: support at 10.37 with defined downside (4.2%) and substantial upside room to resistance. NLR's 1.9% relative strength and bullish MACD looked attractive, but its compression near the 50W offered less defined structure, and critically, its 53.6 risk/reward versus URA's 90.0 exposed it as the riskier entry despite better momentum. The 18.4-point gap reflects setup geometry rather than conviction—this is a category where both winners remain questioned by hard filters.
Nuclear Energy scores 27.2 and receives 0% allocation because the category fails hard eligibility filters, ranking 9th among ten. URA's hard disqualification stems from momentum confirmation of 19.4 and persistence of 33.8—both near-categorical minimums indicating zero participation behind the pullback setup. The 50.0 macro-fit score reflects neutral positioning: real asset sponsorship (+7) and AI growth sponsorship (+5) provide modest support, but credit stress (-5) and lack of category-specific descriptors limit upside. While URA's timing score of 95.0 is exceptional and its risk-reward of 90.0 is best-in-category, these metrics cannot overcome the structural reality that the setup has zero volume confirmation. No buyers are accumulating into the support pullback; stochastic RSI at 0.08 signals desperation oversold, not conviction. NLR's disqualification via hard filter (momentum at 83 but structure marked broken) suggests the category itself is in transition without conviction on either side. Nuclear Energy drops entirely from the portfolio because altseason rotation prioritizes growth (AI, Industrial Metals) and real assets with commodity breadth, not the defensive energy security narrative this category represents. The 0% allocation remains until either URA's pullback generates volume confirmation or NLR breaks decisively above resistance on improving fundamentals—neither condition exists this week.
Traditional Energy — XLE
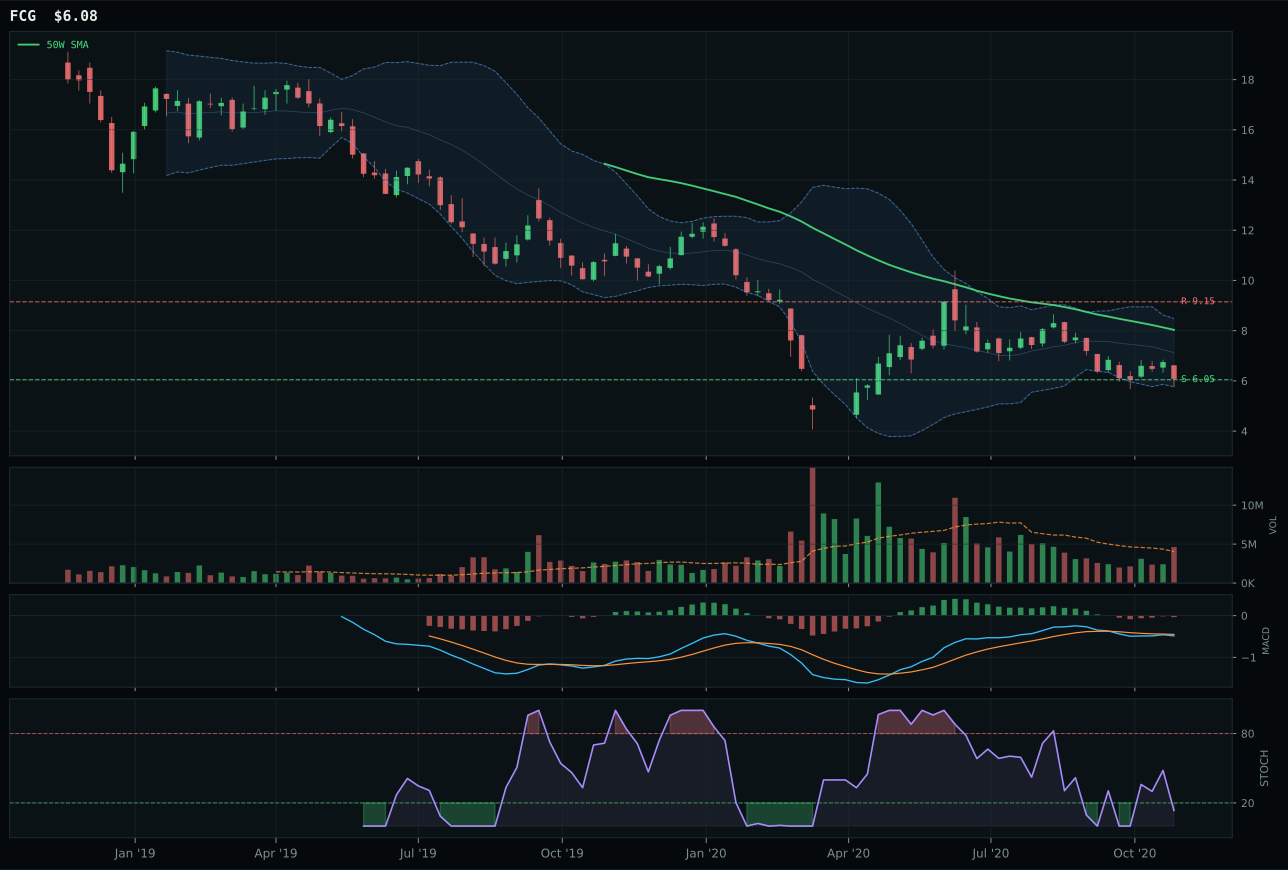
FCG has a pullback into support profile with -18.2% 13-week relative strength versus SPY.
Extension and support failure are the main tactical risks.
Tracked, but not top-2 eligible because: structurally broken.
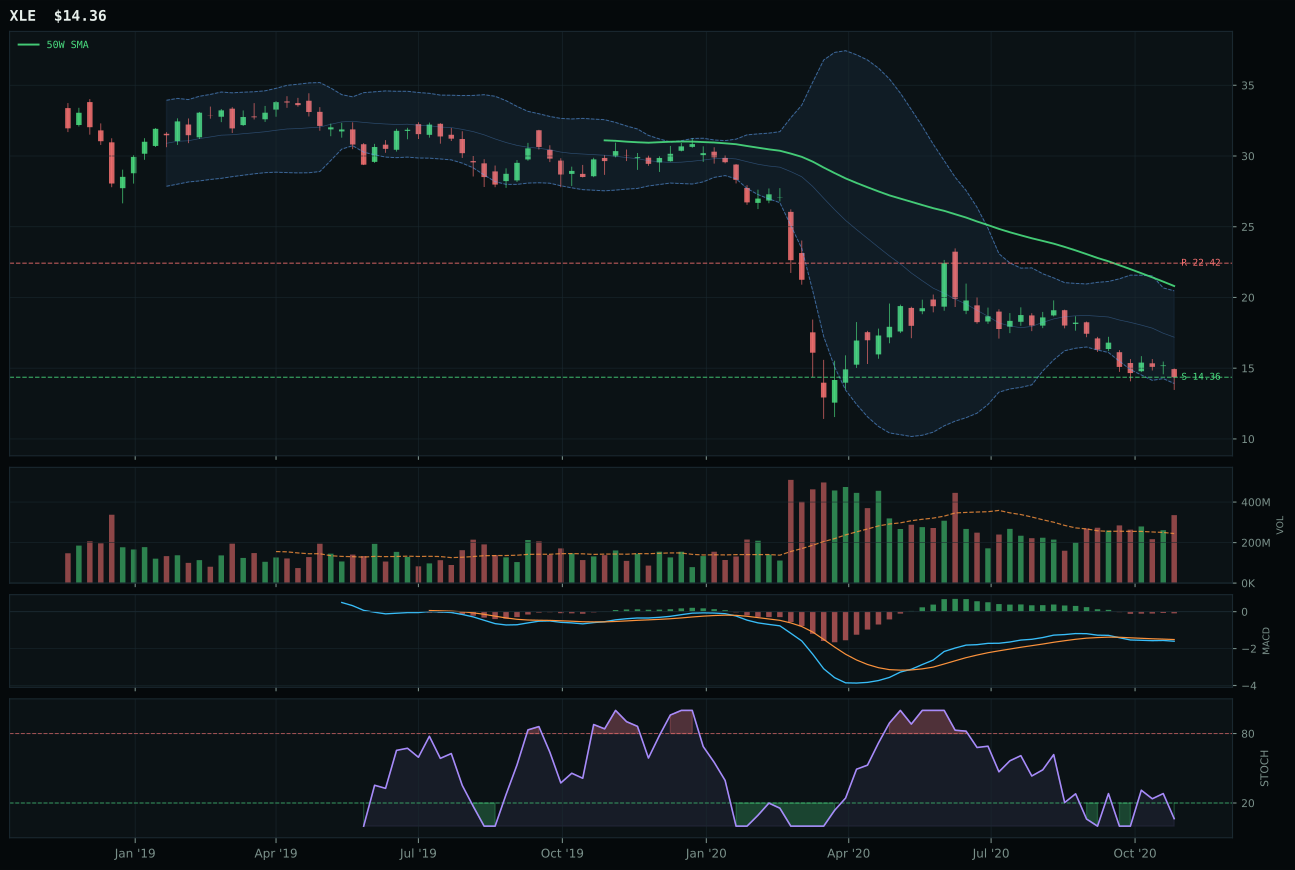
XLE has a pullback into support profile with -20.3% 13-week relative strength versus SPY.
Extension and support failure are the main tactical risks.
Tracked, but not top-2 eligible because: structurally broken.
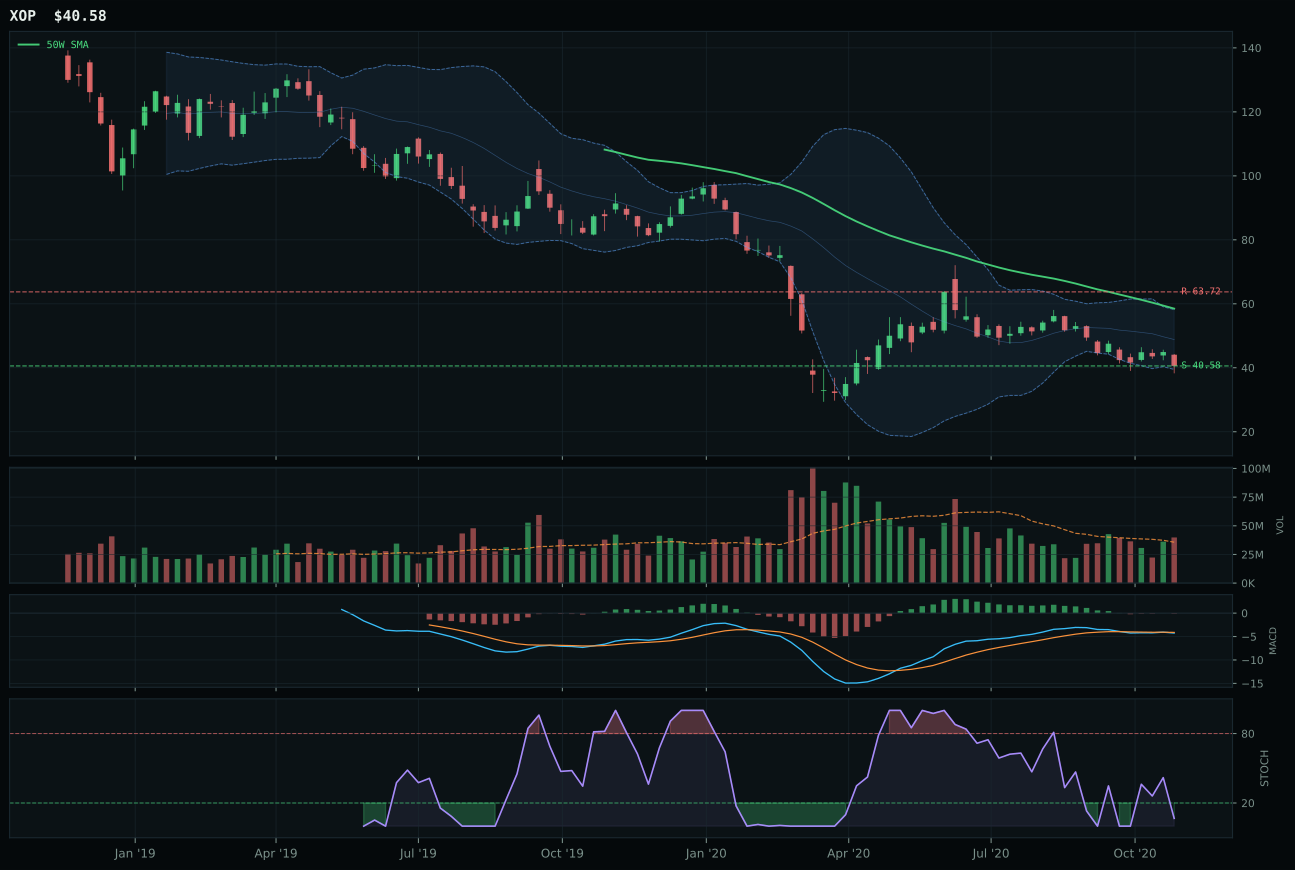
XOP has a pullback into support profile with -21.0% 13-week relative strength versus SPY.
Extension and support failure are the main tactical risks.
Tracked, but not top-2 eligible because: structurally broken.
XLE won by attrition rather than strength, earning the representative slot in a category where all three ETFs failed eligibility filters due to structural breakdown. Trading at -31.0% from the 50W with a -1.5% slope and zero momentum confirmation, XLE represents capitulation rather than accumulation. The only saving grace is its pullback structure into defined support at 14.36 with risk/reward reaching 75.0/100—a profile that rewards disciplined value hunters willing to wait for support confirmation. FCG's -23.0% distance to the 50W might seem less extended, but the setup is less clean (34.2 vs 36.9), and relative strength lagged, making it the weaker representative of a broken category.
Traditional Energy scores 0.0 and receives 0% allocation because the category fails hard eligibility filters, ranking 10th (last) among ten. The 40.0 macro-fit score is weakest in the portfolio: disinflation pressure (-10), credit stress (-7), and only real asset sponsorship (+7) provide minimal offset. XLE's trend of 23.0, momentum confirmation of zero, and persistence of 29.3 represent categorical technical failure; no MACD improvement, no volume sponsorship, no relative strength momentum. The -20.3% 13-week return and -20.3% SPY-relative weakness define directional exhaustion. Even the timing score of 65.0 is false hope—sitting at the 52-week low with defined support is structurally intact only if conviction buyers emerge, and XLE's near-zero momentum confirmation reveals they are absent. Risk-reward of 75.0 is a mirage: 36% upside requires a violent reversal that the broken trend and zero momentum cannot support. Traditional Energy is completely excluded this week because altseason demand, liquidity expansion, and commodity breadth positive all route capital away from legacy energy. The category returns to allocation consideration only if either directional momentum emerges (MACD bullish-improving, rising volume), SPY-relative strength reverses materially, or macro regime shifts to stagflation. Until then, this allocation slot goes to categories with both technical and macro merit.