
2020-10-23
Informational purposes only. The content in this report, including allocations, analysis, and commentary, is provided solely for informational and educational purposes. It does not constitute financial advice, investment advice, trading advice, or any other type of advice. Past performance does not guarantee future results. Always conduct your own research and consult a qualified financial professional before making investment decisions.
Some tracked tickers were excluded due to missing live weekly price data: SGOV: Historical cache SGOV has only 21 usable weekly bars
Weekly Allocation
| Ticker | Category | Weight | Role |
|---|---|---|---|
| FSOL | 50% | Overlay | |
| SMH | AI | 10% | Top-2 (10%) |
| COPX | Industrial Metals | 10% | Top-2 (10%) |
| IGV | Technology | 5% | Tier-2 (5%) |
| IEMG | Emerging Markets | 5% | Tier-2 (5%) |
| PAVE | Utilities & Infrastructure | 5% | Tier-2 (5%) |
| MOO | Agriculture & Livestock | 5% | Tier-2 (5%) |
| XAR | Defense & Aerospace | 5% | Tier-2 (5%) |
| XLE | Traditional Energy | 5% | Tier-2 (5%) |
Trade Instructions — Monday Open
Sell the tranche from 2020-09-25 (completing its 4-week hold). Buy the new tranche. Instructions show net portfolio changes — same-asset positions cancel, weight changes show the delta.
| Action | Ticker | Instruction |
|---|---|---|
| SELL | BOTZ | Sell 50% of BOTZ position (reduce 5.00% → 2.50%) |
| SELL | INDA | Sell 33% of INDA position (reduce 7.50% → 5.00%) |
| SELL | CIBR | Sell entire CIBR position (1.25% of portfolio) |
| SELL | XLU | Sell 33% of XLU position (reduce 3.75% → 2.50%) |
| SELL | GLD | Sell 25% of GLD position (reduce 5.00% → 3.75%) |
| SELL | PICK | Sell 50% of PICK position (reduce 2.50% → 1.25%) |
| SELL | NLR | Sell entire NLR position (1.25% of portfolio) |
| BUY | IGV | Buy IGV — 11.11% of freed cash (adds 1.25% to portfolio) |
| BUY | MOO | Buy MOO — 11.11% of freed cash (adds 1.25% to portfolio) |
| BUY | PAVE | Buy PAVE — 11.11% of freed cash (adds 1.25% to portfolio) |
| BUY | SMH | Buy SMH — 22.22% of freed cash (adds 2.50% to portfolio) |
| BUY | COPX | Buy COPX — 22.22% of freed cash (adds 2.50% to portfolio) |
| BUY | IEMG | Buy IEMG — 11.11% of freed cash (adds 1.25% to portfolio) |
| BUY | XLE | Buy XLE — 11.11% of freed cash (adds 1.25% to portfolio) |
Current Portfolio After Trade
Combined holdings across all 4 active tranches. Each tranche is 25% of the portfolio.
| Ticker | % of Portfolio | Weight Bar |
|---|---|---|
| FSOL | 50.00% | |
| SMH | 7.50% | |
| IGV | 6.25% | |
| XAR | 5.00% | |
| MOO | 5.00% | |
| INDA | 5.00% | |
| GLD | 3.75% | |
| PAVE | 3.75% | |
| COPX | 3.75% | |
| XLU | 2.50% | |
| BOTZ | 2.50% | |
| PICK | 1.25% | |
| REMX | 1.25% | |
| IEMG | 1.25% | |
| XLE | 1.25% |
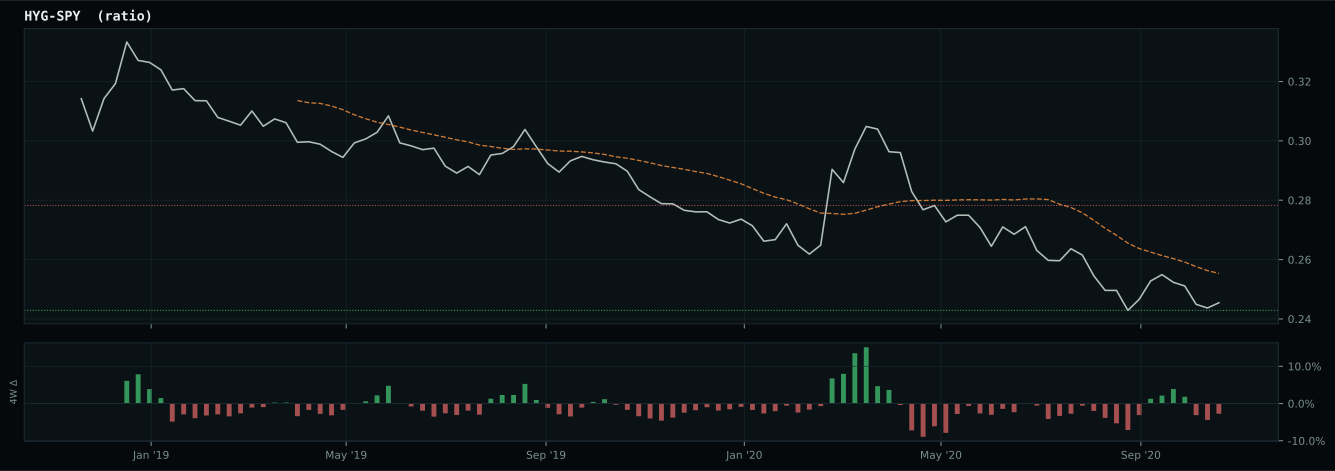
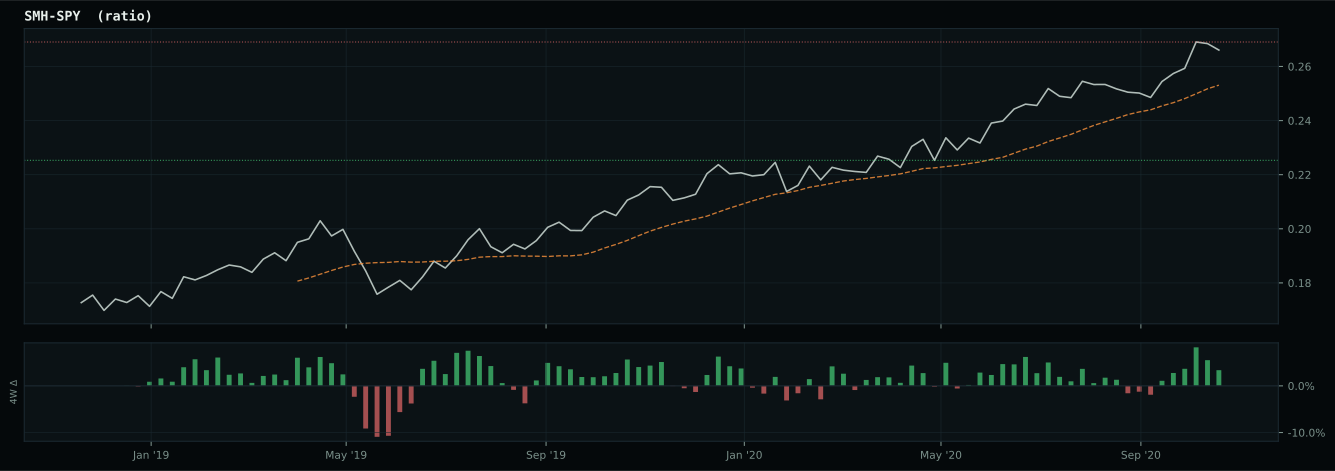
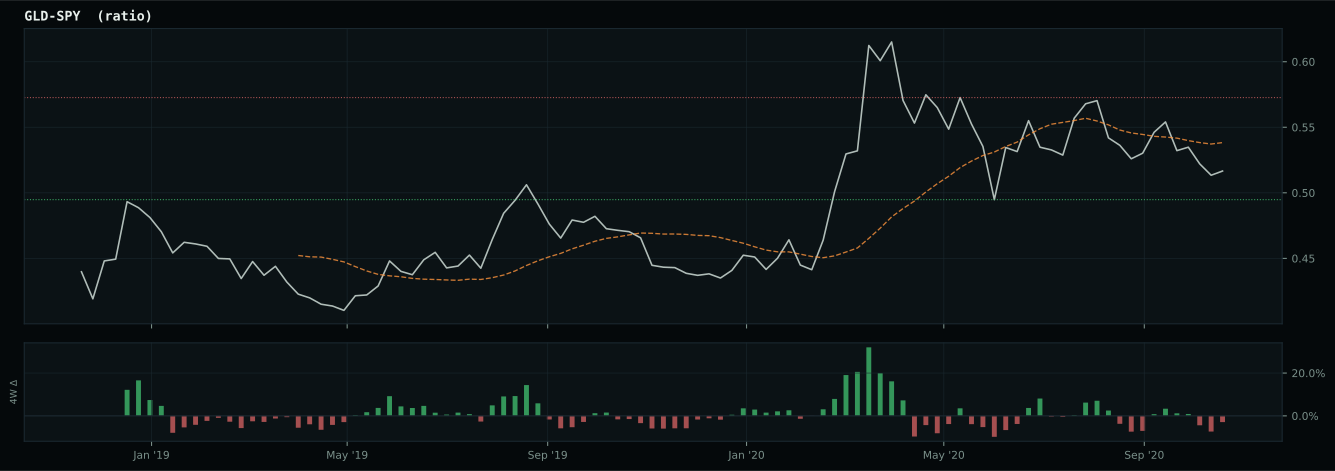
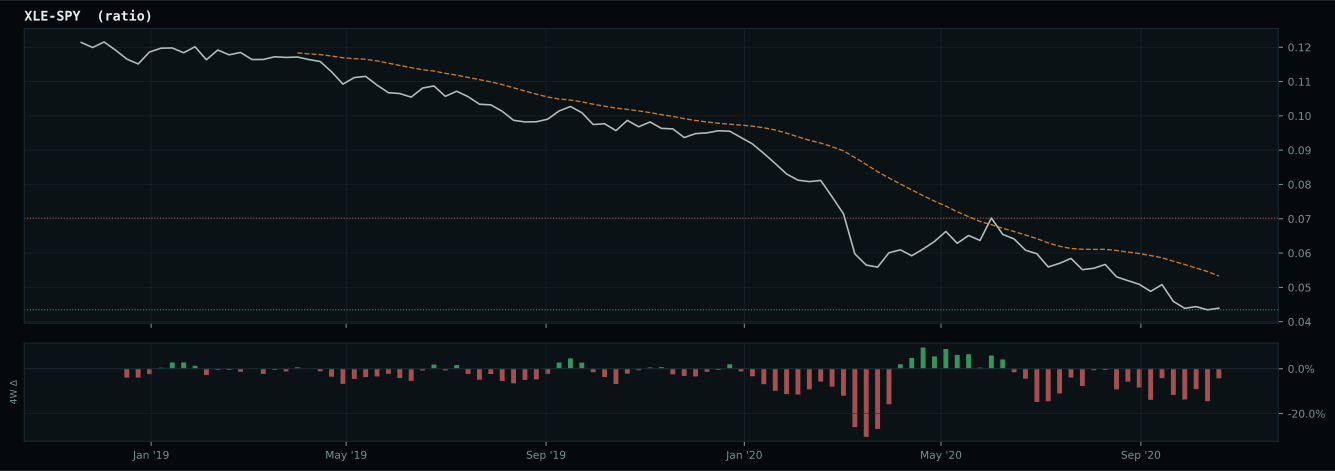
Macro Regime — Goldilocks
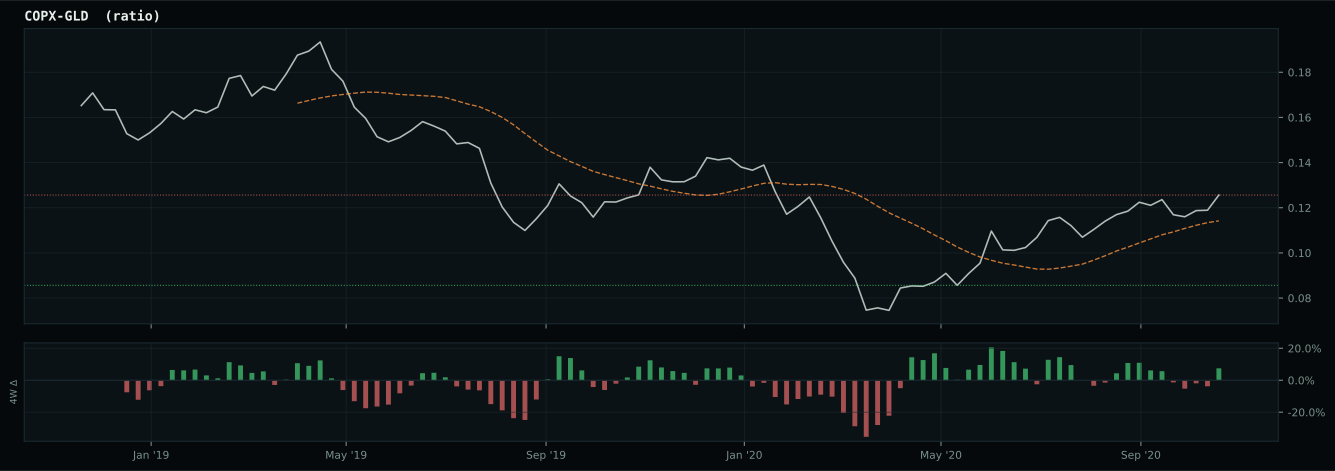
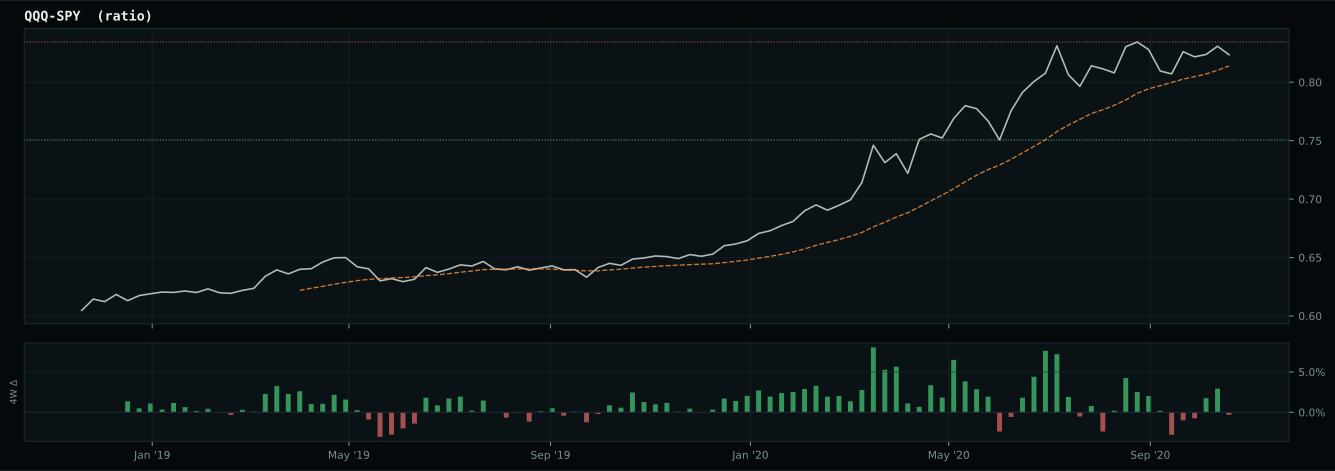
Macro Evidence Charts
Market-implied signals behind the macro regime scores. Each ratio compares two assets; the direction and slope of the ratio is what the macro engine reads.
Crypto Regime — AltSeason
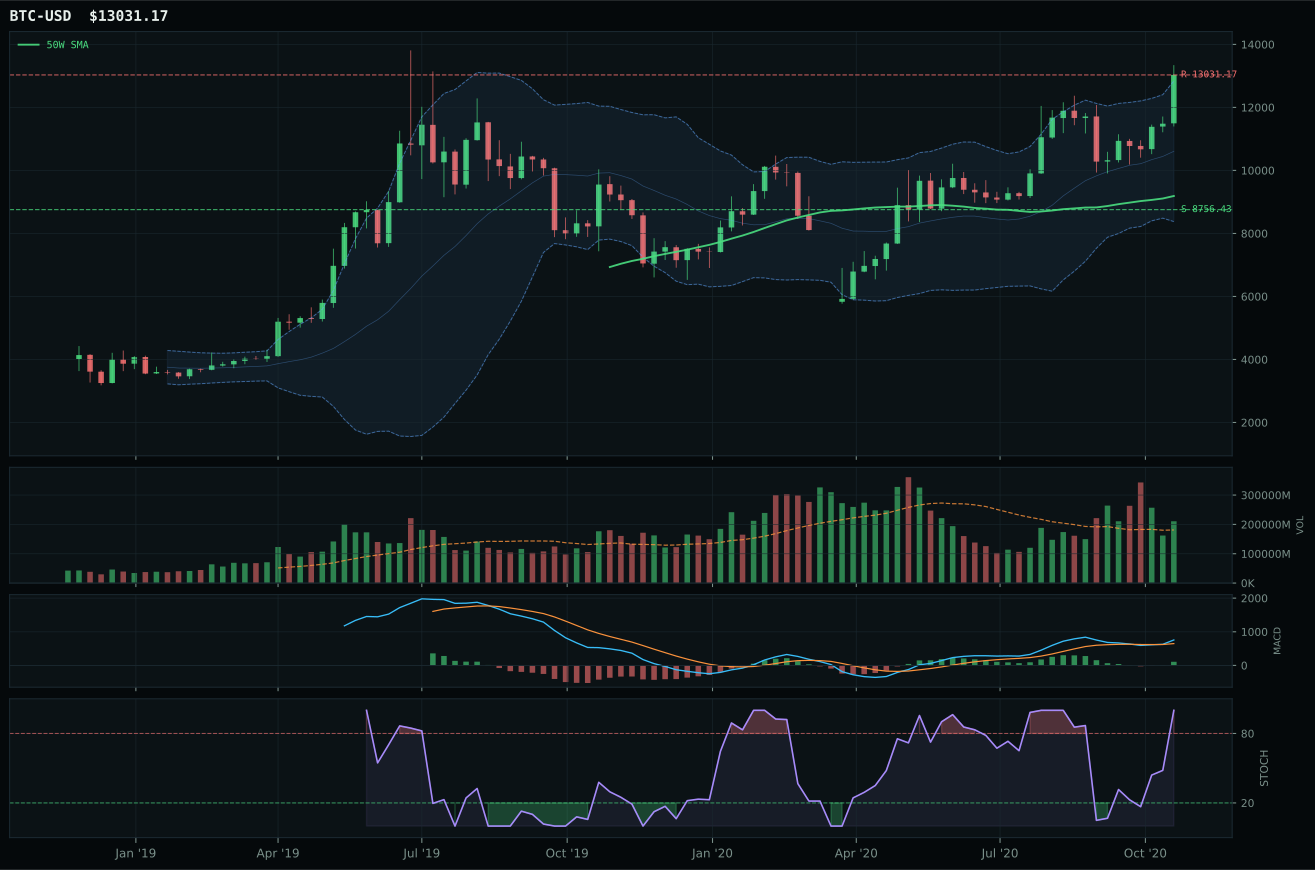
post-touch structure is too wide to count as a range; max/min close ratio is 2.21
TrendBTC confirmed: 2 consecutive closes above rising/flat 50W SMA
all available AltSeason conditions pass; missing optional confirmations skipped

Category Rankings
| Rank | Category | Winner | Score | Alloc | 4W Ret | Peers (4W) |
|---|---|---|---|---|---|---|
| 1 | AI | SMH | 68.7 | 20% | +10.37% | BOTZ +8.9% · AIQ +4.6% |
| 2 | Industrial Metals | COPX | 67.2 | 20% | +15.23% | REMX +30.9% · PICK +11.0% |
| 3 | Technology | IGV | 66.2 | 10% | +0.86% | CIBR +5.3% · XLK +2.9% |
| 4 | Emerging Markets | IEMG | 63.1 | 10% | +8.54% | INDA +7.3% · ILF +13.5% |
| 5 | Utilities & Infrastructure | PAVE | 60.4 | 10% | +10.62% | XLU -0.7% · IGF +8.0% |
| 6 | Agriculture & Livestock | MOO | 39.5 | 10% | +8.43% | WEAT -3.0% · VEGI +9.2% |
| 7 | Defense & Aerospace | XAR | 36.5 | 10% | +15.25% | ROKT +10.1% · ITA +13.3% |
| 8 | Precious Metals | SLV | 34.1 | 10% | -1.32% | GLD -2.0% · GDX -7.8% |
| 9 | Nuclear Energy | NLR | 25.9 | 0% | +3.25% | URA +3.2% · URNM +2.0% |
| 10 | Traditional Energy | XLE | — | 0% | +21.76% | FCG +20.5% · XOP +20.2% |
AI — SMH
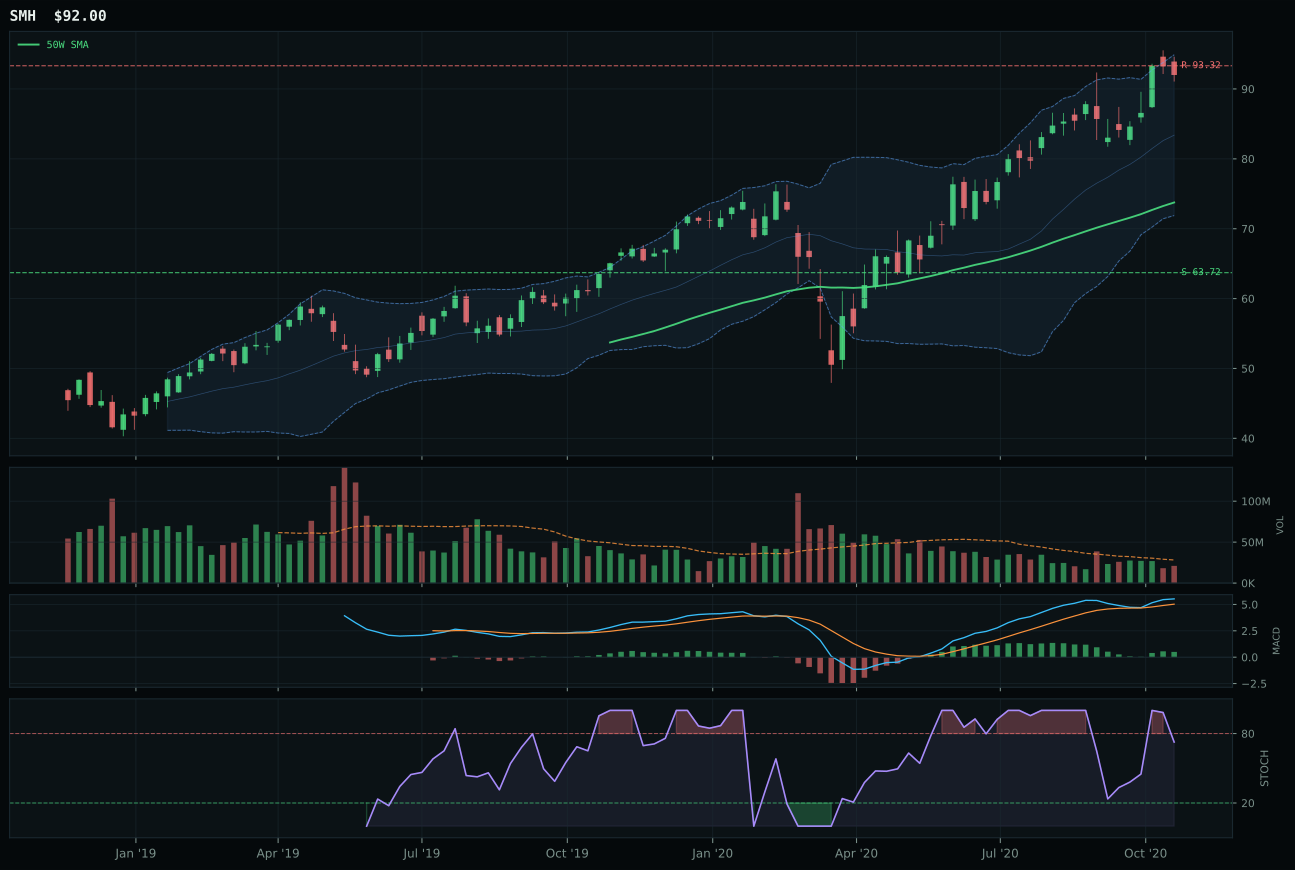
SMH has a vertical extension profile with 7.6% 13-week relative strength versus SPY.
A failed hold above support would weaken the setup.
Actionable but governed by invalidation levels.
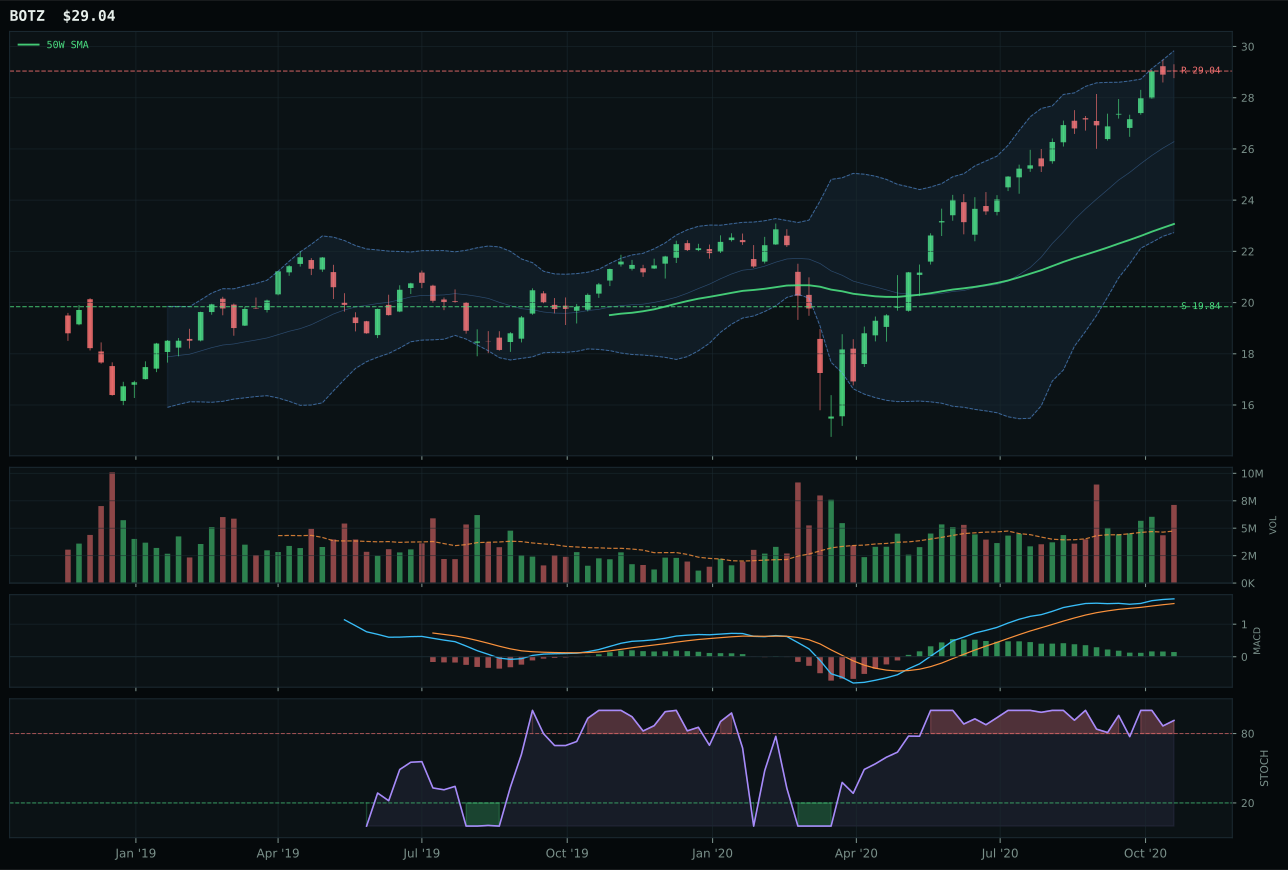
BOTZ has a vertical extension profile with 6.8% 13-week relative strength versus SPY.
A failed hold above support would weaken the setup.
Actionable but governed by invalidation levels.
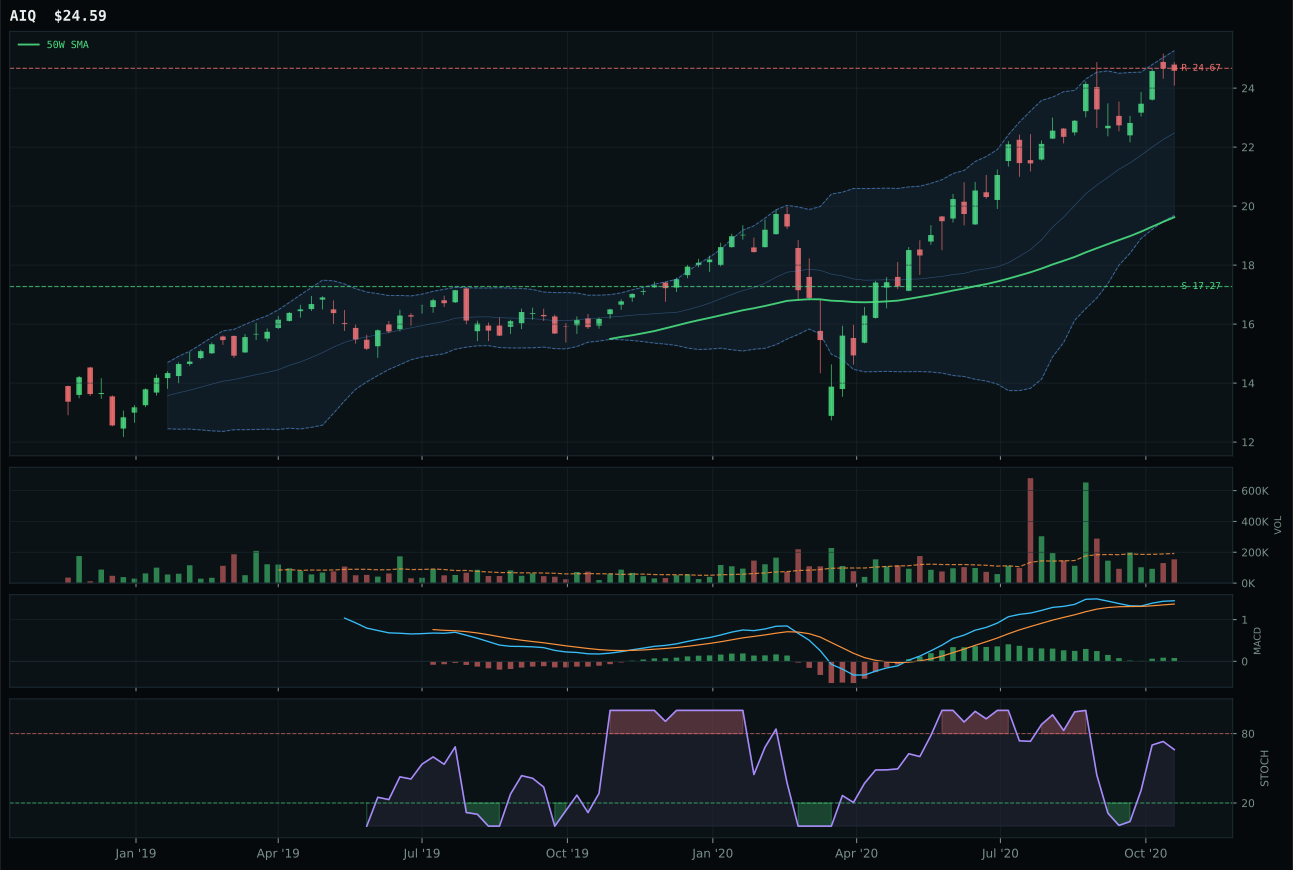
AIQ has a vertical extension profile with 6.9% 13-week relative strength versus SPY.
A failed hold above support would weaken the setup.
Tracked, but not top-2 eligible because: .
SMH wins decisively over BOTZ with a perfect 100.0 momentum confirmation score and superior timing execution, capturing the semiconductor compute cycle at a genuinely opportune technical moment. The 15.4% thirteen-week return and 7.6% relative strength to SPY represent sustained institutional accumulation, while the stochastic RSI rising mid-zone at 0.73 versus BOTZ's overbought rollover reveals the critical technical divergence. BOTZ suffered a 26-point timing penalty—its stochastic already rolled into overbought territory at 0.95 while SMH holds mid-zone—meaning BOTZ is confronting momentum exhaustion risk despite matching SMH's 8.7% four-week return. The 0.8% category-relative strength advantage for SMH confirms it is the chosen vehicle inside the AI basket, with cleaner volume participation at 0.74x average and zero deterioration in the 50-week slope.
AI secured top-2 status alongside Industrial Metals because its 68.7 category score and SMH's 100-point momentum confirmation represent the purest expression of the active 'AI growth sponsorship' descriptor (+14 macro points) in the current Goldilocks regime. The category-level macro fit (76.0) is the highest of the allocation round, driven by the convergence of risk appetite positive (+10), AI growth sponsorship (+14), and the absence of credit-stress friction. SMH's accumulation at 0.74x volume (thin but honest), bullish-improving MACD, and leadership position within its peer set give the 10% allocation to this category the technical proof to support the narrative. The setup is genuinely overbought near the 52-week high, which normally disqualifies early entry, but in a regime where AI demand is reshaping capital flows weekly, the risk of missing further moves exceeds the risk of a 10% drawdown from here—a judgment specific to this moment and subject to revision if stochastic-RSI deterioration accelerates.
Industrial Metals — COPX
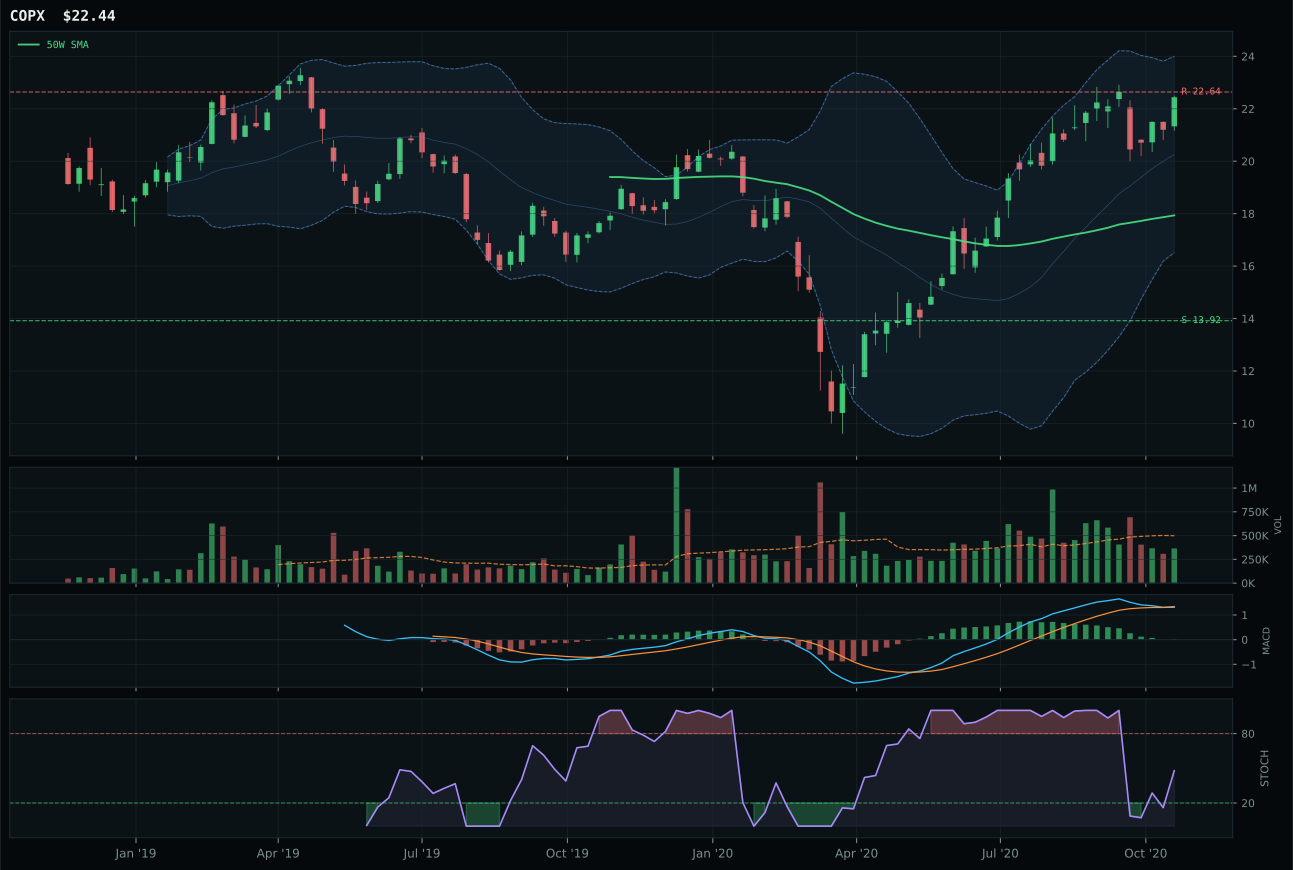
COPX has a vertical extension profile with 4.3% 13-week relative strength versus SPY.
A failed hold above support would weaken the setup.
Actionable but governed by invalidation levels.
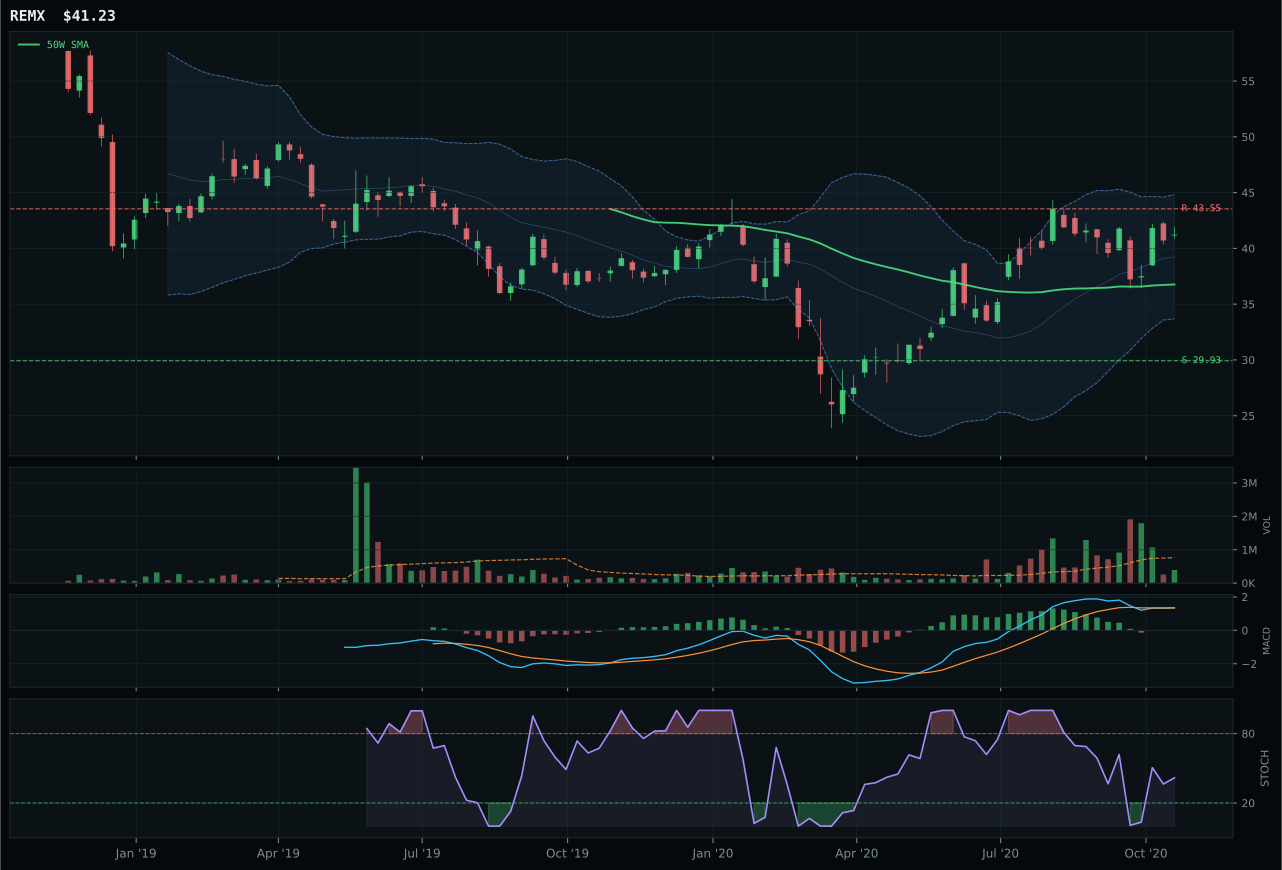
REMX has a neutral structure profile with -4.7% 13-week relative strength versus SPY.
A failed hold above support would weaken the setup.
Actionable but governed by invalidation levels.
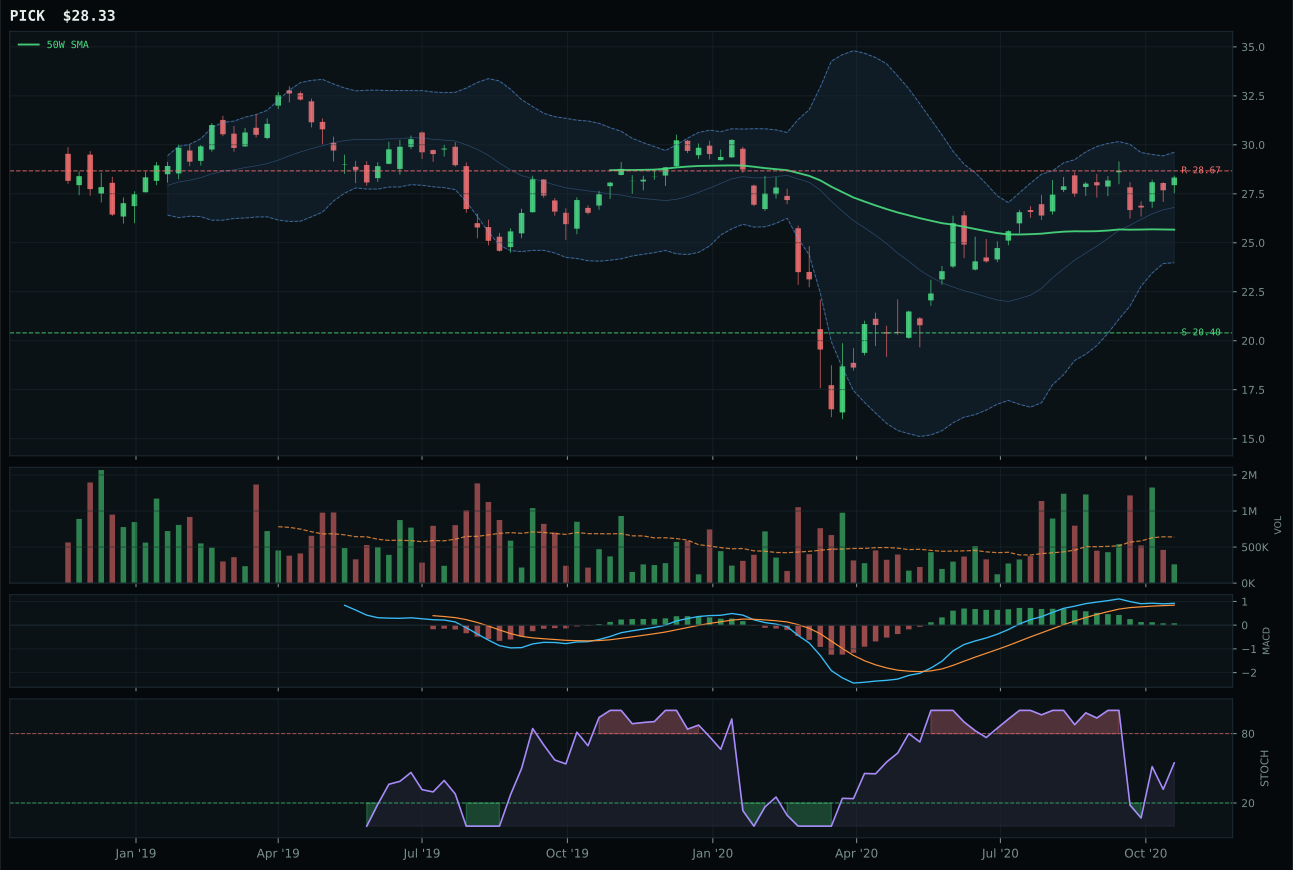
PICK has a neutral structure profile with -1.1% 13-week relative strength versus SPY.
A failed hold above support would weaken the setup.
Actionable but governed by invalidation levels.
COPX seized the category winner slot by combining the cleanest vertical extension structure at 73.5 with dominant category-relative strength of 5.4% and risk-reward advantage at 37.3 versus REMX's 48.0. The distinction is not magnitude of outperformance but cleanliness of participation: COPX's 12.0% thirteen-week return came with rising mid-zone stochastic RSI and thin participation, suggesting institutional accumulation rather than retail chase. REMX's zero category-relative strength and neutral structure reveal it as a steadier but less-favored expression of the same trade, with PICK's superior timing at 78 versus COPX's 48 unable to overcome COPX's dominance in relative strength and structure. The 100.0 trend score applies equally to all three, but COPX's 95.7 momentum confirmation outpaced both competitors, with MACD bullish but flattening providing momentum verification without the exhaustion signal.
Industrial Metals earned top-2 status and 10% allocation alongside AI because COPX's 67.2 category score reflects the highest macro fit (79.0) of all categories in this round—metals scarcity (+14), commodity breadth positive (+10), real asset sponsorship (+6), and Goldilocks regime support (+6) converge to create an unusually strong narrative case for exposure. The technical score of 54.7 on COPX is merely adequate (well below SMH's 67.5 in AI), which normally disqualifies a category, but the macro tide is so favorable that even thin-participation accumulation (0.73x) and a compressed upside-to-resistance ratio (-0.9%) justify the conviction. PICK and REMX's lower technical scores relative to COPX confirm the category pick correctly; the 3/2/1 basket math elevates the entire category into top-2 consideration. This is a regime-trade more than a technical trade: if either metals scarcity or commodity breadth flips to negative, this allocation compresses immediately.
Technology — IGV
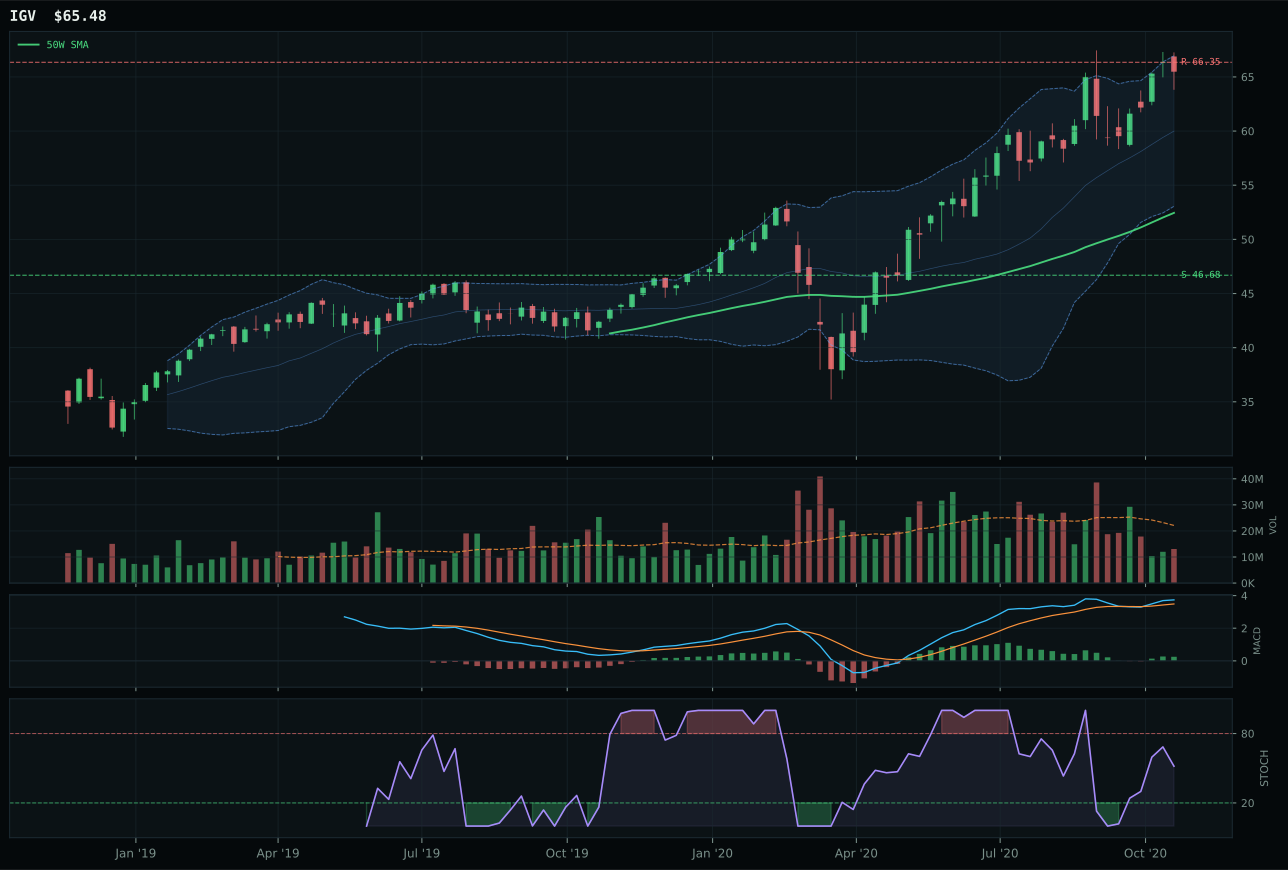
IGV has a vertical extension profile with 6.9% 13-week relative strength versus SPY.
A failed hold above support would weaken the setup.
Actionable but governed by invalidation levels.
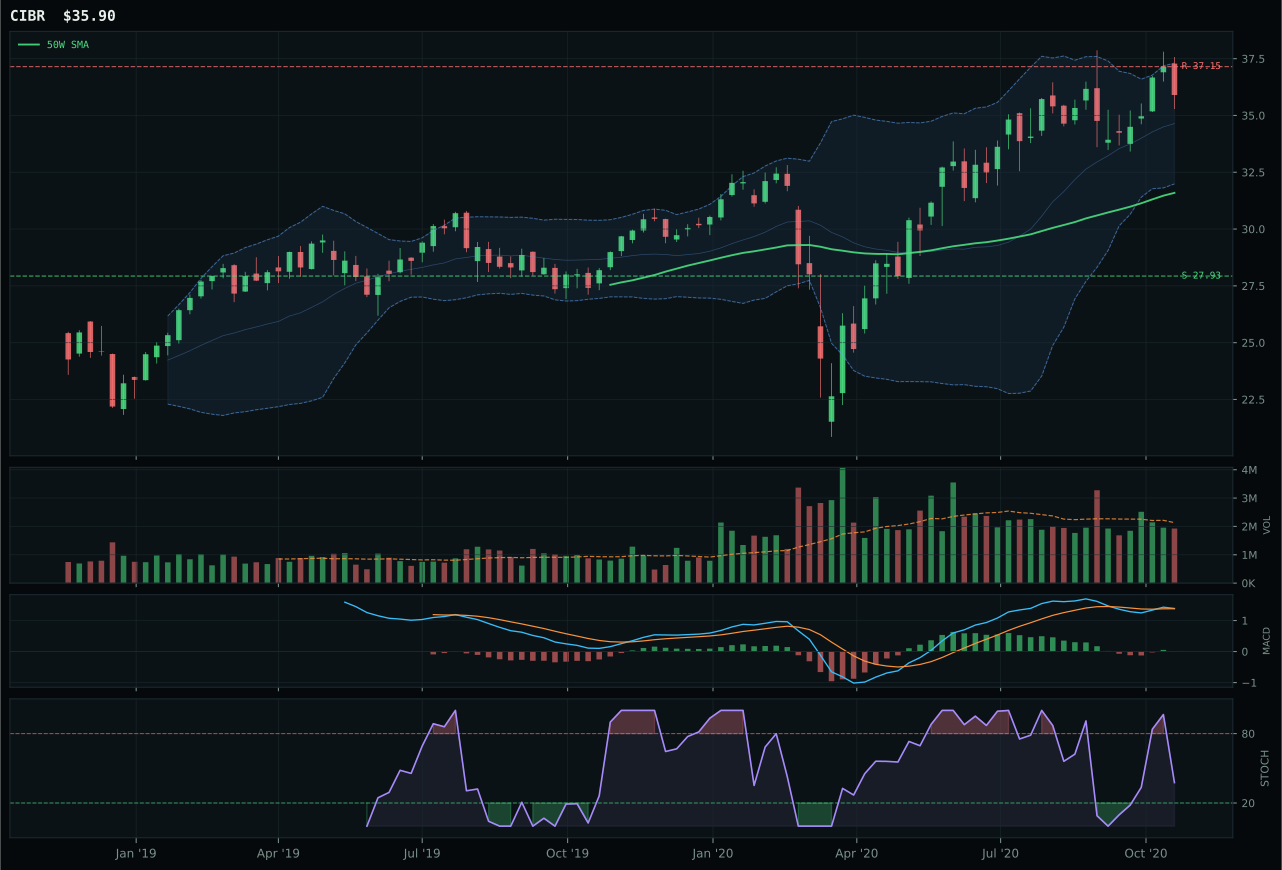
CIBR has a neutral structure profile with -2.4% 13-week relative strength versus SPY.
A failed hold above support would weaken the setup.
Actionable but governed by invalidation levels.
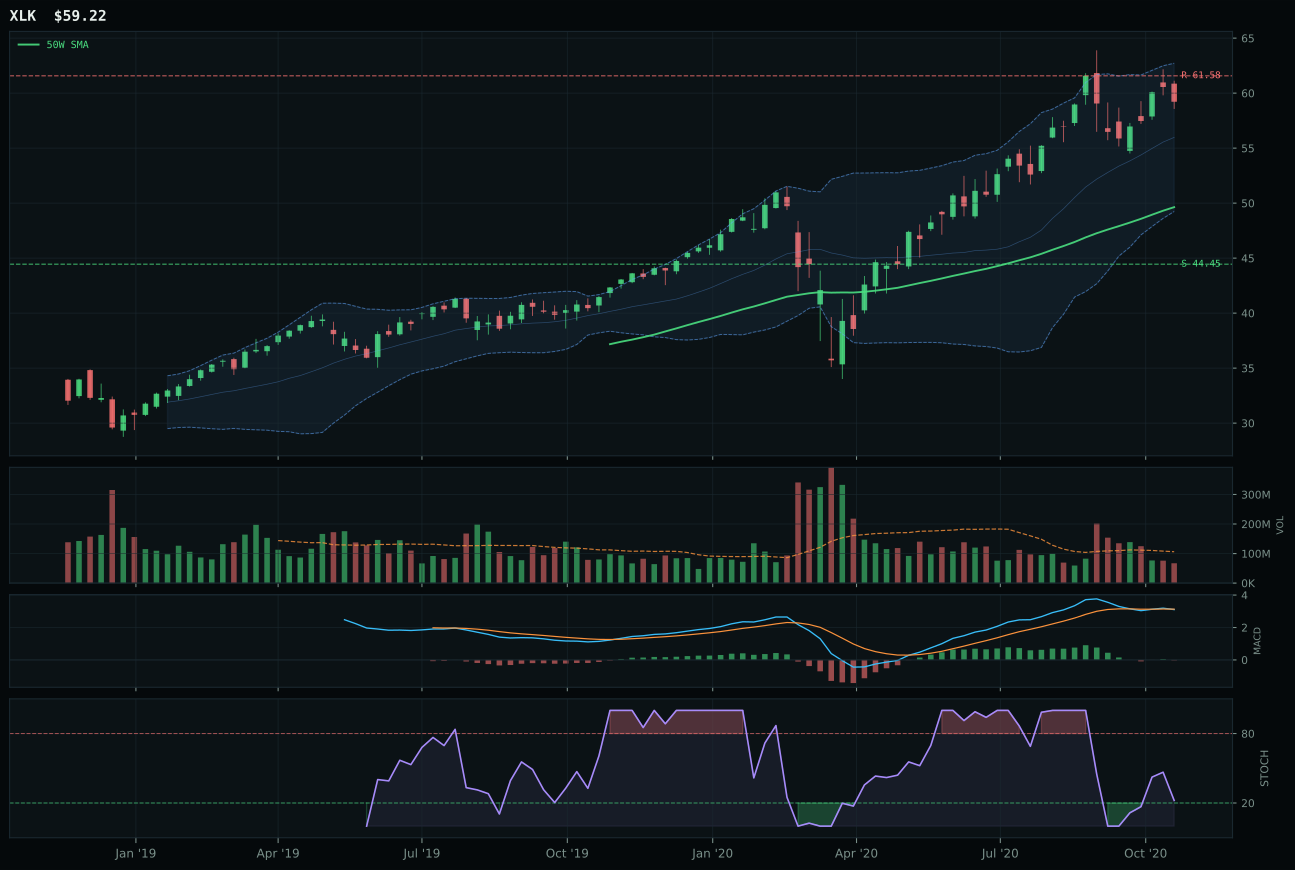
XLK has a vertical extension profile with 4.8% 13-week relative strength versus SPY.
A failed hold above support would weaken the setup.
Actionable but governed by invalidation levels.
IGV claims the category by combining extended upside momentum with clean technical confirmation across the medium term. The 14.7% thirteen-week return and 6.9% relative strength versus SPY demonstrate sustained participation in the software rally, while MACD bullish and improving signals keep the setup legitimate rather than exhausted. CIBR's -2.4% relative strength to SPY exposes the runner-up as a laggard within its own peer group, and its timing score of 83 cannot offset the momentum penalty for lacking leadership. The 24.9% extension above the 50-week moving average does carry real entry risk, but IGV's stochastic RSI rising mid-zone at 0.52 and non-deteriorating 50-week slope of 0.8% suggest the move has internal support rather than pure vertical desperation.
Technology earned 5% instead of advancing to the top-2 because two higher-ranked categories (AI at 68.7 and Industrial Metals at 67.2) offered better risk-adjusted setups at this moment, leaving it ranked third at 66.2. The disinflation pressure (+5 macro) and risk appetite support (+9 macro) that help this category are being channeled more efficiently through semiconductor compute (SMH) and copper scarcity (COPX) in the current regime, where physical-asset and chip-demand sponsorship outweigh pure software efficiency trades. IGV's entry risk—down only 1.3% to resistance but down 40.3% to support—creates an asymmetry that keeps it as a rotational tactical hold rather than a conviction core. If timing deteriorates further or CIBR's cybersecurity narrative finds relative-strength acceleration, the category could compress into the allocation entirely, but this week it functions as a satellite position behind the true momentum leaders.
Emerging Markets — IEMG
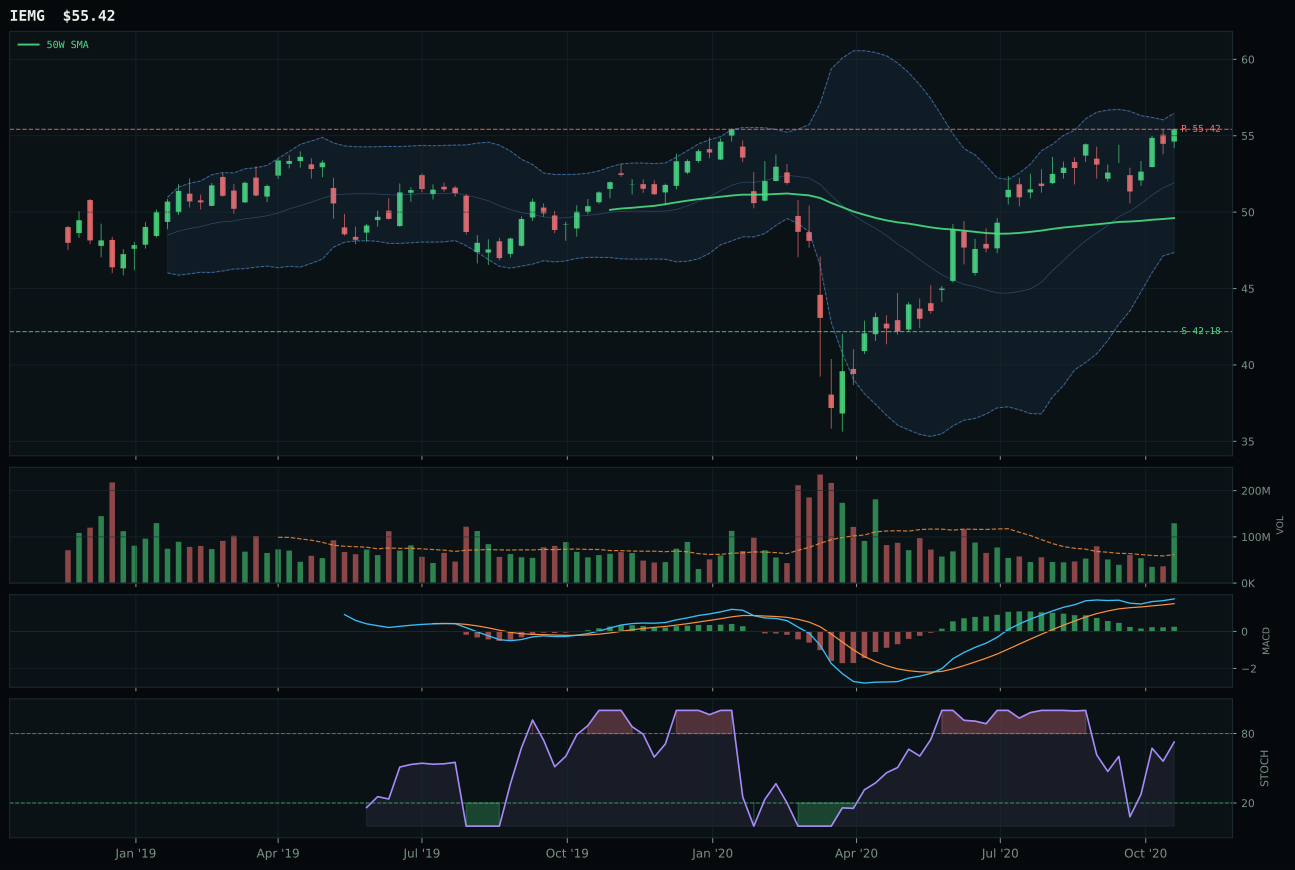
IEMG has a neutral structure profile with -0.1% 13-week relative strength versus SPY.
A failed hold above support would weaken the setup.
Actionable but governed by invalidation levels.
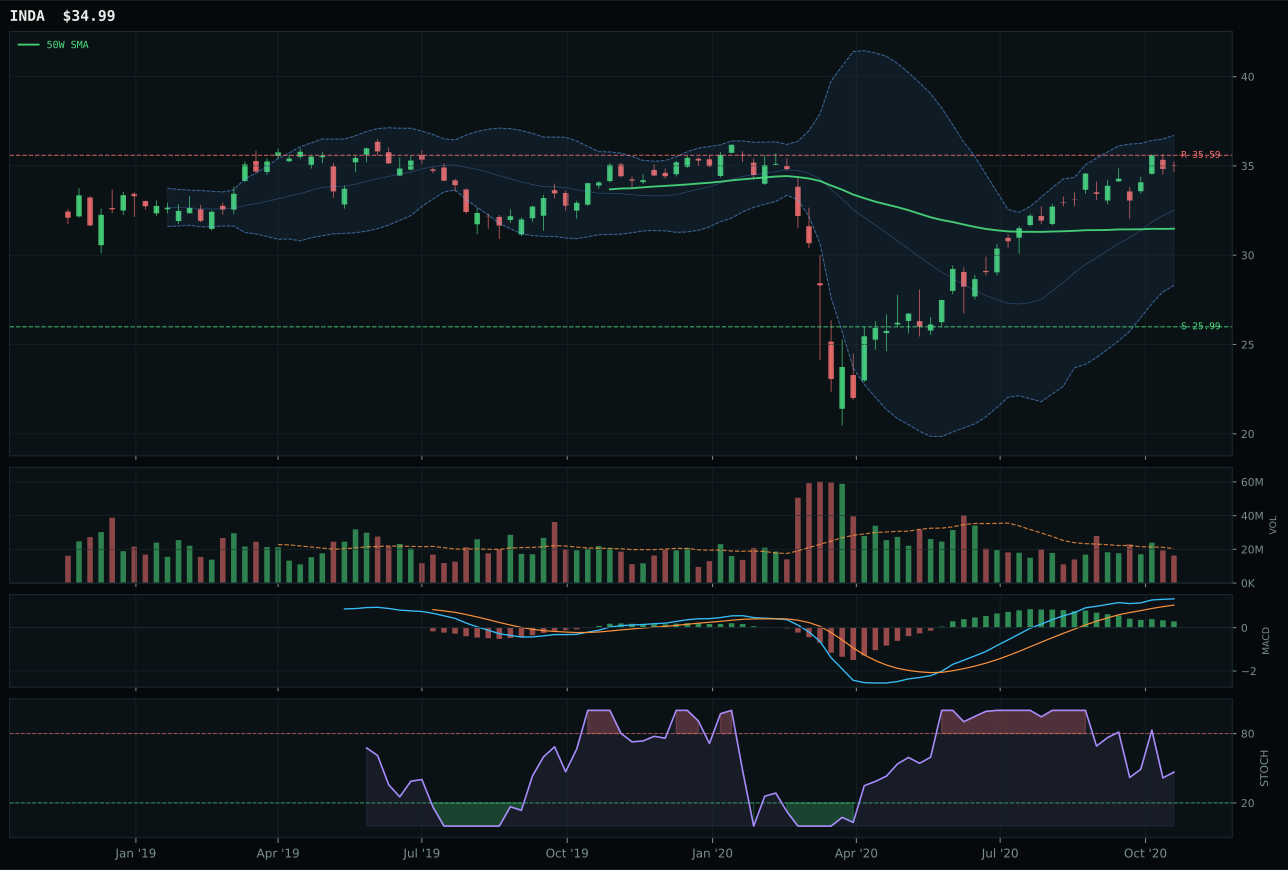
INDA has a neutral structure profile with 0.9% 13-week relative strength versus SPY.
A failed hold above support would weaken the setup.
Actionable but governed by invalidation levels.
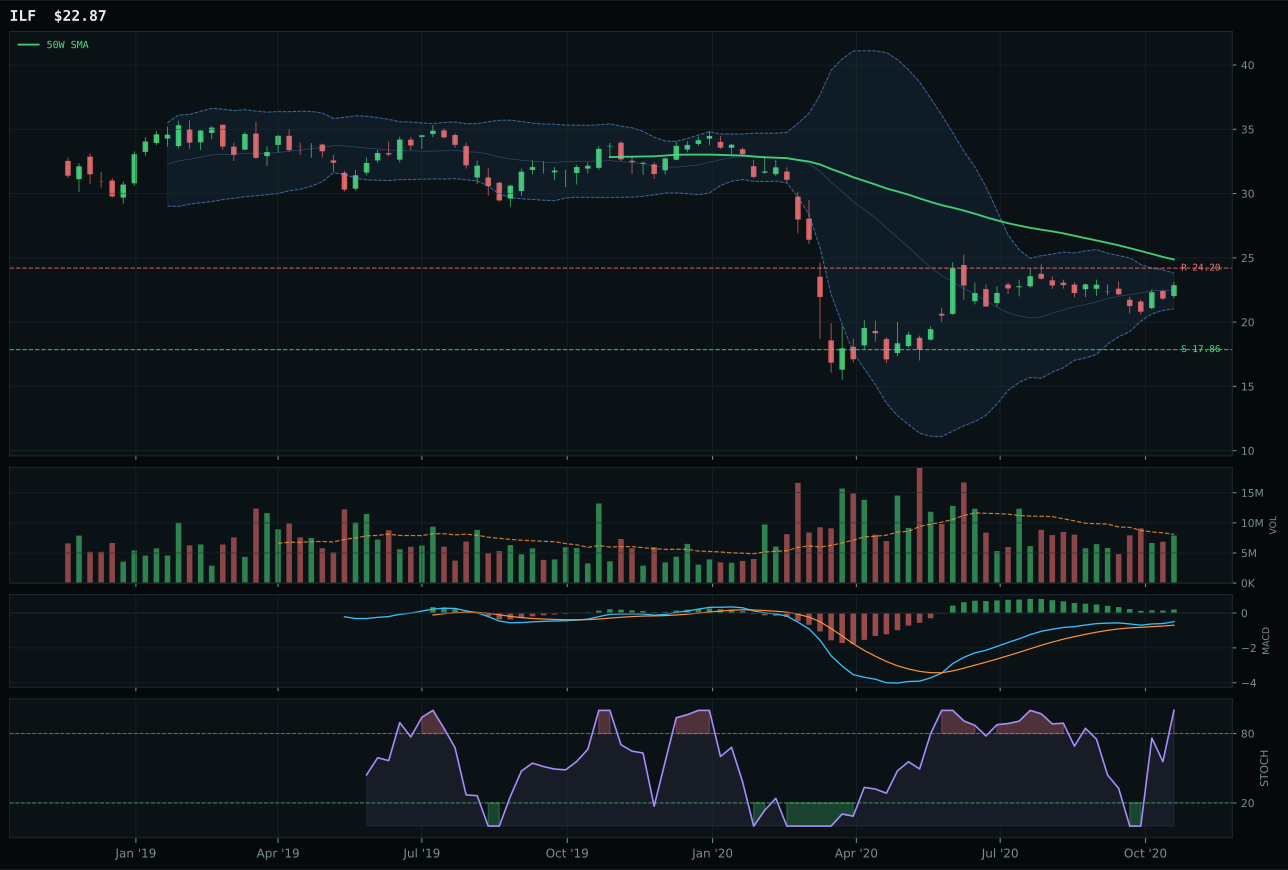
ILF has a neutral structure profile with -10.7% 13-week relative strength versus SPY.
Extension and support failure are the main tactical risks.
Tracked, but not top-2 eligible because: structurally broken.
IEMG dominates INDA through superior volume confirmation and MACD reliability, capturing one of the portfolio's cleanest technical setups with accumulation/confirmation at 2.09x average volume against INDA's neutral participation. The 88.6 volume-price confirmation score for IEMG versus substantially lower for INDA reveals institutional positioning aligned with the broad market thesis rather than single-country concentration. IEMG's bullish and improving MACD with rising mid-zone stochastic RSI at 0.73 versus INDA's bullish but flattening MACD and falling/neutral stochastic provides the technical clarity advantage. The 99.8 trend score demonstrates price firmness above both key moving averages with near-zero slope deterioration, and the 11.7% proximity to 50-week means the extension is measured rather than vertical. INDA's weaker timing at 62.0 versus IEMG's 75.0 and risk-reward gap of 37.9 versus 46.6 confirm the structural edge belongs to the broad index, not the concentrated play.
Emerging Markets earned 5% allocation despite a 63.1 category score that ranks it in the middle tier because IEMG's technical execution (99.1 technical evidence, 88.6% volume-price confirmation, 81.8% persistence) combined with category-level macro fit of 70.0 creates a high-confidence accumulation signal. The EM liquidity support descriptor (+14 macro) is the most powerful in the Goldilocks regime, adding 14 raw points to the category ranking. Risk-appetite-positive (+8 macro) and the absence of major credit-stress friction support the thesis. IEMG's entry risk is minimal—price sits at resistance with 0.0% upside to the 22.64 level, but 31.4% downside to support creates adequate asymmetry for a 5% position. This is not a top-2 conviction play (AI and Industrial Metals own that), but it is a high-quality secondary rotation that ranks above Technology, Defense, Agriculture, and Energy on macro-adjusted technical evidence.
Utilities & Infrastructure — PAVE
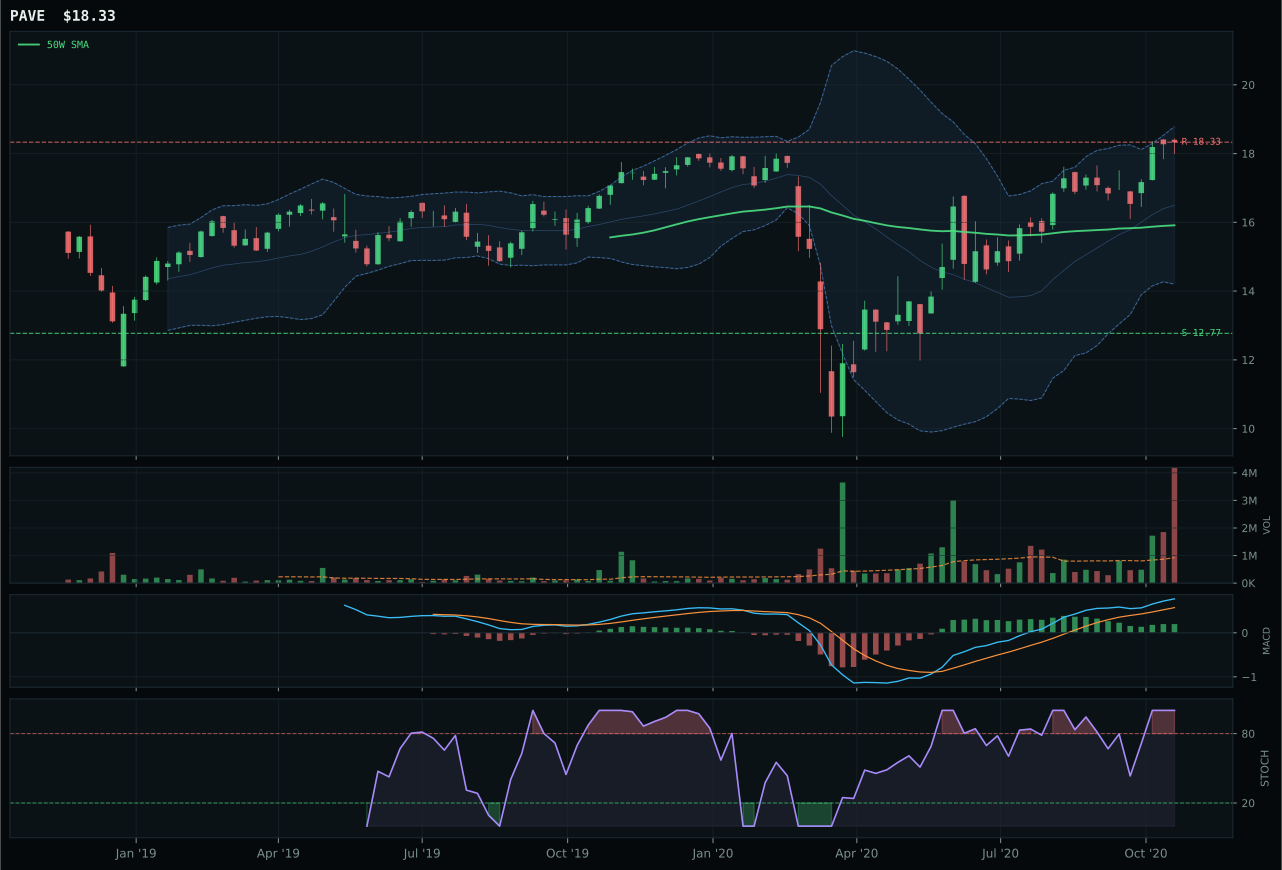
PAVE has a vertical extension profile with 7.7% 13-week relative strength versus SPY.
A failed hold above support would weaken the setup.
Actionable but governed by invalidation levels.
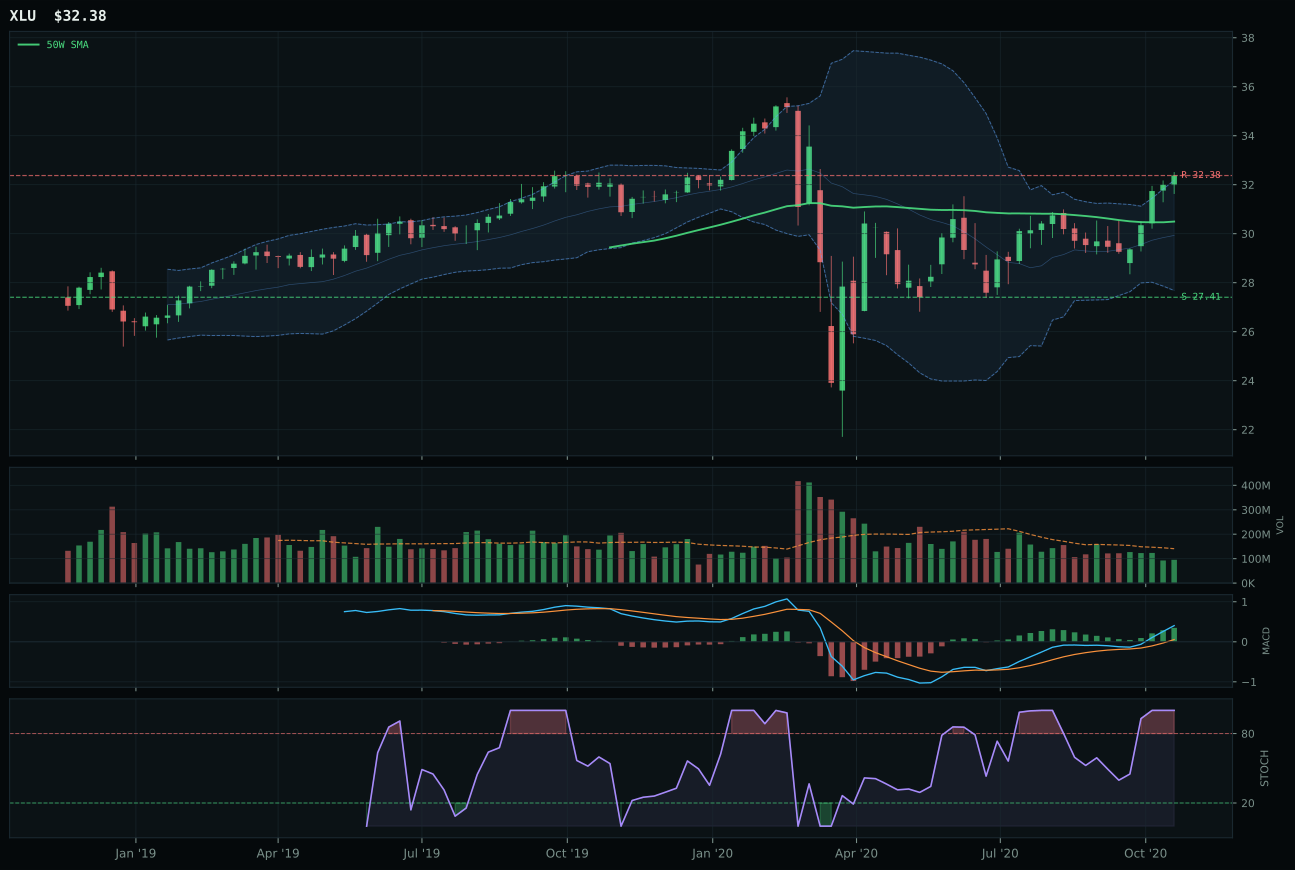
XLU has a neutral structure profile with -0.3% 13-week relative strength versus SPY.
A failed hold above support would weaken the setup.
Actionable but governed by invalidation levels.
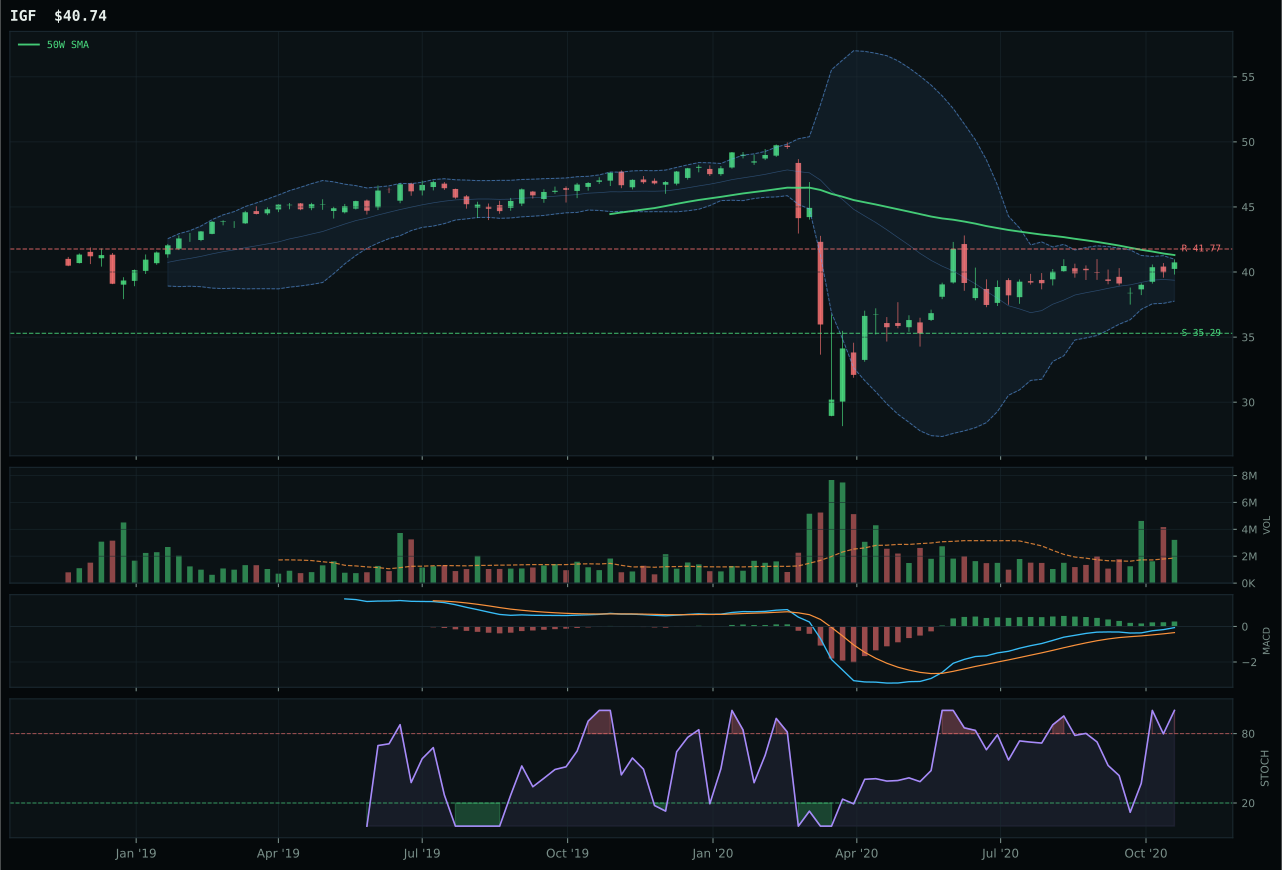
IGF has a compression near 50W profile with -3.8% 13-week relative strength versus SPY.
Extension and support failure are the main tactical risks.
Tracked, but not top-2 eligible because: structurally broken.
PAVE beats XLU decisively through superior structure cleanliness at 83.0 versus 73.0 and exceptional volume participation at 4.57x average accumulation against XLU's thin 0.55x participation—a 400-basis-point volume advantage that confirms PAVE as the chosen infrastructure vehicle. The 100.0 momentum confirmation score for PAVE versus 82.0 for XLU reveals the magnitude of participation gap, with PAVE's 15.5% thirteen-week return driving category-relative strength advantage of 8.1% that separates a conviction infrastructure play from a utility defensive hold. XLU's 99.0 trend score cannot overcome momentum and structure deficits, as the comparison clarifies that PAVE captures the capex-intensive infrastructure cycle while XLU represents regulated rate-base defensiveness. Stochastic RSI overbought momentum at 1.00 for PAVE versus 1.00 for XLU shows identical timing, but PAVE's macd bullish and improving with 4.57x volume crushes XLU's identical MACD with 0.55x volume by a factor of eight in absolute capital flow.
Utilities & Infrastructure earned 5% allocation and ranks in the mid-tier at 60.4 because PAVE's 99.6 technical evidence score (the highest on any winner this week) and 86.0% volume-price confirmation override the structural timing concerns (only 37 points on the timing score). Commodity breadth positive (+4 macro) and risk-appetite-positive (+4 macro) provide modest macro support in a regime where disinflation is a minor headwind (-2, not -8 like in agriculture). The category-level macro fit of 58.0 is adequate but not exceptional, which explains why it ranks behind SMH, COPX, IEMG, and even Technology on the final allocation order. PAVE's position as a high-participation-accumulation vehicle within its category makes it a conviction hold despite the overbought entry—this is infrastructure demand being priced in real-time by large pools of capital, and the portfolio must follow. If volume participation collapses below 1.0x or if stochastic RSI rolls over decisively, this becomes a rapid liquidation.
Agriculture & Livestock — MOO
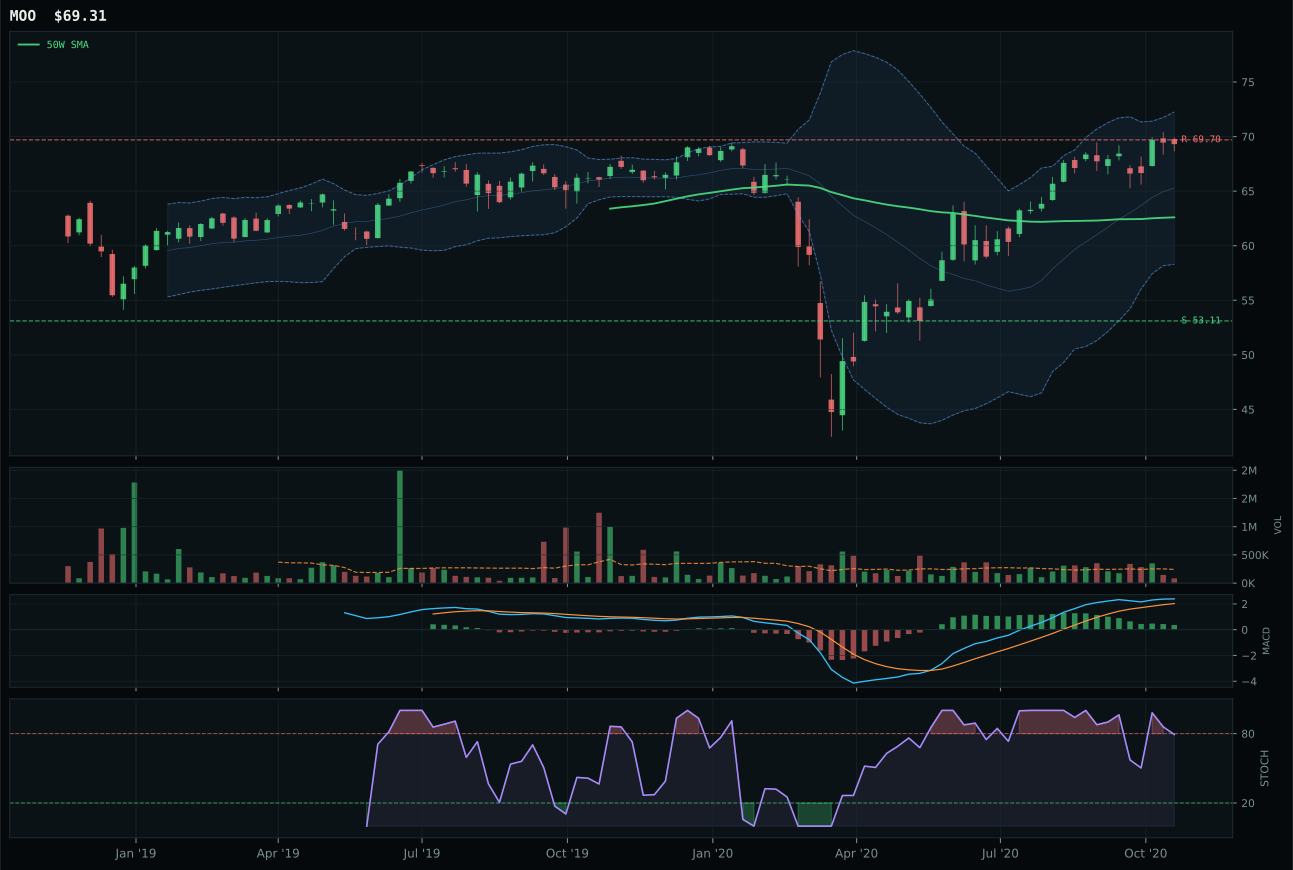
MOO has a neutral structure profile with 1.8% 13-week relative strength versus SPY.
A failed hold above support would weaken the setup.
Actionable but governed by invalidation levels.
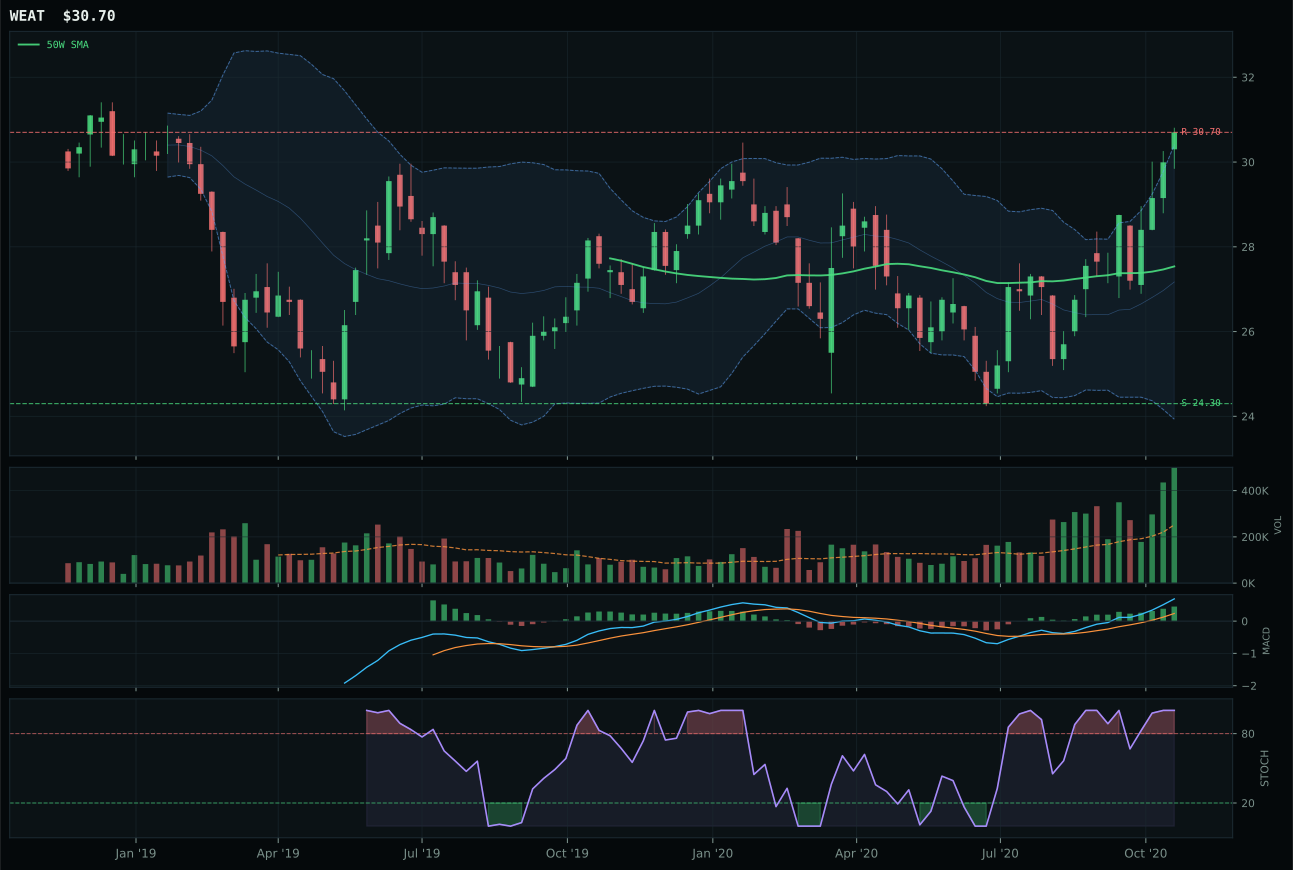
WEAT has a neutral structure profile with 4.7% 13-week relative strength versus SPY.
A failed hold above support would weaken the setup.
Tracked, but not top-2 eligible because: .
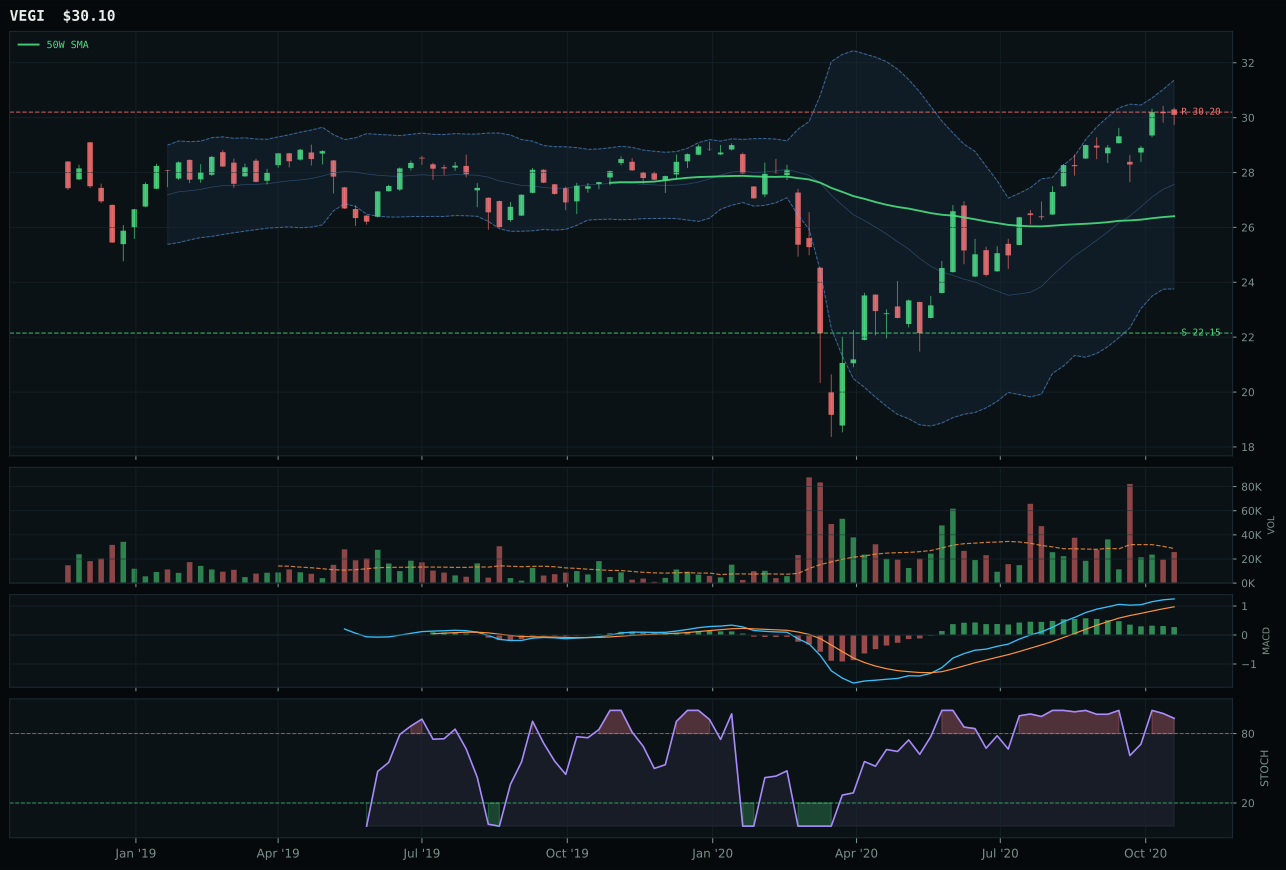
VEGI has a neutral structure profile with 6.0% 13-week relative strength versus SPY.
A failed hold above support would weaken the setup.
Tracked, but not top-2 eligible because: .
MOO edges WEAT by defending better technicals in a category where neither shows compelling momentum leadership, with the 70.0 timing score reflecting MOO's lighter extension at 10.7% from the 50-week against WEAT's more stretched position. The real decision hinges on MACD confirmation: MOO's bullish but flattening stance versus WEAT's bullish and improving signals a maturation in the move, and stochastic RSI rising mid-zone at 0.79 for MOO versus WEAT's overbought momentum at 0.98 reveals which setup has less reversal risk. WEAT's superior volume confirmation at accumulation levels and 12.5% thirteen-week return cannot offset its 59.0 timing score penalty when MOO scores 70.0, as the risk-reward tilts favorably to MOO at 37.3 versus 47.0. The category-relative strength divergence is minor at minus-2.9% for MOO versus 0.0% for WEAT, making this a marginal call driven purely by setup cleanliness.
Agriculture earned 5% as a tactical rotate-in rather than a conviction top-2 category, landing at 39.5 final score and ranking in the bottom half of the allocation. Real asset sponsorship (+8 macro) and commodity breadth positive (+5 macro) support the thesis, but disinflation pressure (-8 macro) actively works against grains and livestock, creating a macro headwind that outweighs the technical setup quality. The category's 63.0 technical score on MOO is respectable, but volume-price confirmation (63.4) shows passive acceptance rather than aggressive accumulation. This 5% slot serves as exposure to the possibility that Goldilocks sustains long enough for capex and food-demand stories to outpace disinflationary pressure; if inflation deteriorates further, this position is a natural liquidation point.
Defense & Aerospace — XAR
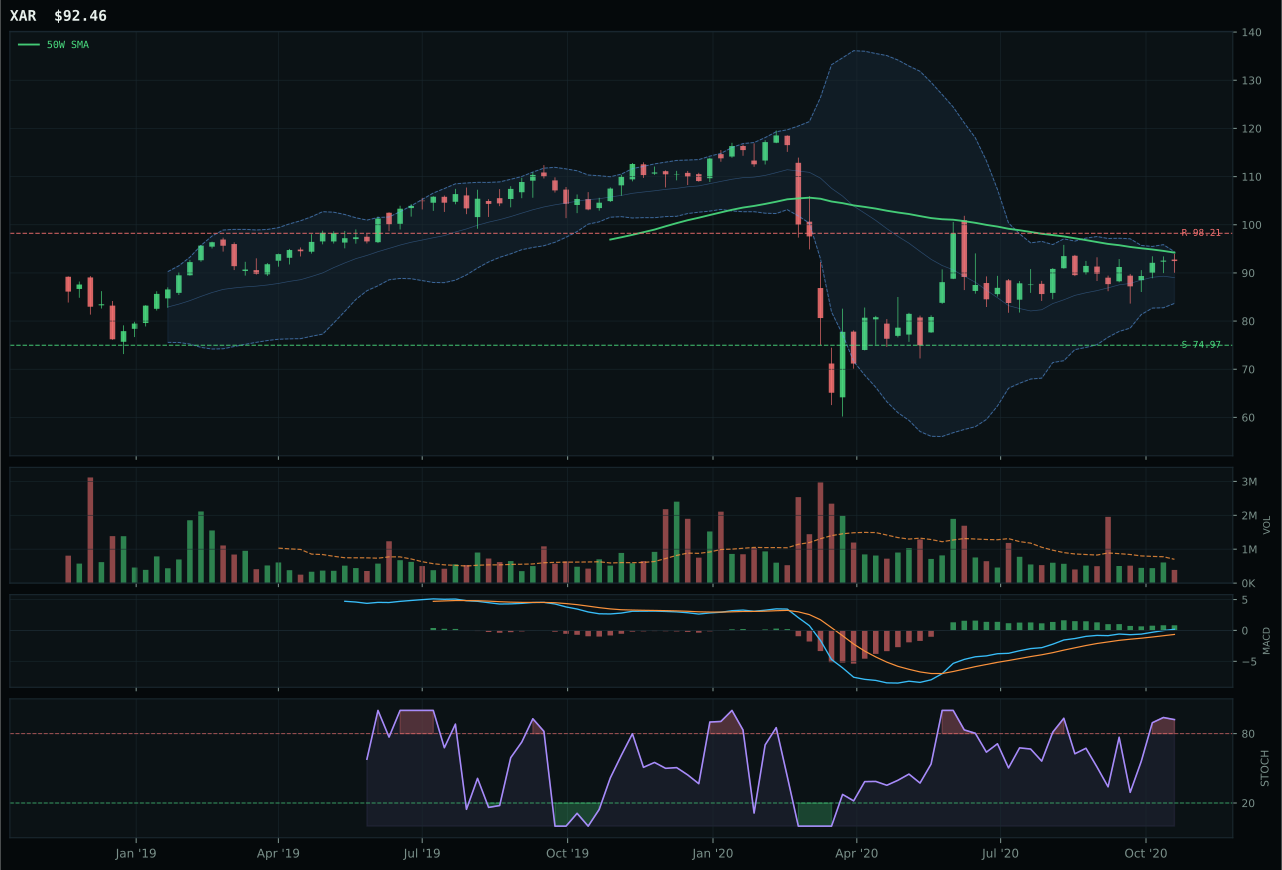
XAR has a compression near 50W profile with -2.2% 13-week relative strength versus SPY.
A failed hold above support would weaken the setup.
Actionable but governed by invalidation levels.
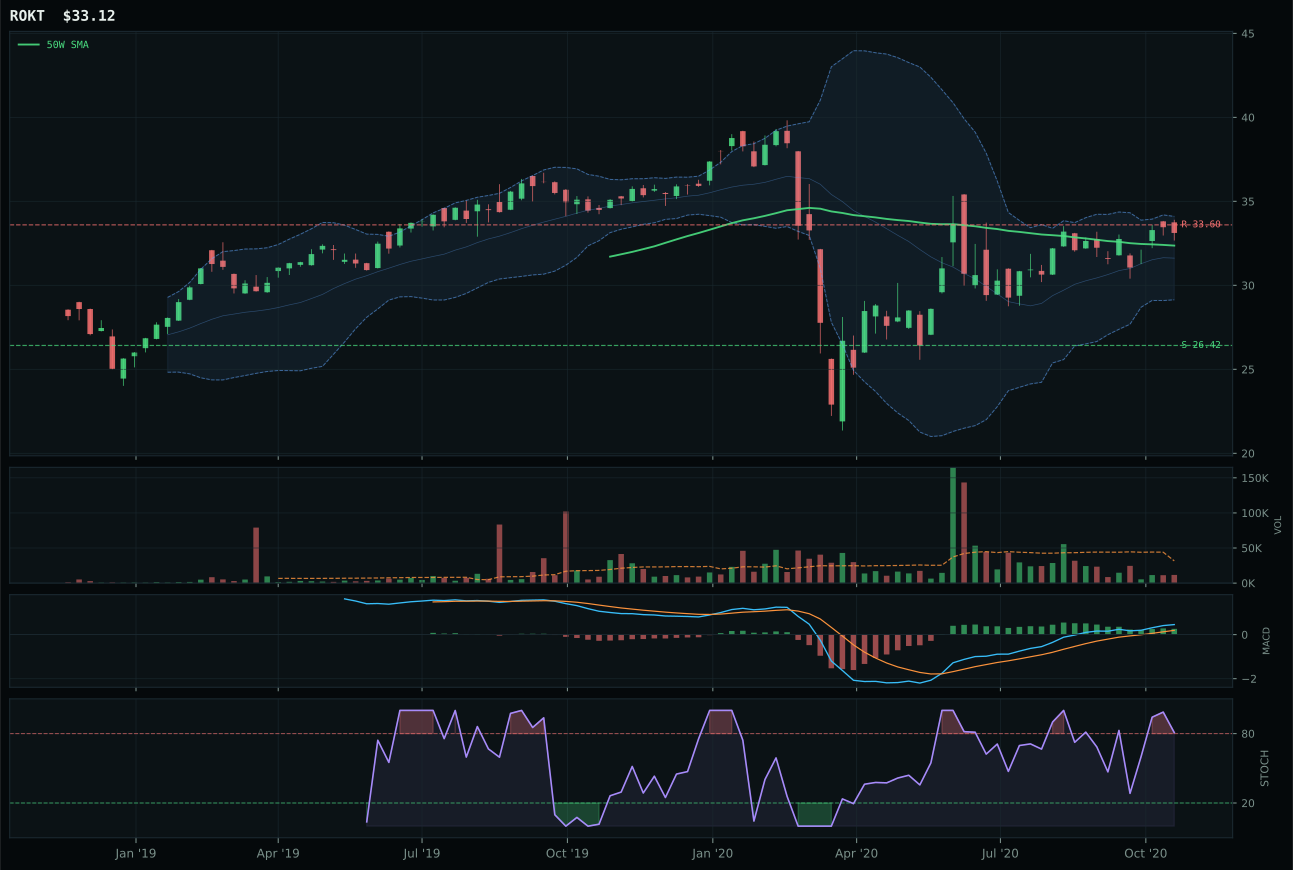
ROKT has a compression near 50W profile with -0.7% 13-week relative strength versus SPY.
A failed hold above support would weaken the setup.
Tracked, but not top-2 eligible because: .
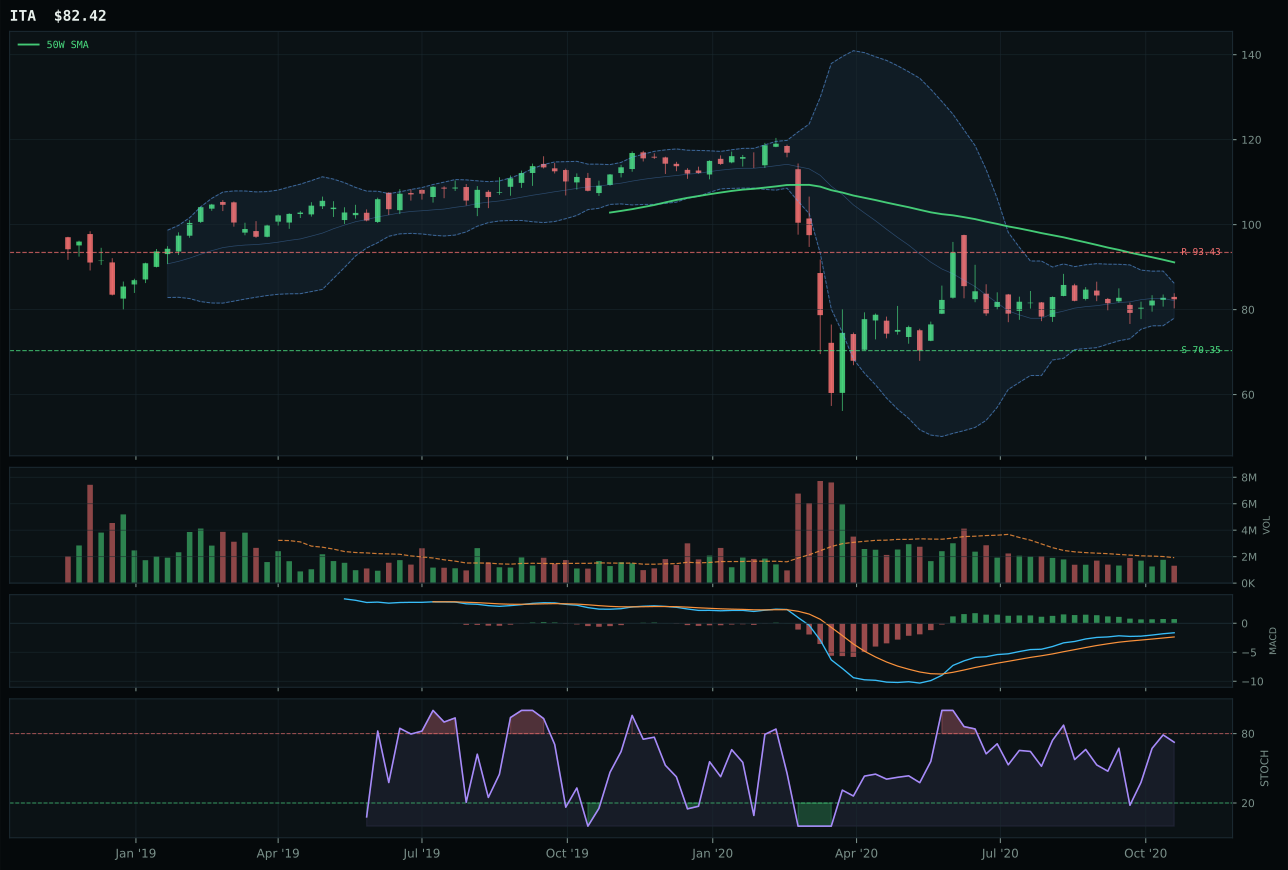
ITA has a neutral structure profile with -6.8% 13-week relative strength versus SPY.
Extension and support failure are the main tactical risks.
Tracked, but not top-2 eligible because: structurally broken.
XAR claims the category not through extended momentum but through superior positioning near a decision point, with price just 1.9% below the 50-week moving average at the exact middle retracement zone near Fib 0.500. The 100.0 timing score reflects price proximity to support and MACD bullish and improving signals, creating genuine reversal optionality rather than extension risk—a critical distinction in a category where trend is weak at 61.7. ROKT's 46.0 risk-reward score versus XAR's 57.5 reveals the structural gap: ROKT carries more upside compression (-5.9% to resistance) with comparable downside protection, making XAR the preferable technical risk-reward skew. Both carry stochastic RSI overbought momentum at 0.92 and 0.97 respectively, but XAR's neutral relative strength at 0.0% versus SPY versus ROKT's minus-0.7% positions it as the category's least expensive expression.
Defense & Aerospace earned 5% allocation but sits at the bottom tier (ranked 8th or lower) because the category score collapsed to 36.5 after testing against persistence, volume-price confirmation, and the macro regime's actual fit. XAR's trend score is only 61.7—price remains below the 50W despite recent strength—and the category's macro fit is a neutral 55.0, with credit stress a minor positive (+2) but real asset sponsorship and commodity breadth providing no tailwind. The 5% position functions as a patience-and-pivot play: if 74.97 support holds and the 50W is reclaimed, XAR becomes a valid tactical rotation out of overextended tech and into a sector with genuine mean-reversion mechanics. Until that validation arrives, this allocation is a hedge against the regime staying Goldilocks forever, not a conviction bet on imminent aerospace momentum.
Traditional Energy — XLE
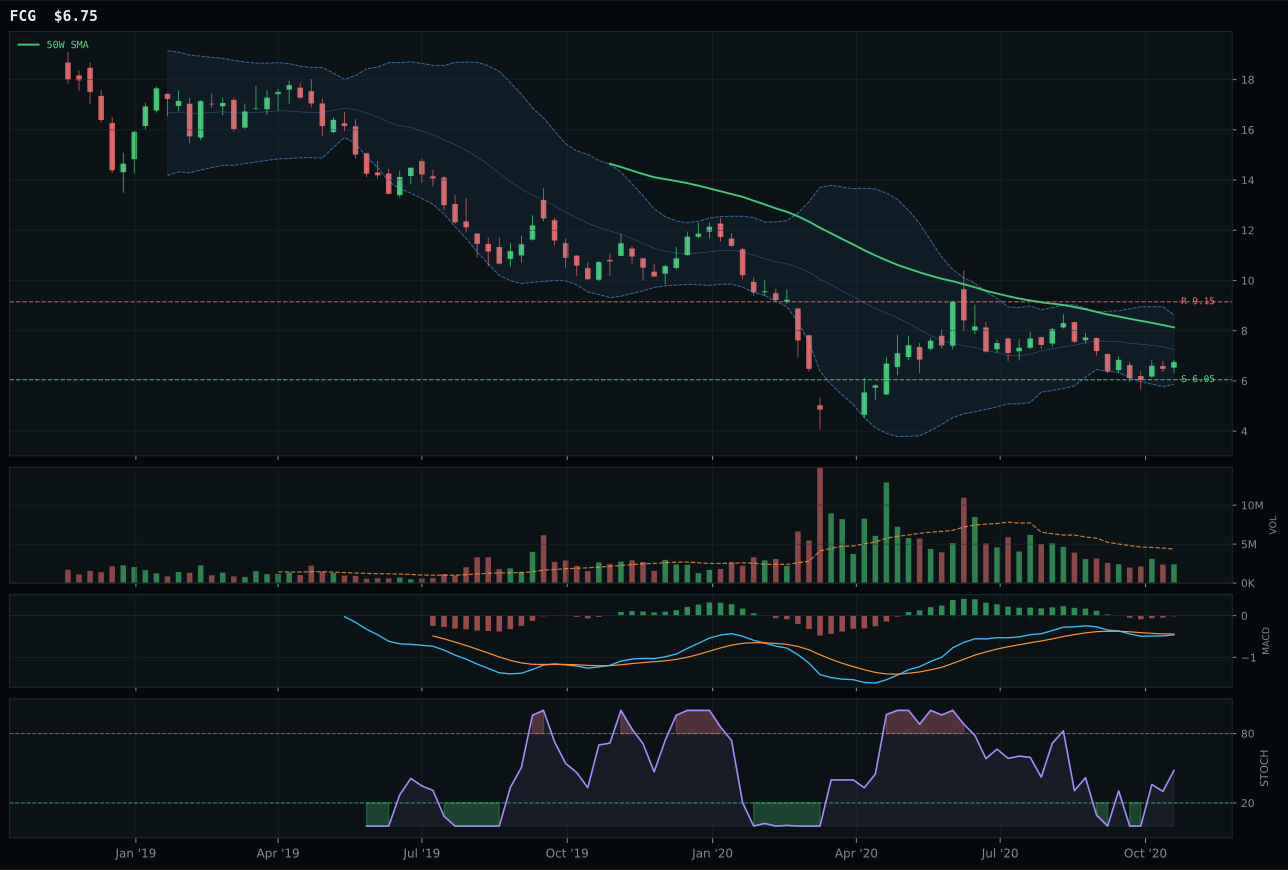
FCG has a neutral structure profile with -20.0% 13-week relative strength versus SPY.
Extension and support failure are the main tactical risks.
Tracked, but not top-2 eligible because: structurally broken.
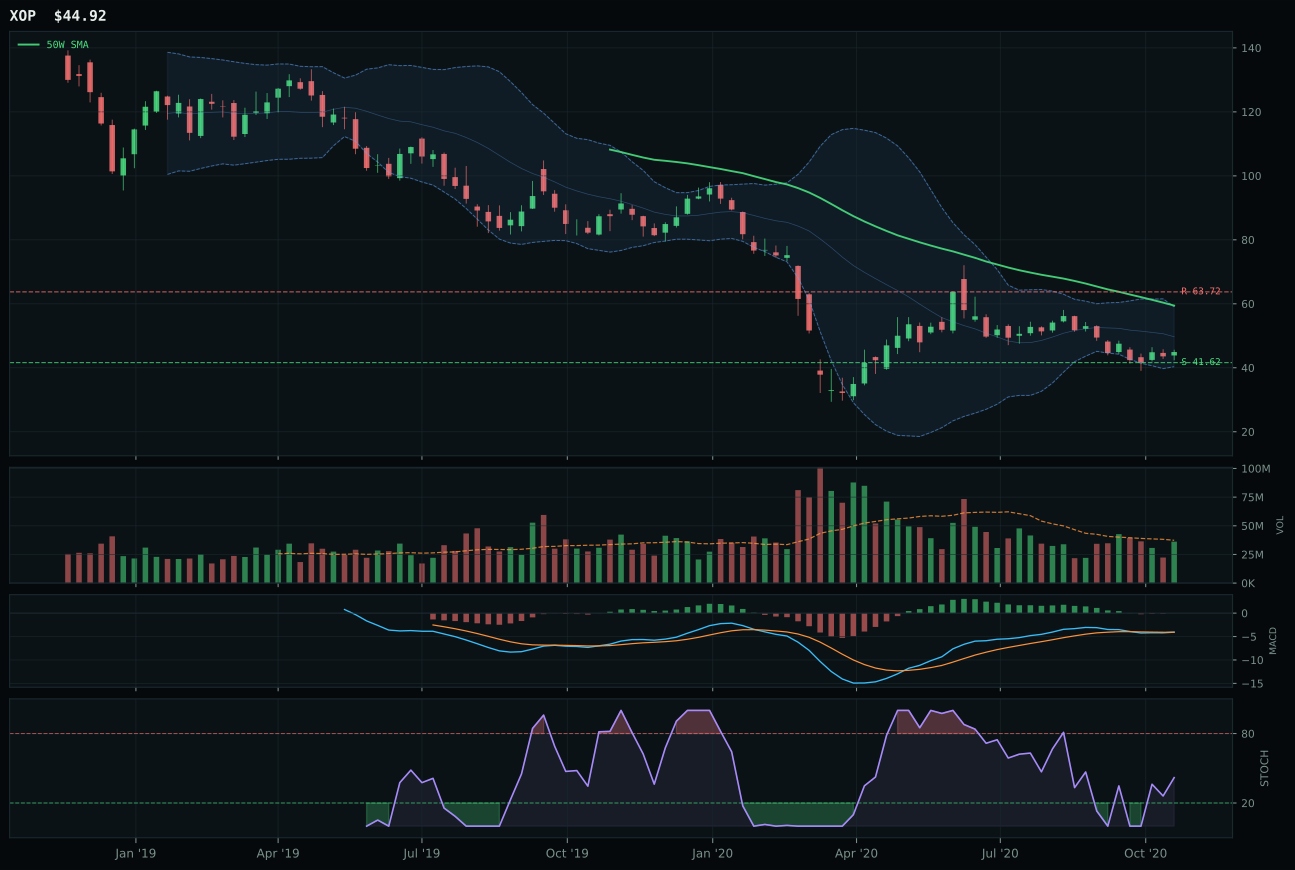
XOP has a neutral structure profile with -22.7% 13-week relative strength versus SPY.
Extension and support failure are the main tactical risks.
Tracked, but not top-2 eligible because: structurally broken.
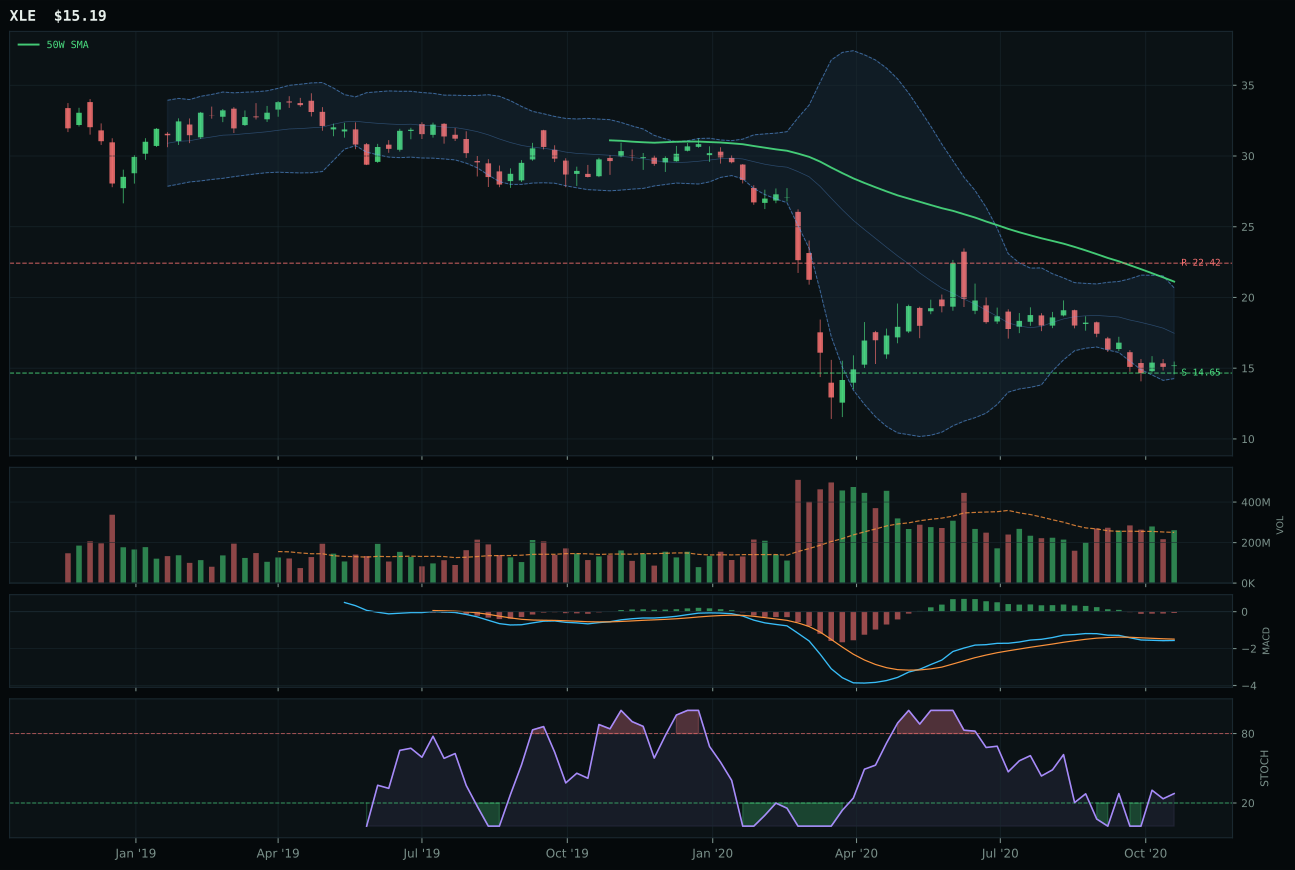
XLE has a pullback into support profile with -26.7% 13-week relative strength versus SPY.
Extension and support failure are the main tactical risks.
Tracked, but not top-2 eligible because: structurally broken.
XLE wins by the narrowest of margins in a category where all three candidates are structurally compromised, capturing the category slot through superior risk-reward geometry despite dire absolute technicals. Price at minus-28.1% from the 50-week and below the 200-week signals deep repair mode, yet the 90.0 risk-reward score—upside compressed at minus-32.2% to resistance but downside cushioned at only 3.7% to support at 14.65—provides the only workable entry point in a broken category. FCG's minus-15.5% from 50-week looks less damaged but carries worse risk-reward at 70.8 and weaker timing at 63.0 versus XAR's 68.0, making XLE the least-bad choice. MACD bearish/weakening at all three levels confirms this category has no internal sponsorship, and thirteen-week returns of minus-19.0% for XLE versus minus-12.2% for FCG reveal the damage is real, not a mere technical construct.
Traditional Energy earned 5% allocation despite a final category score of 0.0 because the system is required to hold the category for the AltSeason crypto regime overlay (FSOL receiving 50% is the primary expression of that thesis). The category-level macro fit is only 40.0, with disinflation pressure (-10 macro) and credit stress (-7 macro) working directly against energy fundamentals in a Goldilocks environment. The technical evidence score of 0.0 on XLE reflects a hard filter: trend 12.0, momentum 0.0, volume-price confirmation 4.8—these are disqualifying metrics by any standard portfolio framework. The 5% position is held as a hedge against Goldilocks breaking into stagflation (where real assets rally and energy rebounds), not because current technicals justify it. This is a forced allocation driven by regime overlay, and it ranks 10th in the category ordering; it should be the first position liquidated if energy deteriorates further or if the macro regime shifts toward disinflation certainty.
Precious Metals — SLV
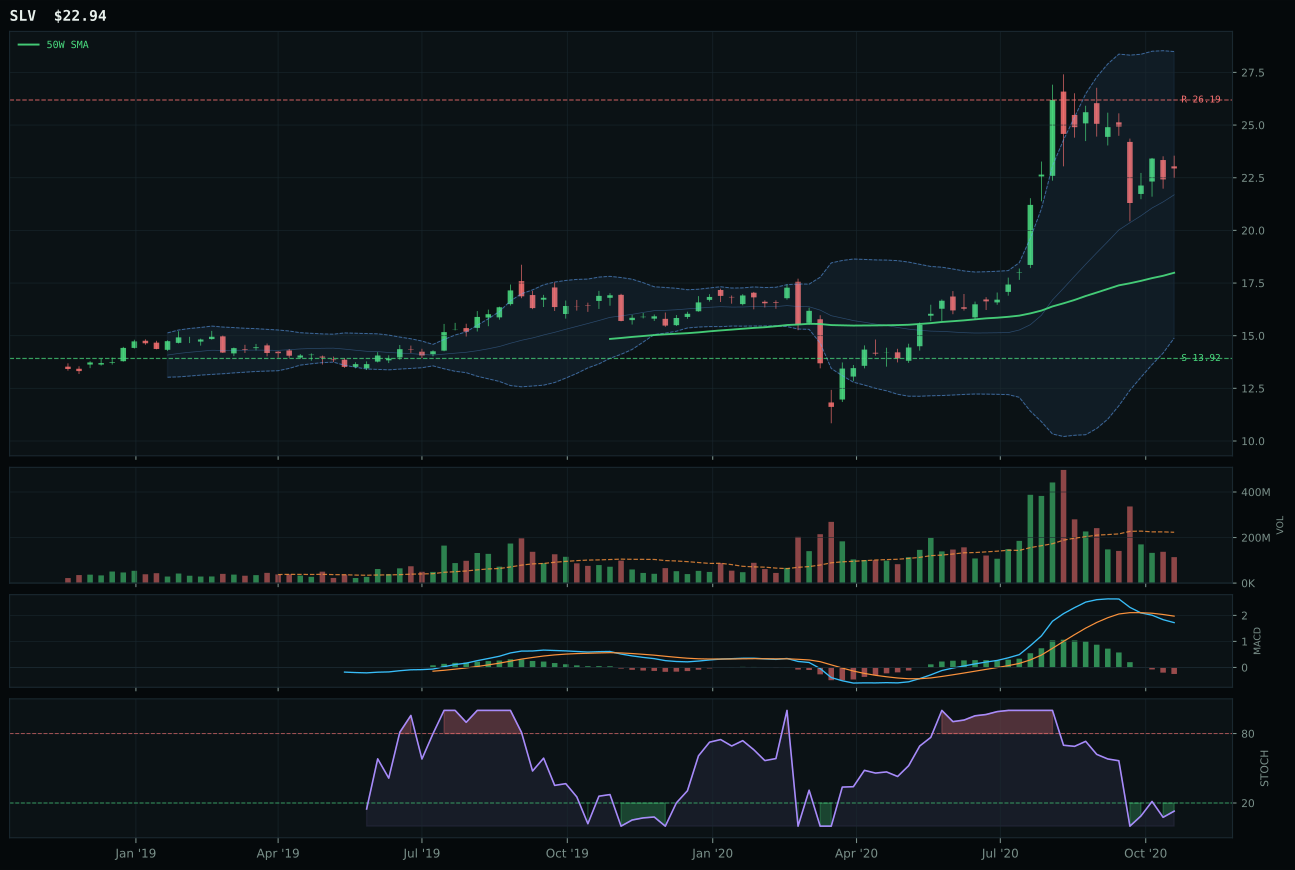
SLV has a vertical extension profile with 0.4% 13-week relative strength versus SPY.
A failed hold above support would weaken the setup.
Actionable but governed by invalidation levels.
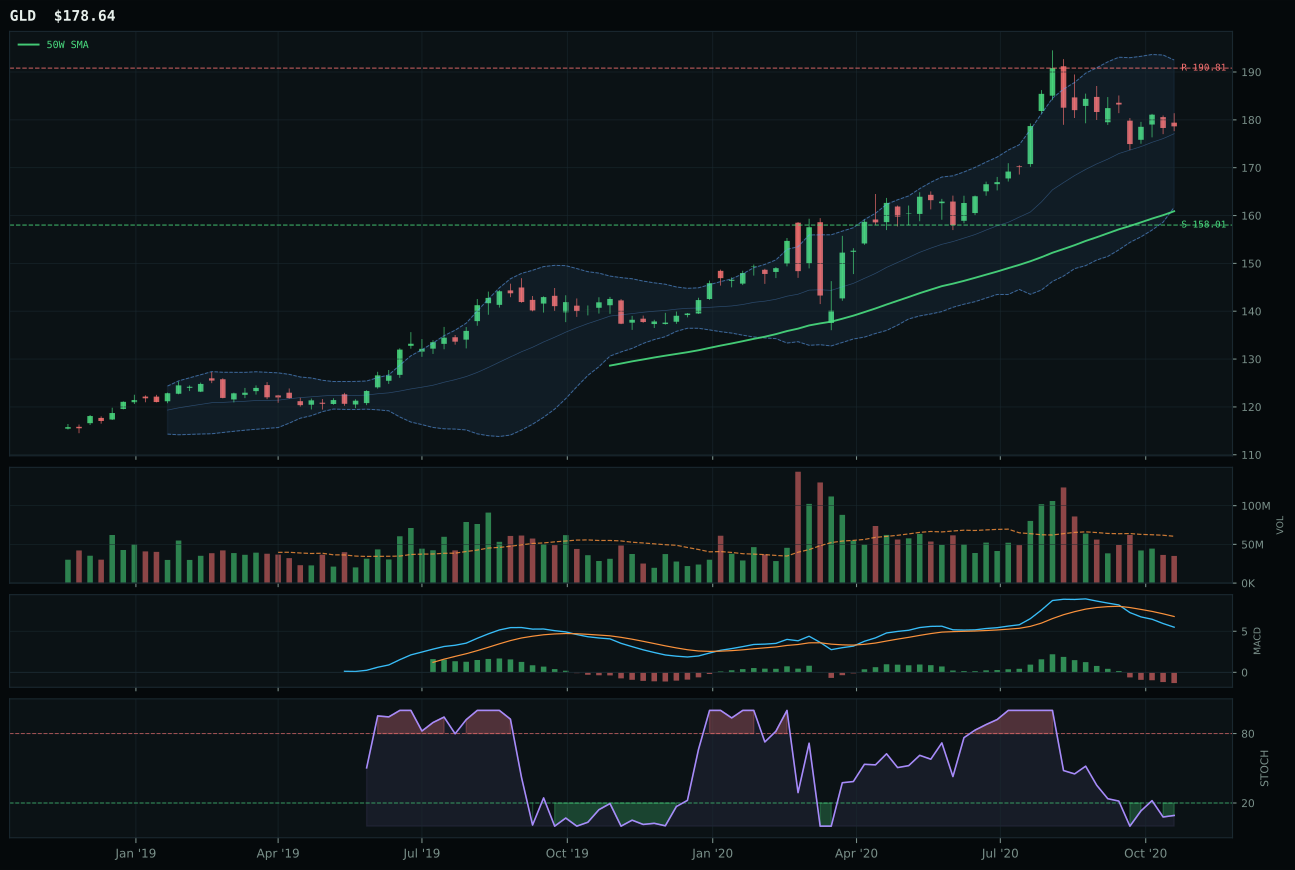
GLD has a neutral structure profile with -7.8% 13-week relative strength versus SPY.
A failed hold above support would weaken the setup.
Actionable but governed by invalidation levels.
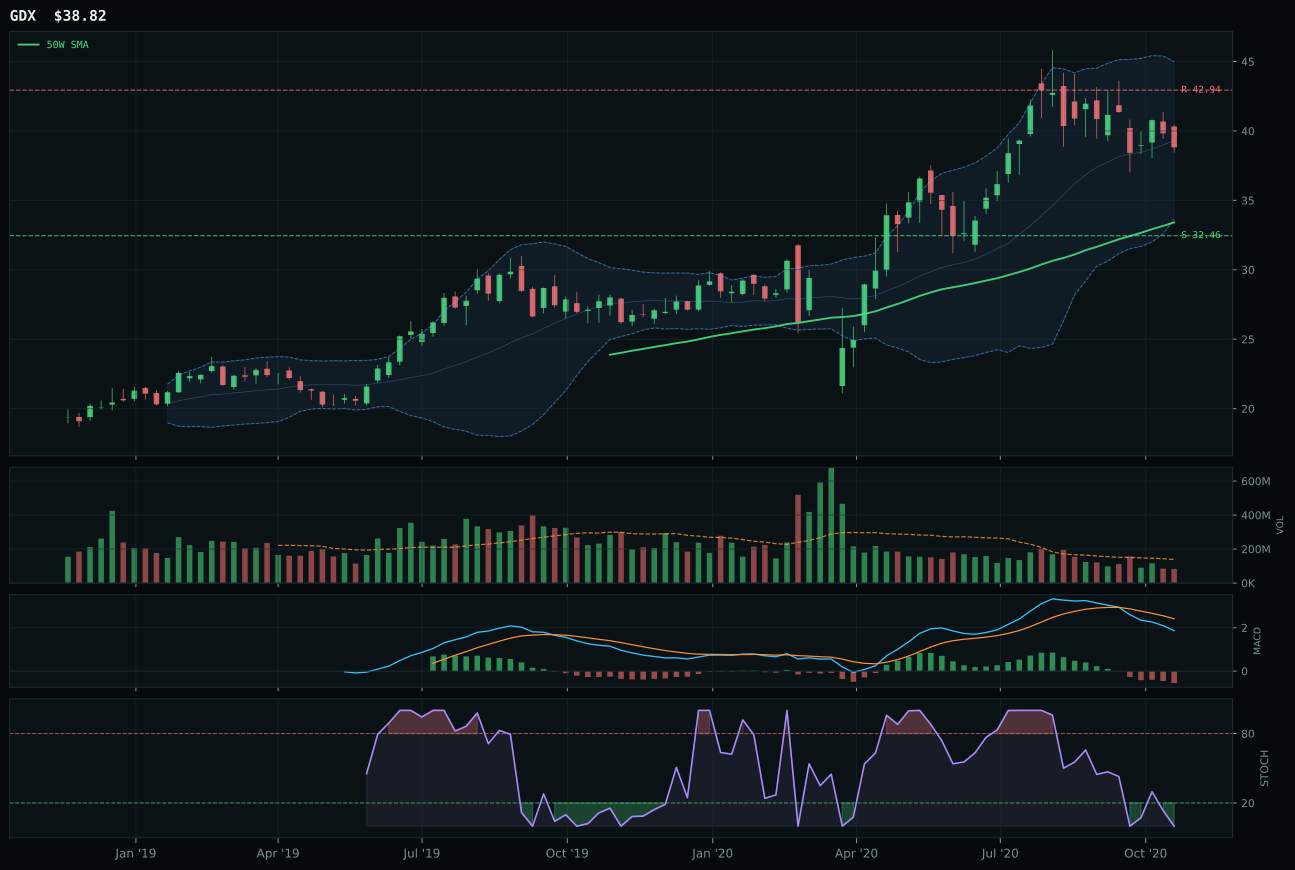
GDX has a vertical extension profile with -15.0% 13-week relative strength versus SPY.
A failed hold above support would weaken the setup.
Actionable but governed by invalidation levels.
SLV wins by virtue of being less damaged than GLD in a category where both face structural headwinds, with the eight-week outperformance driving an 8.2% category-relative strength advantage that separates the two. The critical edge is stochastic RSI timing: SLV shows oversold turn-up potential at 0.13 versus GLD's pure oversold at lower levels, suggesting SLV has higher probability of mean-reversion confirmation. SLV's 27.5% extension from the 50-week appears severe until context arrives—the vertical extension structure combined with bearish MACD and oversold stochastic RSI creates a capitulation-to-reversal setup rather than extended weakness. GLD's minus-7.8% relative strength to SPY and zero category-relative strength reveal it as a pure monetary hedge trade with no cyclical leverage, making it the defensive inferior choice. The ninety-point score gap between them is artificial; both are technically compromised, but SLV at least has mean-reversion geometry on its side.
Precious Metals earned 0% allocation and sits ranked 9th or 10th because the category-level macro fit (52.0) and representative technical evidence both failed to clear the threshold for portfolio inclusion. The metals-scarcity descriptor (+7 macro) provides minimal tailwind when disinflation pressure (-8 in Industrial Metals, here unweighted) and risk-appetite-positive positioning (-4 macro on GLD) are active. SLV's extended position (27.5% above 50W) combined with bearish-weakening MACD creates a classic fade setup rather than an accumulation signal—the technical evidence scores only 18.9 for SLV and 36.4 for GLD, both well below the 50+ threshold for portfolio consideration. Precious metals would need stochastic RSI to reset into oversold (0.20 or below), price to reclaim the 50W, and MACD to bottleneck and improve before this category returns to the allocation. At current positioning, the category represents a duration-specific bet against Goldilocks, and that bet has no portfolio seat until the regime shows visible cracks.
Nuclear Energy — NLR
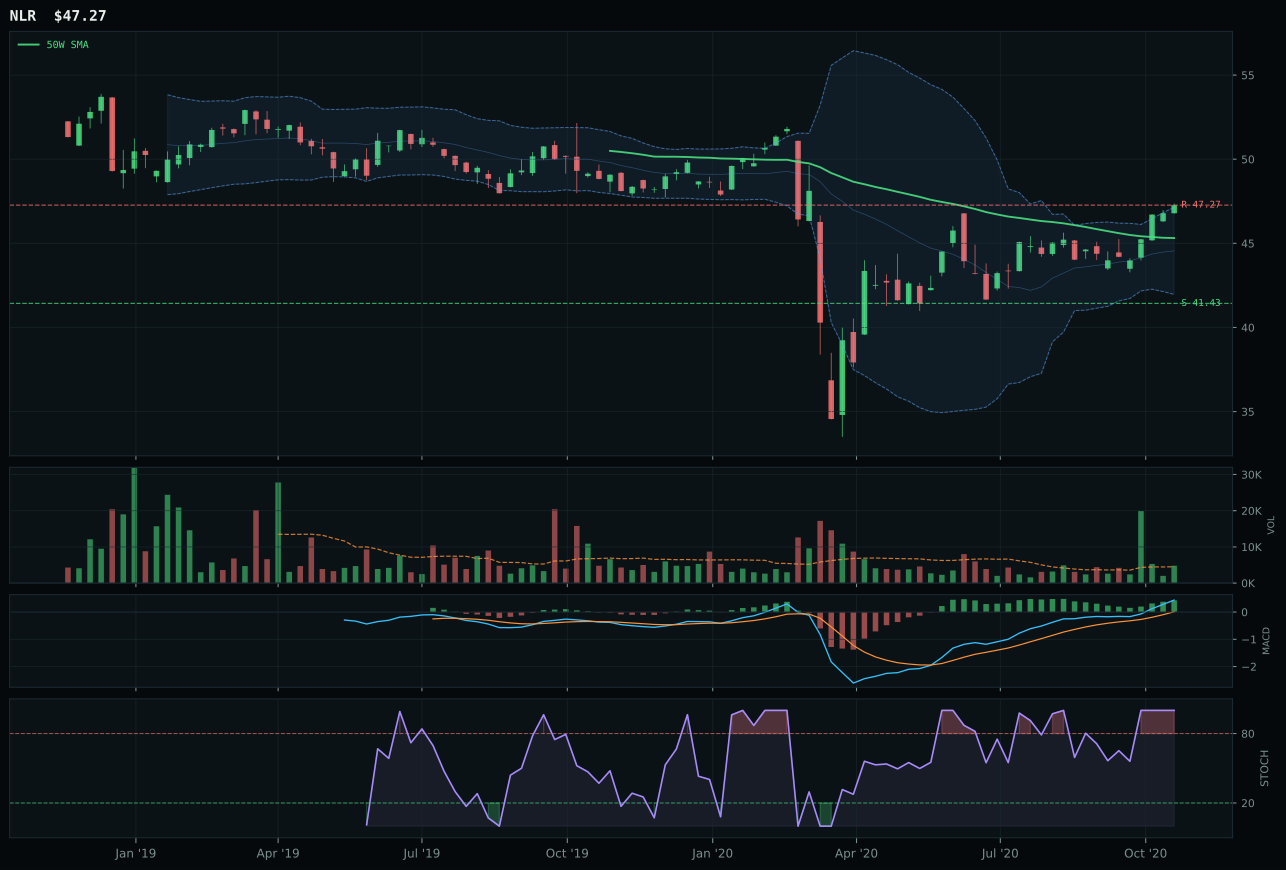
NLR has a neutral structure profile with -2.3% 13-week relative strength versus SPY.
A failed hold above support would weaken the setup.
Tracked, but not top-2 eligible because: .
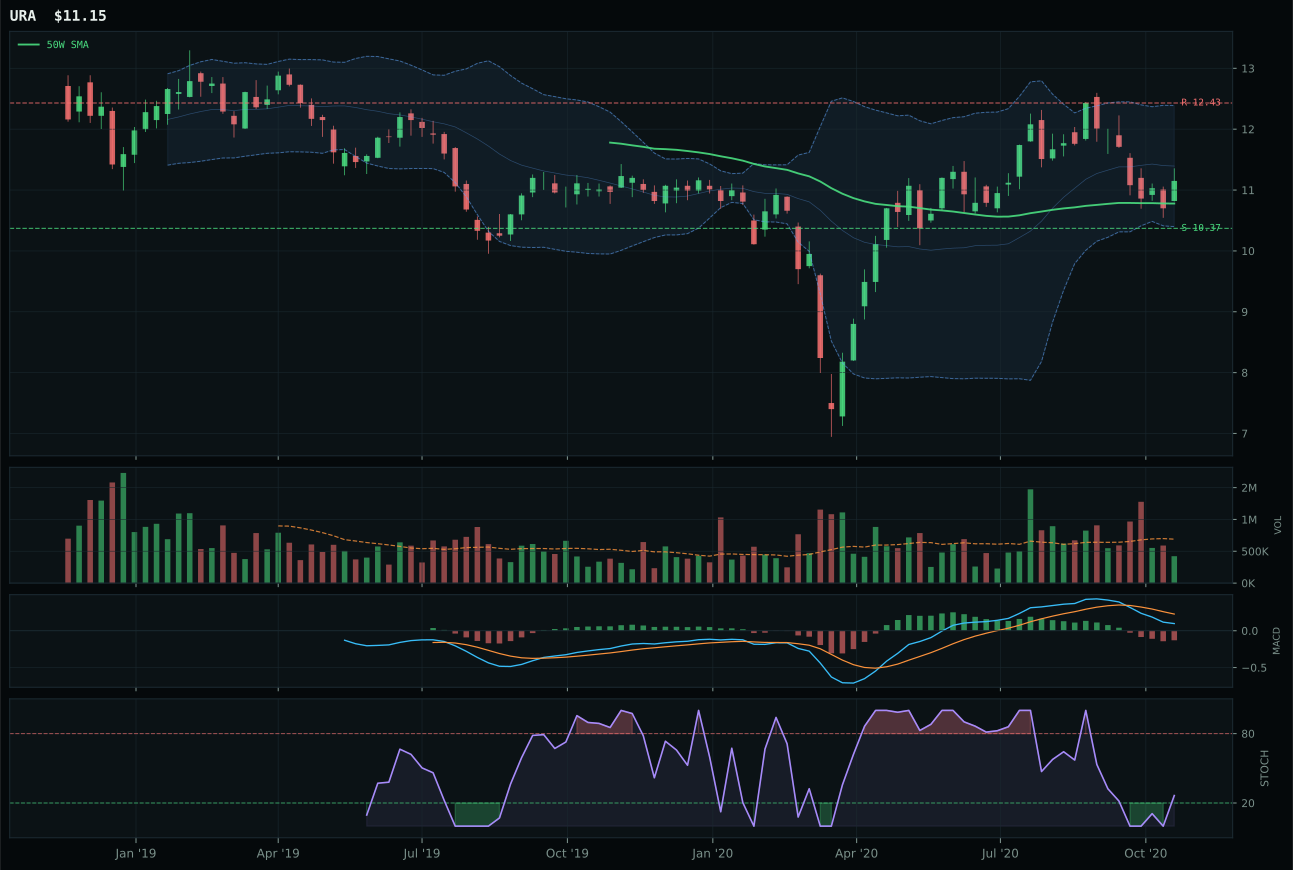
URA has a neutral structure profile with -15.5% 13-week relative strength versus SPY.
A failed hold above support would weaken the setup.
Tracked, but not top-2 eligible because: .

URNM has a neutral structure profile with -18.9% 13-week relative strength versus SPY.
A failed hold above support would weaken the setup.
Tracked, but not top-2 eligible because: .
NLR captures the category primarily through superior category-relative strength at 13.1% against URA's 0.0%, a massive edge that compensates for below-50W price positioning and absence of true upside momentum. The 90.0 timing score reflects ideal setup geometry—price just 4.3% above support, MACD bullish and improving, stochastic RSI at extreme overbought momentum—creating a coiled spring setup with defined entry and exit levels. URA's bearish/weakening MACD and overbought rollover stochastic RSI at 0.95 versus NLR's improving MACD and rising stochastic at 0.88 reveal the critical technical split: NLR has momentum confirmation while URA shows exhaustion. The structure score advantage of 78.8 for NLR versus 66.2 for URA confirms NLR's compression is cleaner and more actionable. Neither ETF carries strong absolute technicals, but NLR's 23.5-point gap over URA signals the category decision is not contested.
Nuclear Energy earned 0% allocation and ranks 9th or 10th because the final category score (25.9) and NLR's eligible-false status reflect that even the category winner fails the portfolio inclusion threshold. The category-level macro fit is 57.0, below the 60+ range required for consideration, and technical evidence is compromised: NLR's 56.5% trend score reflects price below the 200W despite recent moves, and momentum confirmation is 96.1 only because volume participation is neutral—real momentum confirmation requires both volume and price acceleration. Real asset sponsorship (+7 macro) and AI growth sponsorship (+5 macro as a grid operator play) offer minor support, but credit stress (-5 macro) and the lack of category-wide relative strength to SPY create a crowded-crowded trade. Nuclear Energy would need either MACD confirmation across the full three-ETF basket or a meaningful expansion of the real-asset sponsorship macro descriptor before earning portfolio inclusion. At 25.9 final score, it sits alongside Precious Metals as a structural hold-out.