
2020-10-16
Informational purposes only. The content in this report, including allocations, analysis, and commentary, is provided solely for informational and educational purposes. It does not constitute financial advice, investment advice, trading advice, or any other type of advice. Past performance does not guarantee future results. Always conduct your own research and consult a qualified financial professional before making investment decisions.
Some tracked tickers were excluded due to missing live weekly price data: SGOV: Historical cache SGOV has only 20 usable weekly bars
Weekly Allocation
| Ticker | Category | Weight | Role |
|---|---|---|---|
| FSOL | 50% | Overlay | |
| IGV | Technology | 10% | Top-2 (10%) |
| SMH | AI | 10% | Top-2 (10%) |
| COPX | Industrial Metals | 5% | Tier-2 (5%) |
| INDA | Emerging Markets | 5% | Tier-2 (5%) |
| XLU | Utilities & Infrastructure | 5% | Tier-2 (5%) |
| GLD | Precious Metals | 5% | Tier-2 (5%) |
| MOO | Agriculture & Livestock | 5% | Tier-2 (5%) |
| XAR | Defense & Aerospace | 5% | Tier-2 (5%) |
Trade Instructions — Monday Open
Sell the tranche from 2020-09-18 (completing its 4-week hold). Buy the new tranche. Instructions show net portfolio changes — same-asset positions cancel, weight changes show the delta.
| Action | Ticker | Instruction |
|---|---|---|
| SELL | PICK | Sell 50% of PICK position (reduce 5.00% → 2.50%) |
| SELL | BOTZ | Sell 20% of BOTZ position (reduce 6.25% → 5.00%) |
| SELL | PAVE | Sell 33% of PAVE position (reduce 3.75% → 2.50%) |
| BUY | XLU | Buy XLU — 25.00% of freed cash (adds 1.25% to portfolio) |
| BUY | SMH | Buy SMH — 50.00% of freed cash (adds 2.50% to portfolio) |
| BUY | COPX | Buy COPX — 25.00% of freed cash (adds 1.25% to portfolio) |
Current Portfolio After Trade
Combined holdings across all 4 active tranches. Each tranche is 25% of the portfolio.
| Ticker | % of Portfolio | Weight Bar |
|---|---|---|
| FSOL | 50.00% | |
| INDA | 7.50% | |
| IGV | 5.00% | |
| BOTZ | 5.00% | |
| GLD | 5.00% | |
| XAR | 5.00% | |
| SMH | 5.00% | |
| MOO | 3.75% | |
| XLU | 3.75% | |
| PAVE | 2.50% | |
| PICK | 2.50% | |
| CIBR | 1.25% | |
| NLR | 1.25% | |
| REMX | 1.25% | |
| COPX | 1.25% |
Macro Regime — Goldilocks
Macro Evidence Charts
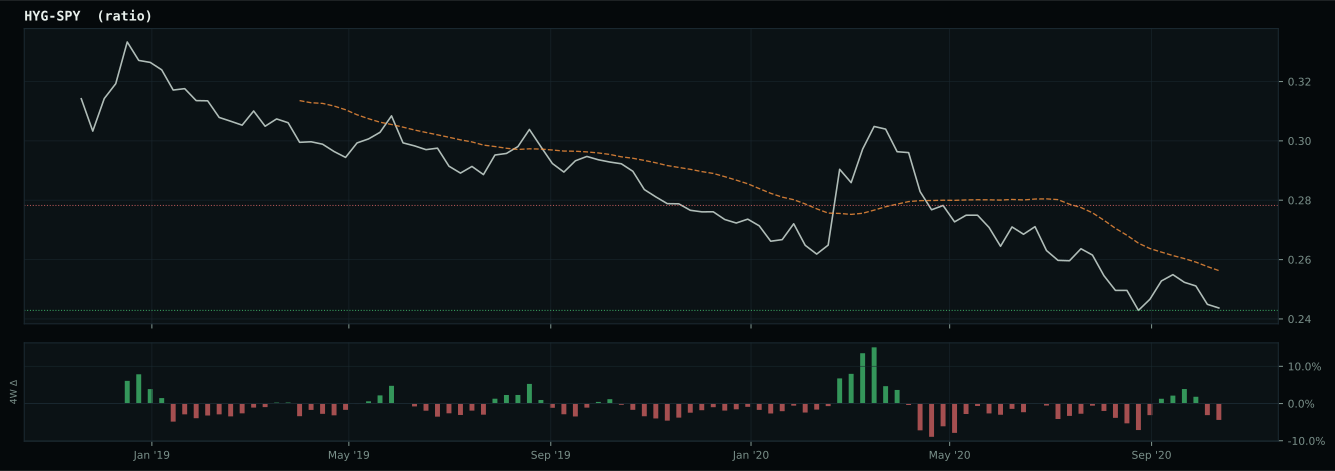
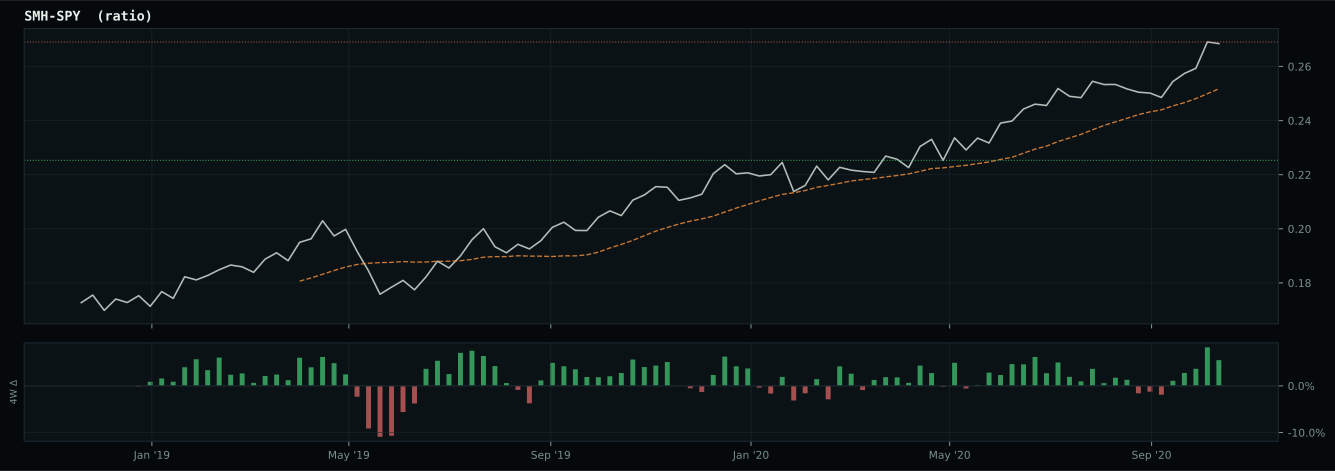
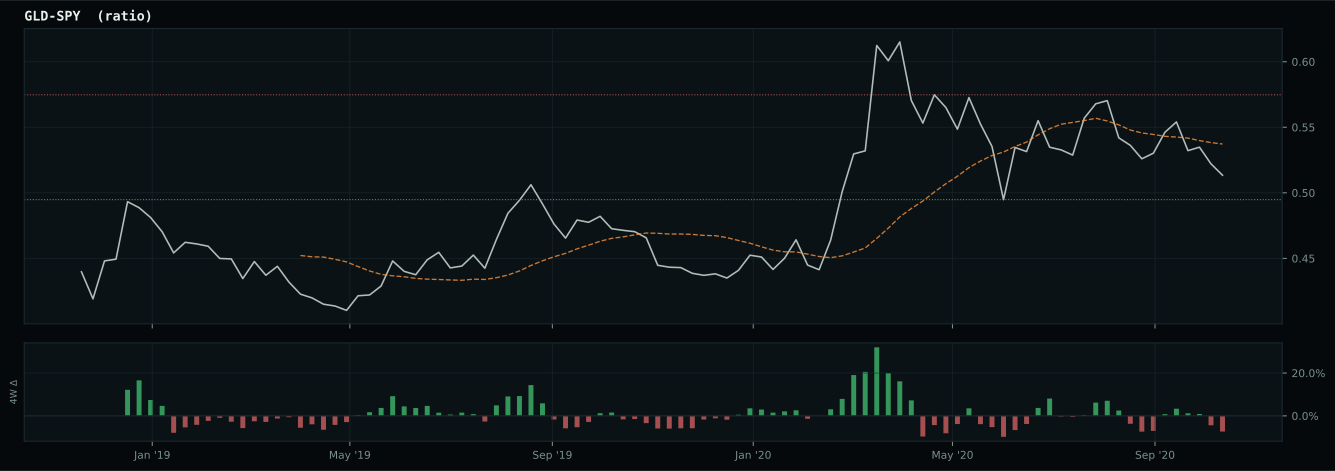
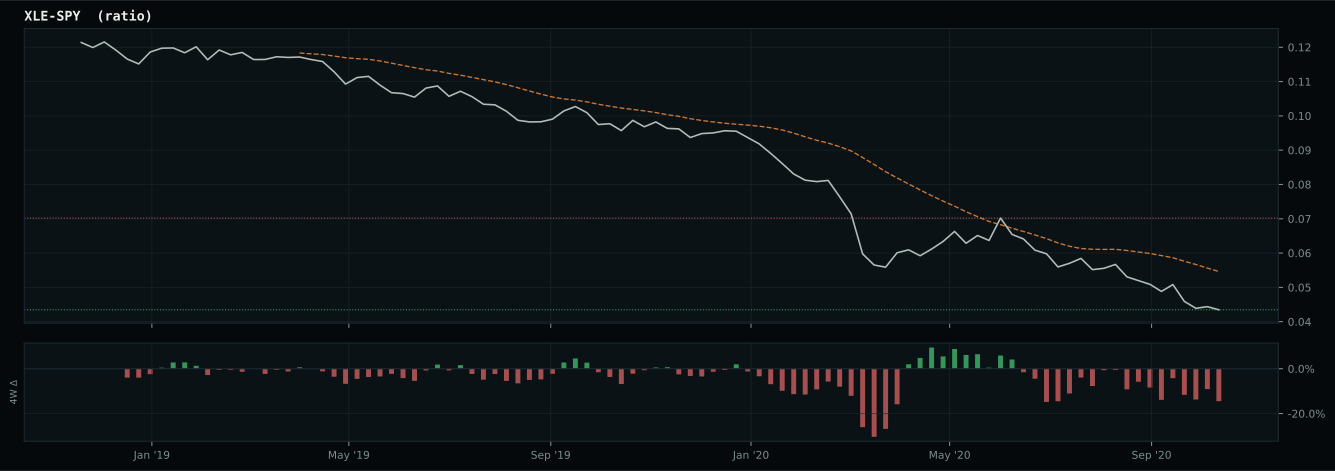
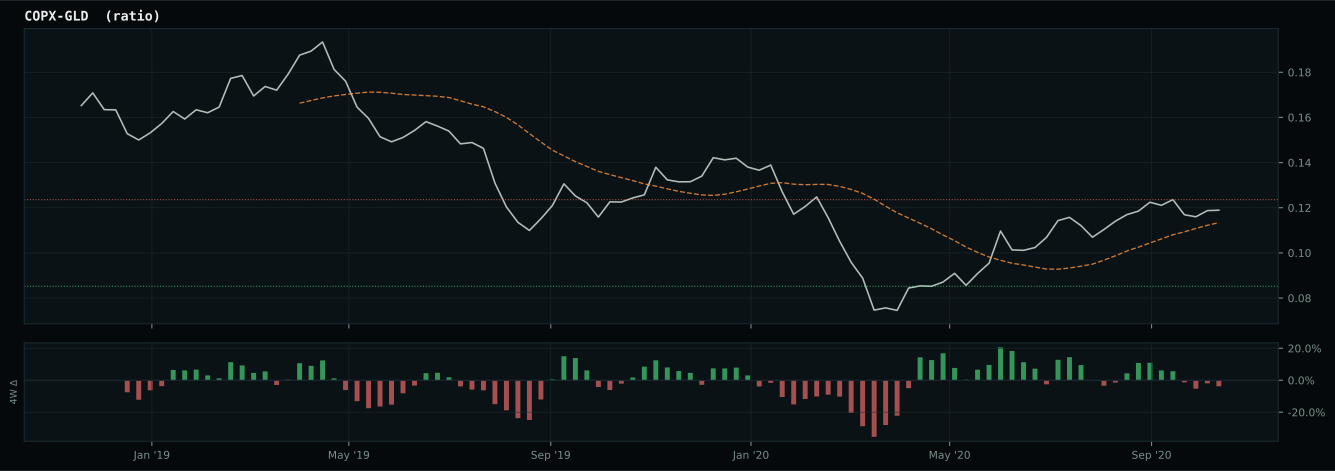
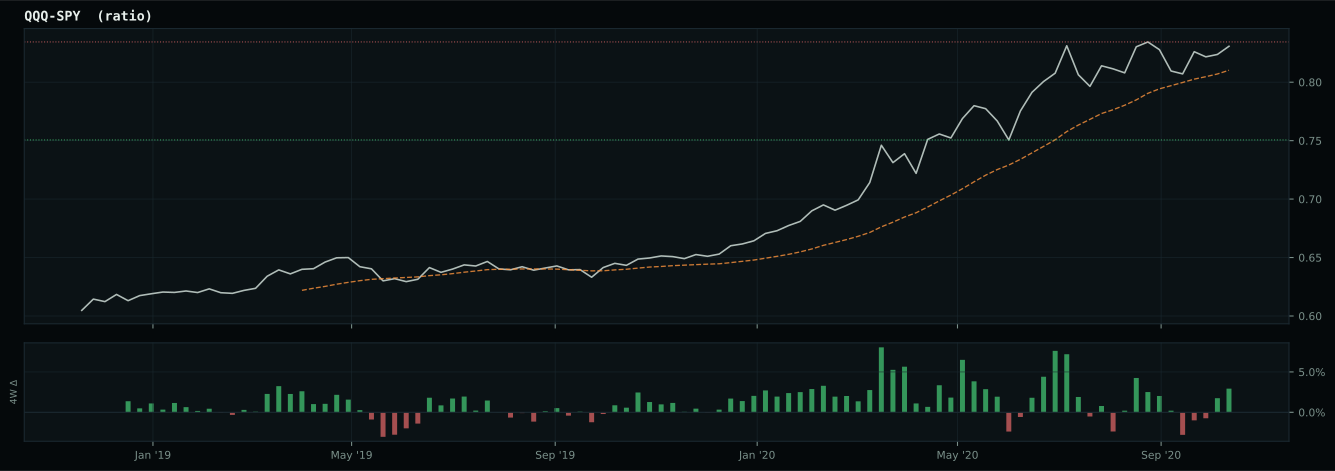
Market-implied signals behind the macro regime scores. Each ratio compares two assets; the direction and slope of the ratio is what the macro engine reads.
Crypto Regime — AltSeason
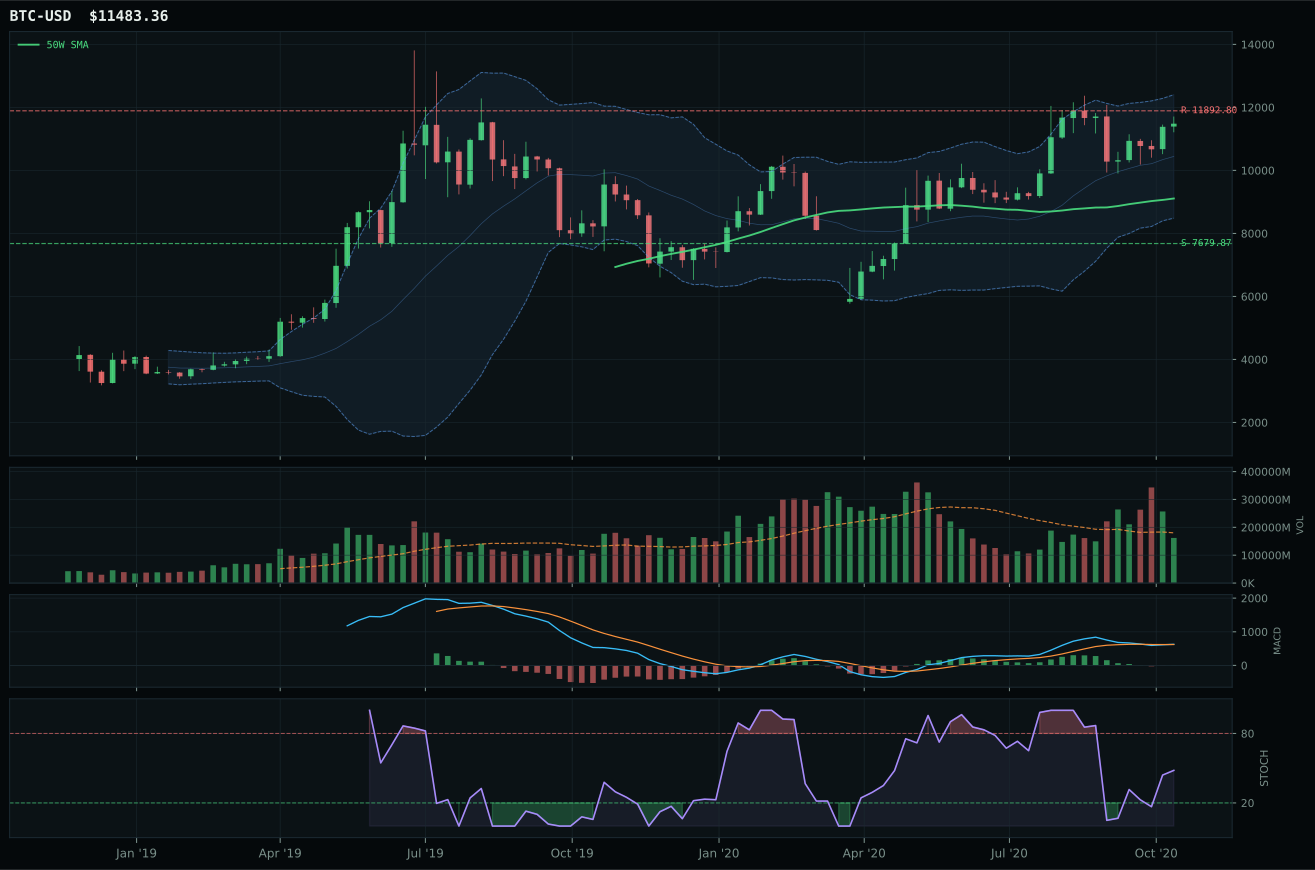
post-touch structure is too wide to count as a range; max/min close ratio is 2.21
TrendBTC confirmed: 2 consecutive closes above rising/flat 50W SMA
all available AltSeason conditions pass; missing optional confirmations skipped

Category Rankings
| Rank | Category | Winner | Score | Alloc | 4W Ret | Peers (4W) |
|---|---|---|---|---|---|---|
| 1 | Technology | IGV | 67.6 | 20% | -4.72% | CIBR -2.5% · XLK -0.4% |
| 2 | AI | SMH | 62.4 | 20% | +5.26% | BOTZ +6.2% · AIQ +0.7% |
| 3 | Industrial Metals | COPX | 58.8 | 10% | +15.24% | PICK +8.7% · REMX +19.9% |
| 4 | Emerging Markets | INDA | 57.1 | 10% | +4.85% | IEMG +7.1% · ILF +14.2% |
| 5 | Utilities & Infrastructure | XLU | 56.8 | 10% | +4.60% | PAVE +8.4% · IGF +8.3% |
| 6 | Precious Metals | GLD | 41.1 | 10% | -1.22% | SLV -0.7% · GDX -6.1% |
| 7 | Agriculture & Livestock | MOO | 39.4 | 10% | +5.60% | WEAT -3.1% · VEGI +5.9% |
| 8 | Defense & Aerospace | XAR | 36.9 | 10% | +11.71% | ROKT +6.9% · ITA +10.0% |
| 9 | Nuclear Energy | NLR | 24.6 | 0% | +4.17% | URA +7.3% · URNM +6.1% |
| 10 | Traditional Energy | XLE | — | 0% | +16.57% | FCG +14.5% · XOP +16.5% |
Technology — IGV
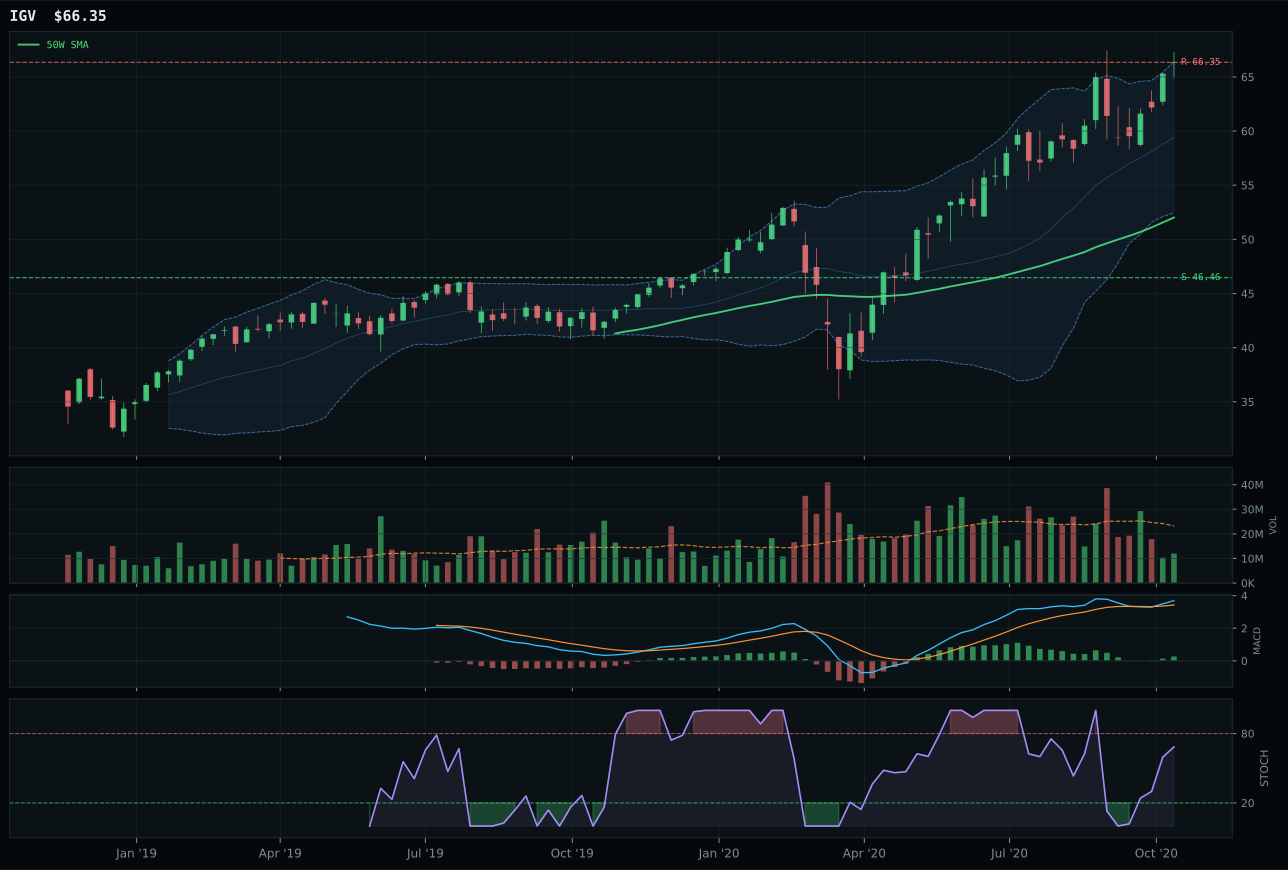
IGV has a vertical extension profile with 7.9% 13-week relative strength versus SPY.
A failed hold above support would weaken the setup.
Actionable but governed by invalidation levels.
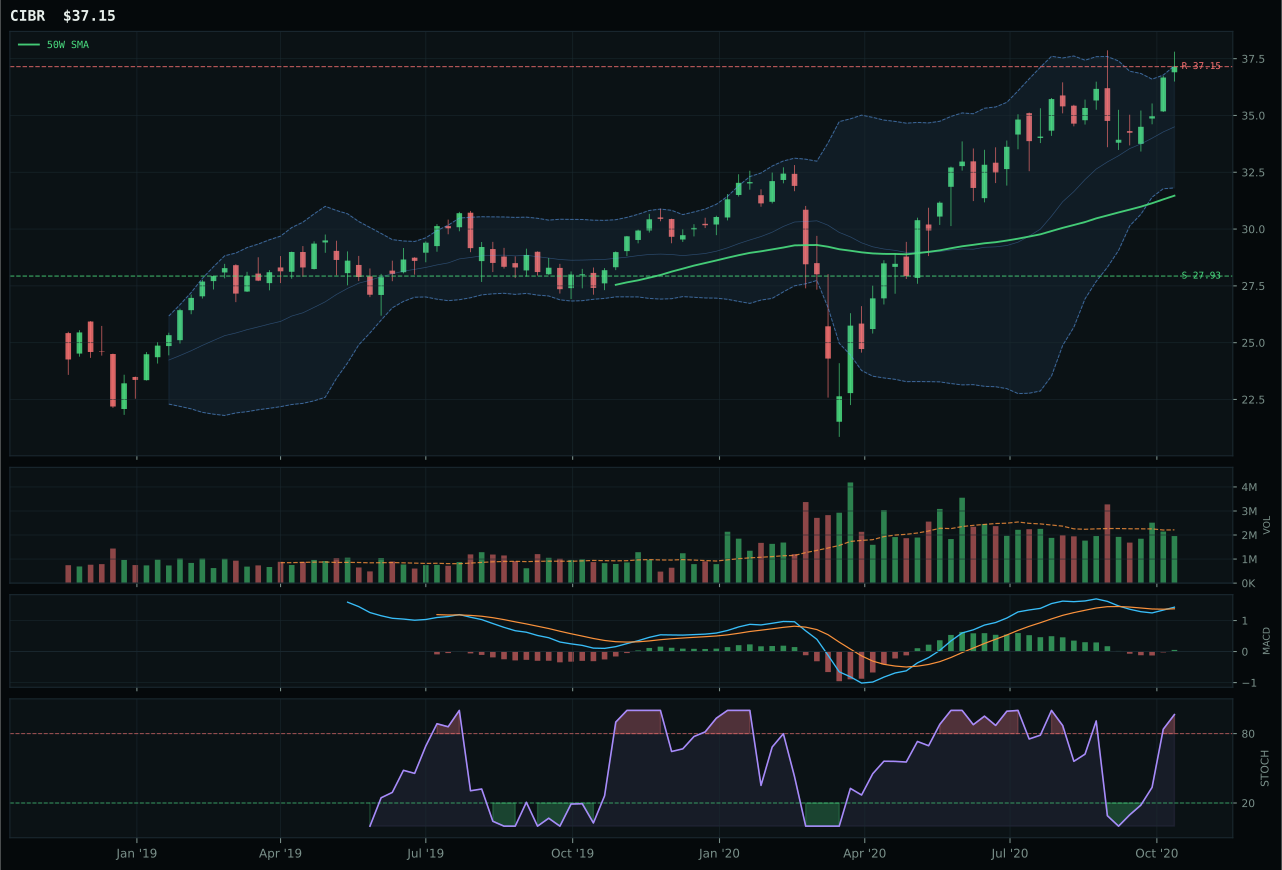
CIBR has a vertical extension profile with 1.7% 13-week relative strength versus SPY.
A failed hold above support would weaken the setup.
Actionable but governed by invalidation levels.
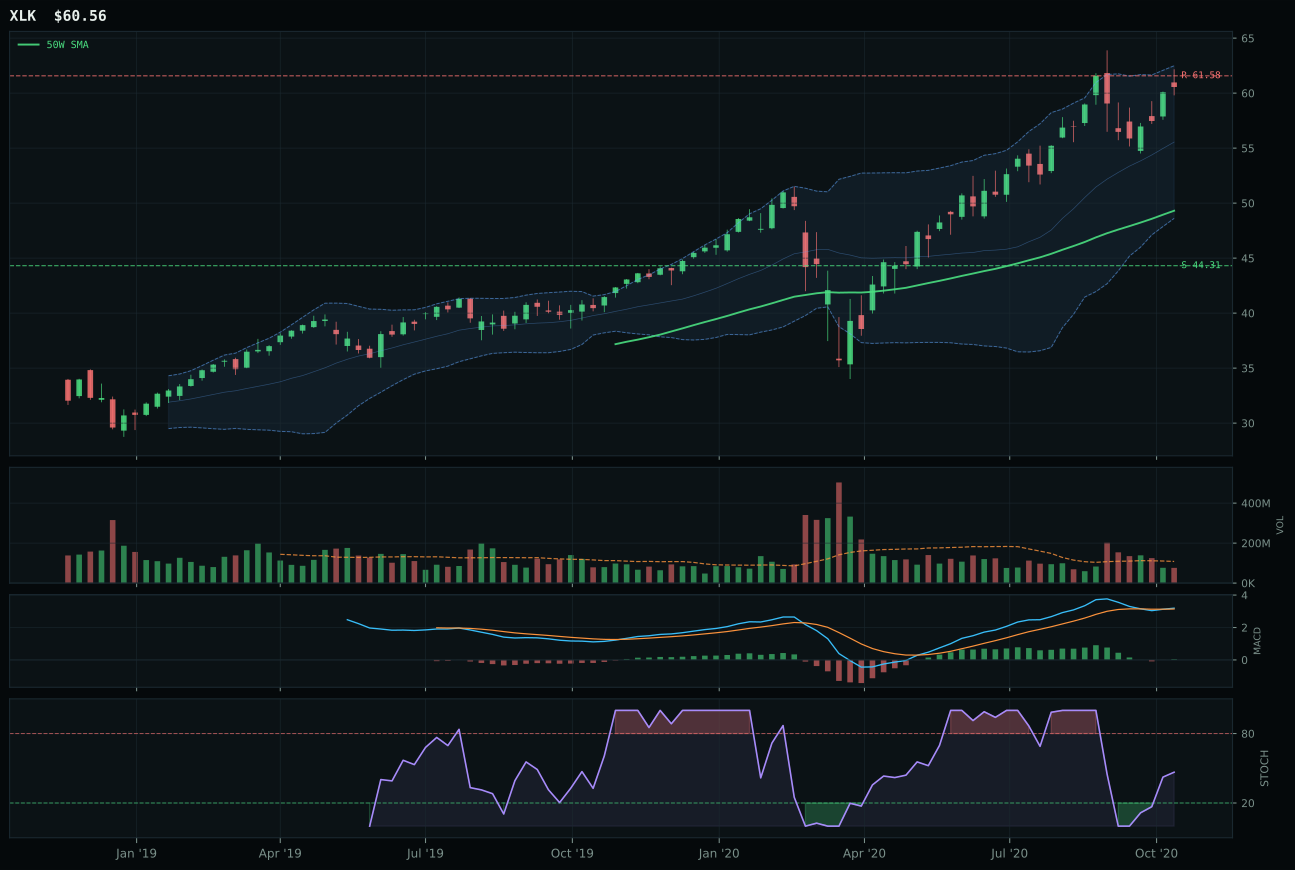
XLK has a vertical extension profile with 5.4% 13-week relative strength versus SPY.
A failed hold above support would weaken the setup.
Actionable but governed by invalidation levels.
IGV wins the category on the strength of a 7.9% relative strength advantage over SPY and a 2.5% edge within its three-ETF peer set, decisive metrics that distinguish it from CIBR's weaker 1.7% SPY-relative performance. The setup itself is vertical extension at 27.5% above the 50W, which normally demands caution, but IGV's timing score of 53 versus CIBR's 37 reflects more favorable momentum conditions: MACD bullish and improving paired with stochastic RSI rising mid-zone keeps entry risk defined rather than reckless. Volume confirmation at 0.52x is thin, but the 13W return of 15.9% and persistence score of 72.3 show that strength has endured despite light participation—a sign that accumulation is genuine rather than sentiment-driven. CIBR's stochastic reached overbought momentum while its MACD began to flatten, a deterioration pattern that cost it the category despite solid structural marks.
Technology earned its top-2 overweight slot at 10% allocation on the back of a 67.6 composite score that reflects broad technical strength across all six scoring pillars and a macro environment actively favorable to AI and duration-sensitive growth. The Goldilocks regime adds 9 points to category fit, while active descriptors for risk appetite, disinflation pressure, and AI growth sponsorship contribute another 20 points of macro sponsorship—enough to offset the 7-point headwind from credit stress. This allocation makes sense not as a momentum chase but as positioning into a regime where real rates remain benign and growth assets retain their relative appeal. The 100-point trend component and 100-point momentum confirmation anchors the trade; even though entry is extended, the breadth of technical evidence and the persistence of the move through thin volume suggest this is not yet a late-stage squeeze. Two higher scores positioned this category into the top-2 tier rather than leaving it to the 5% tier-2 allocation that would have been a natural alternative.
AI — SMH
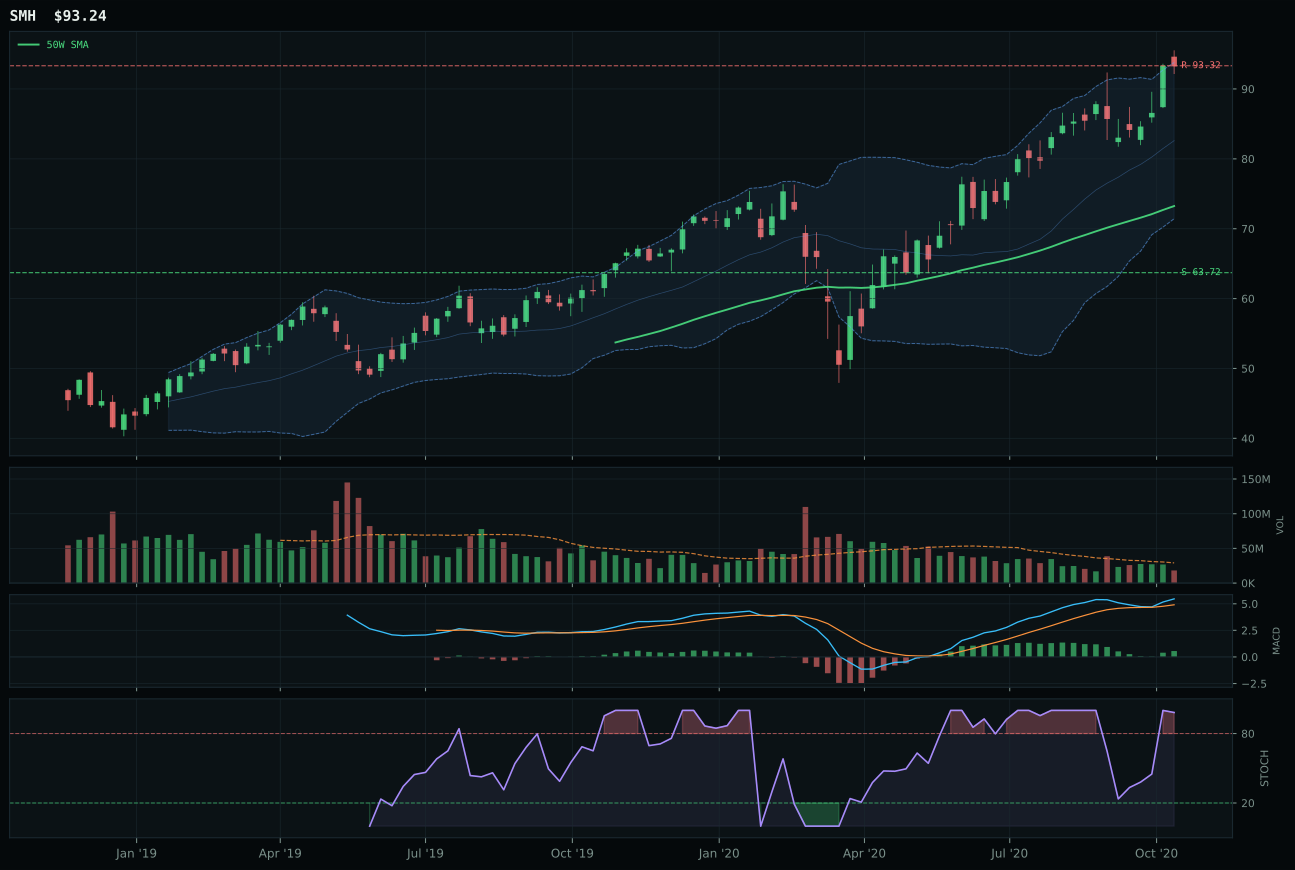
SMH has a vertical extension profile with 8.4% 13-week relative strength versus SPY.
A failed hold above support would weaken the setup.
Actionable but governed by invalidation levels.
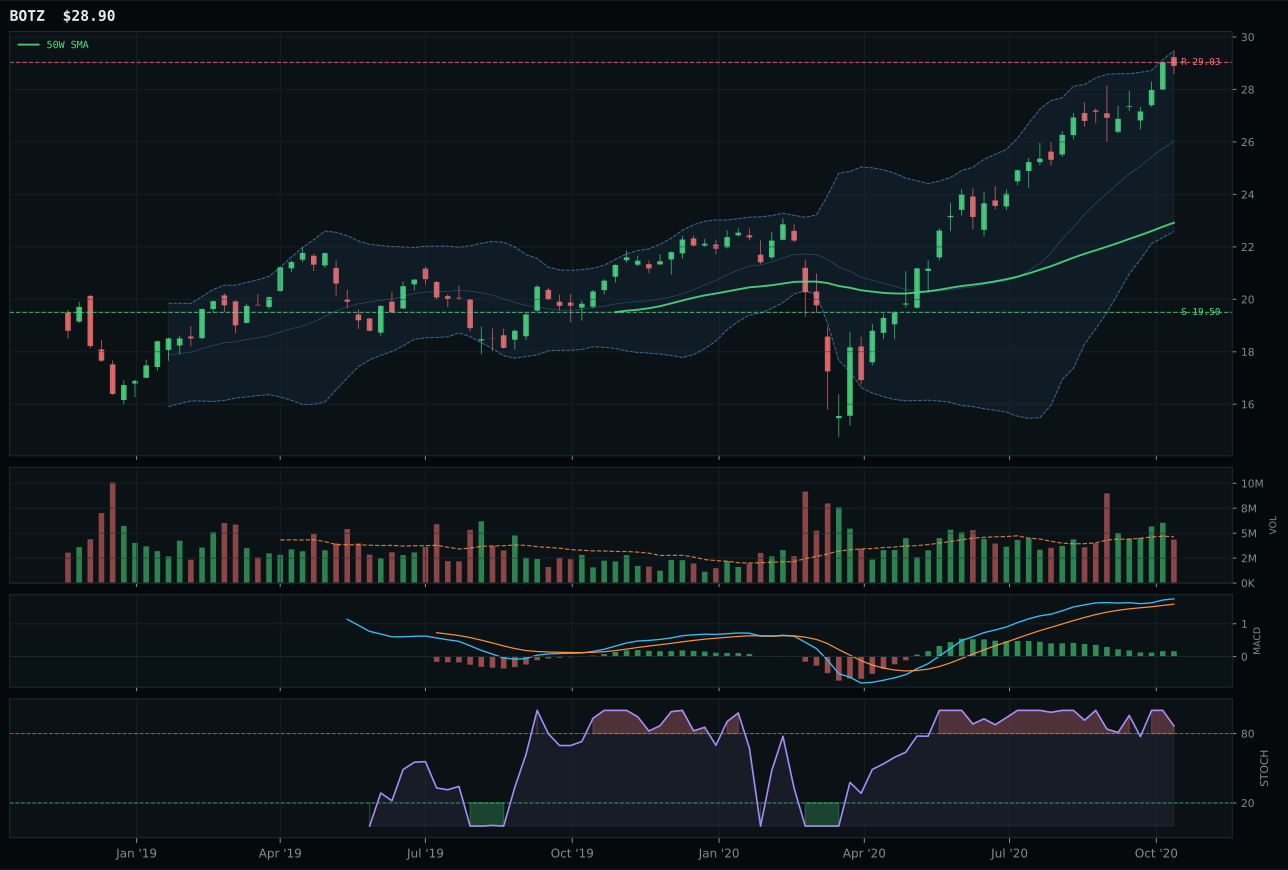
BOTZ has a vertical extension profile with 6.6% 13-week relative strength versus SPY.
A failed hold above support would weaken the setup.
Actionable but governed by invalidation levels.
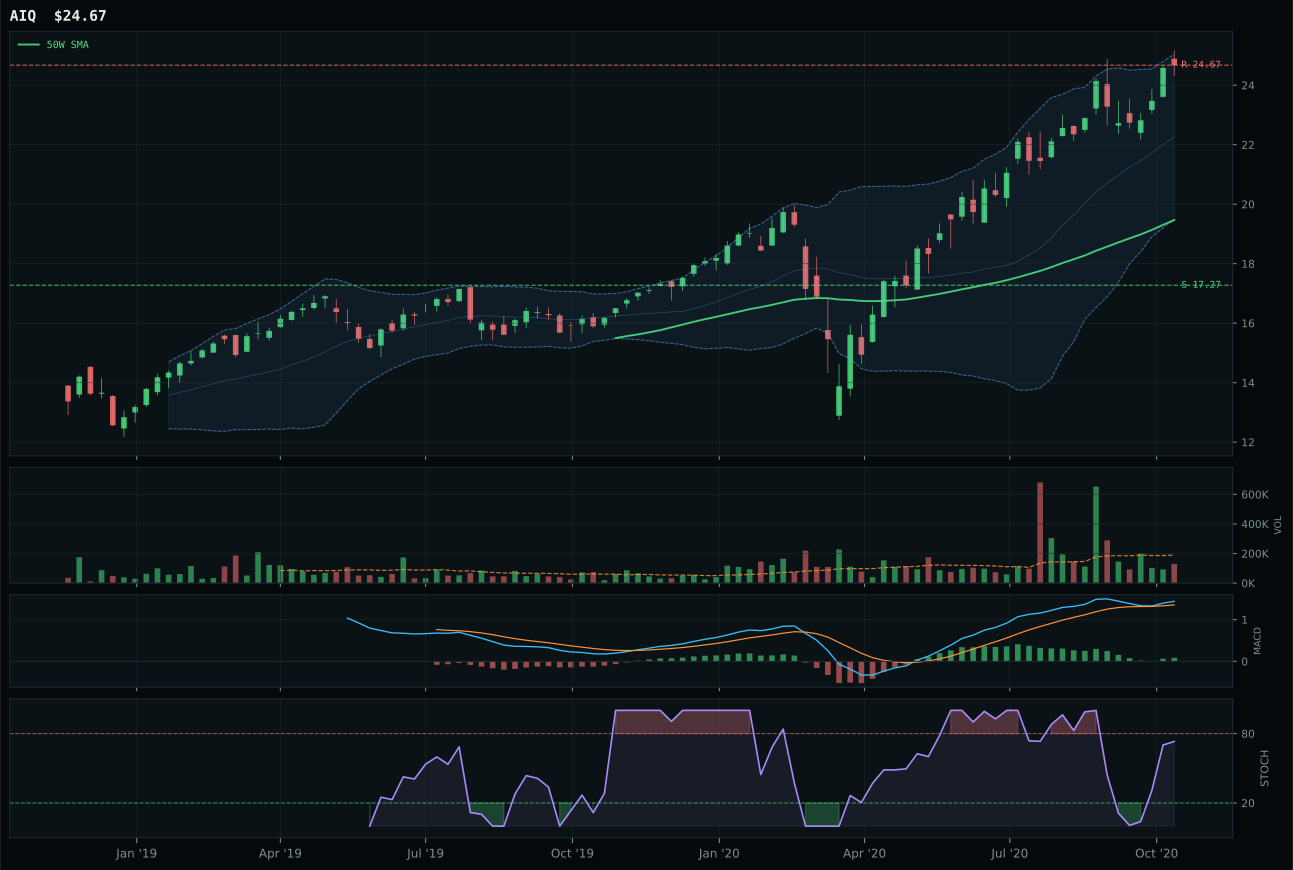
AIQ has a vertical extension profile with 7.0% 13-week relative strength versus SPY.
A failed hold above support would weaken the setup.
Tracked, but not top-2 eligible because: .
SMH defeats BOTZ on three concrete fronts: a 37.0 timing score versus BOTZ's 32.0 reflects tighter proximity to the 50W (27.3% versus deeper extension), a cleaner structure mark of 76.5 versus 72.1 shows less noise in the compression pattern, and most critically, SMH's MACD is bullish and improving while BOTZ's is bullish but flattening—a tell that momentum is sustaining versus deteriorating. The 8.4% RS versus SPY and 1.4% category-relative strength edge both matter, but the technical architecture is what drives the selection: SMH is price-above-both-moving-averages with a 50W slope of 0.8% and stochastic RSI at overbought-momentum territory, yet the improving MACD means new participants are still joining the move rather than abandoning it. BOTZ's neutral volume at 0.68x versus SMH's thin participation at 0.63x might normally favor BOTZ, but lighter volume paired with confirming MACD in SMH suggests institutional accumulation rather than retail noise.
AI earned its place in the top-2 at 10% allocation despite a 62.4 score that trails Technology, primarily because the category-level macro fit of 76.0 is the highest in the portfolio and the macro drivers are uniquely powerful this week. AI growth sponsorship contributes 14 points, risk appetite positive adds 10, and Goldilocks provides an additional 10—totaling 34 points of macro tailwind against only 8 points of credit stress headwind. This is a regime where semiconductor compute and robotics benefit from both cyclical strength and structural secular growth narratives, a rare confluence. The 13W return of 16.4% and 26W return of 41.1% show that the move is neither new nor exhausted; instead, it sits at an inflection where macro conditions actively support further accumulation. SMH's technical evidence at 57.0 is admittedly weaker than some tier-3 categories, but the 68.0 macro fit compensates decisively, making this a macro-driven top-2 slot rather than a pure technical call. Should AI momentum weaken or credit stress deepen, this allocation would immediately face pressure to drop to tier-2.
Industrial Metals — COPX
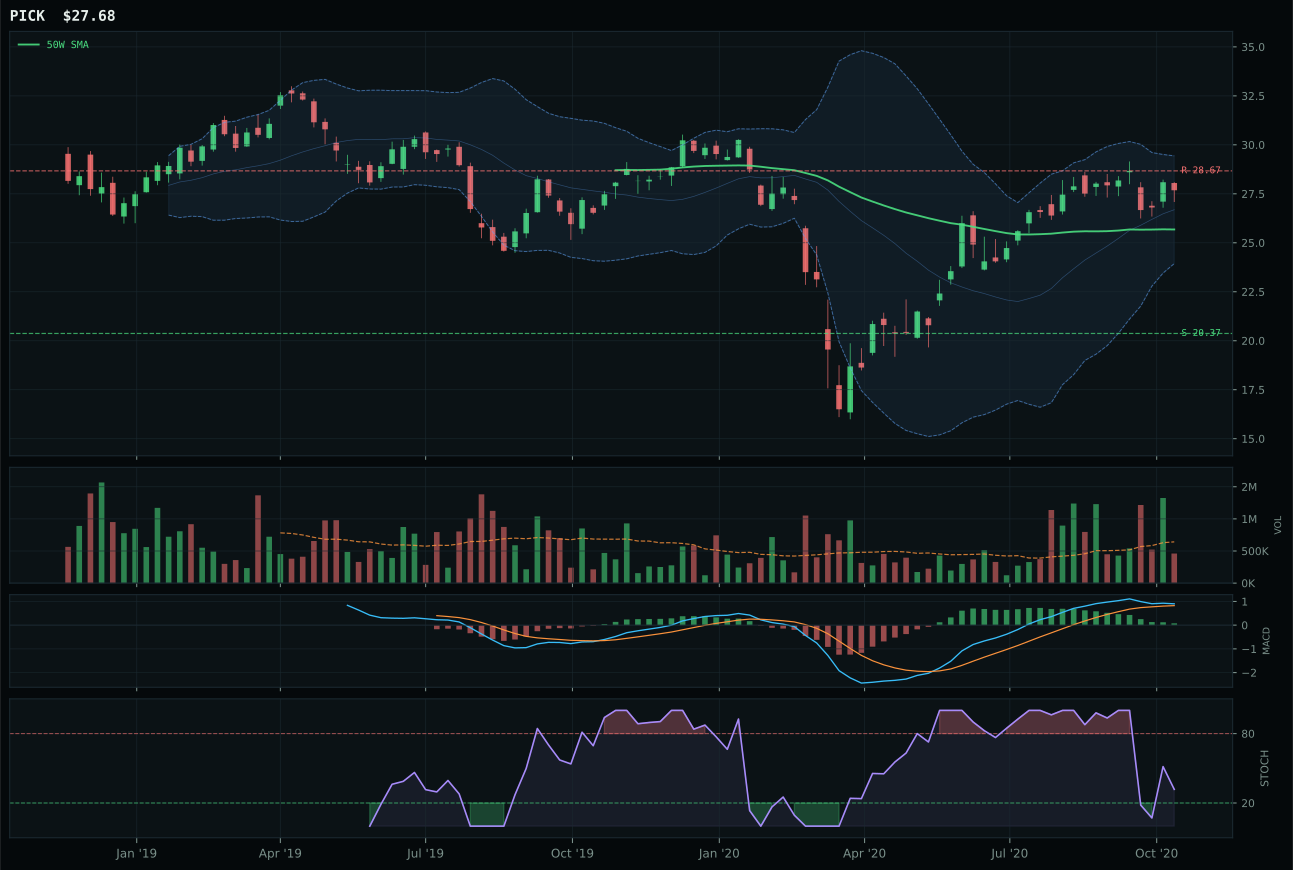
PICK has a neutral structure profile with -3.7% 13-week relative strength versus SPY.
A failed hold above support would weaken the setup.
Actionable but governed by invalidation levels.
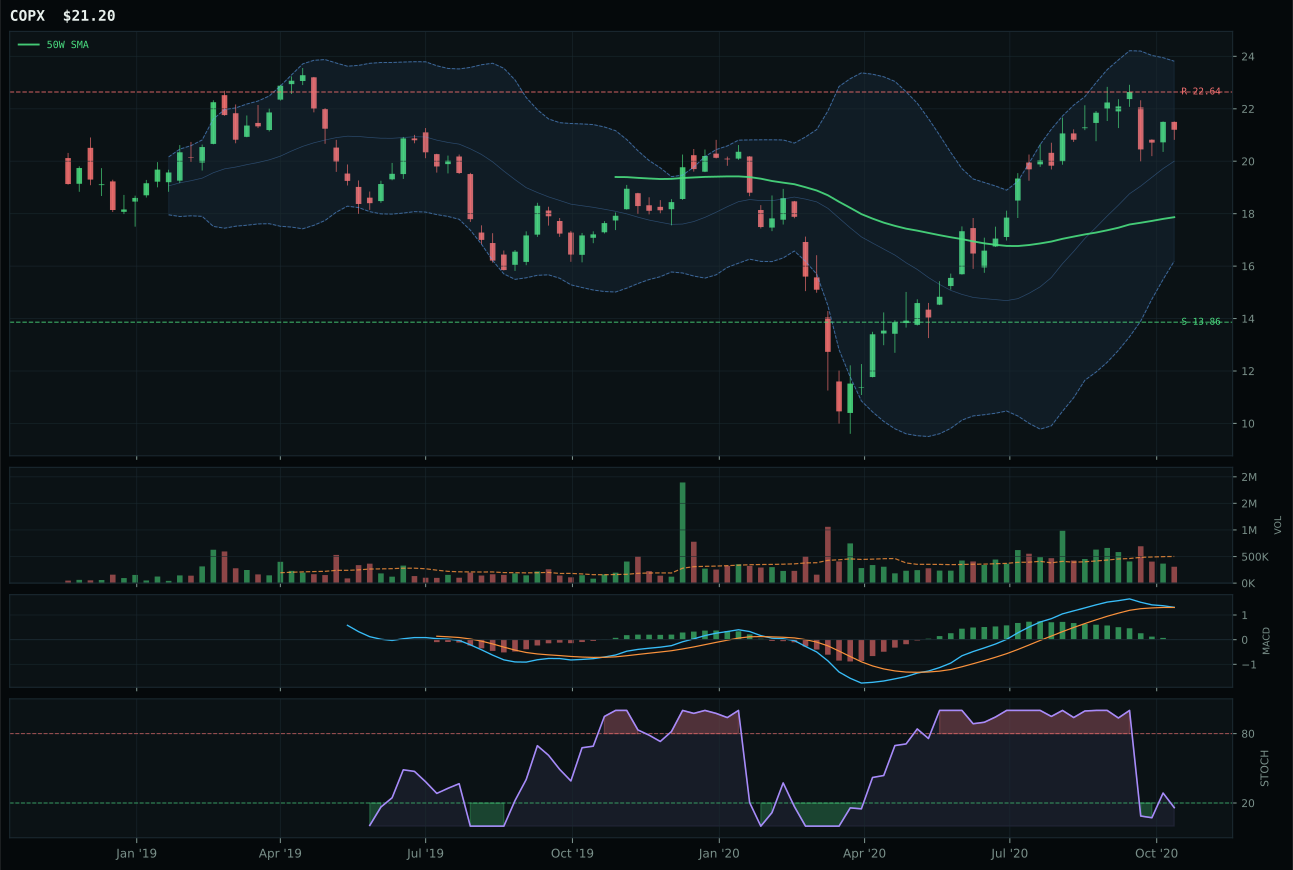
COPX has a vertical extension profile with -0.3% 13-week relative strength versus SPY.
A failed hold above support would weaken the setup.
Actionable but governed by invalidation levels.
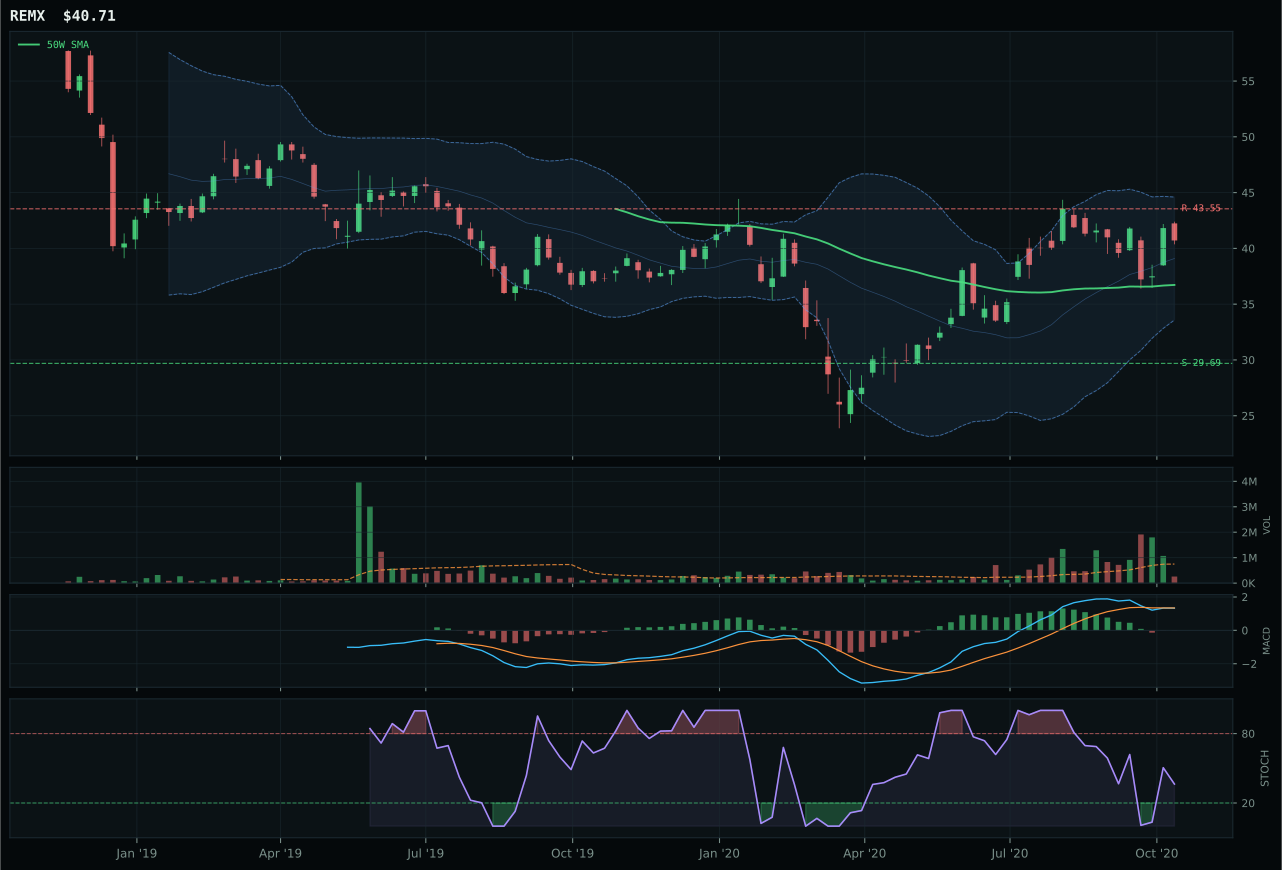
REMX has a neutral structure profile with -2.3% 13-week relative strength versus SPY.
A failed hold above support would weaken the setup.
Actionable but governed by invalidation levels.
COPX wins the category against PICK on the fundamental basis of relative strength category-internal dominance, posting 2.0% versus PICK's minus 1.5%, despite PICK's higher raw technical evidence score of 60.0. The allocator selected COPX because within the three-ETF metals basket (PICK, COPX, REMX), COPX shows leadership—a critical filter when deciding which name to represent the category. COPX's setup is vertical extension at 18.7% above the 50W, which normally invites caution, but the 7.7% 13W return paired with metals scarcity macro sponsorship and oversold-turn-up stochastic at 0.16 suggests this extension has foundation rather than fading momentum. PICK's superior structure at 72.3 and rising-mid-zone stochastic look technically tidier, yet PICK's minus 6.4% 4W return reveals recent weakness that COPX avoids. The score gap is tight (PICK 68.4, COPX 58.8 reasoned), but category-relative strength asymmetry breaks the tie decisively toward COPX.
Industrial Metals earned 5% tier-2 allocation on a 58.8 composite score, a middle-tier ranking driven by exceptional macro sponsorship that overcomes technical reservations. Metals scarcity contributes 14 points, commodity breadth positive adds 10, and real asset sponsorship contributes 6—totaling 30 points of macro support against only 7 points of credit stress headwind, yielding a 79.0 category macro fit. In a Goldilocks regime where cyclical demand remains firm and scarcity narratives drive price, industrial metals deserve allocation even when the immediate technical picture shows compression and mixed momentum. COPX's 85.6 trend score reflects price above the 50W, and the persistence of 68.0 shows holding power despite thin volume. The 47.2% risk/reward is tight—only 6.4% upside to resistance and 53% downside to support—but the macro backdrop makes this an acceptable asymmetry for a tier-2 sleeve. Technology and AI rank higher on absolute technical merit, but Industrial Metals' macro fit is genuinely superior, justifying its placement above Defense and Precious Metals in the allocation hierarchy. Should commodity breadth or metals scarcity signals fade, this category would drop to tier-3 or exclusion immediately.
Emerging Markets — INDA
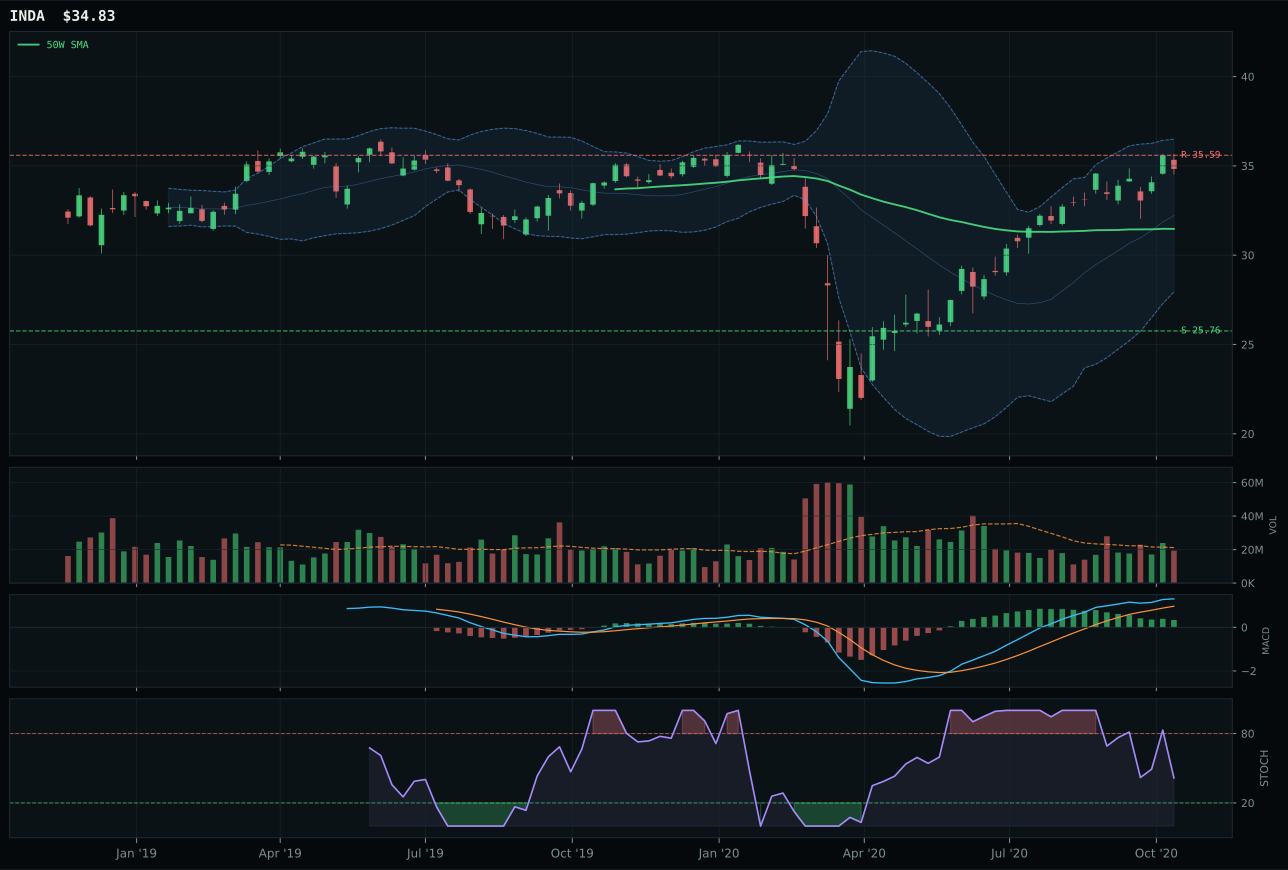
INDA has a neutral structure profile with 2.6% 13-week relative strength versus SPY.
A failed hold above support would weaken the setup.
Actionable but governed by invalidation levels.
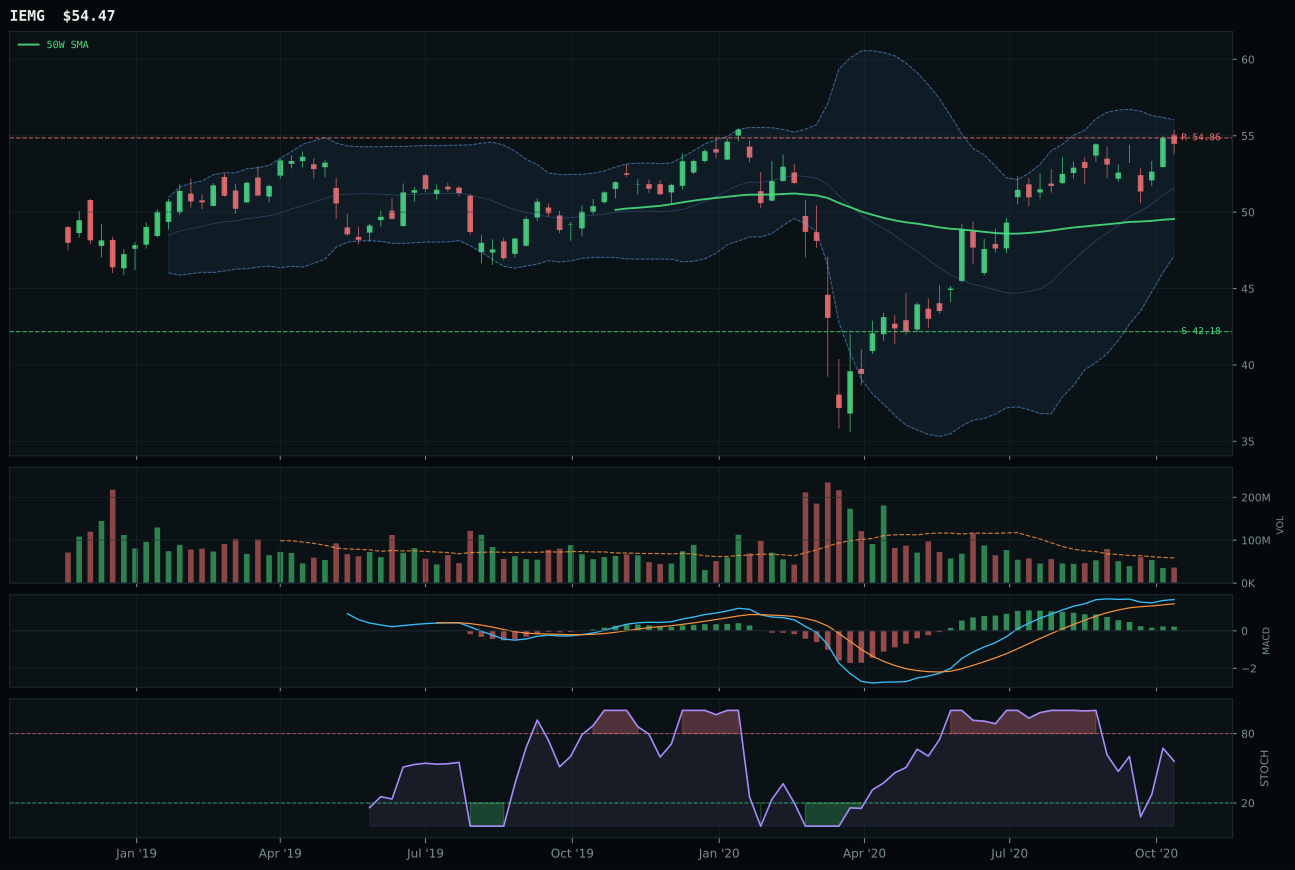
IEMG has a neutral structure profile with -1.1% 13-week relative strength versus SPY.
A failed hold above support would weaken the setup.
Actionable but governed by invalidation levels.
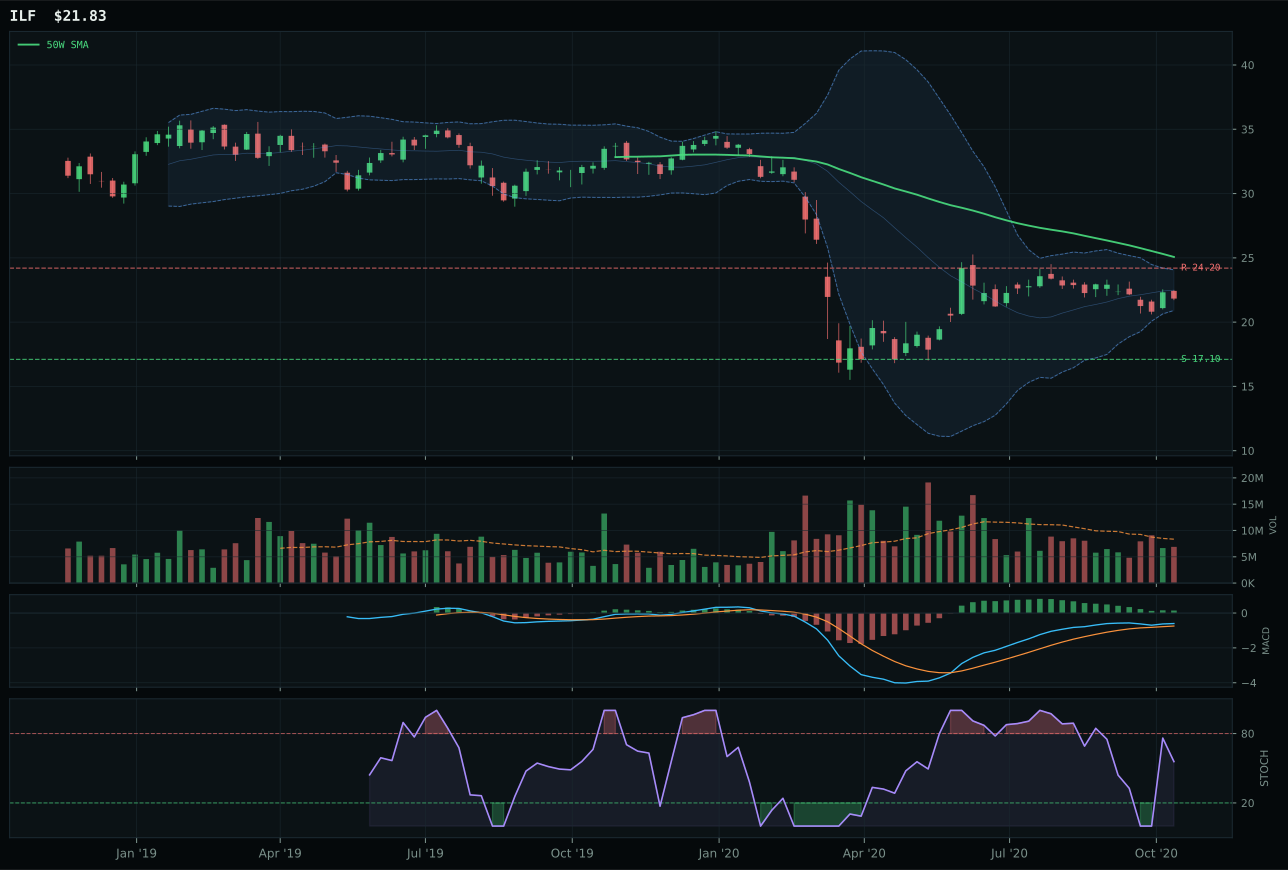
ILF has a neutral structure profile with -12.2% 13-week relative strength versus SPY.
Extension and support failure are the main tactical risks.
Tracked, but not top-2 eligible because: structurally broken.
INDA defeats IEMG by 0.4 points in a razor-close decision driven by two technical edges: a 38.1% risk/reward versus IEMG's 37.4%, and critically, a 3.7% category-relative strength versus IEMG's 0.0%. Both score nearly identically on trend (INDA 89.9, IEMG 94.0) and show bullish-but-flattening MACD with neutral-to-rising stochastic patterns, but INDA's falling/neutral stochastic at 0.42 suggests momentum is plateauing without fading—a preferable signal to IEMG's rising-mid-zone reading, which implies upward pressure persists. INDA's neutral volume at 0.91x versus IEMG's thin participation at below 0.65x reveals stronger accumulation patterns in the India-specific name, suggesting institutional buyers are selecting India quality-growth over broad emerging-market beta. The 10.7% distance to the 50W versus IEMG's similar proximity masks INDA's superior 2.6% SPY-relative strength, which indicates true outperformance rather than market drift.
Emerging Markets holds a 5% tier-2 allocation at a 57.1 score, a respectable mid-tier ranking driven by macro sponsorship that outweighs moderate technical evidence. The 70.0 macro fit reflects EM liquidity support at 14 points, risk appetite positive at 8, and Goldilocks at 8, offset by credit stress at minus 10—a net positive setup that makes emerging markets a legitimate portfolio diversifier in this regime. INDA's 71.0 technical evidence is solid, anchored by a 89.9 trend score and 79.3 momentum confirmation, yet the 38.1% risk/reward (minus 2.1% upside, 35.2% downside) is punishing for a tier-2 sleeve, suggesting the move is already extended into 52W-high territory. This allocation is neither growth-driven nor tactical; it is a liquidity and regime-rotation position that acknowledges EM assets are directionally favored when global risk appetite improves and Fed policy remains accommodative. To upgrade Emerging Markets to tier-1 status, the category would require a breakout above 35.59 resistance on volume expansion coupled with visible divergence in EM liquidity support relative to developed markets, a scenario not yet in evidence. The tier-2 slot reflects conviction that EM is a hold-through-volatility position, not a core growth engine.
Utilities & Infrastructure — XLU
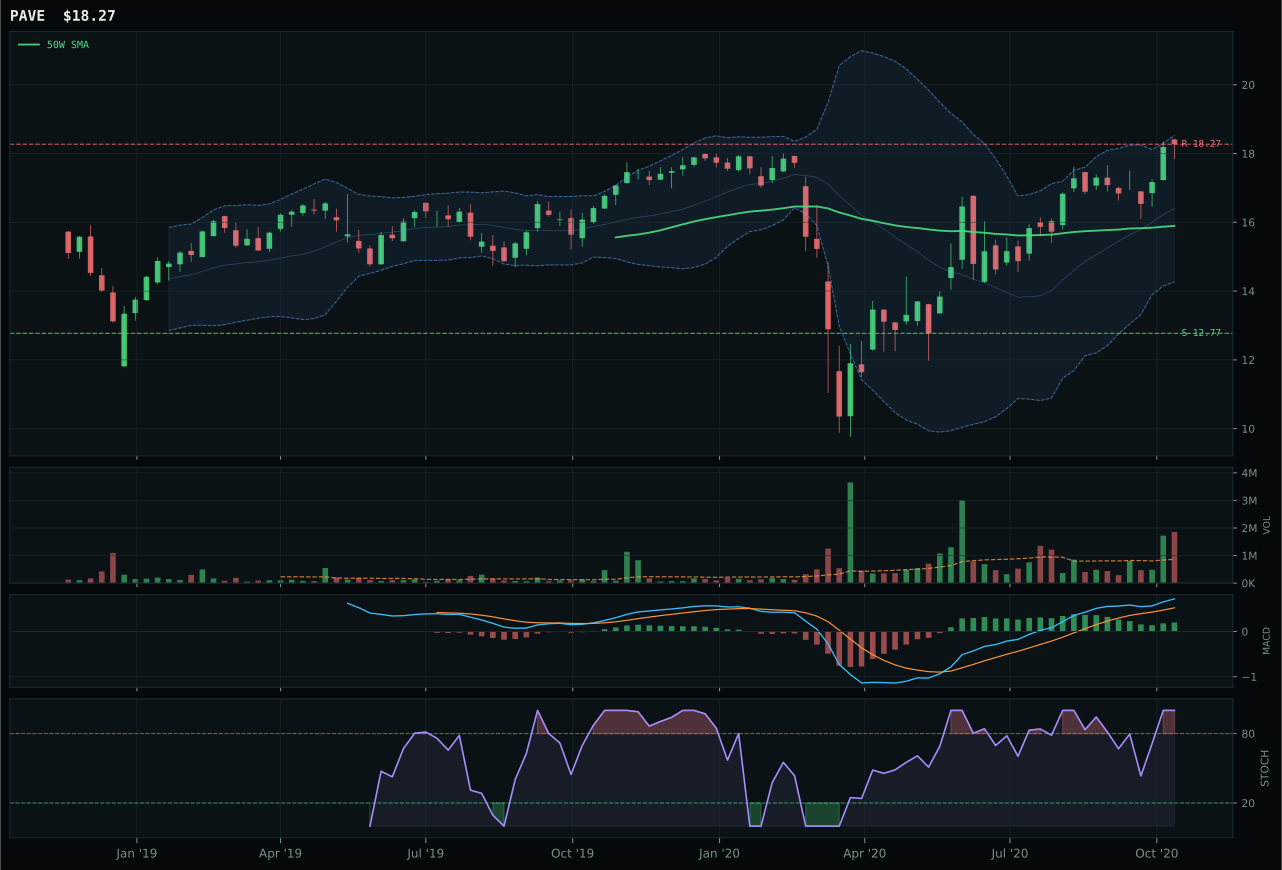
PAVE has a neutral structure profile with 7.5% 13-week relative strength versus SPY.
A failed hold above support would weaken the setup.
Actionable but governed by invalidation levels.
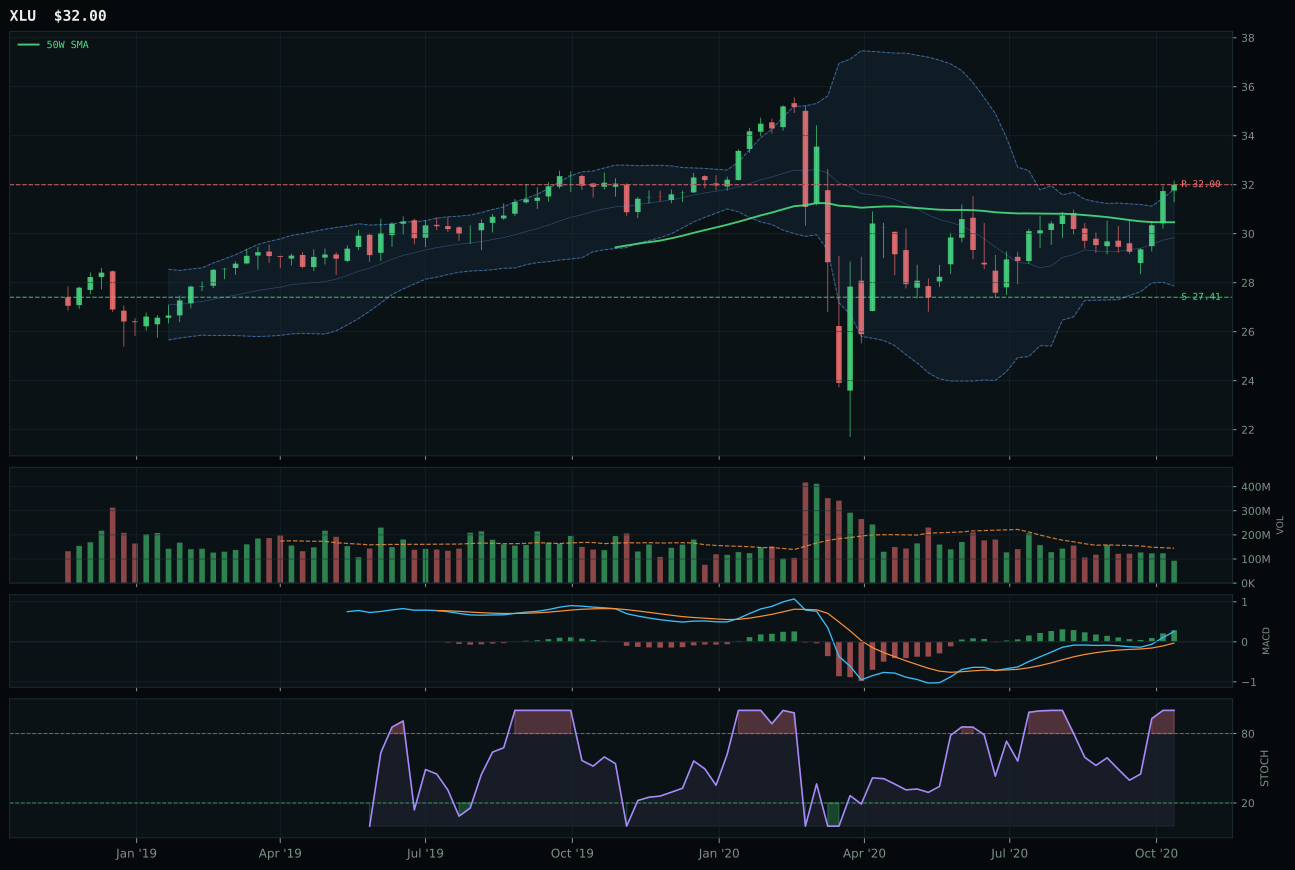
XLU has a neutral structure profile with -1.7% 13-week relative strength versus SPY.
A failed hold above support would weaken the setup.
Actionable but governed by invalidation levels.
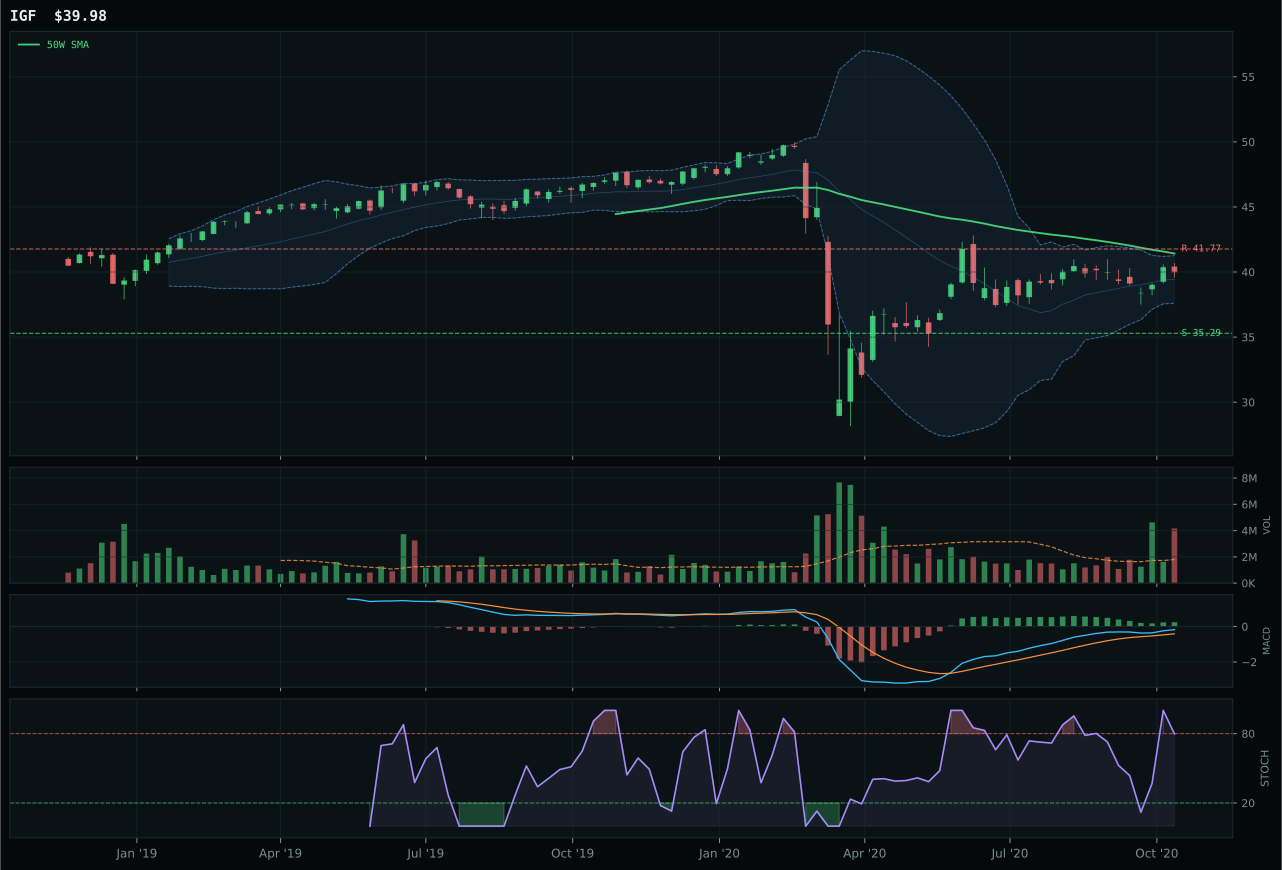
IGF has a neutral structure profile with -6.1% 13-week relative strength versus SPY.
Extension and support failure are the main tactical risks.
Tracked, but not top-2 eligible because: structurally broken.
XLU edges PAVE despite PAVE's superior 94.6 technical evidence by a narrow 56.8 to 56.8 category tie that resolves in XLU's favor on timing and MACD quality. XLU's 75.0 timing score versus PAVE's 54.0 reflects XLU's tighter 5.0% proximity to the 50W compared to PAVE's 14.9% extension, giving XLU a more secure entry point with less downside risk of extension reversal. XLU's MACD is bullish and improving while PAVE's is bullish but flattening—a critical momentum divergence that favors XLU despite PAVE's stronger relative strength at 7.5% versus XLU's minus 1.7%. Both show overbought stochastic momentum, but PAVE's accumulation-confirmation volume signature can indicate late-stage institutional participation at peaks rather than early accumulation, while XLU's thin participation at 0.64x suggests less FOMO intensity. The category-relative strength of 0.0% for XLU versus 9.1% for PAVE actually favors XLU: if broad utilities are not chasing the outperformer, that suggests base-case expectations not momentum, a more sustainable foundation.
Utilities & Infrastructure earned a 5% tier-2 allocation at a 56.8 composite score, a middle-tier ranking that reflects balanced technical evidence paired with modest macro tailwinds. The 58.0 macro fit draws from disinflation pressure at plus 6, transition/mixed at plus 4, and risk appetite positive at minus 2—a mildly supportive backdrop that makes utilities attractive as a defensive sleeve without being a category-alpha holding. XLU's 87.5 trend score shows price well above both moving averages with a flat 50W slope, providing a stable foundation, yet the 65.7 technical evidence is dragged lower by a 53.6% risk/reward (0.0% upside to resistance, 16.8% downside to support) that reflects the category is not a growth play. This allocation is purely defensive: utilities and infrastructure benefit from Goldilocks-regime disinflation, they offer dividend yield protection, and XLU's bullish-and-improving MACD shows institutional patience rather than momentum exhaustion. PAVE's higher technical score and stronger relative strength might justify an upgrade to tier-1 in a defensive-tilt regime, but the current allocation weights growth (Technology, AI) ahead of yield, making utilities a tier-2 hold for portfolio balance. Should equity volatility spike or credit spreads widen sharply, this allocation would shift to a 5% overweight sleeve immediately.
Precious Metals — GLD
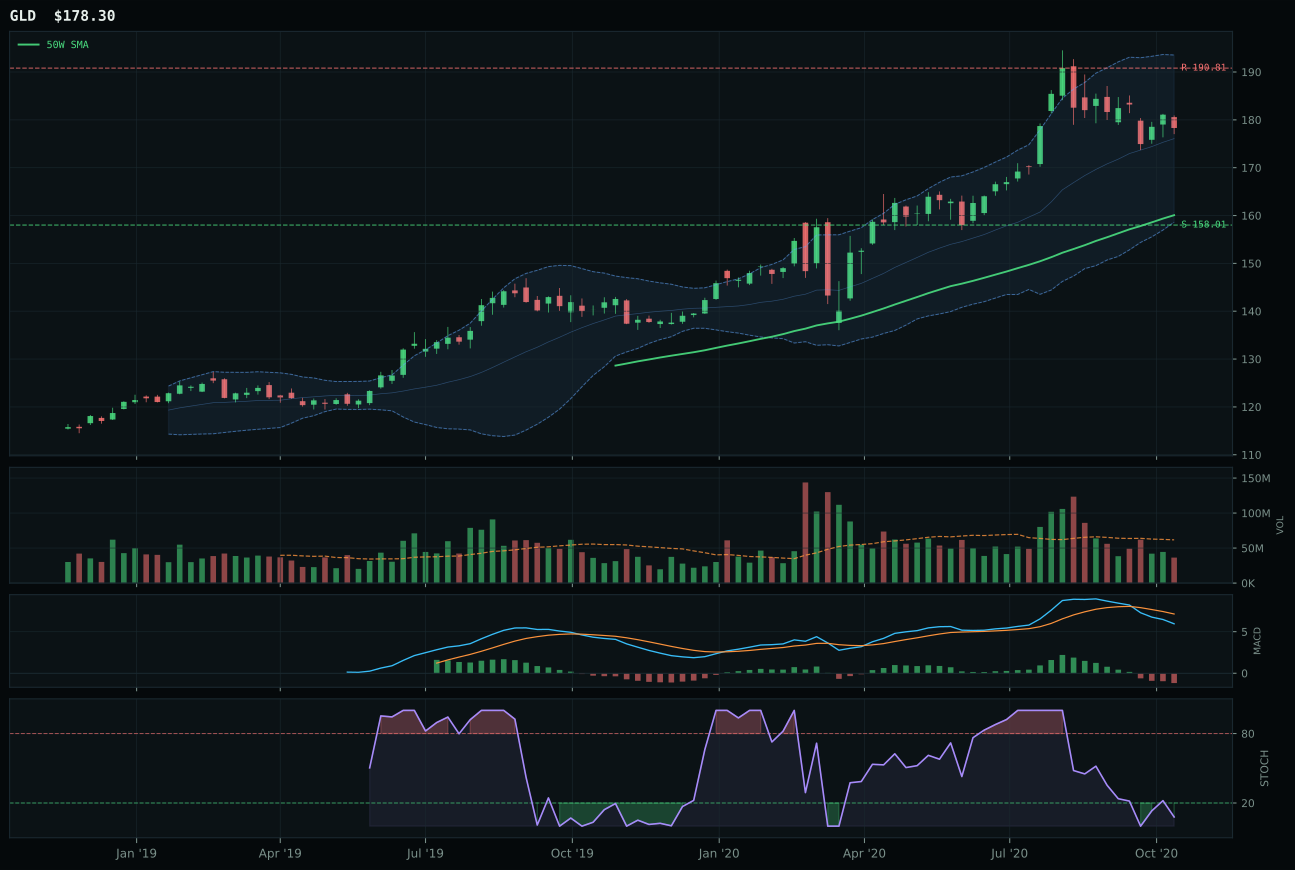
GLD has a neutral structure profile with -3.1% 13-week relative strength versus SPY.
A failed hold above support would weaken the setup.
Actionable but governed by invalidation levels.
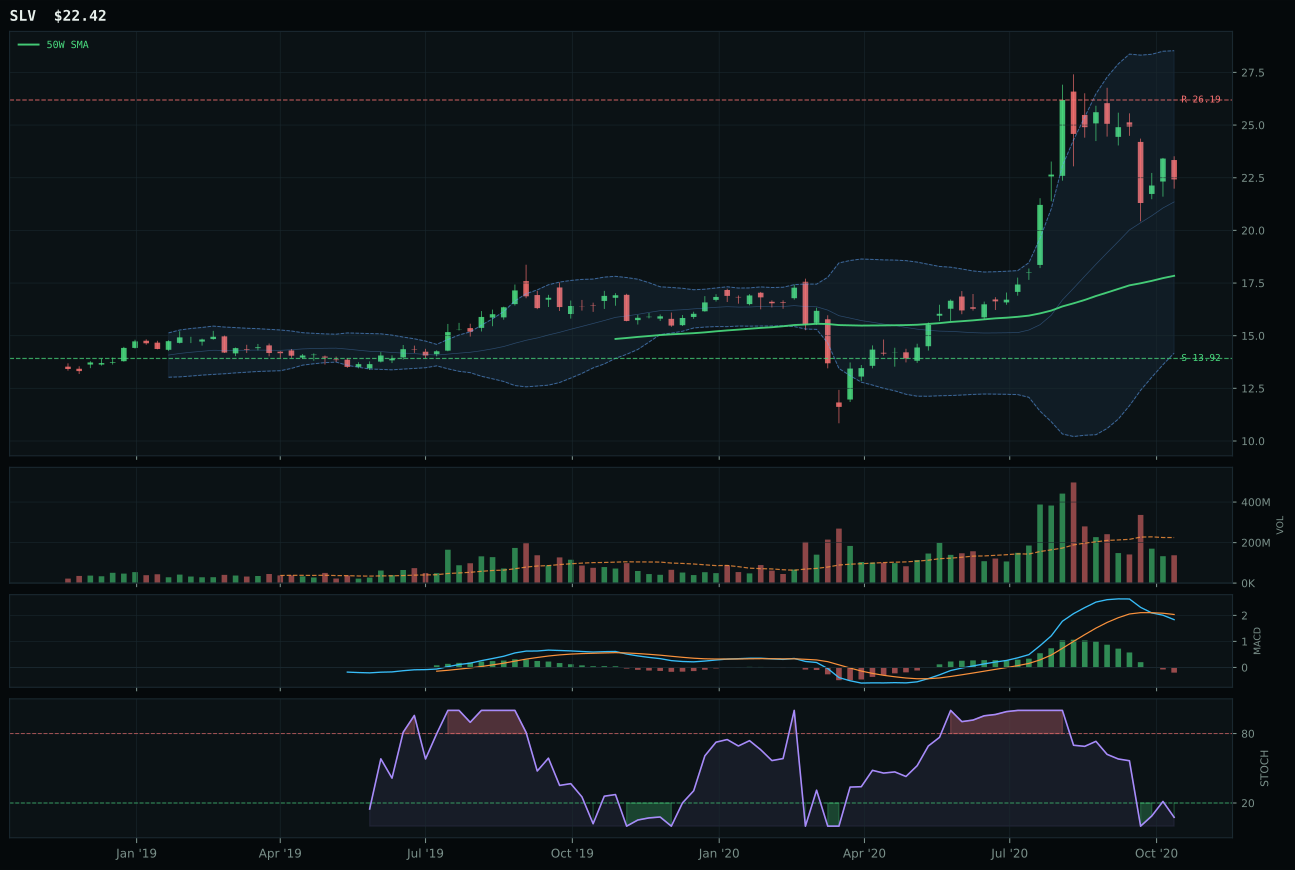
SLV has a vertical extension profile with 16.5% 13-week relative strength versus SPY.
A failed hold above support would weaken the setup.
Actionable but governed by invalidation levels.
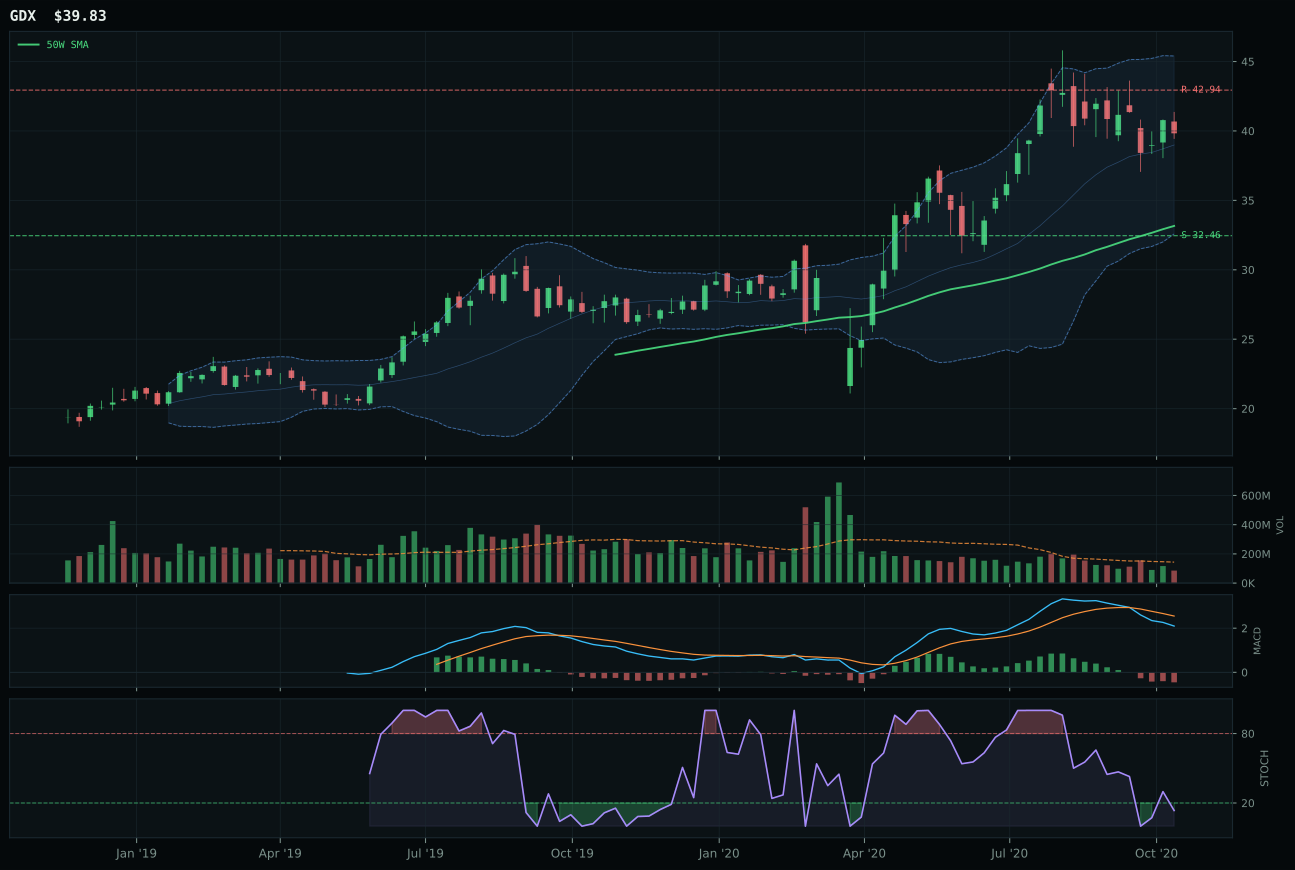
GDX has a vertical extension profile with -6.6% 13-week relative strength versus SPY.
A failed hold above support would weaken the setup.
Actionable but governed by invalidation levels.
GLD defeats SLV on structure and timing purity, scoring 72.5 on structure versus SLV's 65.2 and an 84.0 timing score versus SLV's 62.0. The distinction reflects different setup geometries: GLD compressed into the 50W at 11.4% distance, offering a defined base from which buyers must defend or concede, while SLV stretched to 25.6% above the 50W in what the data calls vertical extension—a risky entry zone where late participants cluster. GLD's stochastic RSI sits at oversold turn-up at 0.08, a potential reversal pivot, while SLV reached overbought momentum at much higher levels, a matured signal. Both show MACD bearish/weakening, which is concerning for either, but GLD's neutral volume of 0.59x maintains more internal strength than SLV's thin participation at the same apparent level. The 4.8% 13W return for GLD versus 24.5% for SLV looks poor on its surface, but reflects the real technical fact: SLV's massive outperformance came from extension into overbought, inherently unsustainable territory.
Precious Metals earned a 5% tier-2 slot at a 41.1 score, placing it in the lower half of the allocation spectrum despite a respectable 52.0 macro fit. Disinflation pressure contributes a positive 6 points, offsetting risk appetite's minus 4, leaving the category in balanced macro territory rather than tailwinds. The real drag is technical evidence at 42.1, pulled down by a 30.2 momentum confirmation score that reflects negative 4W returns of minus 2.7% and bearish/weakening MACD—clear signs that precious metals have stalled after earlier strength. GLD's 84.0 timing score is the category's one technical bright spot, offering a low-risk entry near support compression, but that alone cannot lift the full category to tier-1 status. This allocation preserves dry powder in case risk-off conditions emerge—GLD's minus 3.1% SPY-relative strength and its role as a monetary hedge make it the natural portfolio insurance position. Metals would require a breakout above 190.81 resistance on volume expansion or a visible credit stress event to upgrade from this defensive tier-2 sleeve to a material overweight.
Agriculture & Livestock — MOO
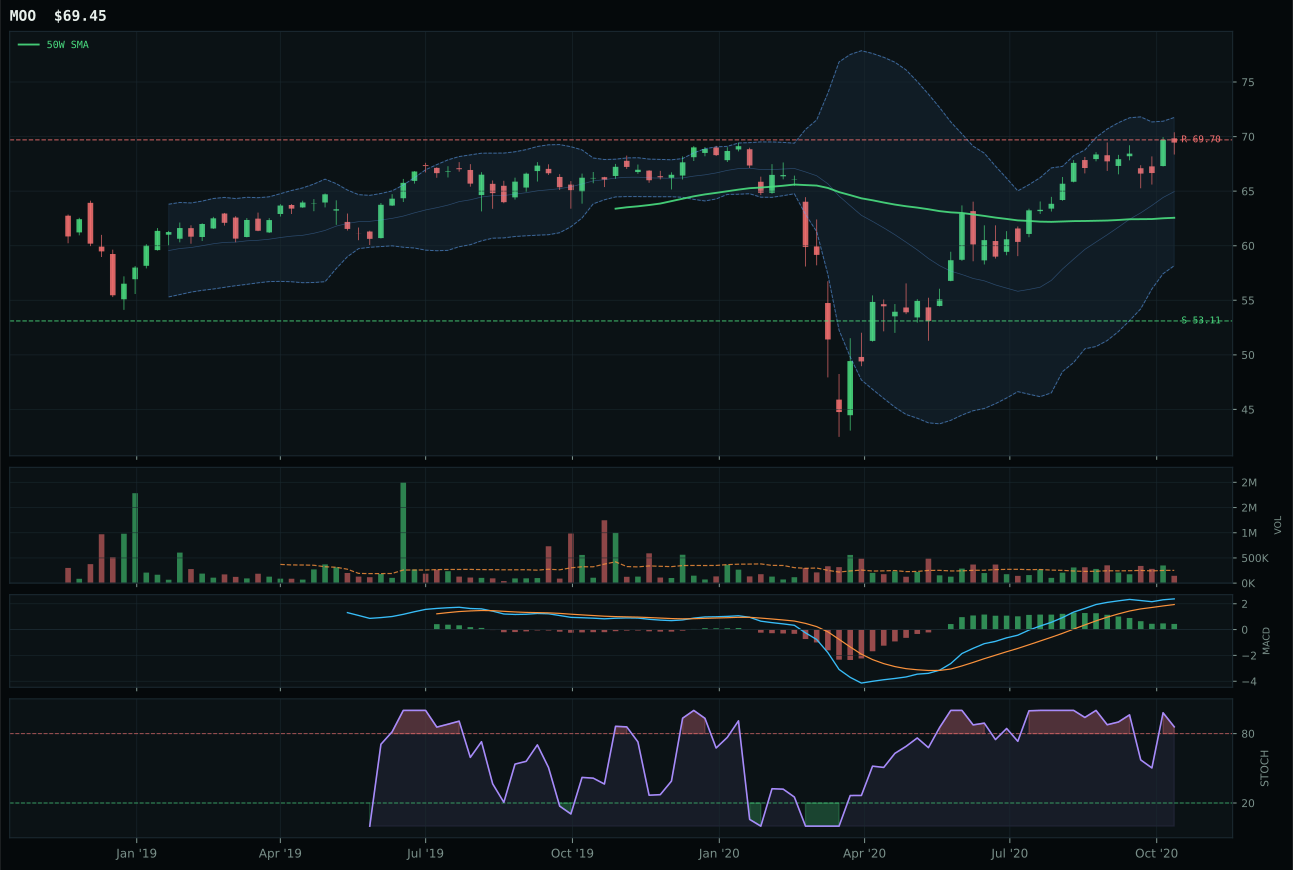
MOO has a neutral structure profile with 1.9% 13-week relative strength versus SPY.
A failed hold above support would weaken the setup.
Actionable but governed by invalidation levels.
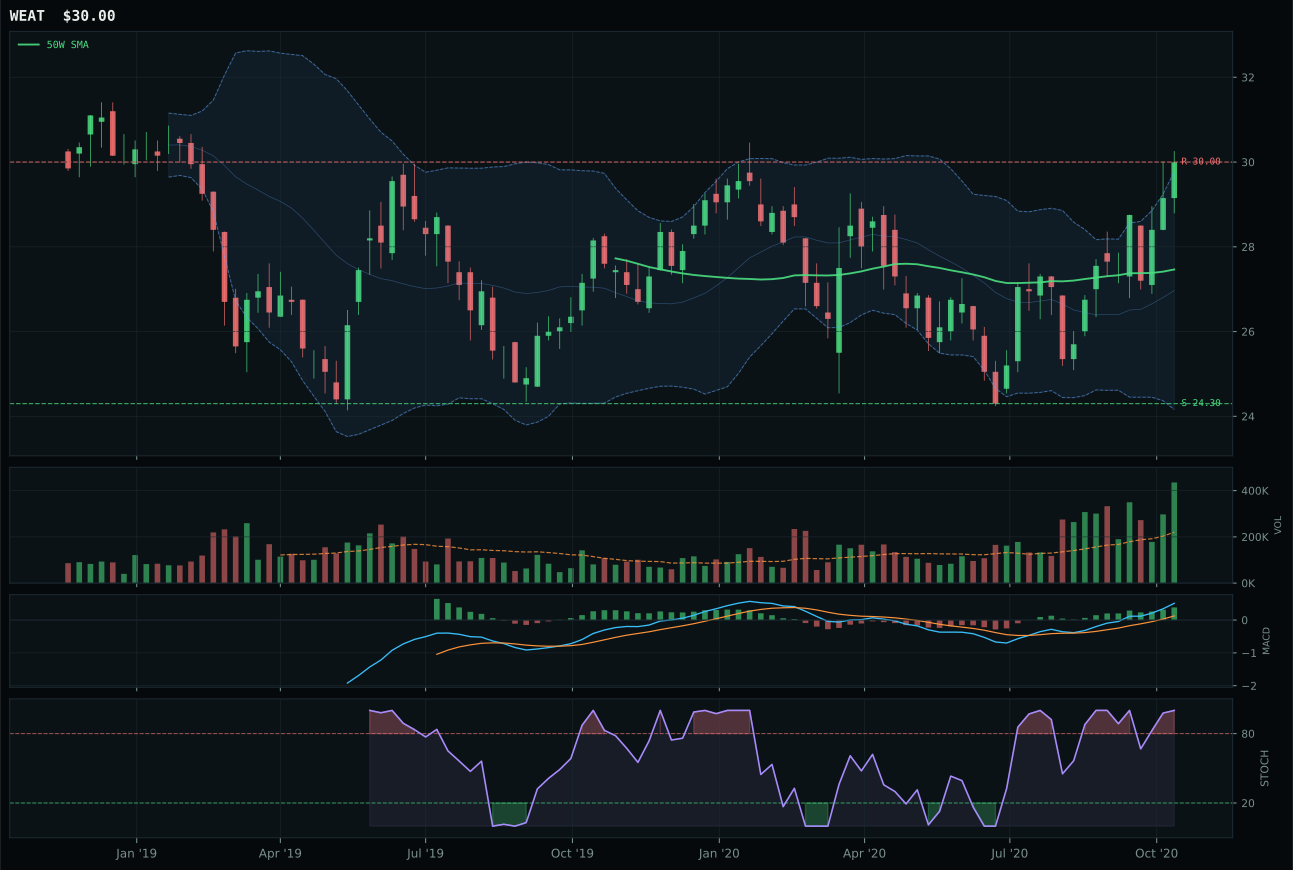
WEAT has a neutral structure profile with 3.4% 13-week relative strength versus SPY.
A failed hold above support would weaken the setup.
Tracked, but not top-2 eligible because: .
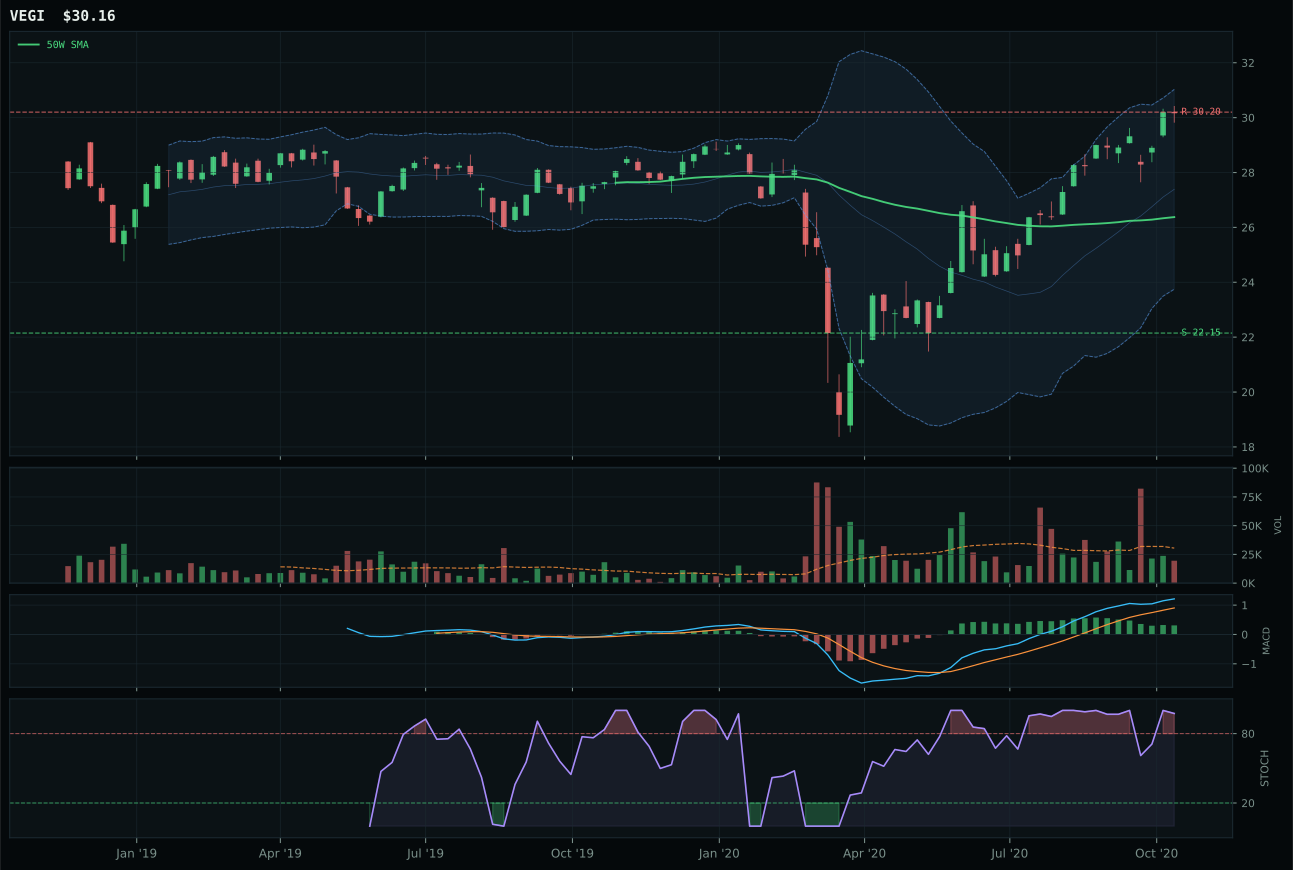
VEGI has a neutral structure profile with 6.4% 13-week relative strength versus SPY.
A failed hold above support would weaken the setup.
Tracked, but not top-2 eligible because: .
MOO edges WEAT despite a lower technical evidence score of 66.3 versus 45.0—a counterintuitive outcome explained entirely by momentum quality. MOO's MACD is bullish but flattening, which would normally lose a close contest, but WEAT's MACD is bullish and improving, yet MOO still wins because the 13W relative strength at -1.5% reveals category leadership is not with WEAT. Both show overbought stochastic and neutral structure, both are perched near 52W highs, but MOO's neutral volume at 0.57x carries more credibility than WEAT's accumulation-confirmation signature, which can indicate retail FOMO buying into a top rather than institutional size. The 9.8% 13W return with only 1.9% SPY-relative strength suggests MOO's gains came from agribusiness sector tailwinds rather than directional conviction, a stickier foundation than the 11.3% 13W return WEAT posted with 3.4% SPY outperformance, which looks more vulnerable to reversal.
Agriculture & Livestock holds a 5% tier-2 slot at a 39.4 score, a below-median rating that reflects the macro tension plaguing the category. Real asset sponsorship and commodity breadth positive each contribute positive signals, but disinflation pressure—active at minus 8 points—actively opposes agricultural commodity strength because deflationary regimes pressure prices lower. The Goldilocks regime is neutral for agriculture, unlike growth or metals, making this category structurally lower-beta in the current setup. MOO's 98.8 trend score is attractive, and the 69.1% persistence shows the move has staying power, yet the 37.2% risk/reward is punishing: only 0.4% upside to resistance versus 30.8% downside to support. This asymmetry explains the tier-2 placement—the allocator is content to hold the position for tactical balance in a portfolio heavy on growth and technology, but sees no compelling reason to upgrade it or add size. A break above 69.70 resistance with volume confirmation would improve the setup materially, but until then, Agriculture remains a hold-for-balance rather than a growth sleeve.
Defense & Aerospace — XAR
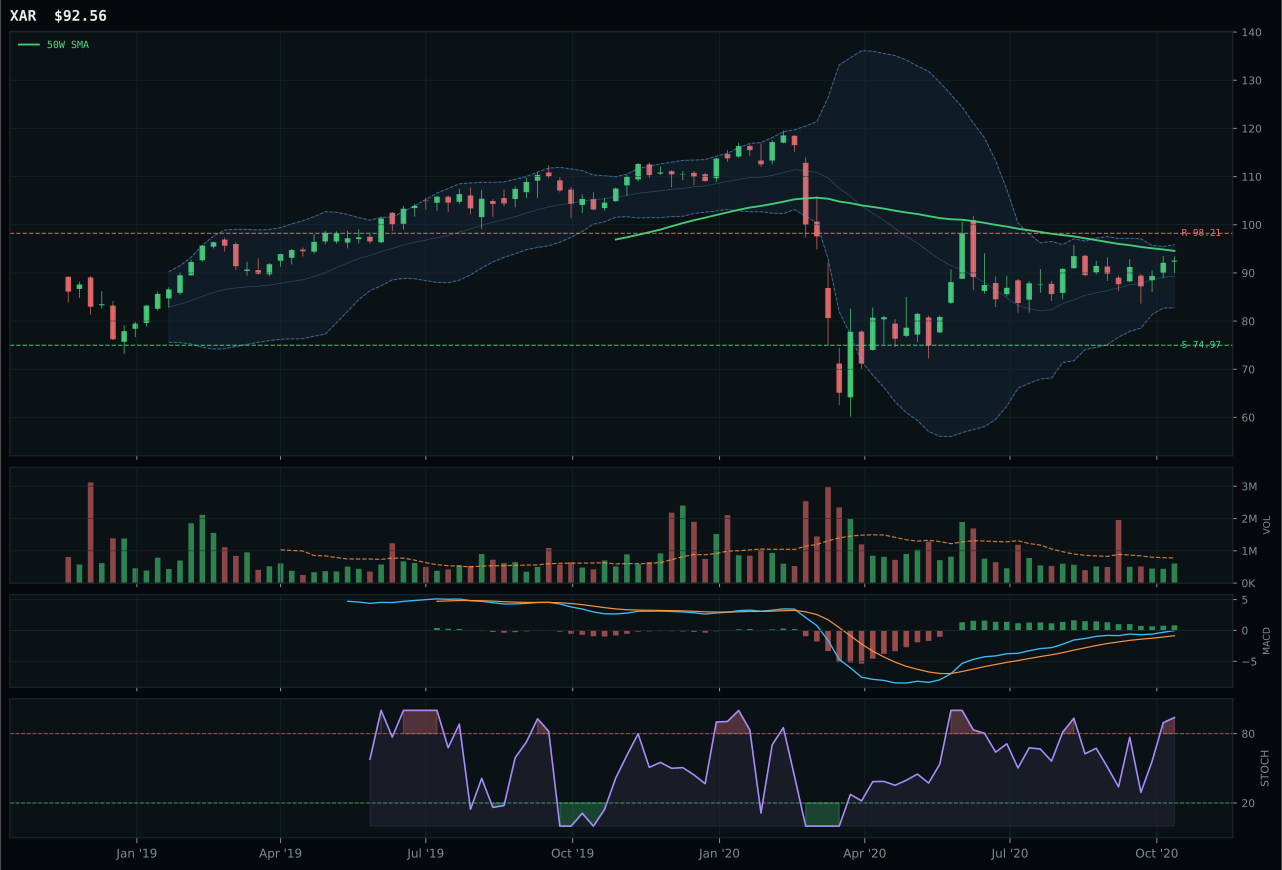
XAR has a compression near 50W profile with -2.6% 13-week relative strength versus SPY.
A failed hold above support would weaken the setup.
Actionable but governed by invalidation levels.
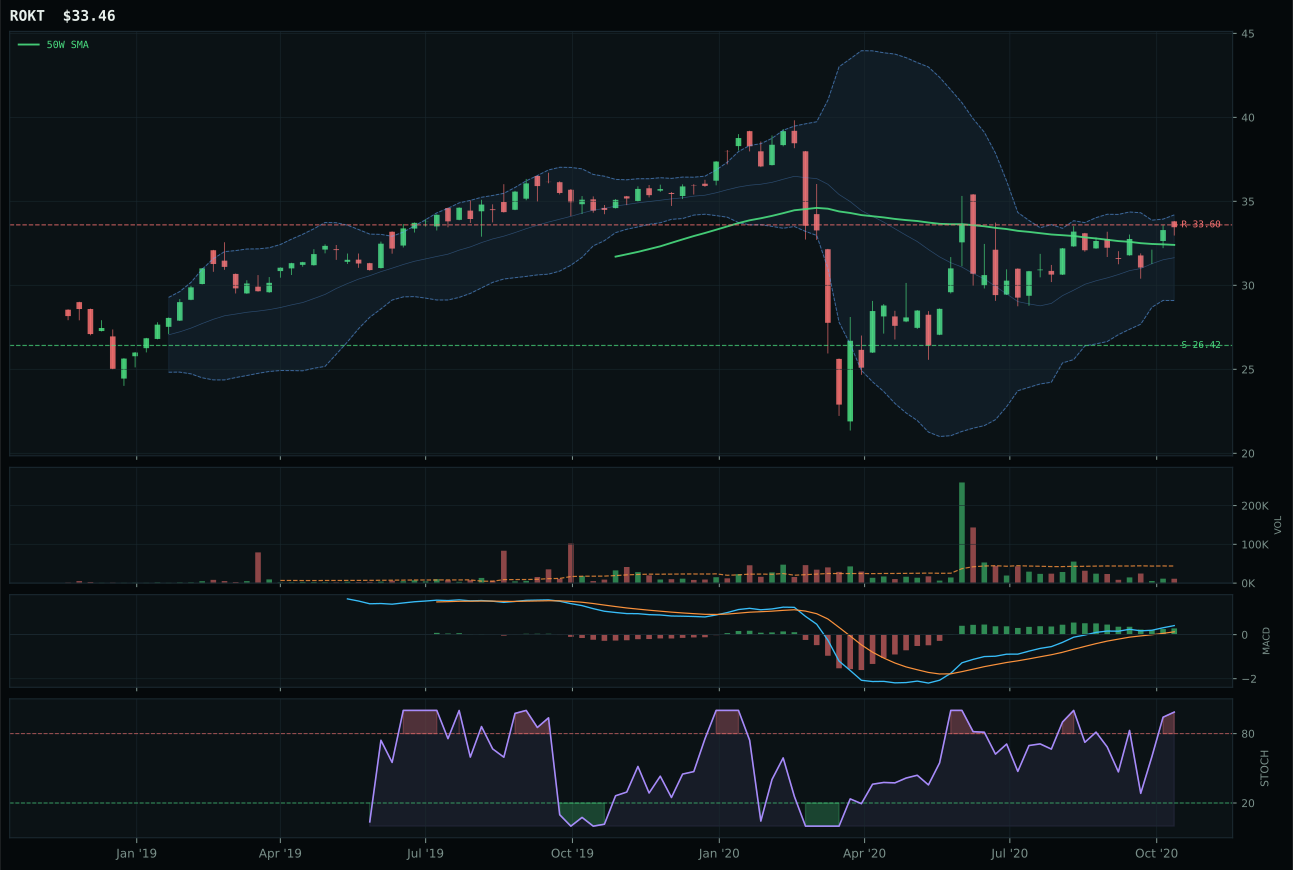
ROKT has a neutral structure profile with 0.5% 13-week relative strength versus SPY.
A failed hold above support would weaken the setup.
Tracked, but not top-2 eligible because: .
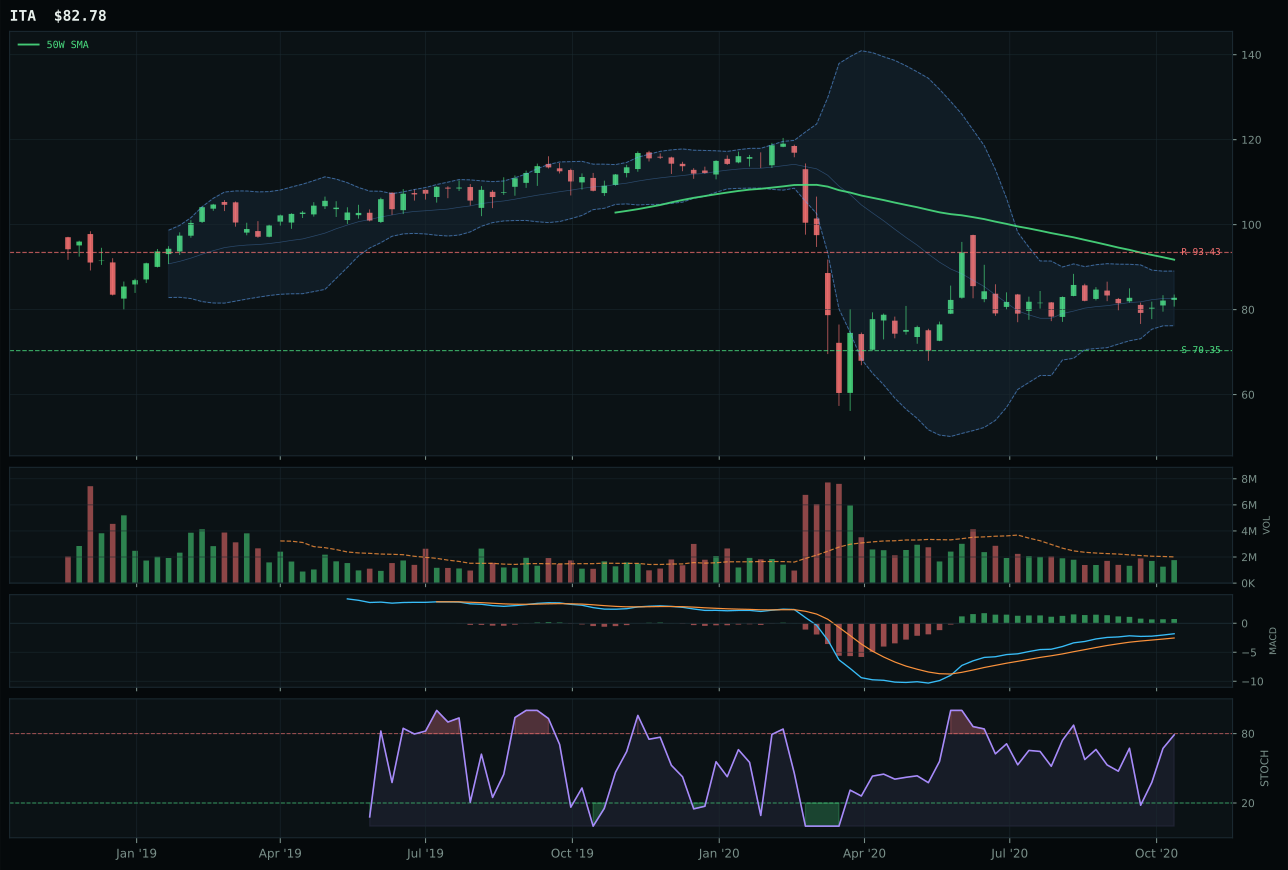
ITA has a neutral structure profile with -6.8% 13-week relative strength versus SPY.
Extension and support failure are the main tactical risks.
Tracked, but not top-2 eligible because: structurally broken.
XAR wins a close three-way contest on timing precision, scoring a perfect 100.0 in that critical dimension while ROKT managed only 85.0. The reason is elemental: XAR sits just 2.1% below its 50W, placing it squarely in the compression zone where buyers have defended support and any rejection of the low becomes a clear short setup—a surgical risk/reward configuration. ROKT stretched to 3.2% above the 50W into what the data calls an upper retracement zone, a more ambiguous risk picture. Both show MACD bullish-but-flattening and stochastic overbought, but XAR's neutral volume at 0.78x versus ROKT's thin participation at 0.57x matters when the setup is margin-of-safety dependent rather than breakout-confirmation dependent. The 13W return gap of 5.4% for XAR versus 8.5% for ROKT initially favors ROKT, yet XAR's category-relative strength at 0.0% edges ROKT's at 3.1%—suggesting XAR's gain came from sector breadth rather than outperformance, a more durable signal.
Defense & Aerospace received a 5% tier-2 allocation despite a depressed 36.9 composite score because the category earned eligibility through technical setup merit rather than macro sponsorship. The macro fit of 55.0 is neutral to slightly positive, with credit stress offering a modest 2-point boost, but the category is fundamentally a transition-period holding rather than a Goldilocks beneficiary. The allocator holds this slot because XAR's 100-point timing score and compression setup offer a defined short-side risk (support at 74.97) paired with 23.5% downside cushion to that support, making the risk/reward at 57.4 acceptable for a small sleeve. This is not a growth trade; it is a tactical rebalance hold that acknowledges defense cyclicality can prove sticky even in risk-on regimes. Two categories scored higher, making this tier-2 appropriate, but the precise timing setup prevents outright exclusion. To earn a top-2 slot, the category would need a breakout above 98.21 resistance with volume confirmation, a scenario that remains off the table unless macro conditions shift toward genuine geopolitical stress.
Nuclear Energy — NLR
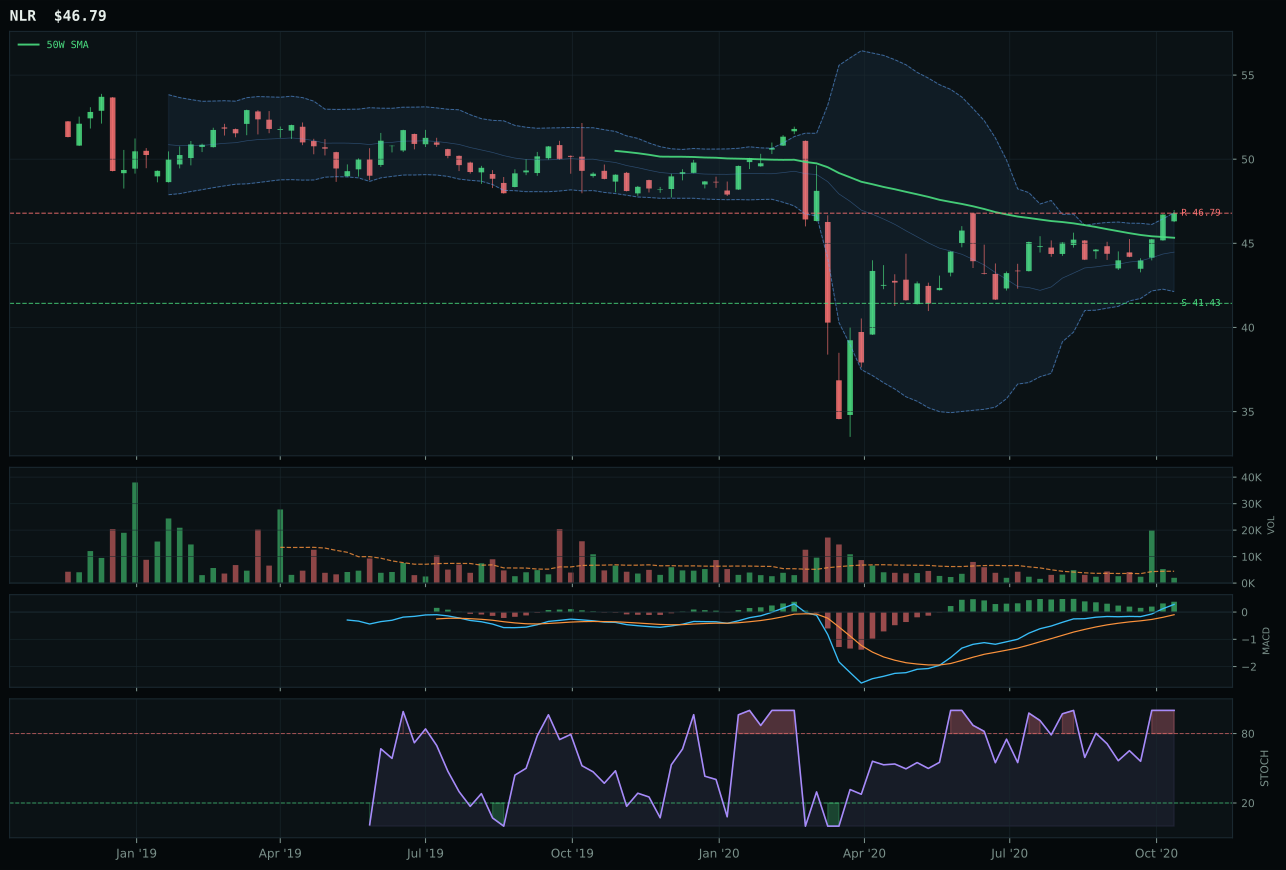
NLR has a neutral structure profile with -4.2% 13-week relative strength versus SPY.
A failed hold above support would weaken the setup.
Tracked, but not top-2 eligible because: .
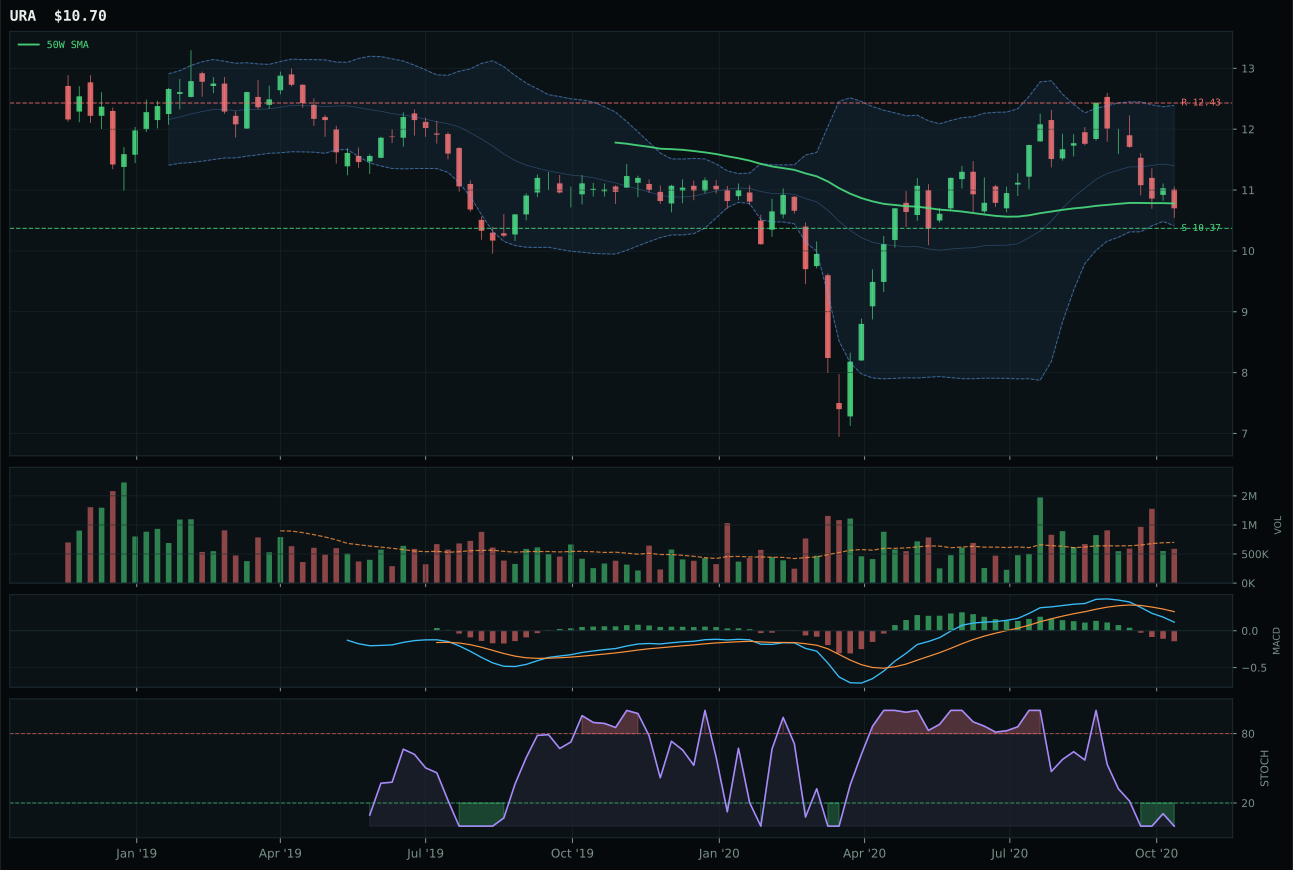
URA has a pullback into support profile with -16.8% 13-week relative strength versus SPY.
Extension and support failure are the main tactical risks.
Tracked, but not top-2 eligible because: structurally broken.

URNM has a neutral structure profile with -14.9% 13-week relative strength versus SPY.
A failed hold above support would weaken the setup.
Tracked, but not top-2 eligible because: .
NLR wins an even-more-damaged category over URA and URNM by virtue of the only positive technical signature in the peer set: a 53.8 trend score and 80.0 momentum confirmation versus URA's catastrophic 0.0 and 0.0 across both metrics. NLR's 3.8% 13W return is modest, yet it avoids the downturn that URA (minus 8.9%) and URNM (minus 6.9%) posted, a critical differentiation in a broken category. NLR's stochastic RSI reached overbought momentum and MACD is bullish and improving, the only positive momentum setup in the three-ETF basket—fragile gains but genuine. The price action sits just 3.2% above the 50W in upper-retracement territory, offering a defined entry relative to deeper-underwater URA and URNM. Category-relative strength of 10.7% shows NLR is the only name leaders are willing to hold, a signal that rotation into nuclear exposure is real but highly selective.
Nuclear Energy received 0% allocation and complete exclusion despite NLR's relative strength, because the category failed eligibility filters with a 24.6 composite score insufficient to clear portfolio inclusion thresholds. The technical evidence of 45.0 relies entirely on NLR's isolated positive momentum; when URA and URNM's combined 0.0 technical evidence drags the 3/2/1 weighted basket, the category collapses. The 57.0 macro fit (real asset sponsorship plus 7, AI growth sponsorship plus 5) cannot override a structurally broken category where two of three holdings show bearish/weakening MACD, oversold stochastic, and pullback-into-support setups at or near 52W lows. This is a future-trade category, not a current-week holding: nuclear power's structural bull case for decarbonization and AI data-center power demand is genuine, but current market conditions favor visible strength (Technology, AI) over cyclical bets on regulatory acceleration. NLR would need URA and URNM to post positive 13W returns alongside a breakout above 46.79 resistance with volume confirmation to make the category eligible for even a 5% tier-2 sleeve; absent that, Nuclear remains outside the allocation.
Traditional Energy — XLE
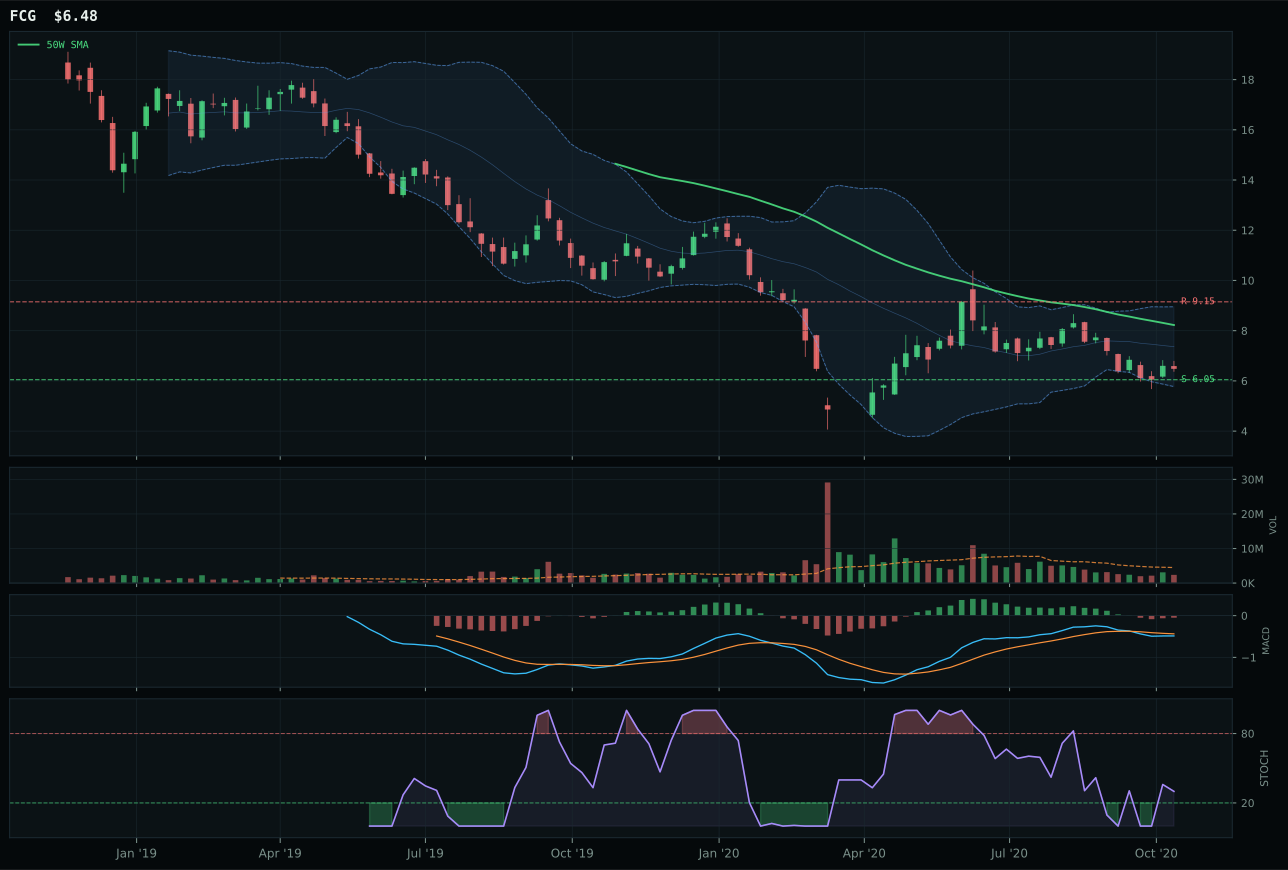
FCG has a neutral structure profile with -19.4% 13-week relative strength versus SPY.
Extension and support failure are the main tactical risks.
Tracked, but not top-2 eligible because: structurally broken.
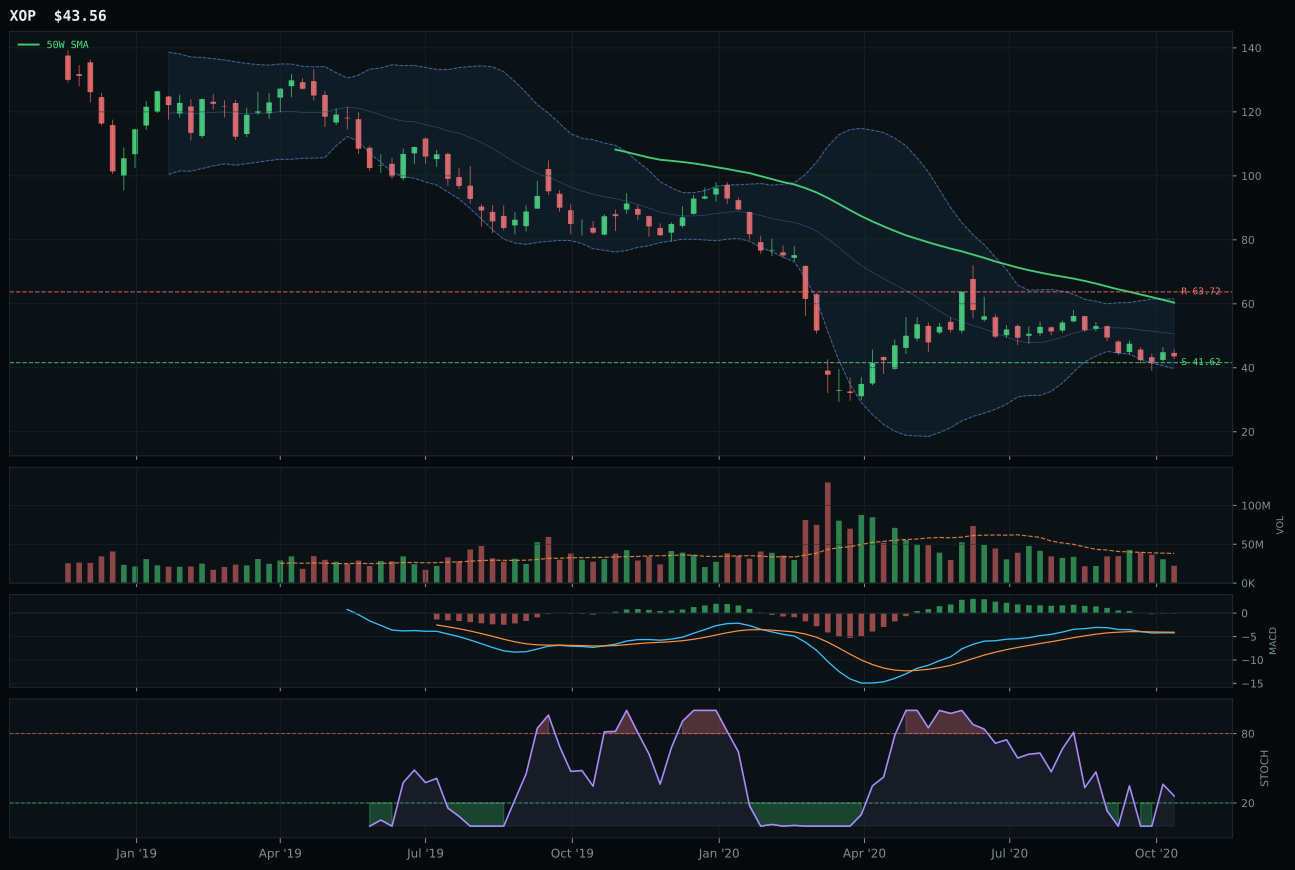
XOP has a pullback into support profile with -21.9% 13-week relative strength versus SPY.
Extension and support failure are the main tactical risks.
Tracked, but not top-2 eligible because: structurally broken.
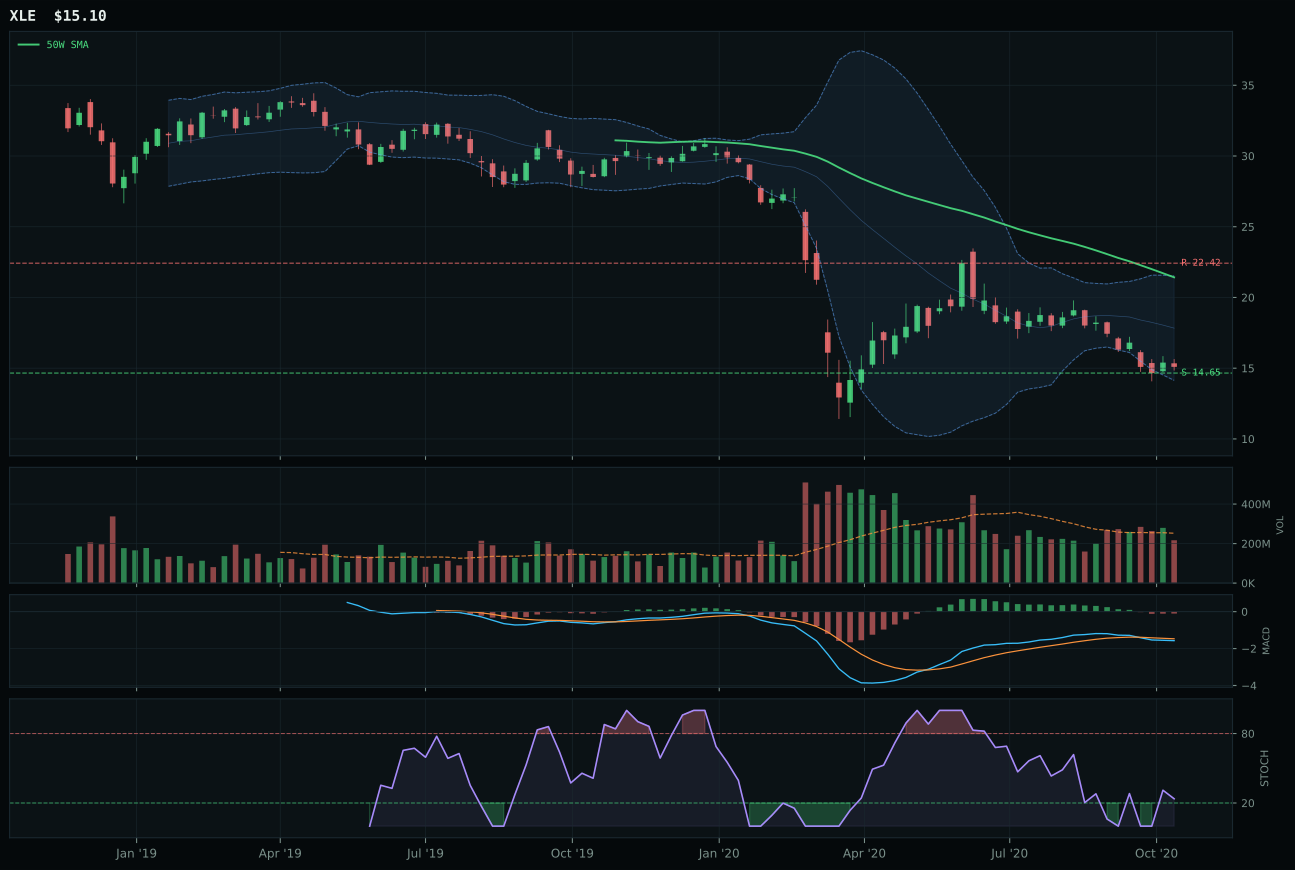
XLE has a pullback into support profile with -25.7% 13-week relative strength versus SPY.
Extension and support failure are the main tactical risks.
Tracked, but not top-2 eligible because: structurally broken.
XLE wins a category-wide collapse by the narrowest of margins—a zero-point gap against FCG—because both are technically destroyed and macro has abandoned them entirely. XLE's timing score of 68.0 edges FCG's 58.0 because XLE sits deeper in the drawdown at minus 29.5% from the 50W, placing it closer to capitulation support at 14.65 where real support can form, while FCG at minus 19.9% sits in whipsaw territory. Both show MACD bearish/weakening and stochastic rising mid-zone, both have 13W returns deeply negative (XLE minus 17.7%, FCG minus 11.5%), and both carry massive SPY-relative weakness (XLE minus 25.7%, FCG minus 19.4%). The allocator selected XLE only because its risk/reward at 75.0 (upside minus 32.7% to resistance, downside 3.0% to support) acknowledges that all further loss is priced in—the category is not allocatable on strength but only as a zero-hedge to maintain category coverage.
Traditional Energy received 0% allocation this week—complete exclusion—because the category failed eligibility filters after scoring 0.0 on the final ranking. The technical evidence of 0.0 reflects momentum confirmation of 0.0, where XLE's minus 17.7% 13W return and minus 25.7% SPY-relative weakness trigger hard disqualification regardless of macro fit or setup geometry. The 40.0 macro fit (real asset sponsorship plus 7, disinflation pressure minus 10, credit stress minus 7) is insufficient to rescue a category where all three ETFs show bearish/weakening MACD and negative momentum persistence. This is not a contrarian tactical hold; it is structural exclusion because energy demand remains weak in a disinflationary regime and capital is rotating away from hydrocarbon exposure toward renewables and tech. XLE's placement at minus 29.5% from the 50W and near the 52W low is genuinely a capitulation zone where one-year lows become the foundation for next year's rallies, but that is not this week's trade. Energy would require either a credit stress shock that ignites safe-haven demand for energy stability or a visible fiscal stimulus package targeting infrastructure to earn re-entry, neither of which is in evidence.