
2020-10-09
Informational purposes only. The content in this report, including allocations, analysis, and commentary, is provided solely for informational and educational purposes. It does not constitute financial advice, investment advice, trading advice, or any other type of advice. Past performance does not guarantee future results. Always conduct your own research and consult a qualified financial professional before making investment decisions.
Some tracked tickers were excluded due to missing live weekly price data: SGOV: Historical cache SGOV has only 19 usable weekly bars
Weekly Allocation
| Ticker | Category | Weight | Role |
|---|---|---|---|
| FSOL | 50% | Overlay | |
| PAVE | Utilities & Infrastructure | 10% | Top-2 (10%) |
| SMH | AI | 10% | Top-2 (10%) |
| INDA | Emerging Markets | 5% | Tier-2 (5%) |
| REMX | Industrial Metals | 5% | Tier-2 (5%) |
| IGV | Technology | 5% | Tier-2 (5%) |
| GLD | Precious Metals | 5% | Tier-2 (5%) |
| MOO | Agriculture & Livestock | 5% | Tier-2 (5%) |
| XAR | Defense & Aerospace | 5% | Tier-2 (5%) |
Trade Instructions — Monday Open
Sell the tranche from 2020-09-11 (completing its 4-week hold). Buy the new tranche. Instructions show net portfolio changes — same-asset positions cancel, weight changes show the delta.
| Action | Ticker | Instruction |
|---|---|---|
| SELL | IGV | Sell 20% of IGV position (reduce 6.25% → 5.00%) |
| SELL | PICK | Sell 33% of PICK position (reduce 7.50% → 5.00%) |
| SELL | BOTZ | Sell 17% of BOTZ position (reduce 7.50% → 6.25%) |
| SELL | XLU | Sell 33% of XLU position (reduce 3.75% → 2.50%) |
| SELL | URNM | Sell entire URNM position (1.25% of portfolio) |
| BUY | PAVE | Buy PAVE — 33.33% of freed cash (adds 2.50% to portfolio) |
| BUY | XAR | Buy XAR — 16.67% of freed cash (adds 1.25% to portfolio) |
| BUY | SMH | Buy SMH — 33.33% of freed cash (adds 2.50% to portfolio) |
| BUY | REMX | Buy REMX — 16.67% of freed cash (adds 1.25% to portfolio) |
Current Portfolio After Trade
Combined holdings across all 4 active tranches. Each tranche is 25% of the portfolio.
| Ticker | % of Portfolio | Weight Bar |
|---|---|---|
| FSOL | 50.00% | |
| INDA | 7.50% | |
| BOTZ | 6.25% | |
| IGV | 5.00% | |
| GLD | 5.00% | |
| XAR | 5.00% | |
| PICK | 5.00% | |
| MOO | 3.75% | |
| PAVE | 3.75% | |
| XLU | 2.50% | |
| SMH | 2.50% | |
| CIBR | 1.25% | |
| NLR | 1.25% | |
| REMX | 1.25% |
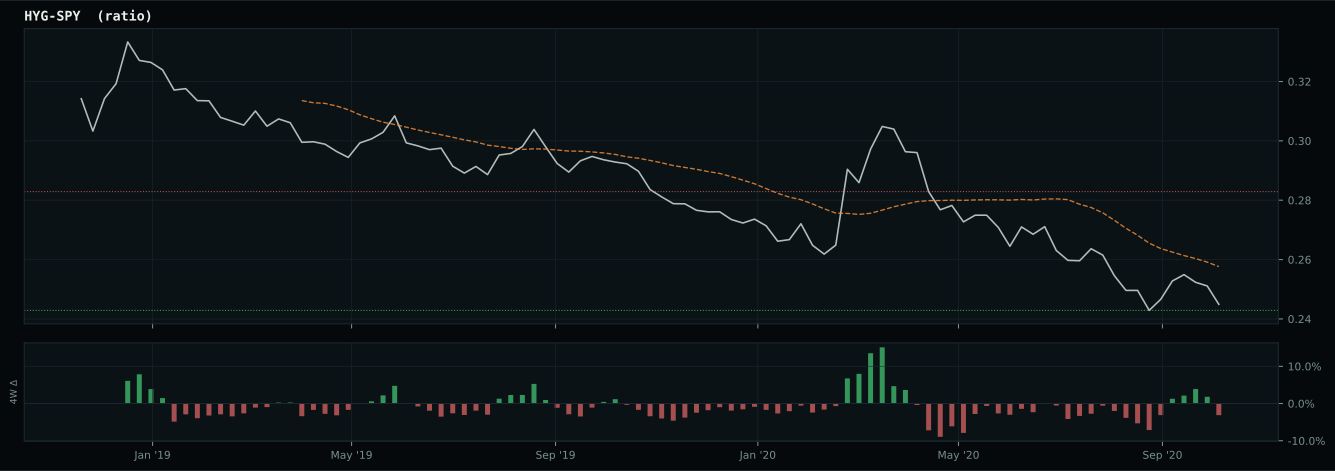
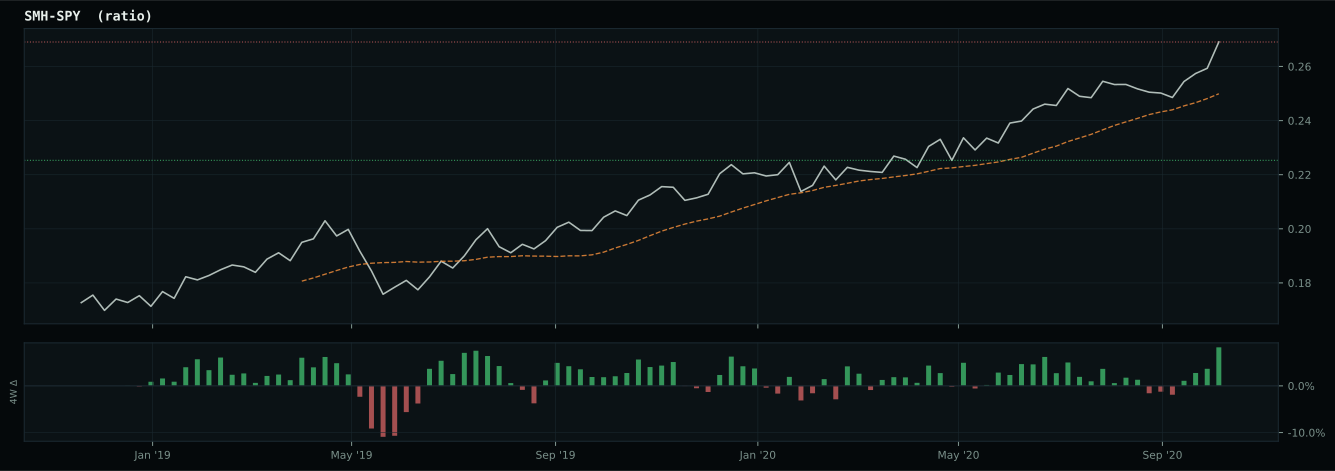
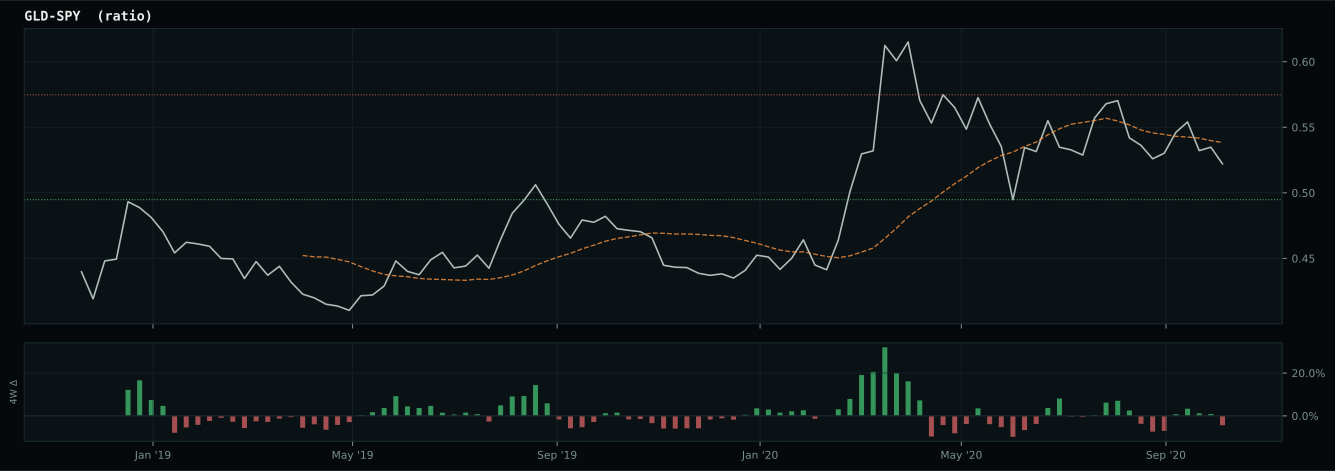
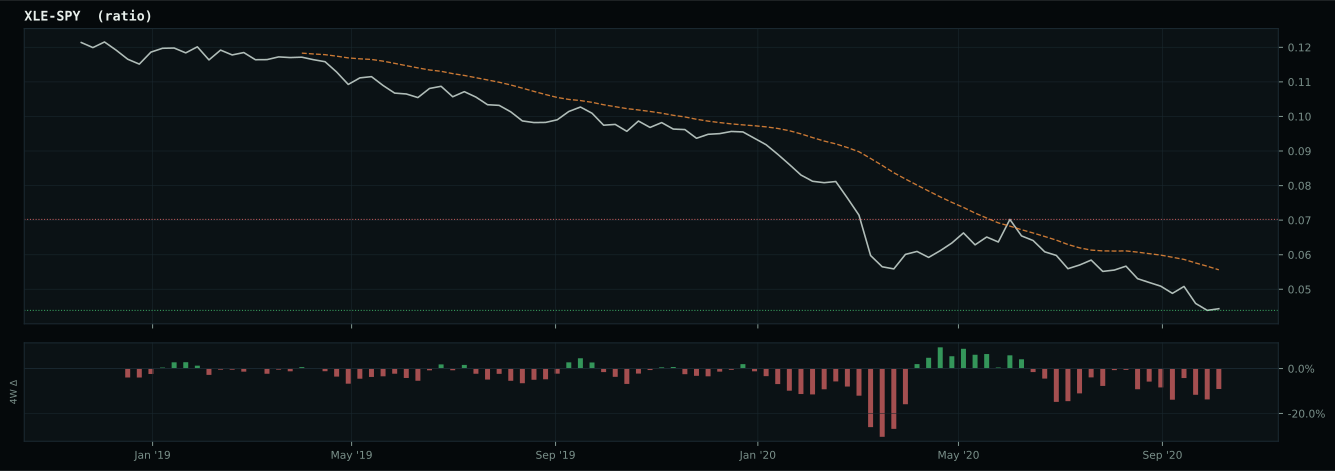
Macro Regime — Goldilocks
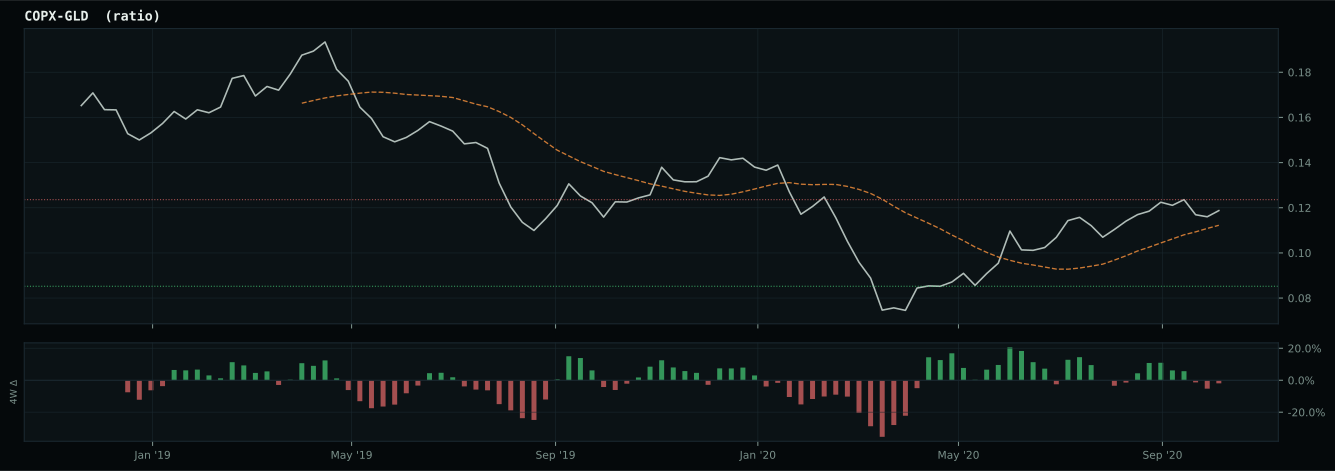
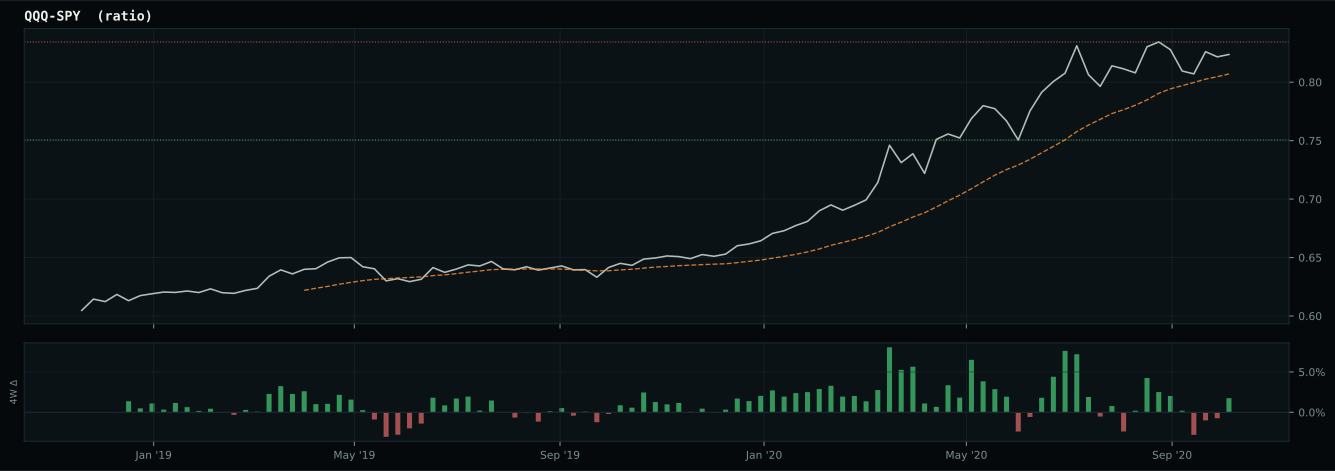
Macro Evidence Charts
Market-implied signals behind the macro regime scores. Each ratio compares two assets; the direction and slope of the ratio is what the macro engine reads.
Crypto Regime — AltSeason
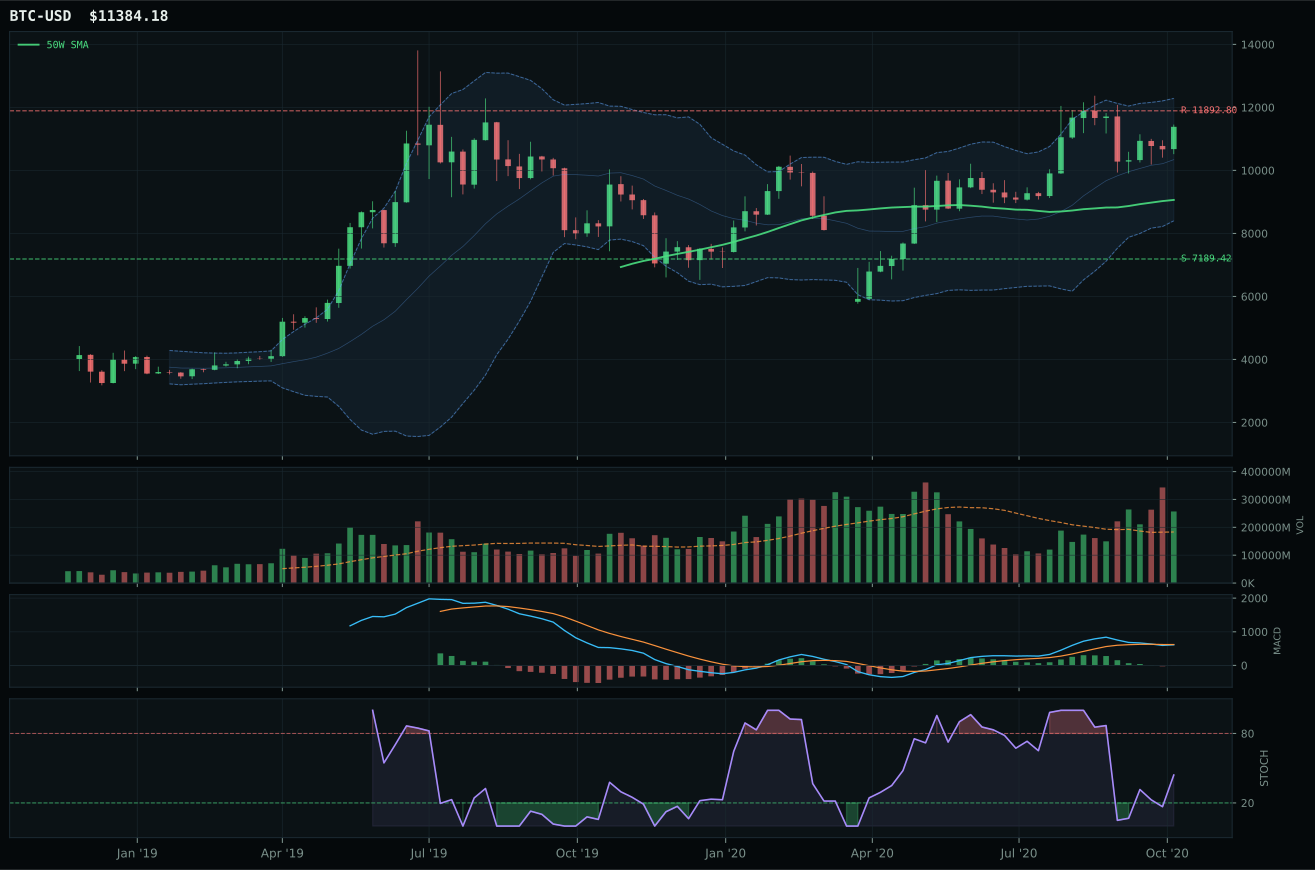
post-touch structure is too wide to count as a range; max/min close ratio is 2.21
TrendBTC confirmed: 2 consecutive closes above rising/flat 50W SMA
all available AltSeason conditions pass; missing optional confirmations skipped

Category Rankings
| Rank | Category | Winner | Score | Alloc | 4W Ret | Peers (4W) |
|---|---|---|---|---|---|---|
| 1 | Utilities & Infrastructure | PAVE | 63.5 | 20% | +10.48% | XLU +3.9% · IGF +5.9% |
| 2 | AI | SMH | 61.9 | 20% | +6.65% | BOTZ +5.9% · AIQ +4.5% |
| 3 | Emerging Markets | INDA | 57.8 | 10% | +4.33% | IEMG +7.4% · ILF +10.4% |
| 4 | Industrial Metals | REMX | 54.6 | 10% | +16.22% | PICK +6.2% · COPX +14.0% |
| 5 | Technology | IGV | 46.4 | 10% | -1.49% | CIBR +0.3% · XLK +1.8% |
| 6 | Precious Metals | GLD | 45.6 | 10% | -2.30% | SLV -2.4% · GDX -3.1% |
| 7 | Agriculture & Livestock | MOO | 37.5 | 10% | +5.51% | WEAT +1.5% · VEGI +4.6% |
| 8 | Defense & Aerospace | XAR | 37.1 | 10% | +4.10% | ROKT +1.1% · ITA +4.2% |
| 9 | Nuclear Energy | NLR | 28.9 | 0% | +4.45% | URA +3.8% · URNM +1.4% |
| 10 | Traditional Energy | FCG | — | 0% | -0.46% | XOP +0.9% · XLE +5.6% |
Utilities & Infrastructure — PAVE
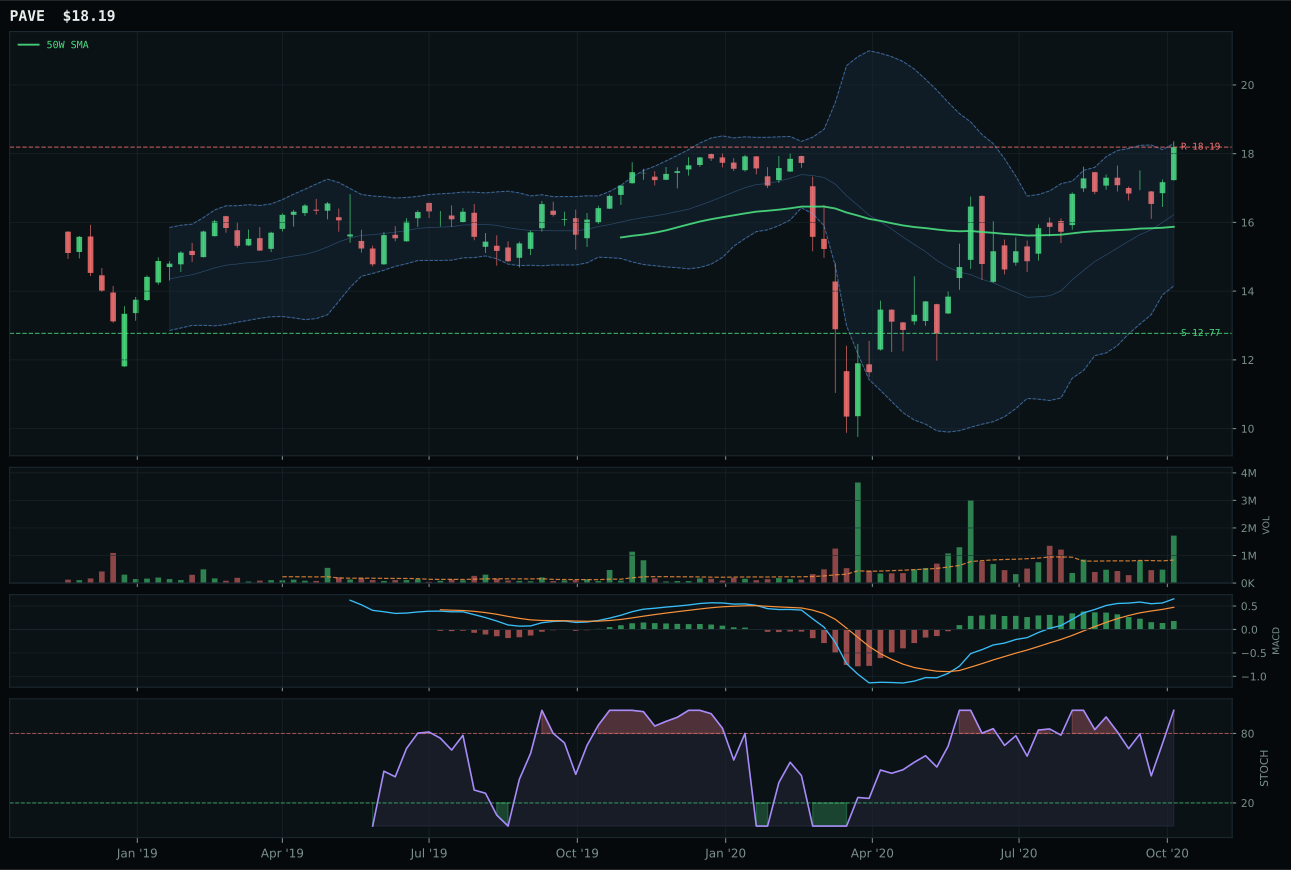
PAVE has a neutral structure profile with 13.1% 13-week relative strength versus SPY.
A failed hold above support would weaken the setup.
Actionable but governed by invalidation levels.
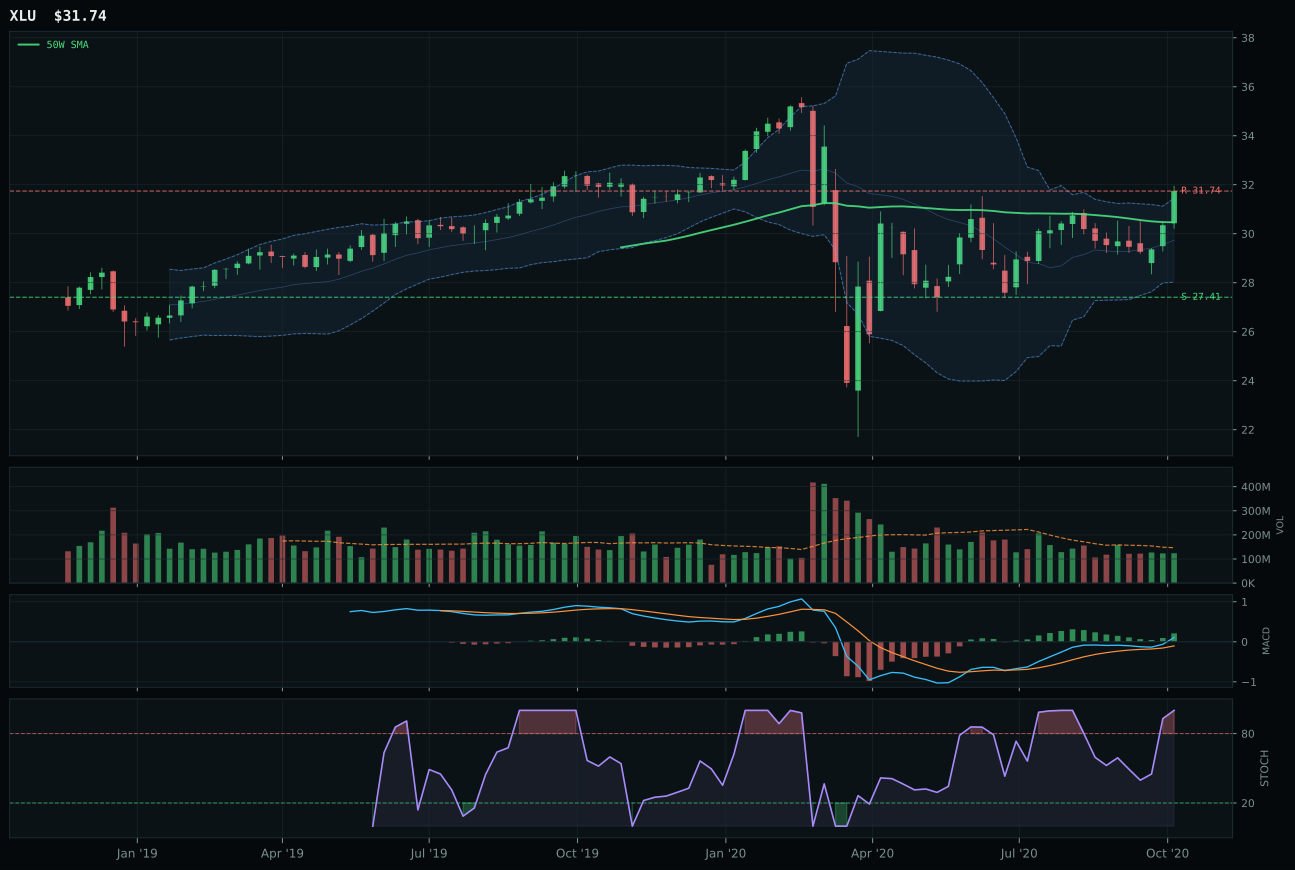
XLU has a neutral structure profile with 0.7% 13-week relative strength versus SPY.
A failed hold above support would weaken the setup.
Actionable but governed by invalidation levels.
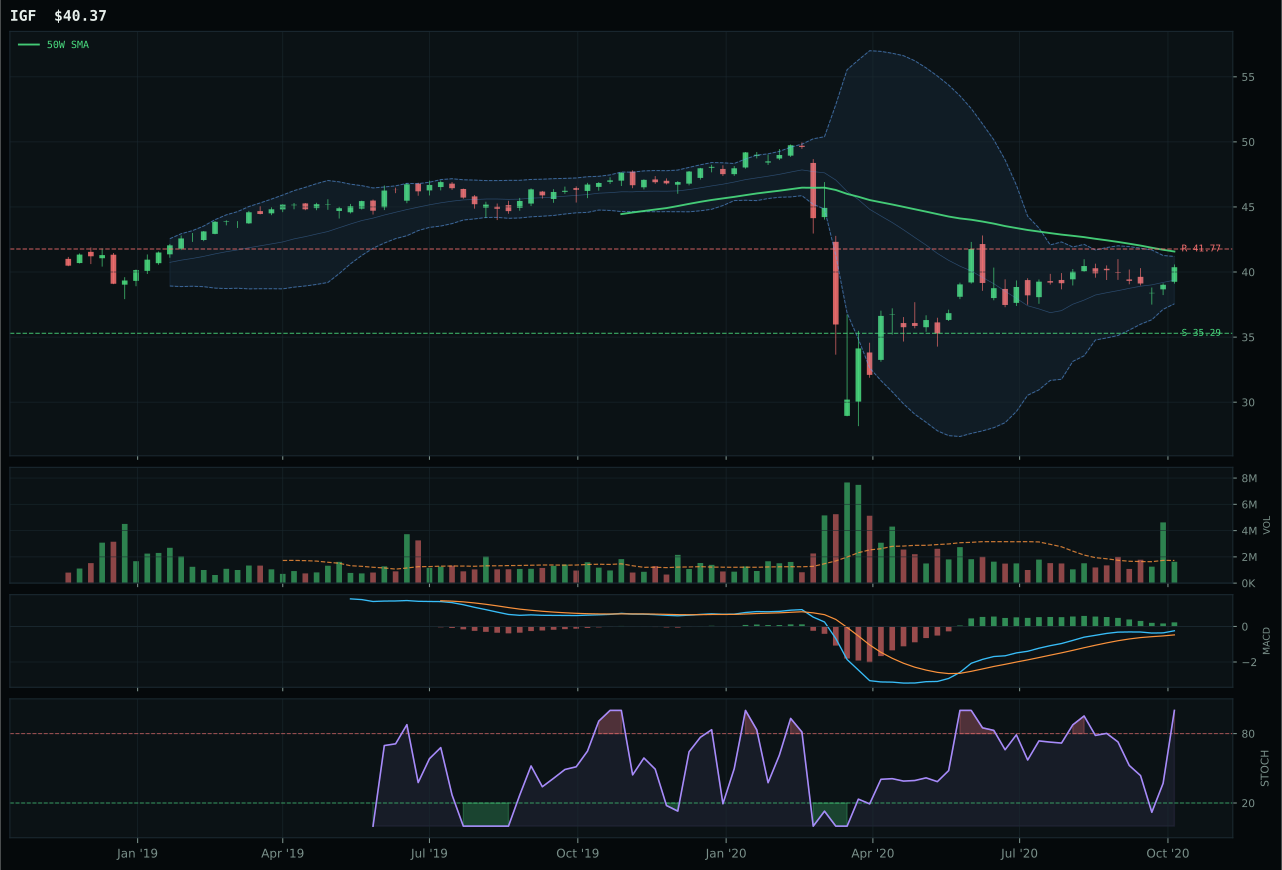
IGF has a compression near 50W profile with -3.6% 13-week relative strength versus SPY.
Extension and support failure are the main tactical risks.
Tracked, but not top-2 eligible because: structurally broken.
PAVE wins utilities decisively on the back of explosive accumulation volume at 2.06x the 20-week average and a perfect 100.0 momentum confirmation score driven by 22.3% 13-week returns and 13.1% SPY outperformance—the broadest relative strength posting among all top-2 category representatives. The infrastructure play sits below the 50-week moving average (at -14.6%) in a position that normally creates caution, yet the compression-into-strength structure at 80.0 combined with 96.2 volume-price confirmation and 99.7 persistence scores signal institutional accumulation rather than weakness. XLU's 91 trend score and bullish-and-improving MACD represented fresher momentum, yet the 0.7% SPY relative strength and neutral volume participation failed to match PAVE's category dominance (+12.4% category relative strength), creating a -5.2 point score disadvantage that the system resolved decisively in PAVE's favor. The infrastructure thesis is capturing flows that utilities-as-dividend-defense cannot access.
Utilities & Infrastructure secured a 10% top-2 allocation after posting 63.5, matching AI at the highest composite score tier and reflecting strong technical sponsorship aligned with Goldilocks macro conditions. The category-level macro fit of 60.0 benefits from Goldilocks (+4), disinflation pressure (+6), and commodity breadth positive (+4), creating modest but genuine tailwinds in a regime favoring real assets and growth infrastructure. PAVE's 97.8 technical evidence score is the second-highest among all category representatives (surpassed only by INDA's 85.8 and approaching SMH's 58.8), paired with 96.2 volume-price confirmation that signals institutional conviction. The 10% position reflects PAVE's emergence as a genuine growth vector within the infrastructure space—this is not dividend defense but capital expenditure participation in a regime where domestic infrastructure spending remains stimulus-dependent. Utilities & Infrastructure and AI share the top-2 tier because both categories combine strong technical evidence with multi-descriptor macro support; the difference is that AI commands higher AI growth sponsorship while Utilities captures broader disinflation and transition narratives, creating complementary exposures rather than competing bets.
AI — SMH
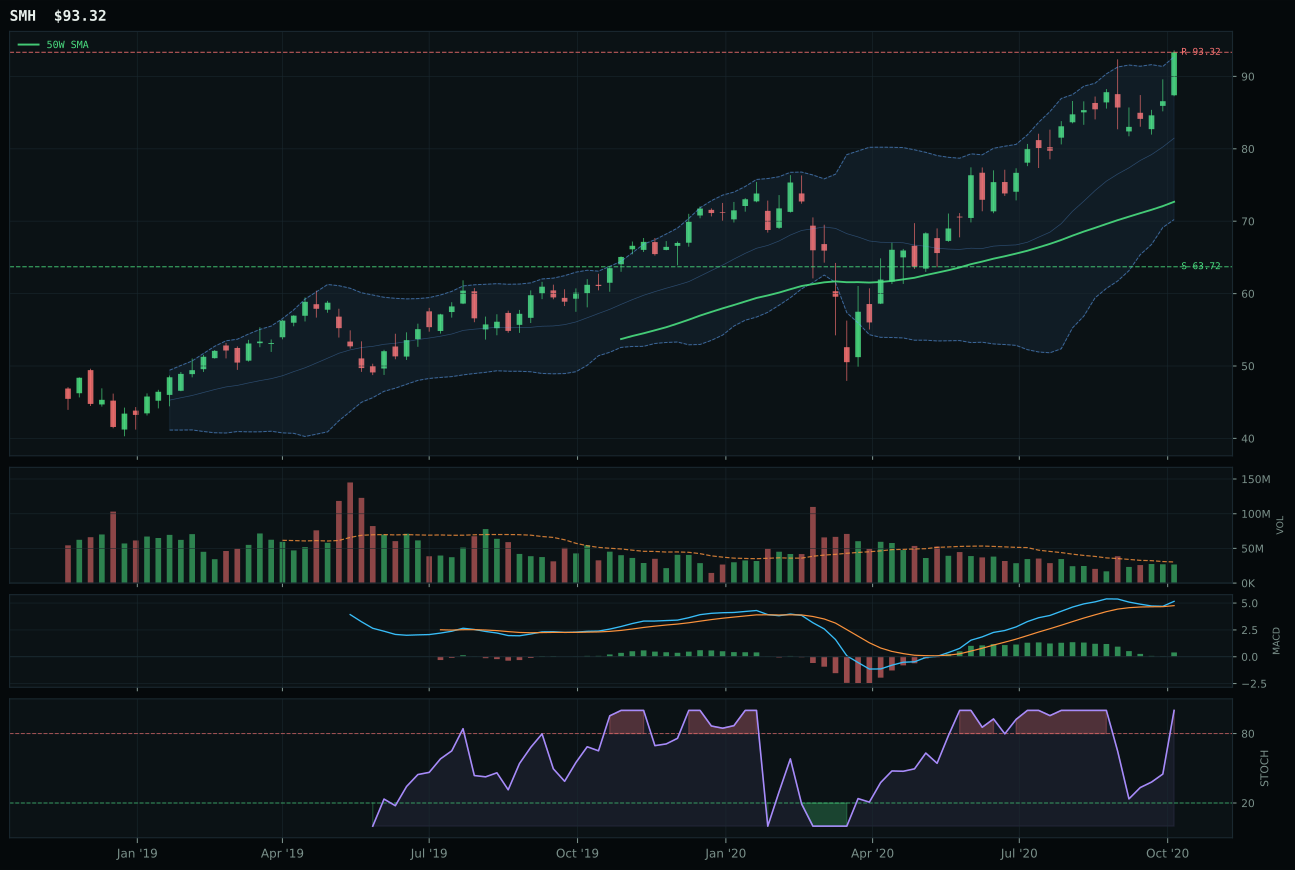
SMH has a vertical extension profile with 7.5% 13-week relative strength versus SPY.
A failed hold above support would weaken the setup.
Actionable but governed by invalidation levels.
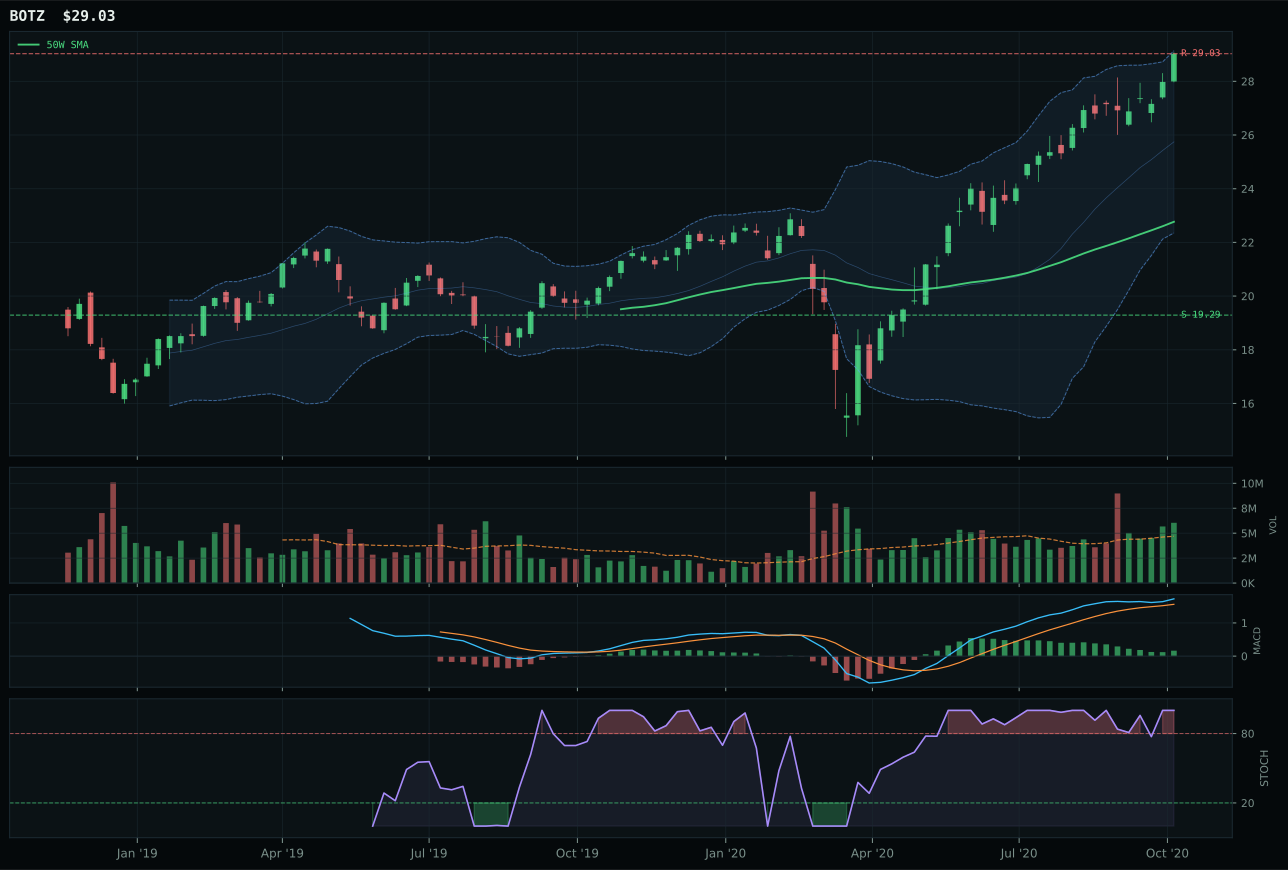
BOTZ has a vertical extension profile with 7.3% 13-week relative strength versus SPY.
A failed hold above support would weaken the setup.
Actionable but governed by invalidation levels.
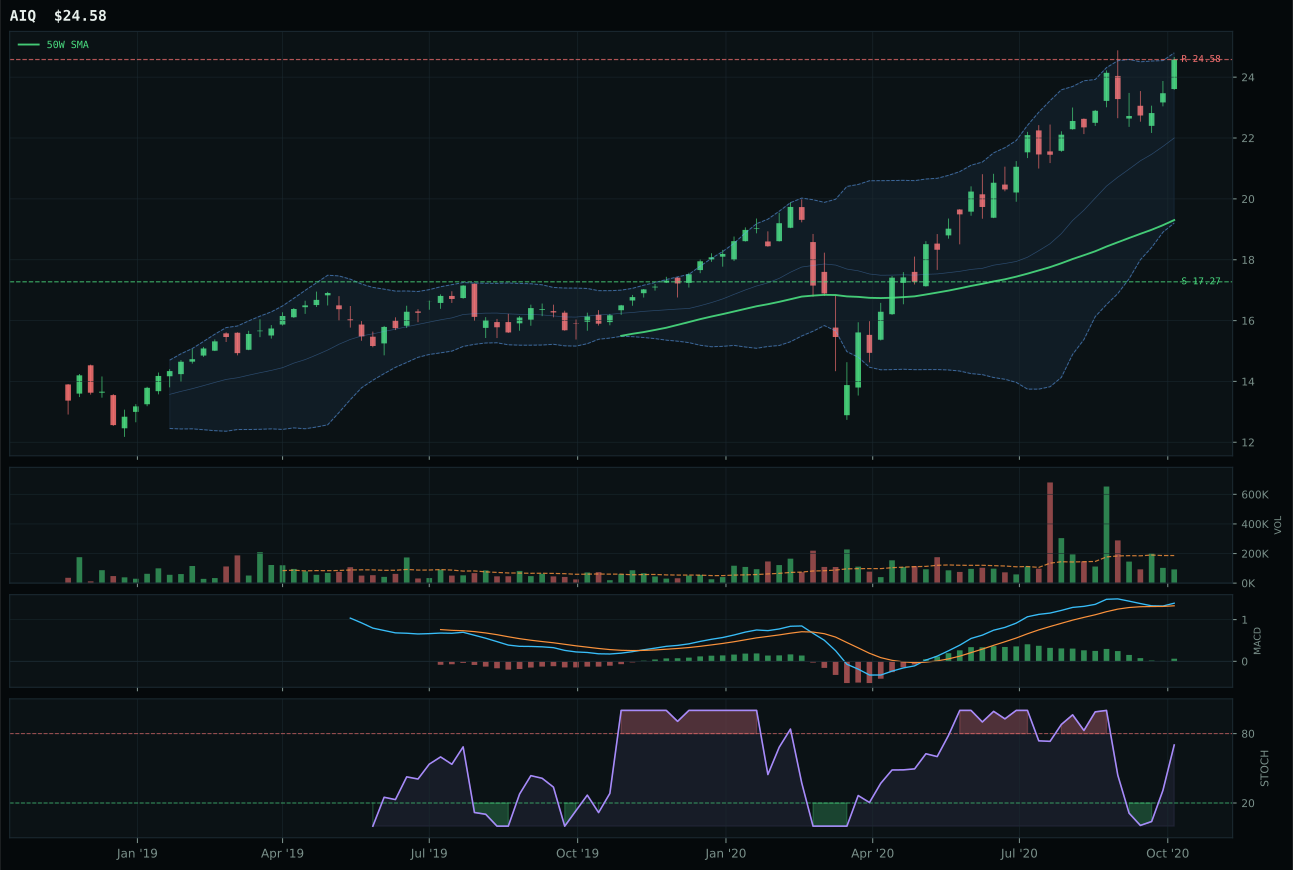
AIQ has a vertical extension profile with 2.0% 13-week relative strength versus SPY.
A failed hold above support would weaken the setup.
Tracked, but not top-2 eligible because: .
SMH captures the AI category on a razor-thin 0.2-point margin over BOTZ, winning through superior category-relative strength and fractionally cleaner structure rather than dramatic technical separation. The semiconductor play posts a perfect 100.0 momentum confirmation score on 16.7% 13-week returns and 7.5% outperformance versus SPY, delivered through neutral 0.88x volume participation that suggests accumulation rather than capitulation. Both BOTZ and SMH sit in identical vertical extension setups with overbought stochastic RSI readings at the 52-week high, yet SMH's 78.3 structure score edges BOTZ's 77.3 by holding greater cleanliness and compression integrity. BOTZ sacrifices positioning by running neutral category-relative strength (0.0% versus 0.2%), a technical detail that compounds given how tight the category decision truly is—this is leadership by execution quality, not by a dominant chart setup.
AI secured a 10% top-2 allocation after posting a 61.9 composite score, second-highest among all eligible categories and driven by extraordinary macro alignment. The AI growth sponsorship descriptor contributes +14 at the category level and +14 specifically for SMH, towering over credit stress's -8 headwind and cementing this category as a structural beneficiary in the current regime. Goldilocks itself adds +10 to the category fit, meaning the macro environment is actively supportive rather than merely permissive. SMH's 100.0 trend score and 100.0 momentum confirmation reflect a name catching the broadest wave of institutional buying power within semiconductor and compute hardware—this is not a mean-reversion candidate but a trending leader with fresh confirmation. The 10% position size reflects genuine macro tailwind combined with technical sponsorship; without the AI descriptor active, this category would rank meaningfully lower.
Emerging Markets — INDA
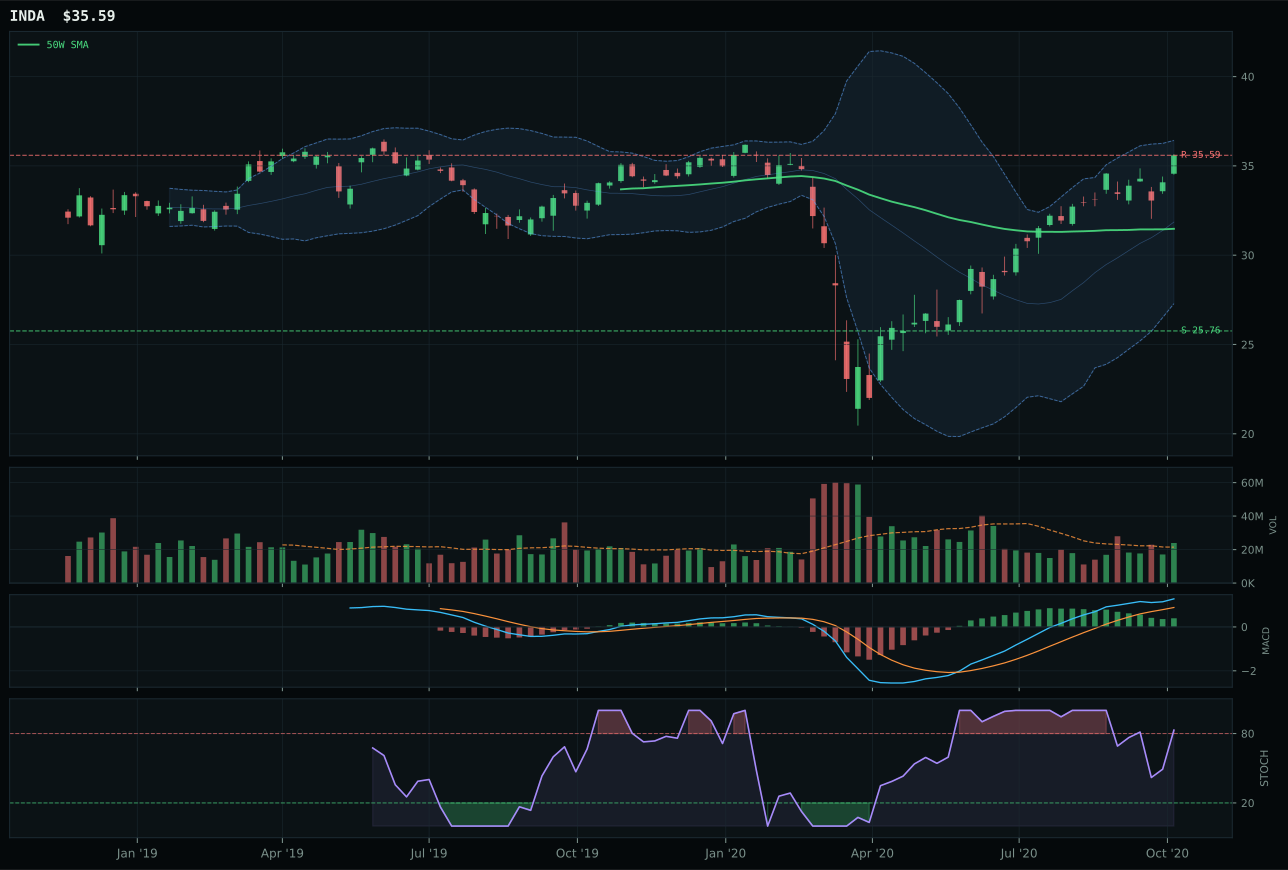
INDA has a neutral structure profile with 6.4% 13-week relative strength versus SPY.
A failed hold above support would weaken the setup.
Actionable but governed by invalidation levels.
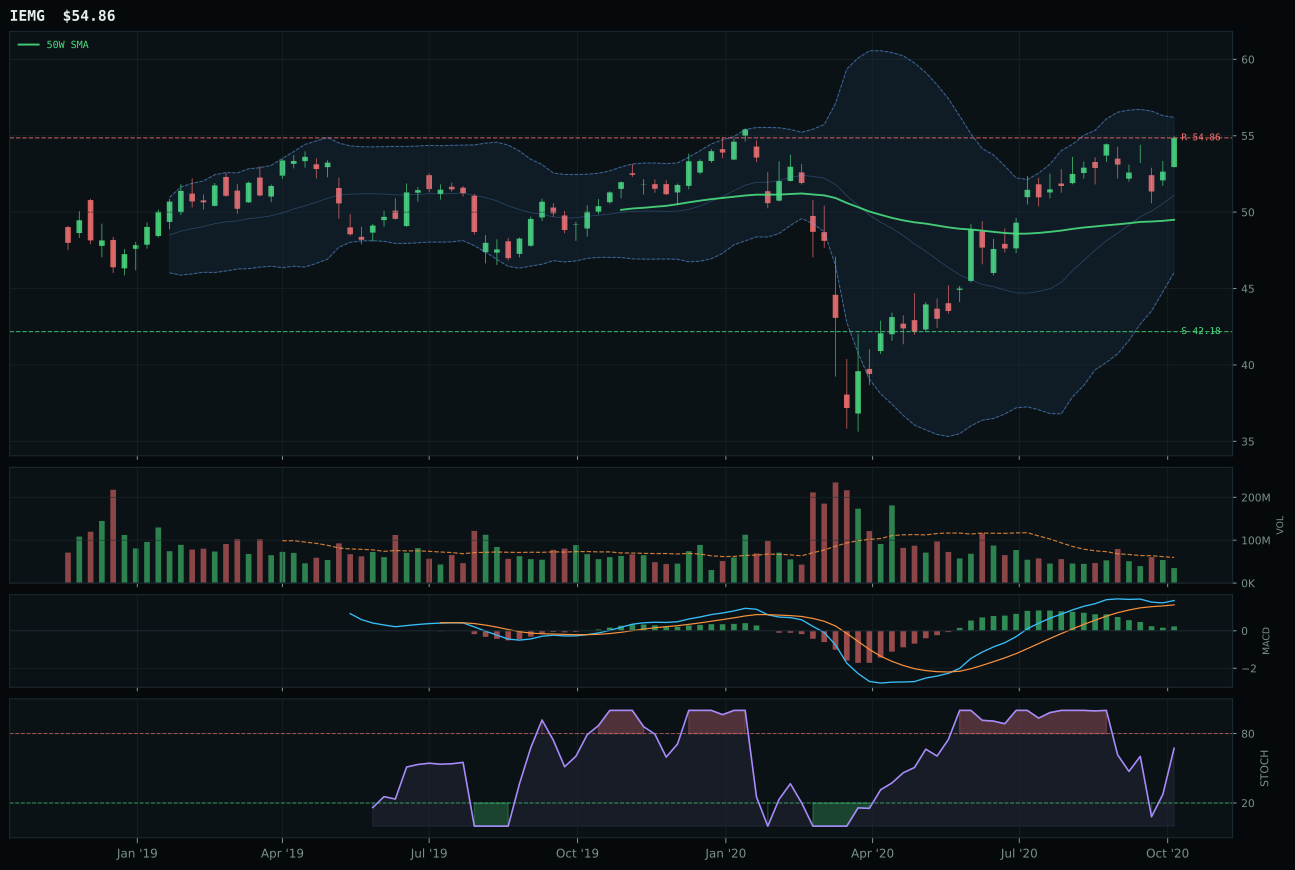
IEMG has a neutral structure profile with -2.6% 13-week relative strength versus SPY.
A failed hold above support would weaken the setup.
Actionable but governed by invalidation levels.
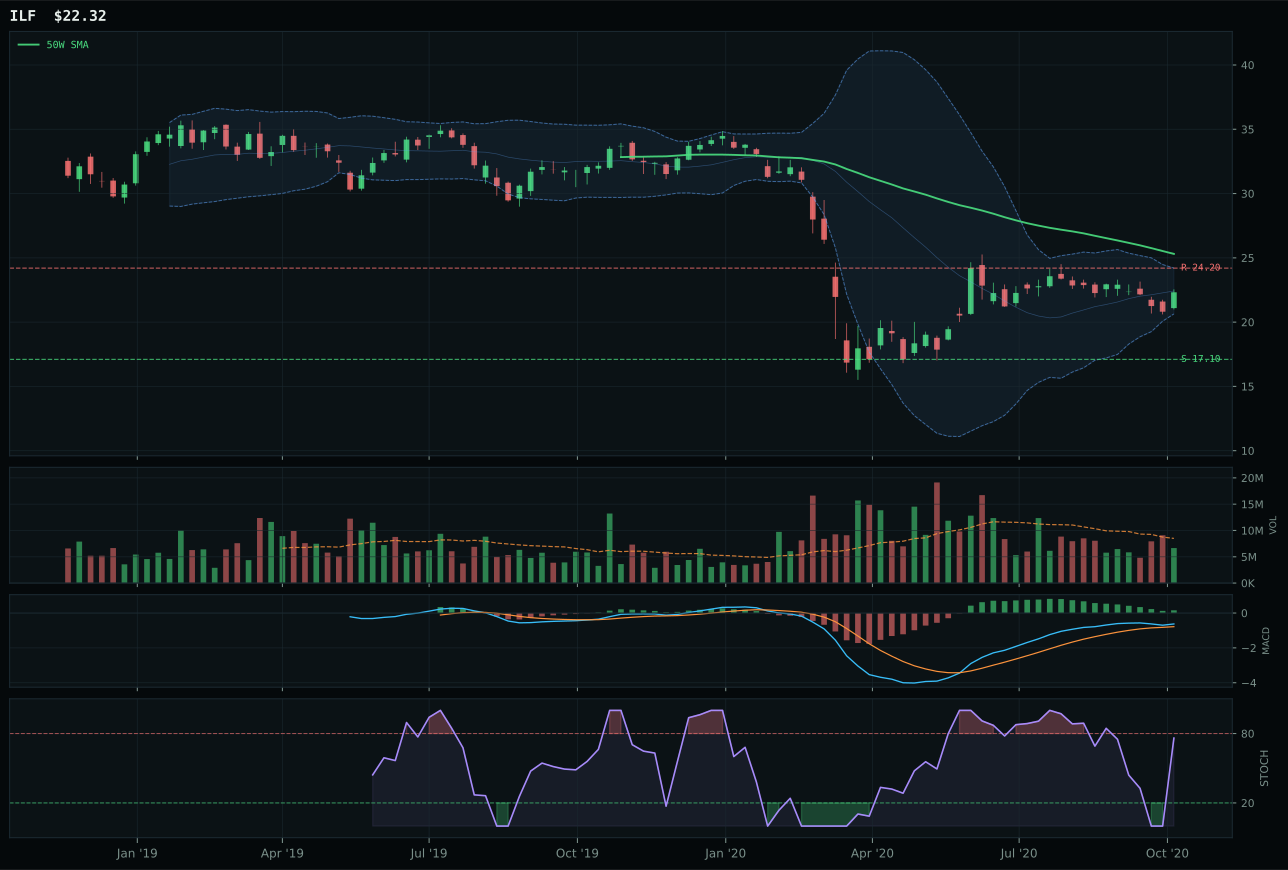
ILF has a neutral structure profile with -10.5% 13-week relative strength versus SPY.
Extension and support failure are the main tactical risks.
Tracked, but not top-2 eligible because: structurally broken.
INDA captures emerging markets decisively, posting 15.6% 13-week returns paired with 6.4% SPY outperformance and 9.0% category-relative strength that towers over IEMG's flat 0.0% category spread. The India-focused play benefits from above-average 1.12x volume participation backing a 100.0 momentum confirmation score, while the structure integrity at 82.5 (versus IEMG's 75.4) reflects cleaner price compression and higher quality setup expansion. INDA's perfect 100.0 trend score and neutral structure position create the exact conditions the reasoning layer prioritizes—genuine sponsorship from both technical accumulation and relative strength. IEMG's thin participation and rising-mid-zone stochastic positioning represent a fresher momentum signal, yet without the category leadership and volume confirmation that INDA demonstrates, the runner-up lacked sufficient breadth to justify selection. The 8.8-point category score gap reflects INDA's complete technical dominance within the emerging-markets basket.
Emerging markets earned 5% as a tier-2 category after posting 57.8, ranking fifth overall and capturing meaningful macro support from EM liquidity sponsorship without breaking into top-2 conviction territory. The category-level macro fit of 62.0 benefits from Goldilocks itself (+8) and EM liquidity support (+14), creating a +22 total tailwind offset only partially by credit stress (-10). INDA's 85.8 technical evidence score exceeds most tier-2 peers, yet the category's 50.0 macro narrative fit—derived from EM liquidity support without additional specific descriptor alignment—constrains allocation to the 5% tier. The portfolio structure prioritizes AI and Utilities because those categories command both strong technical evidence and multiple descriptor tailwinds; INDA's exceptional 9.0% category-relative strength and volume confirmation position it as a quality growth alternative within the tier-2 band. For emerging markets to elevate to 5% allocation, either INDA's technical score would need to reach 90+, or external macro conditions would need to activate additional descriptors (such as commodity breadth or EM currency positioning) that are currently neutral or inactive.
Industrial Metals — REMX
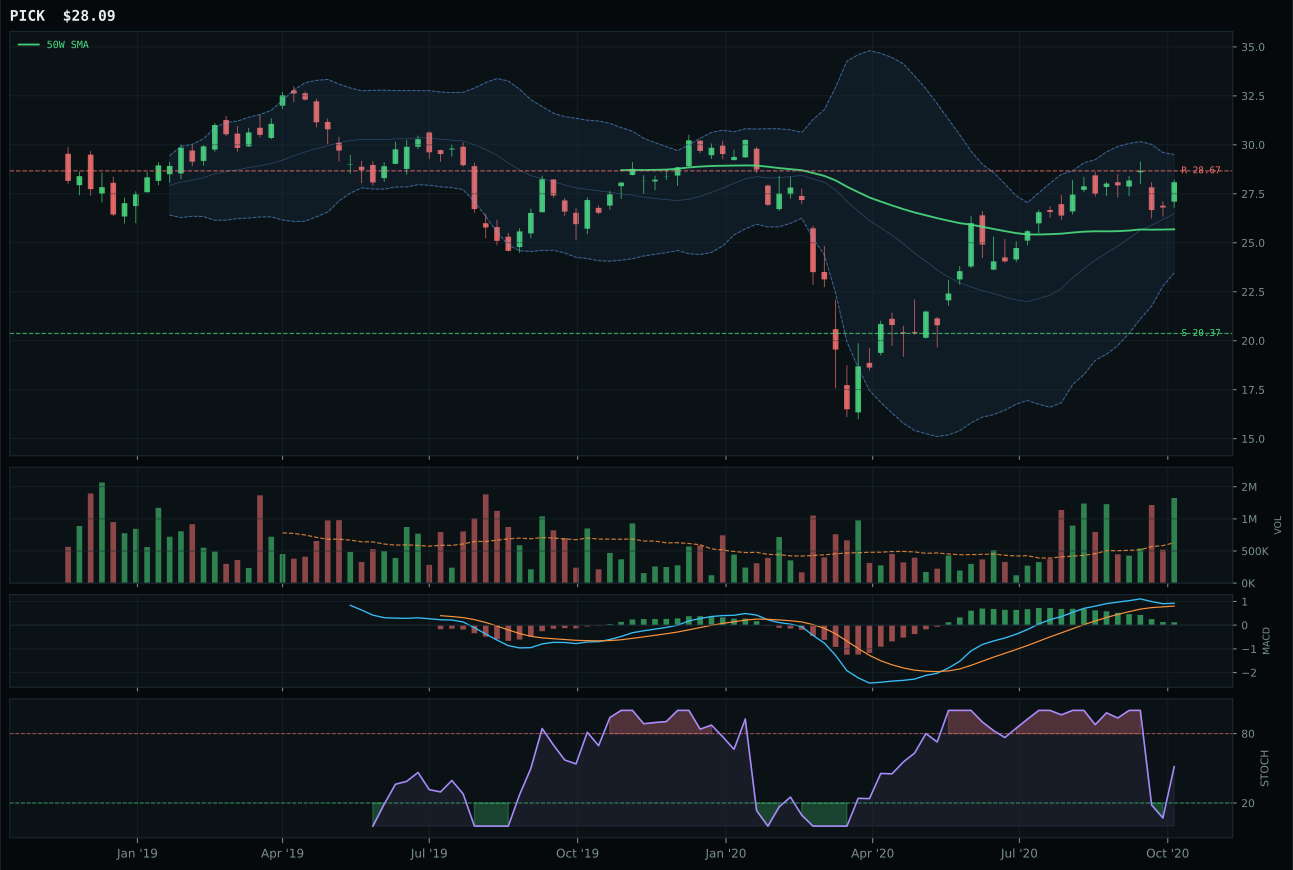
PICK has a neutral structure profile with 0.6% 13-week relative strength versus SPY.
A failed hold above support would weaken the setup.
Actionable but governed by invalidation levels.
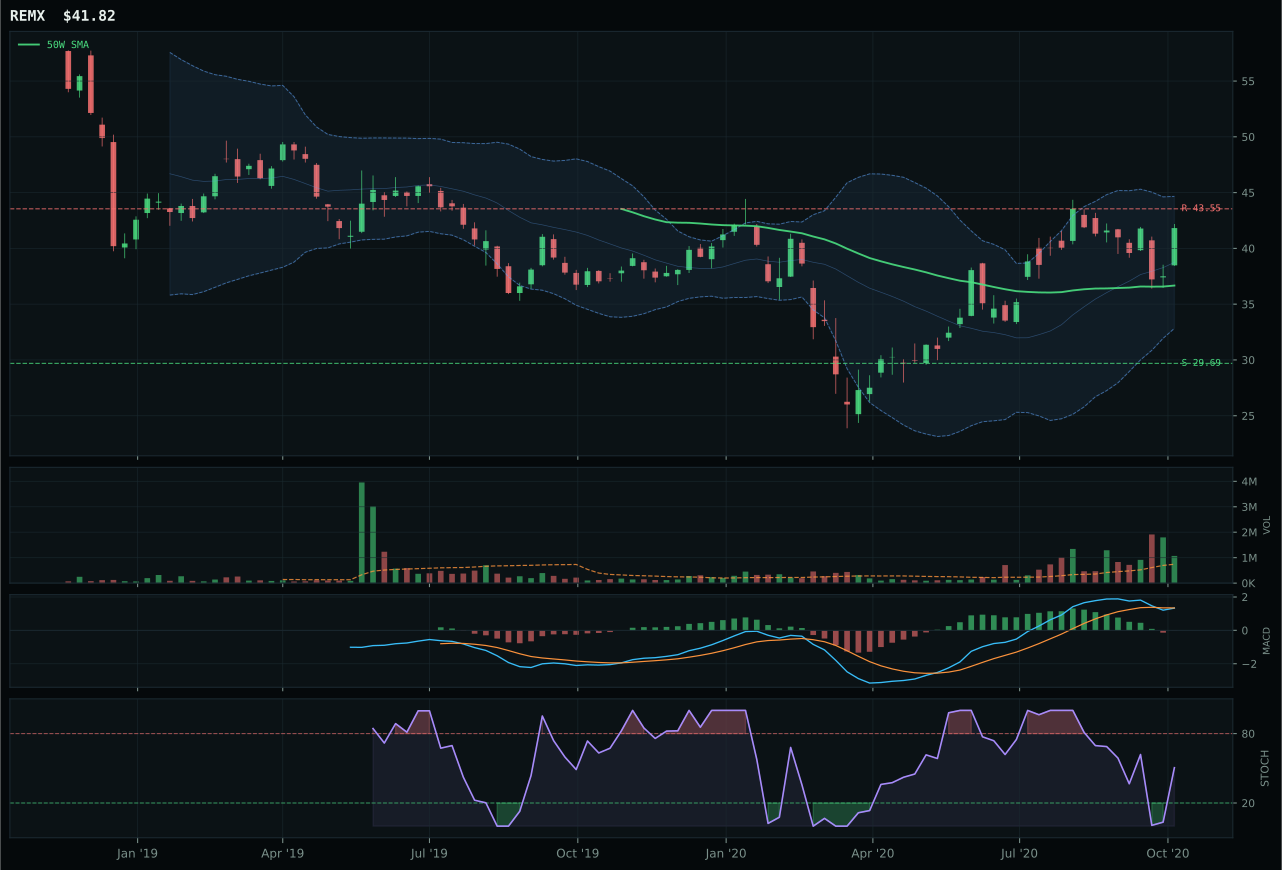
REMX has a neutral structure profile with -1.5% 13-week relative strength versus SPY.
A failed hold above support would weaken the setup.
Actionable but governed by invalidation levels.
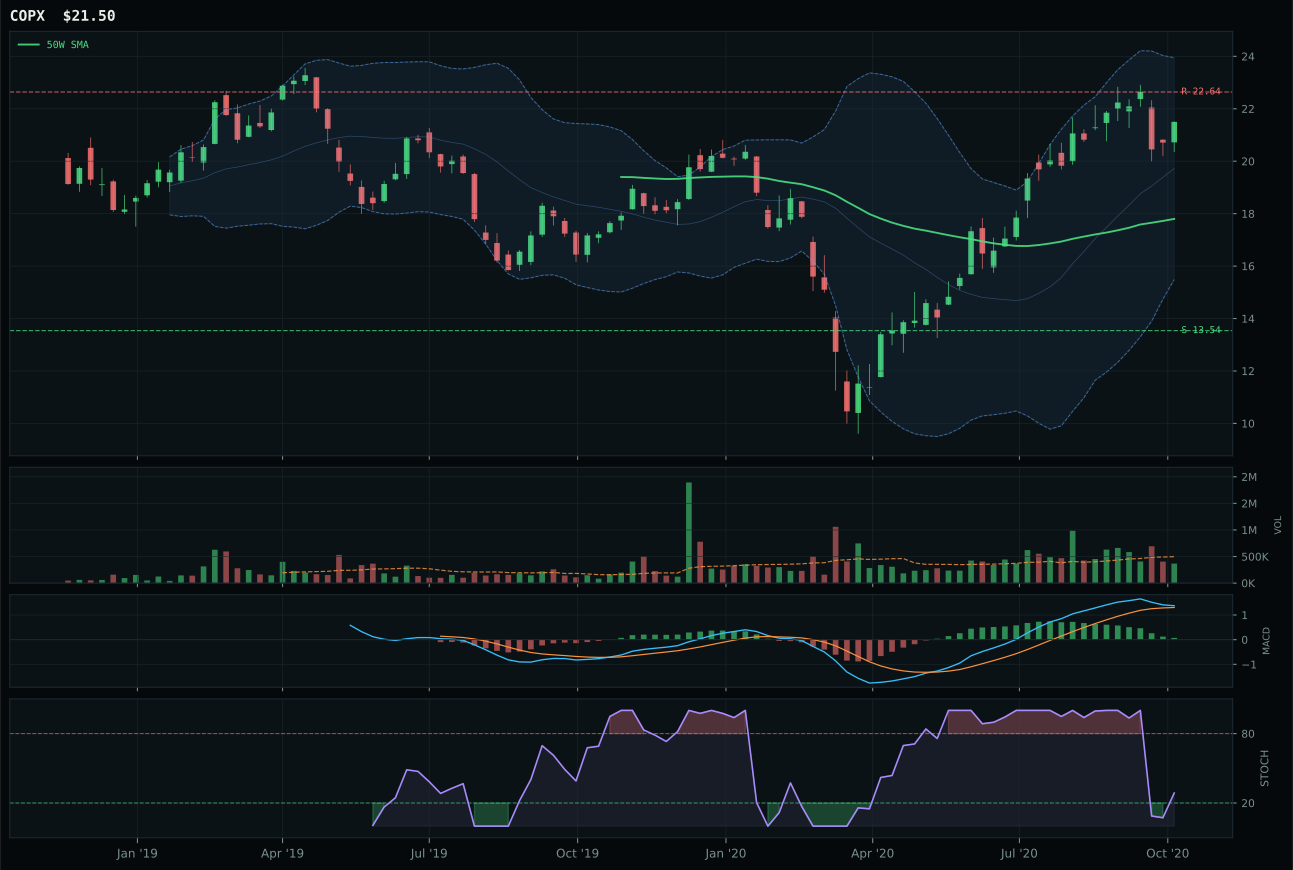
COPX has a vertical extension profile with 2.0% 13-week relative strength versus SPY.
A failed hold above support would weaken the setup.
Tracked, but not top-2 eligible because: .
REMX wins industrial metals despite a lower 50.0 reasoned technical score versus PICK's 71.2, capturing the category win through superior macro narrative fit in a regime where metals scarcity (+9) and AI growth sponsorship (+4) create genuine tailwinds. REMX's rare earth supply-chain positioning aligns directly with the active descriptor set, whereas PICK's 71.8 technical evidence—built on 9.8% 13-week returns, neutral volume, and bullish-flattening MACD—represents technical cleanliness that lacks macro amplification. Both setups operate in neutral structure in the upper retracement zone, yet REMX's category-relative strength of -2.1% and bearish-weakening MACD reflect a name more dependent on narrative conviction than momentum proof, creating technical tension that the macro case must justify. The 3/2/1 weighted basket prioritizes PICK first, but the category reasoner tests that basket against macro state and active descriptors, elevating REMX as the representative because its specialized positioning captures the metals scarcity theme more directly than diversified mining breadth.
Industrial metals earned 5% as a tier-2 category after posting 54.6, ranking fourth overall and capturing genuine macro sponsorship that Technology and other categories cannot match. The category-level macro fit of 79.0 is the second-highest among all ten categories, driven by Goldilocks itself (+6), metals scarcity (+14), commodity breadth positive (+10), and real asset sponsorship (+6), offset only partially by credit stress (-7). This exceptional macro weighting explains why a 54.6 score lands in the allocation tier despite lower absolute technical evidence than some tier-2 peers—the category benefits from multiple descriptor alignments in the current regime. REMX specifically captures the rare-earth supply angle that semiconductor growth and AI compute infrastructure demand, creating a targeted macro bet rather than a broad-based commodity play. The 5% position reflects conviction in the structural metals scarcity narrative; to break into tier-1 (10%), this category would require either a material widening in the technical score or confirmation that disinflation pressure is easing, which would remove one of the few headwinds currently weighing on industrial metals allocation.
Technology — IGV
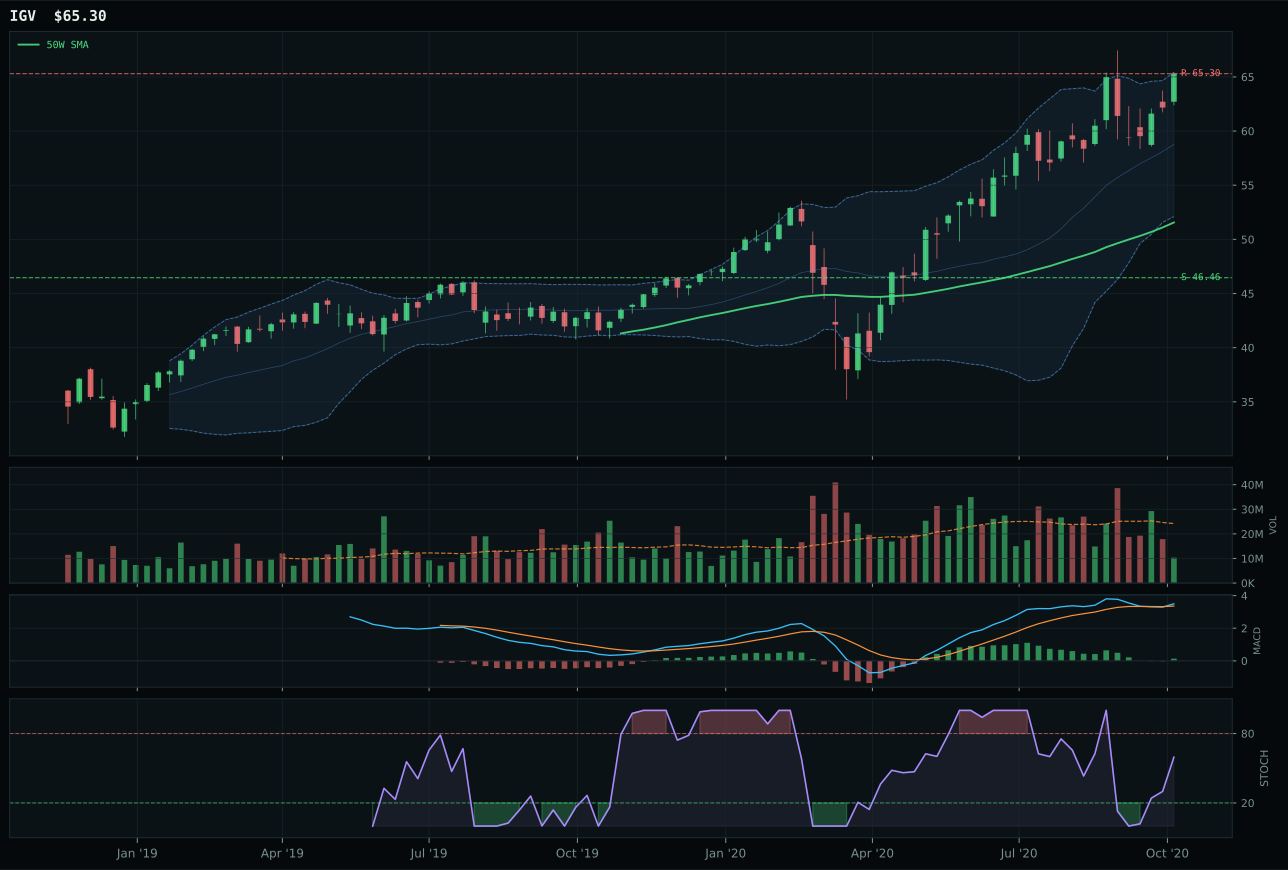
IGV has a vertical extension profile with 0.3% 13-week relative strength versus SPY.
A failed hold above support would weaken the setup.
Actionable but governed by invalidation levels.
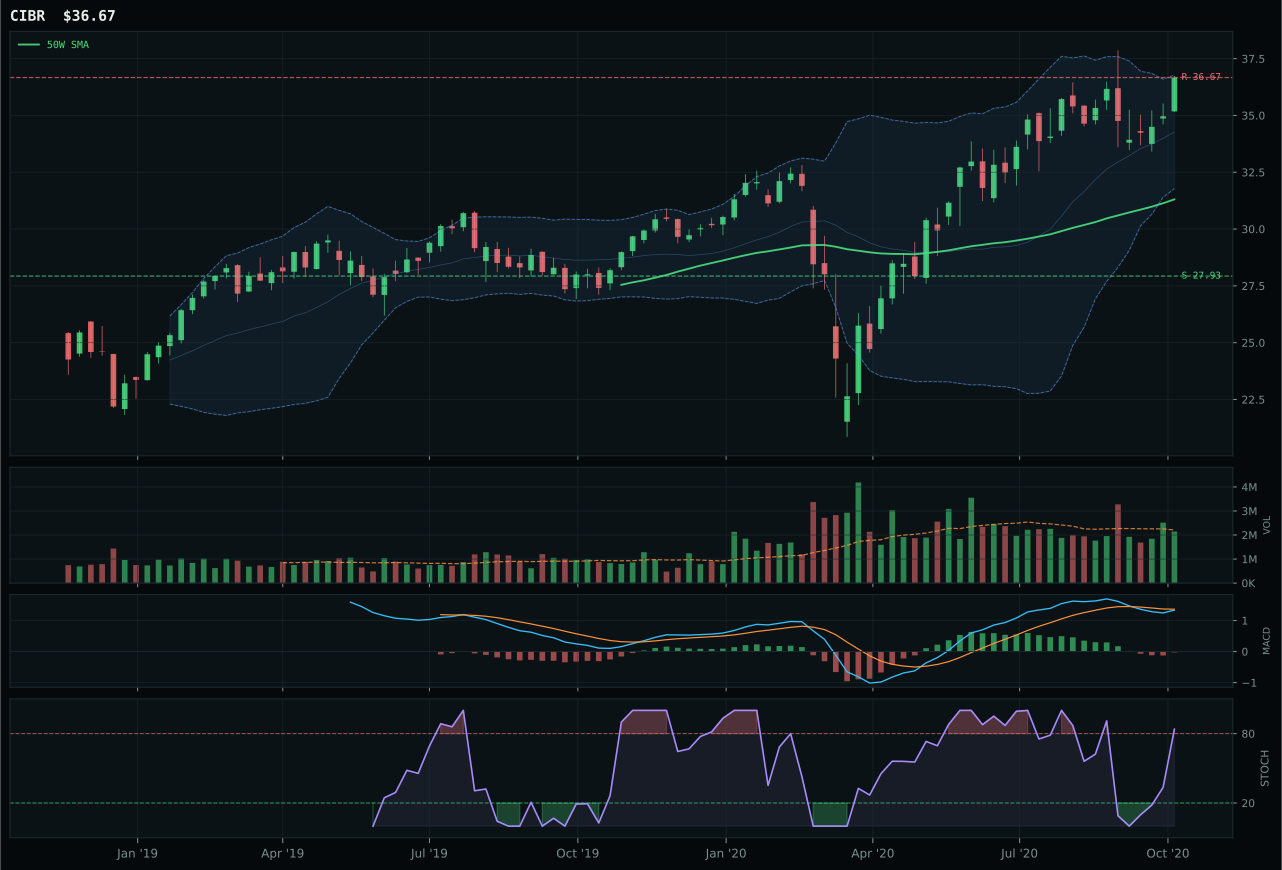
CIBR has a vertical extension profile with -3.9% 13-week relative strength versus SPY.
A failed hold above support would weaken the setup.
Actionable but governed by invalidation levels.
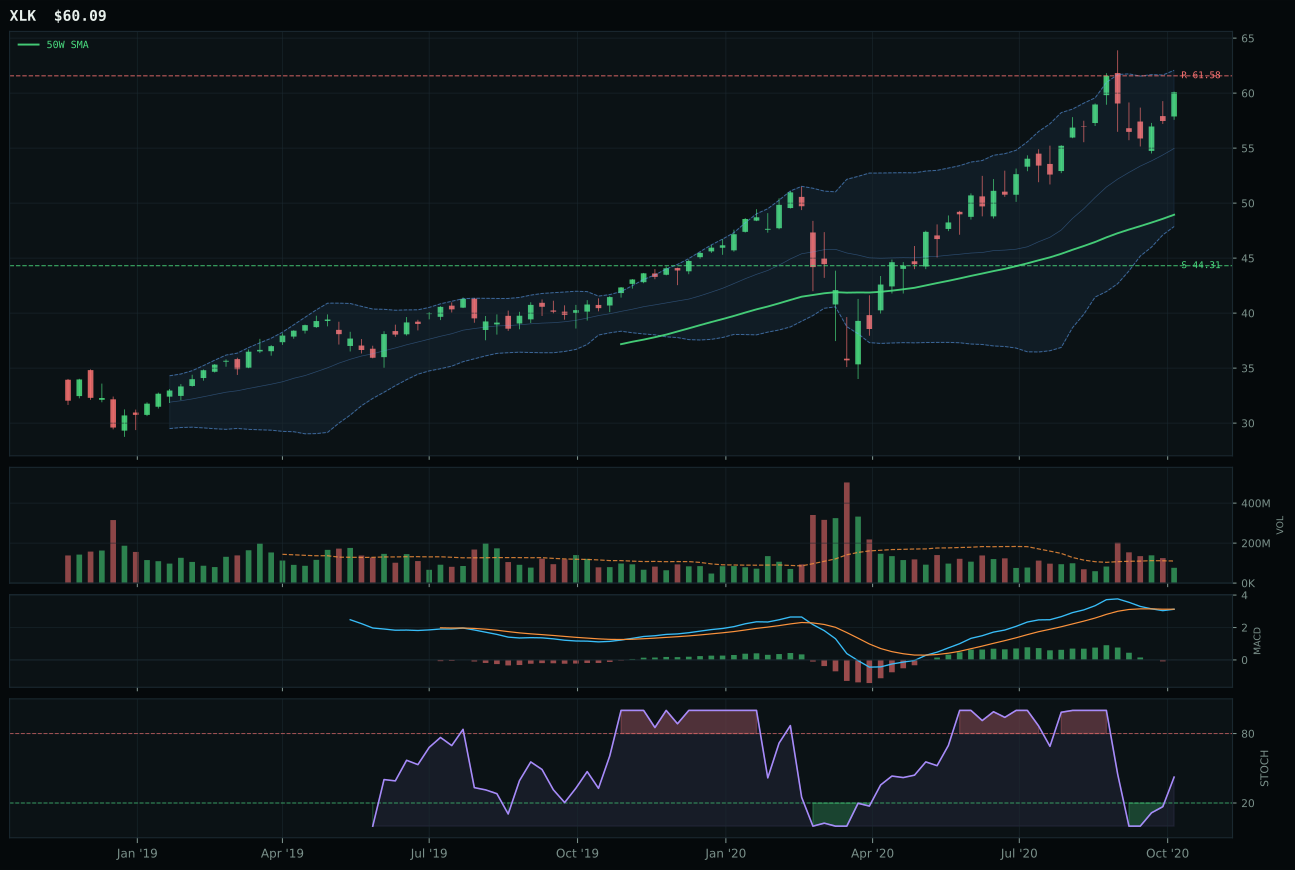
XLK has a vertical extension profile with 2.0% 13-week relative strength versus SPY.
A failed hold above support would weaken the setup.
Actionable but governed by invalidation levels.
IGV wins the category by maintaining price above both the 50-week and 200-week moving averages with a stable 0.9% slope, translating to clean uptrend structure even as the chart sits extended at 26.7% above the 50W. The 13-week return of 9.5% paired with neutral category-relative strength (0.0%) shows measured momentum without the frothy overextension that plagued CIBR, which posted a negative -4.2% category spread and suffered from a bearish-weakening MACD and overbought stochastic positioning. IGV's timing score of 48.0 versus CIBR's 32.0 reflects a chart sitting in a cleaner decision zone rather than deep overbought momentum territory. Volume at 0.43x the 20-week average signals thin participation, yet the trend score of 96.4 and bullish-but-flattening MACD provide enough sponsorship to justify the selection despite the vertical extension setup penalizing entry risk.
Technology earned a 5% allocation as a tier-2 category, sitting below the two top-2 overweights in the portfolio hierarchy. The 46.4 composite score ranked outside the AI and Utilities categories that captured the 10% sleeves, held back by a 48.0 timing score that reflects the extended position and by macro conditions that offer only modest tailwinds—disinflation pressure provides a +5 boost but credit stress drains -7 points. In the Goldilocks regime, technology's AI growth sponsorship carries genuine weight at +6, yet the category's 63.0 macro fit trails other eligible candidates because pure growth exposure lacks the real-asset or infrastructure sponsorship now driving allocations. IGV's strength is undeniable on a technical basis, but the 5% slot recognizes that two higher-scoring categories presented better risk-adjusted entries this week.
Precious Metals — GLD
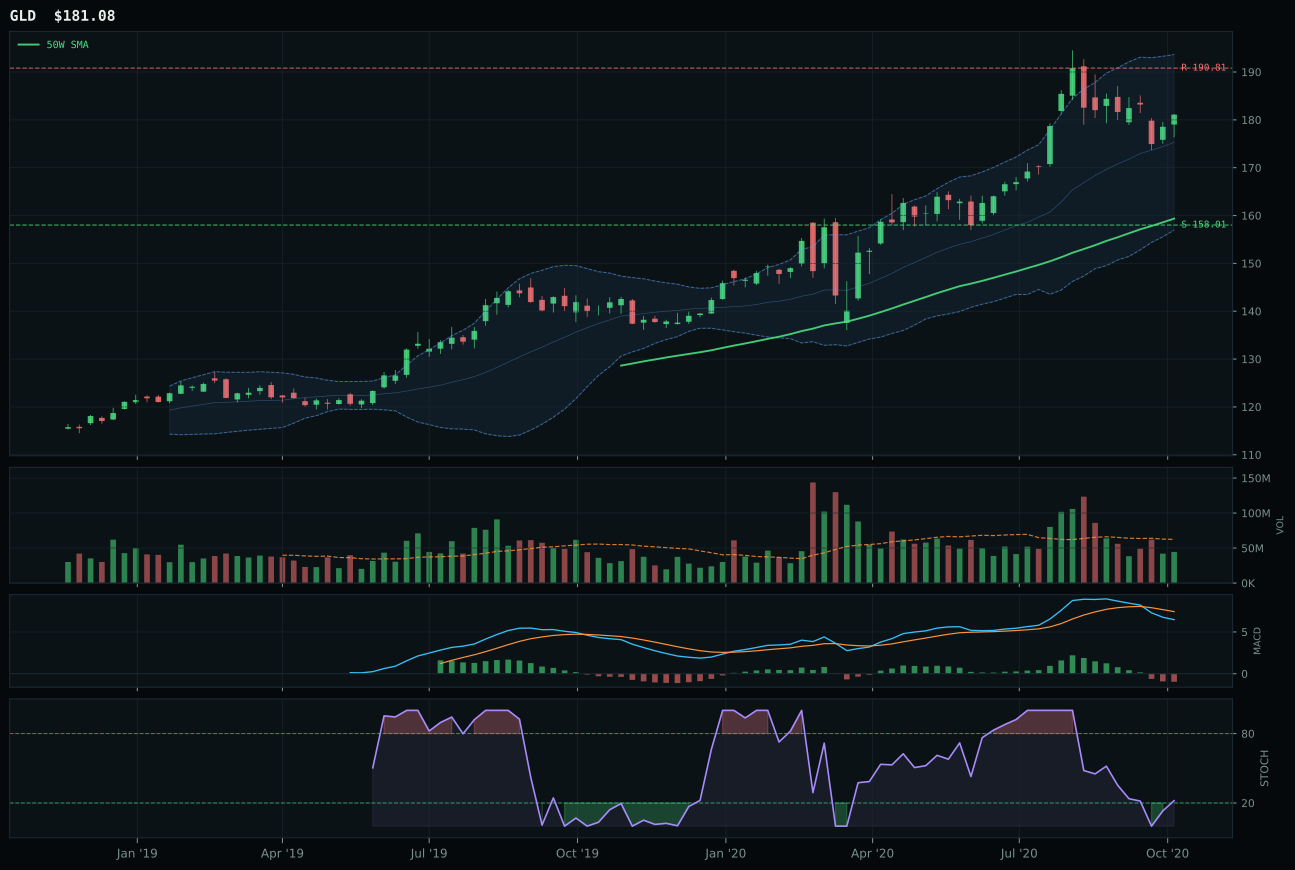
GLD has a neutral structure profile with -2.2% 13-week relative strength versus SPY.
A failed hold above support would weaken the setup.
Actionable but governed by invalidation levels.
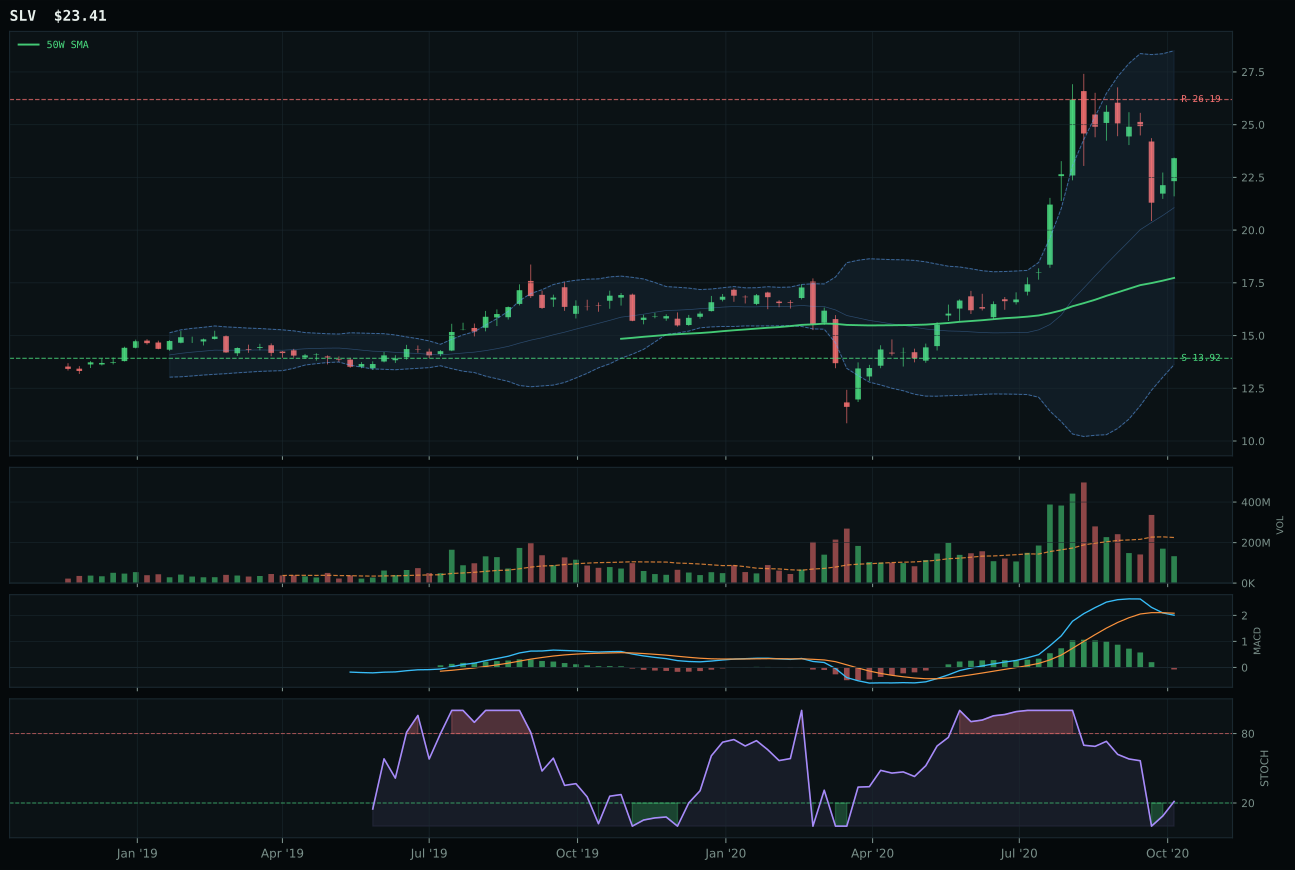
SLV has a vertical extension profile with 25.1% 13-week relative strength versus SPY.
A failed hold above support would weaken the setup.
Actionable but governed by invalidation levels.
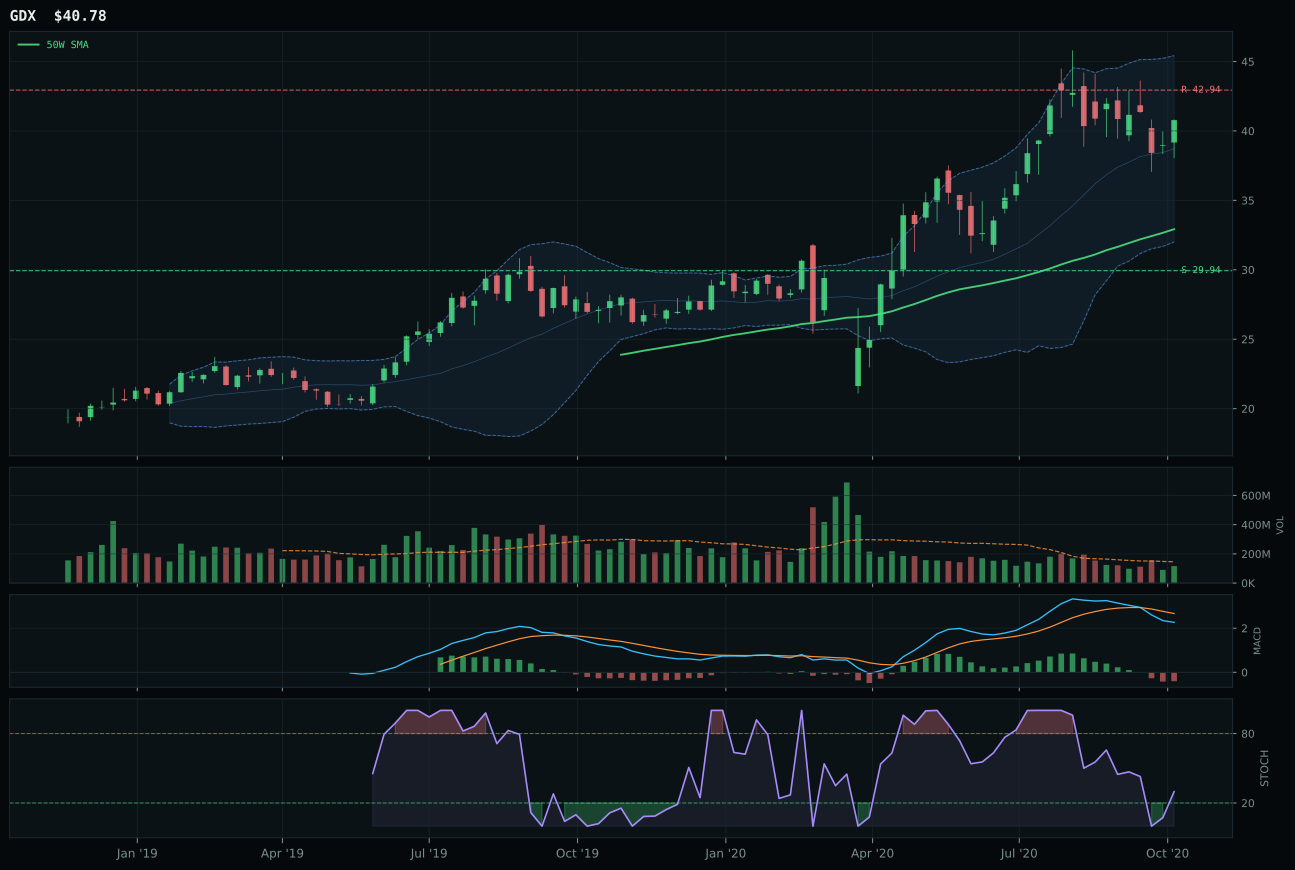
GDX has a vertical extension profile with -3.0% 13-week relative strength versus SPY.
A failed hold above support would weaken the setup.
Actionable but governed by invalidation levels.
GLD captures precious metals despite a 45.6 composite score that ranks below multiple tier-2 categories, winning on timing positioning rather than momentum strength. The 78.0 timing score reflects optimal distance to the 50-week moving average at 13.6%—neither extended into capitulation nor deep underwater—positioned in the upper retracement zone where risk-reward asymmetry (51.3) favors downside protection over upside grab. SLV's 34.3% 13-week return and 25.1% SPY outperformance created explosive momentum confirmation (100.0 score), yet SLV's 32.0% extension and falling-neutral stochastic RSI reading revealed a move extended beyond structural support; GLD's bearish-weakening MACD faced identical weakness, but the chart's 13.6% distance-to-50W versus SLV's 32.0% created a 30-point advantage in timing score (78.0 vs 48.0). GLD's rising-mid-zone stochastic at 0.22 provided fresher setup potential than SLV's falling momentum, justifying the 15.1-point category win despite losing the momentum race outright.
Precious metals earned a 5% tier-2 allocation after scoring 45.6, placing it seventh among ten categories and reflecting a macro environment that offers no structural sponsorship for gold. Disinflation pressure provides +6 support at the category level, yet without credit stress acceleration or explicit monetary easing, gold trades as insurance rather than opportunity. The category-level macro fit of 56.0 lags peers because no dedicated descriptor strongly favors precious metals in a Goldilocks regime—real asset sponsorship is present elsewhere (industrial metals benefit more directly), and the lack of inflation acceleration removes the traditional structural bid. GLD's technical positioning keeps it allocation-worthy as a 5% diversification hedge, but investors should view this as a portfolio insurance sleeve rather than a conviction bet. A deterioration in credit metrics or a shift in central bank policy language would be required to elevate precious metals to tier-1 positioning; until then, the 5% allocation represents balanced risk management in a regime that favors growth and real assets over monetary hedges.
Agriculture & Livestock — MOO
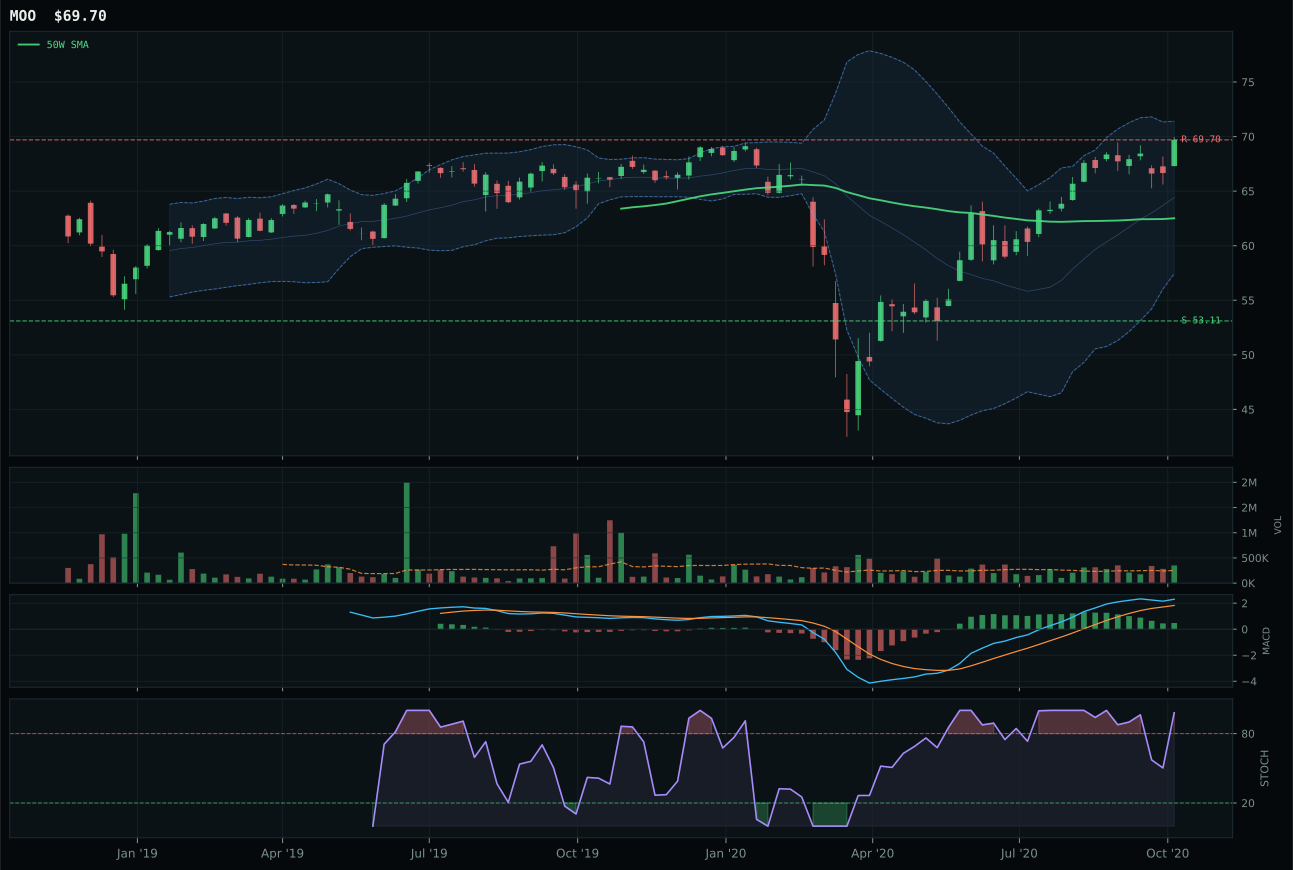
MOO has a neutral structure profile with 6.3% 13-week relative strength versus SPY.
A failed hold above support would weaken the setup.
Actionable but governed by invalidation levels.
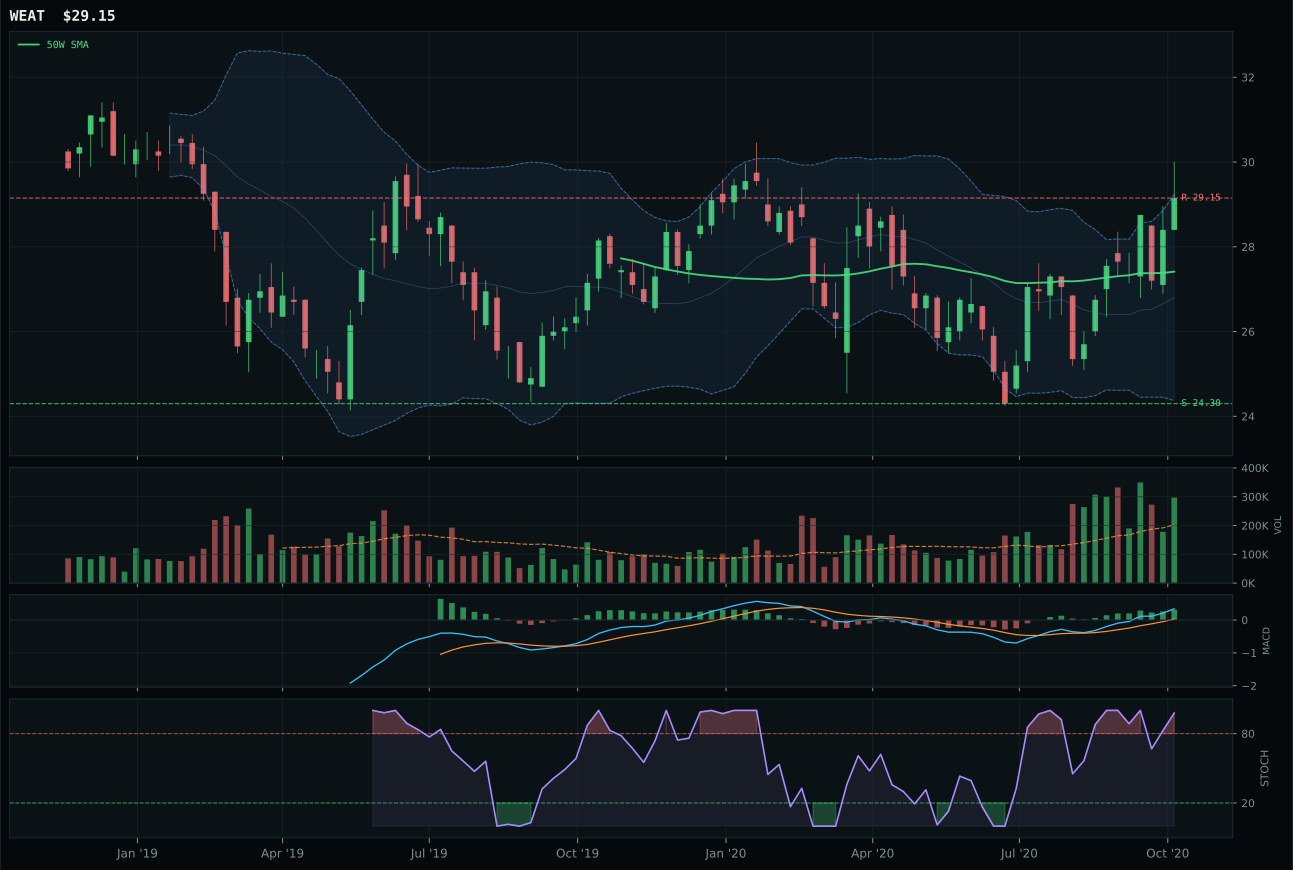
WEAT has a neutral structure profile with -1.4% 13-week relative strength versus SPY.
A failed hold above support would weaken the setup.
Tracked, but not top-2 eligible because: .
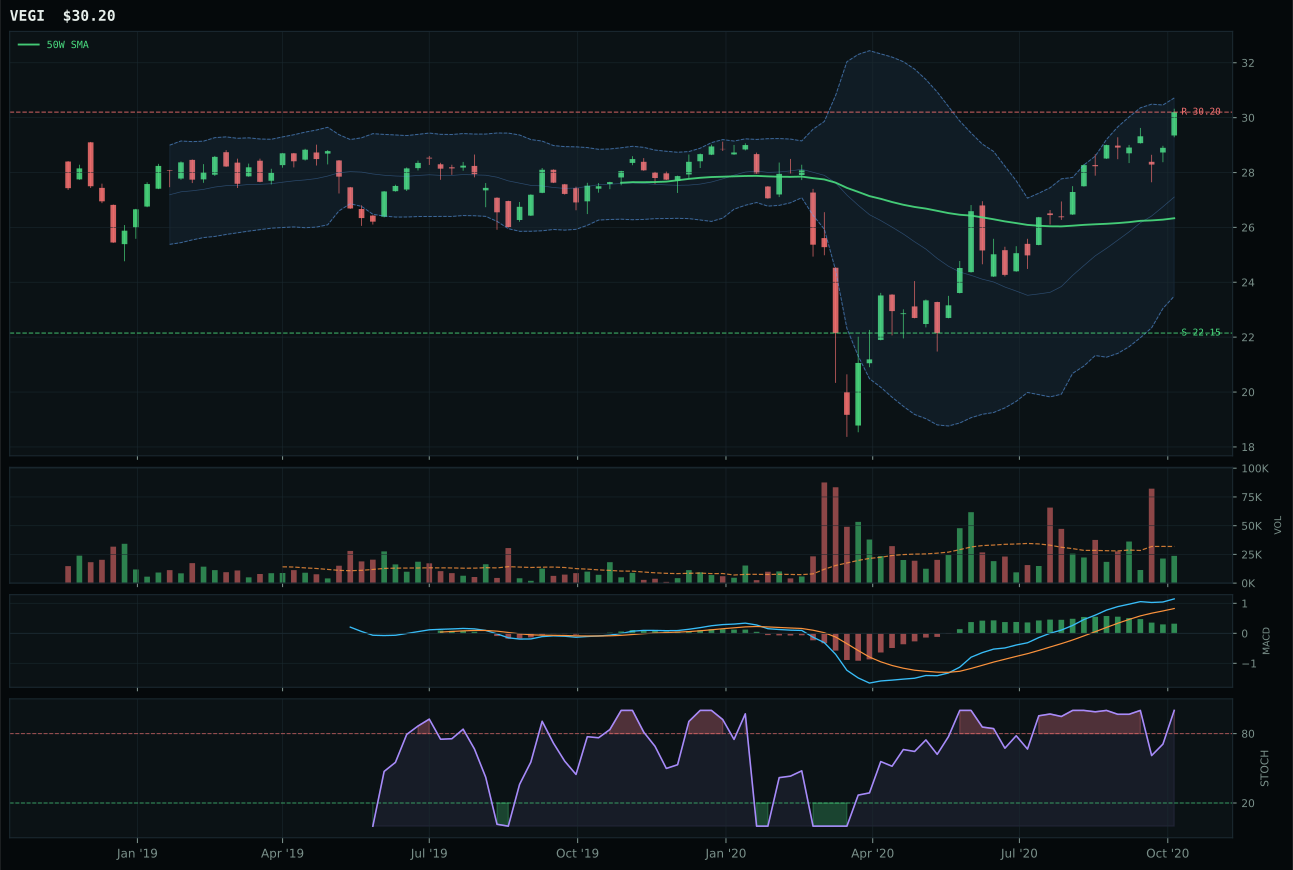
VEGI has a neutral structure profile with 11.7% 13-week relative strength versus SPY.
A failed hold above support would weaken the setup.
Tracked, but not top-2 eligible because: .
MOO dominates agriculture on the basis of pure technical sponsorship, posting a 100.0 trend score from price strength above both moving averages with perfect 0.1% slope, paired with an exceptional 90.3 momentum confirmation that reflects 15.5% 13-week returns and 6.3% SPY outperformance. The neutral structure setup combined with above-average 1.39x volume participation creates the exact conditions the reasoning layer seeks—breadth, liquidity, and relative strength all aligned. WEAT's 7.8% 13-week return and -7.7% category-relative strength created a 31.6-point score gap that was never competitive; WEAT's bullish-and-improving MACD offered fresher momentum signals but lacked the volume confirmation or category leadership positioning that MOO's 2.06x accumulation profile demonstrated. The setup extends into the 52-week high zone, but volume strength and category dominance (+12.4% category relative) validate the extension rather than penalize it.
Agriculture earned a 5% tier-2 allocation despite a 37.5 composite score that reflected solid technical merit but insufficient macro alignment for top-2 consideration. Real asset sponsorship contributes +8 and commodity breadth positive adds +5 to the category macro fit of 55.0, yet disinflation pressure subtracts -8 points, creating a net neutral macro environment. MOO's 79.6 technical evidence score alone is sufficient to justify a 5% sleeve, but the absence of strong category-level tailwind prevents elevation to the 10% tier. The Goldilocks regime itself offers only modest support, and broader commodity narratives lack the urgency that AI hardware or infrastructure capex currently command. MOO's volume profile and momentum remain genuine strengths, but the 5% position acknowledges that agricultural allocations trade at a macro discount in the current descriptor set; investors would need to see commodity breadth accelerate further or disinflation pressure ease for this category to compete at higher tiers.
Defense & Aerospace — XAR
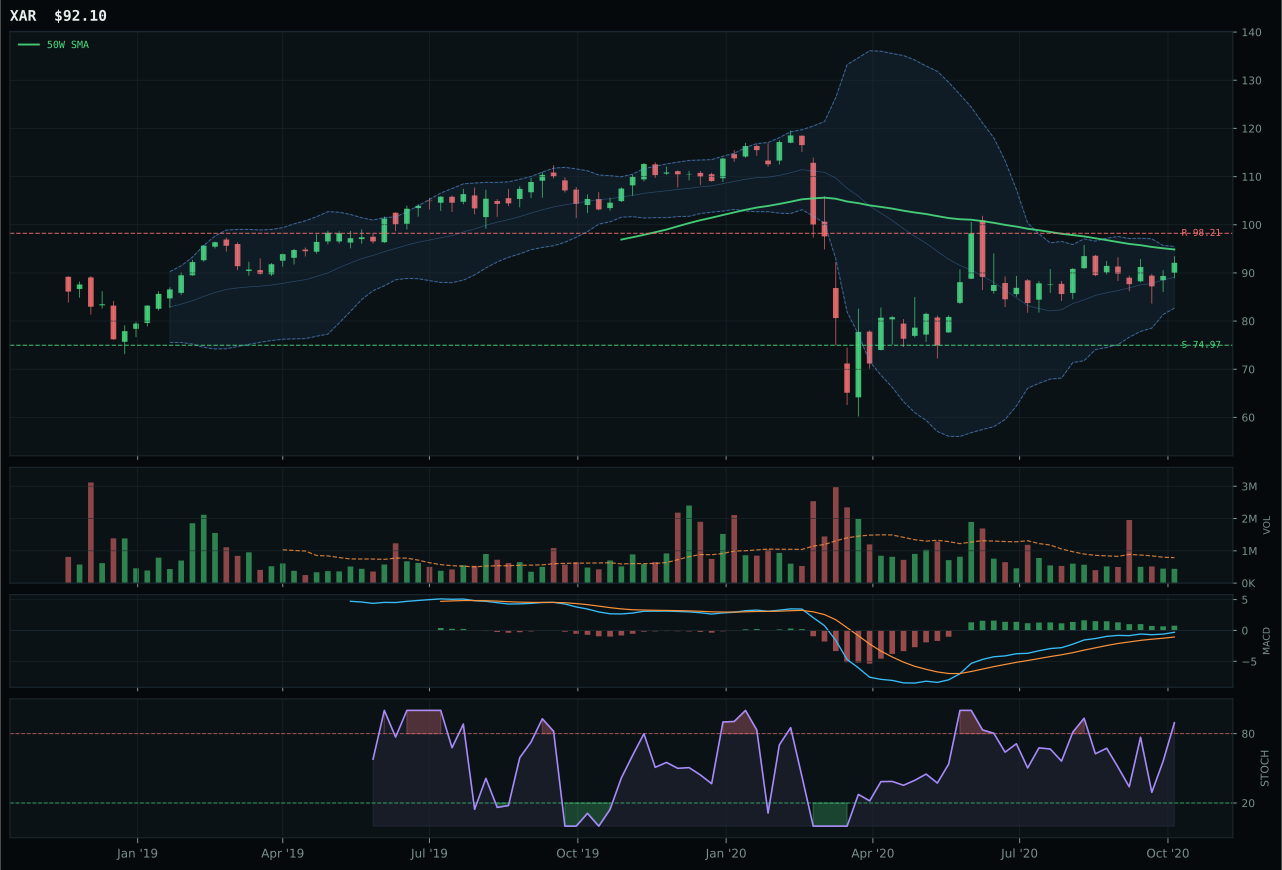
XAR has a compression near 50W profile with 0.8% 13-week relative strength versus SPY.
A failed hold above support would weaken the setup.
Actionable but governed by invalidation levels.
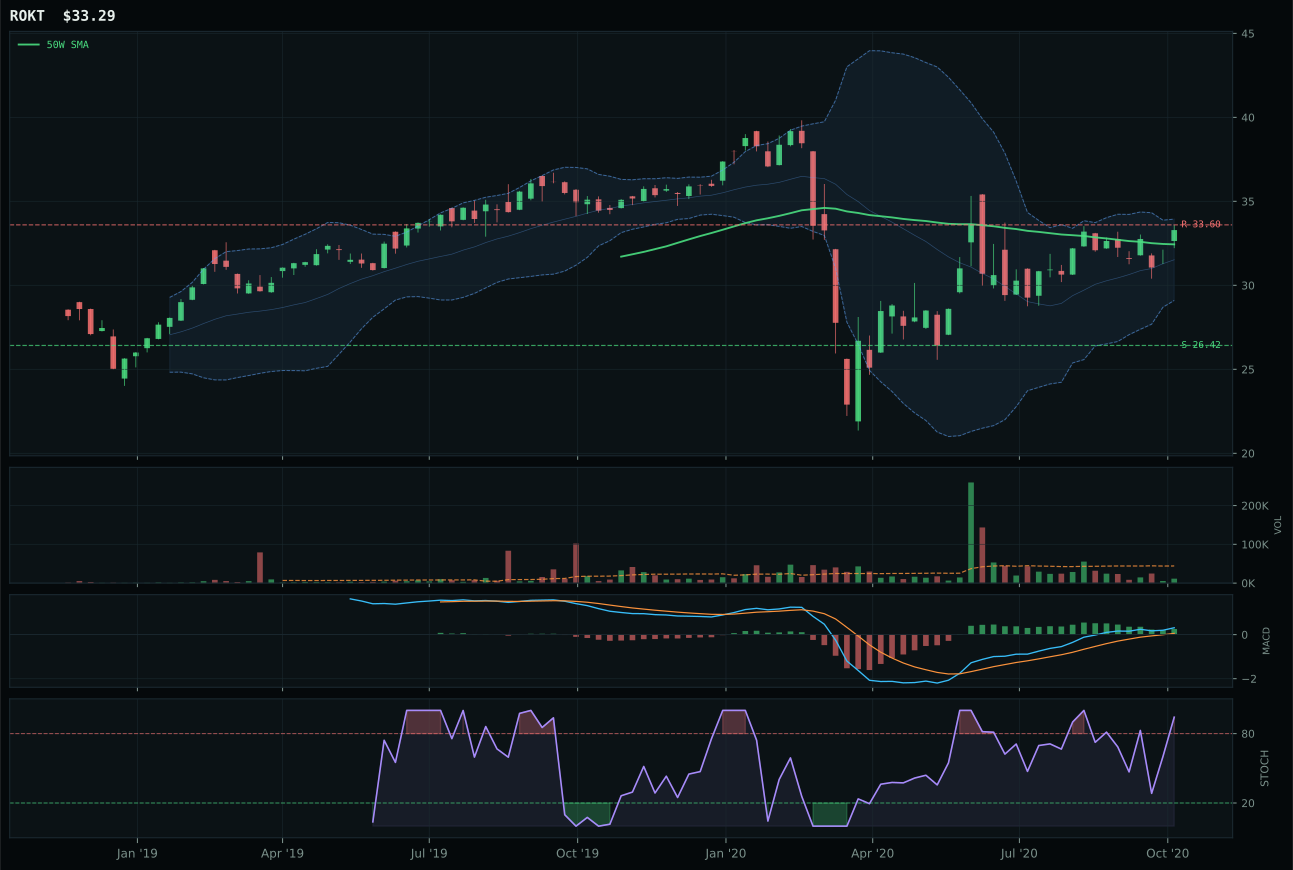
ROKT has a compression near 50W profile with 4.5% 13-week relative strength versus SPY.
A failed hold above support would weaken the setup.
Tracked, but not top-2 eligible because: .
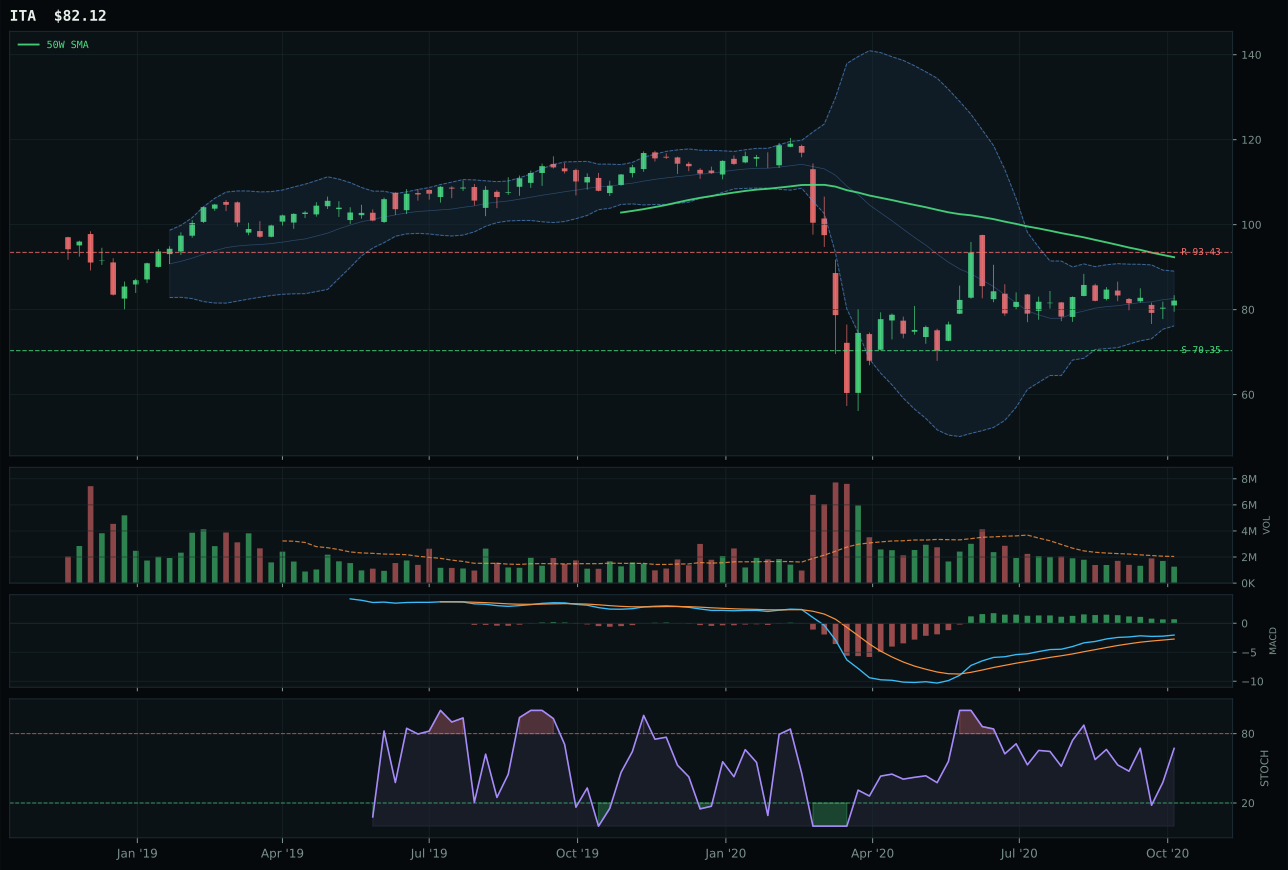
ITA has a neutral structure profile with -5.3% 13-week relative strength versus SPY.
Extension and support failure are the main tactical risks.
Tracked, but not top-2 eligible because: structurally broken.
XAR wins a crowded category decision primarily on timing excellence, posting a perfect 100.0 timing score by sitting just -2.9% below the 50-week moving average in the exact middle retracement decision zone near the 0.500 Fibonacci level. This compression near the 50W creates expansion potential if support holds, a more favorable technical setup than ROKT's 2.6% extension into the upper retracement zone, where buyers face less room before resistance at 33.60. XAR's 57.9 risk-reward score crushes ROKT's 45.6 because downside-to-support spans 22.8% while upside-to-resistance sits at -6.2%, offering genuine asymmetry in a reset context. The 10.0% 13-week return paired with neutral 0.8% category-relative strength positions XAR as a steady performer rather than a chase-the-breakout candidate, and the 0.56x volume profile reflects the thin participation typical of category leaders in early accumulation phases.
Defense & Aerospace earned 5% as a tier-2 category after the 37.1 composite score failed to crack the top-2 threshold, ranking sixth overall among eligible candidates. The category-level macro fit of 55.0 reflects a neutral environment—no specific descriptor strongly favors or penalizes aerospace spending, and while credit stress adds +2 points via transition-mixed regime support, the lack of dedicated macro sponsorship weighs heavily. Goldilocks adds only +3 points to category fit, suggesting the Goldilocks macro regime itself is not a tailwind for this sector in the current descriptor configuration. XAR's technical strength keeps the category allocation-worthy, but the 37.1 score places it firmly in the tier-2 band where capital is deployed for diversification rather than conviction. A shift toward explicit defense spending narratives or credit ease would be required to elevate this category into top-2 positioning.
Nuclear Energy — NLR
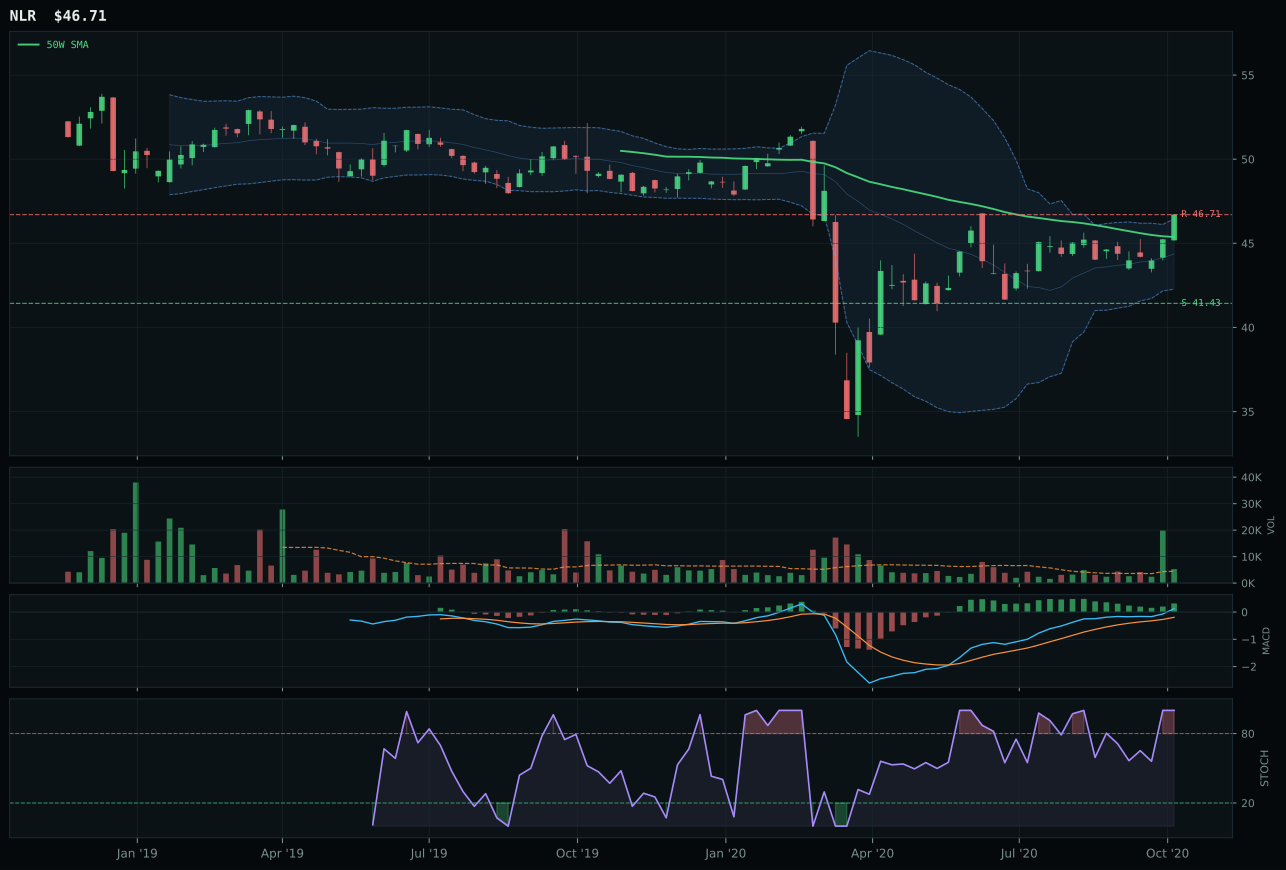
NLR has a compression near 50W profile with -1.4% 13-week relative strength versus SPY.
A failed hold above support would weaken the setup.
Tracked, but not top-2 eligible because: .
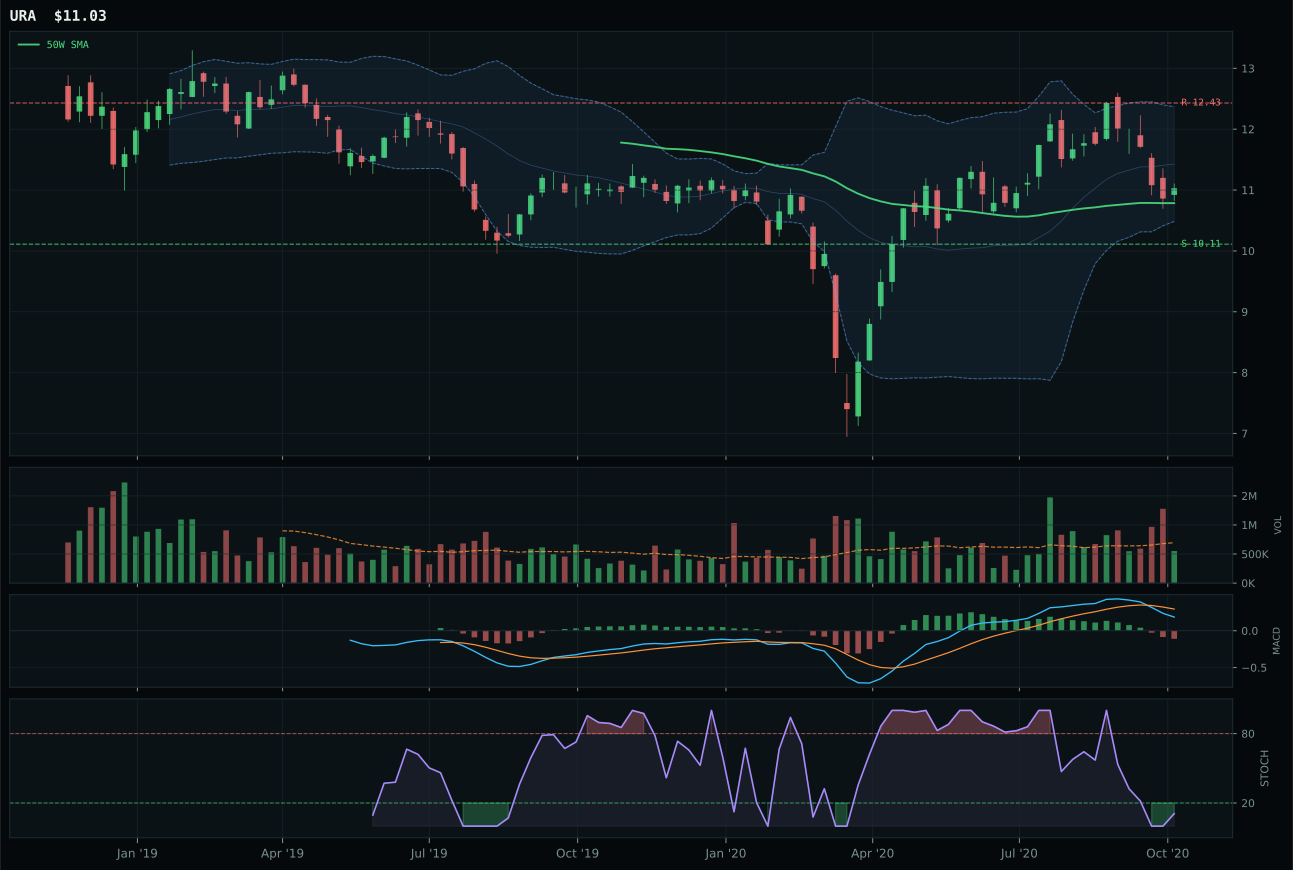
URA has a compression near 50W profile with -10.0% 13-week relative strength versus SPY.
A failed hold above support would weaken the setup.
Tracked, but not top-2 eligible because: .

URNM has a neutral structure profile with -8.0% 13-week relative strength versus SPY.
A failed hold above support would weaken the setup.
Tracked, but not top-2 eligible because: .
NLR wins nuclear despite a 28.9 composite score and 0% final allocation, capturing the category representative slot through superior timing positioning and MACD confirmation versus peers drowning in oversold conditions. Price sits just 2.9% below the 50-week moving average in a compression-near-50W setup that posted a perfect 100.0 timing score—NLR occupies the exact reset zone where accumulation becomes possible if buyers step in. The bullish-and-improving MACD and above-average 1.18x volume participation created a 91.5 momentum confirmation score that towers over URA's 3.0 (which sits in oversold stochastic territory with falling MACD), a 88.5-point gap that defines the category decision despite both setups being ineligible for allocation. NLR's 7.8% 13-week return and 6.5% category-relative strength showed genuine relative resilience, yet the -1.4% SPY relative strength and the broader nuclear sector's -10.0% relative underperformance (URA) created category-level weakness that technical merit alone could not overcome.
Nuclear energy received 0% allocation after posting 28.9, ranking ninth among ten categories and falling below the eligibility threshold despite NLR's respectable technical setup. The category-level macro fit of 57.0 reflects modest support from AI growth sponsorship (+5) and real asset positioning (+7), offset by credit stress headwinds (-5), creating a neutral macro environment. NLR's timing excellence and improving momentum setup would normally merit a 5% sleeve in a neutral macro regime, but the system's eligibility filters require stronger category-level conviction to allocate when multiple competitors offer superior macro alignment. Goldilocks itself adds only modest support to nuclear, and the absence of explicit energy-security or inflation descriptors removes the traditional tailwind that nuclear energy might otherwise capture. For nuclear to earn allocation, either credit conditions must ease significantly to lower the -5 headwind, or a broader regime shift toward energy security and defense spending must activate dedicated descriptors favoring this sector. Until then, NLR's technical merit keeps it on the watchlist as a potential tier-2 entry point if macro conditions shift.
Traditional Energy — FCG
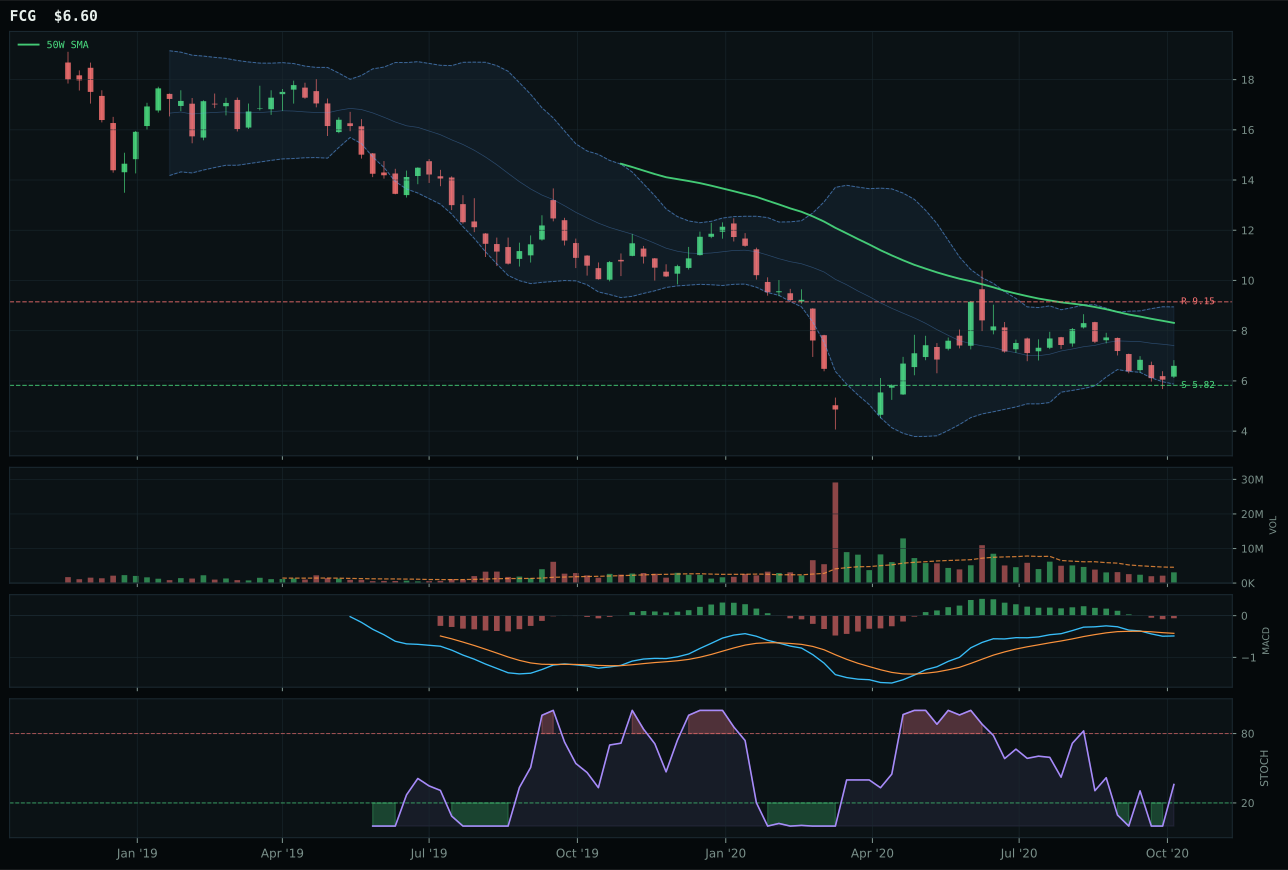
FCG has a neutral structure profile with -16.4% 13-week relative strength versus SPY.
Extension and support failure are the main tactical risks.
Tracked, but not top-2 eligible because: structurally broken.
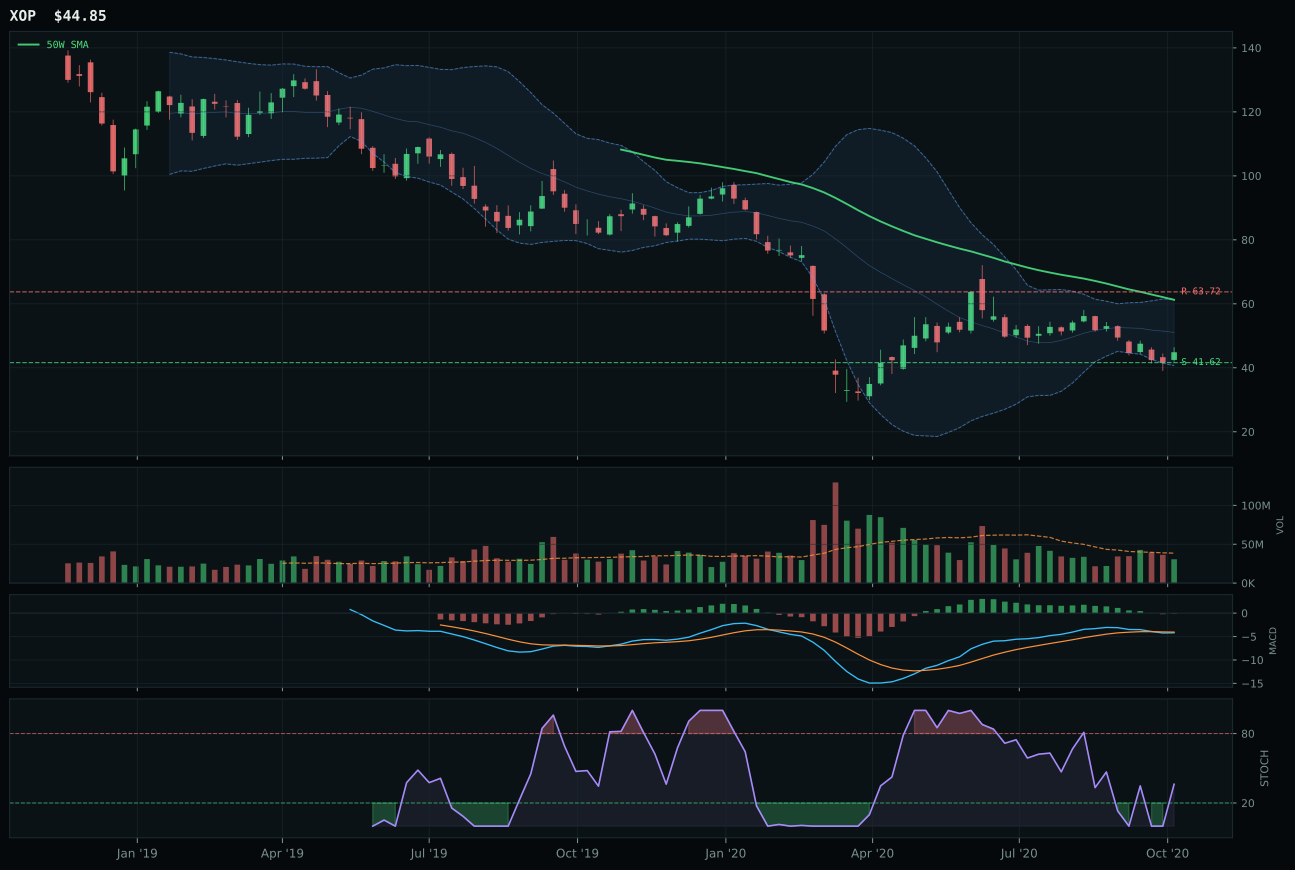
XOP has a neutral structure profile with -18.4% 13-week relative strength versus SPY.
Extension and support failure are the main tactical risks.
Tracked, but not top-2 eligible because: structurally broken.
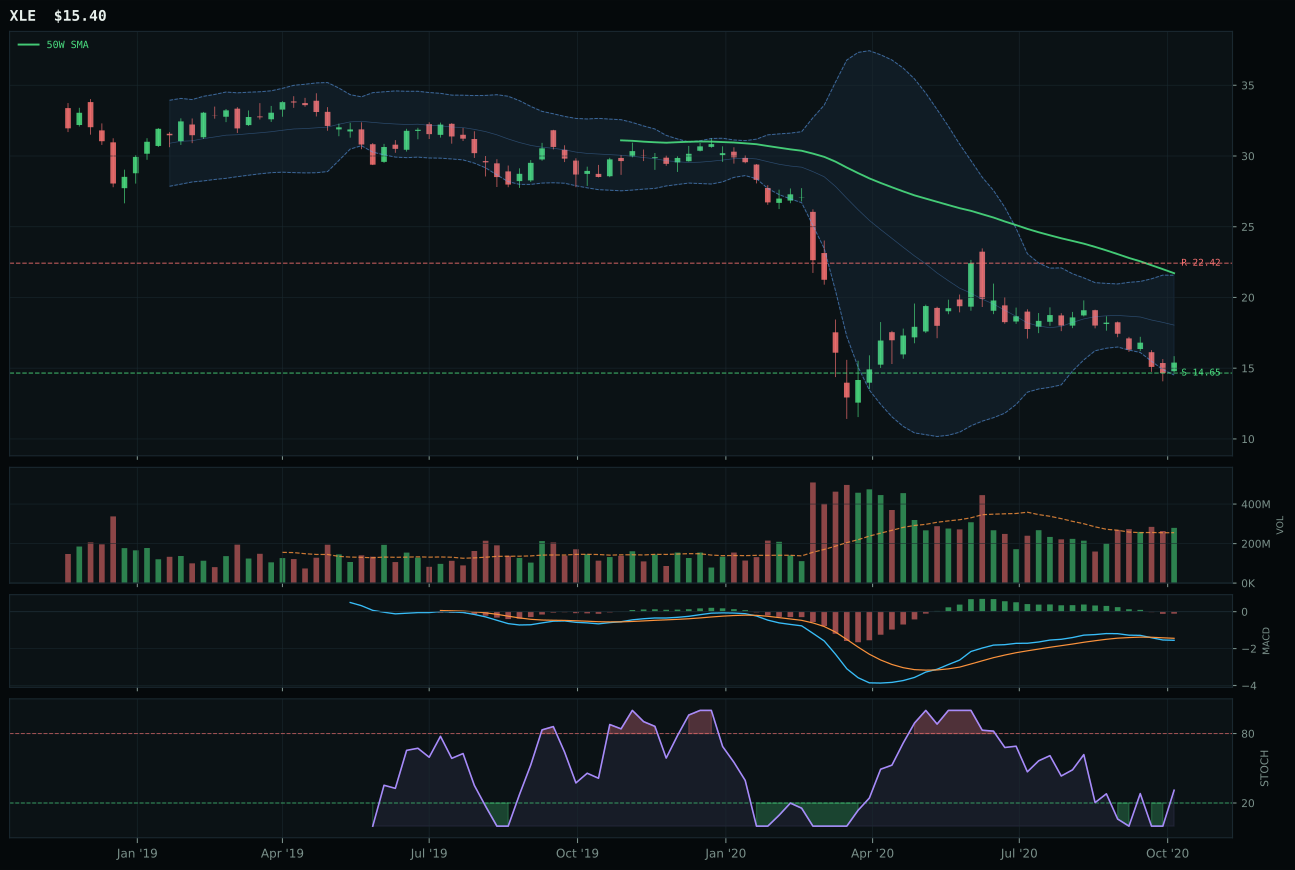
XLE has a neutral structure profile with -22.6% 13-week relative strength versus SPY.
Extension and support failure are the main tactical risks.
Tracked, but not top-2 eligible because: structurally broken.
FCG wins traditional energy in a category that registered 0.0 allocation due to structural failure, defeated by hard eligibility filters rather than by a competitive peer dynamic. The setup shows FCG at -19.3% below the 50-week moving average in the deep retracement value zone, with both price and 200-week average in downtrend alignment—a repair setup that would normally merit consideration as mean-reversion opportunity. However, a 12.0 trend score derived from price below both key moving averages, a -1.0% deteriorating 50-week slope, and catastrophic -16.4% SPY relative strength created a composite trend picture that the system evaluated as structurally broken rather than merely temporary weakness. The -7.2% 13-week return paired with 6.0 momentum confirmation (the lowest score in the dataset) left no technical props to support the narrative; XOP's -18.4% SPY relative strength was marginally worse, confirming that the entire category failed eligibility rather than FCG simply outcompeting marginally stronger peers.
Traditional energy received 0% allocation and was excluded from the portfolio entirely this week, failing eligibility filters that prevent allocation to structurally broken setups. The category-level macro fit of 40.0 is the lowest among all ten categories, with disinflation pressure draining -10 points and credit stress subtracting -7, while only real asset sponsorship at +7 provides any support. This macro deficit combined with the 12.8 technical evidence score for FCG created a composite picture where neither technical nor macro conditions justified capital deployment. The energy sector's structural underperformance against SPY (-16.4% for FCG, -18.4% for XOP, -22.6% for XLE) reflects broader market dislocation away from fossil fuels in a Goldilocks regime that favors AI compute, infrastructure capex, and real assets with supply-side constraints. For traditional energy to re-enter the allocation, either the disinflation narrative must reverse (requiring an inflation re-acceleration), credit stress must swing to support, or relative strength versus SPY must show evidence of stabilization. Until one of those conditions appears, this category remains outside the portfolio hierarchy.