
2020-10-02
Informational purposes only. The content in this report, including allocations, analysis, and commentary, is provided solely for informational and educational purposes. It does not constitute financial advice, investment advice, trading advice, or any other type of advice. Past performance does not guarantee future results. Always conduct your own research and consult a qualified financial professional before making investment decisions.
Some tracked tickers were excluded due to missing live weekly price data: SGOV: Historical cache SGOV has only 18 usable weekly bars
Weekly Allocation
| Ticker | Category | Weight | Role |
|---|---|---|---|
| FSOL | 50% | Overlay | |
| BOTZ | AI | 10% | Top-2 (10%) |
| INDA | Emerging Markets | 10% | Top-2 (10%) |
| IGV | Technology | 5% | Tier-2 (5%) |
| PICK | Industrial Metals | 5% | Tier-2 (5%) |
| XLU | Utilities & Infrastructure | 5% | Tier-2 (5%) |
| GLD | Precious Metals | 5% | Tier-2 (5%) |
| MOO | Agriculture & Livestock | 5% | Tier-2 (5%) |
| XAR | Defense & Aerospace | 5% | Tier-2 (5%) |
Trade Instructions — Monday Open
Sell the tranche from 2020-09-04 (completing its 4-week hold). Buy the new tranche. Instructions show net portfolio changes — same-asset positions cancel, weight changes show the delta.
| Action | Ticker | Instruction |
|---|---|---|
| SELL | SLV | Sell entire SLV position (2.50% of portfolio) |
| SELL | XLK | Sell entire XLK position (1.25% of portfolio) |
| SELL | SMH | Sell entire SMH position (1.25% of portfolio) |
| SELL | ITA | Sell entire ITA position (1.25% of portfolio) |
| BUY | IGV | Buy IGV — 20.00% of freed cash (adds 1.25% to portfolio) |
| BUY | GLD | Buy GLD — 20.00% of freed cash (adds 1.25% to portfolio) |
| BUY | BOTZ | Buy BOTZ — 40.00% of freed cash (adds 2.50% to portfolio) |
| BUY | XAR | Buy XAR — 20.00% of freed cash (adds 1.25% to portfolio) |
Current Portfolio After Trade
Combined holdings across all 4 active tranches. Each tranche is 25% of the portfolio.
| Ticker | % of Portfolio | Weight Bar |
|---|---|---|
| FSOL | 50.00% | |
| INDA | 7.50% | |
| BOTZ | 7.50% | |
| PICK | 7.50% | |
| IGV | 6.25% | |
| GLD | 5.00% | |
| MOO | 3.75% | |
| XLU | 3.75% | |
| XAR | 3.75% | |
| URNM | 1.25% | |
| PAVE | 1.25% | |
| CIBR | 1.25% | |
| NLR | 1.25% |
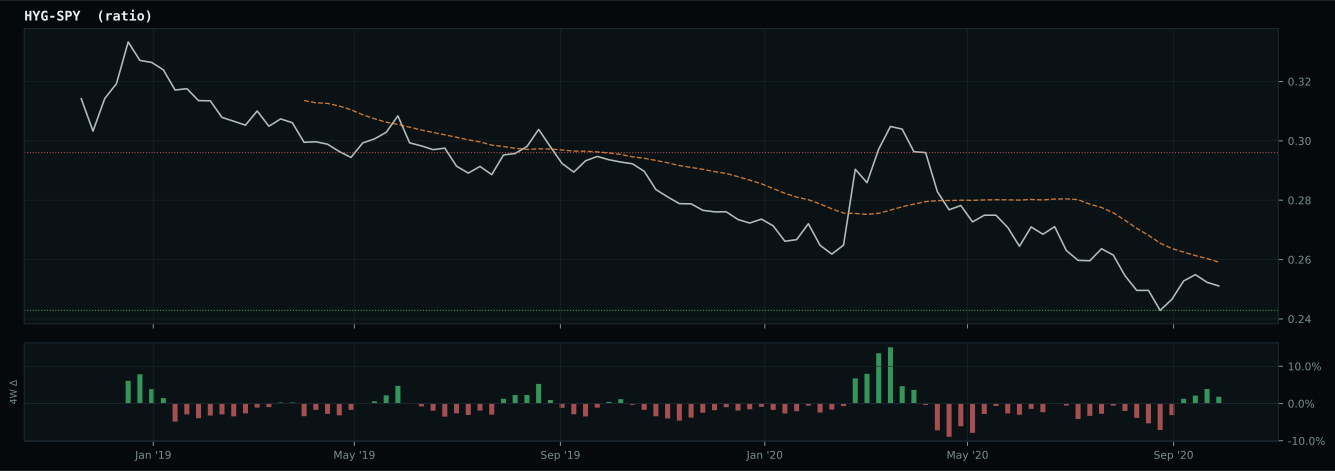
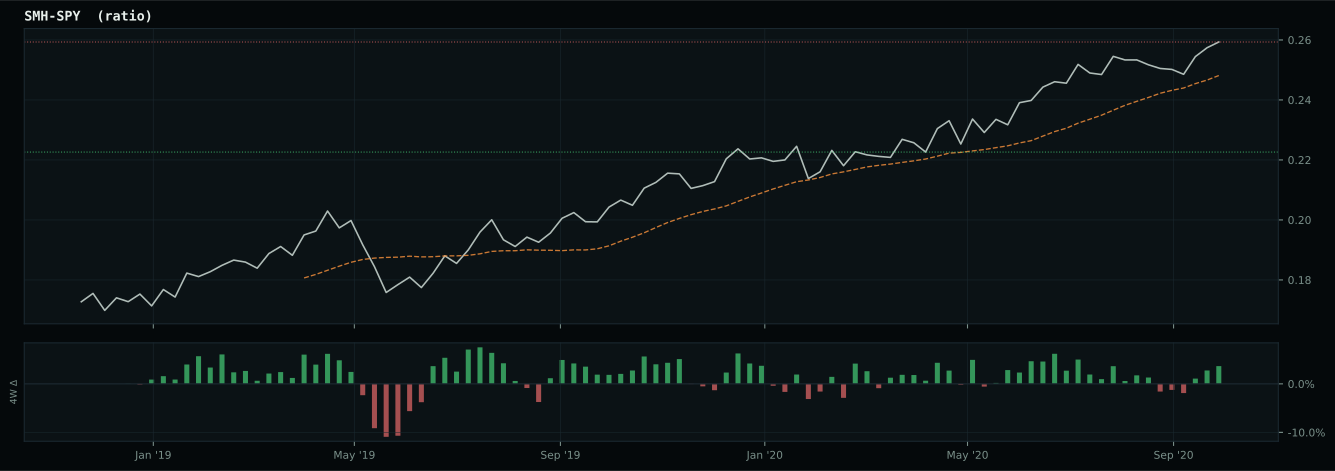
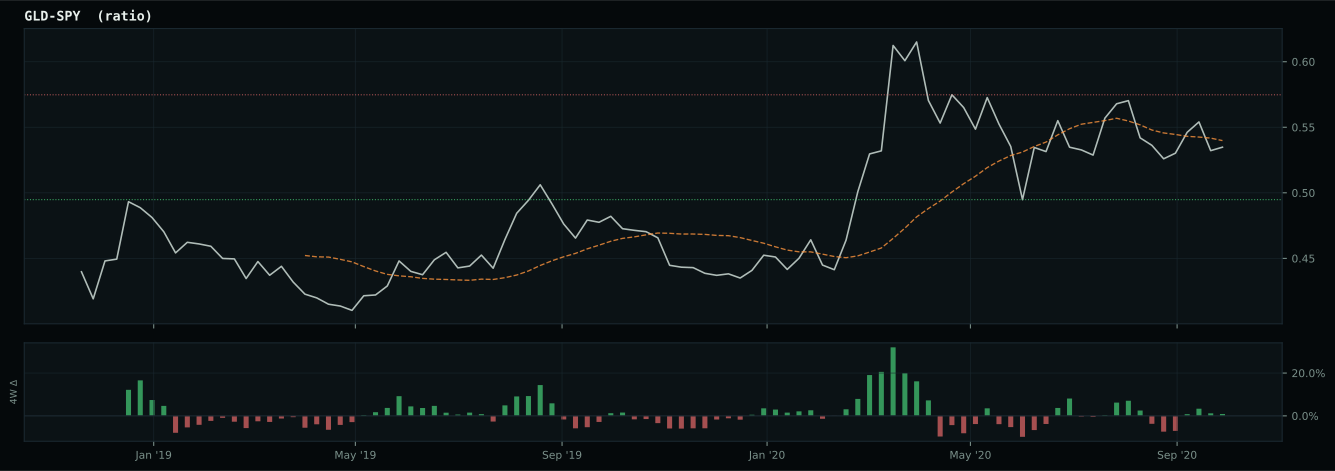
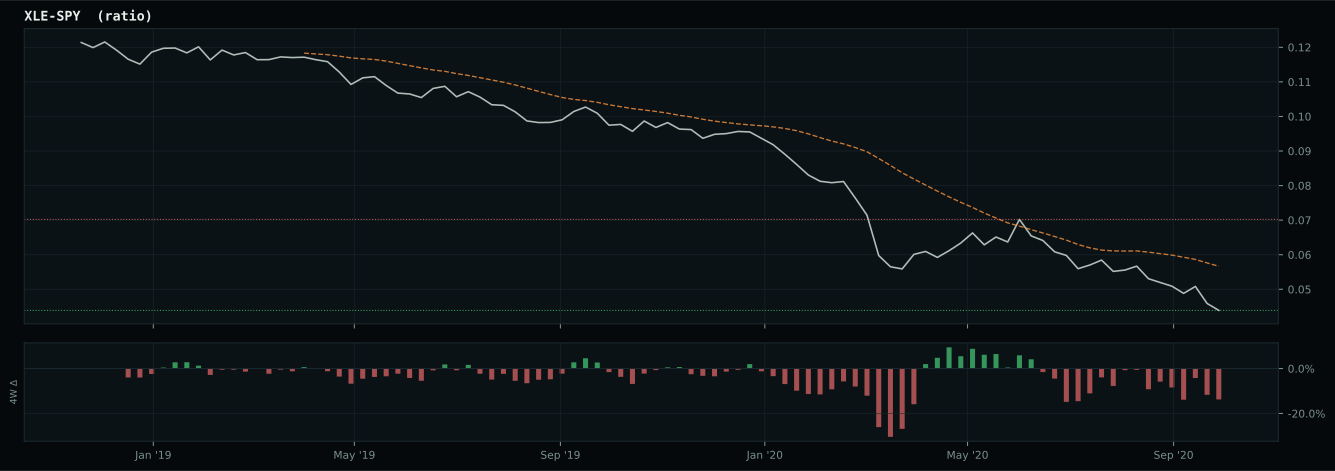
Macro Regime — Goldilocks
Macro Evidence Charts
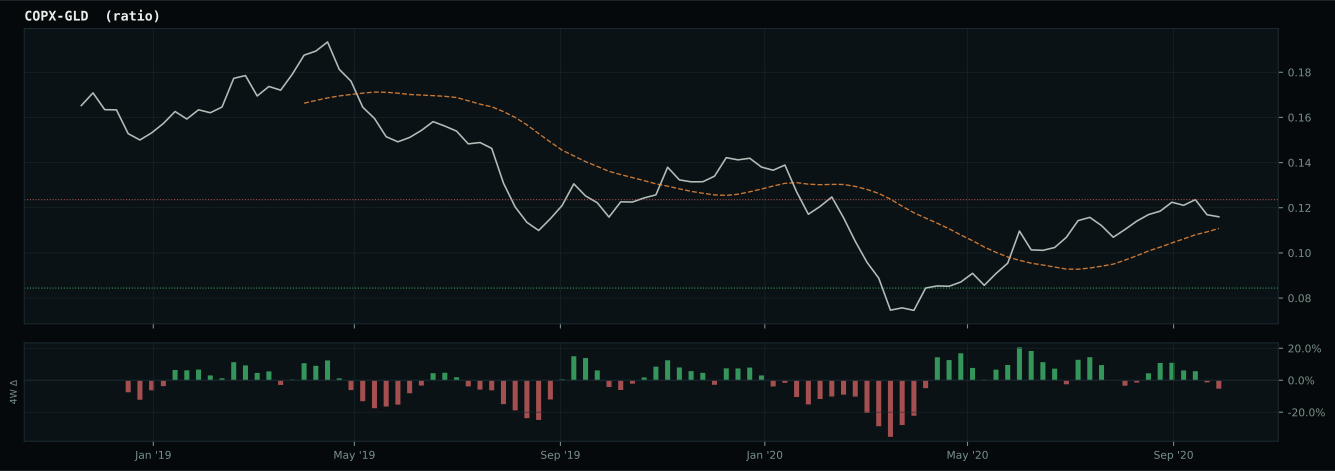
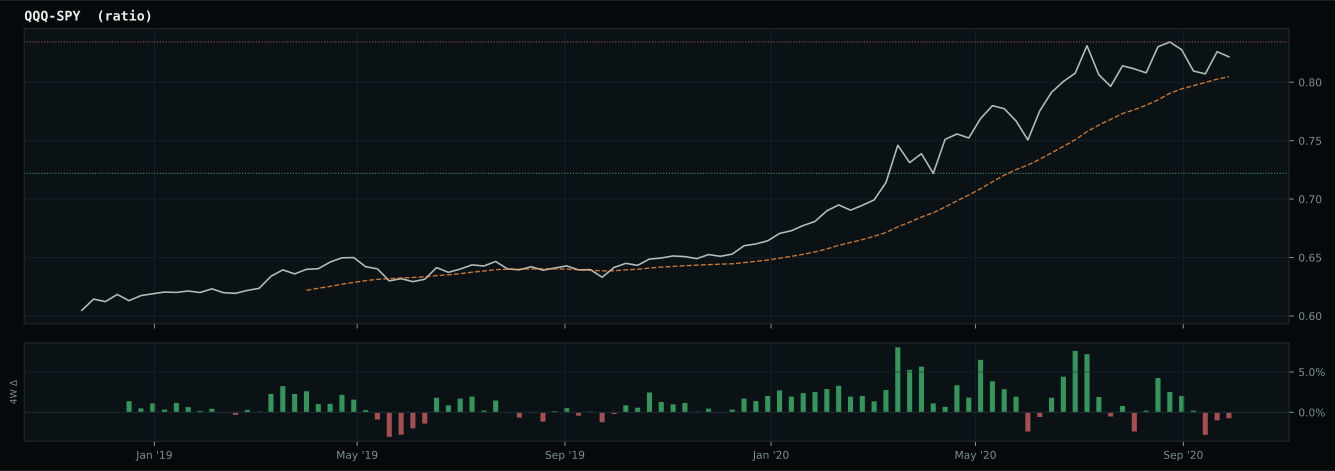
Market-implied signals behind the macro regime scores. Each ratio compares two assets; the direction and slope of the ratio is what the macro engine reads.
Crypto Regime — AltSeason
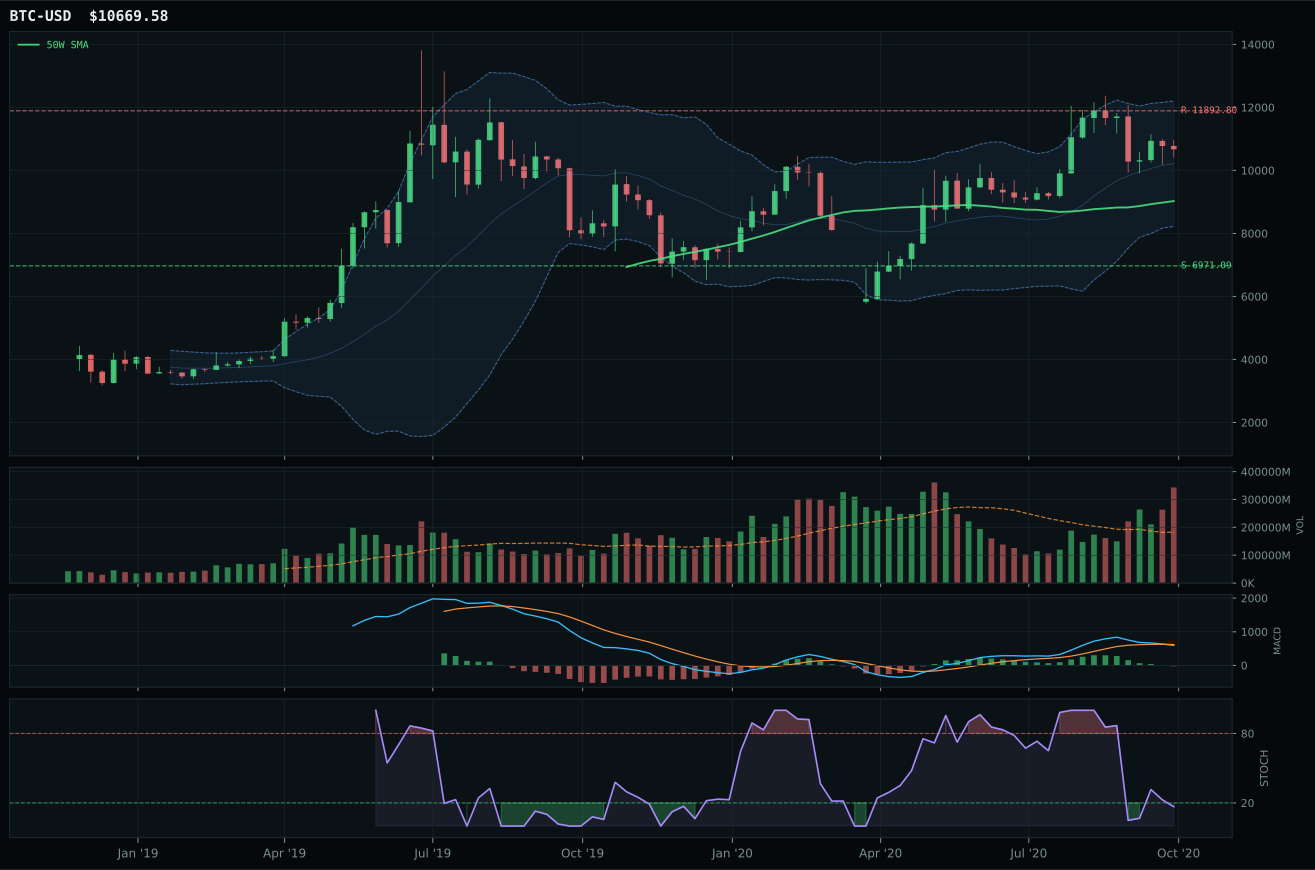
post-touch structure is too wide to count as a range; max/min close ratio is 2.21
TrendBTC confirmed: 2 consecutive closes above rising/flat 50W SMA
all available AltSeason conditions pass; missing optional confirmations skipped

Category Rankings
| Rank | Category | Winner | Score | Alloc | 4W Ret | Peers (4W) |
|---|---|---|---|---|---|---|
| 1 | AI | BOTZ | 73.0 | 20% | +0.07% | SMH +1.0% · AIQ -0.8% |
| 2 | Emerging Markets | INDA | 60.6 | 20% | -3.18% | IEMG +2.1% · ILF +0.9% |
| 3 | Technology | IGV | 57.1 | 10% | -1.77% | XLK -3.5% · CIBR -4.5% |
| 4 | Industrial Metals | PICK | 54.6 | 10% | -0.41% | COPX +4.9% · REMX +5.3% |
| 5 | Utilities & Infrastructure | XLU | 54.2 | 10% | +3.91% | PAVE +3.0% · IGF -1.6% |
| 6 | Precious Metals | GLD | 42.5 | 10% | -0.88% | SLV -0.2% · GDX -2.8% |
| 7 | Agriculture & Livestock | MOO | 38.4 | 10% | -0.12% | WEAT +1.9% · VEGI -1.7% |
| 8 | Defense & Aerospace | XAR | 34.3 | 10% | -4.27% | ROKT -4.3% · ITA -5.6% |
| 9 | Nuclear Energy | NLR | 27.0 | 0% | +0.95% | URNM -4.7% · URA +0.3% |
| 10 | Traditional Energy | XLE | — | 0% | -1.56% | FCG -1.0% · XOP -3.3% |
AI — BOTZ
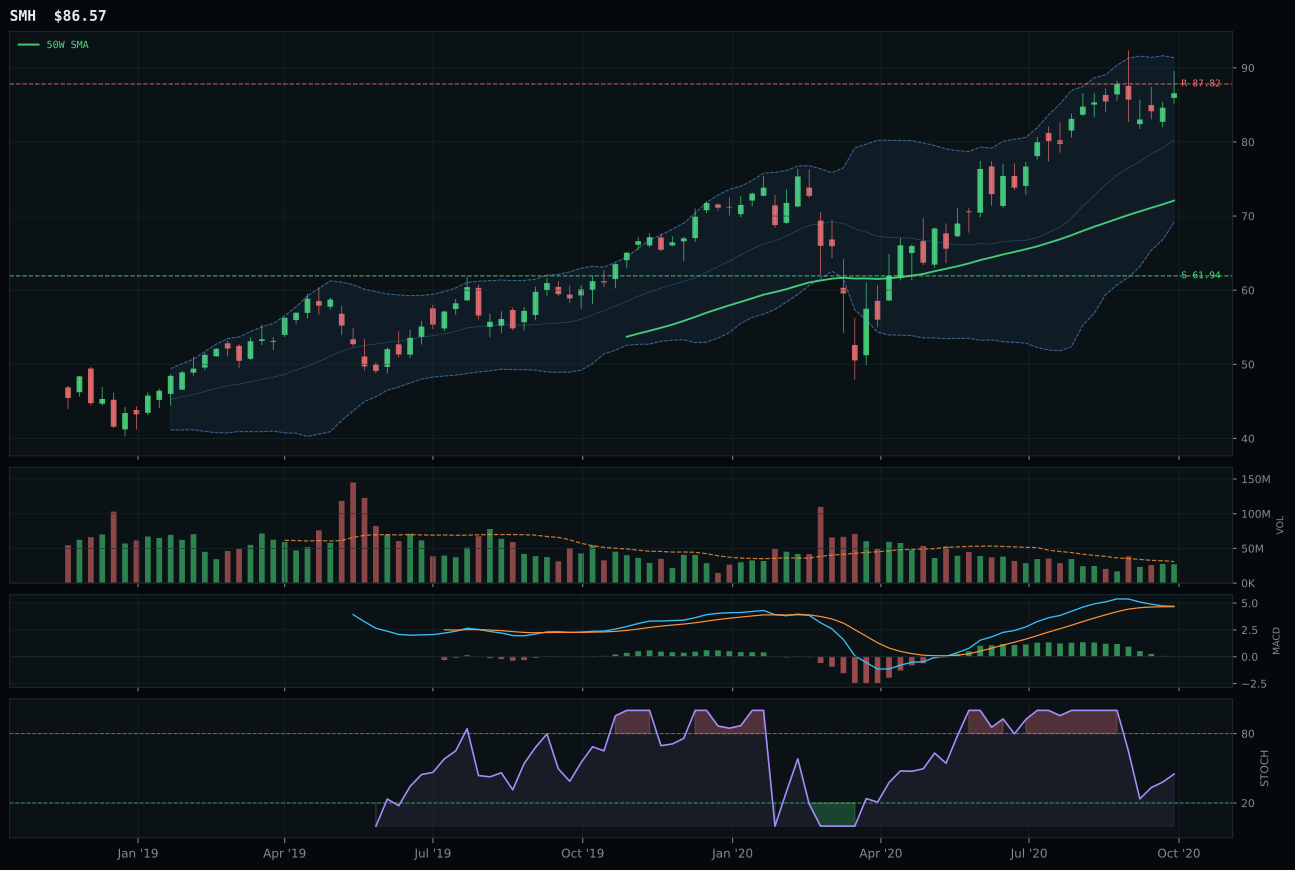
SMH has a vertical extension profile with 6.0% 13-week relative strength versus SPY.
A failed hold above support would weaken the setup.
Actionable but governed by invalidation levels.
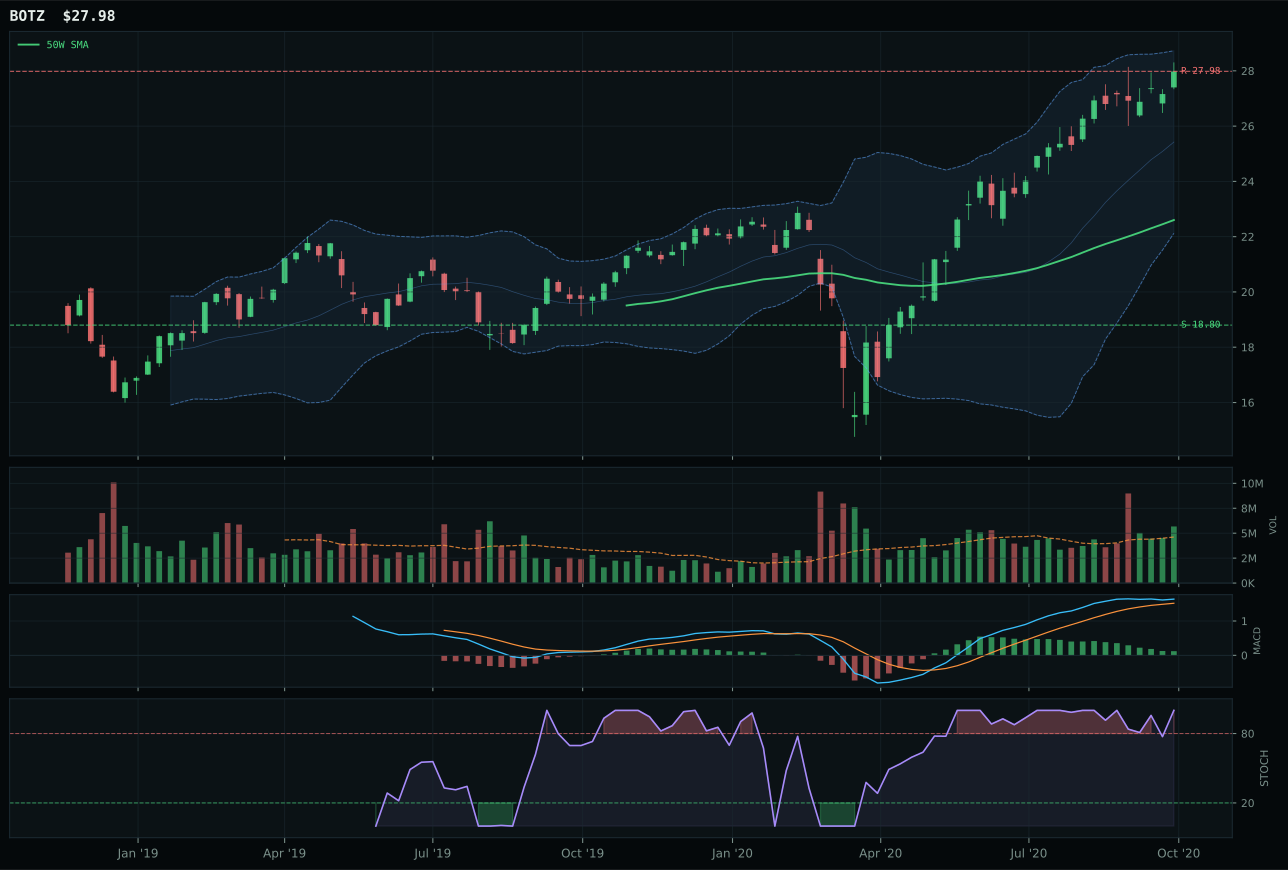
BOTZ has a vertical extension profile with 9.5% 13-week relative strength versus SPY.
A failed hold above support would weaken the setup.
Actionable but governed by invalidation levels.
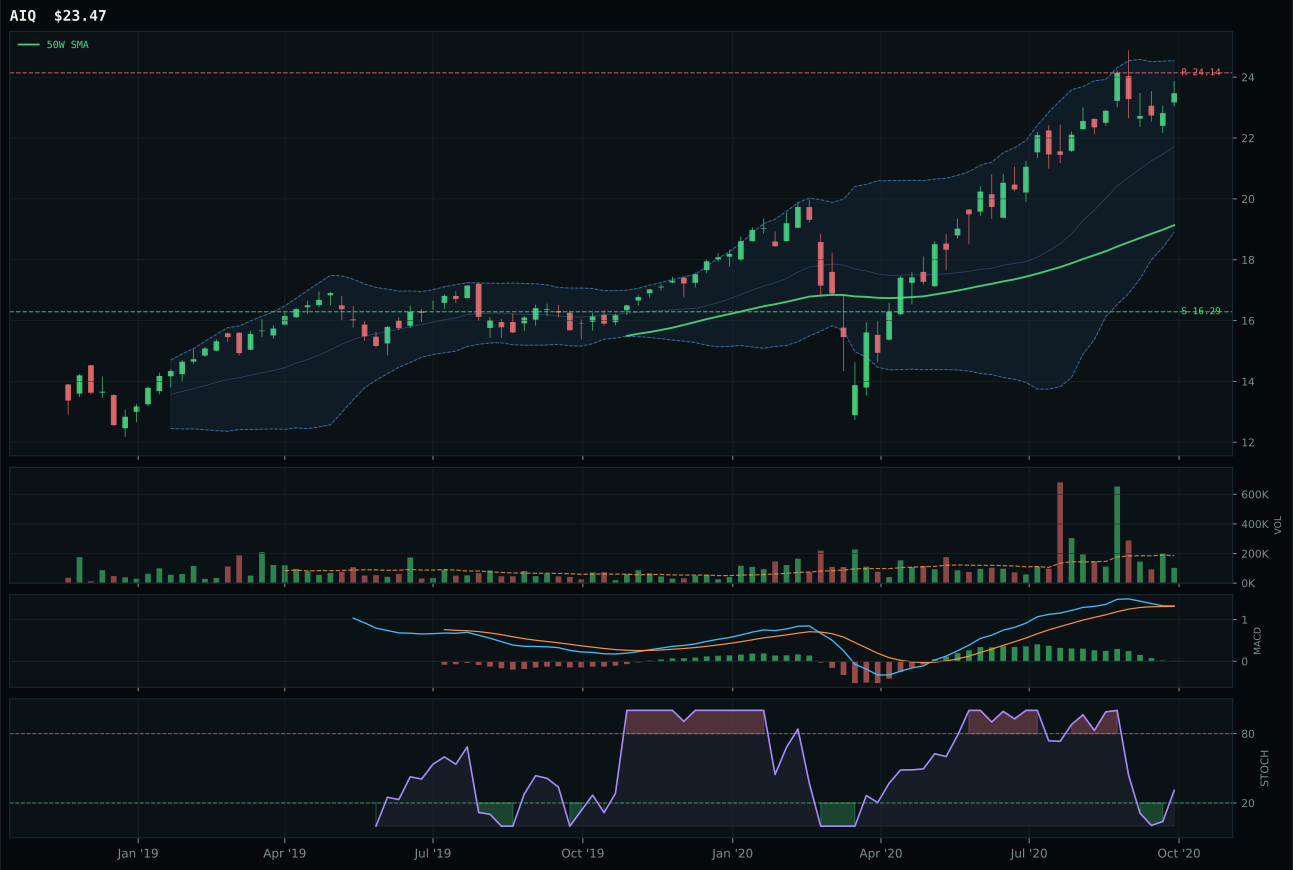
AIQ has a vertical extension profile with 4.6% 13-week relative strength versus SPY.
A failed hold above support would weaken the setup.
Tracked, but not top-2 eligible because: .
BOTZ wins with perfect trend confirmation and exceptional momentum, delivering a 73.0 category score that locks in a top-2 overweight. The robotics ETF sits 100/100 on trend—price above both the 50W and 200W with 9.5% outperformance versus SPY—and posts a flawless 100/100 momentum score driven by 16.4% 13-week returns and 3.5% category-relative strength. SMH, the runner-up semiconductor proxy, fails on two critical counts: its stochastic RSI sits at rising mid-zone versus BOTZ's overbought 1.00, and volume participation is merely neutral rather than the 1.23x above-average that confirms BOTZ's move. The -1.4 point gap between them is tight enough to matter, but BOTZ's ability to sustain 100/100 trend and momentum despite being extended at 23.8% from the 50W speaks to genuine buying pressure and category leadership. SMH's 6.0% SPY-relative strength lags BOTZ's 9.5%, revealing that institutional capital is choosing physical AI cyclicality over compute hardware.
BOTZ earns 10% allocation as a top-2 overweight, reflecting AI's 73.0 category score and strong macro sponsorship. The 86.0 macro fit score is the highest among all categories this week, driven by liquidity expansion at +10, risk appetite at +10, and AI growth sponsorship at +14—a rare alignment where both technical evidence (79.9/100) and macro narrative converge without conflict. The timing score of 32.0 is the category's only weakness, stemming from near 52W highs and overbought oscillator readings, yet momentum confirmation at 100/100 overwhelms that caution. In a Goldilocks regime with credit stress at -8 (manageable), BOTZ represents the purest leverage to synchronized risk-on positioning and structural AI adoption. The 40.0 risk/reward score warns that upside to resistance is nil and downside to support is 48.8%, so this allocation assumes the macro tailwinds persist through support at 18.80; if they don't, this sleeve reverses quickly.
Emerging Markets — INDA
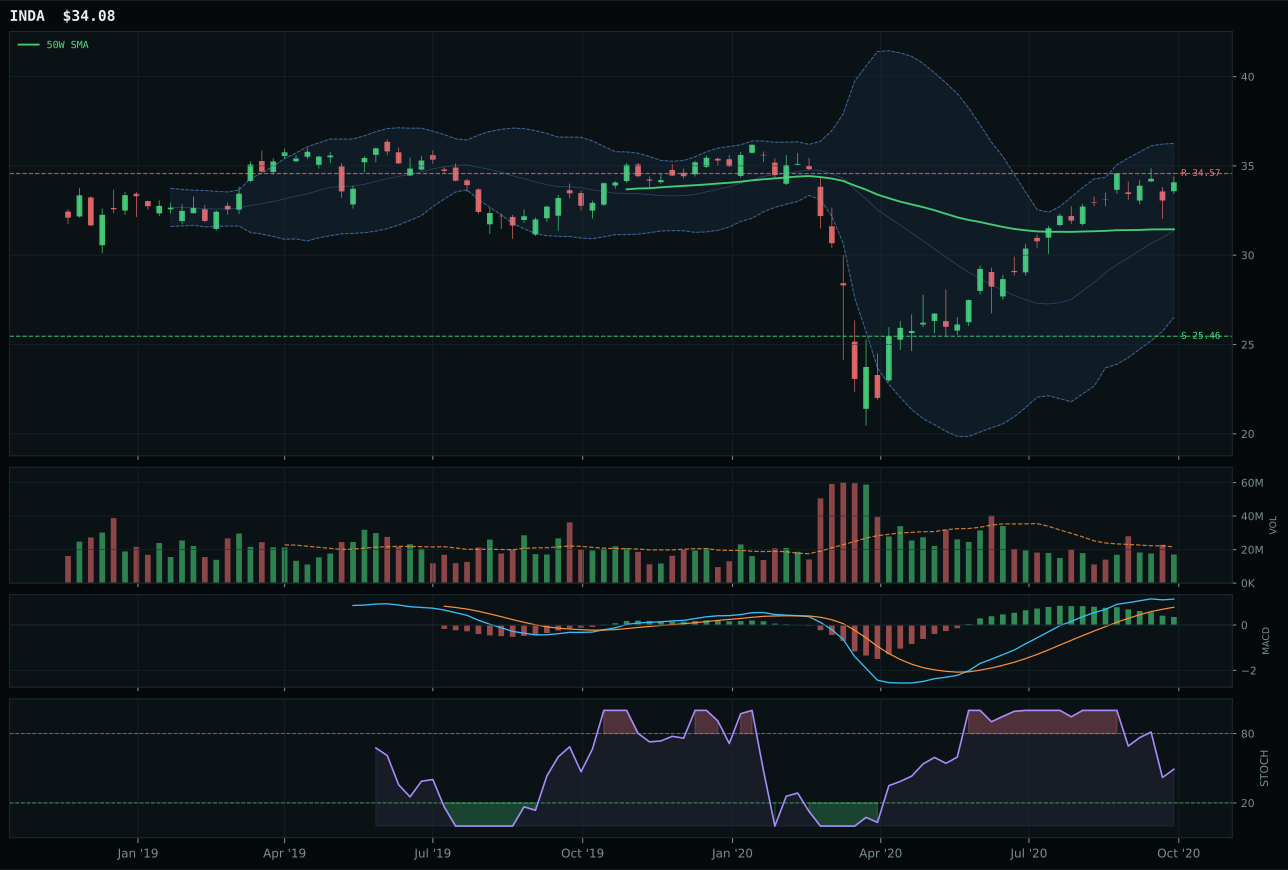
INDA has a neutral structure profile with 5.3% 13-week relative strength versus SPY.
A failed hold above support would weaken the setup.
Actionable but governed by invalidation levels.
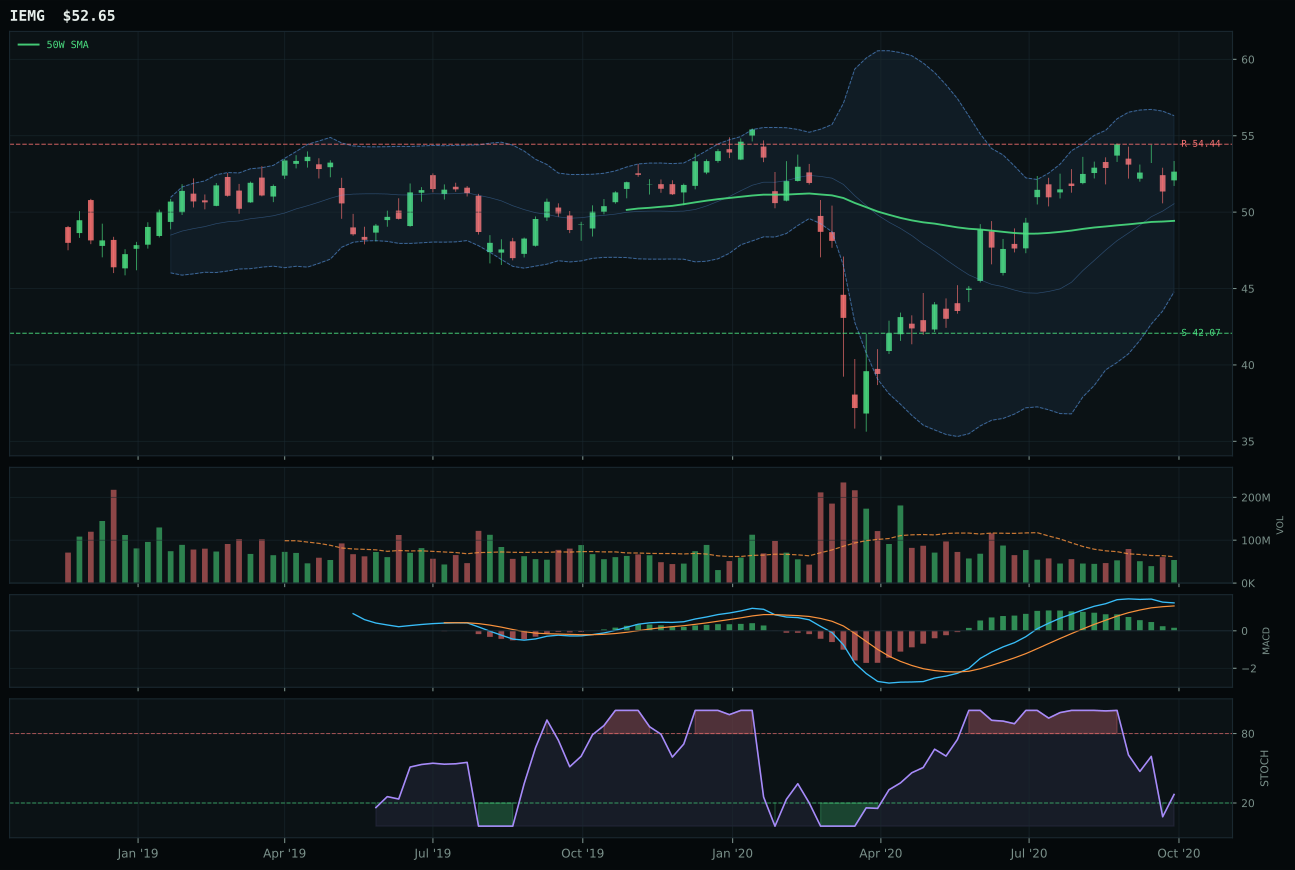
IEMG has a neutral structure profile with -0.1% 13-week relative strength versus SPY.
A failed hold above support would weaken the setup.
Actionable but governed by invalidation levels.
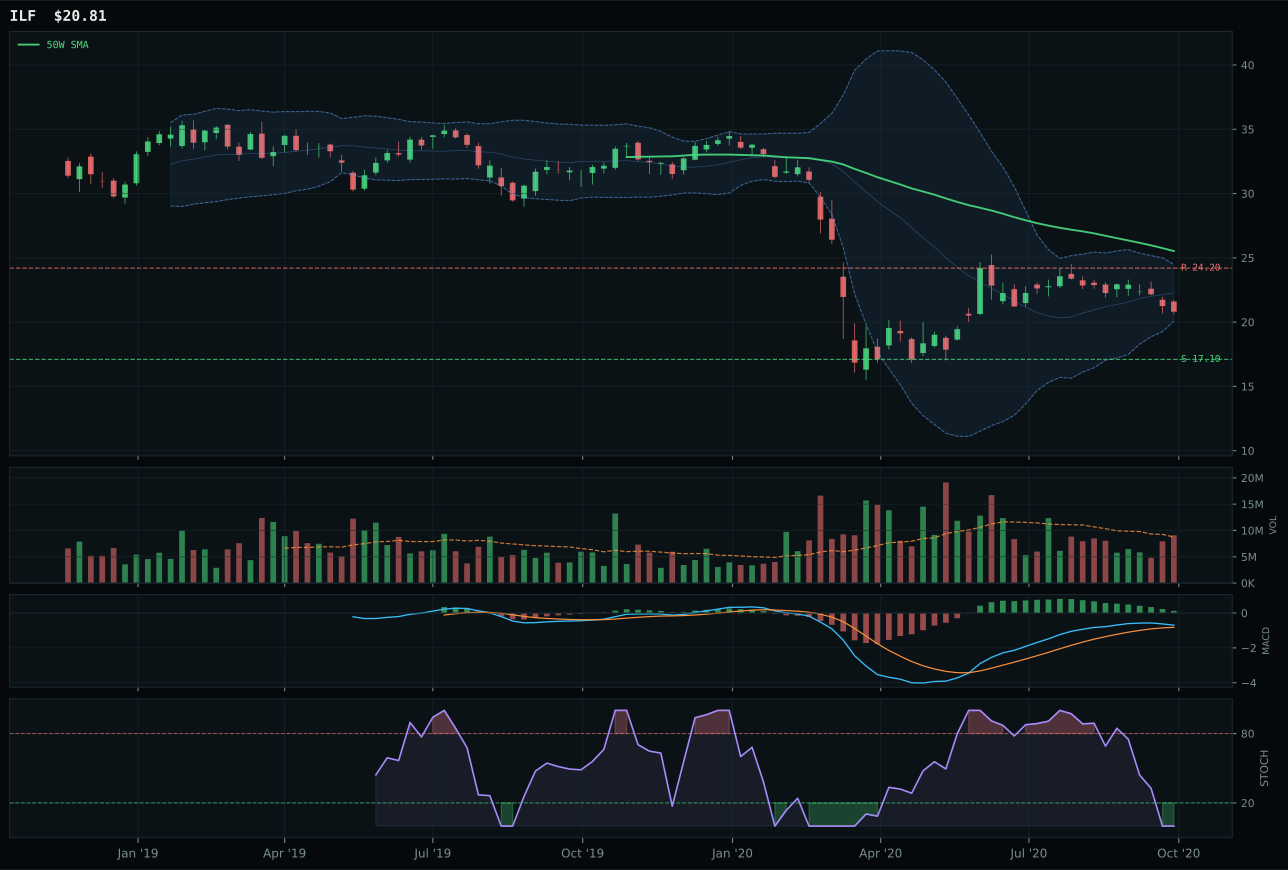
ILF has a neutral structure profile with -13.5% 13-week relative strength versus SPY.
Extension and support failure are the main tactical risks.
Tracked, but not top-2 eligible because: structurally broken.
INDA wins decisively with perfect 100/100 trend—price above the 50W and 200W with 0.0% slope and 5.3% SPY-relative strength—and delivers exceptional momentum confirmation at 88.7/100 from 12.2% 13-week return paired with 5.4% category-relative strength. IEMG, the runner-up, sits only 7.4 points behind with near-identical 96/100 trend, yet INDA's structure score of 79.6/100 exceeds IEMG's 74.6/100 due to superior cleanliness (75.0 vs unspecified) and compression (82.2 vs unspecified). The margin matters: INDA's neutral structure combines clean lines with above-average institutional positioning, while IEMG's broad emerging-market beta leaves it exposed to regional volatility. INDA's category-relative strength at 5.4% crushes IEMG's 0.0%, revealing that Indian equities are outrunning the broader EM complex on quality and growth narratives. Both names sit bullish but flattening MACD and falling/neutral stochastic RSI, indicating that initial buyers have pulled back and consolidation strength is proving sustainable. Volume at 0.79x for INDA is neutral but adequate; the setup does not require heavy participation, only proof that accumulation is outpacing distribution.
Emerging Markets earns 10% allocation as a top-2 overweight, with INDA representing the highest-quality risk-on positioning outside of AI. The 60.6 category score ranks second among the ten categories (behind AI's 73.0), and the 78.0 macro fit score is exceptional, driven by EM liquidity support at +14, liquidity expansion at +8, risk appetite at +8, and Goldilocks regime at +8. INDA's 78.7/100 technical evidence is rock-solid, with perfect trend, strong persistence at 82.8/100, and volume-price confirmation at 77.1/100 that signals institutional accumulation in a quality EM proxy. The -10 credit stress modifier is the only headwind, manageable in a Goldilocks regime where risk appetite dominates. This allocation reflects synchronized tailwinds: Indian equities benefit from global liquidity, emerging-market rotation, quality-growth sponsorship, and China rotation—a rare multi-dimensional setup. The 45.8/100 risk/reward score warns that upside to resistance is minimal (-1.4%), leaving zero room for chasing, but the 33.9% downside to support 25.46 is ample and represents the core thesis: India's structural growth story is intact even if multiples compress near-term. Any break below 25.46 with volume acceleration should trigger a reallocation into BOTZ, which offers better risk management.
Technology — IGV
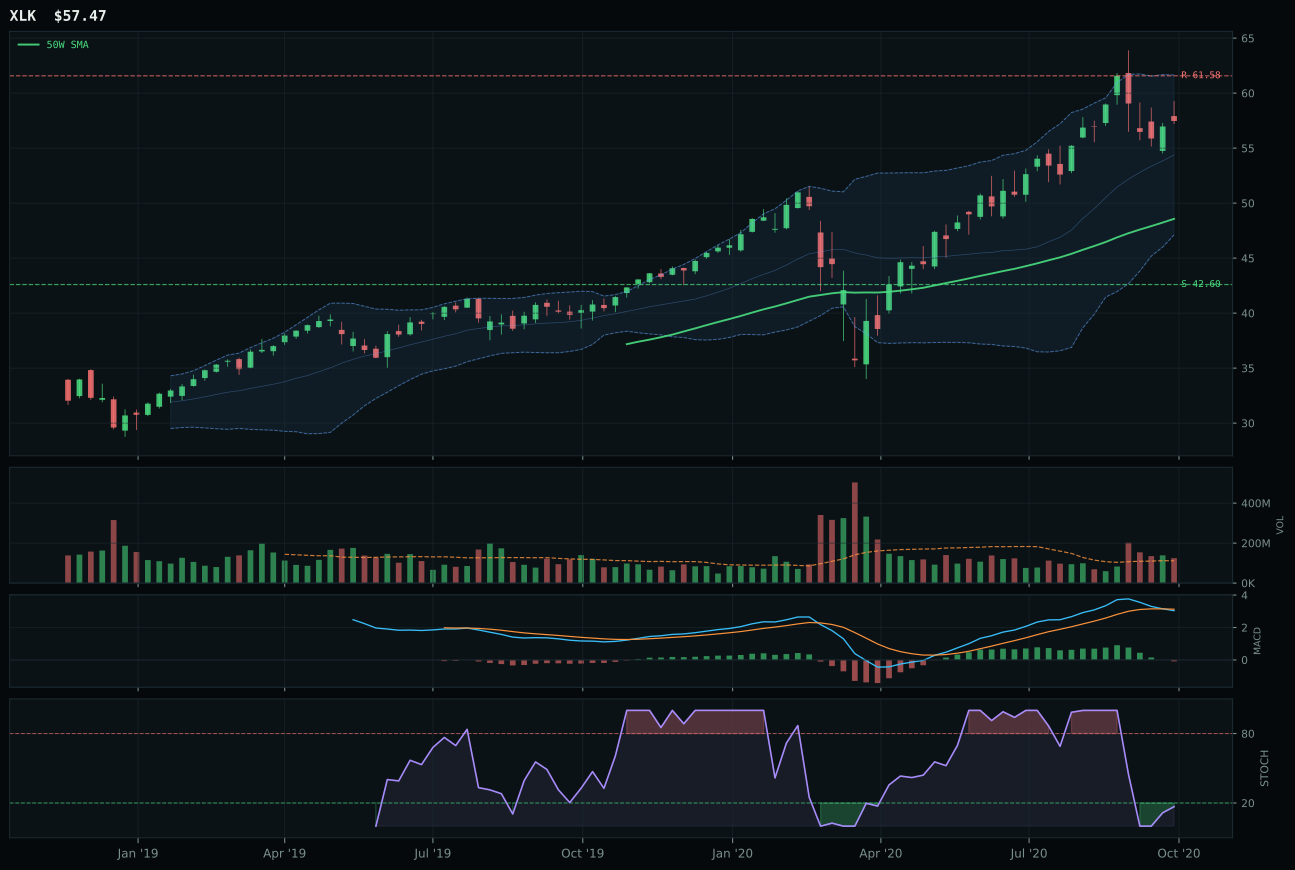
XLK has a vertical extension profile with 2.3% 13-week relative strength versus SPY.
A failed hold above support would weaken the setup.
Actionable but governed by invalidation levels.
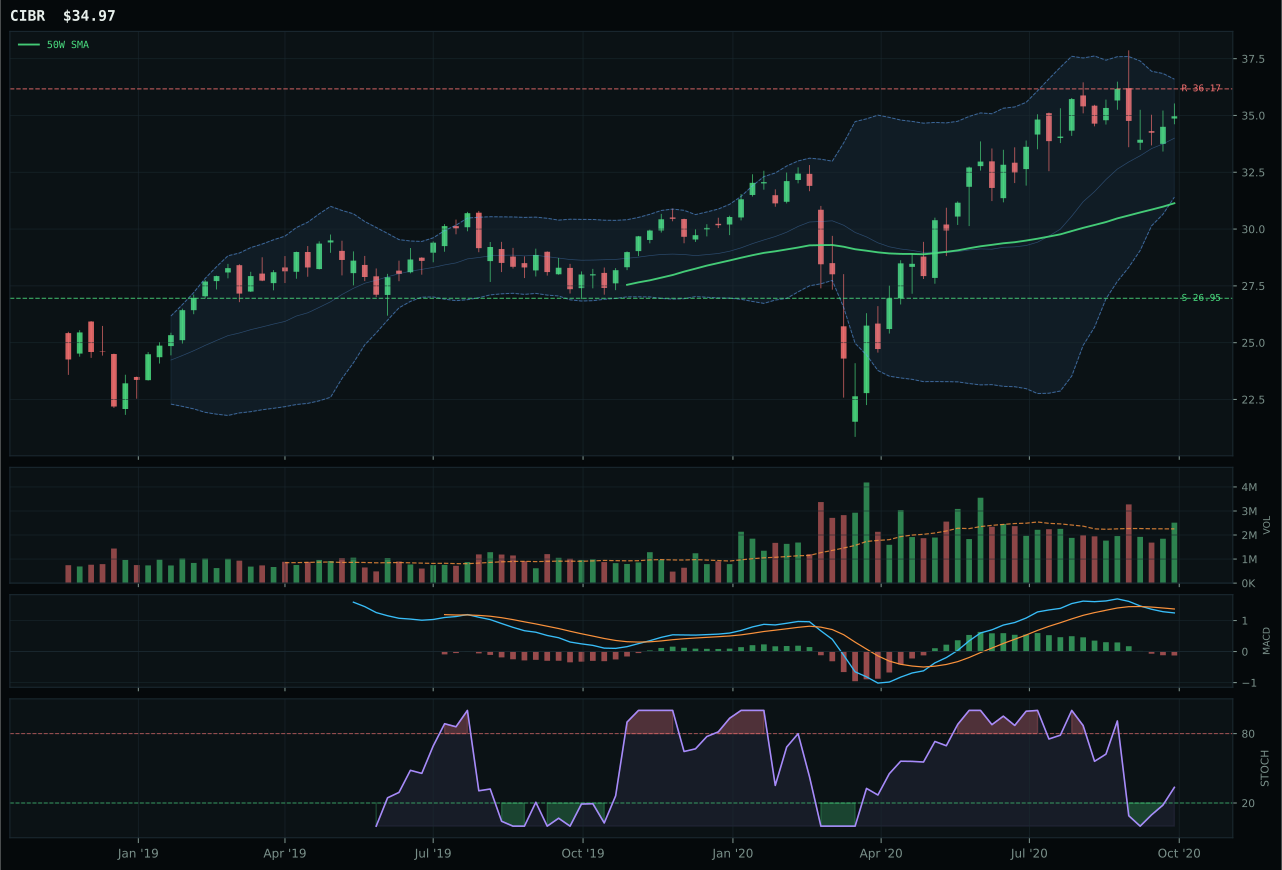
CIBR has a neutral structure profile with -2.9% 13-week relative strength versus SPY.
A failed hold above support would weaken the setup.
Actionable but governed by invalidation levels.
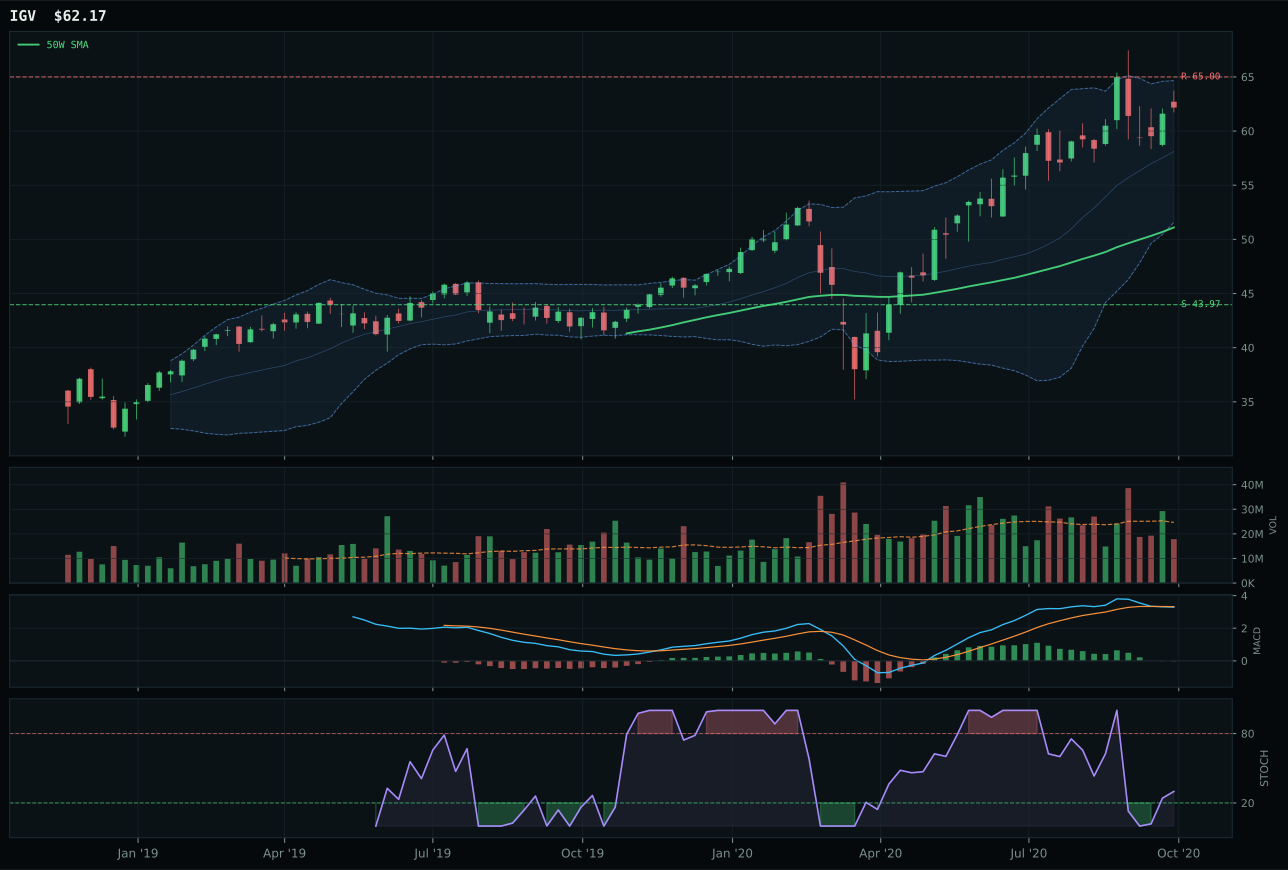
IGV has a vertical extension profile with 0.3% 13-week relative strength versus SPY.
A failed hold above support would weaken the setup.
Actionable but governed by invalidation levels.
IGV wins the category despite being extended 21.7% above its 50-week moving average because it holds a cleaner technical structure than XLK, the runner-up. While both names sit in vertical extension setups with bearish MACD prints, IGV's stochastic RSI positioning at mid-zone 0.30 provides better timing than XLK's oversold turn-up, which signals late-stage momentum rather than fresh accumulation. The 13-week return of 7.3% trails XLK's 9.2%, but IGV's 0.3% relative strength to SPY against XLK's 2.3% matters less than the setup quality—IGV's thin 0.72x volume participation actually penalizes the score fairly, preventing a false read on weak hands chasing into resistance at 65.00. The category decision hinges on structure and timing, not raw momentum: XLK looks like a bounce off oversold conditions, while IGV looks like measured strength being hit with entry risk.
Technology earns 5% allocation as a tier-2 holding, behind the two top-2 overweights but ahead of excluded categories. The 81.0 macro fit score reflects active tailwinds—Goldilocks regime, liquidity expansion at +9, risk appetite at +9, and AI growth sponsorship at +6—yet the category's final 57.1 score still ranks outside the top two, signaling that technical evidence (62% weight) is restraining enthusiasm despite favorable macro conditions. Disinflation pressure at +5 supports the multiple, but two higher-scoring categories have better setup quality and lower entry risk. For allocation purposes, IGV represents a measured long rather than a conviction play: the position acknowledges macro support and trend structure above key moving averages, but the extended valuation and weak volume confirmation mean this sleeve should act as a technical bounce play rather than a core accumulation zone. Any pullback closer to the 50W would sharply improve the case for a larger sleeve.
Industrial Metals — PICK
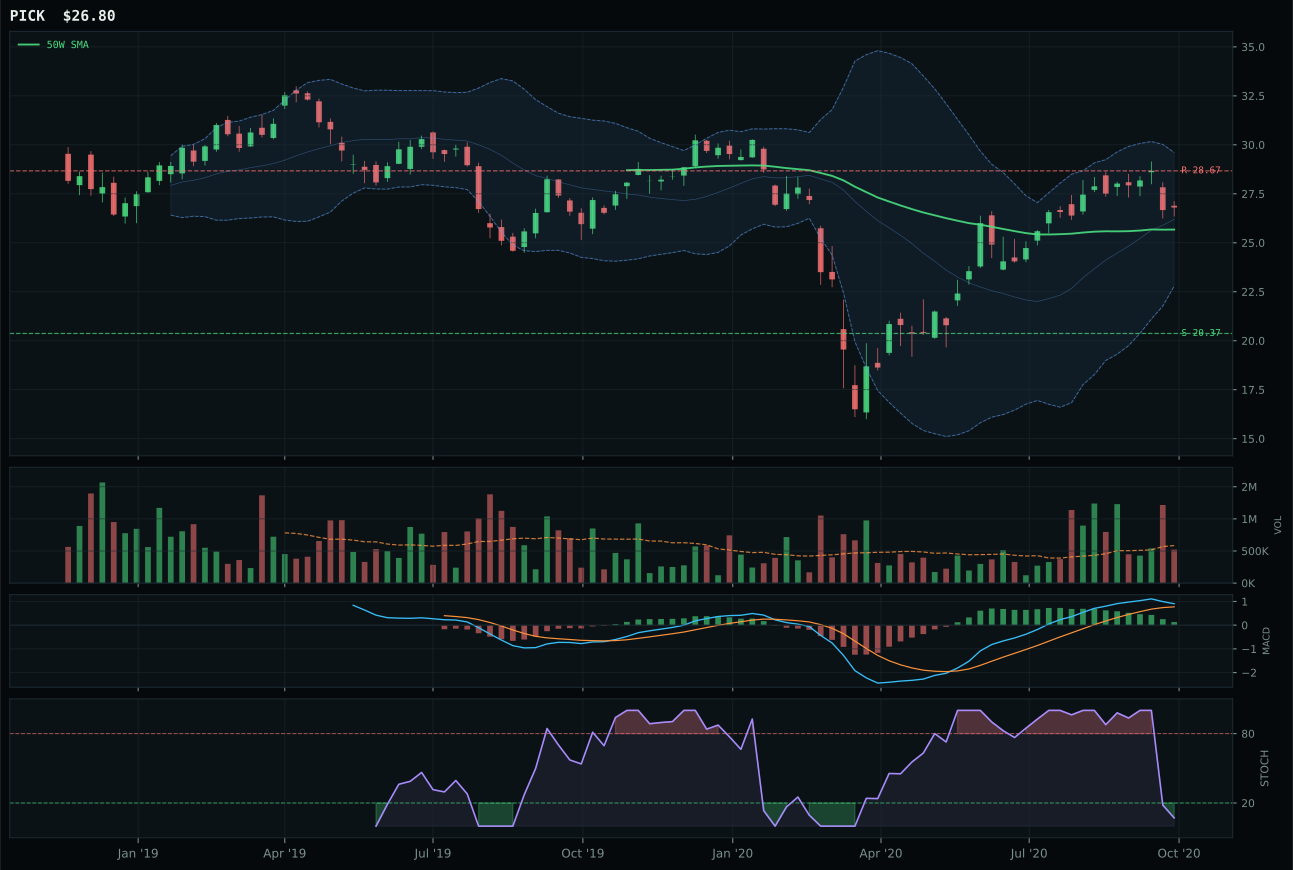
PICK has a neutral structure profile with 1.4% 13-week relative strength versus SPY.
A failed hold above support would weaken the setup.
Actionable but governed by invalidation levels.
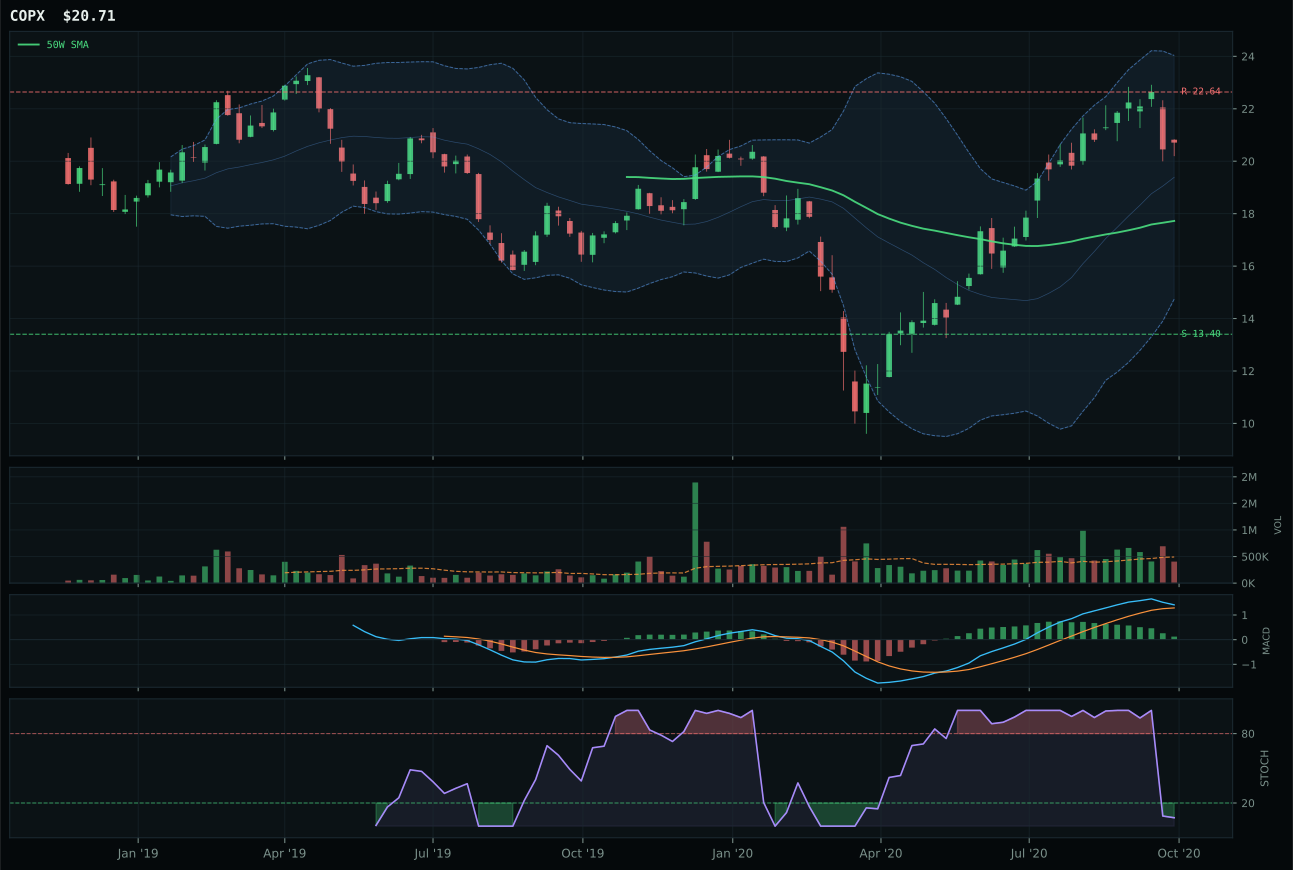
COPX has a vertical extension profile with 9.1% 13-week relative strength versus SPY.
A failed hold above support would weaken the setup.
Tracked, but not top-2 eligible because: .
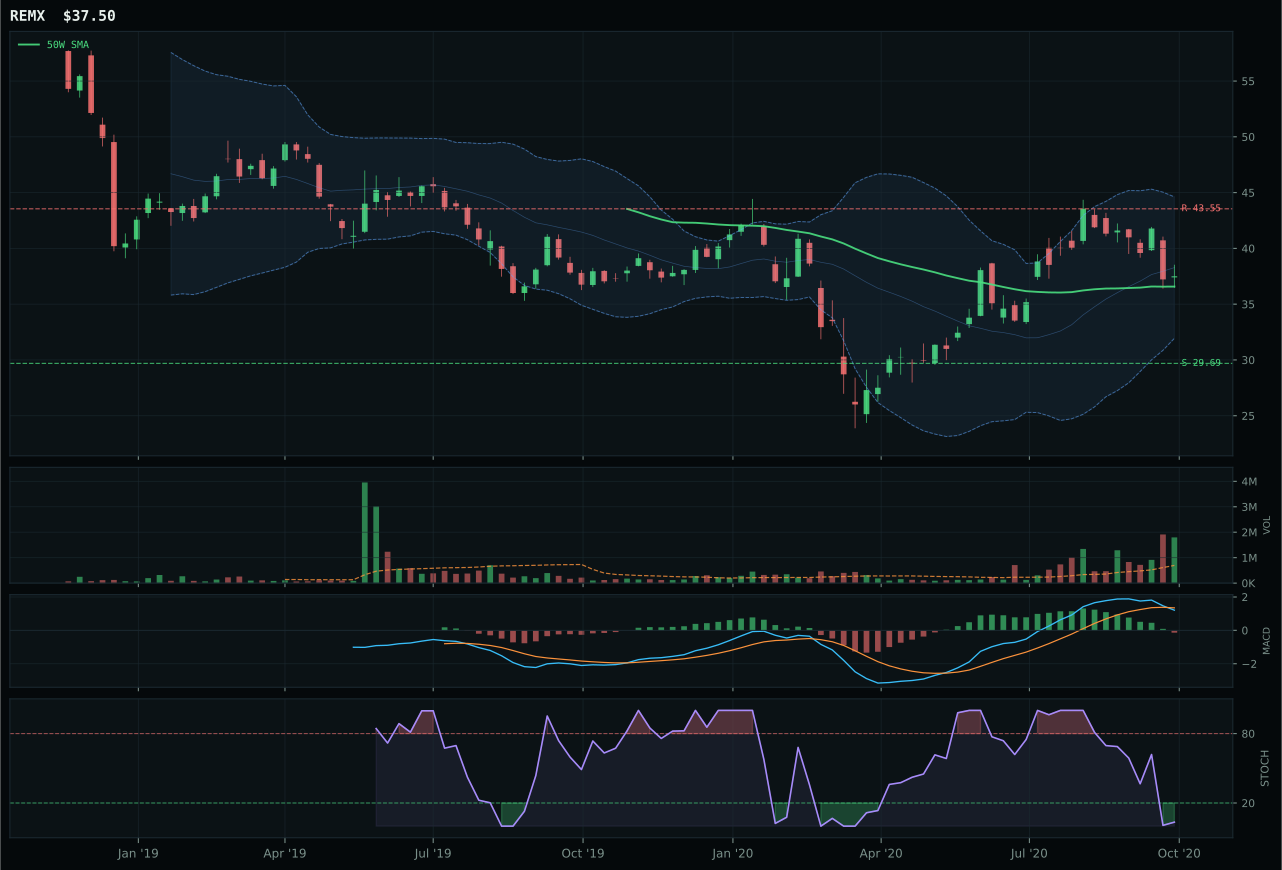
REMX has a compression near 50W profile with -0.3% 13-week relative strength versus SPY.
A failed hold above support would weaken the setup.
Actionable but governed by invalidation levels.
PICK wins by avoiding COPX's extension trap: while COPX sits 16.9% above the 50W in vertical extension with stochastic RSI oversold and volume neutral, PICK sits only 4.4% from the 50W with neutral structure and identical timing score at 85/100. The difference is risk/reward: COPX's 47.8/100 leaves minimal upside cushion (-6.5% to resistance) and high downside risk, while PICK's 48.7/100 trades 31.6% downside support for -6.5% upside—a healthier asymmetry for accumulation. COPX shows superior momentum at 86/100 and 16.0% 13-week return versus PICK's 59.7/100 and 8.4%, yet that performance came with thinner participation and is now extended into resistance. The 23.3-point gap reflects PICK's 67/100 composite versus COPX's 44/100: PICK's structure is cleaner (76.4 vs 74.6), timing is tighter (4.4% vs 16.9% from 50W), and the setup invites rather than punishes fresh capital allocation. Both have bullish but flattening MACD, but only PICK leaves room for buyers to establish position before resistance.
Industrial Metals receives 5% allocation as a tier-2 holding, supported by exceptional 79.0/100 macro fit driven by metals scarcity at +14 and commodity breadth positive at +10, the highest macro scores any category receives this week. Yet the 54.6 category score still ranks outside top-2, signaling that strong macro narrative alone cannot overcome modest technical evidence: PICK's 62.8/100 technical score is solid but not dominant. The Goldilocks regime at +6, combined with real asset sponsorship at +6, creates favorable conditions for mean-reversion accumulation in a dislocation market. Risk/reward at 48.7/100 warns that this is a boring, low-upside position—the 5% allocation assumes metals benefit from credit stress buffer rather than explosive upside. Volume confirmation at 58.0/100 is adequate but not enthusiastic, and category-relative strength at 0.0% means PICK is merely keeping pace with REMX and COPX rather than outrunning them. This allocation reflects the macro case for real assets in Goldilocks, not a technical breakout; if metals scarcity or commodity breadth descriptors flip negative, this sleeve should rotate immediately into higher-conviction themes.
Utilities & Infrastructure — XLU
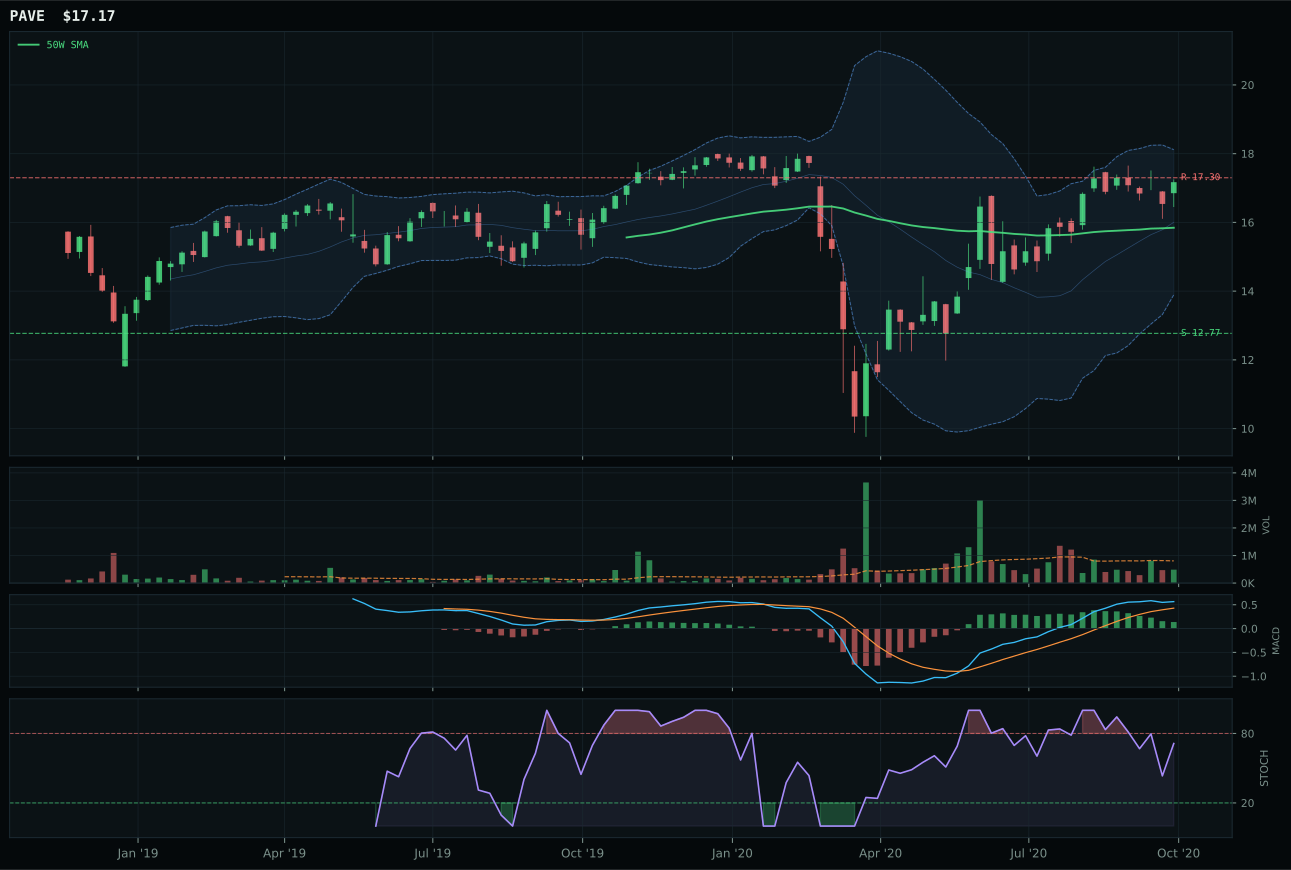
PAVE has a neutral structure profile with 6.3% 13-week relative strength versus SPY.
A failed hold above support would weaken the setup.
Actionable but governed by invalidation levels.
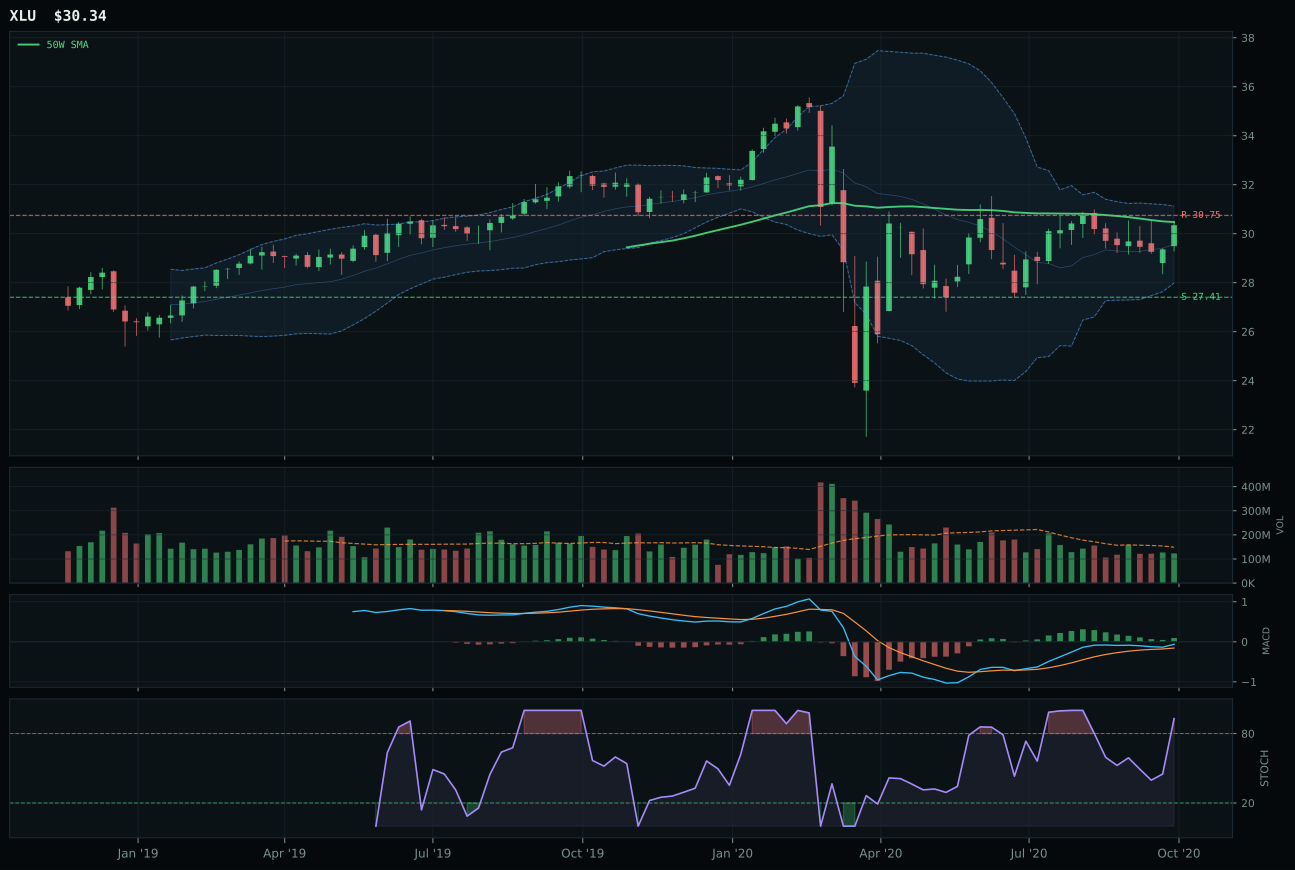
XLU has a compression near 50W profile with -2.1% 13-week relative strength versus SPY.
A failed hold above support would weaken the setup.
Actionable but governed by invalidation levels.
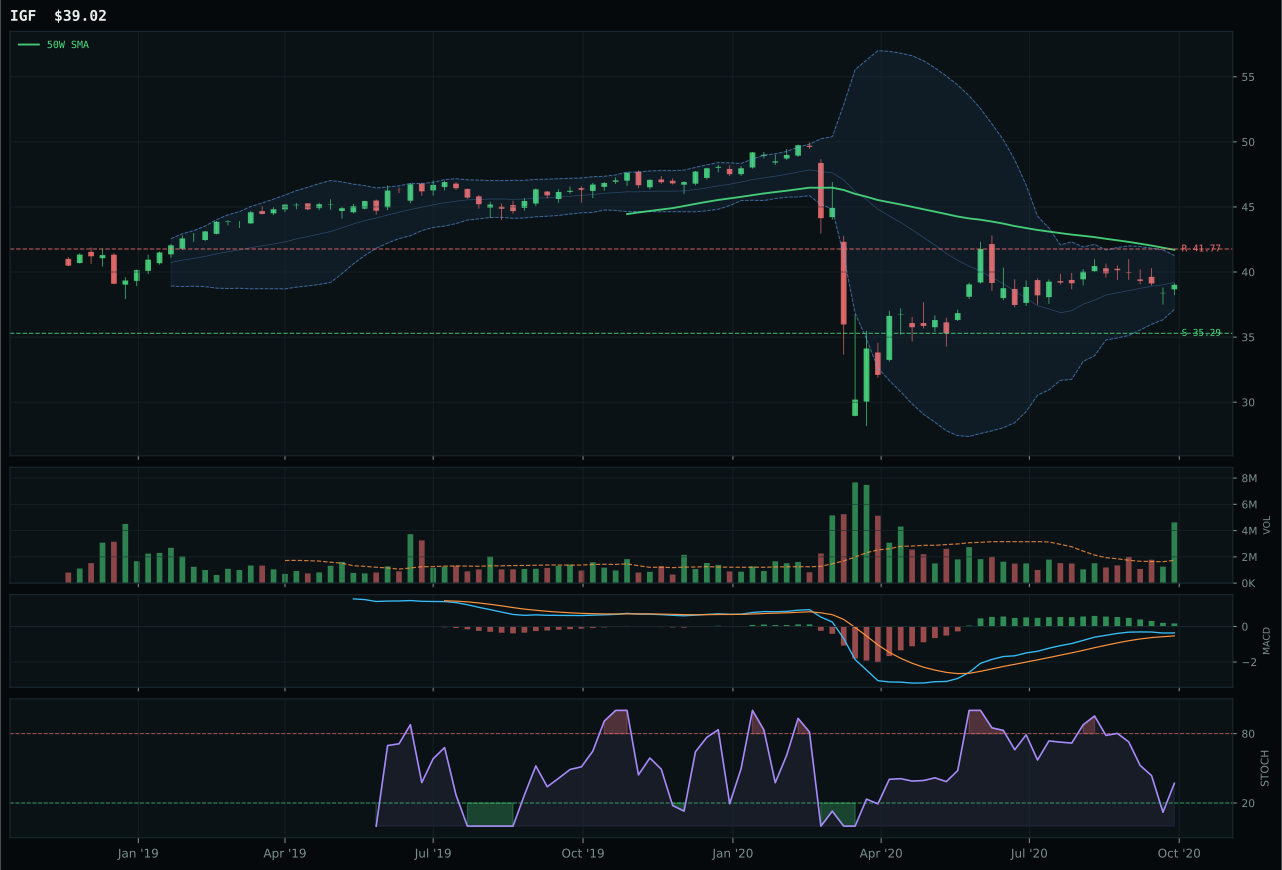
IGF has a neutral structure profile with -6.5% 13-week relative strength versus SPY.
Extension and support failure are the main tactical risks.
Tracked, but not top-2 eligible because: structurally broken.
XLU wins a close decision (only -1.2 points behind PAVE) by trading exceptional timing at 95/100—price at -0.4% from the 50W compression—versus PAVE's 78/100 timing at +8.4% extension. Both names sit neutral structure with bullish but flattening MACD, yet XLU's compression-at-50W setup offers a cleaner entry point for fresh capital without overextension risk. PAVE's 13-week return of 13.3% dwarfs XLU's 4.8%, and its 6.3% SPY-relative strength beats XLU's -2.1%, yet those metrics arrived with thin 0.72x volume participation versus XLU's neutral 0.83x, and PAVE's stochastic RSI is rising mid-zone versus XLU's overbought momentum at 0.93. Risk/reward is the deciding factor: PAVE's 37.4/100 score offers only -1.3% upside to resistance and minimal further extension room, while XLU's 47.2/100 delivers -1.3% upside but is compressing into support, leaving 10.7% downside before invalidation. The category is defense-biased, so PAVE's infrastructure beta is more thematically aligned, yet XLU's technical setup is cleaner and the infrastructure story can be played through the PAVE position if needed.
Utilities & Infrastructure receives 5% allocation as a tier-2 holding, with XLU representing defensive equity positioning in a Goldilocks regime where disinflation pressure at +6 supports regulated utility multiples. The 54.2 category score ranks 5th or 6th among the ten, outside top-2 consideration, and the 58.0 macro fit reflects modest tailwinds: the regime is transition/mixed at only +4, and risk appetite is negative at -2. XLU's 62.6/100 technical evidence is respectable but not dominant, and the 61.8/100 momentum confirmation is the weakest link in the setup. This allocation is structural hedging rather than conviction play: it acknowledges that Goldilocks regimes eventually deteriorate, and when they do, utilities provide both downside protection (4.8% 13-week return is recession-safe) and duration benefit (disinflation pressure at +6 supports multiple expansion). The compression-at-50W setup is the key: it allows defensive rotation without forcing entry at extended valuations, which is critical if growth rotations continue and this position needs to be held through weakness. If risk appetite flips negative or credit stress worsens, this 5% sleeve should immediately move higher within the portfolio architecture; for now, it sits as a quiet accumulation zone for macro-timing flexibility.
Precious Metals — GLD
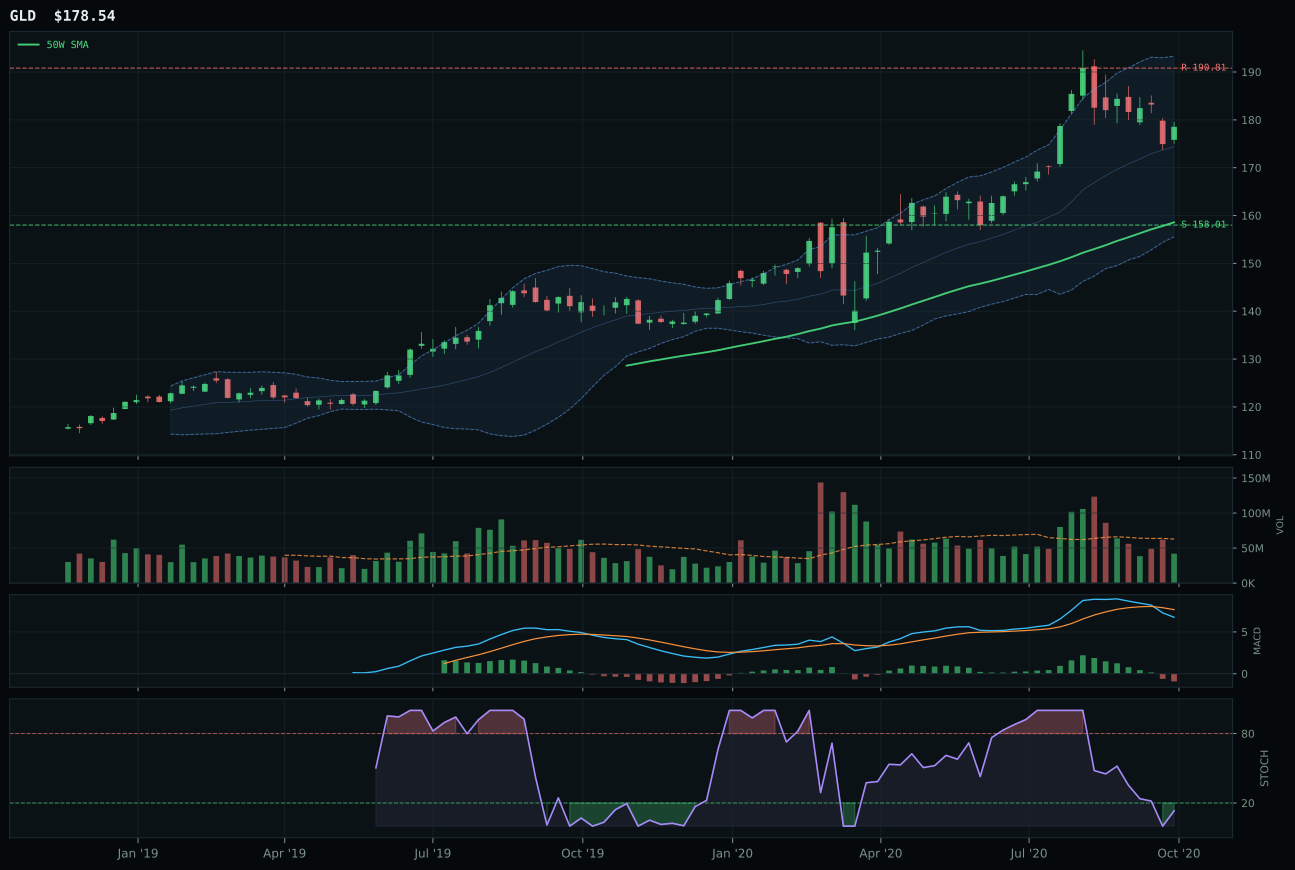
GLD has a neutral structure profile with 0.0% 13-week relative strength versus SPY.
A failed hold above support would weaken the setup.
Actionable but governed by invalidation levels.
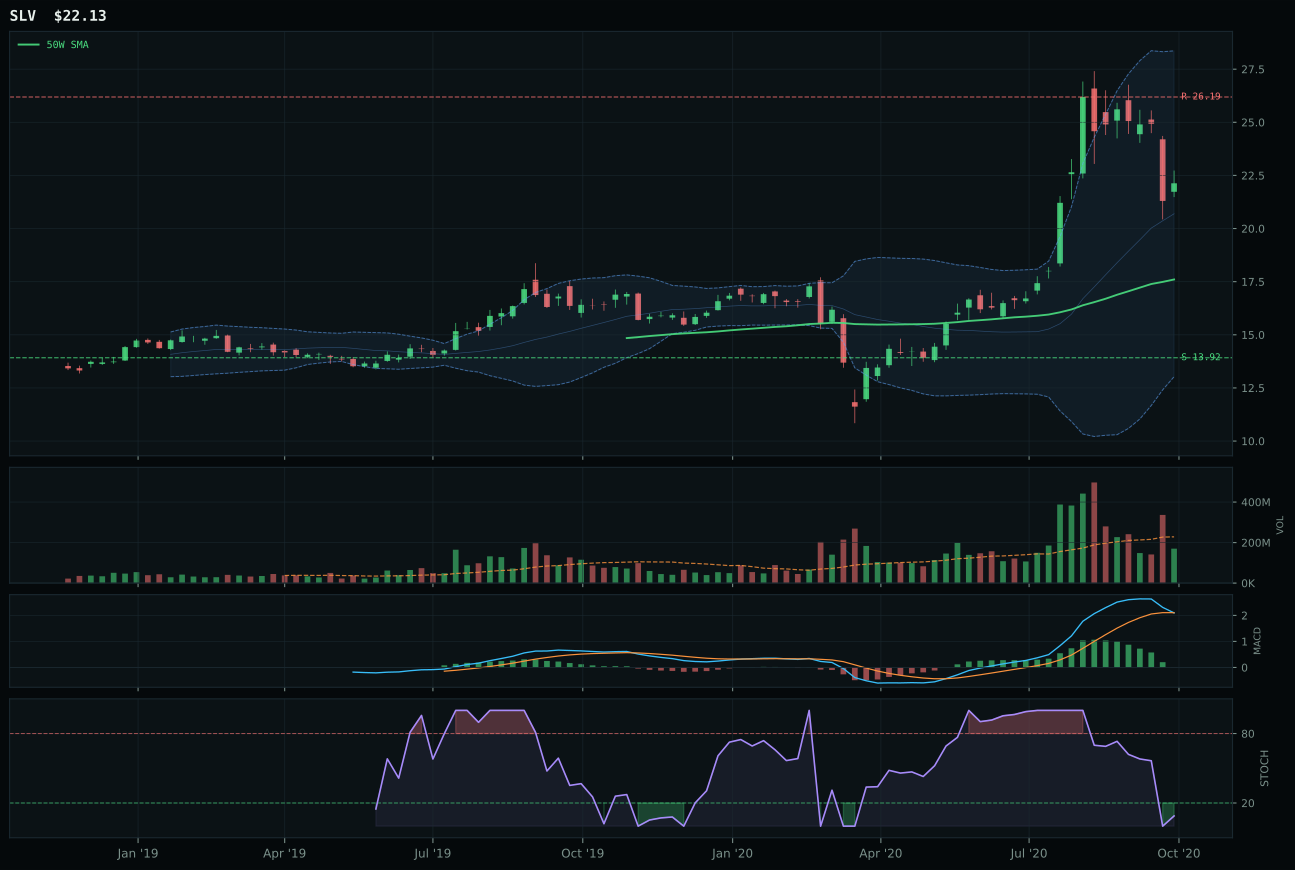
SLV has a vertical extension profile with 25.5% 13-week relative strength versus SPY.
A failed hold above support would weaken the setup.
Actionable but governed by invalidation levels.
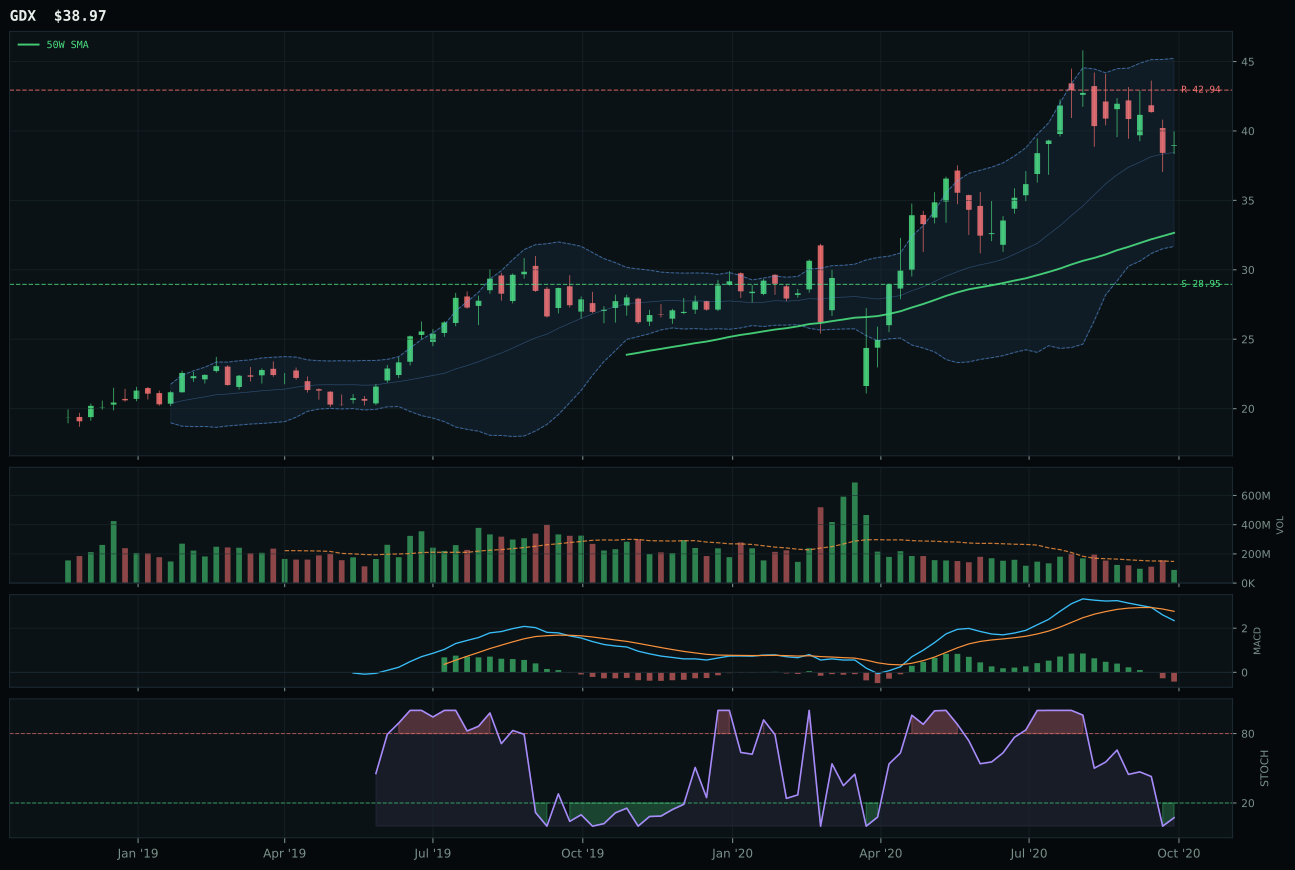
GDX has a vertical extension profile with 0.8% 13-week relative strength versus SPY.
A failed hold above support would weaken the setup.
Actionable but governed by invalidation levels.
GLD wins a difficult category by sustaining price above both moving averages and maintaining neutral structure at 75.1/100 despite bearish MACD and oversold stochastic RSI at 0.13. SLV, the runner-up, delivers far superior 13-week momentum at 32.4% and remarkable 25.5% SPY-relative strength—metrics that would normally dominate—but sits extended 25.7% from the 50W in a vertical extension setup, which violates the risk/reward guardrails at 34.7/100 versus GLD's 53.9/100. The critical difference is timing: GLD's 70/100 timing score reflects 12.6% distance from the 50W and oversold conditions that invite accumulation, while SLV's 48/100 timing warns of exhaustion near resistance at 26.19. SLV's 32.4% return looks like the narrative winner, yet it arrived with thin 0.72x volume participation on both names, meaning neither position is institutional-grade accumulation. GLD's 6.9% 13-week return is pedestrian, but the structure supports buyers proving intent at support 158.01 without overextension risk.
Precious Metals receives 5% allocation as a tier-2 holding, with GLD serving as the defensive monetary hedge in a regime where disinflation pressure is active at +6 but risk appetite is positive at -4, creating conflicting signals. The 42.5 category score ranks 5th or 6th, outside top-2 consideration, and the 50.0 macro fit score (lowest of all categories) reflects the awkward positioning: metals benefit from disinflation and credit stress hedging, yet in Goldilocks conditions with positive risk appetite, that narrative loses priority. GLD's 39.3/100 technical evidence is the category's primary driver, not macro sponsorship. The momentum confirmation score of 32.9/100 is weak, indicating slow accumulation rather than conviction buying, and volume-price confirmation at 43.0/100 suggests institutional hesitation. This allocation represents portfolio insurance rather than opportunity: it acknowledges that SLV's explosive 32.4% outperformance may be fool's gold (extended, thin volume, momentum rollover), and GLD's more stable structure offers better risk-adjusted entry if equities stumble. Any further extension in SLV should trigger a reallocation of this 5% away from metals entirely.
Agriculture & Livestock — MOO
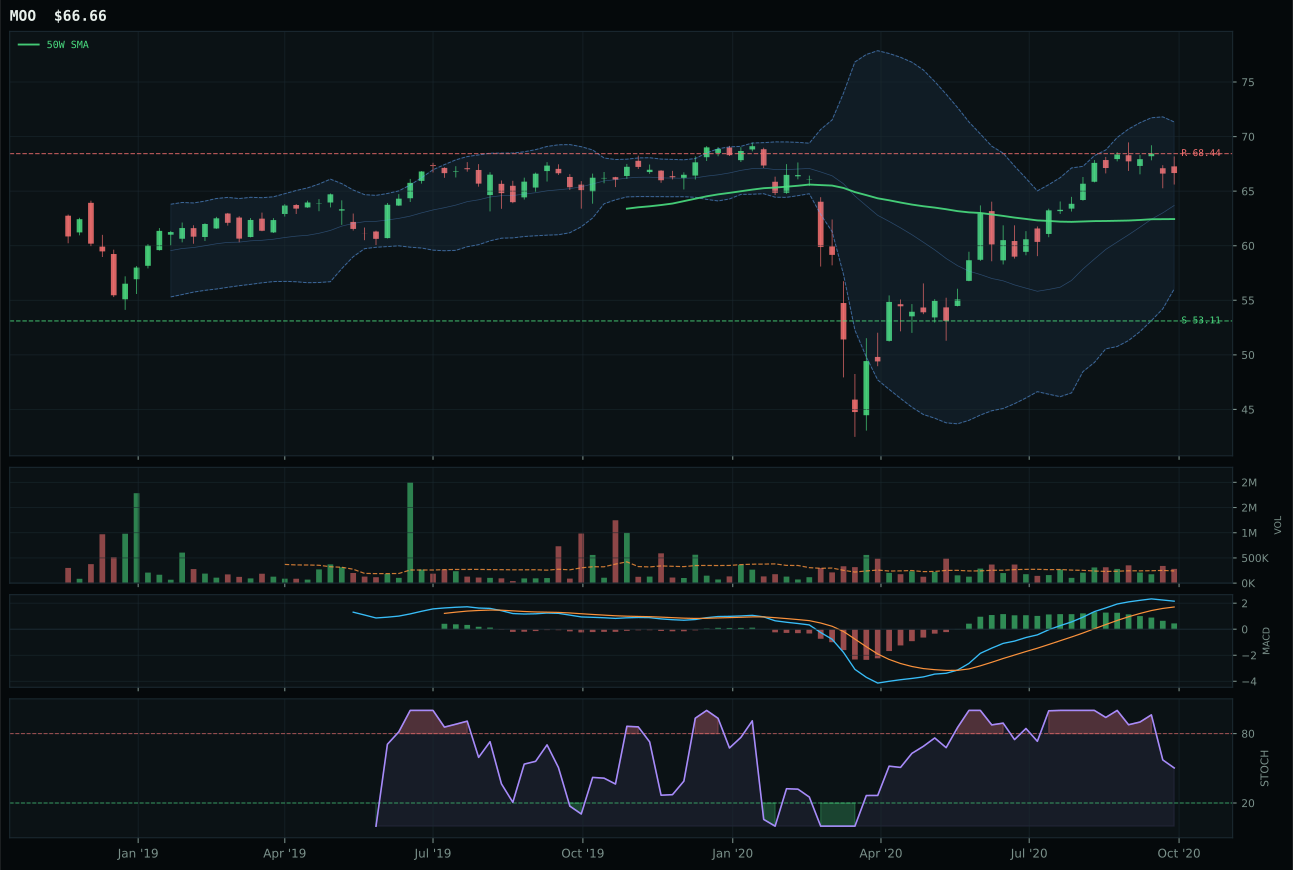
MOO has a neutral structure profile with 3.1% 13-week relative strength versus SPY.
A failed hold above support would weaken the setup.
Actionable but governed by invalidation levels.
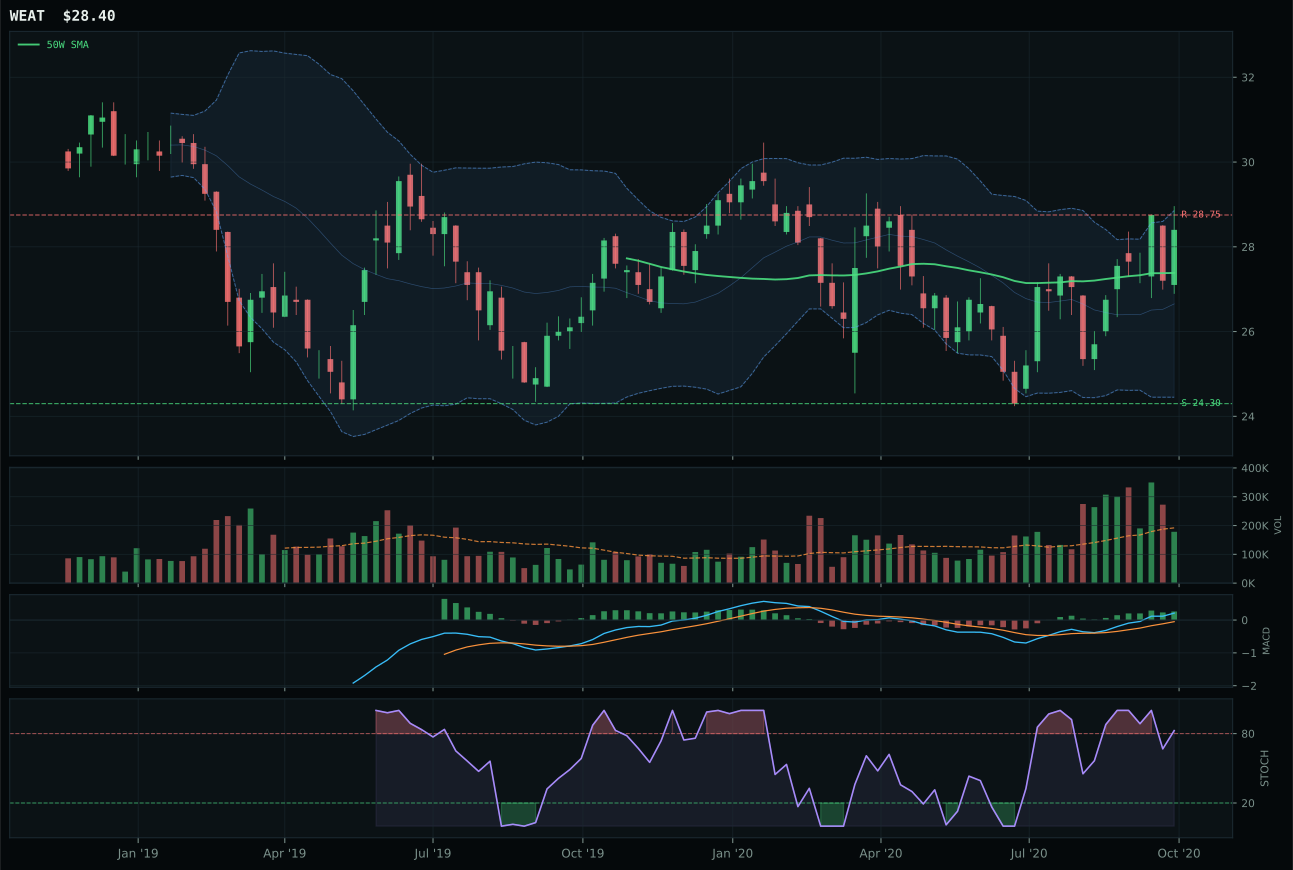
WEAT has a neutral structure profile with 5.8% 13-week relative strength versus SPY.
A failed hold above support would weaken the setup.
Tracked, but not top-2 eligible because: .
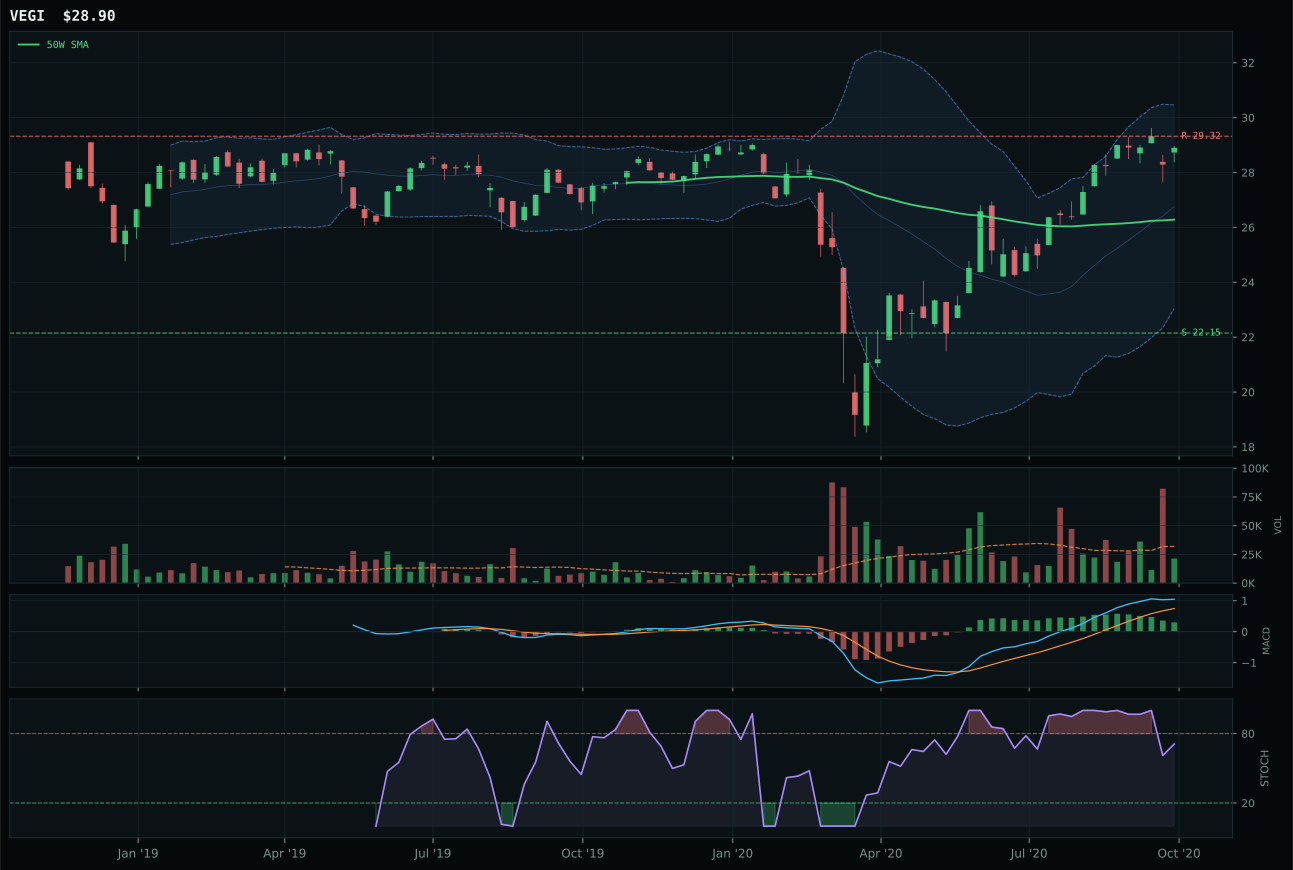
VEGI has a neutral structure profile with 8.4% 13-week relative strength versus SPY.
A failed hold above support would weaken the setup.
Tracked, but not top-2 eligible because: .
MOO wins decisively with a perfect 100/100 trend score and clean structure at 82.8/100, combining price above both moving averages with neutral composition and above-average 1.17x volume participation that confirms the move. WEAT, the runner-up, shows sharper 13-week momentum at 12.7% versus MOO's 10.0% and sports 5.8% SPY-relative strength, but those short-term gains mask deteriorating conditions: its stochastic RSI is overbought rolling over, MACD is bullish and improving (suggesting late-stage extension), and volume sits neutral rather than accumulated. The 23.6-point gap is the largest in this week's analysis, driven by MOO's 77.3/100 composite technical score versus WEAT's 54/100. MOO's falling/neutral stochastic at 0.50 paired with bullish but flattening MACD indicates consolidation strength—the setup is defending its 50W and not yet overbought—while WEAT's overbought rollover is a classic exhaustion tell. MOO's 6.8% proximity to the 50W gives buyers room to accumulate; WEAT's extended positioning leaves no error margin.
Agriculture & Livestock receives 5% allocation as a tier-2 holding, with MOO offering modest real-asset exposure in a Goldilocks regime where real asset sponsorship is active at +8. The 38.4 category score ranks 6th or 7th, well outside top-2 consideration, but the allocation reflects the overlay structure's demand for three to six 5% sleeves. MOO's 69.7/100 technical evidence is solid, yet the category's 50.0 macro fit score reveals the core constraint: disinflation pressure at -8 directly conflicts with commodity strength narratives, and the broader commodity breadth positive at +5 is modest. The risk/reward at 46.8/100 warns that upside to resistance is only -2.6%, leaving minimal room for extension; downside to support at 25.5% is healthier, but that assumes the macro stability persists. This allocation is a tactical real-asset hedge against liquidity surprise rather than a conviction growth play. If disinflation accelerates or commodity breadth rolls over, MOO's 0% category-relative strength versus WEAT's -2.7% suggests both names will struggle simultaneously, making this sleeve vulnerable to regime shift.
Defense & Aerospace — XAR
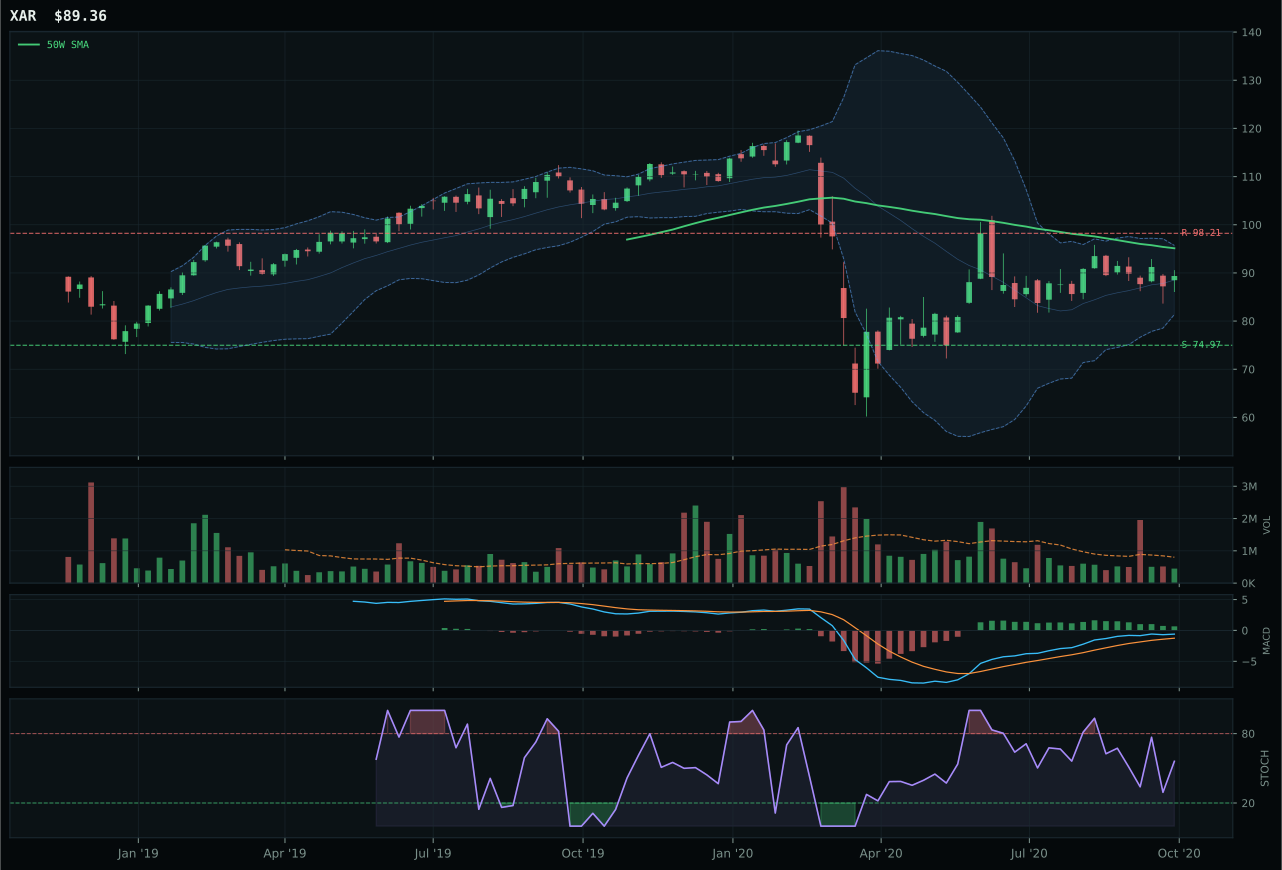
XAR has a neutral structure profile with -4.1% 13-week relative strength versus SPY.
A failed hold above support would weaken the setup.
Actionable but governed by invalidation levels.
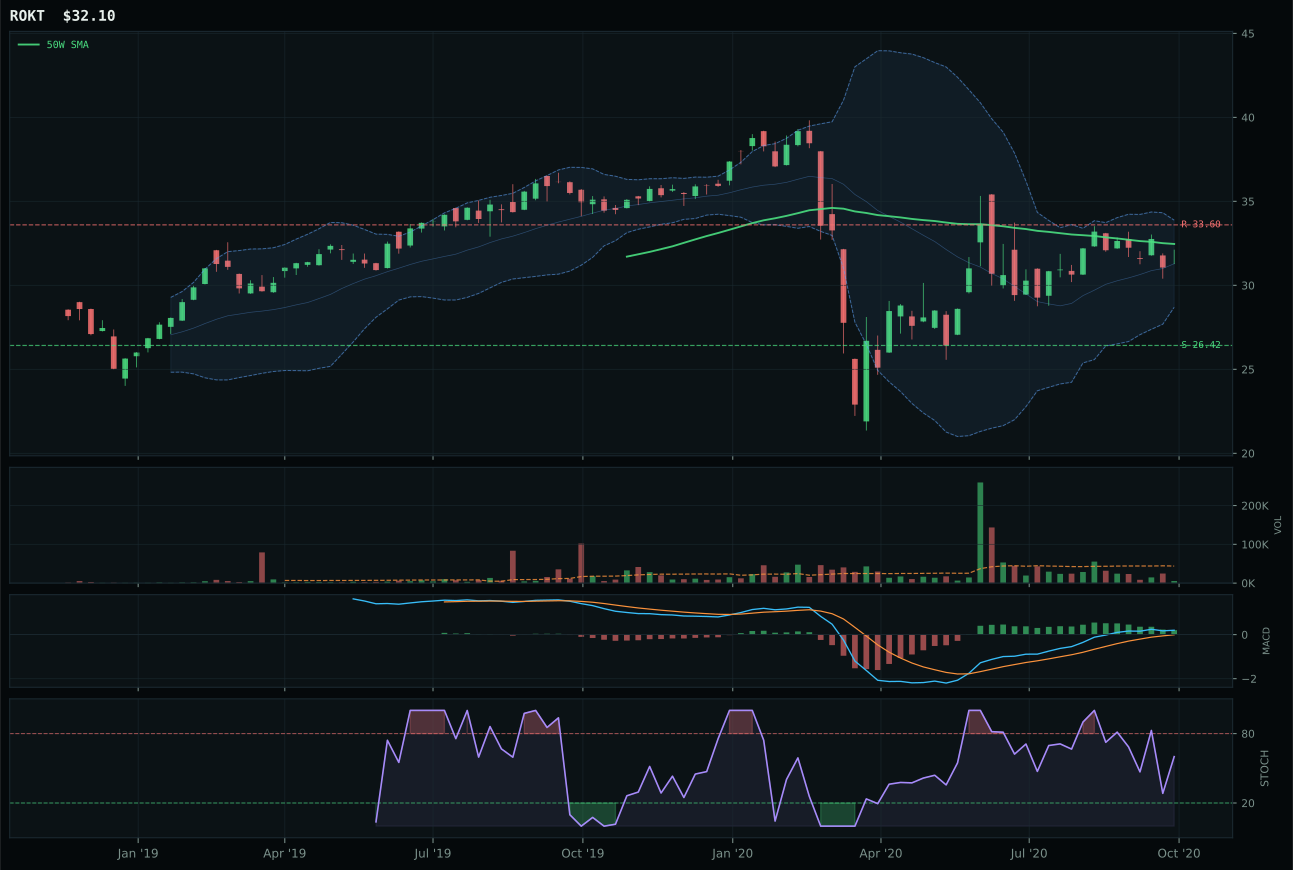
ROKT has a compression near 50W profile with -0.9% 13-week relative strength versus SPY.
A failed hold above support would weaken the setup.
Tracked, but not top-2 eligible because: .
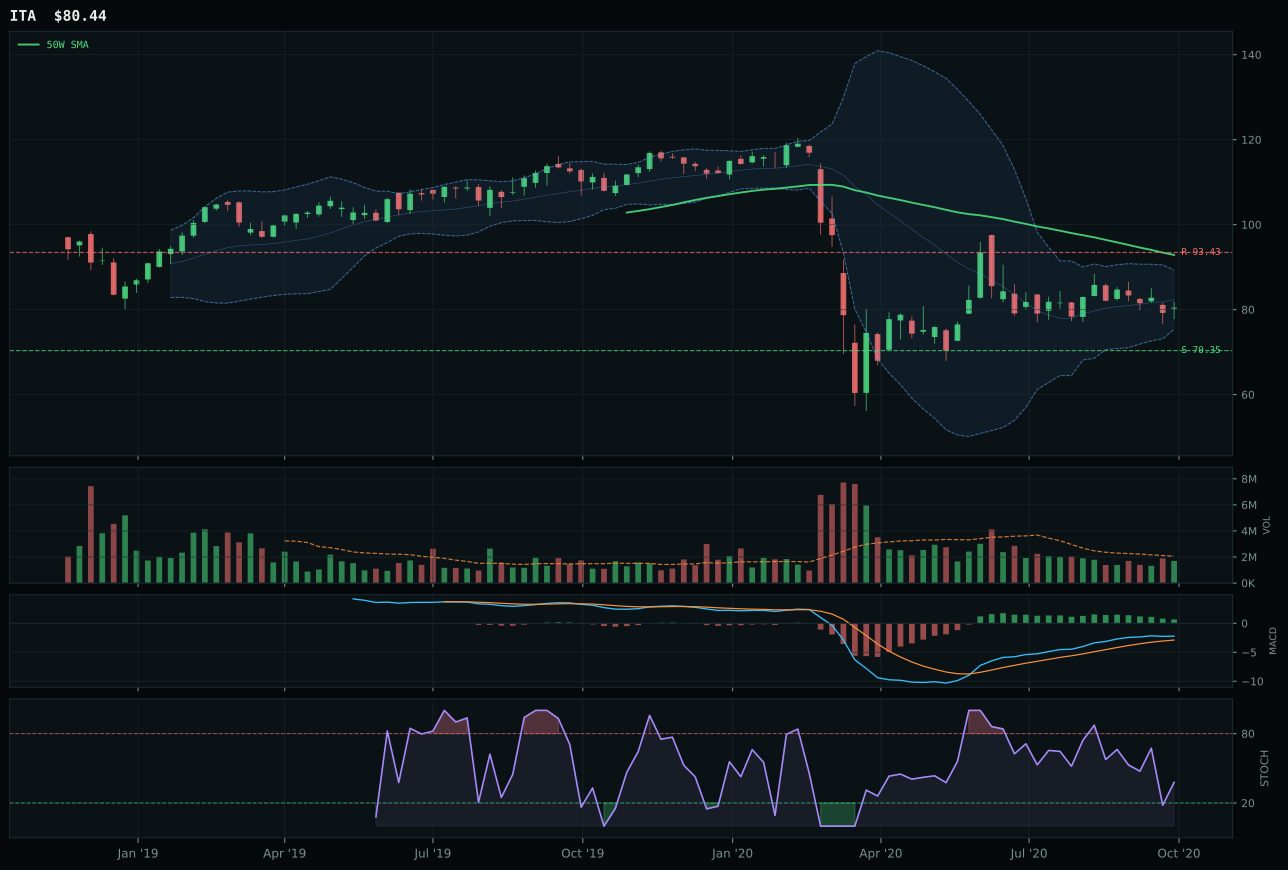
ITA has a neutral structure profile with -8.6% 13-week relative strength versus SPY.
Extension and support failure are the main tactical risks.
Tracked, but not top-2 eligible because: structurally broken.
XAR wins a weak category by default: it is structurally neutral and below the 50W, but timing is exceptional at 85/100 because price sits -6.1% from the moving average with stochastic RSI rising mid-zone, creating a setup where buyers can prove intent before committing fresh capital. ROKT, the runner-up, has superior momentum at 60/100 versus XAR's 47/100 and sits at compression near the 50W with a sharper 6.0% 13-week return, yet its risk/reward grade of 56.7 loses to XAR's 61.5 because the tighter range leaves less room before resistance at 33.60. Neither name carries meaningful SPY-relative strength—XAR at -4.1%, ROKT at -0.9%—which explains the category's overall 34.3 score and exclusion from top-2 consideration. The 13-point gap to ROKT feels more like choosing the lesser disappointment than finding a compelling catalyst; XAR's bullish but flattening MACD is not accelerating, and volume remains thin at 0.56x average participation.
Defense & Aerospace receives 5% allocation as a tier-2 holding, earning a spot only because the overlay structure demands three to six categories receive 5% sleeves. The category's 34.3 score ranks 7th or 8th among the ten, well below the top-2 threshold, and its 55.0 macro fit reflects neutral-to-negative tailwinds: credit stress is active but only at +2, while the Goldilocks regime provides only +3 support. Risk appetite is positive for the category at +7 on the ROKT comp, yet XAR—the actual winner—captures none of that benefit and instead sits with -4.1% SPY relative strength. This allocation is structural necessity rather than conviction: the category's technical evidence averages 52.6/100 across the three-ETF basket, and XAR's 60.2/100 technical score barely justifies inclusion. If macro conditions rotate toward recession or equity drawdown, this 5% sleeve should be the first candidate to redeploy, as it offers neither momentum nor relative strength to justify holding through volatility.
Nuclear Energy — NLR
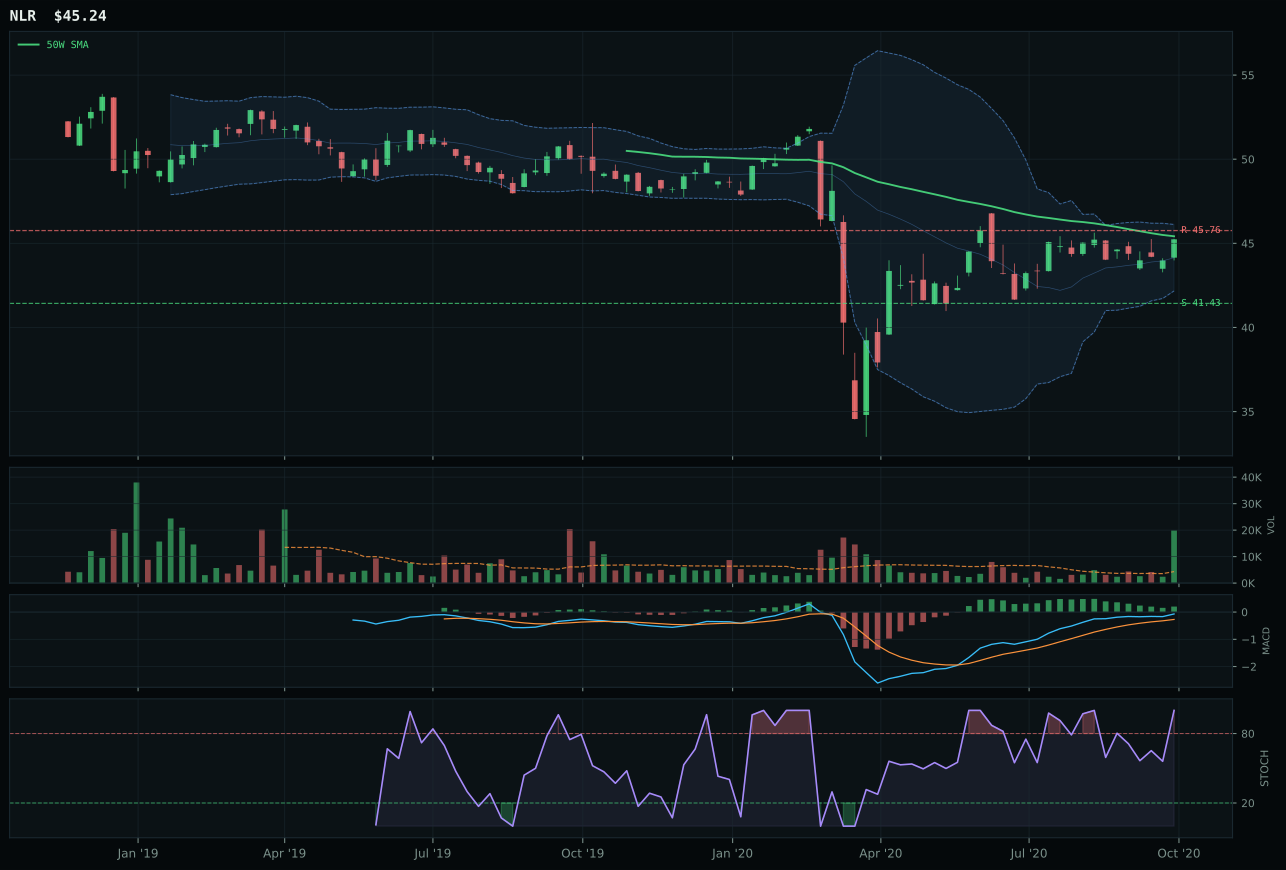
NLR has a compression near 50W profile with -2.3% 13-week relative strength versus SPY.
Extension and support failure are the main tactical risks.
Tracked, but not top-2 eligible because: structurally broken.

URNM has a neutral structure profile with -2.9% 13-week relative strength versus SPY.
A failed hold above support would weaken the setup.
Tracked, but not top-2 eligible because: .
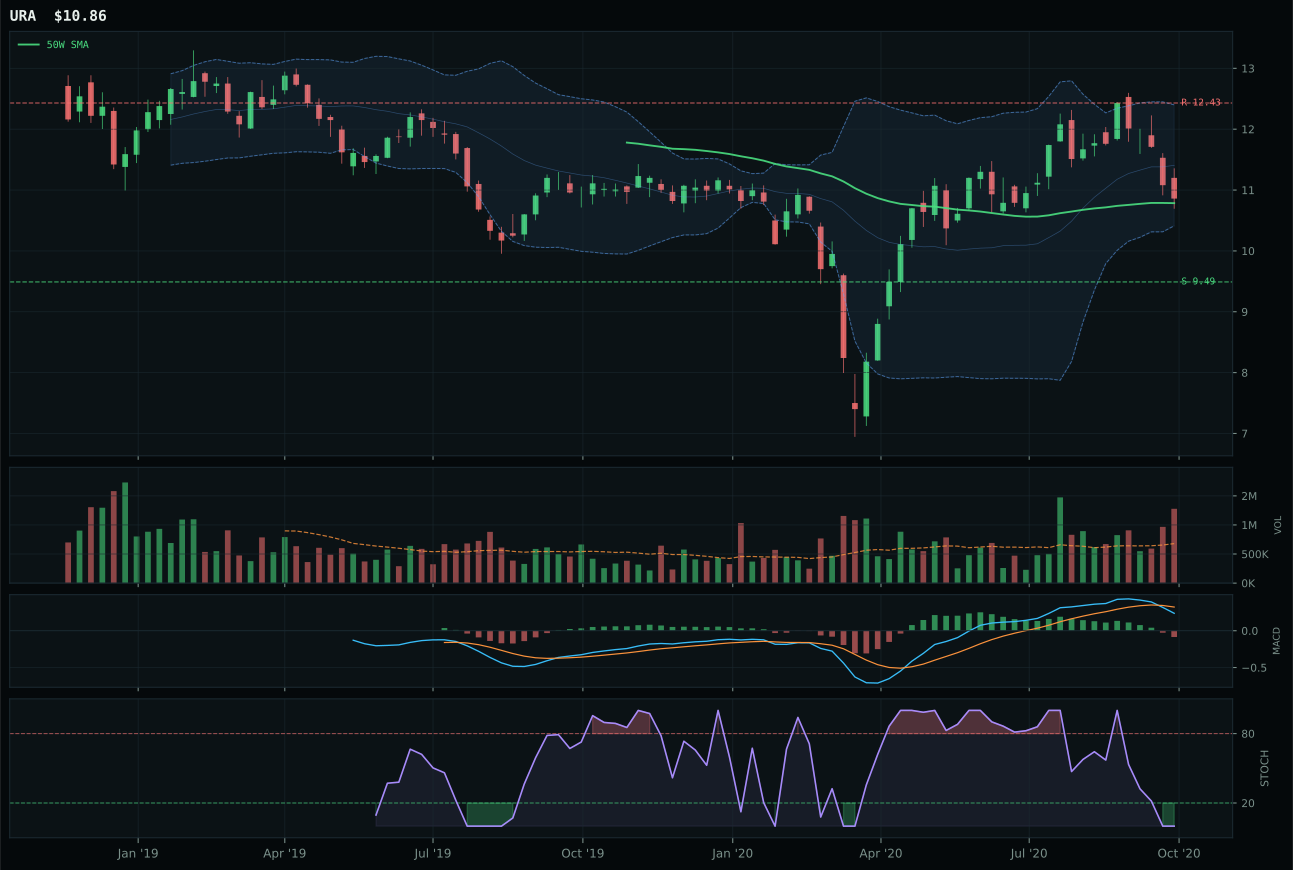
URA has a compression near 50W profile with -7.7% 13-week relative strength versus SPY.
A failed hold above support would weaken the setup.
Tracked, but not top-2 eligible because: .
NLR wins by offering the only bullish technical print in a structurally weakened category: while all three ETFs sit below the 200W, NLR trades compression near the 50W at -0.4% with exceptional 95/100 timing and above-average 4.58x accumulation-level volume confirmation. Price is at support 41.43 with stochastic RSI at overbought momentum 1.00, indicating buyers are actively defending the level, and MACD is bullish but flattening—not accelerating, but not deteriorating. URNM, the runner-up, has similar -2.9% RS versus SPY and sits neutral structure, yet its timing score of 85/100 versus NLR's 95/100 masks a critical difference: URNM's MACD is bearish/weakening versus NLR's bullish but flattening, and stochastic RSI is oversold versus overbought. The 7.7-point gap reflects NLR's 42.0/100 technical evidence versus URNM's 26.1/100—a massive spread driven by volume confirmation (68.8 vs 23) and MACD direction (bullish vs bearish). NLR's 4.6% 13-week return is modest, but the 4.58x volume print signals uranium players are accumulating strength despite broad-market weakness, a rare tell.
Nuclear Energy receives 0% allocation this week and is excluded from the portfolio entirely, ranked 9th or 10th due to eligibility filters triggered by below-200W price action. The 27.0 final category score reflects hard technical breaks that override the 57.0 macro fit—the second-highest macro fit of all categories, driven by real asset sponsorship at +7 and AI growth sponsorship at +5 (data center power demand). Yet the Goldilocks regime does not contain explicit nuclear tailwinds, and credit stress at -5 creates headwinds. NLR's 42.0/100 technical evidence is the category's only strength, but it is insufficient to overcome the structural break below the 200W. The category reasoning is clear: if nuclear energy is a legitimate long-term structural theme (it is), it needs price above the 200W and momentum confirmation above 50/100 to justify capital allocation. Currently, NLR's exceptional 95/100 timing paired with 4.58x volume looks like capitulation-bounce accumulation, not trend confirmation. If NLR breaks and holds above 45.76 resistance with sustained volume participation above 1.0x, the category could re-enter top-2 consideration; until then, this allocation slot remains reserved for higher-probability technical setups.
Traditional Energy — XLE
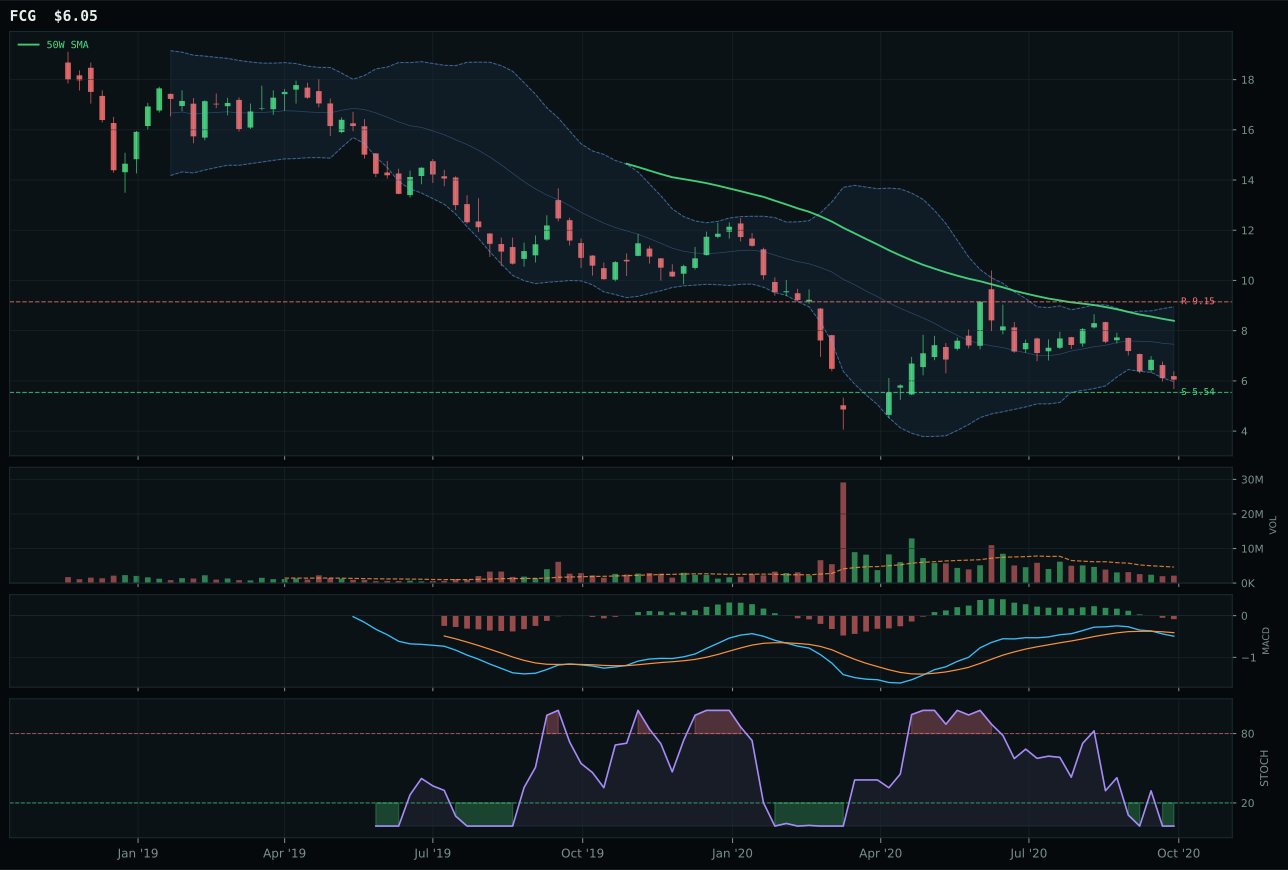
FCG has a neutral structure profile with -26.4% 13-week relative strength versus SPY.
Extension and support failure are the main tactical risks.
Tracked, but not top-2 eligible because: structurally broken.
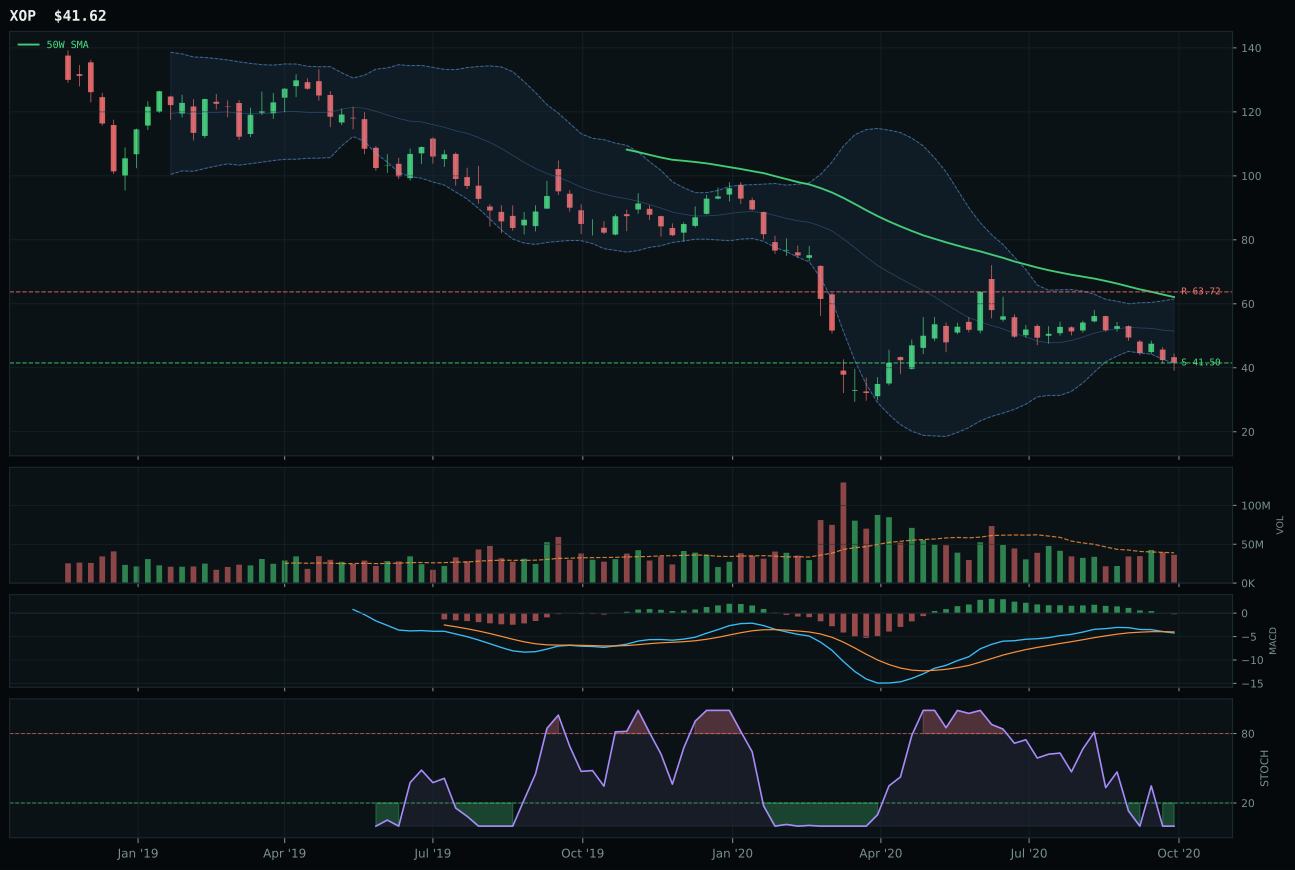
XOP has a pullback into support profile with -26.8% 13-week relative strength versus SPY.
Extension and support failure are the main tactical risks.
Tracked, but not top-2 eligible because: structurally broken.
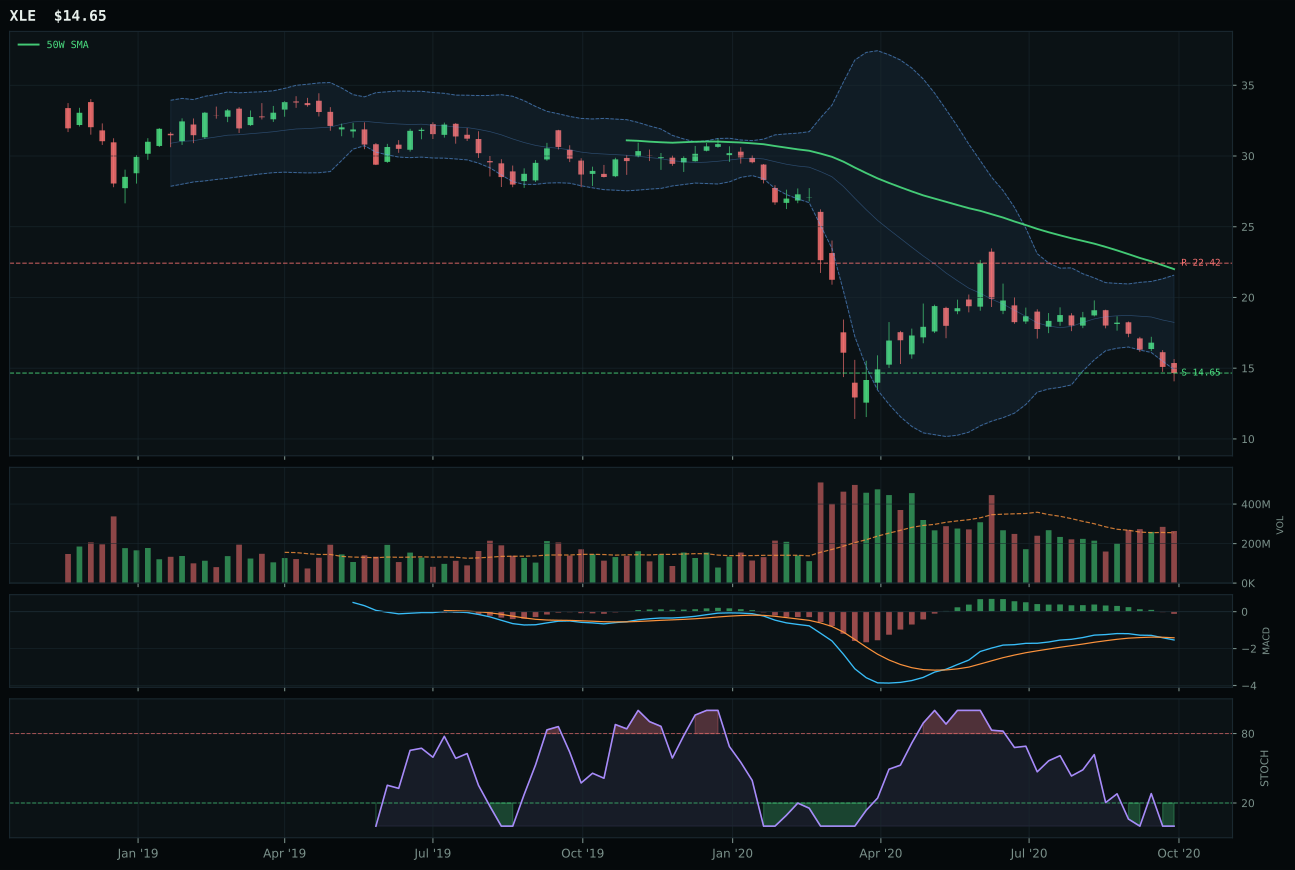
XLE has a pullback into support profile with -28.4% 13-week relative strength versus SPY.
Extension and support failure are the main tactical risks.
Tracked, but not top-2 eligible because: structurally broken.
XLE wins a broken category by representing the least-damaged setup: all three ETFs in this basket are structurally negative, but XLE's -33.4% distance from the 50W paired with pullback-into-support structure at 36.2/100 offers more defined risk than ROKT or FCG. Price sits at support 14.65 with risk/reward grading at 75/100—the highest in the category—because downside is essentially zero while upside to resistance at 22.42 is symmetrical. XLE's stochastic RSI is completely oversold at 0.00, MACD is bearish/weakening, and momentum confirmation is 0.0/100, making this a pure technical capitulation setup, not an institutional accumulation. FCG loses on structure (31.8 vs 36.2) and timing (50.0 vs 60.0) despite having marginally superior RS at -26.4% versus XLE's -28.4%. The category-level score of 0.0 reflects that no ETF in the basket qualifies as eligible due to hard filters triggering on trend deterioration, below-200W positioning, and zero momentum confirmation. XLE's 13-week return of -21.5% is catastrophic, and 1.03x volume at neutral participation confirms sellers are not capitulating on heavy volume—this is silent accumulation into capitulation, not reversal confirmation.
Traditional Energy receives 0% allocation this week and is excluded from the portfolio entirely, ranked 9th or 10th among the ten categories. The 0.0 final category score reflects hard eligibility filters triggered by structurally broken technicals: all three ETFs sit below the 200W, trend scores max at 12/100, and momentum confirmation is 0.0/100 across the basket. The 40.0 macro fit score is the second-lowest of all categories (only Precious Metals at 50.0 is weaker), driven by disinflation pressure at -10 and credit stress at -7, which directly oppose energy sector strength narratives. Real asset sponsorship at +7 is insufficient to overcome the weight of negative macro descriptors in a Goldilocks regime where growth assets dominate. XLE's 0.0 technical evidence score means all its information content comes from macro fit (47.0/100), which is barely above the 40.0 category fit—a red flag that macro narrative is propping up a technically dead chart. If energy prices bounce sharply higher and volume participation suddenly increases during a relief rally, this category could re-enter consideration; for now, the energy sector is simply outside the portfolio's allocation framework, and capital is better deployed in the eight categories that qualify for placement.