
2020-09-25
Informational purposes only. The content in this report, including allocations, analysis, and commentary, is provided solely for informational and educational purposes. It does not constitute financial advice, investment advice, trading advice, or any other type of advice. Past performance does not guarantee future results. Always conduct your own research and consult a qualified financial professional before making investment decisions.
Some tracked tickers were excluded due to missing live weekly price data: SGOV: Historical cache SGOV has only 17 usable weekly bars
Weekly Allocation
| Ticker | Category | Weight | Role |
|---|---|---|---|
| FSOL | 50% | Overlay | |
| BOTZ | AI | 10% | Top-2 (10%) |
| INDA | Emerging Markets | 10% | Top-2 (10%) |
| CIBR | Technology | 5% | Tier-2 (5%) |
| XLU | Utilities & Infrastructure | 5% | Tier-2 (5%) |
| GLD | Precious Metals | 5% | Tier-2 (5%) |
| PICK | Industrial Metals | 5% | Tier-2 (5%) |
| XAR | Defense & Aerospace | 5% | Tier-2 (5%) |
| NLR | Nuclear Energy | 5% | Tier-2 (5%) |
Trade Instructions — Monday Open
Sell the tranche from 2020-08-28 (completing its 4-week hold). Buy the new tranche. Instructions show net portfolio changes — same-asset positions cancel, weight changes show the delta.
| Action | Ticker | Instruction |
|---|---|---|
| SELL | PICK | Sell 14% of PICK position (reduce 8.75% → 7.50%) |
| SELL | XLK | Sell 67% of XLK position (reduce 3.75% → 1.25%) |
| SELL | SLV | Sell 33% of SLV position (reduce 3.75% → 2.50%) |
| SELL | ITA | Sell 50% of ITA position (reduce 2.50% → 1.25%) |
| SELL | MOO | Sell 25% of MOO position (reduce 5.00% → 3.75%) |
| SELL | PAVE | Sell 50% of PAVE position (reduce 2.50% → 1.25%) |
| BUY | BOTZ | Buy BOTZ — 14.29% of freed cash (adds 1.25% to portfolio) |
| BUY | INDA | Buy INDA — 14.29% of freed cash (adds 1.25% to portfolio) |
| BUY | XLU | Buy XLU — 14.29% of freed cash (adds 1.25% to portfolio) |
| BUY | GLD | Buy GLD — 14.29% of freed cash (adds 1.25% to portfolio) |
| BUY | XAR | Buy XAR — 14.29% of freed cash (adds 1.25% to portfolio) |
| BUY | CIBR | Buy CIBR — 14.29% of freed cash (adds 1.25% to portfolio) |
| BUY | NLR | Buy NLR — 14.29% of freed cash (adds 1.25% to portfolio) |
Current Portfolio After Trade
Combined holdings across all 4 active tranches. Each tranche is 25% of the portfolio.
| Ticker | % of Portfolio | Weight Bar |
|---|---|---|
| FSOL | 50.00% | |
| INDA | 7.50% | |
| PICK | 7.50% | |
| BOTZ | 5.00% | |
| IGV | 5.00% | |
| MOO | 3.75% | |
| XLU | 3.75% | |
| GLD | 3.75% | |
| SLV | 2.50% | |
| XAR | 2.50% | |
| XLK | 1.25% | |
| ITA | 1.25% | |
| PAVE | 1.25% | |
| SMH | 1.25% | |
| URNM | 1.25% | |
| CIBR | 1.25% | |
| NLR | 1.25% |
Macro Regime — Goldilocks
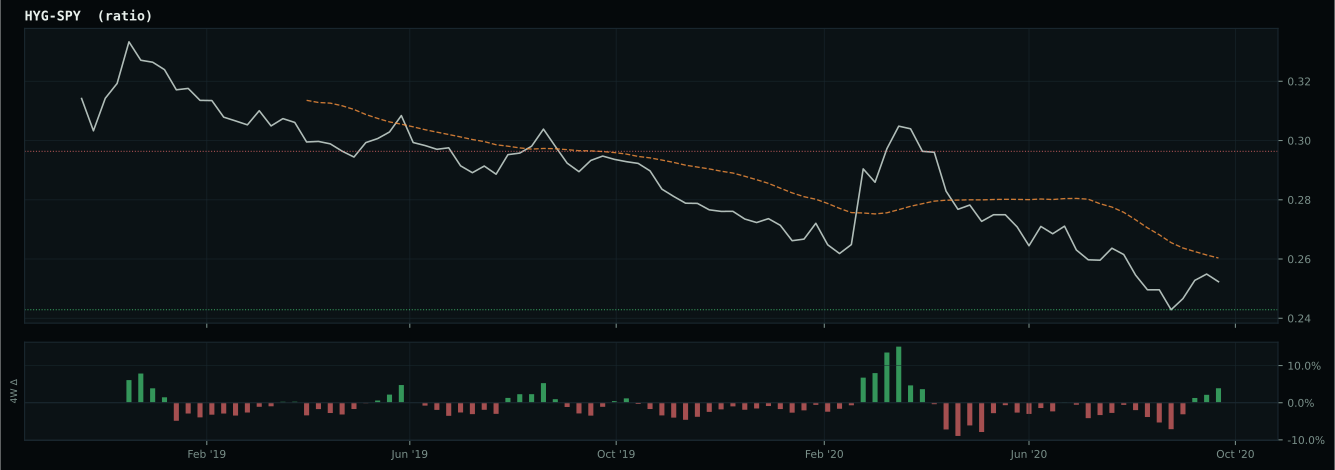
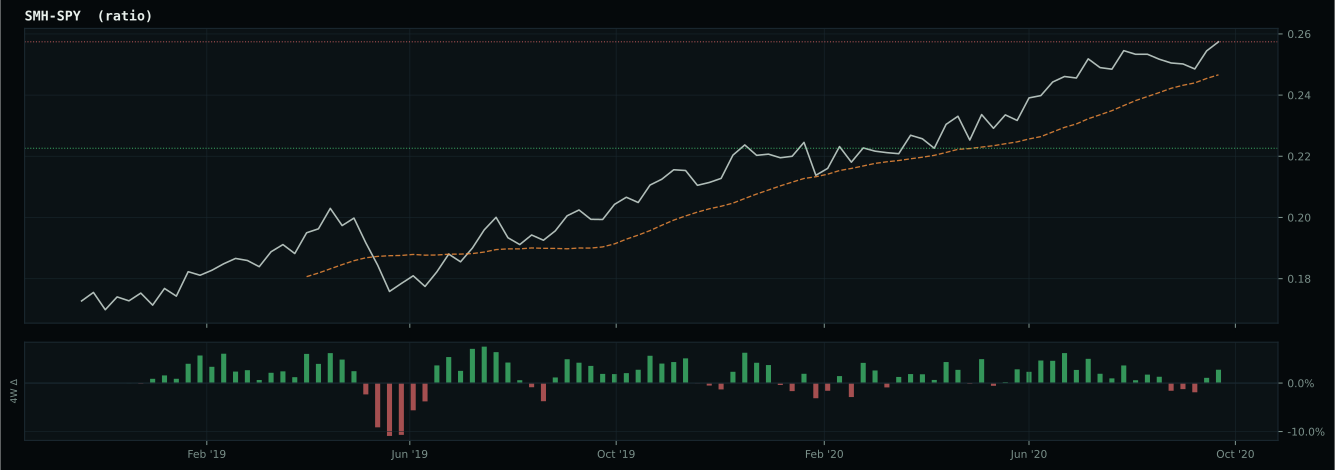
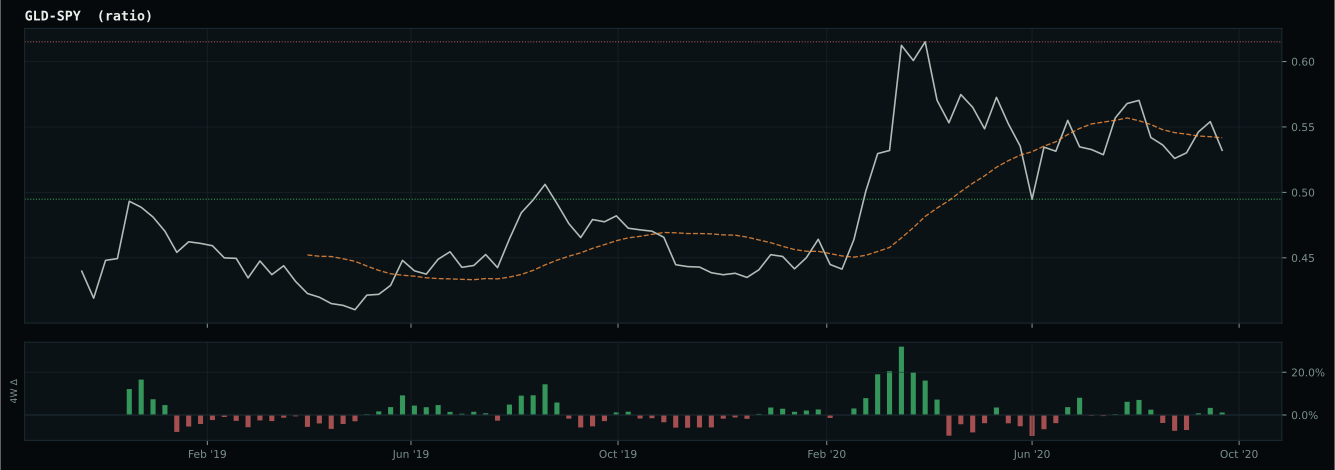
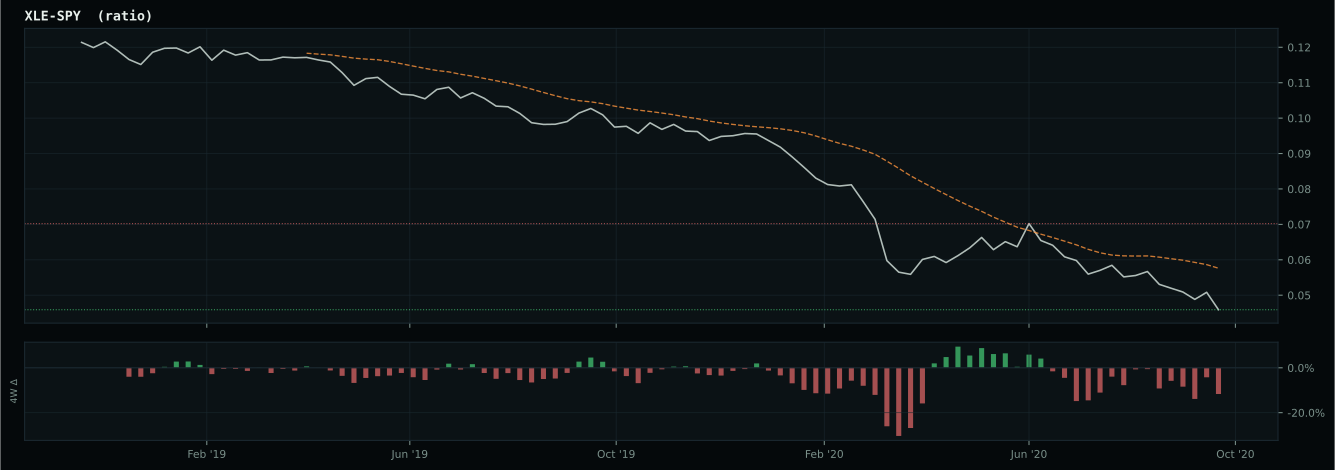
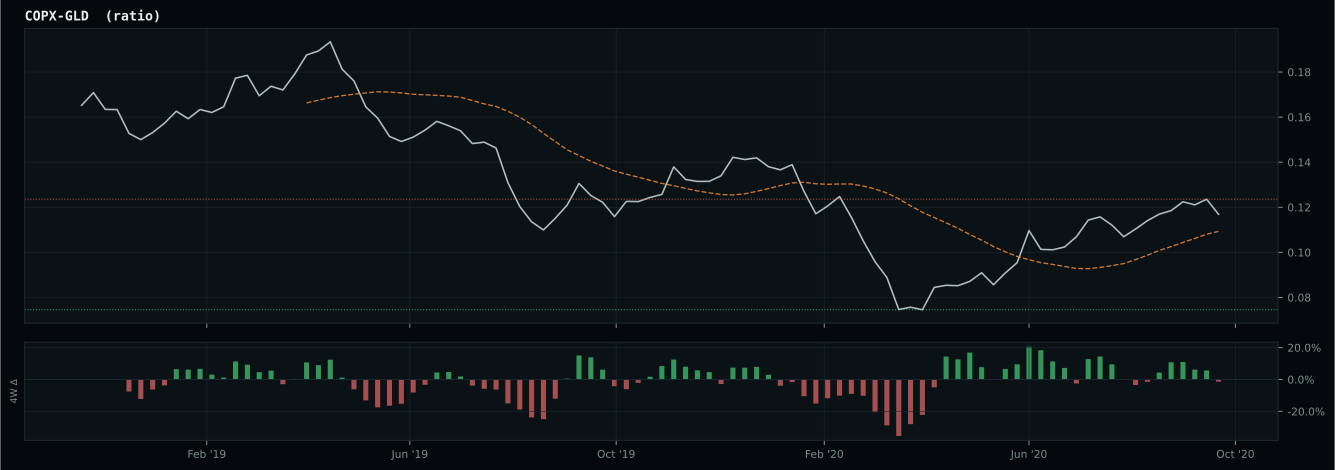
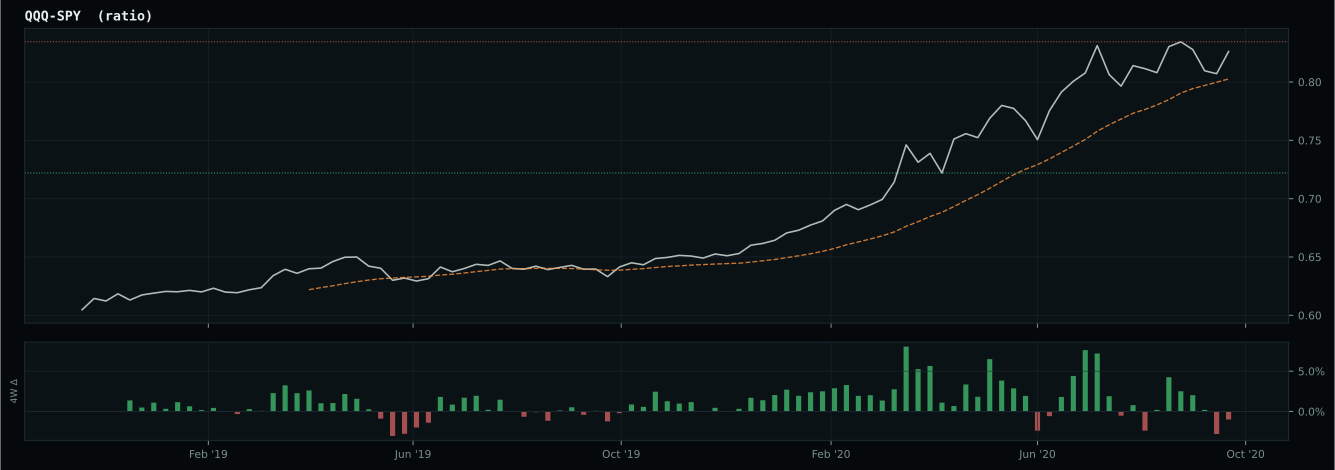
Macro Evidence Charts
Market-implied signals behind the macro regime scores. Each ratio compares two assets; the direction and slope of the ratio is what the macro engine reads.
Crypto Regime — AltSeason
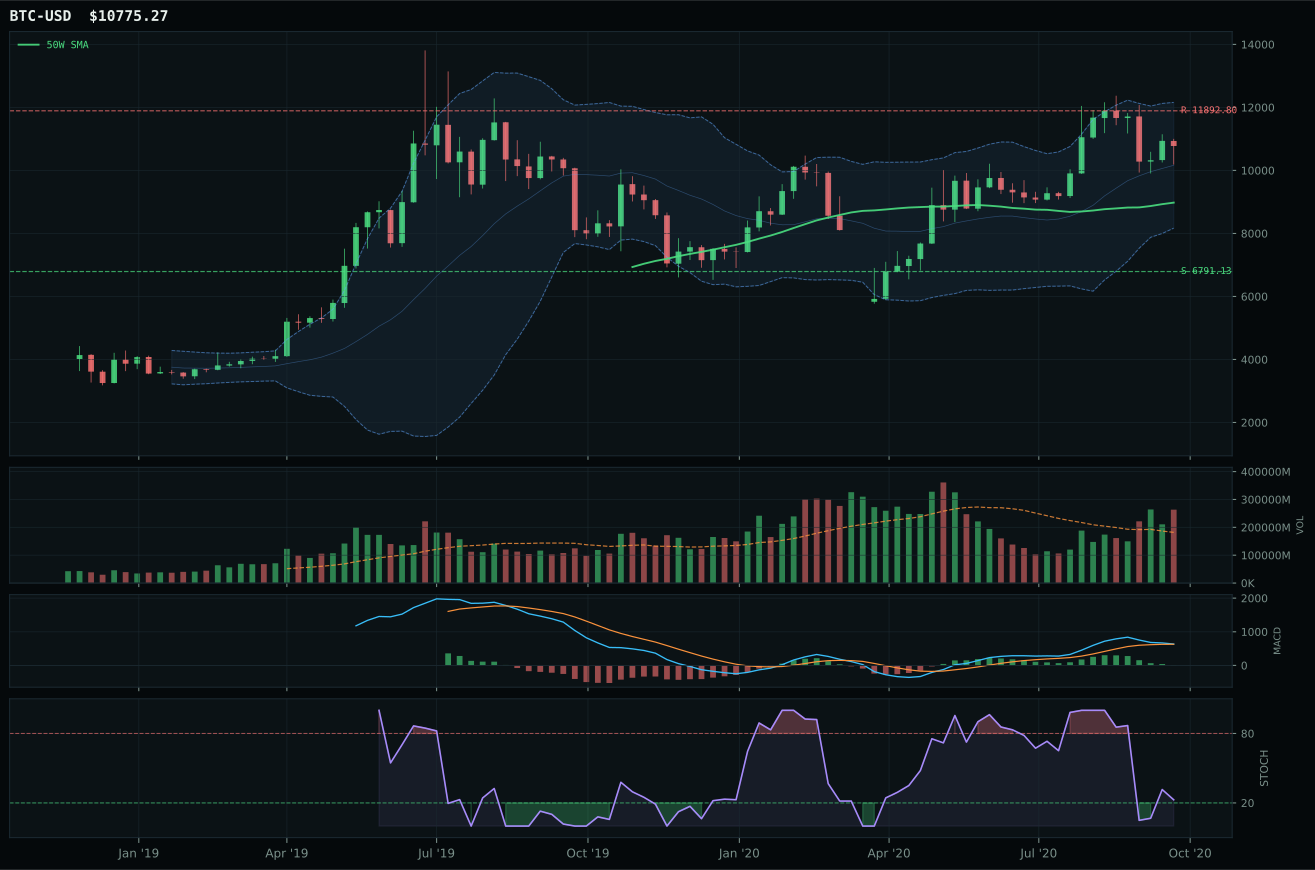
post-touch structure is too wide to count as a range; max/min close ratio is 2.21
TrendBTC confirmed: 2 consecutive closes above rising/flat 50W SMA
all available AltSeason conditions pass; missing optional confirmations skipped

Category Rankings
| Rank | Category | Winner | Score | Alloc | 4W Ret | Peers (4W) |
|---|---|---|---|---|---|---|
| 1 | AI | BOTZ | 57.6 | 20% | +4.93% | SMH +6.2% · AIQ +5.3% |
| 2 | Emerging Markets | INDA | 54.5 | 20% | +2.20% | IEMG +5.2% · ILF +5.7% |
| 3 | Technology | CIBR | 50.4 | 10% | +2.14% | XLK +1.1% · IGV +3.7% |
| 4 | Utilities & Infrastructure | XLU | 46.7 | 10% | +8.94% | PAVE +8.1% · IGF +4.0% |
| 5 | Precious Metals | GLD | 41.8 | 10% | +1.66% | SLV +4.3% · GDX -1.0% |
| 6 | Industrial Metals | PICK | 38.9 | 10% | +4.57% | COPX +7.2% · REMX +10.1% |
| 7 | Defense & Aerospace | XAR | 33.9 | 10% | +2.99% | ROKT +2.8% · ITA +1.2% |
| 8 | Nuclear Energy | NLR | 23.9 | 10% | +6.66% | URA -0.6% · URNM -4.3% |
| 9 | Agriculture & Livestock | MOO | 20.6 | 0% | +2.30% | VEGI +3.6% · WEAT +12.4% |
| 10 | Traditional Energy | XLE | — | 0% | -2.80% | XOP +1.8% · FCG +6.9% |
AI — BOTZ
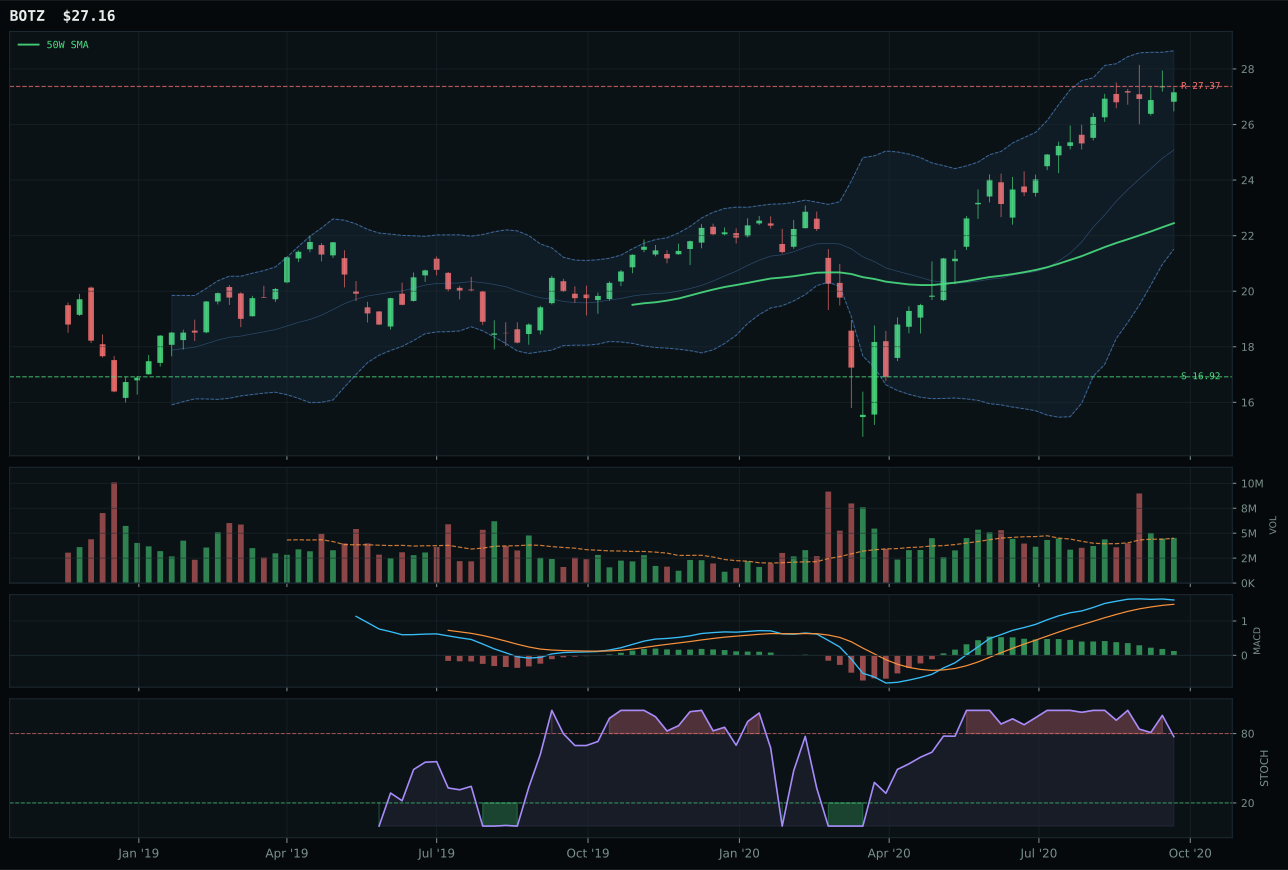
BOTZ has a vertical extension profile with 5.7% 13-week relative strength versus SPY.
A failed hold above support would weaken the setup.
Actionable but governed by invalidation levels.
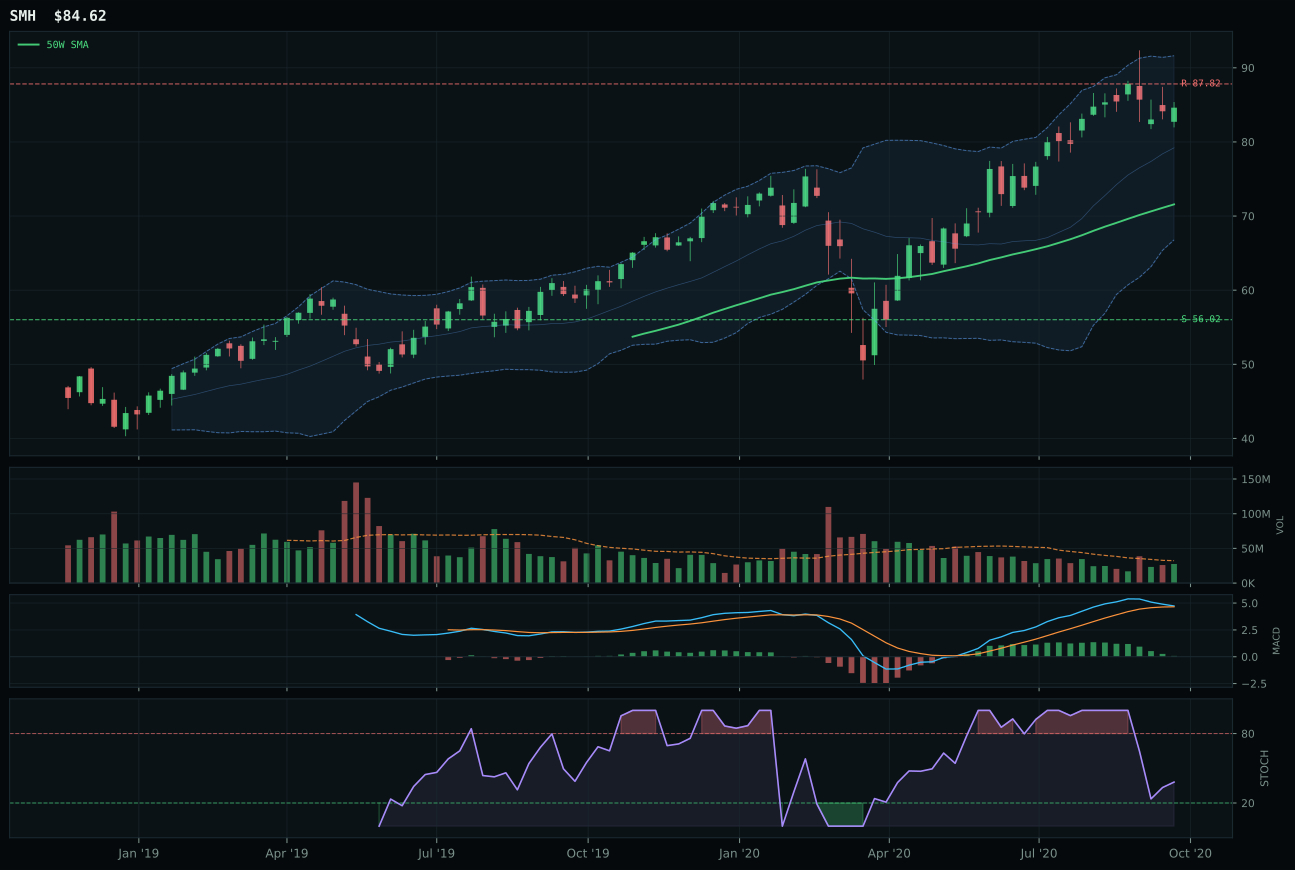
SMH has a vertical extension profile with 5.0% 13-week relative strength versus SPY.
A failed hold above support would weaken the setup.
Actionable but governed by invalidation levels.
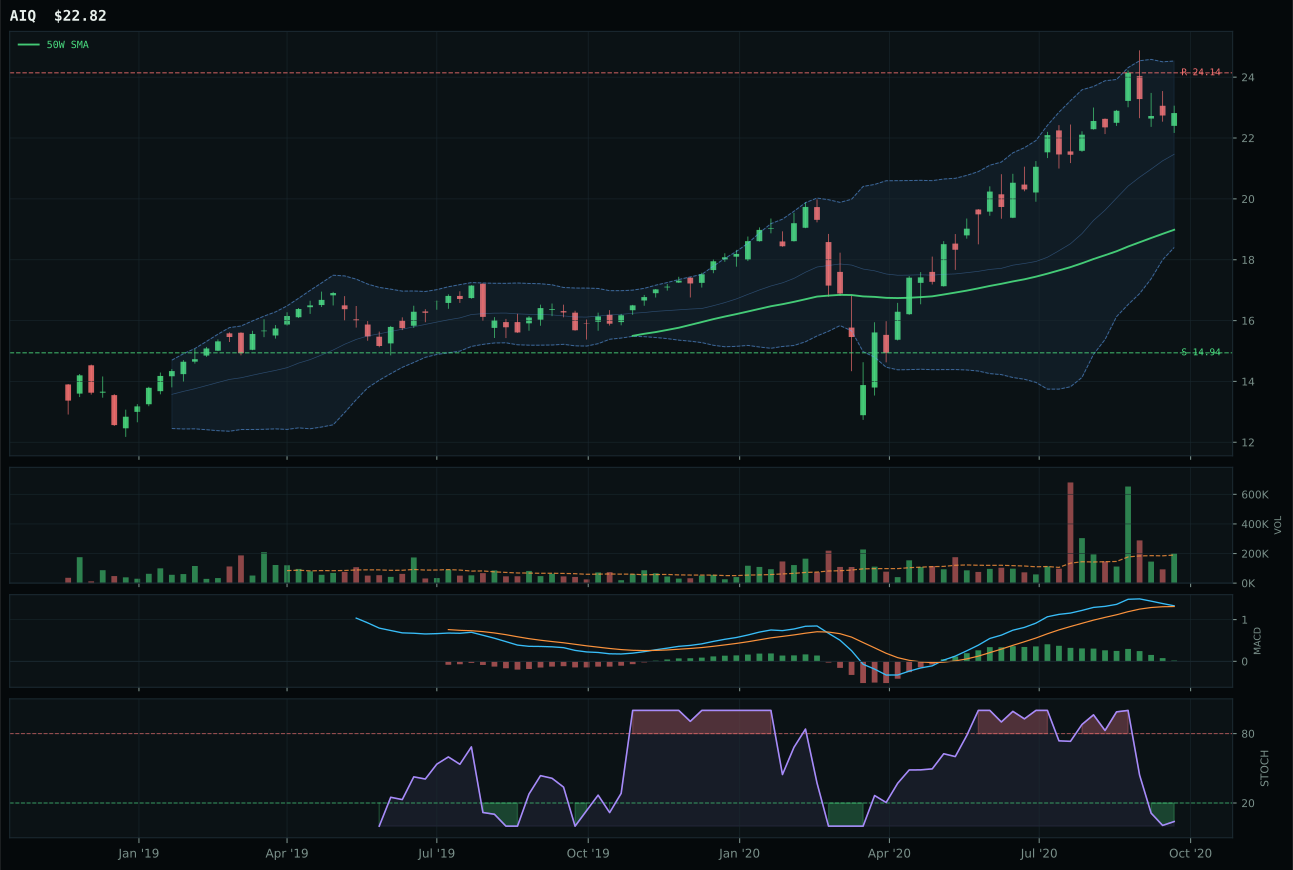
AIQ has a vertical extension profile with 2.8% 13-week relative strength versus SPY.
A failed hold above support would weaken the setup.
Tracked, but not top-2 eligible because: .
BOTZ won AI despite SMH's slightly higher composite score because category-relative strength broke in BOTZ's favor at 0.7% versus 0.0%. Both sit in vertical extension—BOTZ 21.0% above the 50W, SMH equally stretched—but the tiebreaker is internal basket leadership. BOTZ's 15.3% 13W return and 5.7% SPY-relative strength create the micro-conviction that robotics-cycle demand (as opposed to semiconductor scarcity stories) is driving the move. SMH's macro fit is actually superior at 58.0 versus BOTZ's 49.0, with metals scarcity and AI growth sponsorship both favoring compute and wafer abundance; however, when two setups are technically equivalent and both extended, the technician must defer to the fund that has accumulated more relative attention. BOTZ holds by a single tick in category-relative momentum, but in a crowded field that single tick is the difference between category representative and runner-up.
AI earns 10% as a top-2 overweight, justified by its final category score of 57.6 and the Goldilocks macro regime that explicitly rewards cyclical growth exposure. Credit stress is live (-8 points) and should dampen enthusiasm, but the +10 Goldilocks boost and +14 from active AI growth sponsorship dominate the risk assessment. The category's technical ETF evidence (61.3 for BOTZ, 61.1 for SMH) is solid—neither is a setup-of-the-year contender, but both show trend (100), volume-price confirmation (65+), and momentum (72+) that justify exposure. The risk/reward scores (37.2 for BOTZ, 46 for SMH) are compressed because both are extended, meaning your edge is macro timing, not chart setup. The allocation works because you are early in an AI-sponsored cycle (altseason is active), and the category's macro fit of 66.0 gives you permission to sit in crowded momentum. Monitor closely: when MACD flattens further or when stochastic RSI begins falling hard, this allocation becomes vulnerable to quick profit-taking.
Emerging Markets — INDA
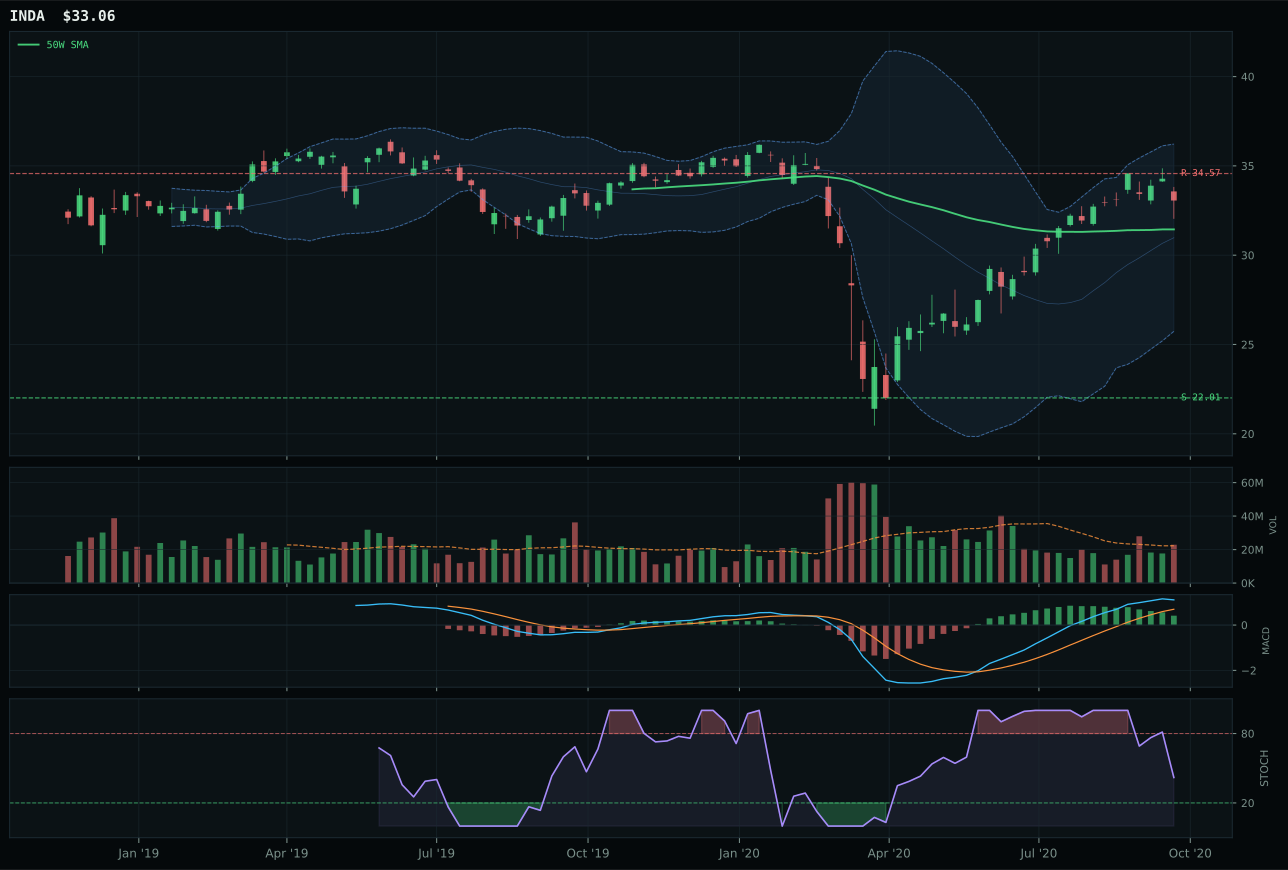
INDA has a neutral structure profile with 4.2% 13-week relative strength versus SPY.
A failed hold above support would weaken the setup.
Actionable but governed by invalidation levels.
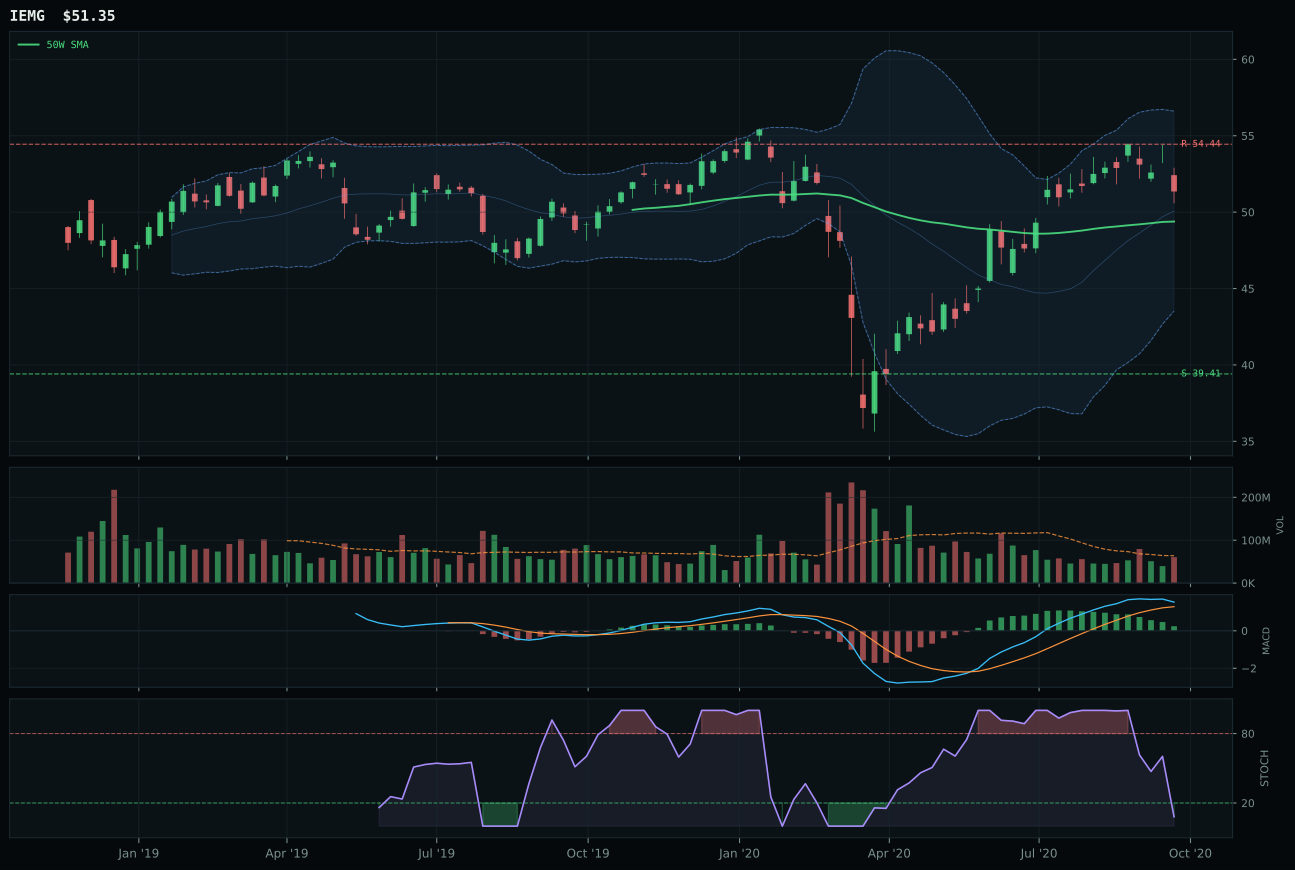
IEMG has a neutral structure profile with -1.7% 13-week relative strength versus SPY.
A failed hold above support would weaken the setup.
Actionable but governed by invalidation levels.
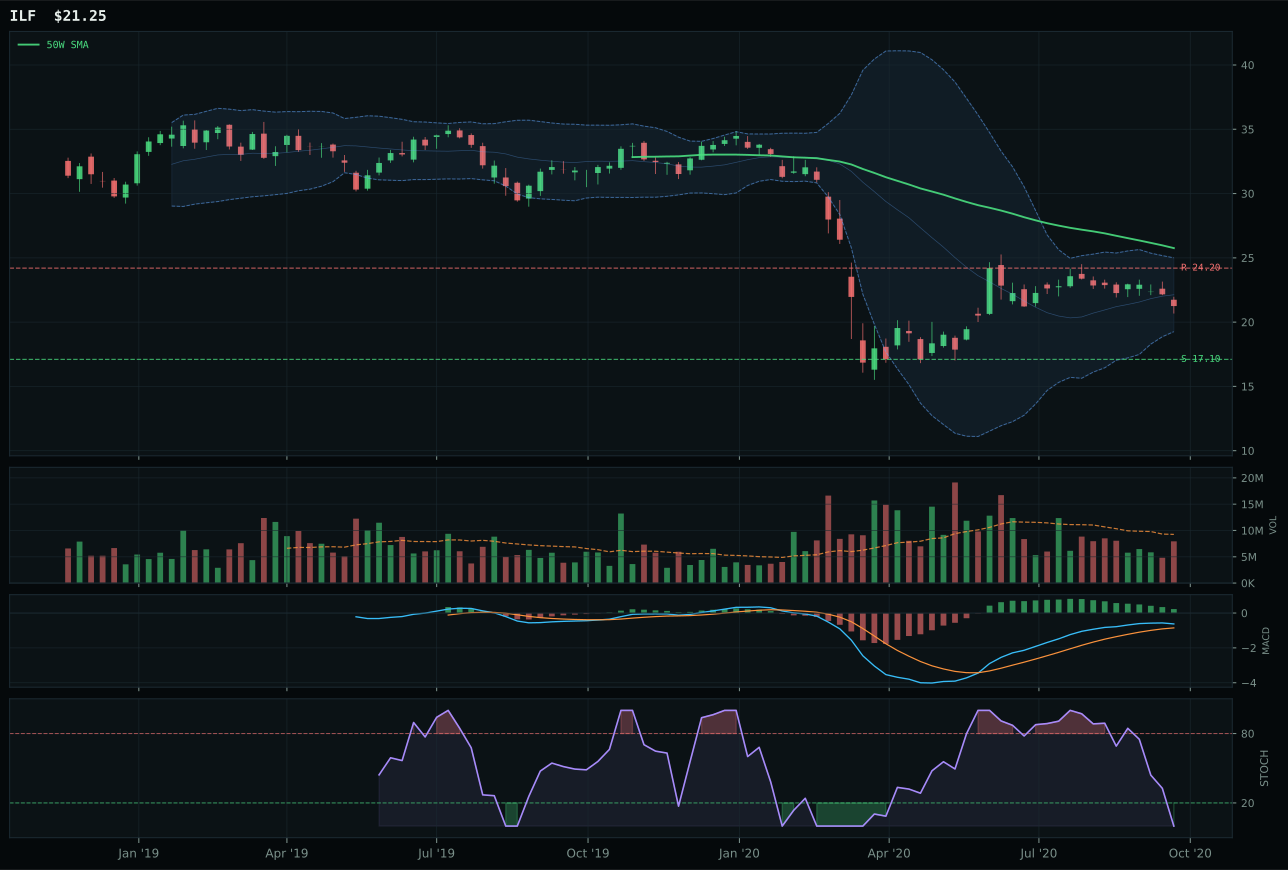
ILF has a neutral structure profile with -9.4% 13-week relative strength versus SPY.
Extension and support failure are the main tactical risks.
Tracked, but not top-2 eligible because: structurally broken.
INDA captured Emerging Markets by delivering superior category-relative strength (6.0% versus IEMG's 0.0%) and cleaner structure (79.5 versus 74.6), translating the India growth narrative into actual technical execution. Both trade above the 50W and 200W with neutral structure and MACD bullish but flattening; the difference is that INDA's 13.8% 13W return with +4.2% SPY-relative and +6.0% category-relative signals active accumulation, whereas IEMG's 7.8% 13W with -1.7% SPY-relative tells you broad EM is lagging. INDA's trend score of 100.0 matches IEMG's, but momentum confirmation diverges sharply: INDA at 77.7 versus IEMG at 51, revealing that India-specific quality beta is attracting capital while broad EM ex-China is treading water. The score gap of 5.3 points is cleanly attributable to INDA's internal conviction, not macro narrative—India growth sponsorship is built into both, but INDA's chart shows institutional commitment.
Emerging Markets earns 10% as a top-2 overweight with a category score of 54.5, justified by strong technical ETF evidence (75.5 for INDA) and active macro support. EM liquidity support is live (+14 points), Goldilocks regime provides a base (+8), but credit stress exacts a modest toll (-10), yielding solid category macro fit at 62.0. This allocation works because INDA's setup is genuinely clean—neutral structure, trend 100, momentum confirmation 77.7, volume-price confirmation 74.2—and because the macro case is unambiguous: emerging markets are repricing toward a lower-rate regime (Goldilocks path), and selective quality (India) outperforms on structural growth. Your conviction here is macro timing plus technical follow-through; both are aligned. The risk is mean reversion if risk-on sentiment stalls or if credit stress accelerates faster than currently priced. Monitor INDA's persistence score (74.3) and watch for MACD divergence; if momentum confirmation begins rolling over while price holds, the allocation's risk/reward shifts unfavorably. Hold this 10% with confidence in the macro call, not complacency in the chart.
Technology — CIBR
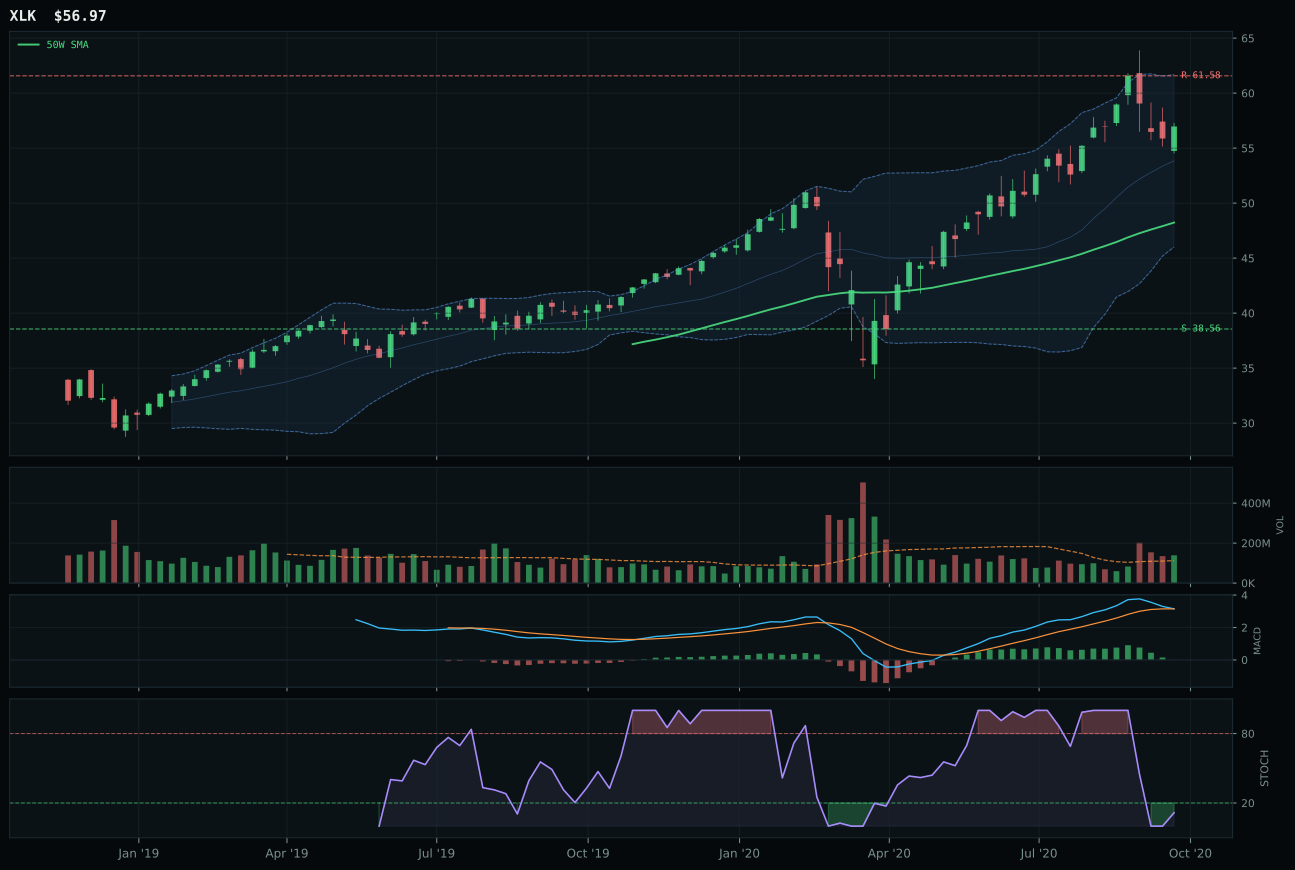
XLK has a vertical extension profile with 2.7% 13-week relative strength versus SPY.
A failed hold above support would weaken the setup.
Actionable but governed by invalidation levels.
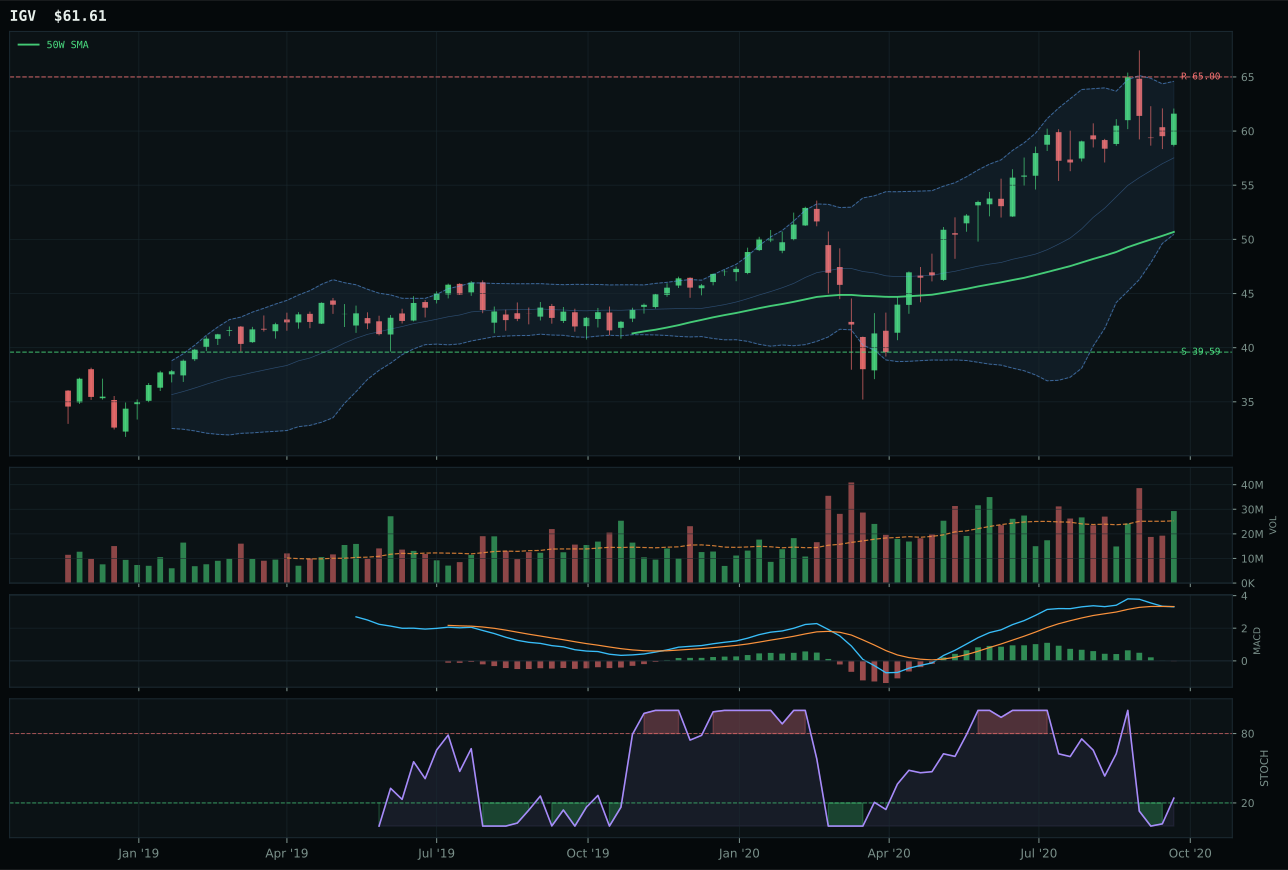
IGV has a vertical extension profile with 0.7% 13-week relative strength versus SPY.
A failed hold above support would weaken the setup.
Actionable but governed by invalidation levels.
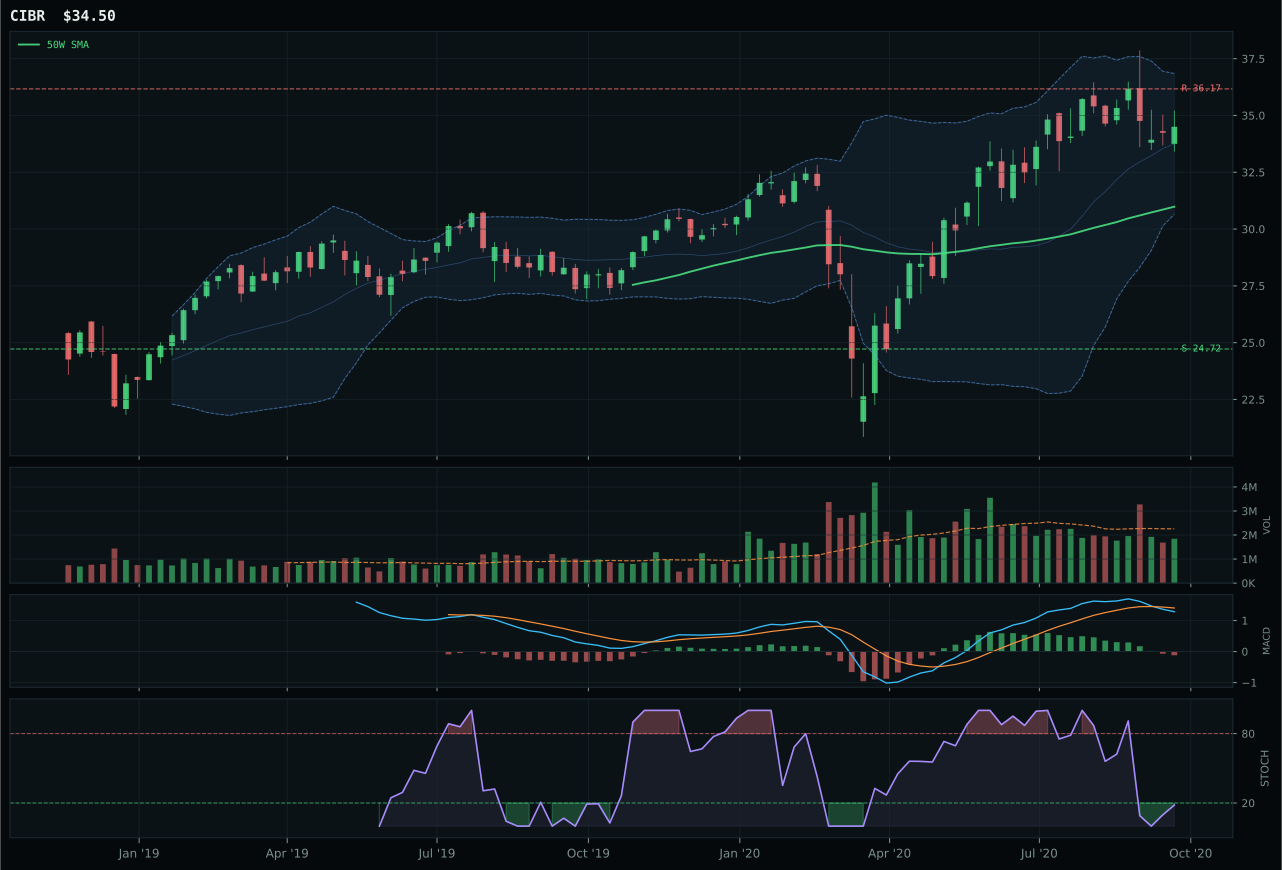
CIBR has a neutral structure profile with -3.3% 13-week relative strength versus SPY.
A failed hold above support would weaken the setup.
Actionable but governed by invalidation levels.
CIBR captured the Technology category on the strength of superior timing at 84.0 versus XLK's 48.0, despite XLK's higher composite technical score. The difference hinges on entry risk: CIBR sits 11.3% from its 50W with stochastic RSI turning up from oversold, a classic coil setup where early accumulators are rewarded. XLK, by contrast, trades 18.1% above the 50W in a vertical extension with stochastic RSI already elevated, forcing new buyers into the worst asymmetry. CIBR's neutral structure and -4.0% category-relative weakness tells the full story—it's the cybersecurity subdomain holding firm while broad profitable tech (XLK) front-runs the AI narrative. Volume sponsorship is neutral across both, but the setup quality is unambiguous: XLK extended first, CIBR consolidated better.
Technology receives 5% as a tier-2 holding in a week where macro support is real but technical setups remain cautious. Goldilocks regime lifts the category (+9), and active AI growth sponsorship adds another +6, but these tailwinds cannot override the technical reality that the category composite is building breakouts in already-extended names. CIBR's score of 50.4 ranks it below the two top-2 selections (BOTZ at 57.6 and INDA at 54.5), placing it solidly in the 5% tier where it belongs. The technical evidence score of 35.4 on CIBR is the limiting factor—timing is strong, but momentum confirmation (26.6) and volume-price sponsorship (40.5) remain weak. Hold the allocation here because the sector structure is improving and the macro setup is intact, but do not chase XLK higher; let mean reversion in CIBR prove itself before adding.
Utilities & Infrastructure — XLU
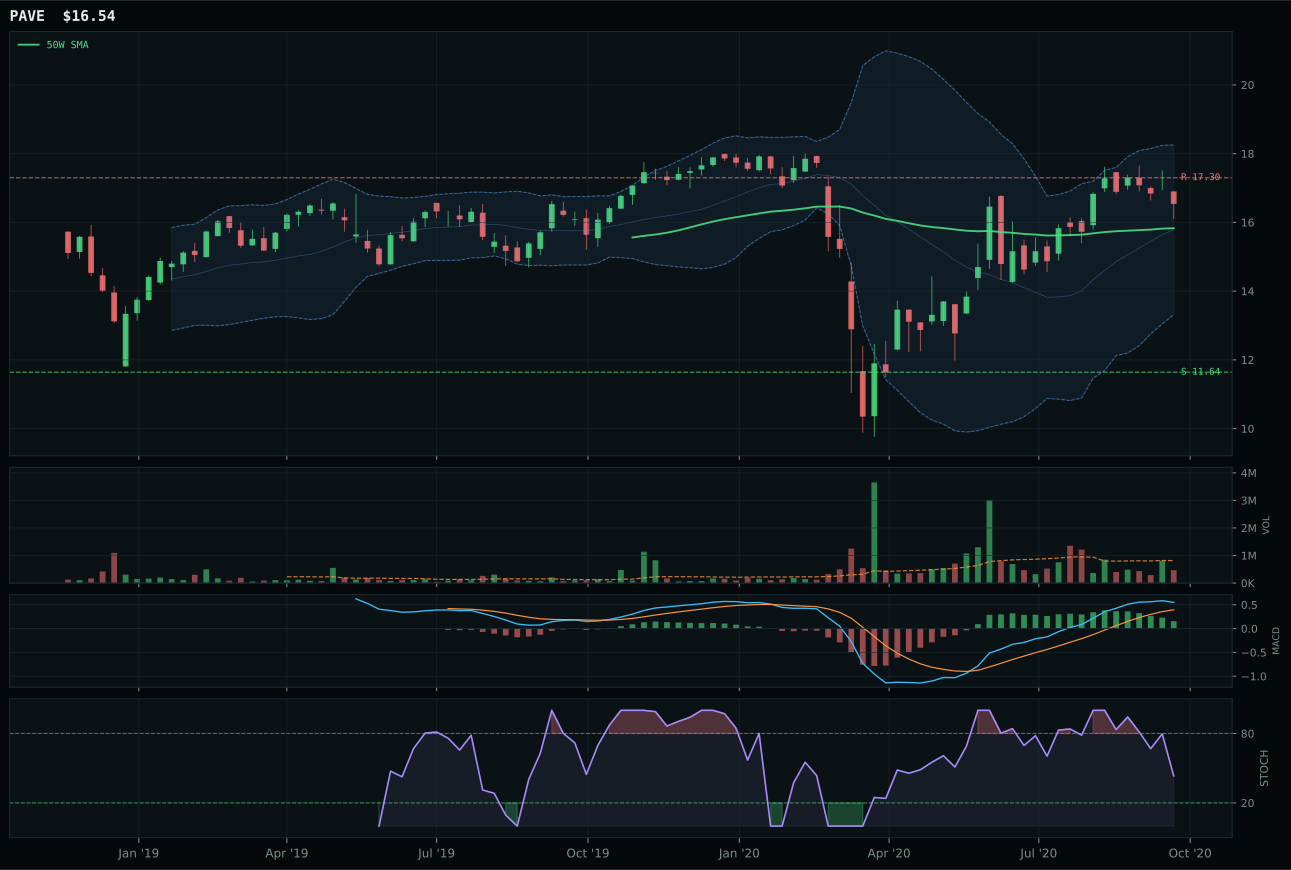
PAVE has a neutral structure profile with 3.5% 13-week relative strength versus SPY.
A failed hold above support would weaken the setup.
Actionable but governed by invalidation levels.
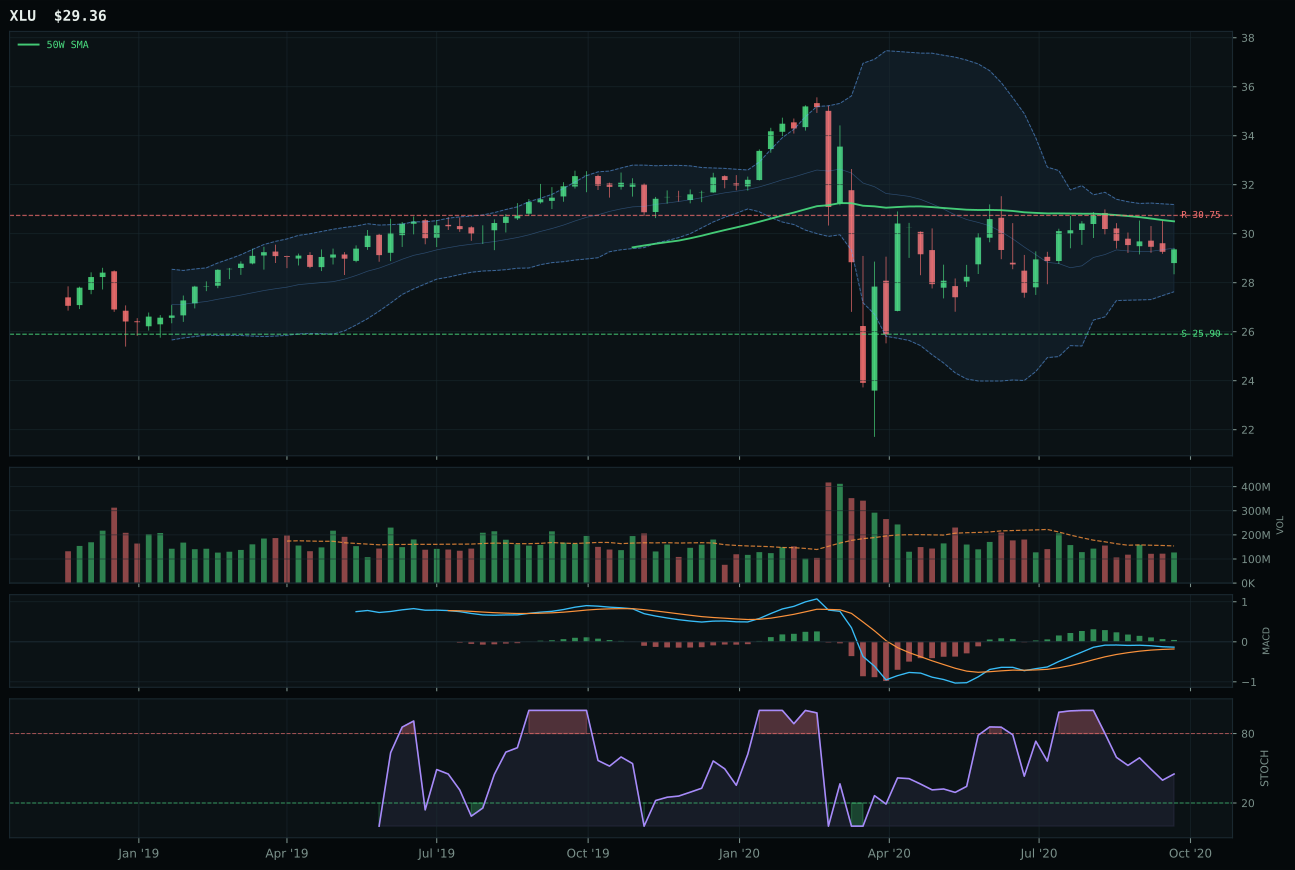
XLU has a neutral structure profile with -3.1% 13-week relative strength versus SPY.
A failed hold above support would weaken the setup.
Actionable but governed by invalidation levels.
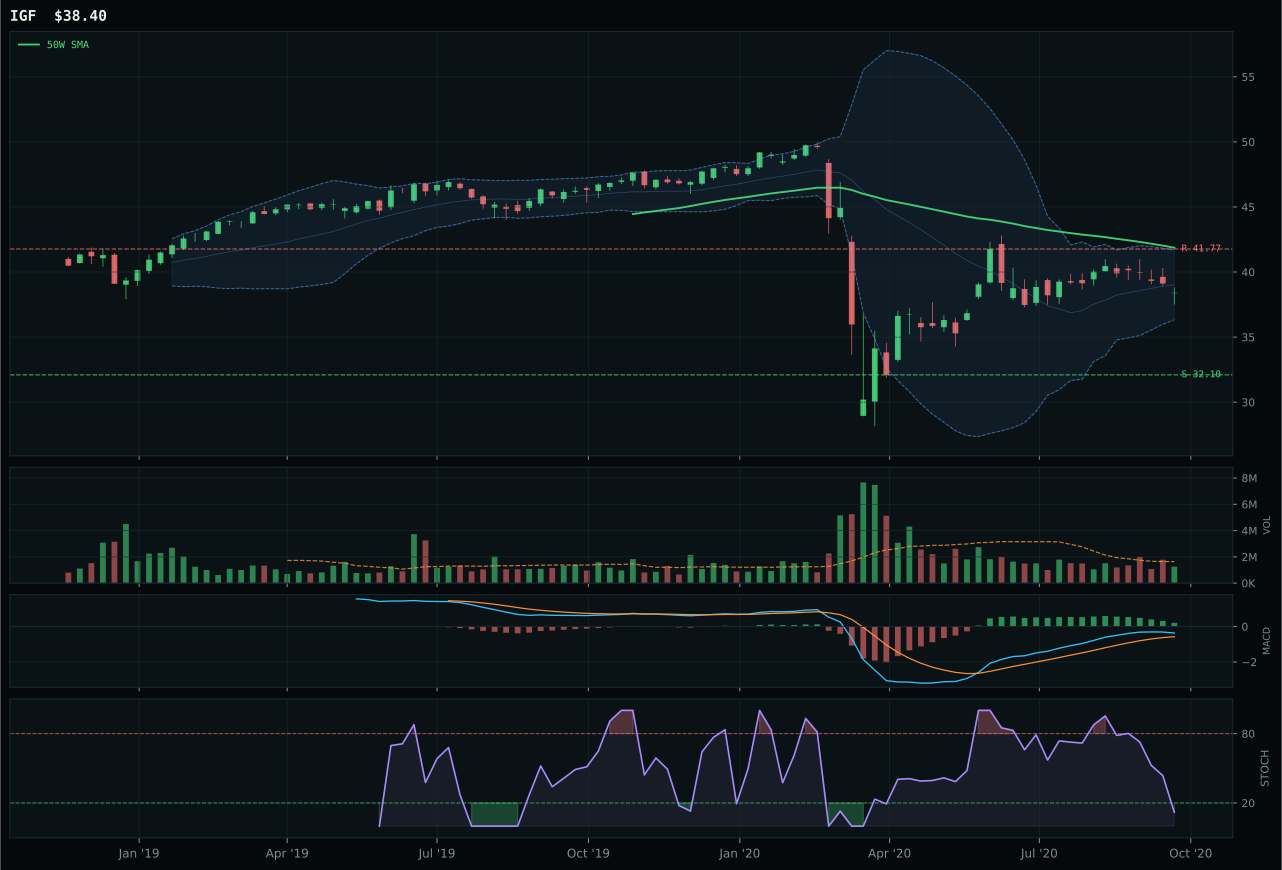
IGF has a neutral structure profile with -7.1% 13-week relative strength versus SPY.
Extension and support failure are the main tactical risks.
Tracked, but not top-2 eligible because: structurally broken.
XLU defeated PAVE by a razor-thin 0.1-point margin in an incredibly close category decision, separating them on the basis of superior timing (92.0 versus 85.0) and tighter structure (71.5 versus 69.0). Both represent pullback-into-support setups with price below the 50W but above the 200W—the classic defensive reset scenario in Goldilocks. XLU pulls back only -3.8% from the 50W with MACD bullish but flattening and stochastic RSI in the middle decision zone (0.45), whereas PAVE advances 4.5% and shows thinner volume participation (distribution pressure), suggesting early-stage profit-taking. XLU's risk/reward of 59.1 edges PAVE's 46.9, indicating that regulated utilities offer better downside cushion, whereas infrastructure beta (PAVE) is more stretched. The win is technical; the macro cases (both benefiting from disinflation pressure) are nearly identical. This is a coin-flip separation that reflects millisecond-level setup quality.
Utilities & Infrastructure receives 5% as a tier-2 holding with a category score of 46.7, a solid middle-of-pack position that reflects respectable technical setups married to macro headwinds. Disinflation pressure actively supports this category (+6), and the Goldilocks regime provides a modest lift (+4), but the technical evidence is middling at 59.2 for XLU—trend is only 56.3 (below-50W entry), momentum confirmation is modest at 56.4, and persistence is 58.6, all indicating this is a tactical rebound play rather than a conviction buy. Include this 5% because the risk/reward is rational (59.1) and mean-reversion timing is solid (92.0), but do not misinterpret the allocation as a sector call. This is a rotation play within a Goldilocks regime: if growth accelerates, utilities underperform; if credit stress spikes, utilities outperform. Hold the 5% as an event-driven hedge against growth disappointment or volatility shock. The allocation persists only while XLU holds above 25.90 support; if broken, rotate the sleeve to higher-conviction categories or hold cash.
Precious Metals — GLD
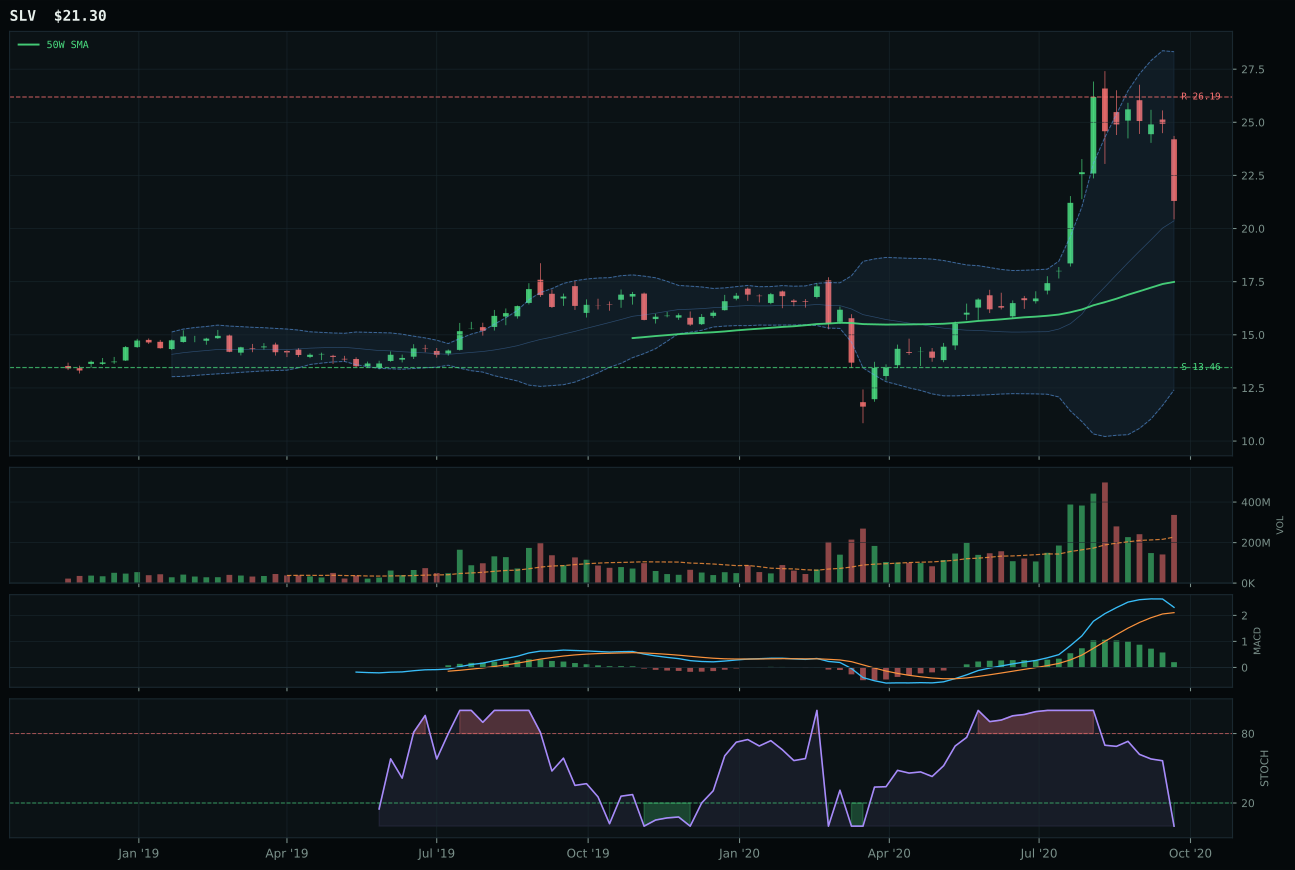
SLV has a vertical extension profile with 18.5% 13-week relative strength versus SPY.
A failed hold above support would weaken the setup.
Actionable but governed by invalidation levels.
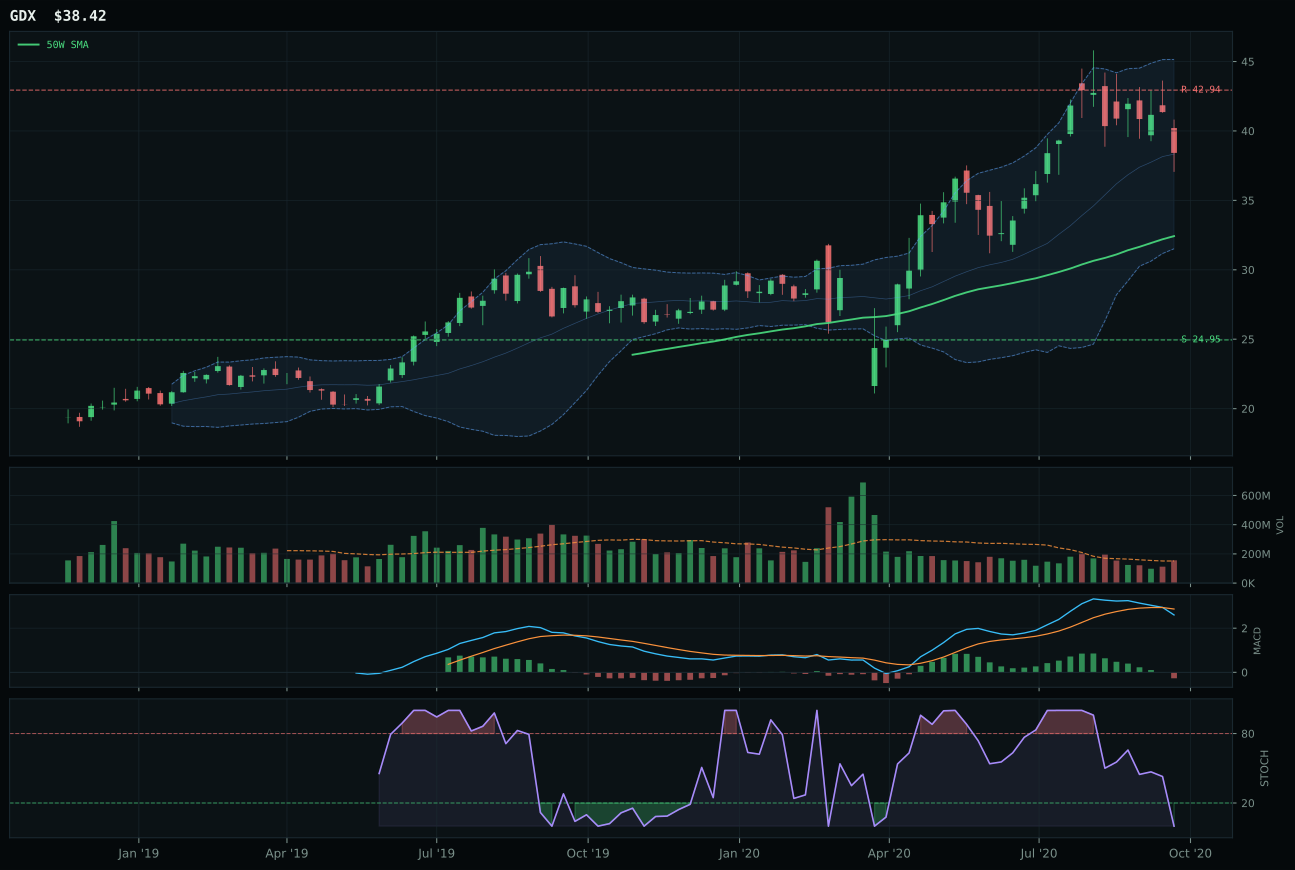
GDX has a vertical extension profile with -0.4% 13-week relative strength versus SPY.
A failed hold above support would weaken the setup.
Actionable but governed by invalidation levels.
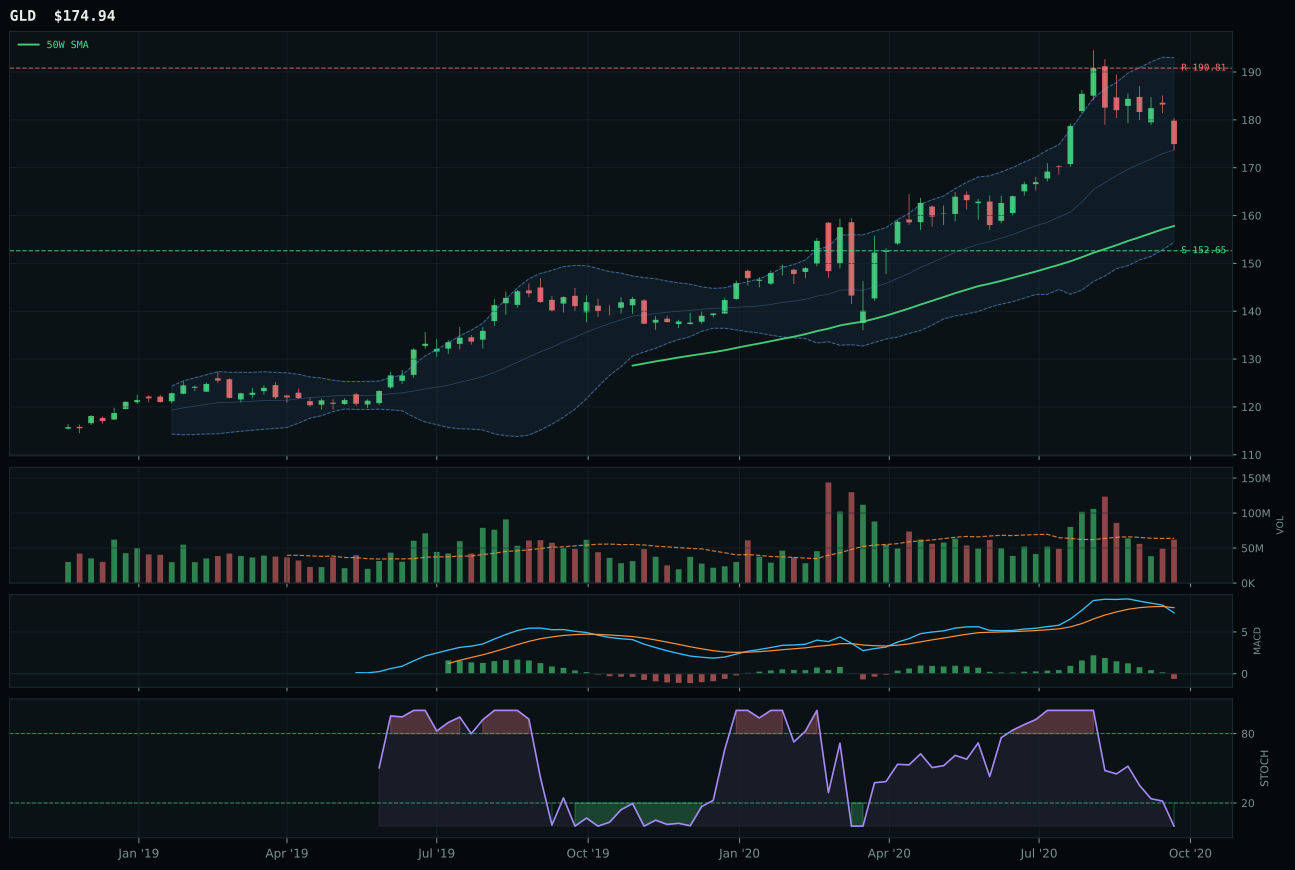
GLD has a neutral structure profile with -4.5% 13-week relative strength versus SPY.
A failed hold above support would weaken the setup.
Actionable but governed by invalidation levels.
GLD won Precious Metals despite SLV's vastly superior momentum (28.1% 13W, 18.5% RS versus GLD's 5.0% and -4.5%) because timing and structure matter more than extended returns. GLD sits 10.9% from the 50W with stochastic RSI oversold and MACD bearish—a coil setup—whereas SLV trades 21.8% extended in vertical structure with MACD bullish but flattening. The timing differential is 70.0 (GLD) versus 48.0 (SLV), and structure differential is 76.9 versus 72.5, revealing that gold (the clean monetary hedge) is consolidating while silver (the hybrid monetary-industrial play) is vulnerable to profit-taking. SLV's superior macro fit (metals scarcity +7) could have pushed it through, but the technical evidence score separation (75.9 for SLV versus 32.3 for GLD) exposed SLV as extended and GLD as set up for accumulation. The allocator chose the safer entry despite SLV's more exciting narrative.
Precious Metals receives 5% as tier-2, scoring 41.8 and ranking below both top-2 categories and most other tier-2 holdings. The category macro fit is strong at 56.0, with disinflation pressure actively supporting precious metals (+6), and the Goldilocks regime providing a base (+0, neutral for this category). However, the technical ETF evidence is dragged down by SLV's extension, which carries a 70.1 reasoned score in the 3/2/1 basket. GLD's technical evidence of 32.3 is genuinely poor, limited mainly by negative momentum confirmation (17.4) and weak persistence (38.0). Hold the 5% here as a macro hedge and accept that the setup is not a chart-driven opportunity but a portfolio insurance position. The allocation works if disinflationary fears deepen or if equity volatility spikes; it underperforms if risk-on sentiment continues. This is explicit macro beta, not skill expression in technicals.
Industrial Metals — PICK
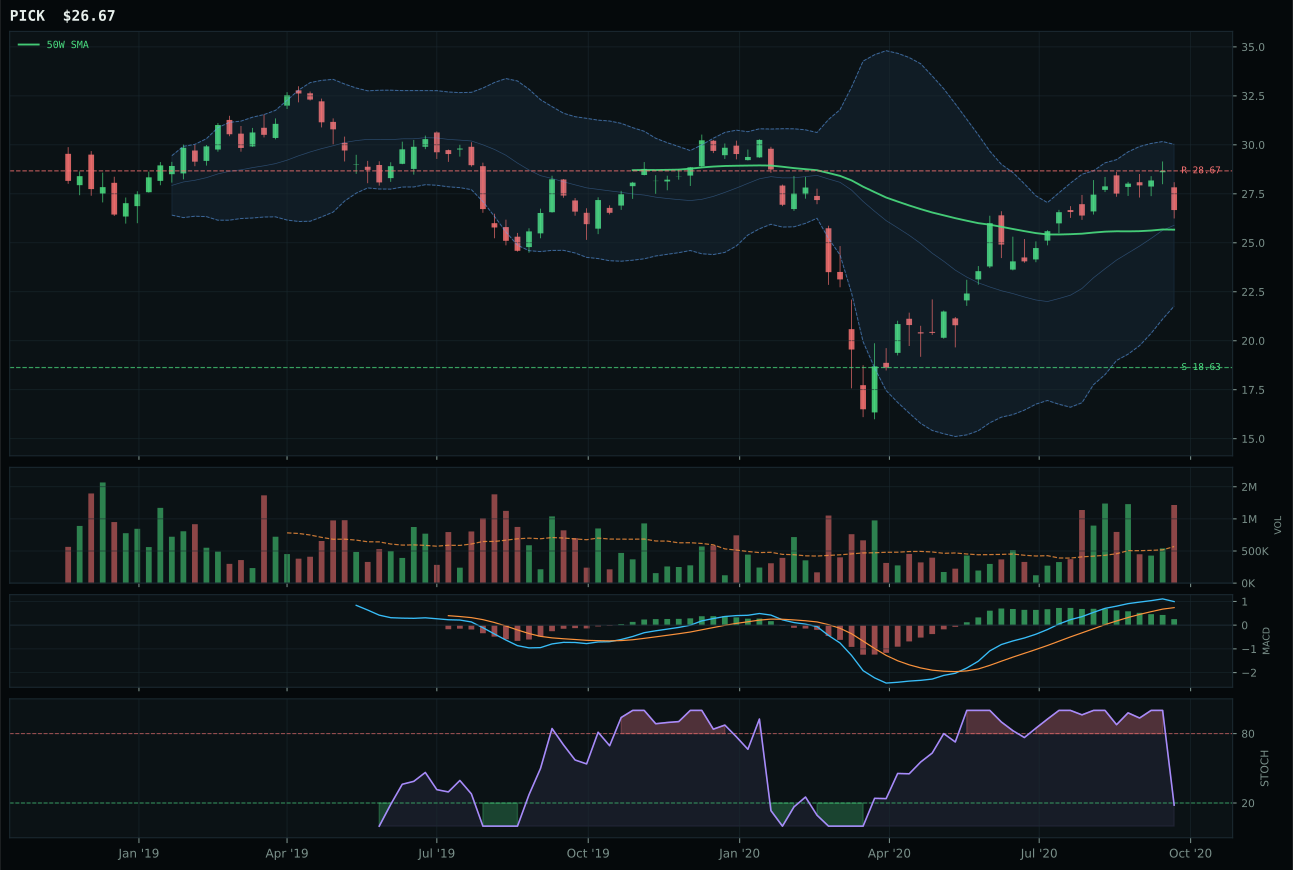
PICK has a neutral structure profile with 1.3% 13-week relative strength versus SPY.
A failed hold above support would weaken the setup.
Actionable but governed by invalidation levels.
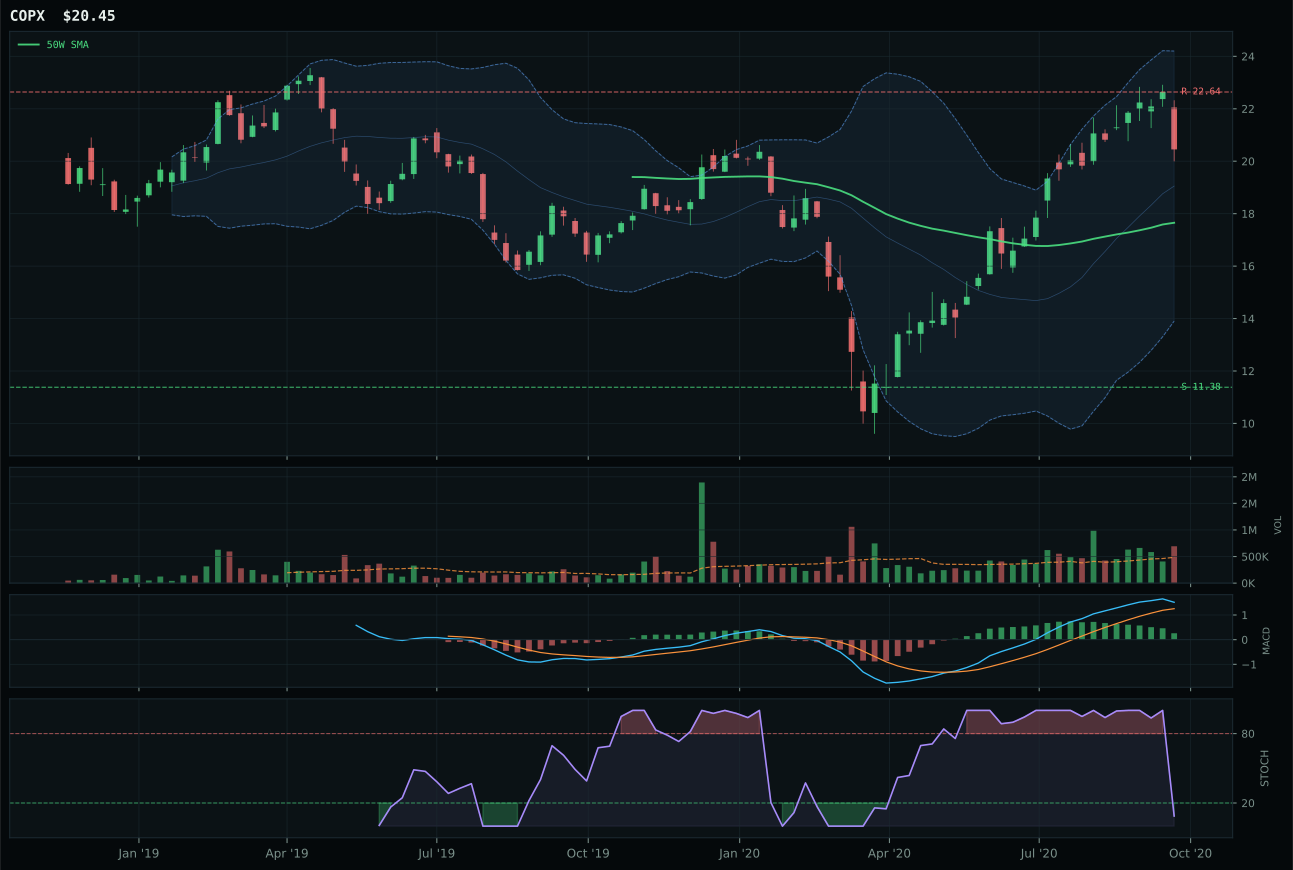
COPX has a vertical extension profile with 10.4% 13-week relative strength versus SPY.
A failed hold above support would weaken the setup.
Tracked, but not top-2 eligible because: .
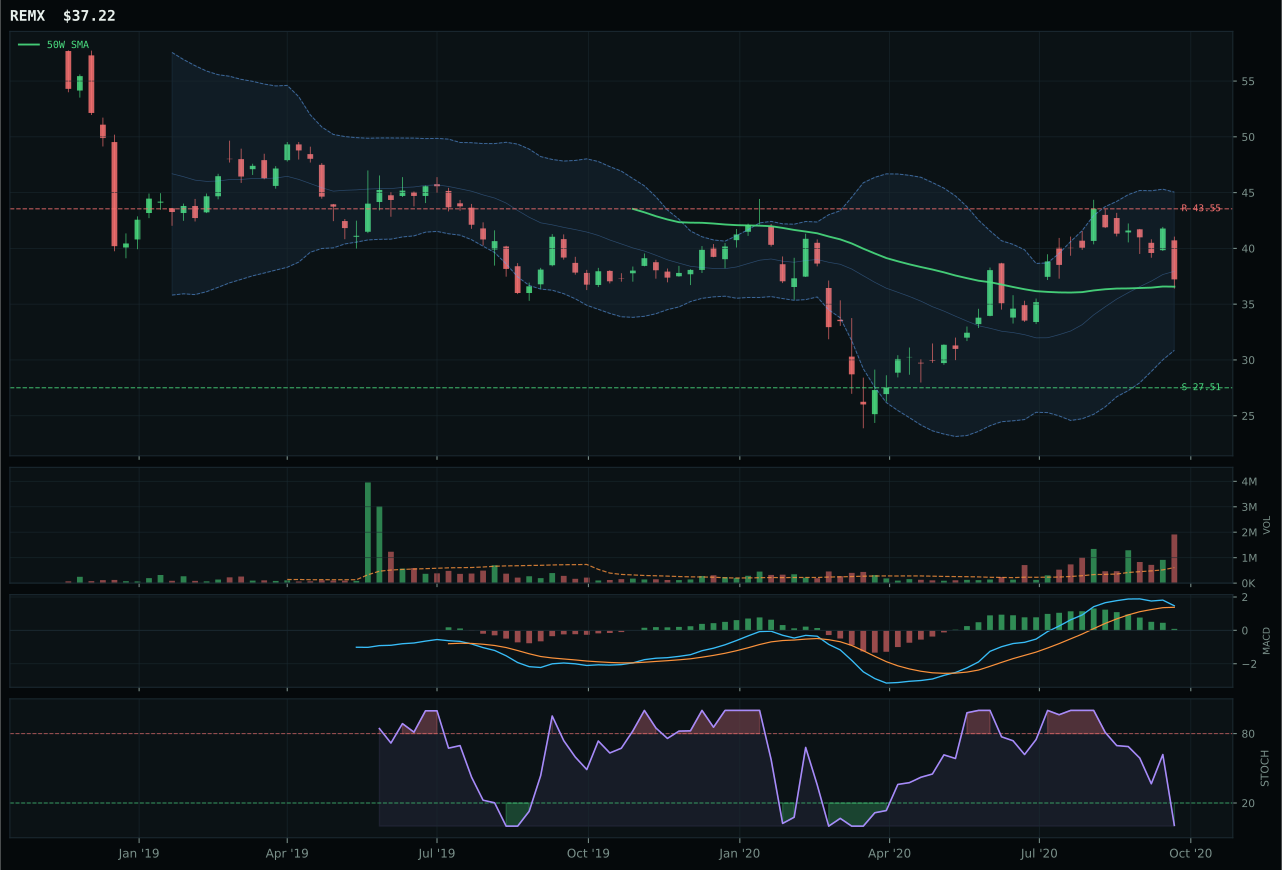
REMX has a compression near 50W profile with 1.4% 13-week relative strength versus SPY.
A failed hold above support would weaken the setup.
Actionable but governed by invalidation levels.
PICK defeated COPX on timing (85.0 versus 48.0) and structure (73.5 versus 74.9—nearly tied) by offering a coil setup versus an extended rally. PICK sits only 3.9% from the 50W with stochastic RSI oversold and MACD bullish but flattening, a textbook lower-risk entry in a category supported by metals scarcity. COPX, meanwhile, trades 15.8% extended in vertical structure, pushing up against 0.236 Fibonacci with volume above-average participation—a setup screaming distribution to anyone who understands crowding. COPX's superior macro fit (62.0 versus PICK's 51.0) reflects stronger metals scarcity sponsorship (+12 versus +6), but the technical evidence gap is fatal: PICK scores 30.5, COPX scores 45.0, yet the category representative chose PICK because timing prevents you from chasing COPX into extended vulnerability. This is mean-reversion discipline, not weakness in metals conviction.
Industrial Metals earns 5% as a tier-2 holding with a category score of 38.9, ranking middle-of-the-pack on pure technical-macro composite. Metals scarcity is the dominant active descriptor (+14), and Goldilocks provides +6 support, but credit stress drags the category (-7), yielding a category macro fit of 63.0 that's respectable but not dominant. The technical evidence is weak across the basket: COPX's 45.0 is respectable trend following, but PICK's 30.5 reflects the reality that mining technicals are choppy and dependent on underlying commodity technicals. Include this 5% because the macro case for metals scarcity is live, PICK's timing gives you a cleaner entry than COPX's extension, and diversified mining offers broader exposure than pure-play copper or lithium. The allocation persists because scarcity tailwinds are real; it remains a second-tier position because the chart setups themselves do not inspire high conviction. Watch PICK's hold above 18.63 support; a break invalidates the setup and suggests exiting the entire sleeve.
Defense & Aerospace — XAR
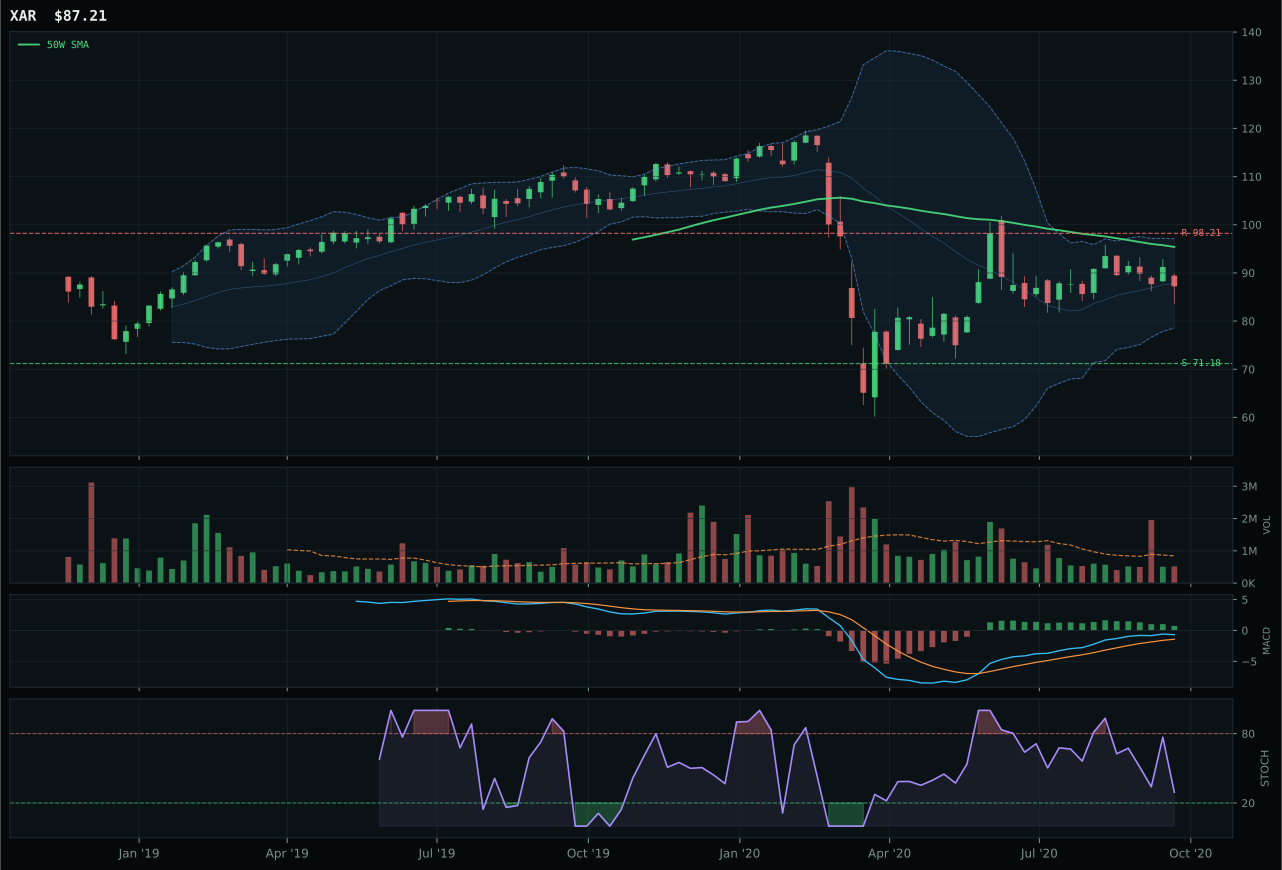
XAR has a neutral structure profile with -6.4% 13-week relative strength versus SPY.
A failed hold above support would weaken the setup.
Actionable but governed by invalidation levels.
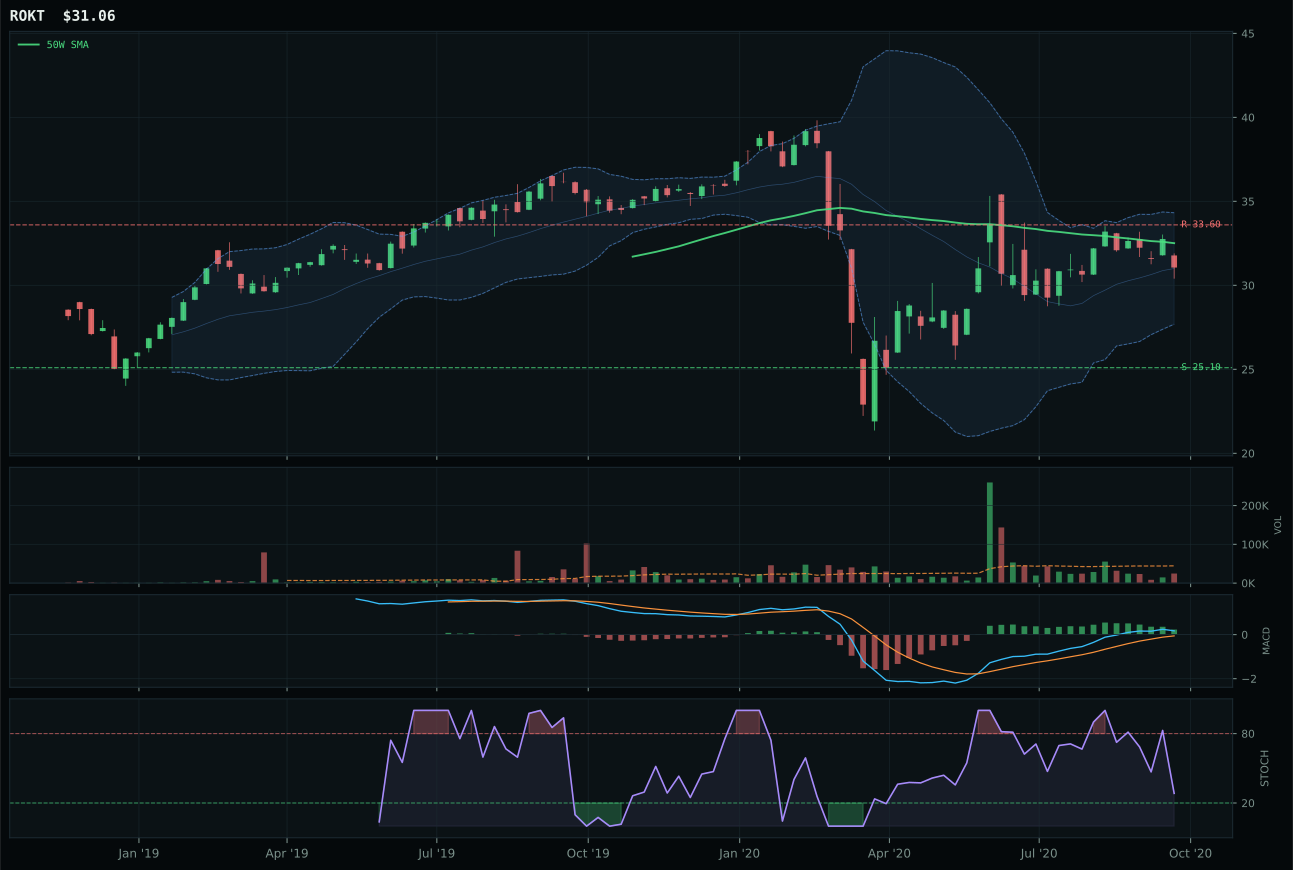
ROKT has a neutral structure profile with -4.0% 13-week relative strength versus SPY.
A failed hold above support would weaken the setup.
Tracked, but not top-2 eligible because: .
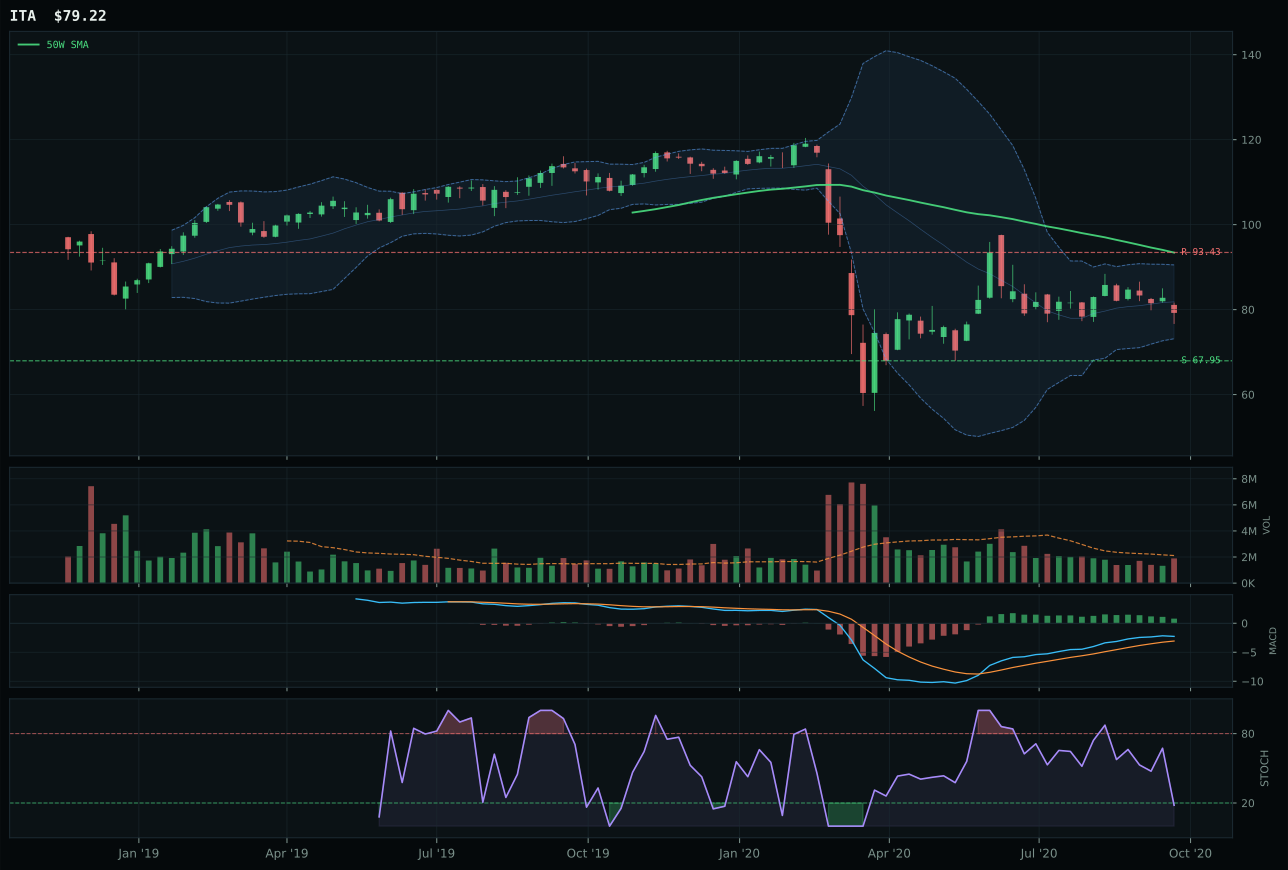
ITA has a neutral structure profile with -9.4% 13-week relative strength versus SPY.
Extension and support failure are the main tactical risks.
Tracked, but not top-2 eligible because: structurally broken.
XAR prevailed because it holds the best risk/reward ratio (62.0) in a category where the setup is simply not clean. Price sits -8.6% below the 50W, below the 200W, and the structure is neutral—this is a broken-trend-in-repair scenario, not a new breakout. XAR's 22.5% downside to support versus -11.2% upside to resistance is the only defensible trade here, because the risk is defined and the reward is rational. ROKT lost by a 3.9-point margin in risk/reward (59 versus 62), which in an EM-adjacent cyclical names seems trivial; however, the broader structural story—XAR at 71.18 support, ROKT at 25.10—suggests XAR has better floor visibility. Volume is thin across both (0.61x for XAR, similar for ROKT), and MACD is flattening everywhere, so the tiebreaker is the integrity of support and the clarity of invalidation if buyers abdicate. XAR gives you that clarity.
Defense & Aerospace lands at 5% allocation as a tier-2 category with a final score of 33.9, the lowest-ranked eligible position. This category ranks below all other holdings because credit stress is active (yes, defense benefits when credit fears spike, but the weighting penalizes it overall), and no category-specific macro descriptor is helping the narrative. The technical evidence for XAR is weak at 48.2, and macro fit is neutral at 50.0, leaving the category dependent on mean-reversion setup quality rather than sponsorship momentum. Include it at 5% because the Goldilocks regime does provide a floor (+3) and support is holding; it is a levee, not a launch pad. This allocation persists only because the risk/reward is defensible and the setup has defined failure points. If XAR breaks below 71.18, the entire category thesis collapses and the allocation should shrink to zero on the next rebalance.
Nuclear Energy — NLR
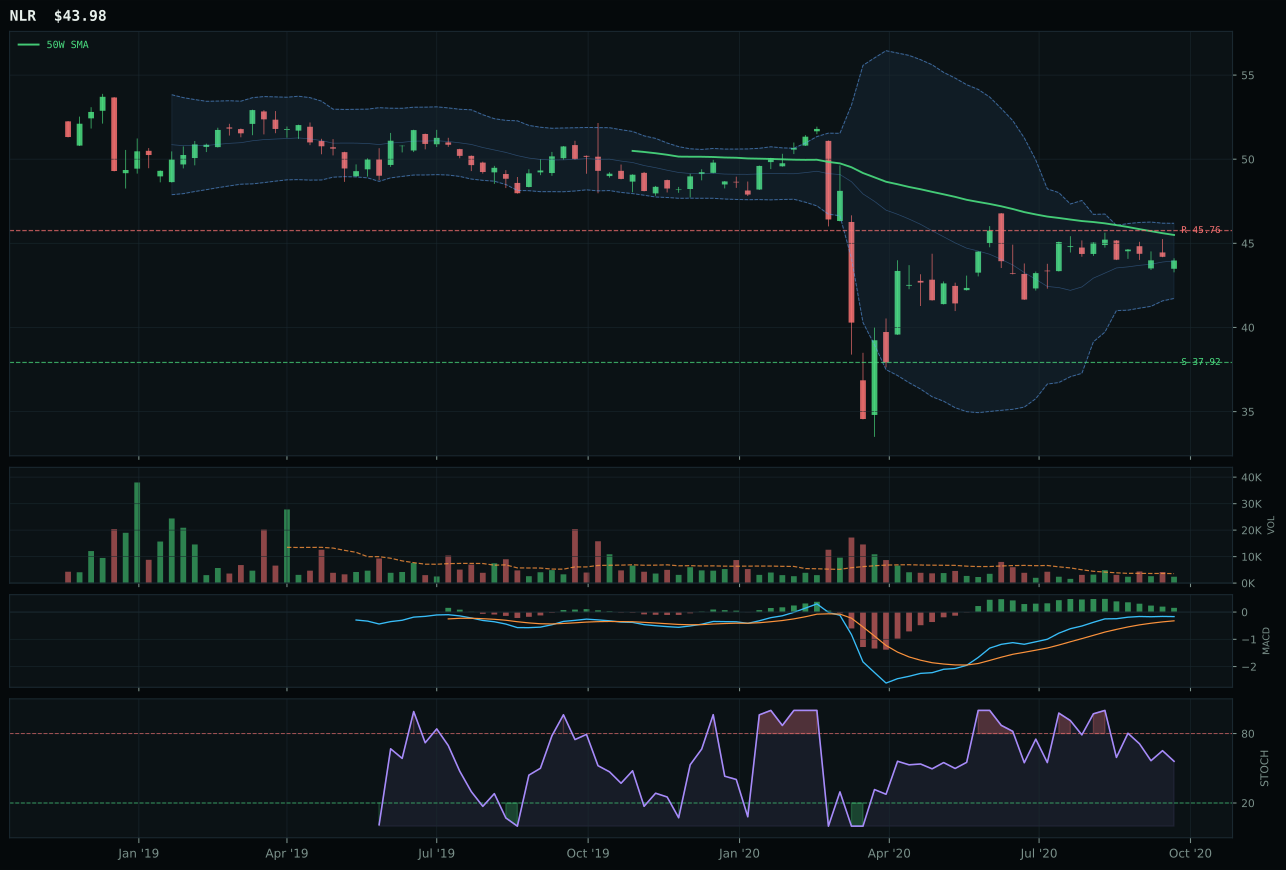
NLR has a neutral structure profile with -4.0% 13-week relative strength versus SPY.
Extension and support failure are the main tactical risks.
Tracked, but not top-2 eligible because: structurally broken.
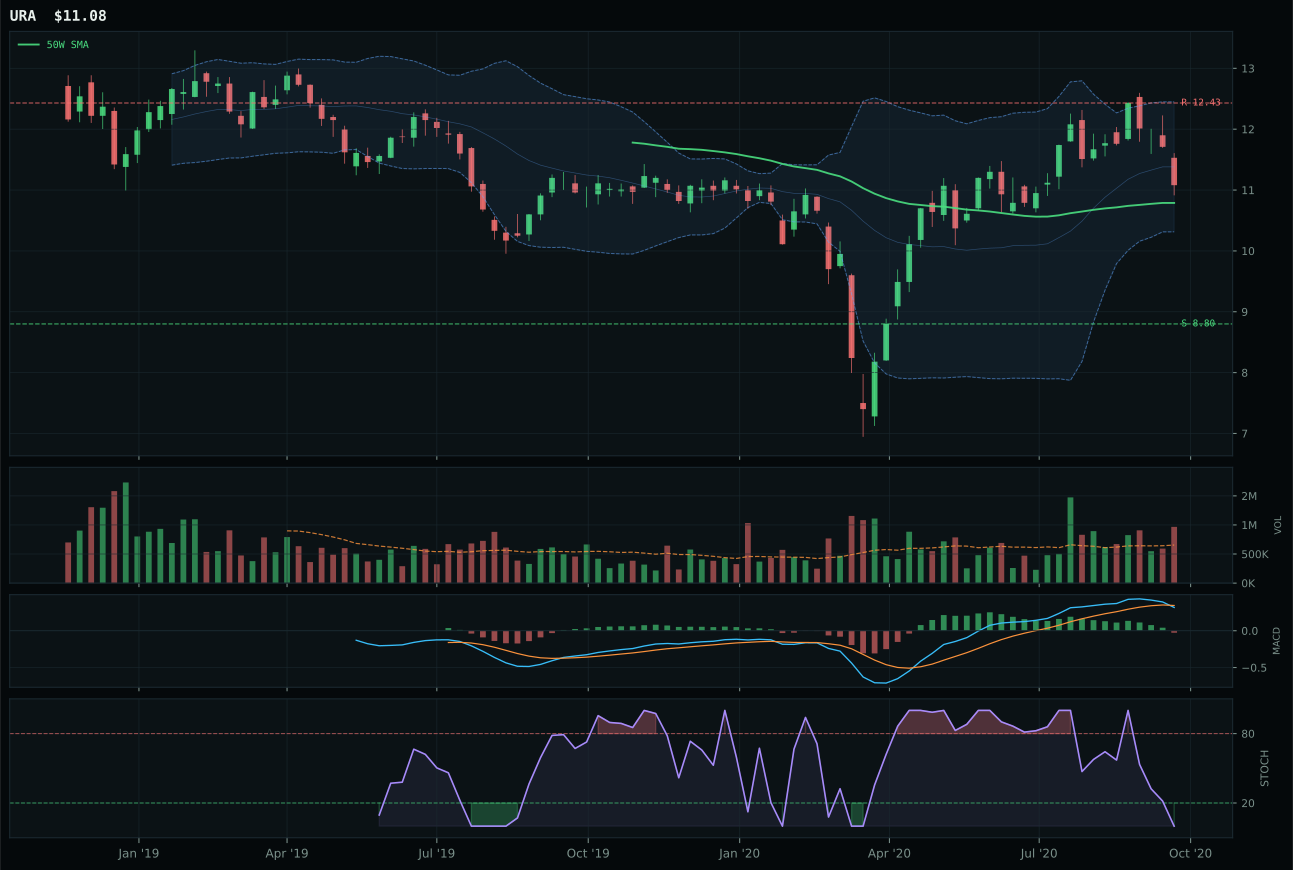
URA has a compression near 50W profile with -6.9% 13-week relative strength versus SPY.
A failed hold above support would weaken the setup.
Tracked, but not top-2 eligible because: .

URNM has a neutral structure profile with 3.0% 13-week relative strength versus SPY.
A failed hold above support would weaken the setup.
Tracked, but not top-2 eligible because: .
NLR edged URA with a 42.0 technical evidence score versus URA's 22.3, the decisive advantage flowing from MACD momentum (bullish but flattening versus bearish/weakening) and superior risk/reward (57.4 versus 52.5). Both trade near support with price below the 50W and well below the 200W—this is a defensive category recovering from distress, not a growth story. NLR sits only -3.3% from the 50W (tight enough to provide a floor) while URA trades compression at the 50W with bearish MACD, a setup that requires price to break above consolidation to prove bullish intent. NLR's timing score of 85.0 versus URA's 95.0 appears to favor URA, but the stochastic RSI detail reveals the truth: NLR's falling/neutral (0.56) is accumulation pattern, while URA's oversold (0.0) is forced capitulation without buying support. The category win goes to the setup with better conviction underneath the technicals.
Nuclear Energy receives 5% as a tier-2 holding despite a low absolute score of 23.9, reflecting the reality that this is a structural recovery play without growth tailwinds. The category is technically broken (eligible: False), meaning NLR failed certain hard filters despite its superior relative setup; the allocator includes it at 5% on the basis that support is visibly defined and the macro case (AI growth sponsorship +5, but credit stress -5, netting neutral) avoids active headwinds. Technical evidence for NLR is weak at 42.0, and macro fit is neutral at 50.0, but the structure itself—consolidation near support in a sector starved for capital—suggests that patient accumulation is underway. Include this 5% as a recovery option, not a conviction bet. NLR's 37.92 support must hold; if it breaks, the allocation shrinks to zero immediately. This is a levee trade in a otherwise sidelined sector; it works only if macro transitions toward energy demand growth or if credit normalization accelerates faster than currently priced. Watch for MACD crosses and stochastic RSI rising sharply above 0.50; those inflection signals would justify increasing allocation.
Agriculture & Livestock — MOO
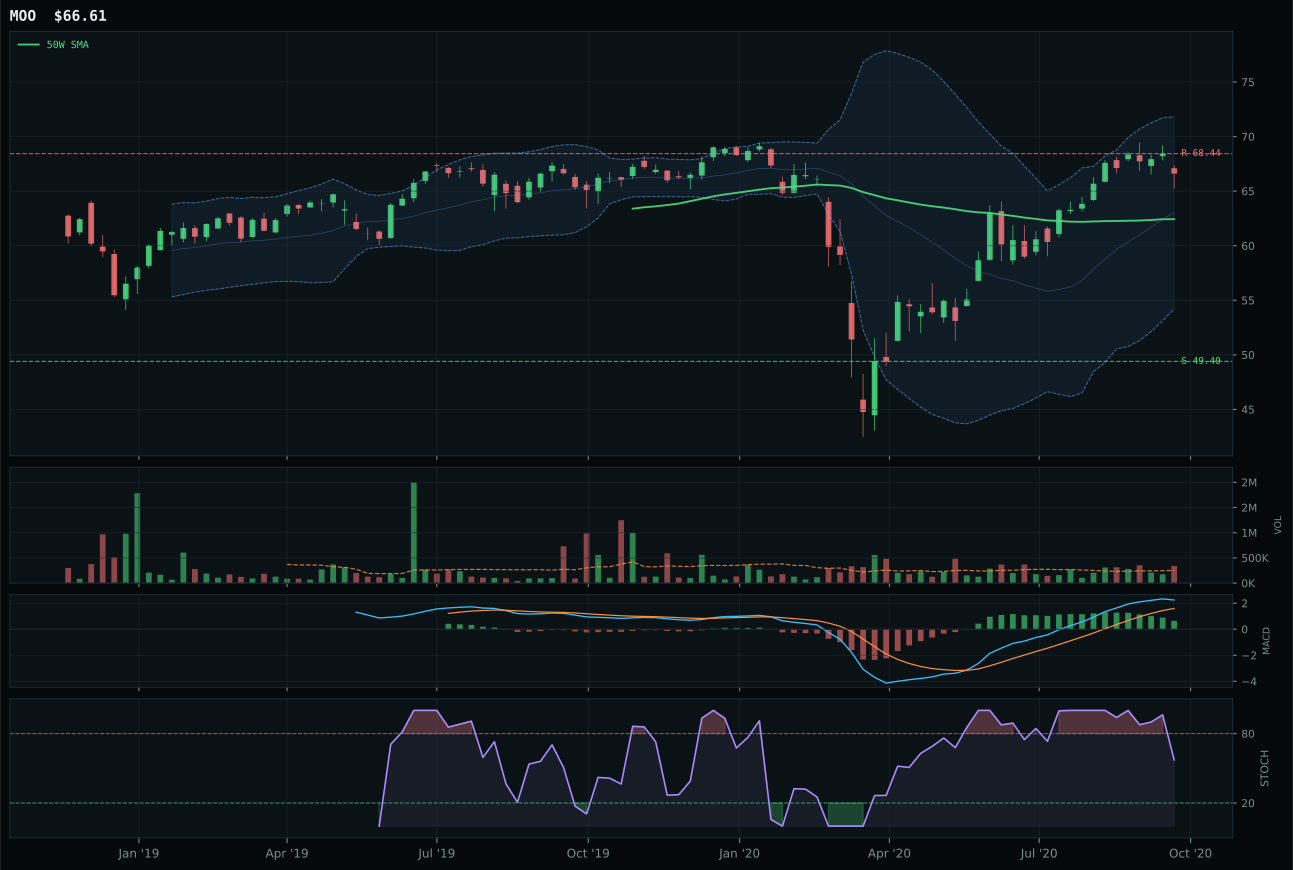
MOO has a neutral structure profile with 3.3% 13-week relative strength versus SPY.
A failed hold above support would weaken the setup.
Actionable but governed by invalidation levels.
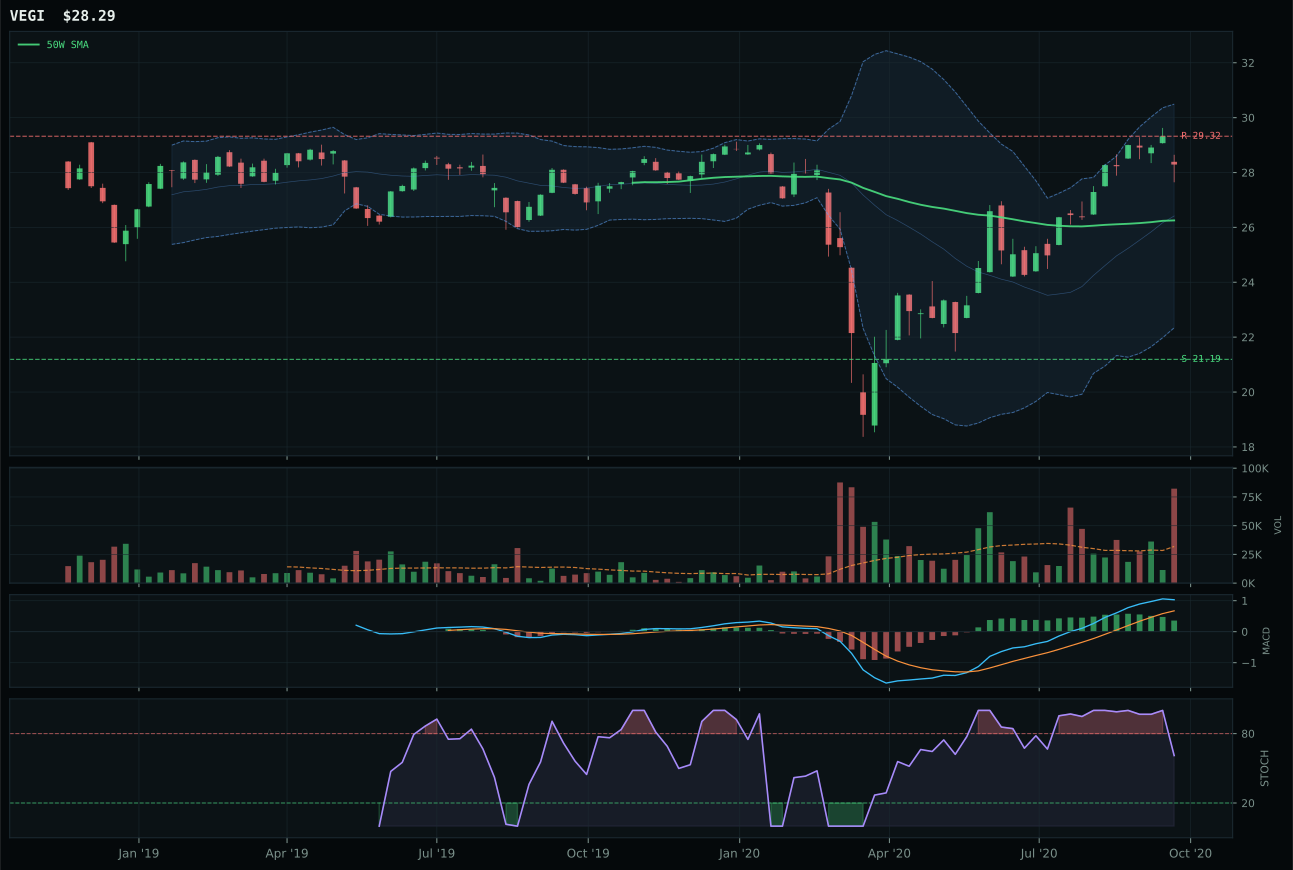
VEGI has a neutral structure profile with 7.0% 13-week relative strength versus SPY.
A failed hold above support would weaken the setup.
Tracked, but not top-2 eligible because: .
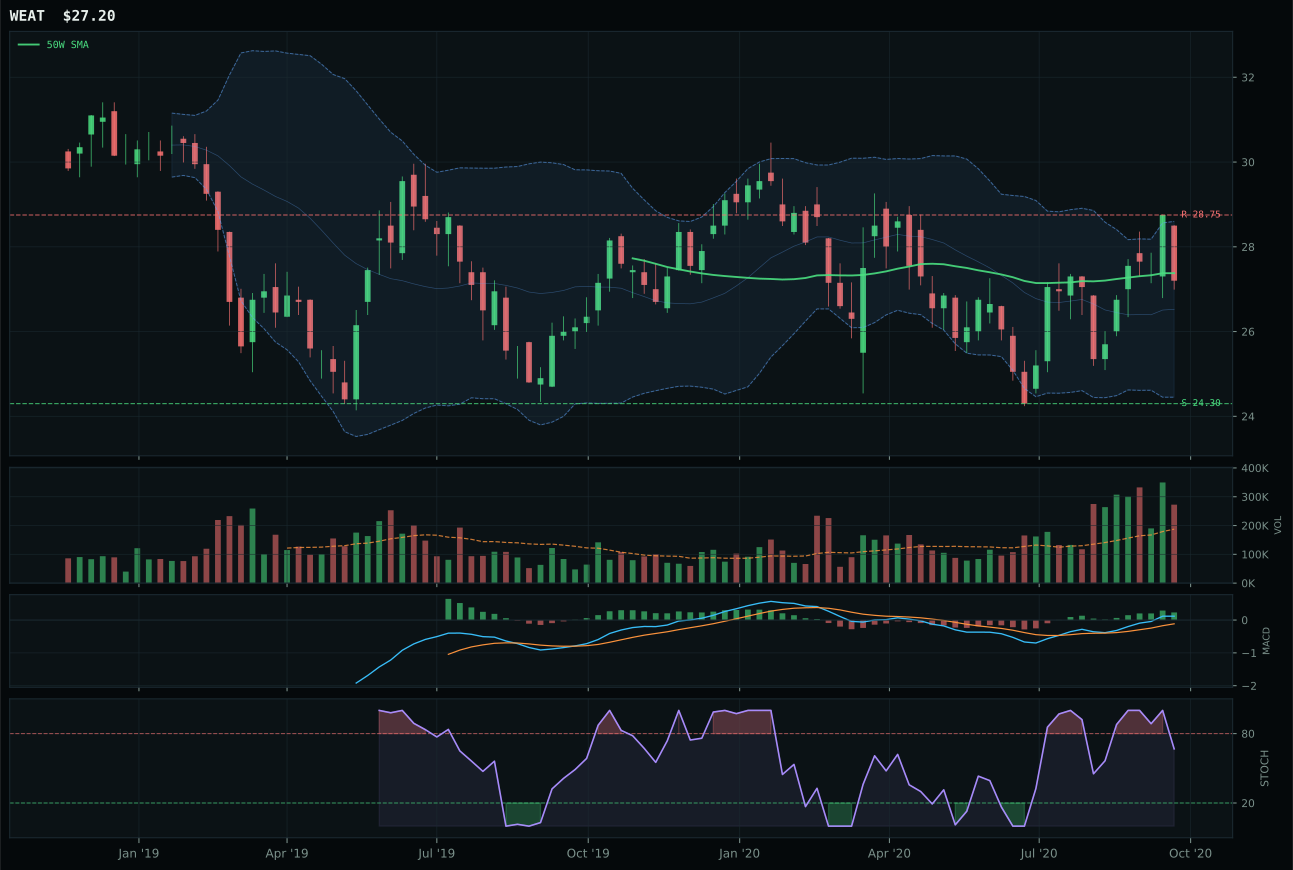
WEAT has a compression near 50W profile with 2.4% 13-week relative strength versus SPY.
Extension and support failure are the main tactical risks.
Tracked, but not top-2 eligible because: structurally broken.
MOO won with a composite score of 78 against VEGI's 57, a gap driven entirely by structural cleanliness and risk/reward. Both trade at 50W-level support with neutral structures and bullish-but-flattening MACD; the difference is that MOO delivers 80.2 structure versus VEGI's 72.2, and more critically, MOO shows above-average volume participation (1.35x 20W) confirming the rally, while VEGI shows distribution pressure. This matters because agribusiness (MOO) is consolidating higher with real participation, whereas plant-based proteins (VEGI) are rallying on thinner commitment. MOO's 12.9% 13W return with category-relative parity (0.0%) tells you this is broad, not speculative; VEGI's 16.6% with +3.7% category-relative strength suggests it ran ahead of fundamentals. The 21.1-point score gap reflects a clean setup versus a contested one.
Agriculture & Livestock receives 0% allocation this week, ranking outside the eligible pool despite MOO's technical win. The category score of 20.6 places it 9th or 10th, below all funded sleeves, because disinflation pressure is active and penalizes the entire commodity space (-8 points). This is the Goldilocks regime's most direct headwind for agri: if deflationary forces persist, input costs fall and farm margins compress despite volume. Macro fit of 42.0 is the lowest in the portfolio, and no active descriptor supports agriculture at all. MOO's technical case (71.9 technical evidence) is sound and should be monitored, but the portfolio has no room for cyclical commodity stories when macro is sliding toward disinflationary pressure. Re-entry would require either a macro pivot (inflation surprise) or a deterioration in higher-conviction categories like AI and EM. Hold this category at zero and review after next week's macro data.
Traditional Energy — XLE
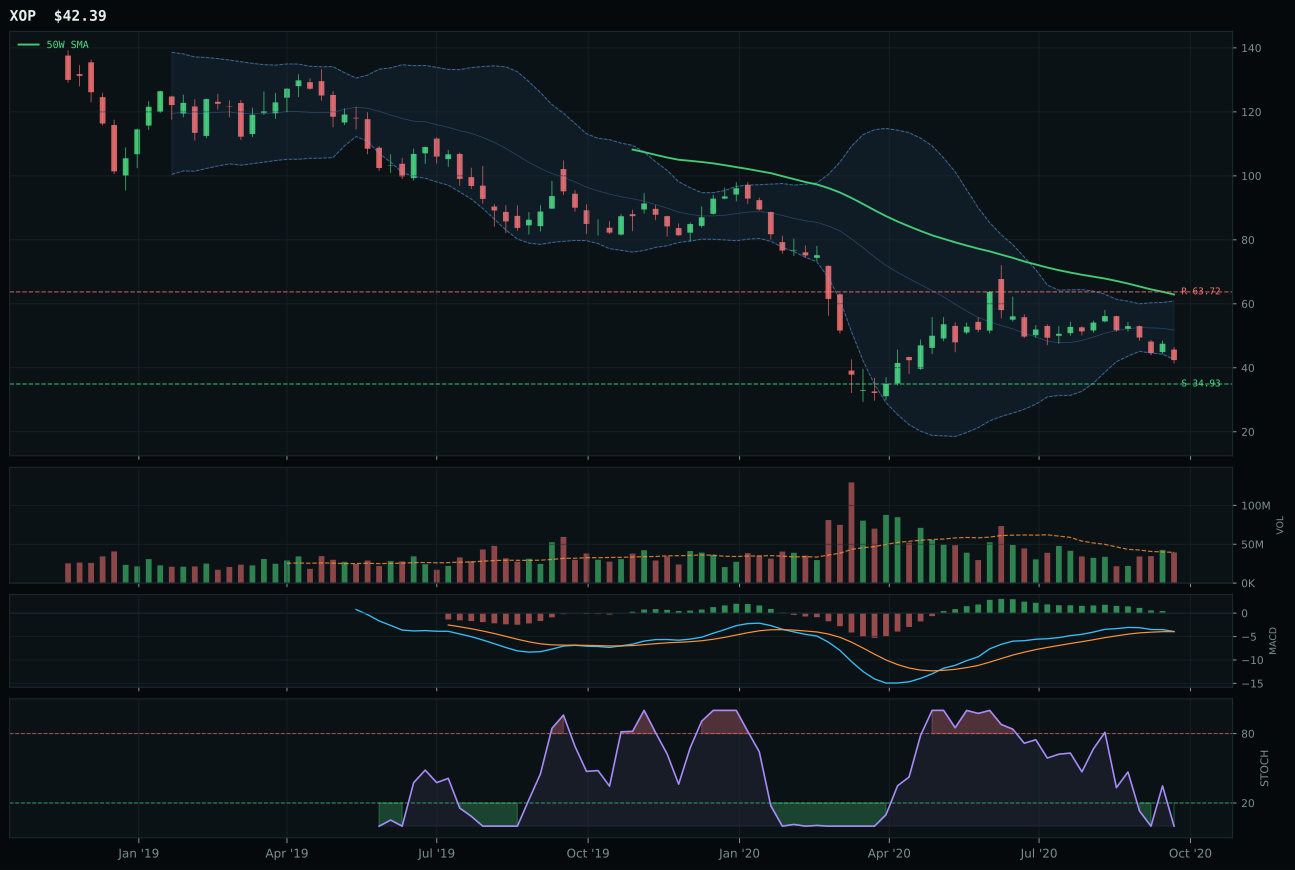
XOP has a neutral structure profile with -24.3% 13-week relative strength versus SPY.
Extension and support failure are the main tactical risks.
Tracked, but not top-2 eligible because: structurally broken.
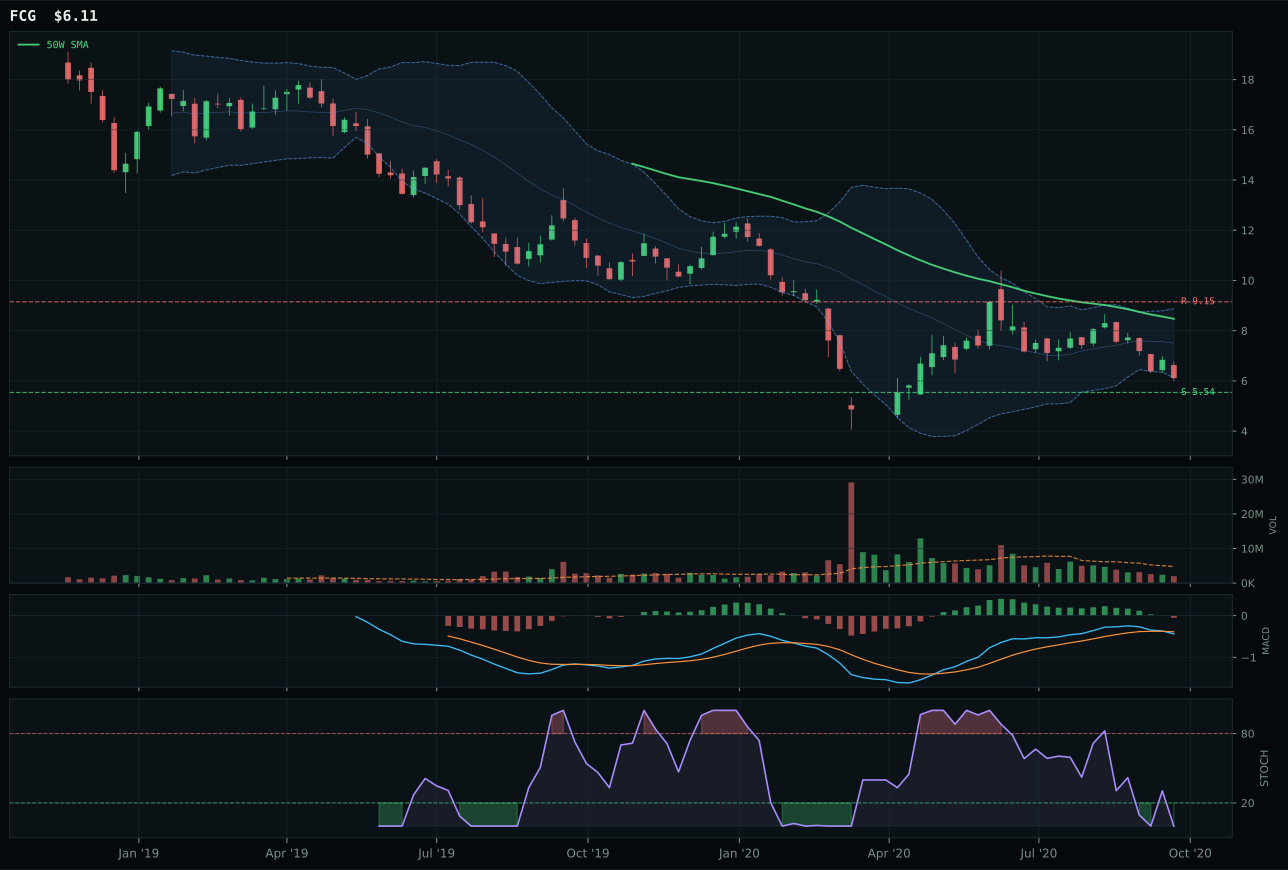
FCG has a neutral structure profile with -24.3% 13-week relative strength versus SPY.
Extension and support failure are the main tactical risks.
Tracked, but not top-2 eligible because: structurally broken.
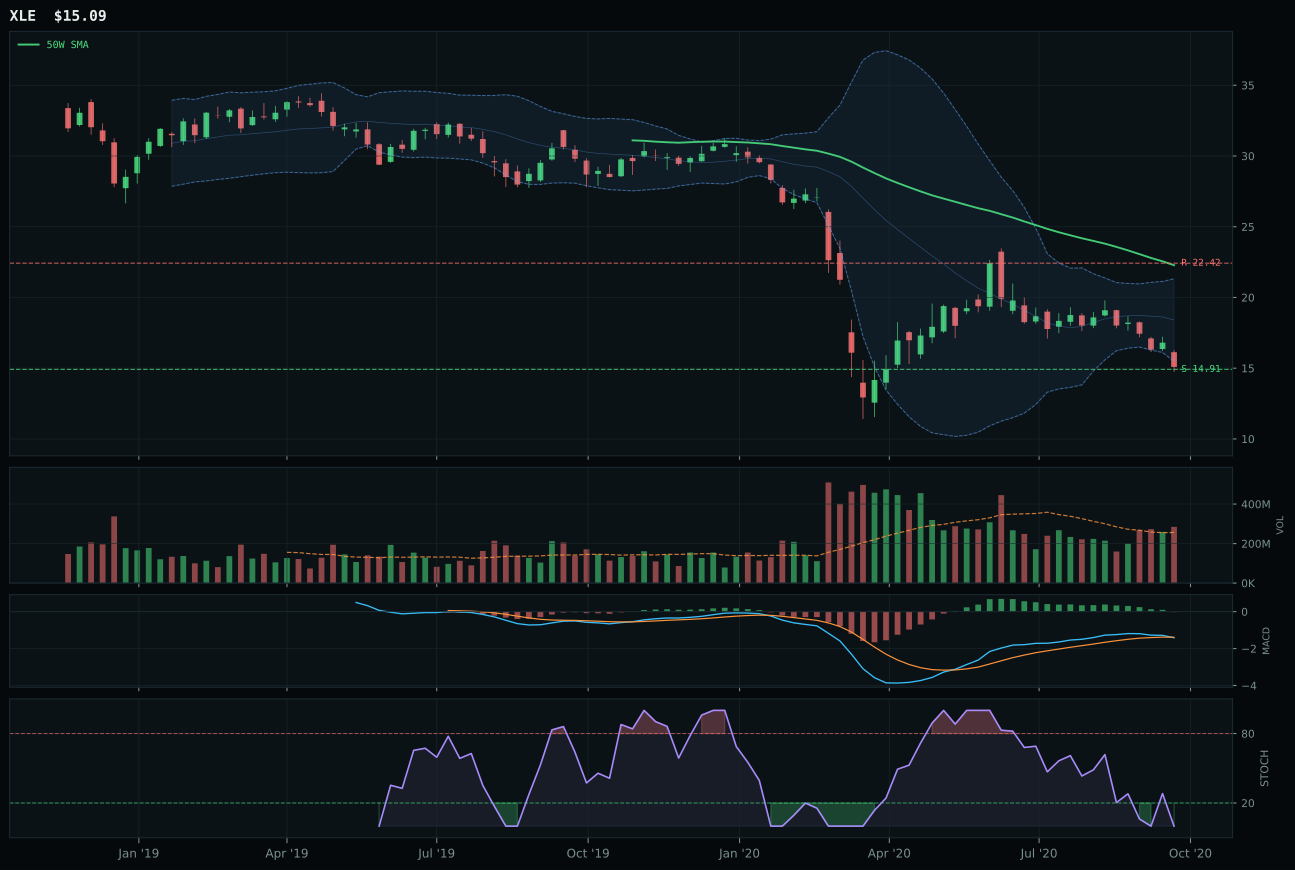
XLE has a pullback into support profile with -26.9% 13-week relative strength versus SPY.
Extension and support failure are the main tactical risks.
Tracked, but not top-2 eligible because: structurally broken.
XLE won the internal category battle by posting a 60.0 timing score versus XOP's 50.0 and FCG's 50.0, which in a structurally broken category is the only valid tiebreaker. All three ETFs are deep underwater: XLE -32.3% from the 50W, prices below both key moving averages, MACD bearish, stochastic RSI oversold at 0.00. The only separating factor is XLE's above-average volume participation (1.11x 20W), suggesting some institutional recognition that support at 14.91 (1.2% downside) is worth defending. XOP and FCG show neutral or thin participation, revealing reluctant holders. Risk/reward is theoretically compelling at 75.0 for XLE (27.3% upside range from 14.91 to 22.42), but this is a synthetic trade—you're not buying momentum or conviction, you're buying capitulation hope. The category is broken; XLE simply broke least.
Traditional Energy receives 0% allocation and ranked outside the eligible pool with a category score of 0.0, the only category disqualified entirely. The structural filter explicitly marked Traditional Energy as ineligible: price action is not just mean-reverting—it is in repair mode with XLE below the 200W, MACD bearish/weakening, and momentum confirmation scoring 0.0. The macro case is actively hostile: disinflation pressure is live (-10 points) and credit stress active (-7), combining for -17 macro headwind. Goldilocks regime provides zero buffer for this category (+0), leaving it to subsist purely on technical setup quality. The technical evidence for XLE is 0.0—no redemption there. This allocation is zero because energy is not broken-for-now; it is broken-for-real. Crude and natural gas will need price discovery much lower before this category becomes investable, and even then, it will require macro reacceleration or credit thaw. Do not attempt to catch falling knives; wait for clear accumulation signals and triple support confirmation.