
2020-09-18
Informational purposes only. The content in this report, including allocations, analysis, and commentary, is provided solely for informational and educational purposes. It does not constitute financial advice, investment advice, trading advice, or any other type of advice. Past performance does not guarantee future results. Always conduct your own research and consult a qualified financial professional before making investment decisions.
Some tracked tickers were excluded due to missing live weekly price data: SGOV: Historical cache SGOV has only 16 usable weekly bars
Weekly Allocation
| Ticker | Category | Weight | Role |
|---|---|---|---|
| FSOL | 50% | Overlay | |
| PICK | Industrial Metals | 10% | Top-2 (10%) |
| IGV | Technology | 10% | Top-2 (10%) |
| INDA | Emerging Markets | 5% | Tier-2 (5%) |
| BOTZ | AI | 5% | Tier-2 (5%) |
| GLD | Precious Metals | 5% | Tier-2 (5%) |
| PAVE | Utilities & Infrastructure | 5% | Tier-2 (5%) |
| XAR | Defense & Aerospace | 5% | Tier-2 (5%) |
| MOO | Agriculture & Livestock | 5% | Tier-2 (5%) |
Trade Instructions — Monday Open
Sell the tranche from 2020-08-21 (completing its 4-week hold). Buy the new tranche. Instructions show net portfolio changes — same-asset positions cancel, weight changes show the delta.
| Action | Ticker | Instruction |
|---|---|---|
| SELL | SLV | Sell 40% of SLV position (reduce 6.25% → 3.75%) |
| SELL | INDA | Sell 17% of INDA position (reduce 7.50% → 6.25%) |
| SELL | XLK | Sell 25% of XLK position (reduce 5.00% → 3.75%) |
| SELL | SMH | Sell 50% of SMH position (reduce 2.50% → 1.25%) |
| SELL | REMX | Sell entire REMX position (1.25% of portfolio) |
| SELL | URA | Sell entire URA position (1.25% of portfolio) |
| BUY | PICK | Buy PICK — 28.57% of freed cash (adds 2.50% to portfolio) |
| BUY | BOTZ | Buy BOTZ — 14.29% of freed cash (adds 1.25% to portfolio) |
| BUY | MOO | Buy MOO — 14.29% of freed cash (adds 1.25% to portfolio) |
| BUY | IGV | Buy IGV — 28.57% of freed cash (adds 2.50% to portfolio) |
| BUY | GLD | Buy GLD — 14.29% of freed cash (adds 1.25% to portfolio) |
Current Portfolio After Trade
Combined holdings across all 4 active tranches. Each tranche is 25% of the portfolio.
| Ticker | % of Portfolio | Weight Bar |
|---|---|---|
| FSOL | 50.00% | |
| PICK | 8.75% | |
| INDA | 6.25% | |
| MOO | 5.00% | |
| IGV | 5.00% | |
| XLK | 3.75% | |
| BOTZ | 3.75% | |
| SLV | 3.75% | |
| PAVE | 2.50% | |
| ITA | 2.50% | |
| XLU | 2.50% | |
| GLD | 2.50% | |
| SMH | 1.25% | |
| URNM | 1.25% | |
| XAR | 1.25% |
Macro Regime — Goldilocks
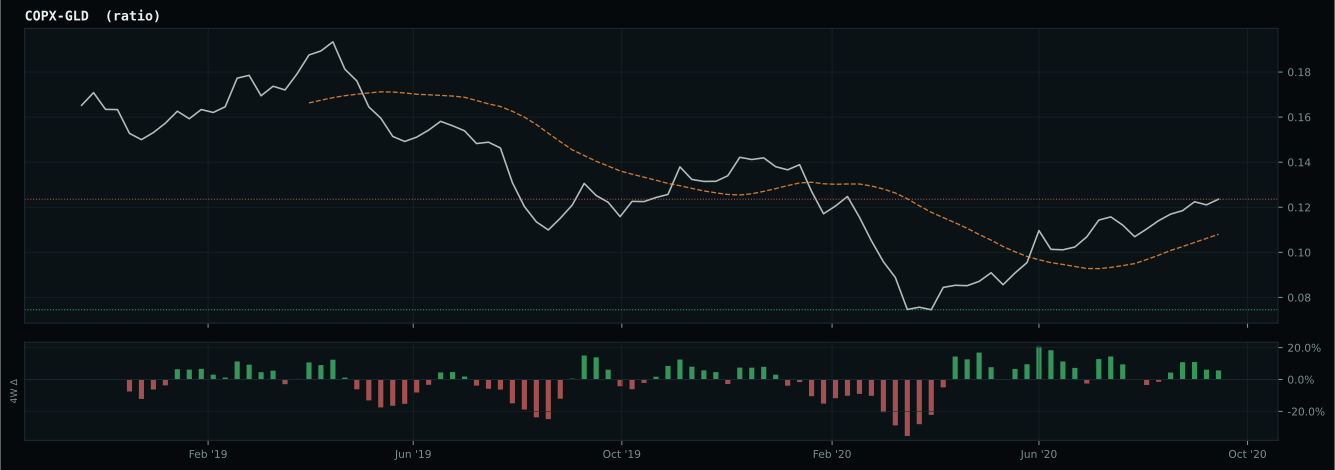
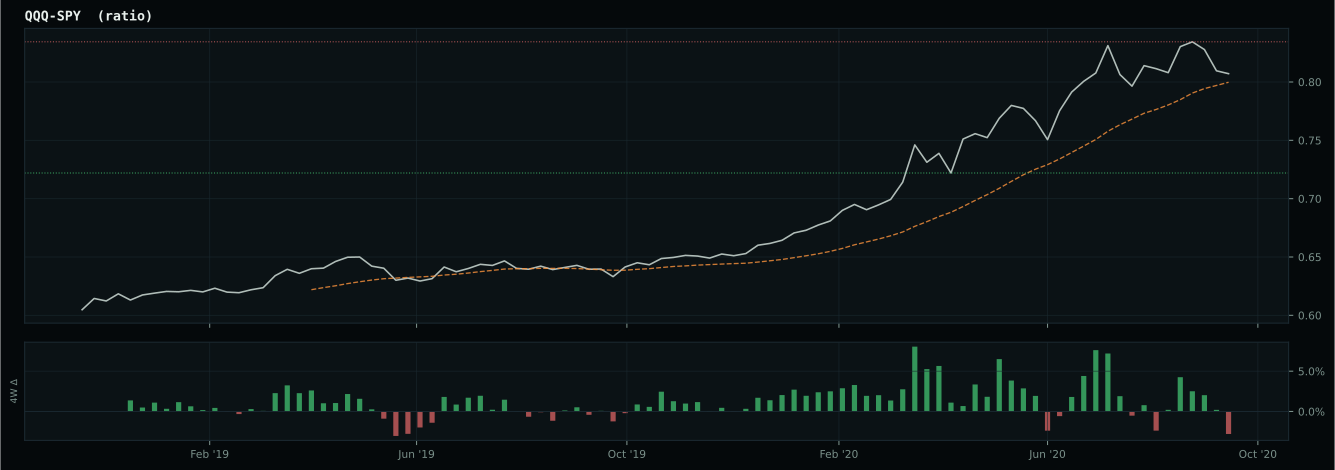
Macro Evidence Charts
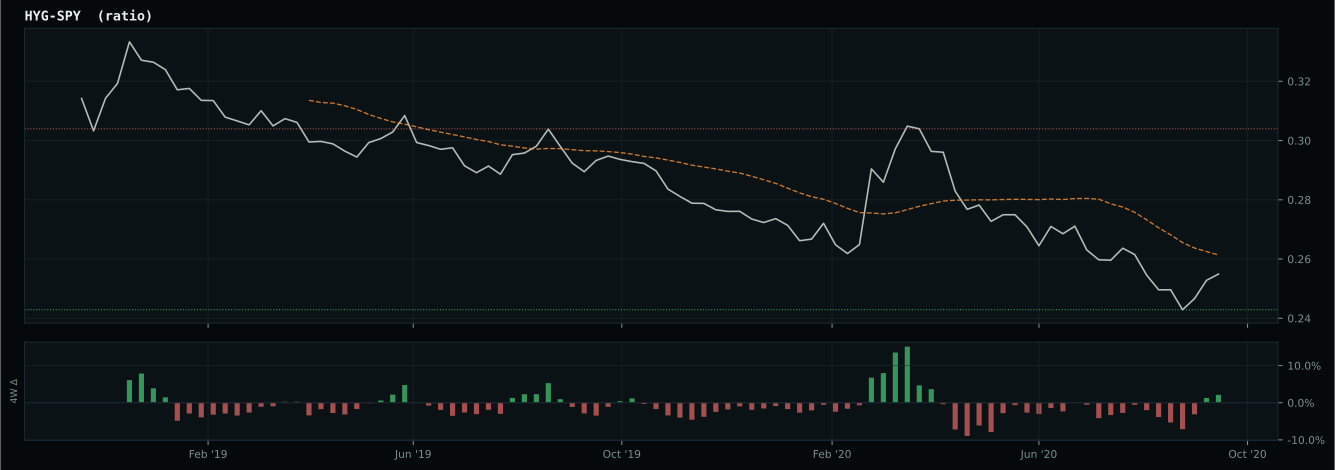
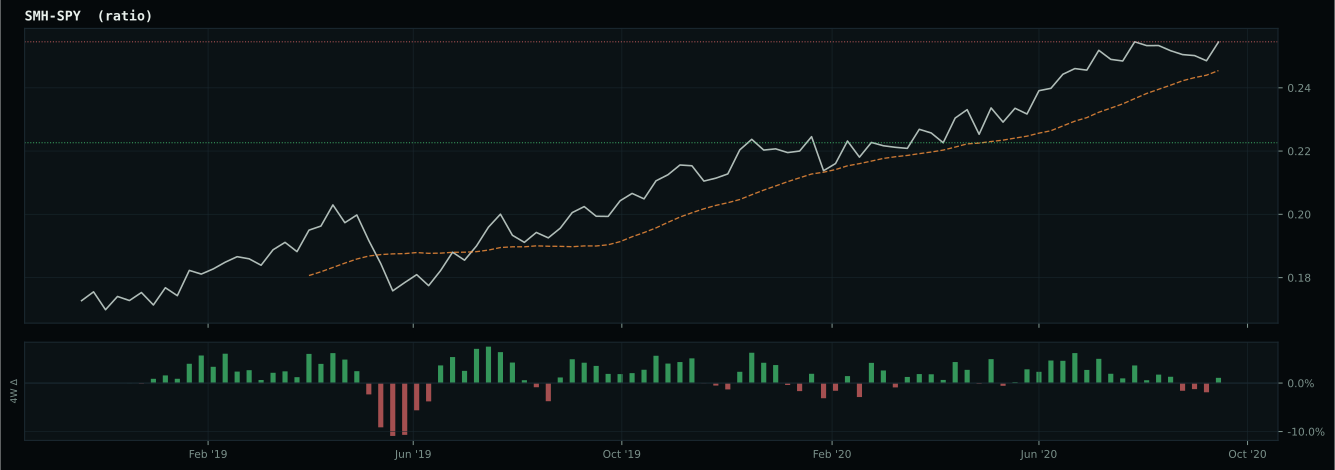
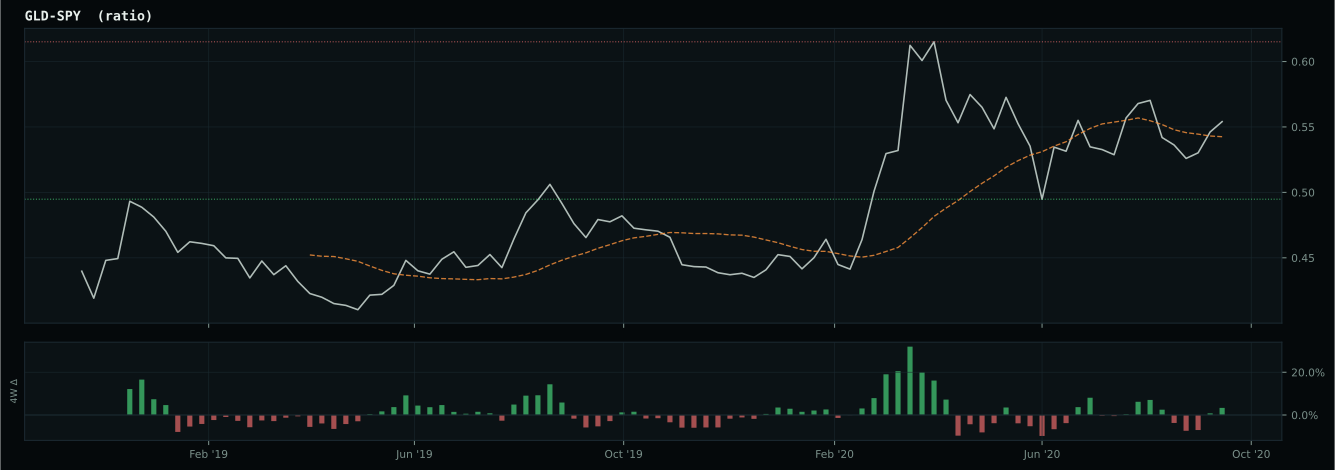
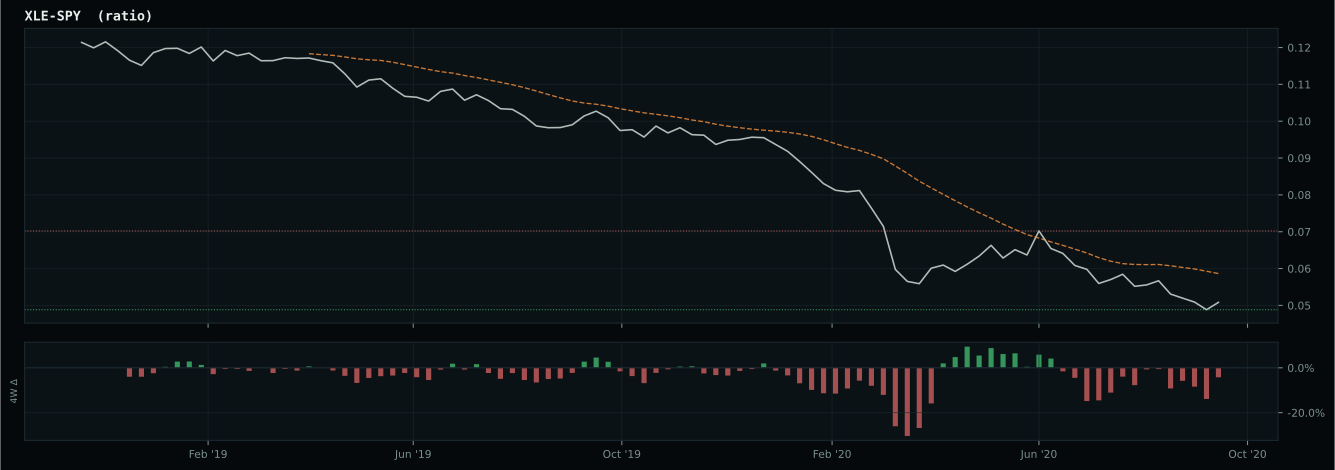
Market-implied signals behind the macro regime scores. Each ratio compares two assets; the direction and slope of the ratio is what the macro engine reads.
Crypto Regime — AltSeason
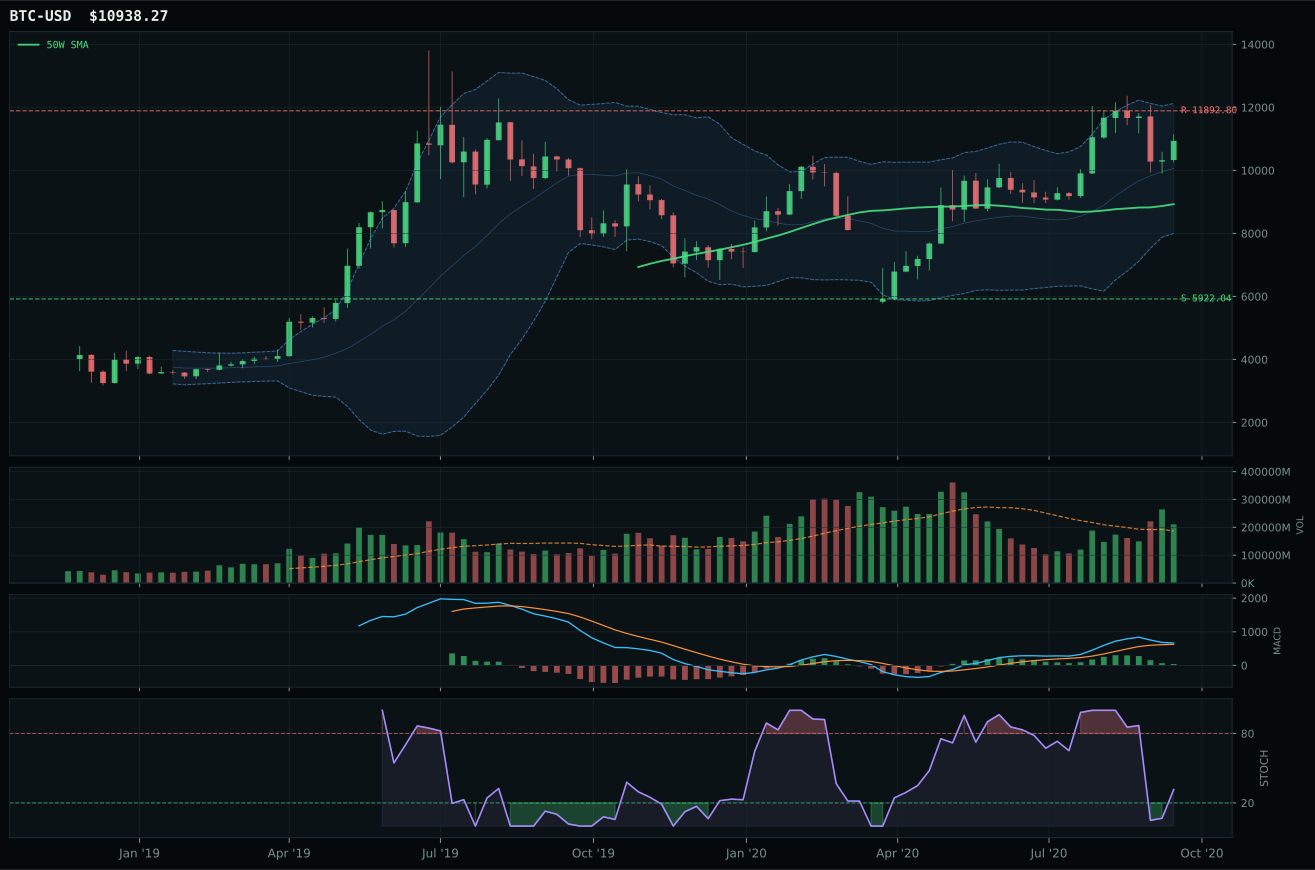
post-touch structure is too wide to count as a range; max/min close ratio is 2.21
TrendBTC confirmed: 2 consecutive closes above rising/flat 50W SMA
all available AltSeason conditions pass; missing optional confirmations skipped

Category Rankings
| Rank | Category | Winner | Score | Alloc | 4W Ret | Peers (4W) |
|---|---|---|---|---|---|---|
| 1 | Industrial Metals | PICK | 75.0 | 20% | +0.40% | REMX +1.1% · COPX -3.3% |
| 2 | Technology | IGV | 60.0 | 20% | +13.90% | XLK +11.2% · CIBR +10.5% |
| 3 | Emerging Markets | INDA | 59.0 | 10% | +4.35% | IEMG +4.2% · ILF +1.3% |
| 4 | AI | BOTZ | 55.9 | 10% | +8.31% | SMH +13.6% · AIQ +10.7% |
| 5 | Precious Metals | GLD | 53.4 | 10% | -0.24% | SLV -4.8% · GDX +0.3% |
| 6 | Utilities & Infrastructure | PAVE | 41.5 | 10% | +8.88% | XLU +11.1% · IGF +4.9% |
| 7 | Defense & Aerospace | XAR | 39.5 | 10% | +3.73% | ITA +2.3% · ROKT +6.2% |
| 8 | Agriculture & Livestock | MOO | 39.3 | 10% | +3.98% | WEAT +6.3% · VEGI +6.7% |
| 9 | Nuclear Energy | NLR | 35.9 | 0% | +7.59% | URA -6.2% · URNM -10.8% |
| 10 | Traditional Energy | XLE | — | 0% | -6.08% | XOP -4.0% · FCG -1.5% |
Industrial Metals — PICK
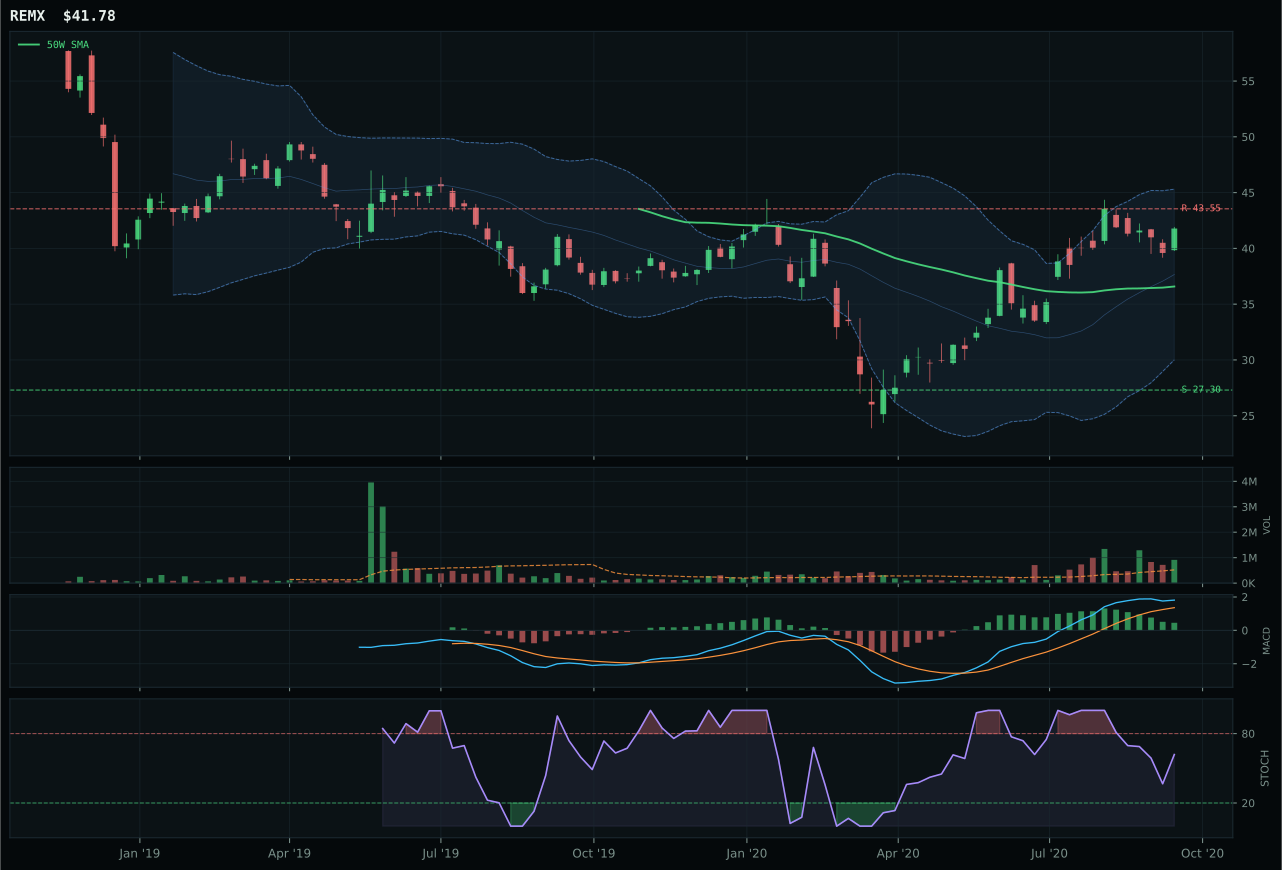
REMX has a neutral structure profile with 13.6% 13-week relative strength versus SPY.
A failed hold above support would weaken the setup.
Actionable but governed by invalidation levels.
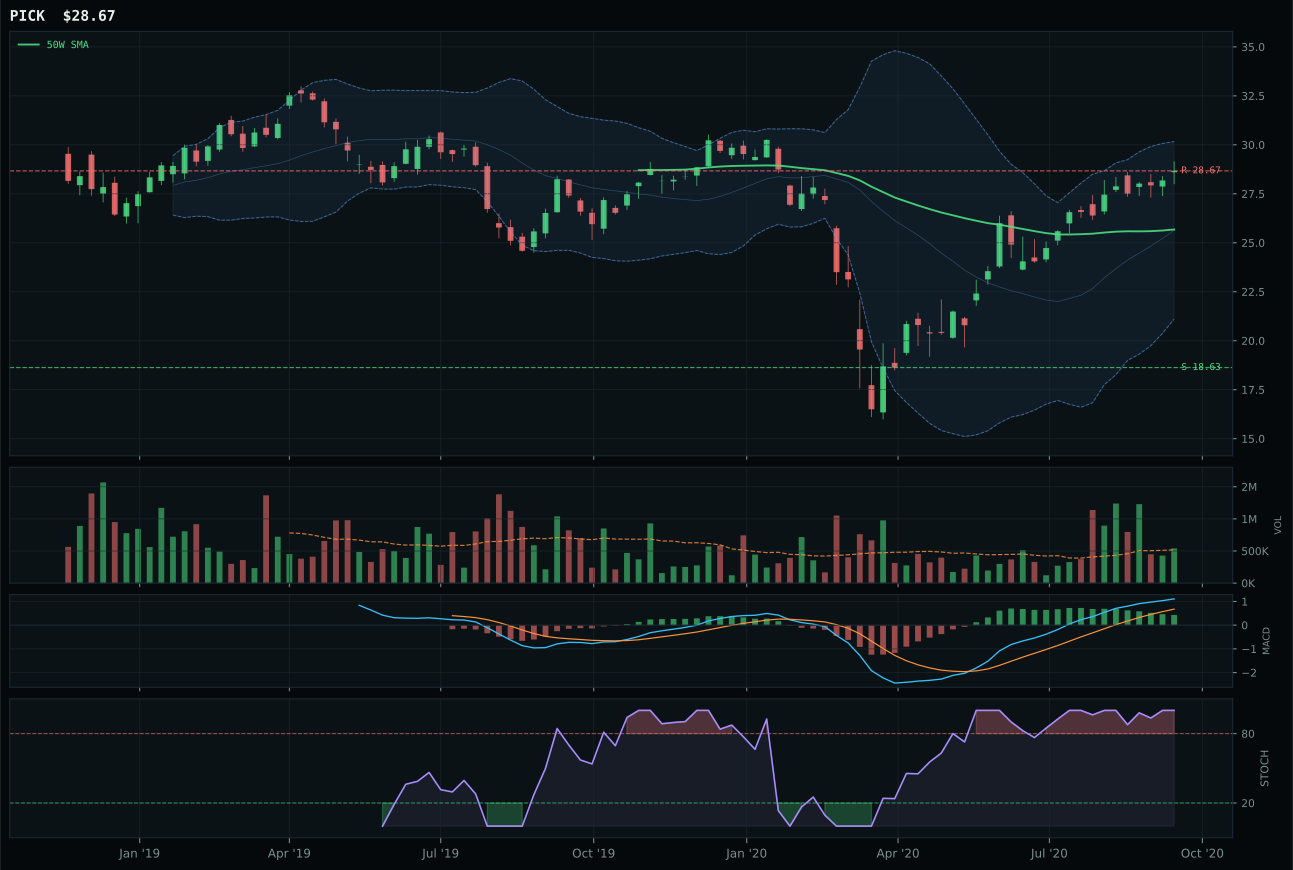
PICK has a neutral structure profile with 12.1% 13-week relative strength versus SPY.
A failed hold above support would weaken the setup.
Actionable but governed by invalidation levels.
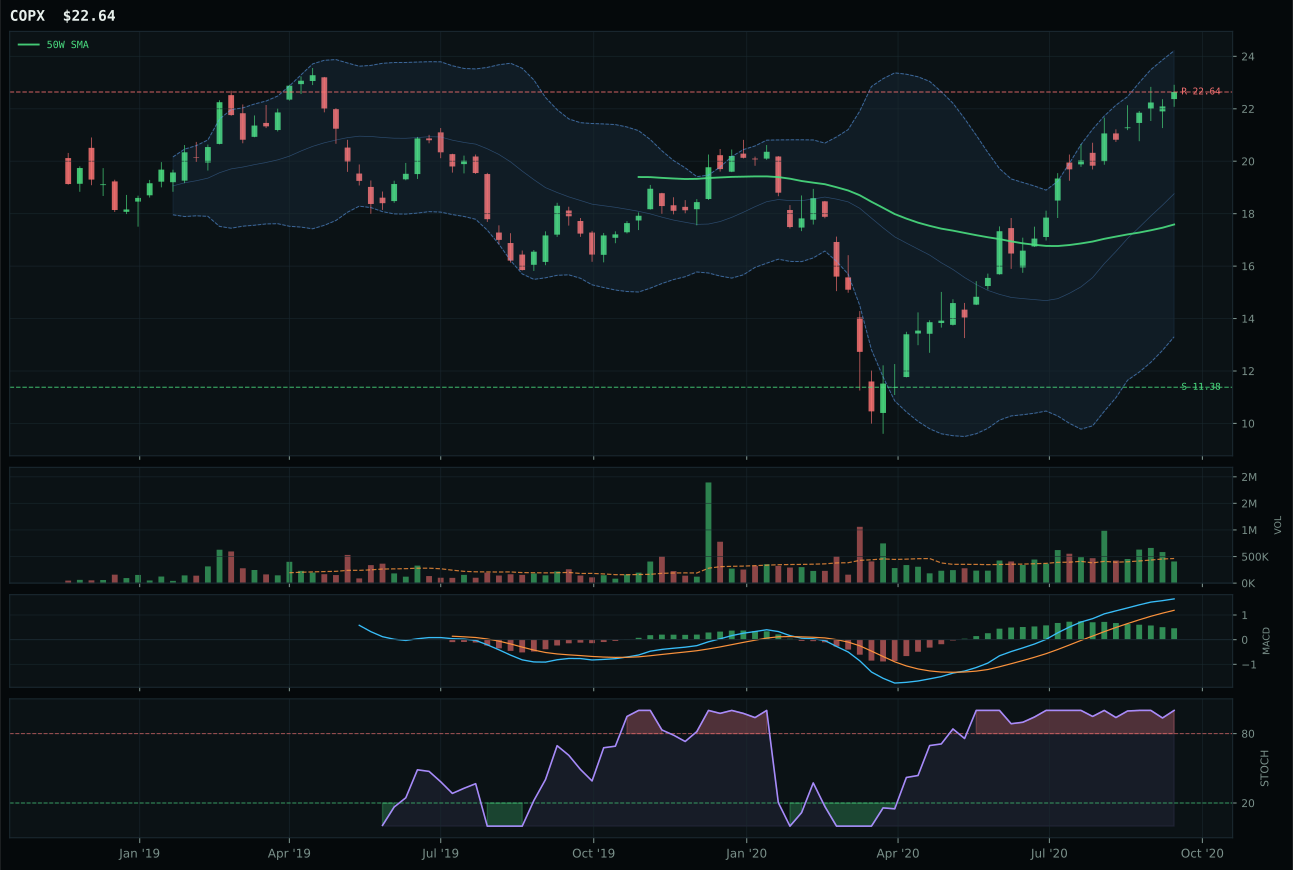
COPX has a vertical extension profile with 29.3% 13-week relative strength versus SPY.
A failed hold above support would weaken the setup.
Tracked, but not top-2 eligible because: .
PICK wins Industrial Metals on perfect momentum confirmation (100.0/100) and persistence (86.1/100), delivering 19.2% 13-week return and 12.1% SPY-relative strength while maintaining neutral volume at 1.05x. The setup is neutral structure with 79.2/100 cleanliness, stochastic RSI overbought momentum at 1.00, and MACD bullish but flattening—this is a sustained move, not a coil or reversal. Price sits 11.6% above the 50-week with support at 18.63 and resistance at 28.67 nearly at price, so the risk asymmetry is poor (47.7/100 risk-reward), yet the timing score of 62.0/100 acknowledges that this is a mature move with legitimate breadth underneath. REMX's 91.5/100 technical evidence and superior volume confirmation (accumulation vs neutral) at first reads as competition, but PICK's structure is cleaner (79.2 vs 78.3) and category-relative strength favors PICK's neutral positioning over REMX's 0.0%, a critical detail in breadth-based selections.
Industrial Metals ranks as top-2 and earns 10% allocation, the second-highest conviction sleeve behind Technology. The category score of 75.0 reflects exceptional macro fit at 79.0/100, where metals scarcity is the dominant bid at +14, commodity breadth positive at +10, and real asset sponsorship at +6 create a fortress narrative in Goldilocks. PICK's 78.5/100 technical evidence demonstrates 96.0/100 trend strength (price above 50W, below 200W, with positive slope), perfect momentum at 100.0/100 from sustained 19.2% returns, and volume-price confirmation at 76.4/100 that validates accumulation. The risk-reward is poor at 47.7/100 and timing is intermediate at 62.0/100, but these drawbacks are acceptable at top-2 sizing because the category's macro case is fortress-grade and PICK's structure is cleanest inside a three-ETF basket anchored by rare-earth supply-chain concerns. This allocation reflects a deliberate bet that metals scarcity sponsorship will persist through the near term.
Technology — IGV
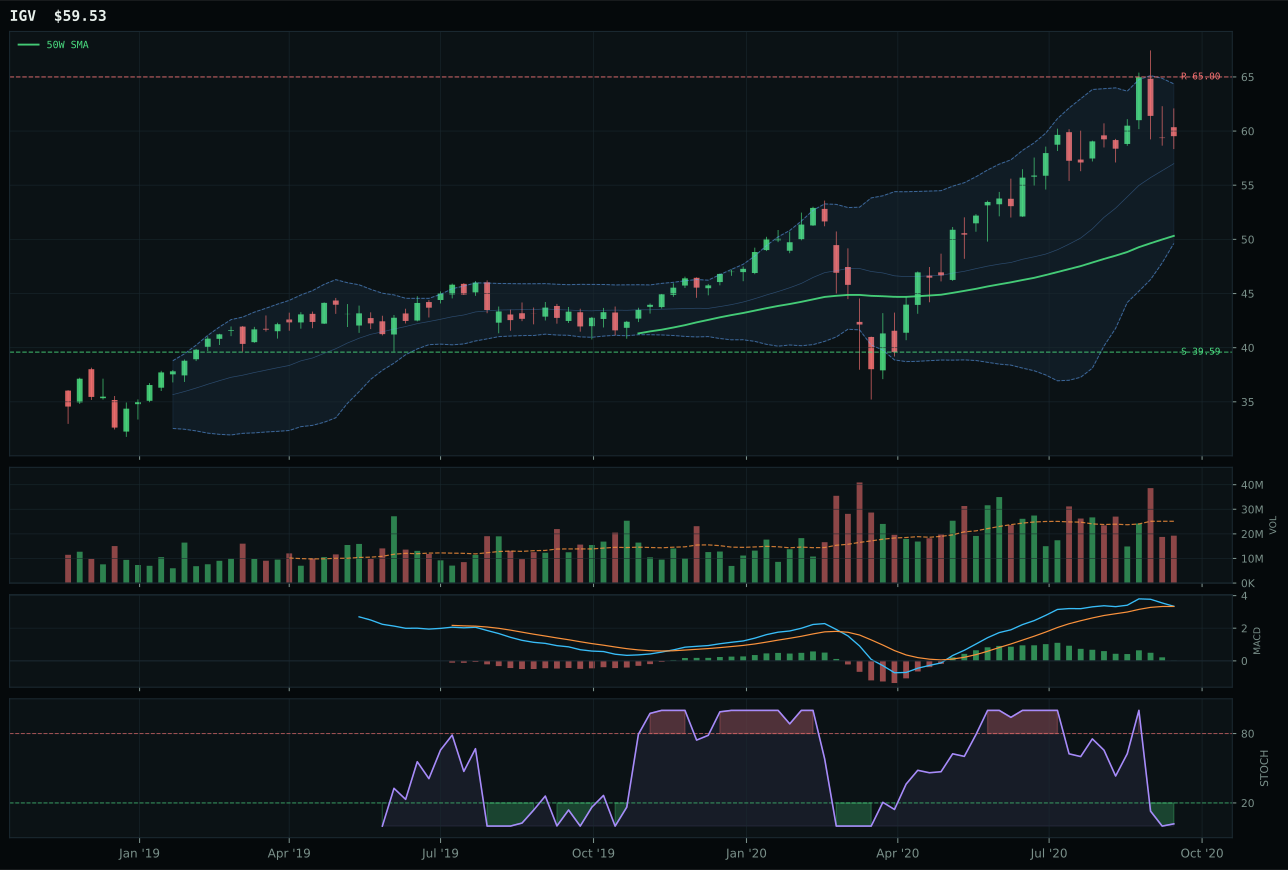
IGV has a vertical extension profile with -0.3% 13-week relative strength versus SPY.
A failed hold above support would weaken the setup.
Actionable but governed by invalidation levels.
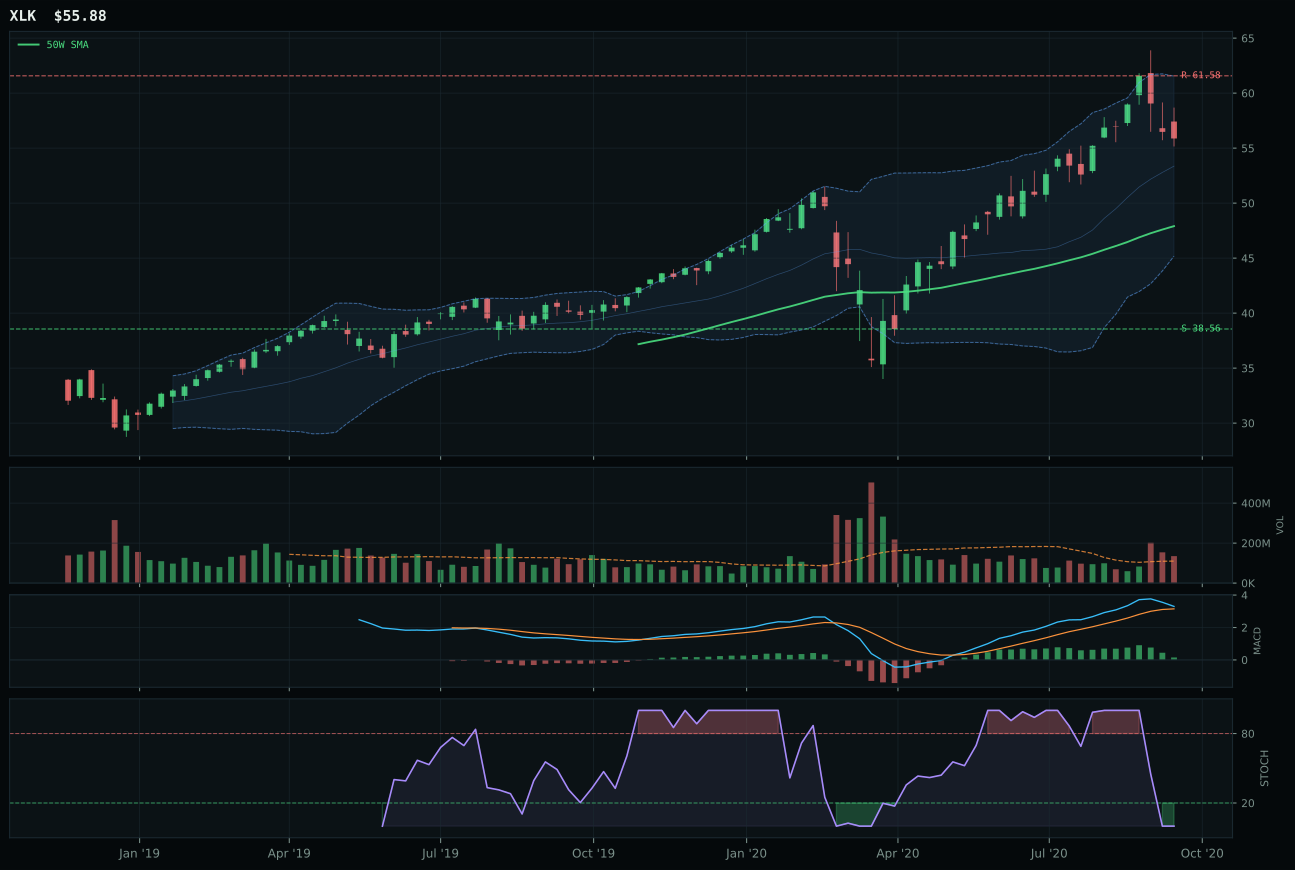
XLK has a vertical extension profile with 2.2% 13-week relative strength versus SPY.
A failed hold above support would weaken the setup.
Actionable but governed by invalidation levels.
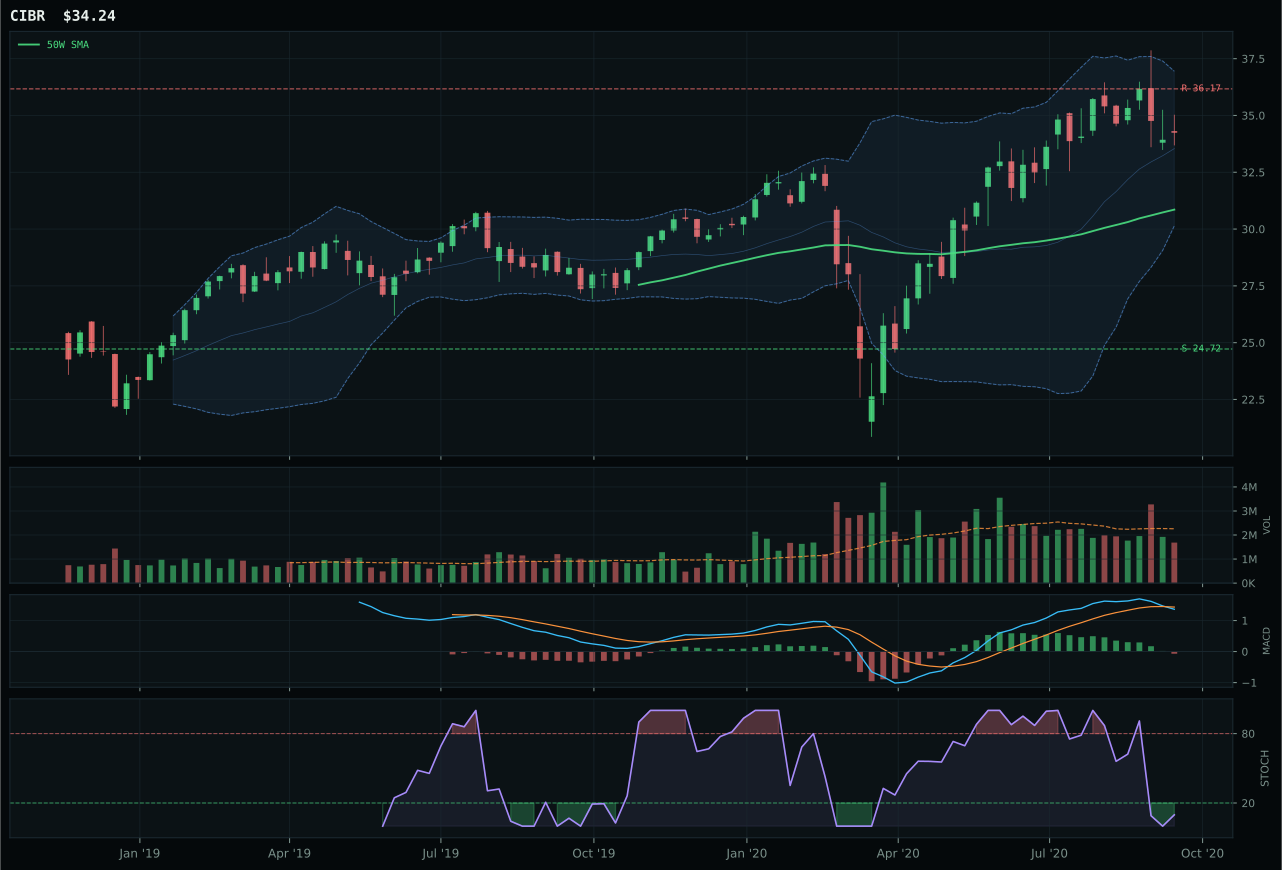
CIBR has a neutral structure profile with -2.8% 13-week relative strength versus SPY.
A failed hold above support would weaken the setup.
Actionable but governed by invalidation levels.
IGV wins on cleaner structure and better risk-reward despite XLK's superior momentum readings. IGV's 6.9% 13-week return with -0.3% relative strength versus SPY sits in a vertical extension 18.3% above the 50-week MA, which is extended but not as severely punished as it might appear because stochastic RSI has compressed to oversold at 0.02, signaling a coil rather than exhaustion. The 50-week slope remains positive at 0.7% and volume is neutral at 0.77x the 20-week average, meaning accumulation isn't being rejected. XLK's loss stems from category-relative weakness: its 0.0% reading versus IGV's category median placement means it lacks the peer sponsorship inside enterprise software exposure that the scoring demands.
Technology earns 10% as a top-2 category, ranking alongside Industrial Metals as the portfolio's highest-conviction positions in a Goldilocks regime. The category's 60.0 score reflects 95.6/100 trend strength—price firmly above both the 50W and 200W—combined with 71.8/100 structure cleanliness that supports the entry risk of being 18.3% extended. Disinflation pressure active at +5 and risk appetite positive at +9 create a macro tailwind for duration-sensitive growth, yet this is not a free ride: the timing score of only 48.0/100 reflects that most of the 56.6% 26-week gain has already been captured, and MACD is visibly flattening despite bullish setup. The allocation holds because the technical proof order demonstrates genuine peer leadership inside the three-ETF basket, not macro label alone.
Emerging Markets — INDA
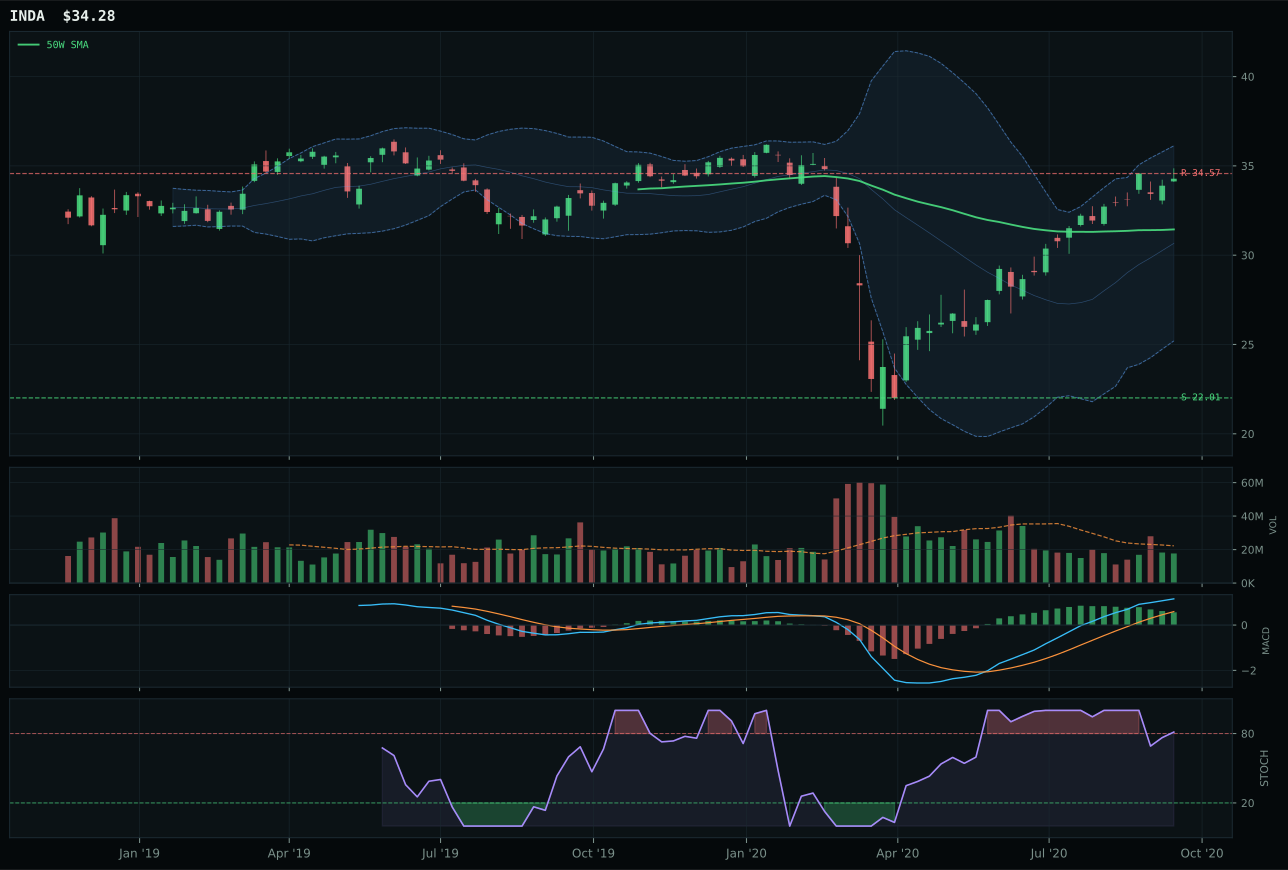
INDA has a neutral structure profile with 12.5% 13-week relative strength versus SPY.
A failed hold above support would weaken the setup.
Actionable but governed by invalidation levels.
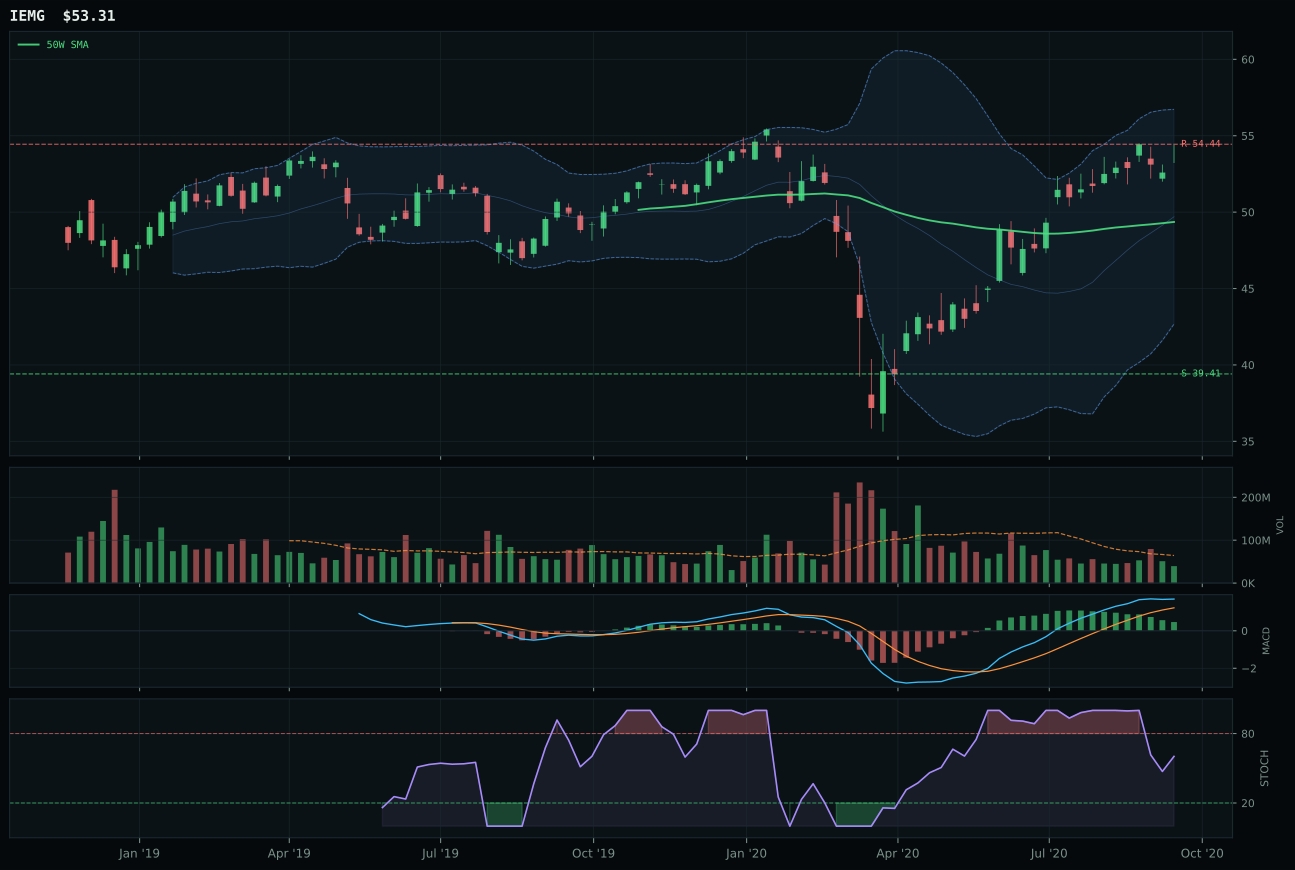
IEMG has a neutral structure profile with 4.9% 13-week relative strength versus SPY.
A failed hold above support would weaken the setup.
Actionable but governed by invalidation levels.
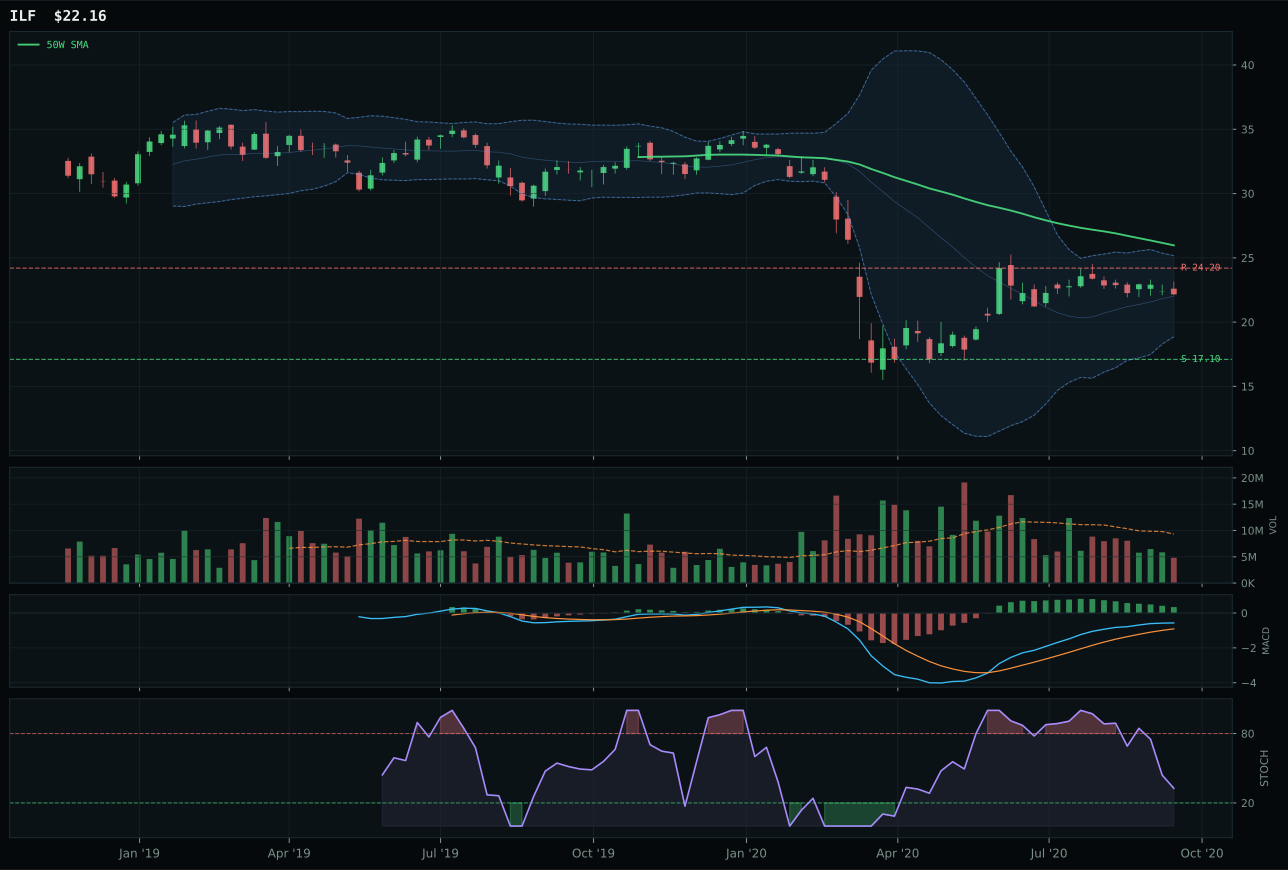
ILF has a neutral structure profile with -7.6% 13-week relative strength versus SPY.
Extension and support failure are the main tactical risks.
Tracked, but not top-2 eligible because: structurally broken.
INDA wins Emerging Markets on category-relative dominance: 12.5% SPY-relative strength, 19.6% 13-week return, and 7.6% category-relative positioning that crushes IEMG's 0.0% peer comparison. The setup is textbook strength: price above both moving averages with 0.1% slope, structure at 82.3/100 with 83.3% cleanliness, stochastic RSI overbought rolling over at 0.81, and MACD bullish but flattening. Volume is neutral at 0.80x, and momentum confirmation reaches 100.0/100 from sustained returns and category leadership. The risk-reward is tight at 45.3/100 because resistance is nearly at hand (-0.8% upside), but the timing score of 52.0/100 and persistence of 88.7/100 show this is a clean move with confirmation, not a blown-out extended ramp. IEMG's structure is less clean (75.5 vs 82.3) and volume is thin (neutral vs thin), making INDA's selection straightforward.
Emerging Markets earns 5% as a tier-3 category, supported by macro tailwinds that don't quite justify top-2 status. The category score of 59.0 reflects 70.0/100 macro fit, where EM liquidity support is the active bid at +14 alongside risk appetite positive at +8. INDA's 71.0/100 technical evidence is solid—100.0/100 trend, 100.0/100 momentum confirmation from strong returns and category leadership—but timing at 52.0/100 and risk-reward at 45.3/100 show this is a late-stage extended move with no margin for error. The allocation holds at 5% because EM positioning works in a Goldilocks regime where risk appetite is bid and central banks remain accommodative, yet INDA would need to reset toward support and rebuild timing optionality to earn promotion to tier-2. The category rank of 7th reflects that macro sponsorship is real but technical evidence is stretched; this is a defensive EM hold that works only if risk appetite remains stable.
AI — BOTZ
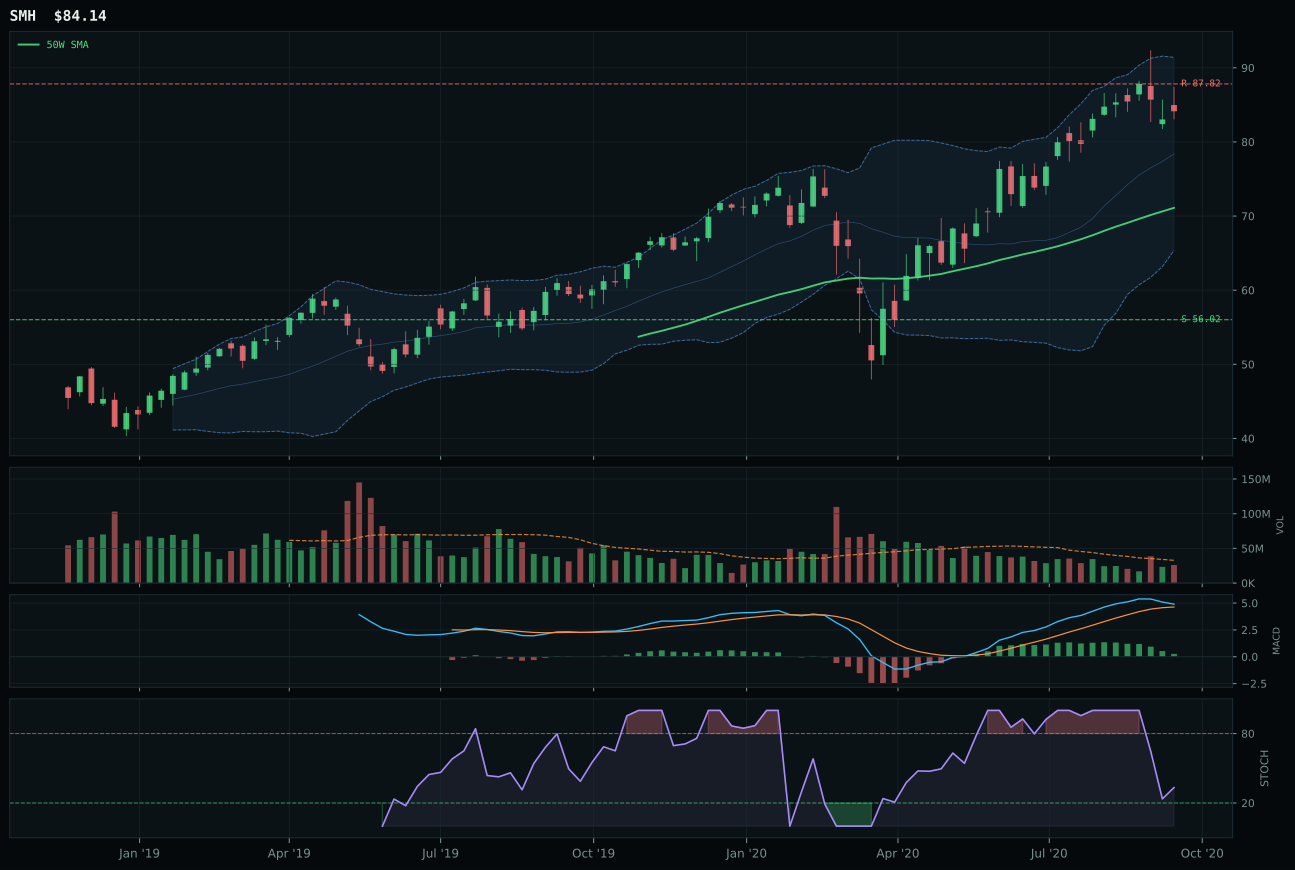
SMH has a vertical extension profile with 4.5% 13-week relative strength versus SPY.
A failed hold above support would weaken the setup.
Actionable but governed by invalidation levels.
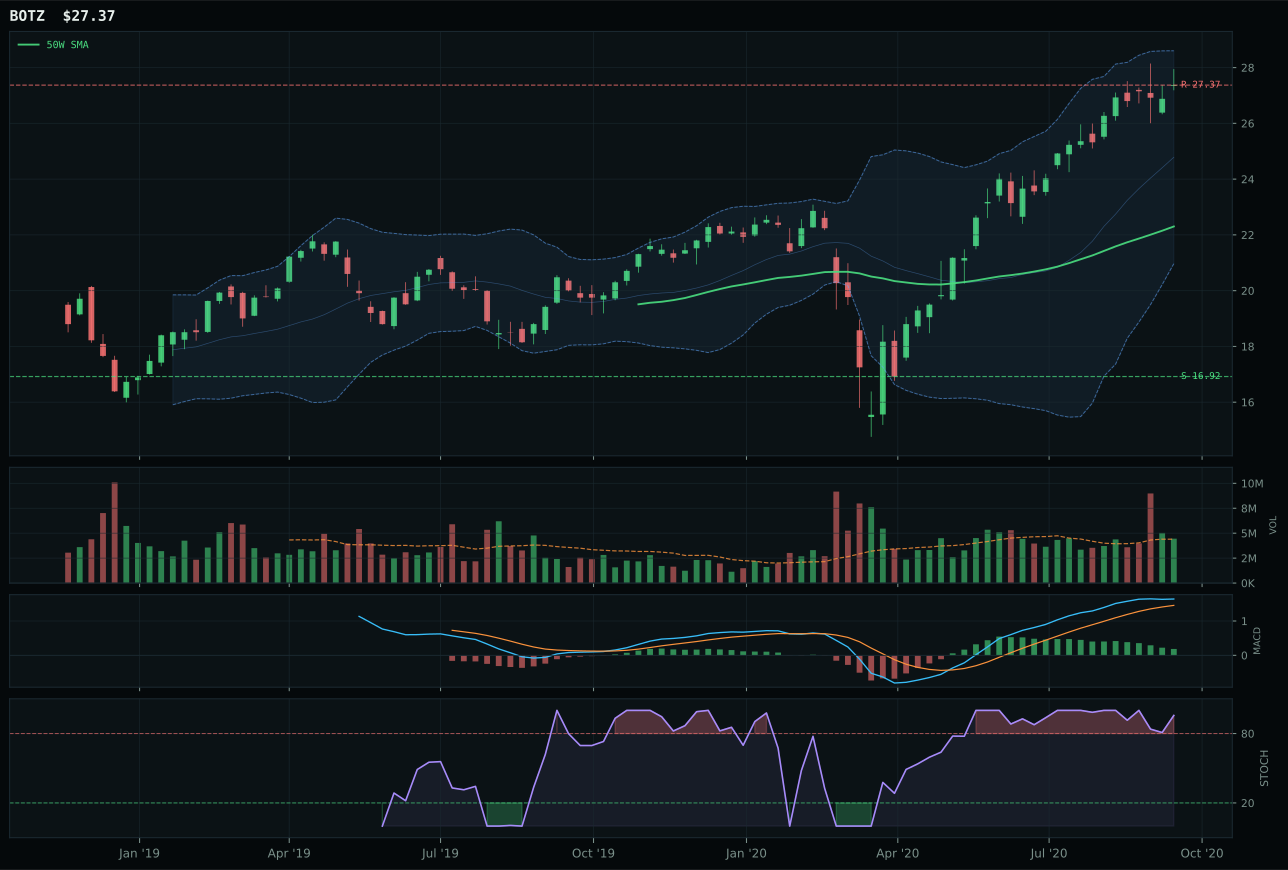
BOTZ has a vertical extension profile with 8.5% 13-week relative strength versus SPY.
A failed hold above support would weaken the setup.
Actionable but governed by invalidation levels.
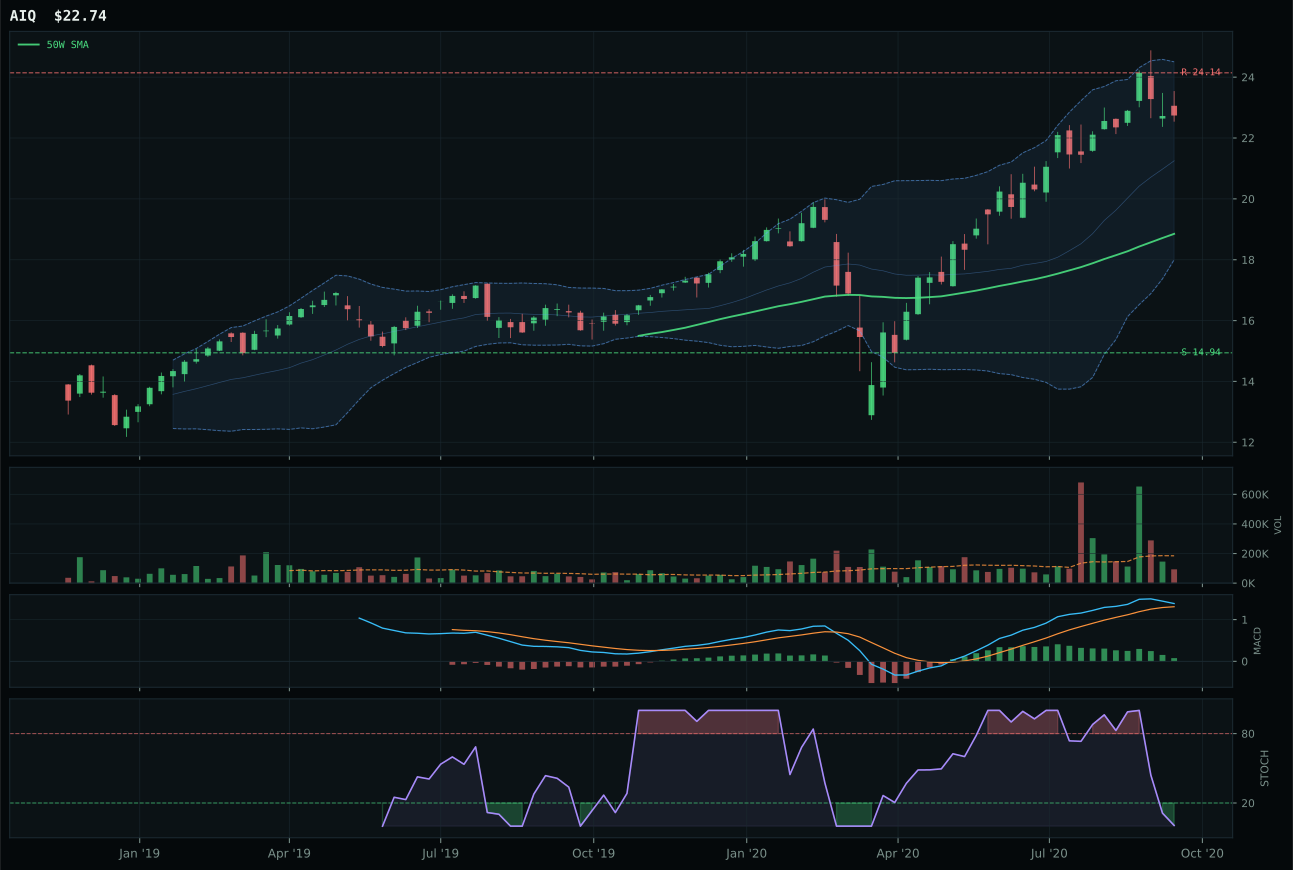
AIQ has a vertical extension profile with 3.6% 13-week relative strength versus SPY.
A failed hold above support would weaken the setup.
Tracked, but not top-2 eligible because: .
BOTZ claims the category on stronger category-relative strength—4.1% versus SMH's 0.0%—despite carrying worse timing risk and the highest extension penalty of all winners at 22.7% from the 50-week MA. The setup is pure momentum: 15.7% 13-week return, 8.5% SPY-relative strength, stochastic RSI overbought and rolling over at 0.96, and resistance sitting just 0.0% above current price near the 52-week high. Volume remains neutral at 1.01x and MACD is still bullish but flattening, which keeps the move from breaking into pure rejection, yet the timing score of 22.0/100 and risk-reward of 39.3/100 show this is a late-stage momentum signal. SMH's 62.2/100 technical evidence couldn't overcome BOTZ's sponsored breadth inside the robotics/physical AI sleeve.
AI receives 5% allocation as a tier-2 category, behind Technology and Industrial Metals. The category's 55.9 score leans heavily on macro fit (76.0/100 category-level), where AI growth sponsorship at +14 and risk appetite positive at +10 carry real weight in an altseason regime. However, the technical evidence of 53.0/100 for the representative reveals why it doesn't rank top-2: BOTZ is extended into a reversal zone with no meaningful upside remaining, and the 13-week return compression (from SMH's 11.6% to BOTZ's 15.7%) hides deteriorating entry quality. The category would need to reset toward support and rebuild volume confirmation to justify promotion; right now it's a macro-driven hold that works only because risk appetite remains bid.
Precious Metals — GLD
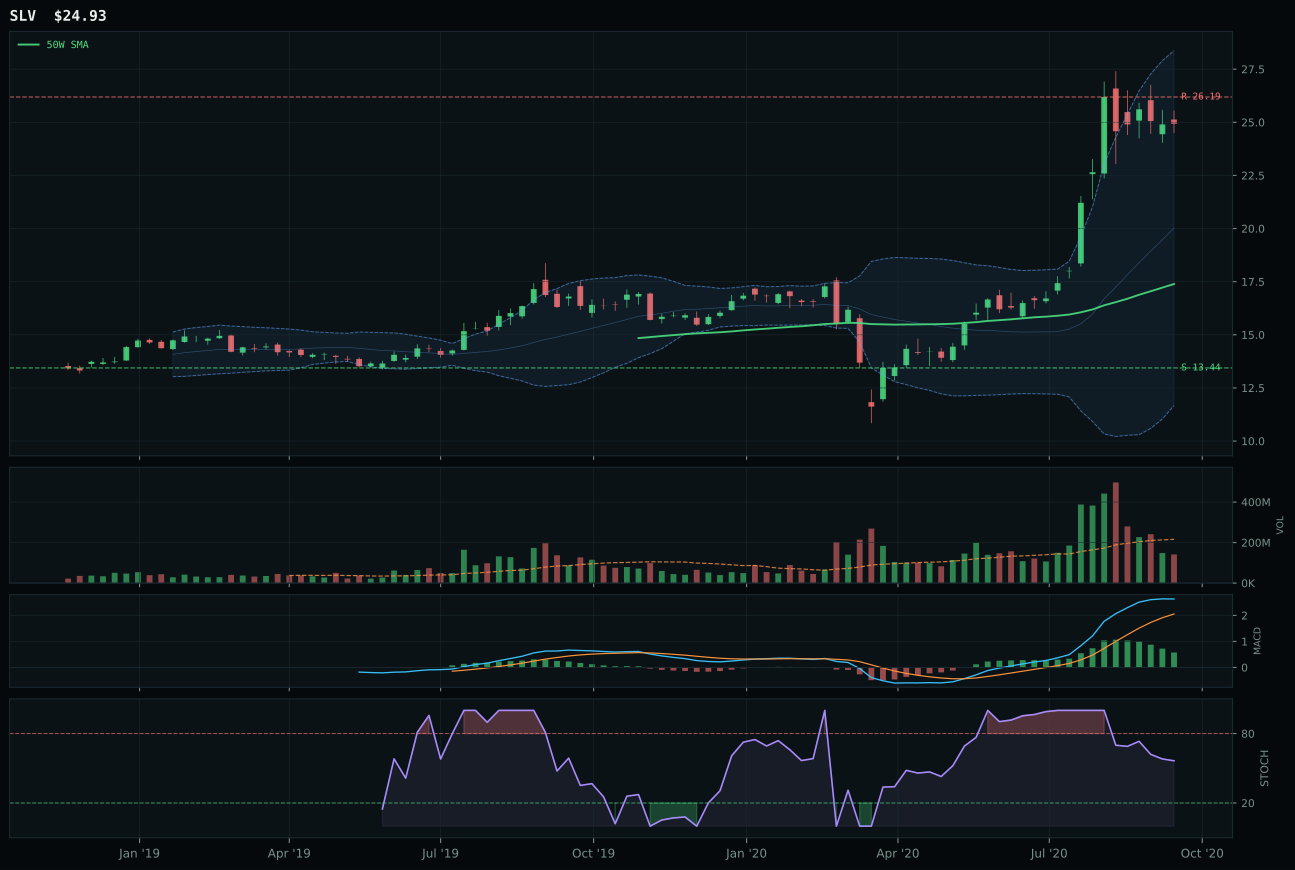
SLV has a vertical extension profile with 44.1% 13-week relative strength versus SPY.
A failed hold above support would weaken the setup.
Actionable but governed by invalidation levels.
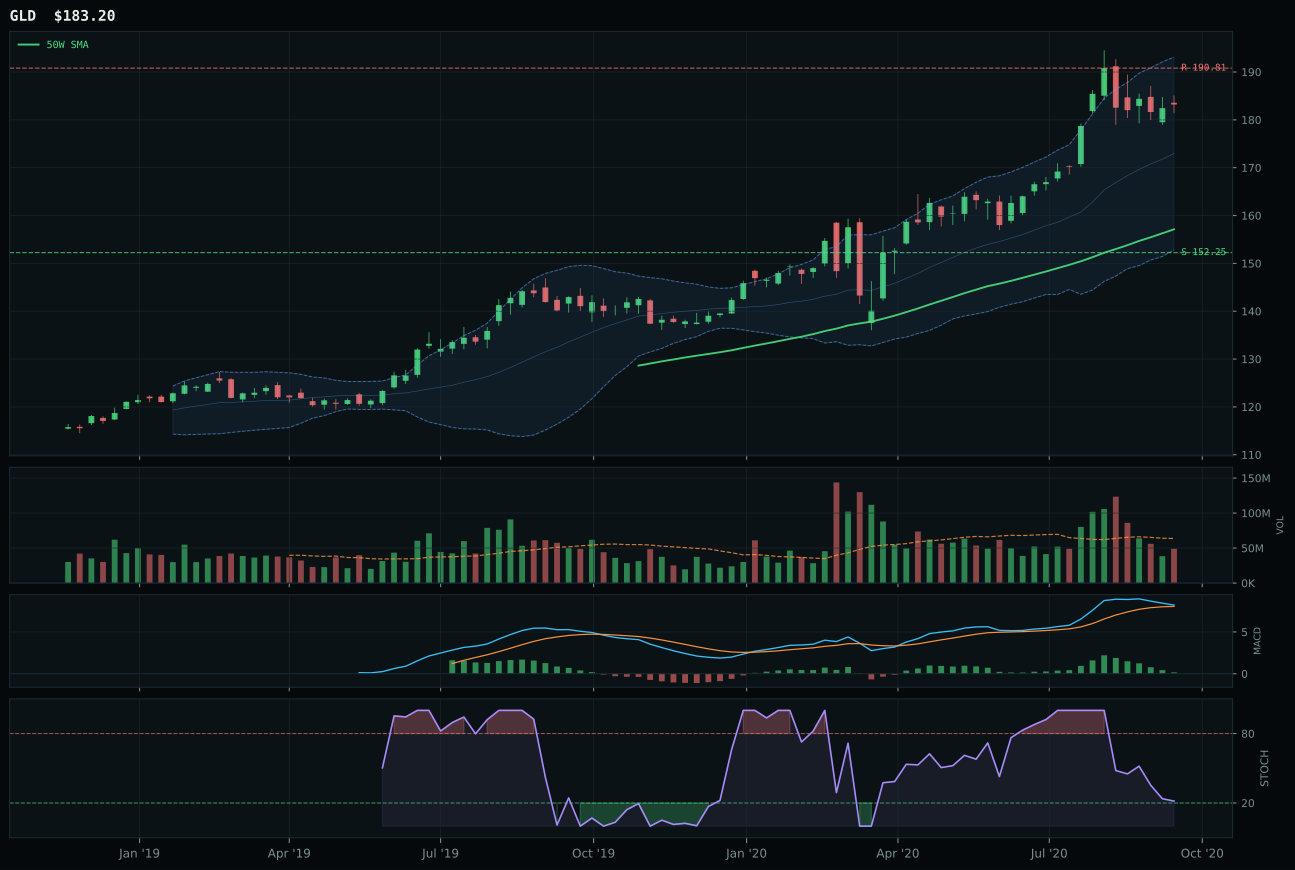
GLD has a vertical extension profile with 4.6% 13-week relative strength versus SPY.
A failed hold above support would weaken the setup.
Actionable but governed by invalidation levels.
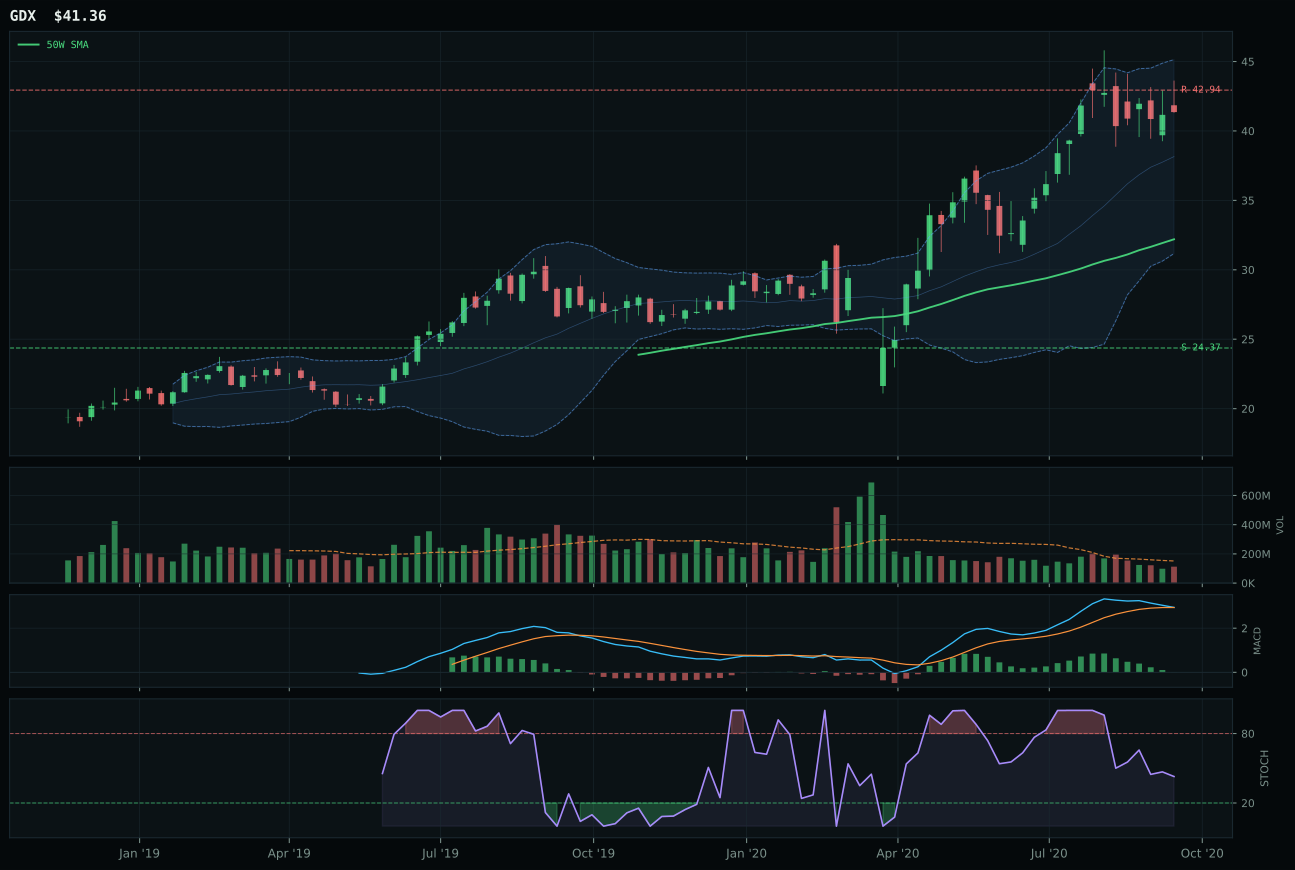
GDX has a vertical extension profile with 16.1% 13-week relative strength versus SPY.
A failed hold above support would weaken the setup.
Actionable but governed by invalidation levels.
GLD wins the metals category on structure superiority and tighter risk-reward despite SLV's explosive momentum: GLD's 79.8/100 structure score beats SLV's 73.3/100, and GLD's risk-reward of 48.5/100 outdoes SLV's 46.0/100 precisely because GLD is less stretched. SLV is a 43.4% extension from the 50-week MA compared to GLD's 16.6%, and that distance difference feeds directly into worse timing (48.0 vs 48.0 identical, but SLV's extension to the upper Fib zone is riskier) and volume confirmation (thin participation vs neutral). SLV's 51.2% 13-week return and 44.1% SPY-relative strength are intoxicating, but they come with stochastic RSI falling/neutral and thin volume that suggests momentum rather than sponsorship. The 1.4-point margin between GLD and SLV masks a meaningful quality difference: GLD is the monetary hedge positioning itself cleanly, while SLV is the leveraged trade that works until it doesn't.
Precious Metals earns 5% as a tier-3 category, supported primarily by macro sponsorship rather than technical strength. The category score of 53.4 reflects 68.0/100 macro fit, where monetary hedge bid is the dominant signal at +14, activated by credit stress and disinflation pressure in the Goldilocks regime. GLD's technical evidence is only 53.8/100, hampered by falling/neutral stochastic RSI at 0.22 and risk-reward of 48.5/100 that leaves little room above resistance. The category-relative strength of -11.6% reveals that SLV's outperformance is creating concentration risk inside metals, yet GLD's selection reflects a deliberate choice to hold the cleaner, steadier monetary hedge rather than chase SLV's leveraged beta. The allocation holds because the macro descriptor checklist provides real support, but only 5% sizing acknowledges that this is a defensive positioning play, not a growth or momentum conviction.
Utilities & Infrastructure — PAVE
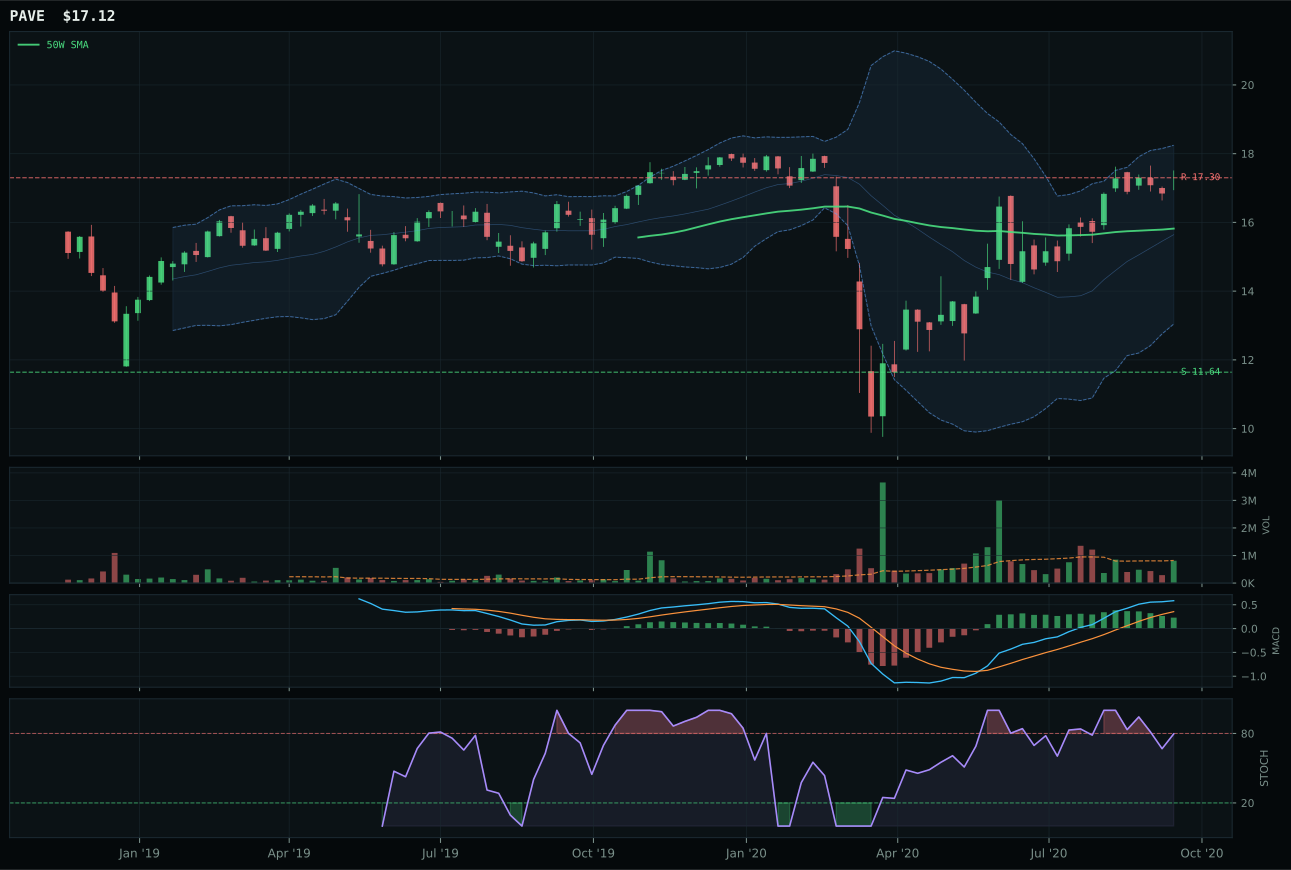
PAVE has a neutral structure profile with 5.8% 13-week relative strength versus SPY.
A failed hold above support would weaken the setup.
Actionable but governed by invalidation levels.
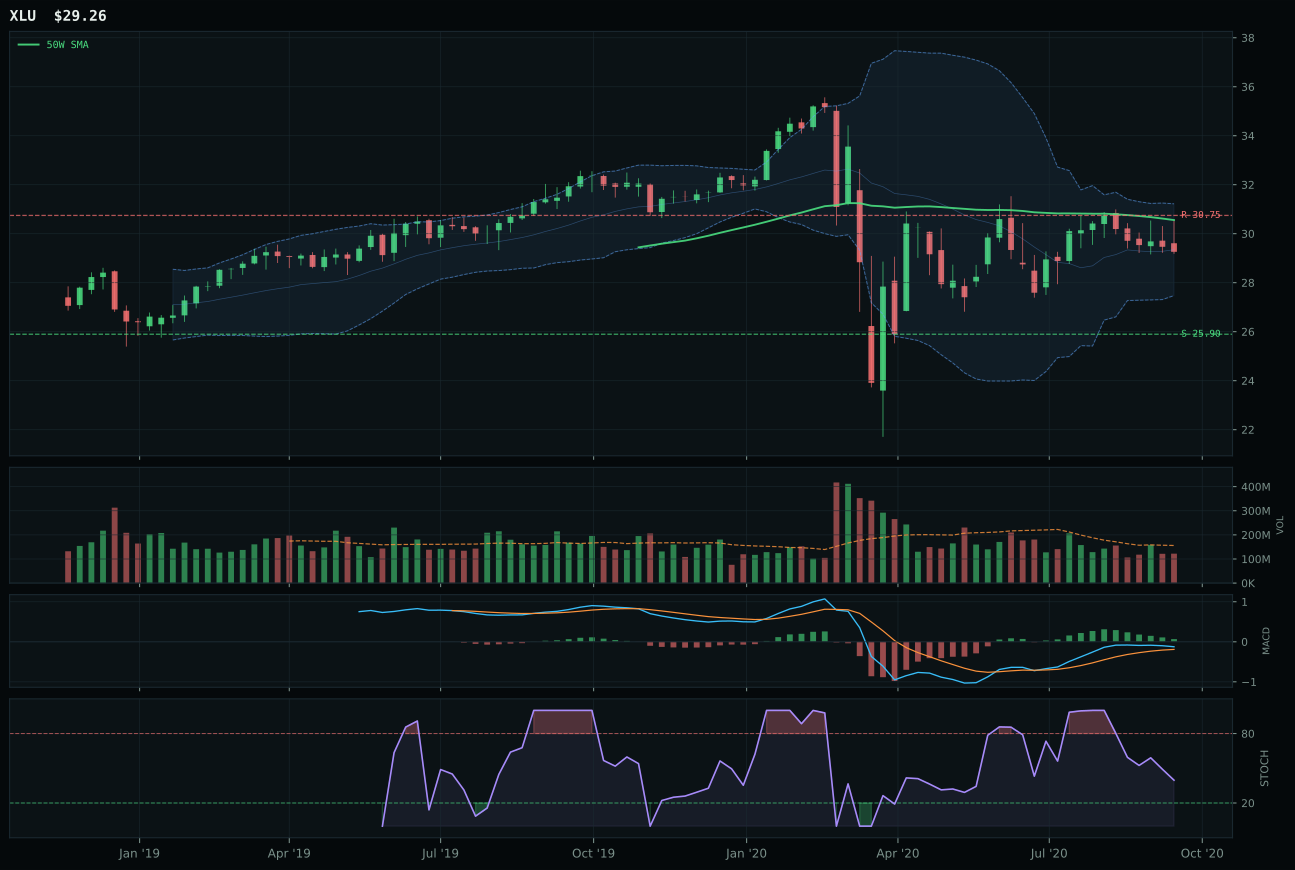
XLU has a neutral structure profile with -5.3% 13-week relative strength versus SPY.
A failed hold above support would weaken the setup.
Actionable but governed by invalidation levels.
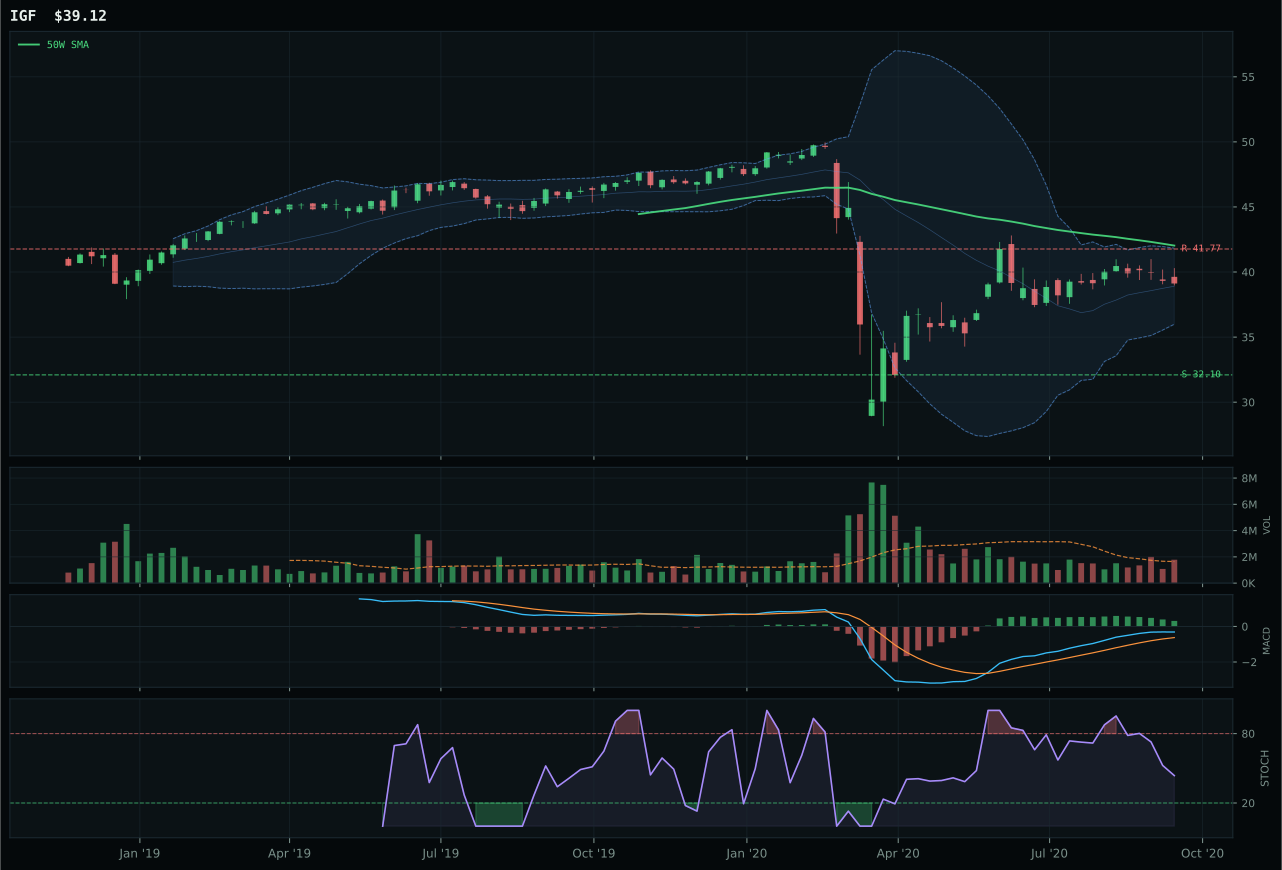
IGF has a neutral structure profile with -6.2% 13-week relative strength versus SPY.
Extension and support failure are the main tactical risks.
Tracked, but not top-2 eligible because: structurally broken.
PAVE wins Utilities & Infrastructure decisively on category-relative strength (11.1% vs XLU's 0.0%) and superior momentum confirmation (97.7/100) despite a pullback setup where price sits 8.2% above the 50-week but below the 200-week. The structure is neutral at 73.1/100 with decent compression, stochastic RSI is falling/neutral at 0.80 (not overbought), and MACD is bullish but flattening. Volume is neutral at 0.99x, and persistence is excellent at 86.8/100, meaning accumulation is real across the move. PAVE's 12.9% 13-week return and 5.8% SPY-relative strength paint a picture of domestic infrastructure beta capturing capex optimism, not rates-sensitive utility defense. XLU's 12.7-point gap to second place is driven by negative category-relative strength, weaker structure (71.2 vs 73.1), and trend evidence of only 53.0/100 against PAVE's 84.7/100.
Utilities & Infrastructure earns 5% as a tier-3 category, positioned as cyclical capex exposure rather than defensive rate-sensitive holding. The category score of 41.5 reflects 79.3/100 technical evidence for PAVE (strong trend at 84.7, excellent momentum at 97.7, solid volume-price confirmation at 78.2) but only 53.0/100 macro fit, where commodity breadth positive and risk appetite support compete against credit stress headwinds. PAVE's risk-reward is tight at 45.4/100 (resistance at 17.30 nearly at price, 47.1% downside to support), and timing at 70.0/100 signals an intermediate setup rather than fresh entry. The allocation holds because PAVE demonstrates genuine peer leadership inside infrastructure (11.1% category-relative strength) and portfolio construction benefits from having one cyclical real-asset sleeve separate from the pure metals rotation. However, the tier-3 sizing acknowledges that macro fit is fragile; this category would need to see either sustained capex commentary improvement or a reset toward support to justify promotion to the 10% tier-2 bracket.
Defense & Aerospace — XAR
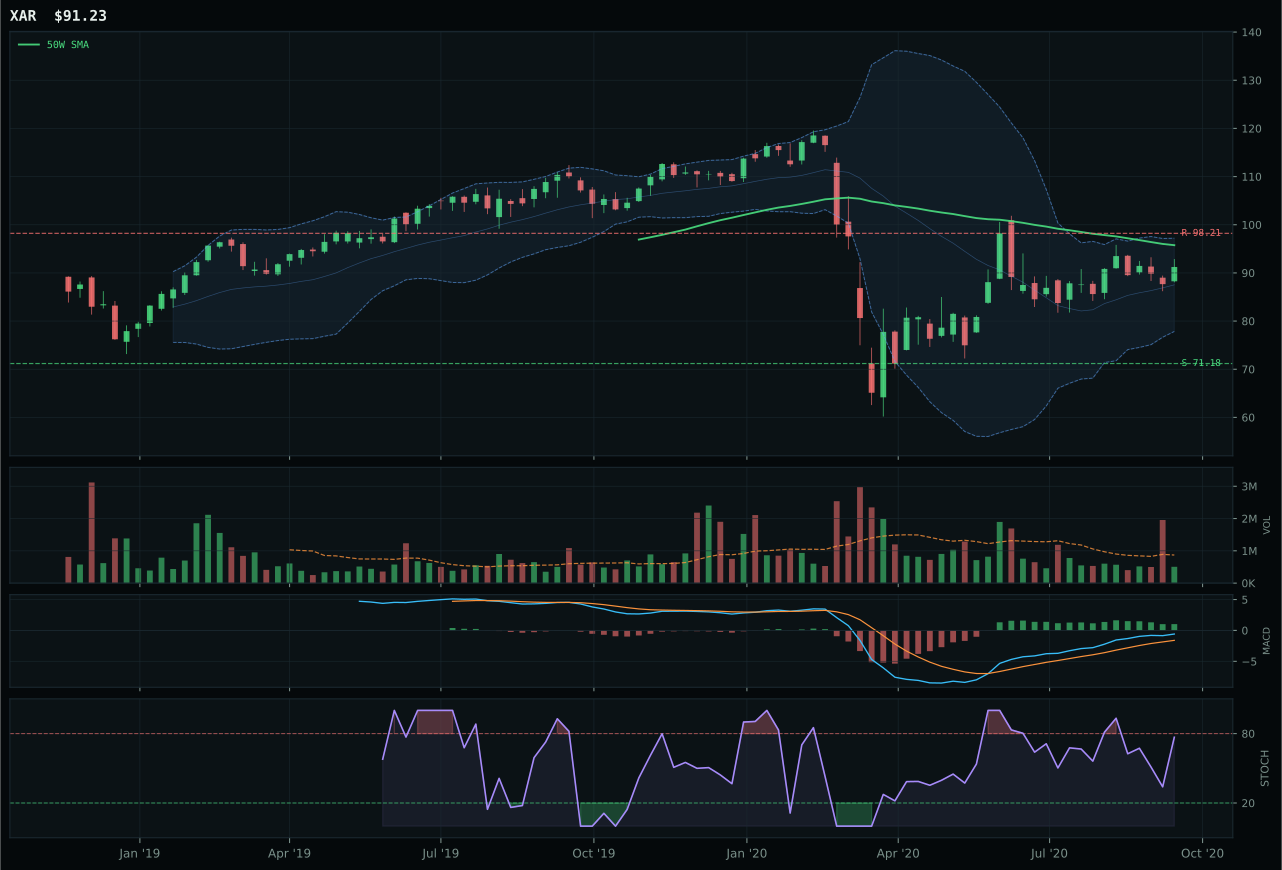
XAR has a neutral structure profile with -2.9% 13-week relative strength versus SPY.
A failed hold above support would weaken the setup.
Actionable but governed by invalidation levels.
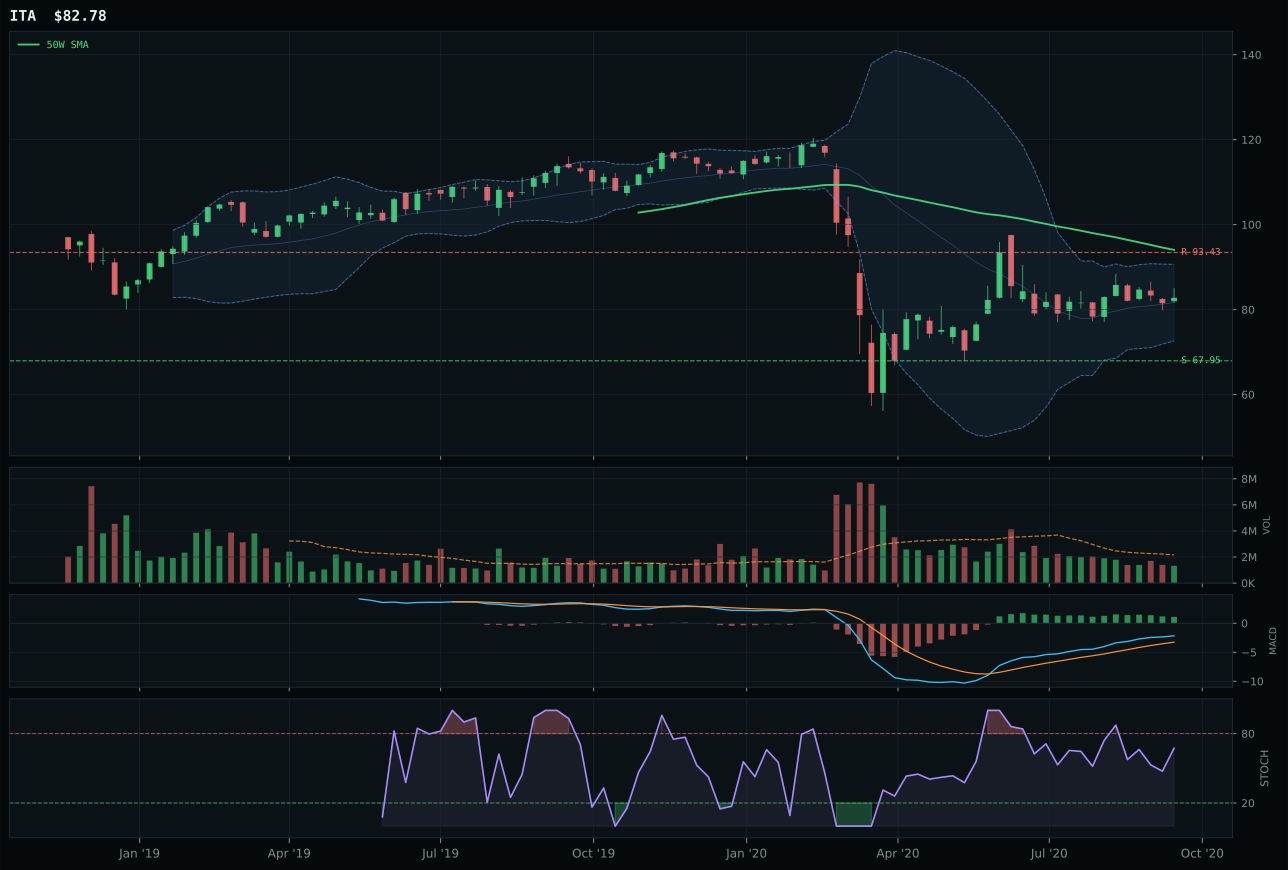
ITA has a neutral structure profile with -8.9% 13-week relative strength versus SPY.
A failed hold above support would weaken the setup.
Actionable but governed by invalidation levels.
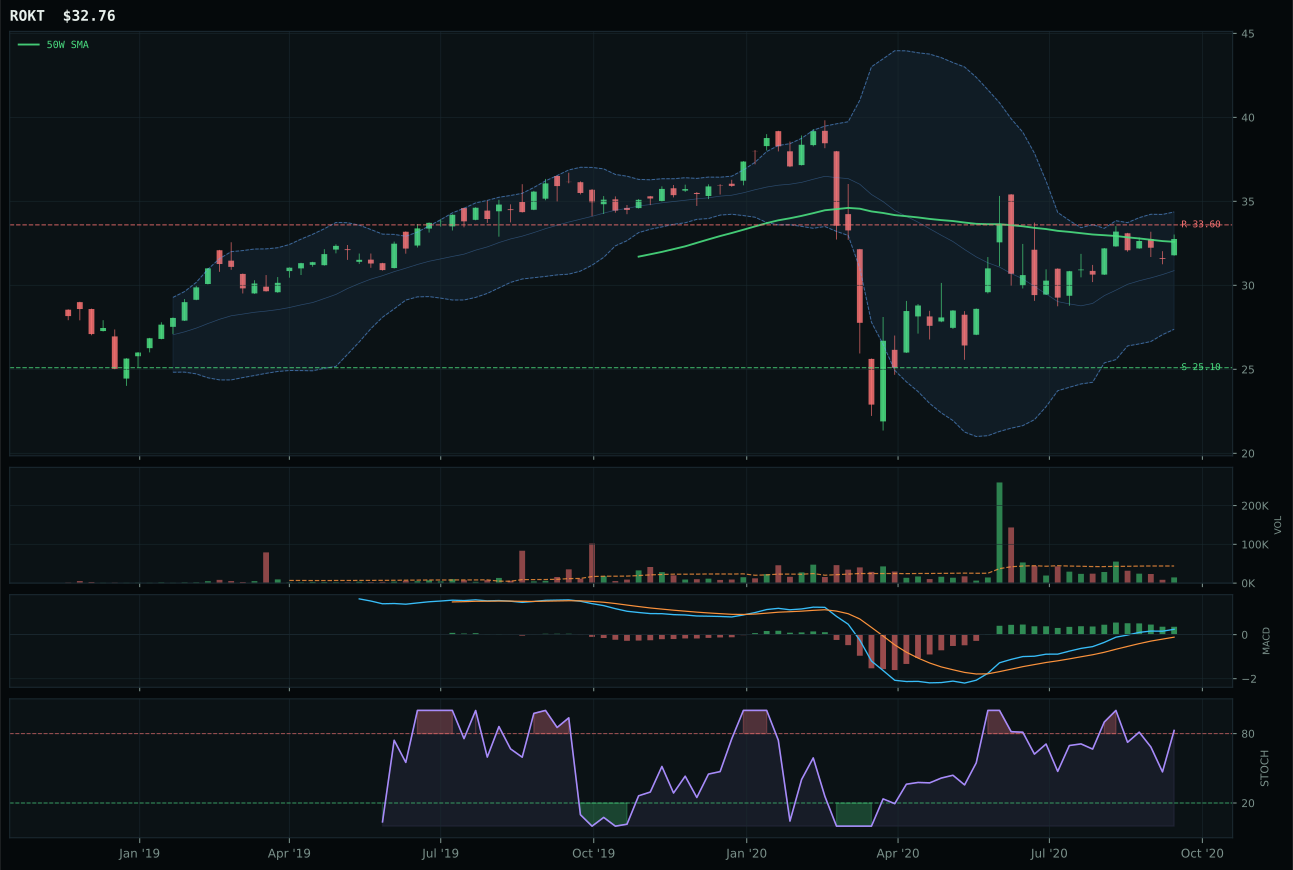
ROKT has a compression near 50W profile with -0.1% 13-week relative strength versus SPY.
A failed hold above support would weaken the setup.
Tracked, but not top-2 eligible because: .
XAR wins Defense & Aerospace on timing excellence, posting a 100.0/100 score on a pullback setup—price is 4.7% below the 50-week MA but still above the 200-week, which means support is the trade, not chase. The stochastic RSI sits rising in the mid-zone at 0.77, MACD is bullish but flattening, and Fib location at 0.500 signals a genuine decision point rather than exhaustion. XAR's 4.3% 13-week return and -2.9% SPY-relative reading are modest, but the structure is neutral with decent compression (71.5/100), and risk-reward at 57.5/100 reflects 28.2% downside to support and -7.1% upside to resistance. ITA's 25.8-point gap to second place shows no close competition; its -1.8% 13-week return and -8.9% SPY-relative strength created a clear technical hierarchy favoring XAR.
Defense & Aerospace earns 5% as a tier-3 category, outside both top-2 sleeves. The category score of 39.5 reflects a structural conflict: XAR's timing advantage (100.0/100) comes from being deeply off the moving average, yet trend strength lags at only 56.7/100 because price sits below the 50-week and RS versus SPY is negative. The macro fit of 50.0/100 provides no sector-specific sponsorship—credit stress offered a mild +2 boost, but no descriptor profile strongly supports defense in this regime. Volume is thin at 0.58x, and momentum confirmation is muted at 54.4/100. The allocation persists because relative to its peers, XAR's pullback timing is cleaner than other tier-3 choices, yet this category would need to demonstrate SPY-relative strength recovery and move back above its 50-week MA to earn promotion into the tier-2 bracket.
Agriculture & Livestock — MOO
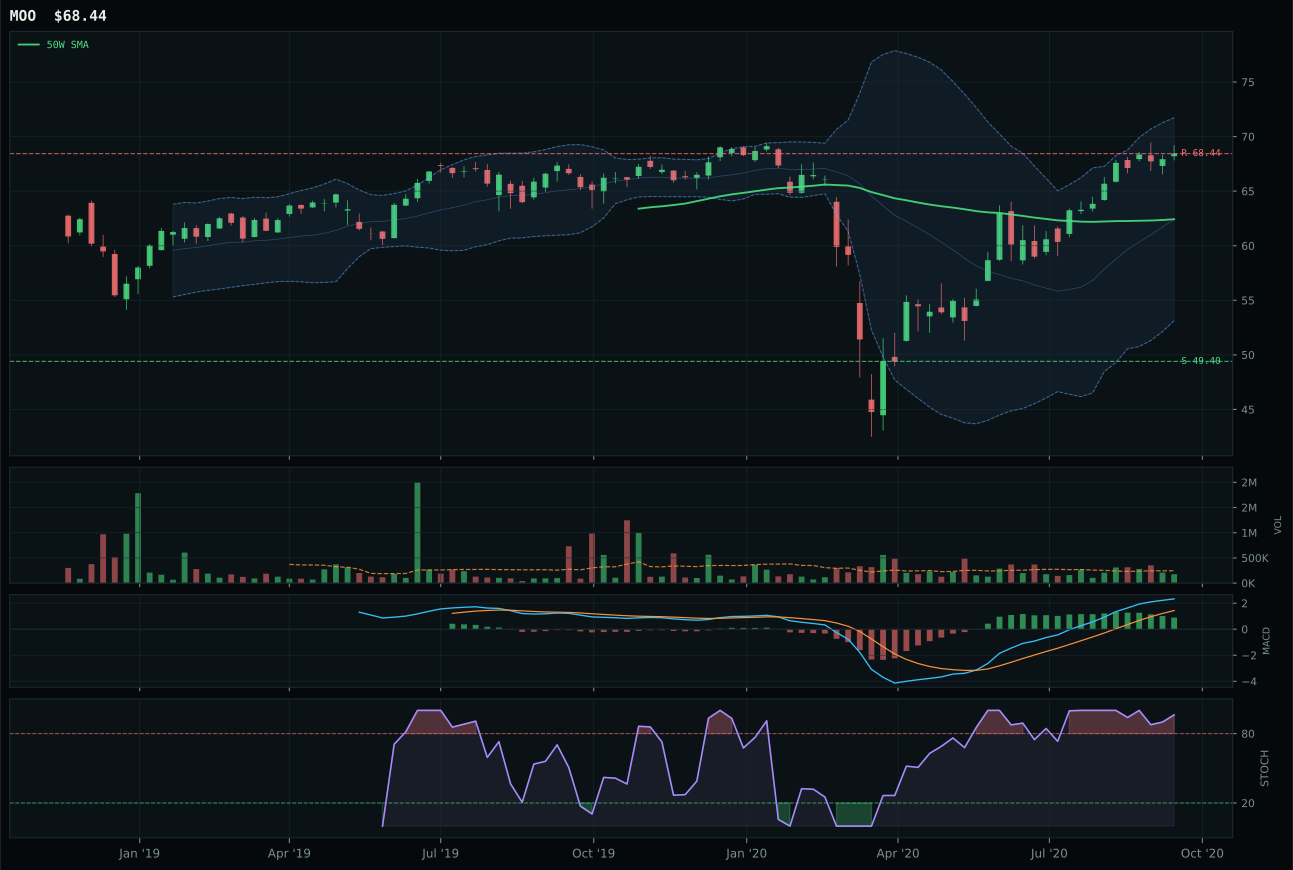
MOO has a neutral structure profile with 6.0% 13-week relative strength versus SPY.
A failed hold above support would weaken the setup.
Actionable but governed by invalidation levels.
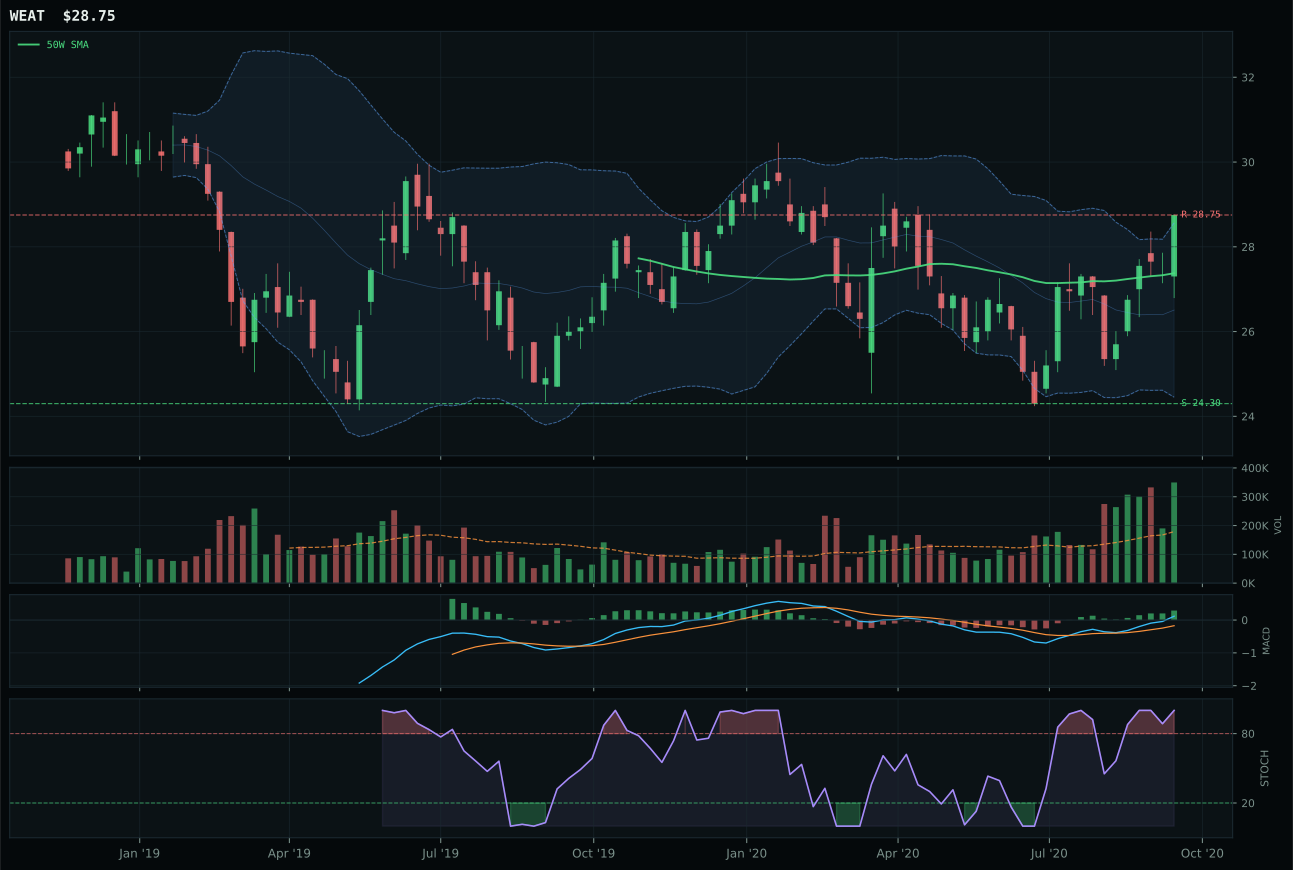
WEAT has a neutral structure profile with 7.6% 13-week relative strength versus SPY.
A failed hold above support would weaken the setup.
Tracked, but not top-2 eligible because: .
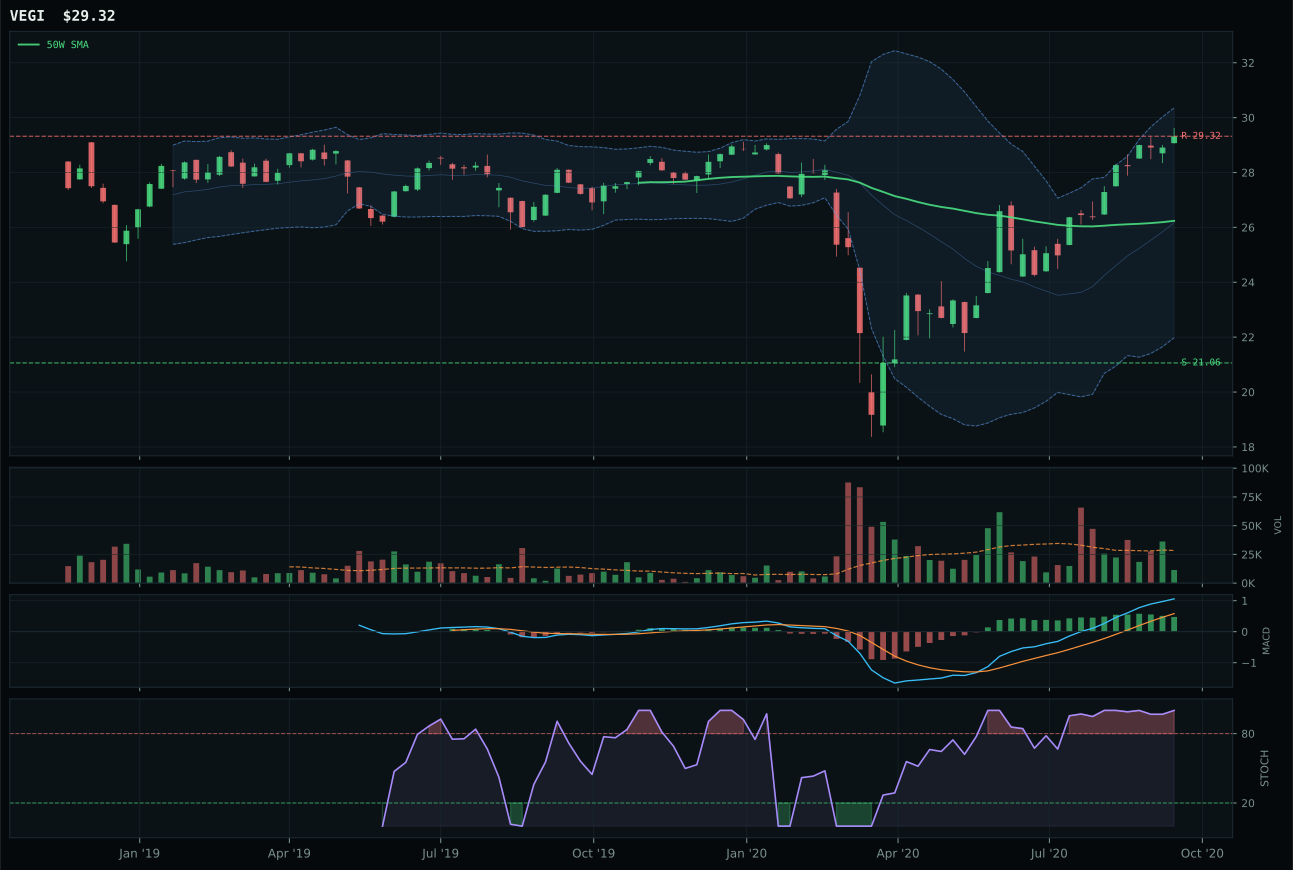
VEGI has a neutral structure profile with 10.1% 13-week relative strength versus SPY.
A failed hold above support would weaken the setup.
Tracked, but not top-2 eligible because: .
MOO wins on broader structure cleanliness (78.3/100 vs WEAT's neutral score) and superior momentum confirmation (67.0/100) despite WEAT posting a stronger 13-week return of 14.8% versus MOO's 13.1%. The technical divergence is revealing: MOO's MACD is bullish but flattening with stochastic RSI overbought at 0.96 and rolling over, while WEAT's MACD is actively improving—yet MOO's 6.0% SPY-relative strength and neutral volume participation at 0.71x beat WEAT's accumulation/confirmation volume and weaker category-relative strength of -1.7%. Price sits 9.6% above the 50-week with support at 49.40 and resistance nearly at hand, creating a setup where the stochastic rollover matters more than improving MACD when the move is already mature. The 13.1-point gap to WEAT confirms XAR's peer dominance inside agribusiness equity.
Agriculture & Livestock receives 5% as a tier-3 category, reflecting a macro-technical mismatch that limits its conviction. MOO's category score of 39.3 is buoyed by flawless 100.0/100 trend strength—price above both moving averages with 0.1% slope—yet timing collapses to 52.0/100 as the move is extended near a new 52-week high and stochastic RSI is overbought and rolling. Risk-reward at 40.7/100 shows no upside left and 38.5% downside exposure from here. Macro fit sits at 50.0/100, neutral because real asset sponsorship (+5) is offset by disinflation pressure (-5). The allocation survives the round cut because commodity breadth positive remains active at +5 and the Goldilocks regime still allows real-asset positioning; however, the thin volume (0.71x) and lack of fresh accumulation mean this category is momentum-dependent and vulnerable to any risk-appetite pullback.
Nuclear Energy — NLR
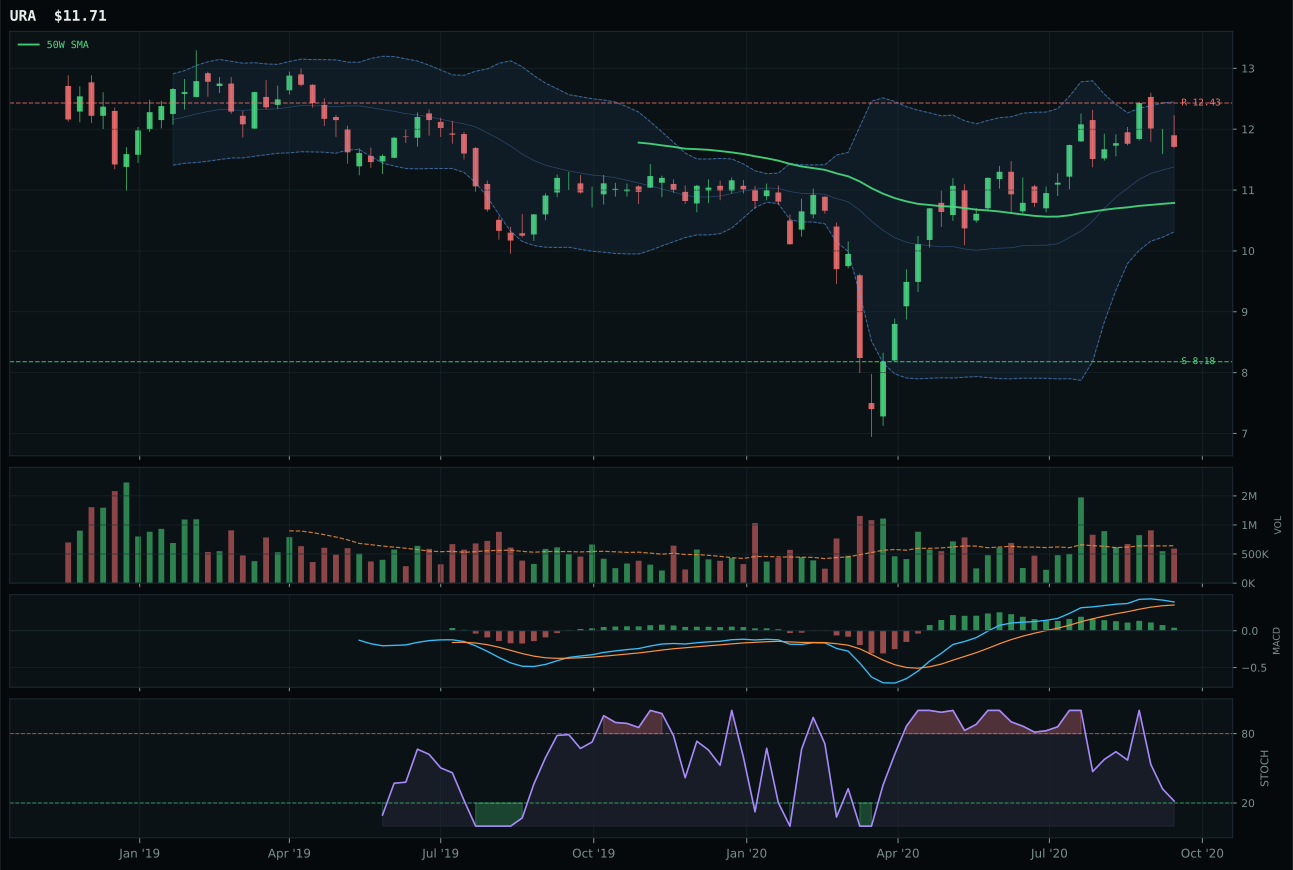
URA has a neutral structure profile with 1.4% 13-week relative strength versus SPY.
A failed hold above support would weaken the setup.
Tracked, but not top-2 eligible because: .

URNM has a neutral structure profile with 10.6% 13-week relative strength versus SPY.
A failed hold above support would weaken the setup.
Tracked, but not top-2 eligible because: .
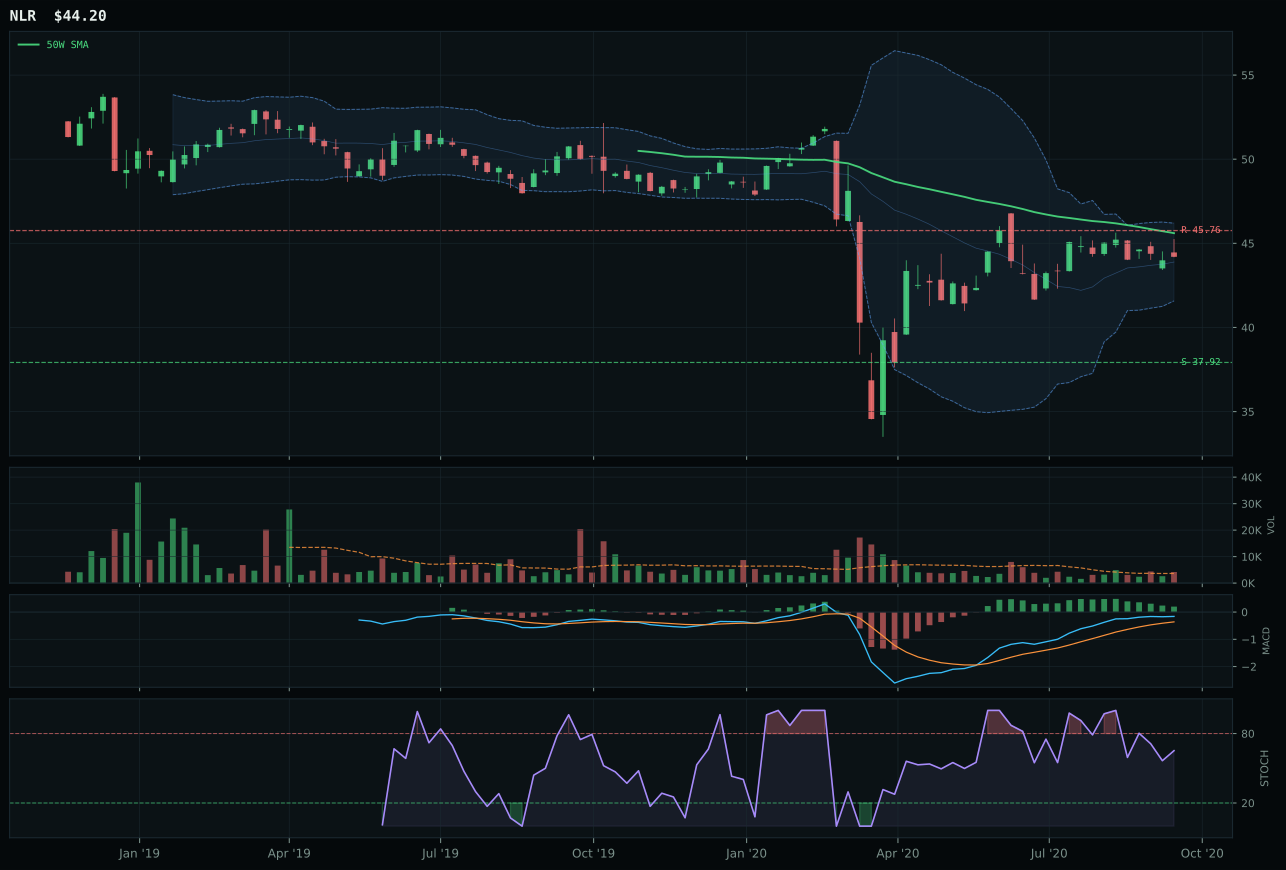
NLR has a neutral structure profile with -4.8% 13-week relative strength versus SPY.
Extension and support failure are the main tactical risks.
Tracked, but not top-2 eligible because: structurally broken.
NLR wins Nuclear by default among three weak contenders, posting 85.0/100 timing (price -3.1% from 50-week at Fib 0.382, a genuine decision point) despite horrific trend strength of 33.9/100 (below both moving averages, -0.3% slope, -4.8% SPY-relative). The stochastic RSI is falling/neutral at 0.65 and volume is above-average at 1.15x, which suggests institutional accumulation into weakness rather than retail momentum chasing. Momentum confirmation is only 46.5/100 (2.4% 13-week return, -6.2% category-relative), a clear sign the category is in repair mode, not strength mode. URA loses on timing (70.0 vs 85.0) and risk-reward (47.4 vs 56.7) despite higher SPY-relative strength at 1.4%, revealing that the scoring prefers tighter entry risk over higher absolute momentum when both are weak.
Nuclear Energy receives 0% allocation, having failed eligibility filters and ranked 10th among ten categories. The category score of 35.9 is propped up by 85.0/100 timing (a technically sound pullback setup) but crushed by 33.9/100 trend (deeply underwater on the moving averages with negative relative strength) and 46.5/100 momentum confirmation (barely positive returns with no peer sponsorship). NLR's 42.0/100 technical evidence cannot overcome the structural damage: the macro fit is 48.0/100, neutral at best, because risk appetite positive is slightly penalizing the sector and no descriptor specifically supports nuclear in Goldilocks. The above-average volume at 1.15x is the only technical positive, suggesting that if accumulation is real, it's extremely early-stage. Nuclear earns zero because it's being repriced lower across both technical and macro dimensions; the timing score of 85.0 is a trap—price is at a cleaner entry but the trend is broken and institutional sponsorship is absent. Re-entry requires evidence that trend is genuinely recovering, not just that the pullback is technically orderly.
Traditional Energy — XLE
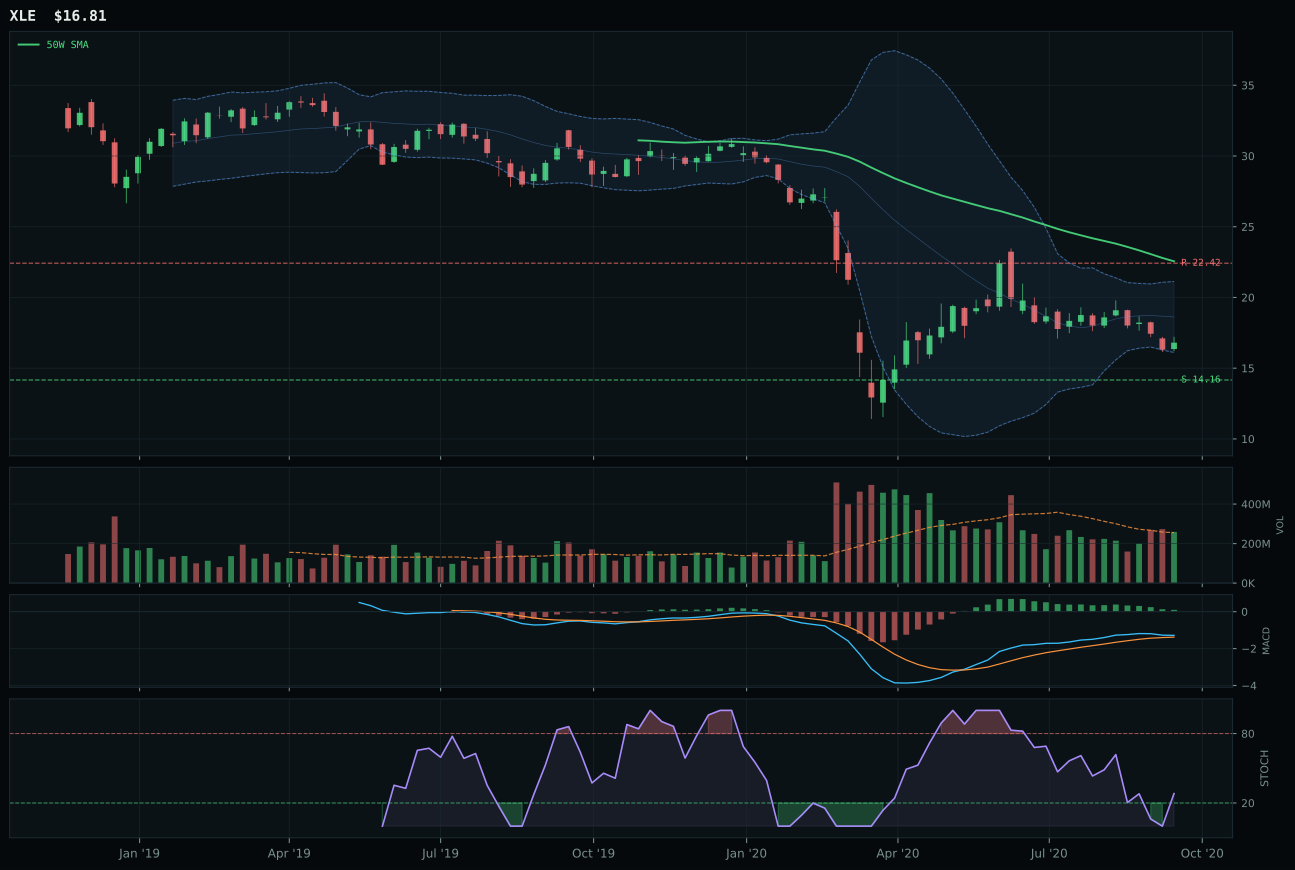
XLE has a neutral structure profile with -22.2% 13-week relative strength versus SPY.
Extension and support failure are the main tactical risks.
Tracked, but not top-2 eligible because: structurally broken.
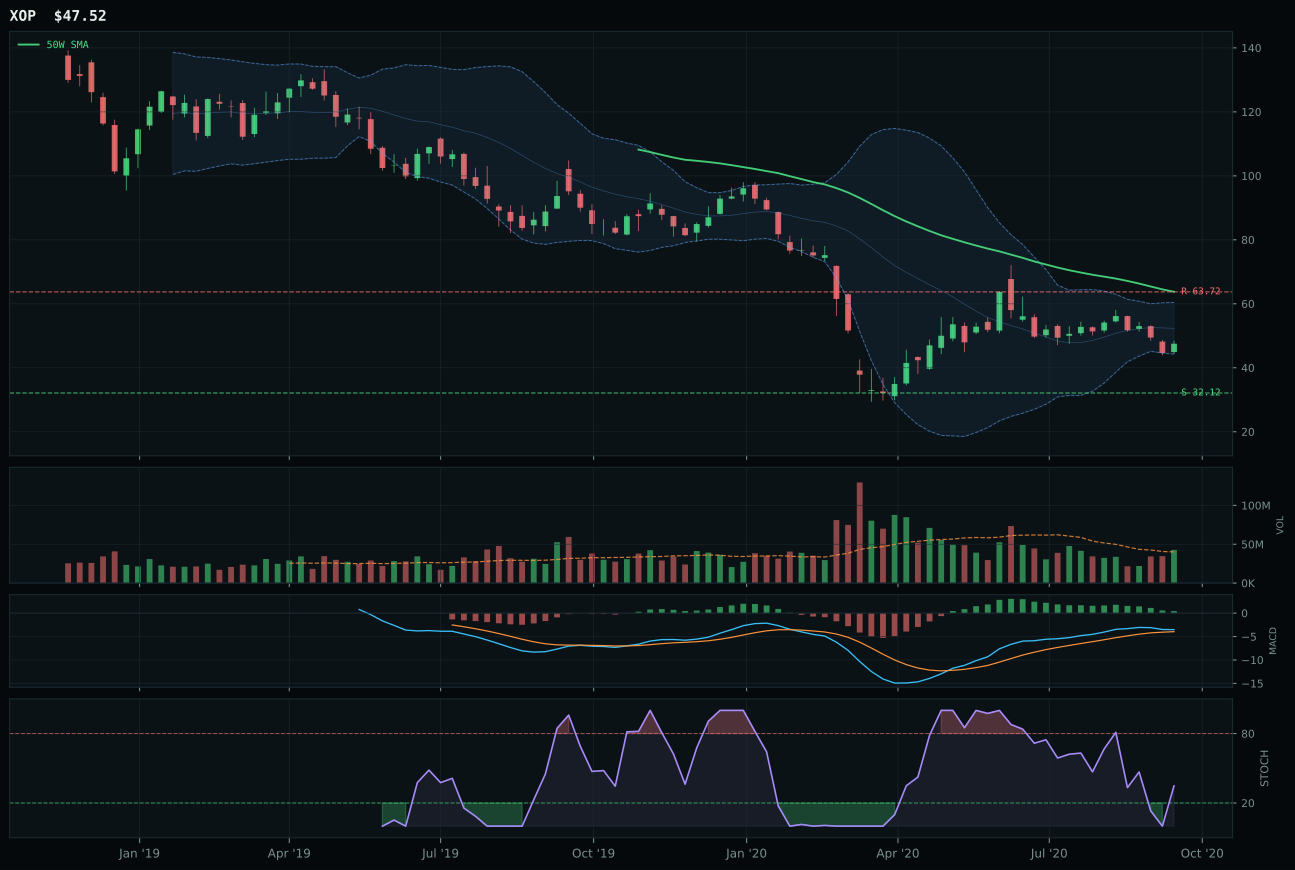
XOP has a neutral structure profile with -22.4% 13-week relative strength versus SPY.
Extension and support failure are the main tactical risks.
Tracked, but not top-2 eligible because: structurally broken.
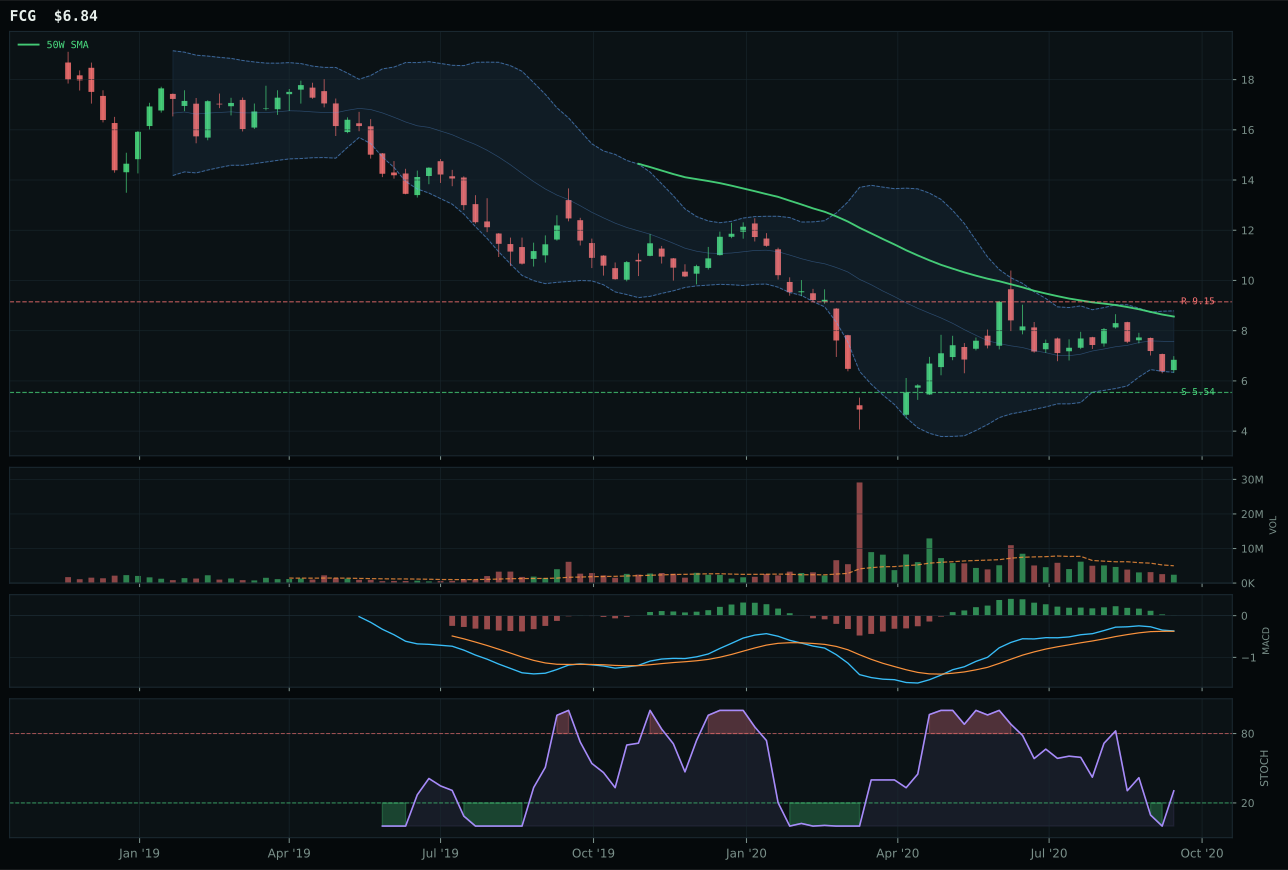
FCG has a neutral structure profile with -23.4% 13-week relative strength versus SPY.
Extension and support failure are the main tactical risks.
Tracked, but not top-2 eligible because: structurally broken.
XLE wins Energy, though 'wins' is relative in a category that earned 0% allocation and failed eligibility filters. XLE posts 26.0/100 trend—price is 25.5% below the 50-week and below the 200-week, with -1.0% slope and -22.2% SPY-relative weakness—creating a value-zone setup at Fib 0.786 where the risk-reward is actually attractive at 69.2/100 (18.6% downside, -25.0% upside). The stochastic RSI is rising mid-zone at 0.28 and MACD is bullish but flattening, so there is technical repair underway. However, momentum confirmation scores 0.0/100 because the 13-week return is -15.1%, the 4-week return is -6.7%, and volume-price confirmation at 28.5/100 shows thin institutional interest. XOP loses to XLE by a 6-point margin on timing (50.0 vs 58.0) and risk-reward (39.5 vs 69.2), but neither setup merits capital.
Traditional Energy receives 0% allocation, failing the portfolio's eligibility screens entirely. The category score is 0.0, not 10-20 points of weak positioning, which signals hard-filter rejection rather than low ranking. The reasoning is transparent: 36.5/100 technical evidence combined with 47.0/100 macro fit cannot sustain a position when momentum confirmation is zero (thirteen weeks of negative returns and no institutional sponsorship) and volume-price confirmation is broken at 28.5/100. The Goldilocks macro regime provides zero tailwind—real asset sponsorship is active at +5, but disinflation pressure (-10) and credit stress (-7) both penalize energy. XLE sits deep in the value zone, price 25% below the 50-week, which would normally attract contrarian interest; however, the -22.2% SPY-relative weakness over thirteen weeks indicates the market is not absorbing this valuation dislocation. Energy earns zero allocation because its technical and macro profiles are misaligned in the current regime; a sustained period of risk-on flow and rising commodity prices would be required for re-entry.