
2020-09-11
Informational purposes only. The content in this report, including allocations, analysis, and commentary, is provided solely for informational and educational purposes. It does not constitute financial advice, investment advice, trading advice, or any other type of advice. Past performance does not guarantee future results. Always conduct your own research and consult a qualified financial professional before making investment decisions.
Some tracked tickers were excluded due to missing live weekly price data: SGOV: Historical cache SGOV has only 15 usable weekly bars
Weekly Allocation
| Ticker | Category | Weight | Role |
|---|---|---|---|
| FSOL | 50% | Overlay | |
| IGV | Technology | 10% | Top-2 (10%) |
| PICK | Industrial Metals | 10% | Top-2 (10%) |
| GLD | Precious Metals | 5% | Tier-2 (5%) |
| INDA | Emerging Markets | 5% | Tier-2 (5%) |
| BOTZ | AI | 5% | Tier-2 (5%) |
| XLU | Utilities & Infrastructure | 5% | Tier-2 (5%) |
| MOO | Agriculture & Livestock | 5% | Tier-2 (5%) |
| URNM | Nuclear Energy | 5% | Tier-2 (5%) |
Trade Instructions — Monday Open
Sell the tranche from 2020-08-14 (completing its 4-week hold). Buy the new tranche. Instructions show net portfolio changes — same-asset positions cancel, weight changes show the delta.
| Action | Ticker | Instruction |
|---|---|---|
| SELL | FBTC | Sell entire FBTC position (12.50% of portfolio) |
| SELL | REMX | Sell 67% of REMX position (reduce 3.75% → 1.25%) |
| SELL | BOTZ | Sell 33% of BOTZ position (reduce 3.75% → 2.50%) |
| SELL | XLK | Sell 20% of XLK position (reduce 6.25% → 5.00%) |
| SELL | XAR | Sell 50% of XAR position (reduce 2.50% → 1.25%) |
| SELL | SLV | Sell 17% of SLV position (reduce 7.50% → 6.25%) |
| SELL | FCG | Sell entire FCG position (1.25% of portfolio) |
| BUY | FSOL | Buy FSOL — 58.82% of freed cash (adds 12.50% to portfolio) |
| BUY | PICK | Buy PICK — 11.76% of freed cash (adds 2.50% to portfolio) |
| BUY | XLU | Buy XLU — 5.88% of freed cash (adds 1.25% to portfolio) |
| BUY | IGV | Buy IGV — 11.76% of freed cash (adds 2.50% to portfolio) |
| BUY | GLD | Buy GLD — 5.88% of freed cash (adds 1.25% to portfolio) |
| BUY | URNM | Buy URNM — 5.88% of freed cash (adds 1.25% to portfolio) |
Current Portfolio After Trade
Combined holdings across all 4 active tranches. Each tranche is 25% of the portfolio.
| Ticker | % of Portfolio | Weight Bar |
|---|---|---|
| FSOL | 50.00% | |
| INDA | 7.50% | |
| SLV | 6.25% | |
| PICK | 6.25% | |
| XLK | 5.00% | |
| MOO | 3.75% | |
| BOTZ | 2.50% | |
| SMH | 2.50% | |
| PAVE | 2.50% | |
| ITA | 2.50% | |
| XLU | 2.50% | |
| IGV | 2.50% | |
| REMX | 1.25% | |
| XAR | 1.25% | |
| URA | 1.25% | |
| GLD | 1.25% | |
| URNM | 1.25% |
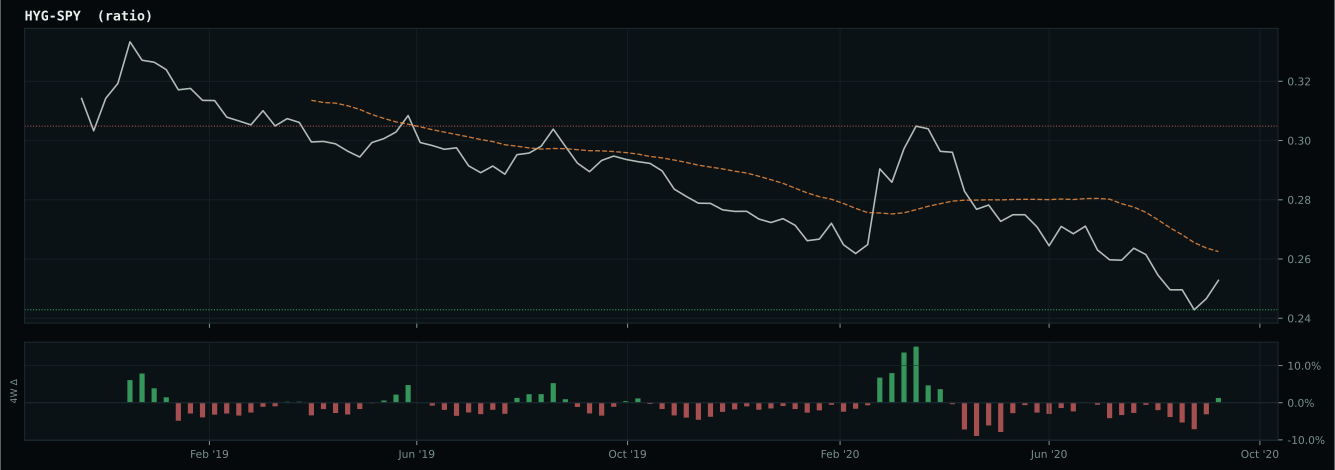
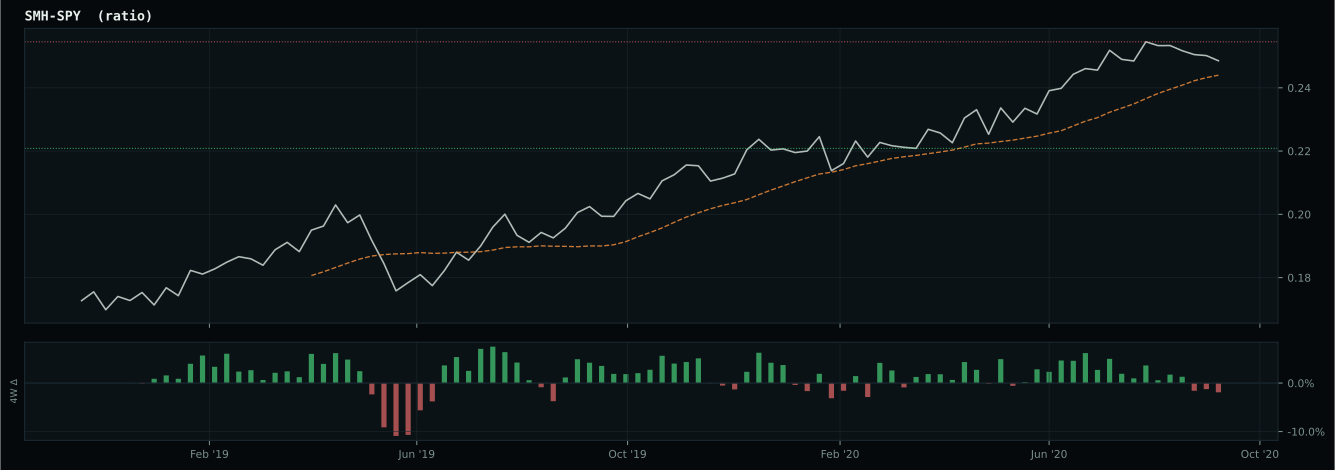
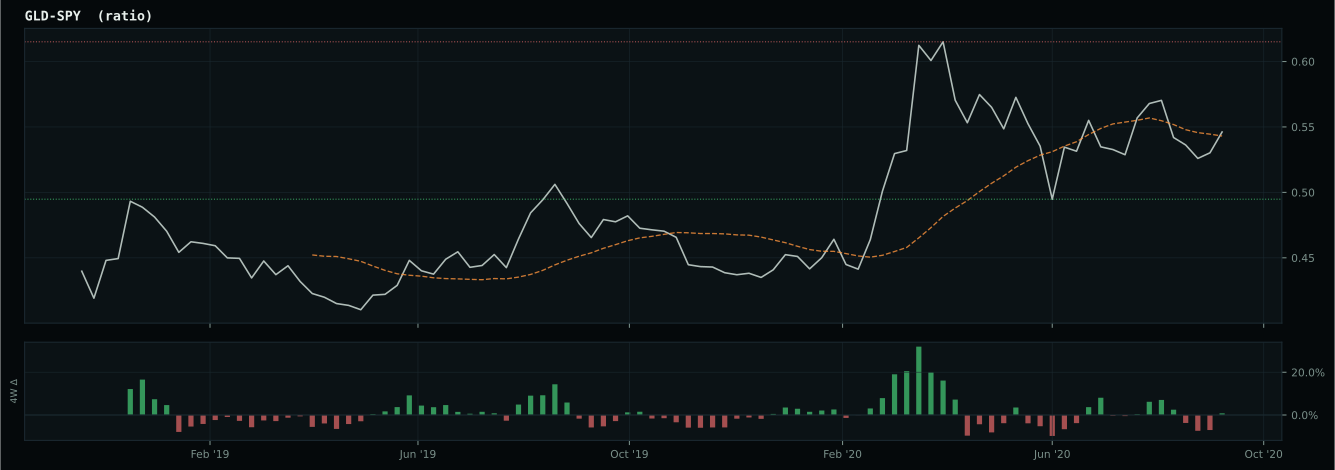
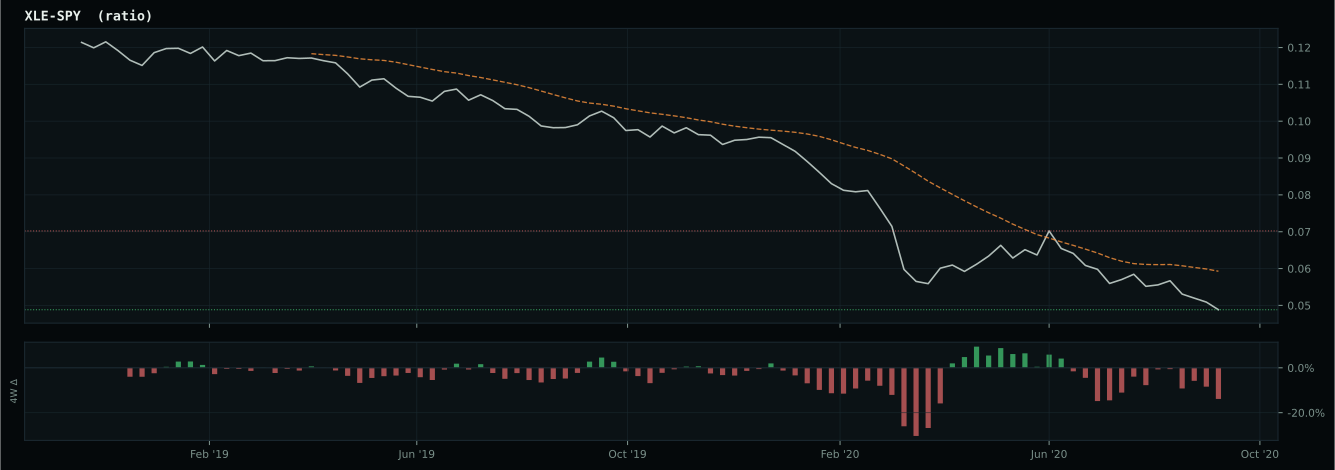
Macro Regime — Goldilocks
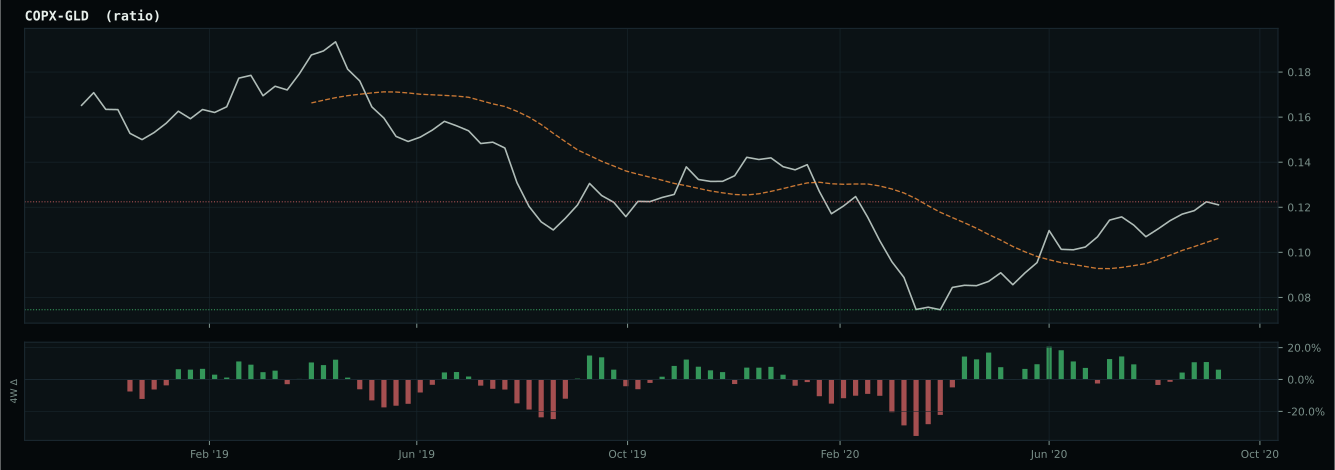
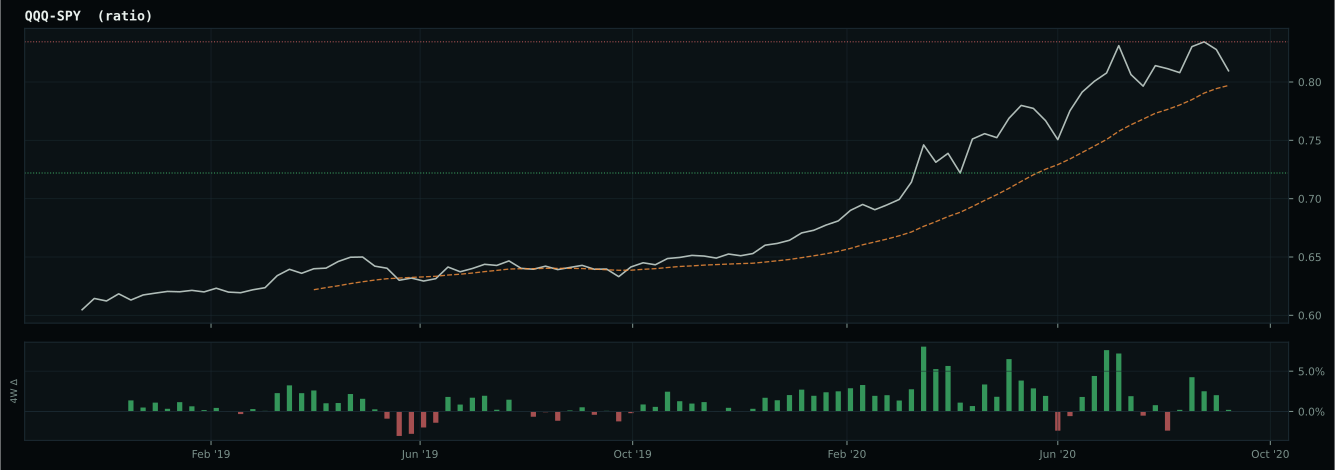
Macro Evidence Charts
Market-implied signals behind the macro regime scores. Each ratio compares two assets; the direction and slope of the ratio is what the macro engine reads.
Crypto Regime — AltSeason
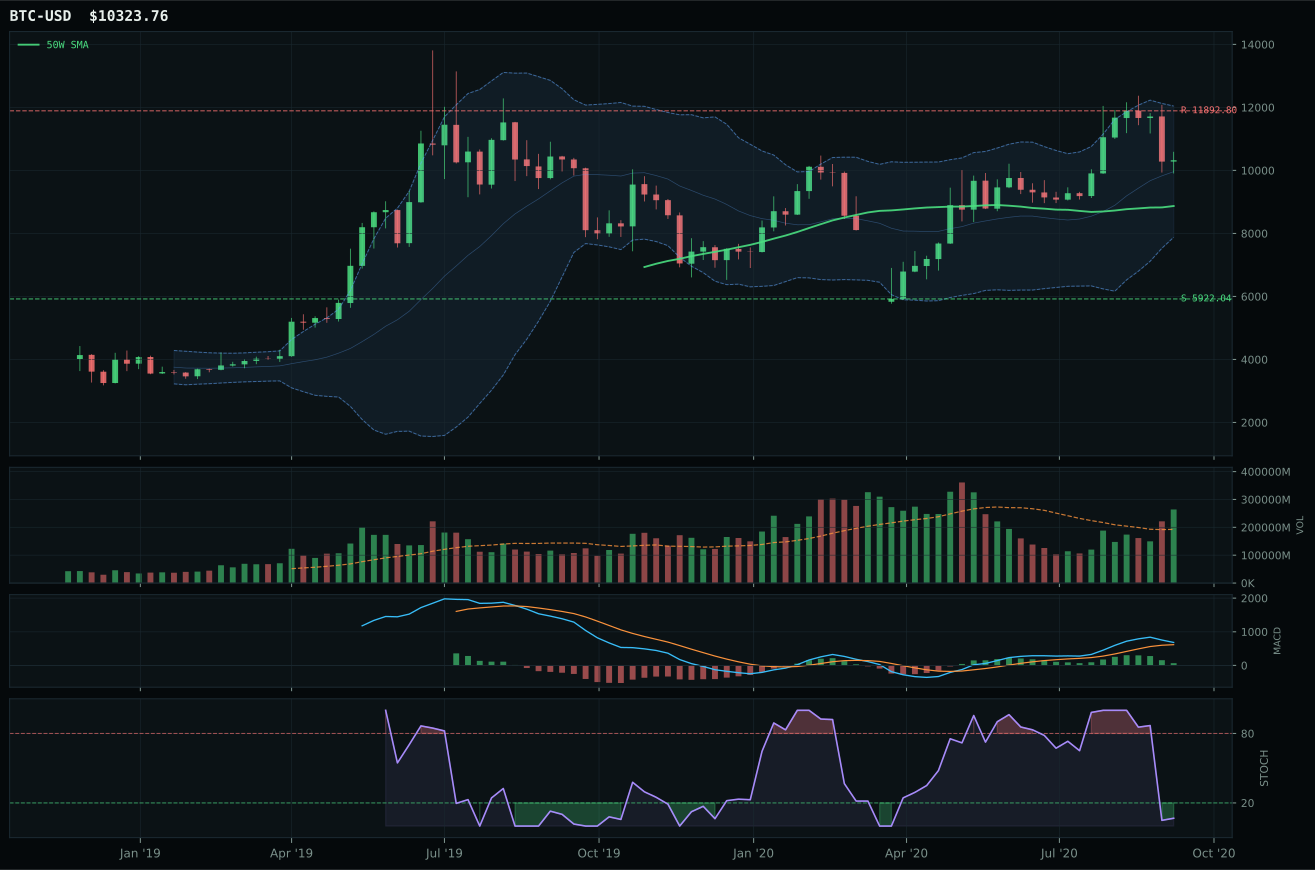
post-touch structure is too wide to count as a range; max/min close ratio is 2.21
TrendBTC confirmed: 2 consecutive closes above rising/flat 50W SMA
all available AltSeason conditions pass; missing optional confirmations skipped

Category Rankings
| Rank | Category | Winner | Score | Alloc | 4W Ret | Peers (4W) |
|---|---|---|---|---|---|---|
| 1 | Technology | IGV | 69.4 | 20% | +9.83% | XLK +6.2% · CIBR +7.5% |
| 2 | Industrial Metals | PICK | 68.9 | 20% | -1.92% | REMX +6.0% · COPX -3.9% |
| 3 | Precious Metals | GLD | 66.8 | 10% | -1.63% | SLV -7.1% · GDX -2.8% |
| 4 | Emerging Markets | INDA | 58.3 | 10% | +3.55% | IEMG +3.3% · ILF -0.8% |
| 5 | AI | BOTZ | 56.1 | 10% | +6.91% | SMH +11.4% · AIQ +7.9% |
| 6 | Utilities & Infrastructure | XLU | 39.4 | 10% | +7.26% | PAVE +7.5% · IGF +2.0% |
| 7 | Agriculture & Livestock | MOO | 36.2 | 10% | +2.40% | VEGI +3.9% · WEAT +6.8% |
| 8 | Nuclear Energy | URNM | 34.5 | 10% | -9.42% | URA -7.5% · NLR +4.2% |
| 9 | Defense & Aerospace | ITA | 26.6 | 0% | +0.41% | ROKT +6.4% · XAR +4.6% |
| 10 | Traditional Energy | XLE | — | 0% | -6.18% | XOP -0.6% · FCG +2.5% |
Technology — IGV
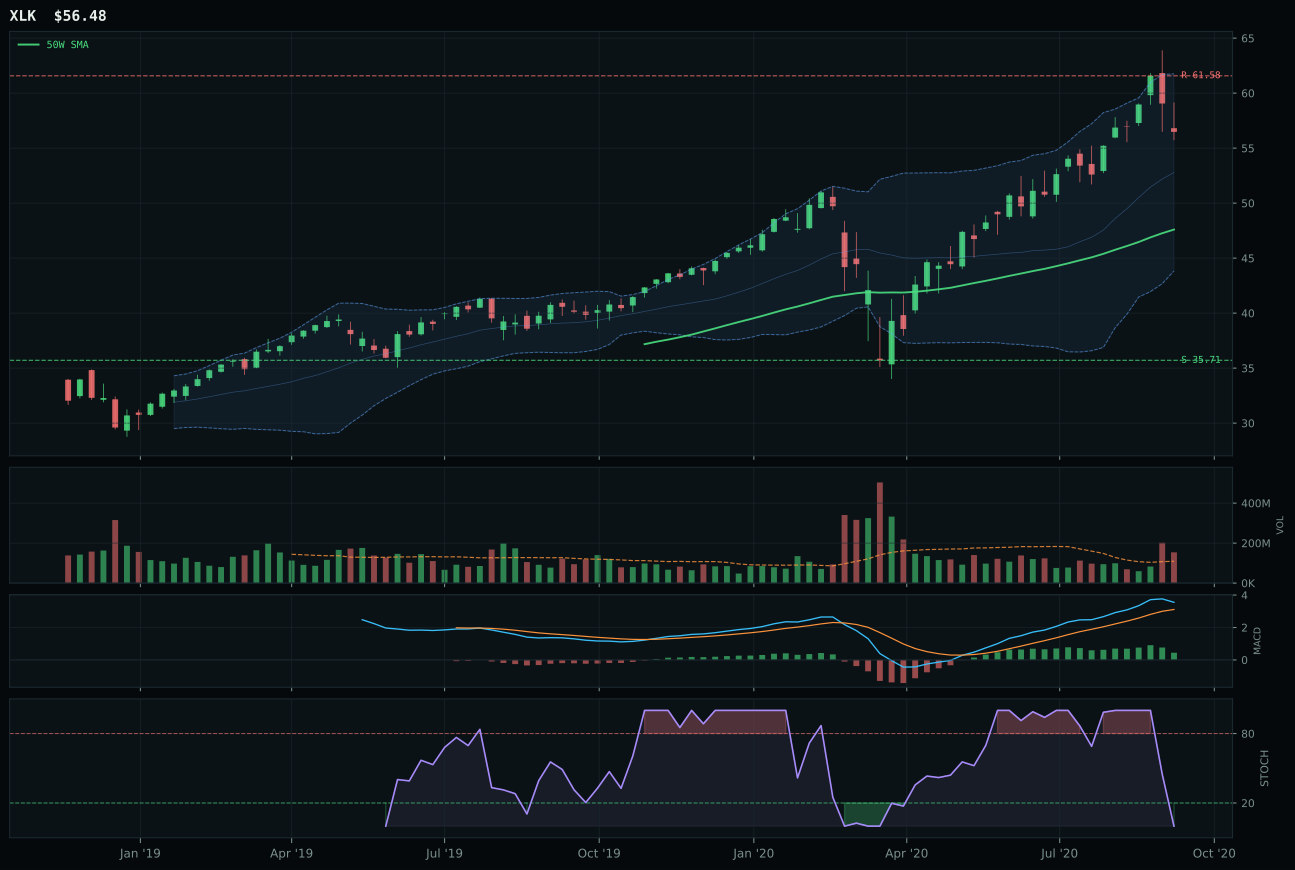
XLK has a vertical extension profile with 3.8% 13-week relative strength versus SPY.
A failed hold above support would weaken the setup.
Actionable but governed by invalidation levels.
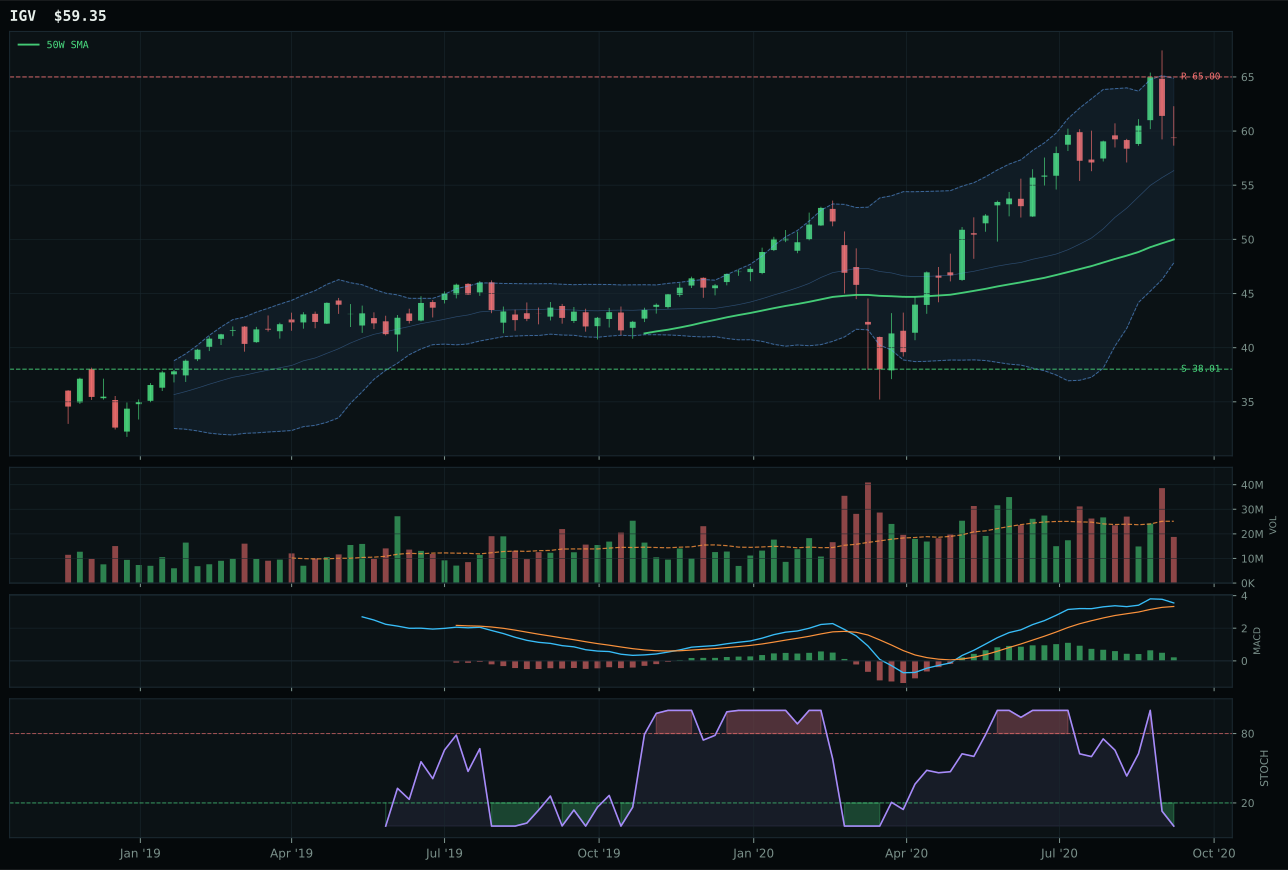
IGV has a vertical extension profile with 2.0% 13-week relative strength versus SPY.
A failed hold above support would weaken the setup.
Actionable but governed by invalidation levels.
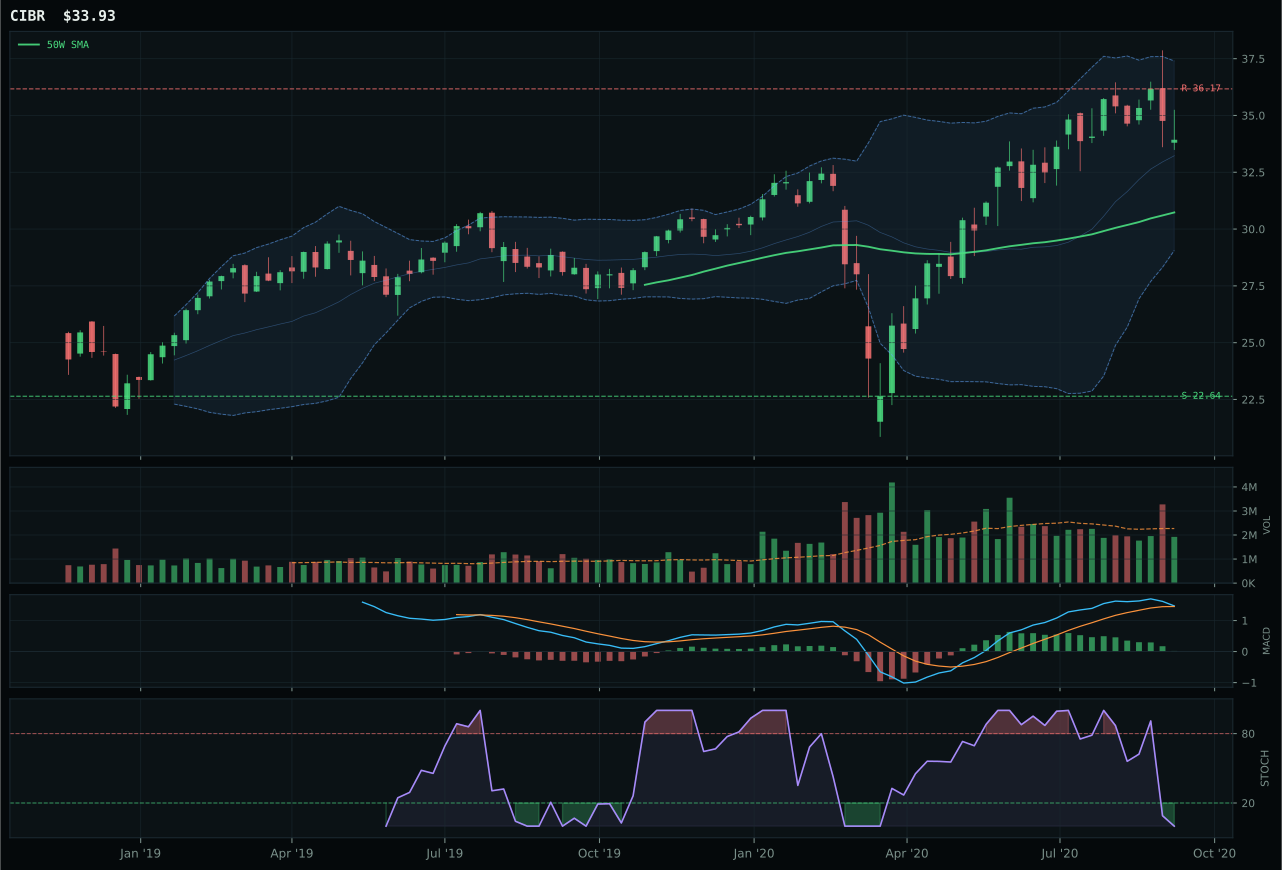
CIBR has a neutral structure profile with -3.1% 13-week relative strength versus SPY.
A failed hold above support would weaken the setup.
Actionable but governed by invalidation levels.
IGV wins the category because its relative strength versus SPY at 2.0% paired with a clean trend setup above both the 50W and 200W created enough conviction to overcome the 18.7% extension penalty that typically signals late-stage entry risk. XLK's superior momentum (13.6% vs. 11.8% over 13W) and stronger SPY-relative performance at 3.8% could not compensate for a fractionally weaker risk/reward profile at 47.6 versus IGV's 47.8, a margin that reflects only the thinning participation volume in IGV's move. The decisive technical edge came from volume: IGV traded at 0.75x its 20W average while XLK drew above-average participation, meaning IGV's buyers were more selective and the move less crowded even though both charts displayed identical MACD weakness and oversold stochastics. Enterprise software leadership won over broad profitable tech leadership because the narrower base required higher quality confirmation.
Technology earned its 10% top-2 overweight slot because the category score of 69.4 ranked among the two highest eligible final scores this week in a Goldilocks macro state where both risk appetite and disinflation pressure remain active. The category's macro fit of 72.0 reflects strong sponsorship from positive risk appetite and AI growth narratives that offset the structural headwind of credit stress. What pushed Technology into the elite tier despite compressed entry points is the breadth of the setup: all three candidate ETFs (XLK, CIBR, IGV) sit with price above the 200W and MACD bullish, anchoring the category's 3/2/1 weighted technical evidence at 62% of the final calculation. The risk here is real—every new buyer into this setup is buying extension into a known momentum leader with limited upside to resistance—but Goldilocks regimes reward pushing into strength when macro tailwinds are this clean and the pullback from extension remains confined above the 50W.
Industrial Metals — PICK
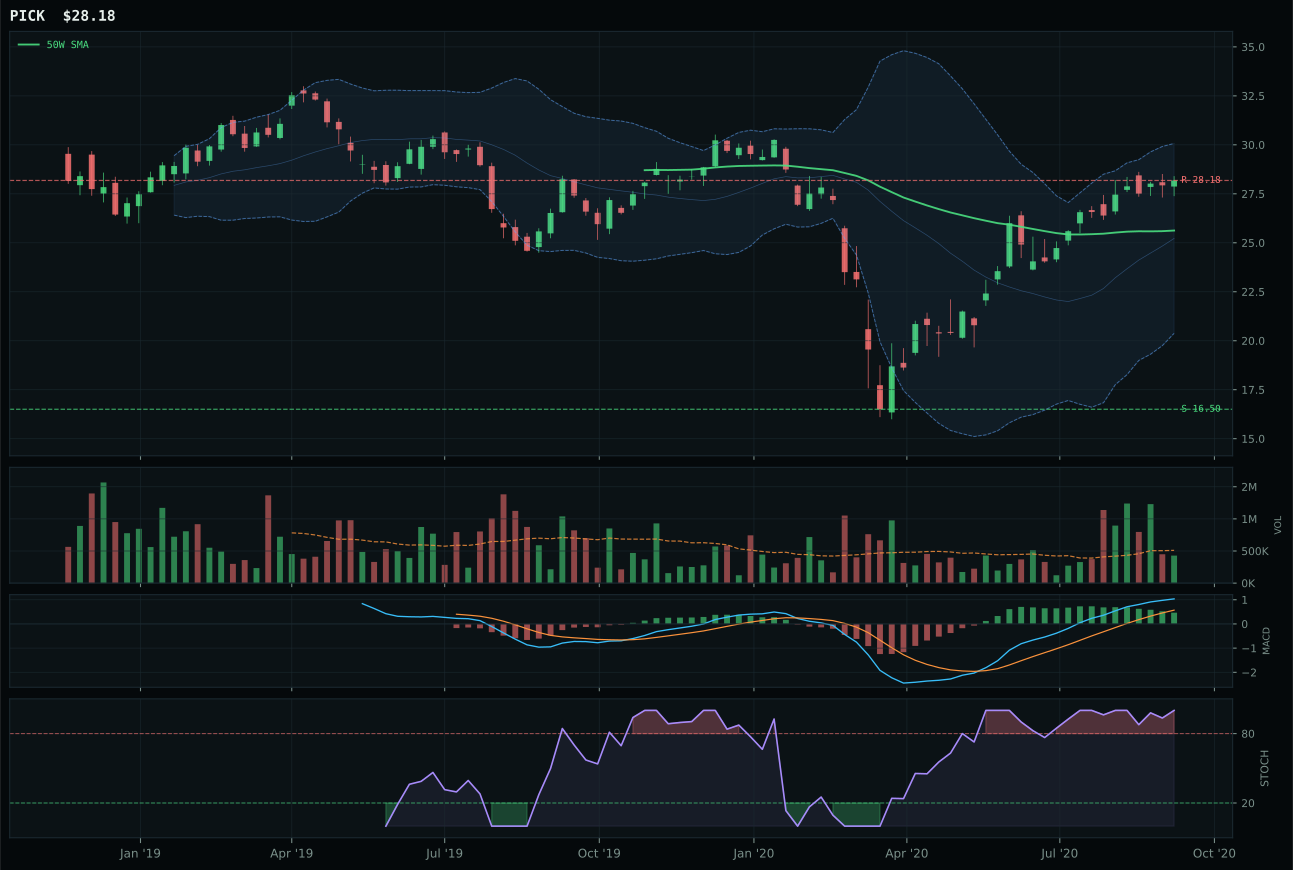
PICK has a neutral structure profile with 3.3% 13-week relative strength versus SPY.
A failed hold above support would weaken the setup.
Actionable but governed by invalidation levels.
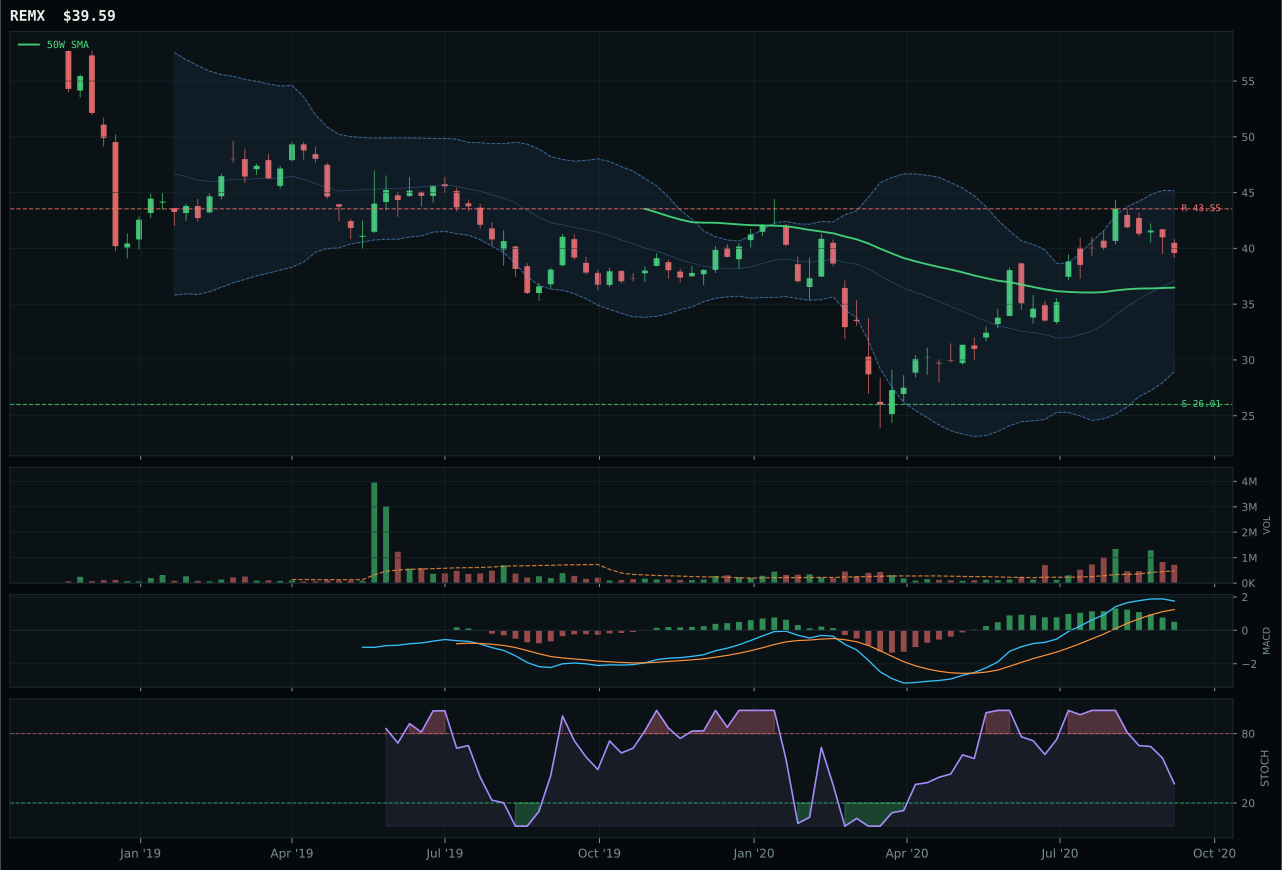
REMX has a neutral structure profile with 3.0% 13-week relative strength versus SPY.
A failed hold above support would weaken the setup.
Actionable but governed by invalidation levels.
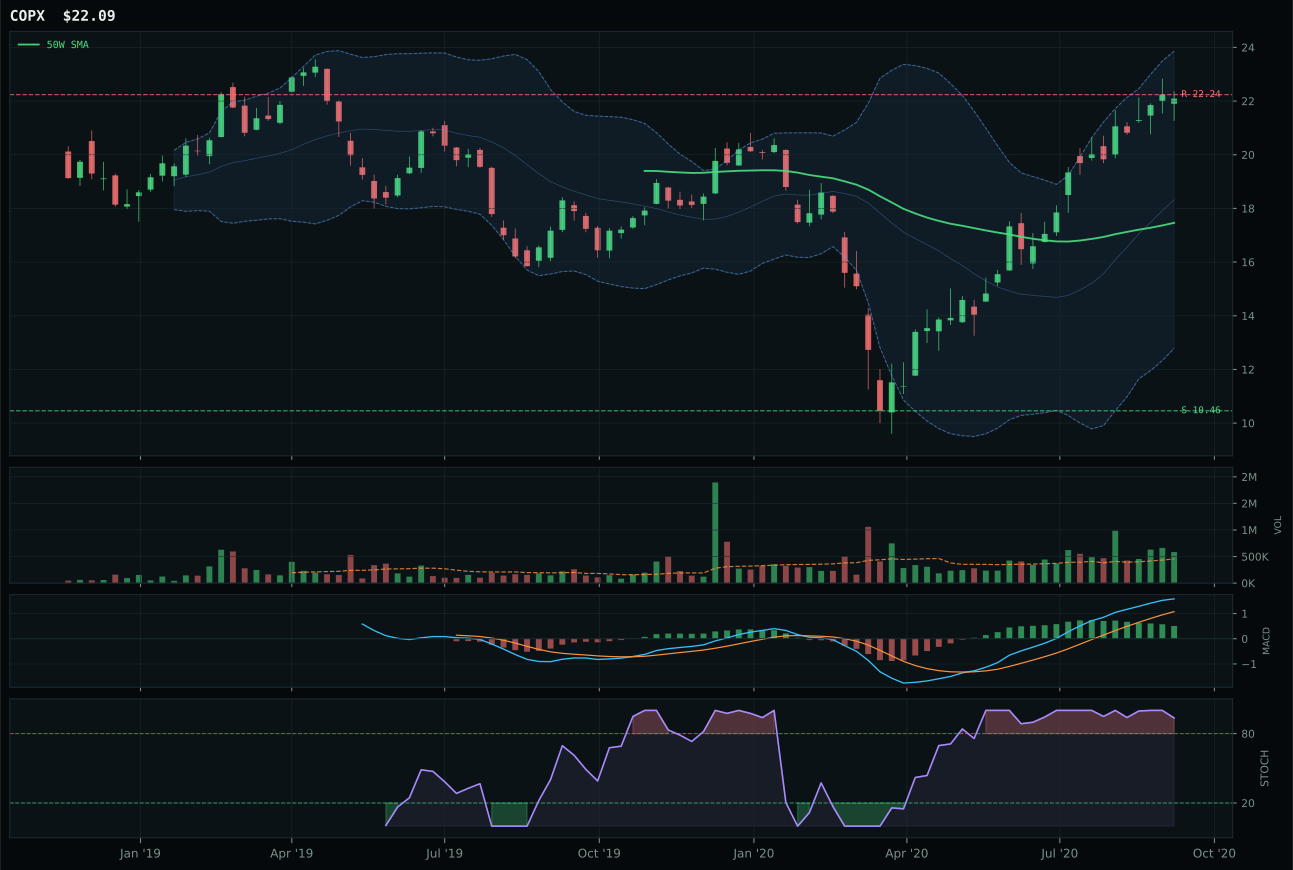
COPX has a vertical extension profile with 24.2% 13-week relative strength versus SPY.
A failed hold above support would weaken the setup.
Tracked, but not top-2 eligible because: .
PICK wins the Industrial Metals category and earns top-2 status because its 78.8 structure score and 70.0 timing score combined to deliver the most balanced setup across the category despite price sitting fractionally below the 200W. PICK's neutral structure at 10.0% distance from the 50W represents a Goldilocks entry point: far enough from the 50W to avoid reversal noise, but close enough to avoid the extension penalty that crushed COPX (which sits 24.2% extended despite 34.0% 13W returns). REMX's 3.0% SPY-relative strength and neutral structure could not overcome its -0.3% category-relative weakness versus PICK's 0.0%, a deficit that reflects REMX's above-average volume suggesting distribution rather than fresh accumulation. PICK's stochastic RSI at 1.00 (overbought momentum) combined with its neutral timing creates the ideal setup: momentum has already overextended within the context of the 50W, so the next phase of accumulation will likely consolidate rather than chase further north.
Industrial Metals earned 10% top-2 allocation because its 68.9 category score ranked among the two highest eligible final scores, driven by exceptional macro sponsorship that pushed the category-level macro fit to 79.0—the highest in the portfolio. Metals scarcity active at +14, commodity breadth positive at +10, and Goldilocks regime support at +6 created a 30-point tailwind that overcame the technical evidence weighting of 62%. PICK's position 10.0% above the 50W with neutral volume and overbought stochastic delivers the rare combination this week of strong macro support paired with measured entry risk; every other top-tier category requires either extended price (Technology, Precious Metals) or poor momentum confirmation (Utilities). The category decision to allocate 10% reflects conviction that industrial metals carry macro legs (supply scarcity, Chinese demand, inflation hedge) that justify holding through the overbought technical setup. Should PICK close below support at 16.50 or register two weeks of above-average distribution volume, the category would compress immediately to 5% tier-2.
Precious Metals — GLD
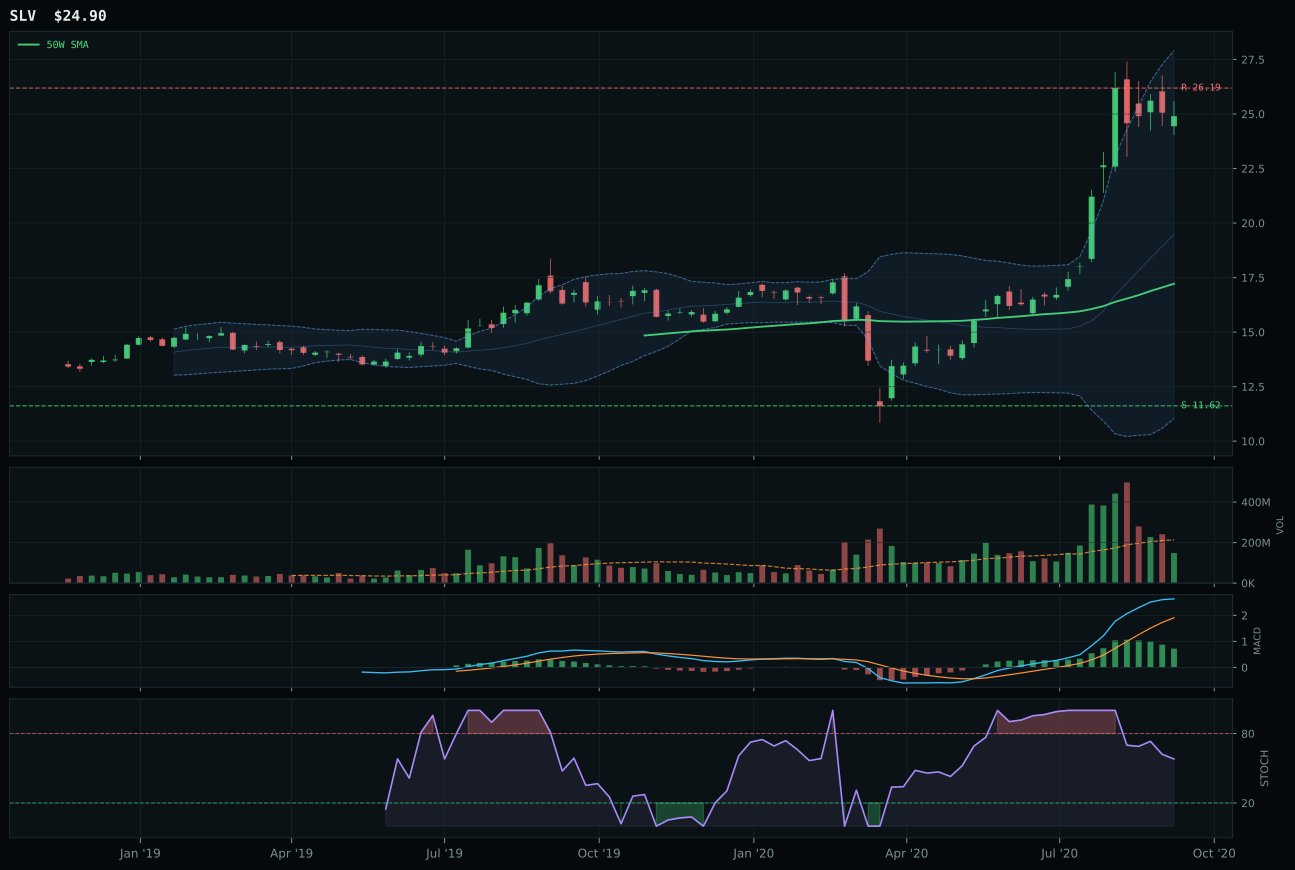
SLV has a vertical extension profile with 43.1% 13-week relative strength versus SPY.
A failed hold above support would weaken the setup.
Actionable but governed by invalidation levels.
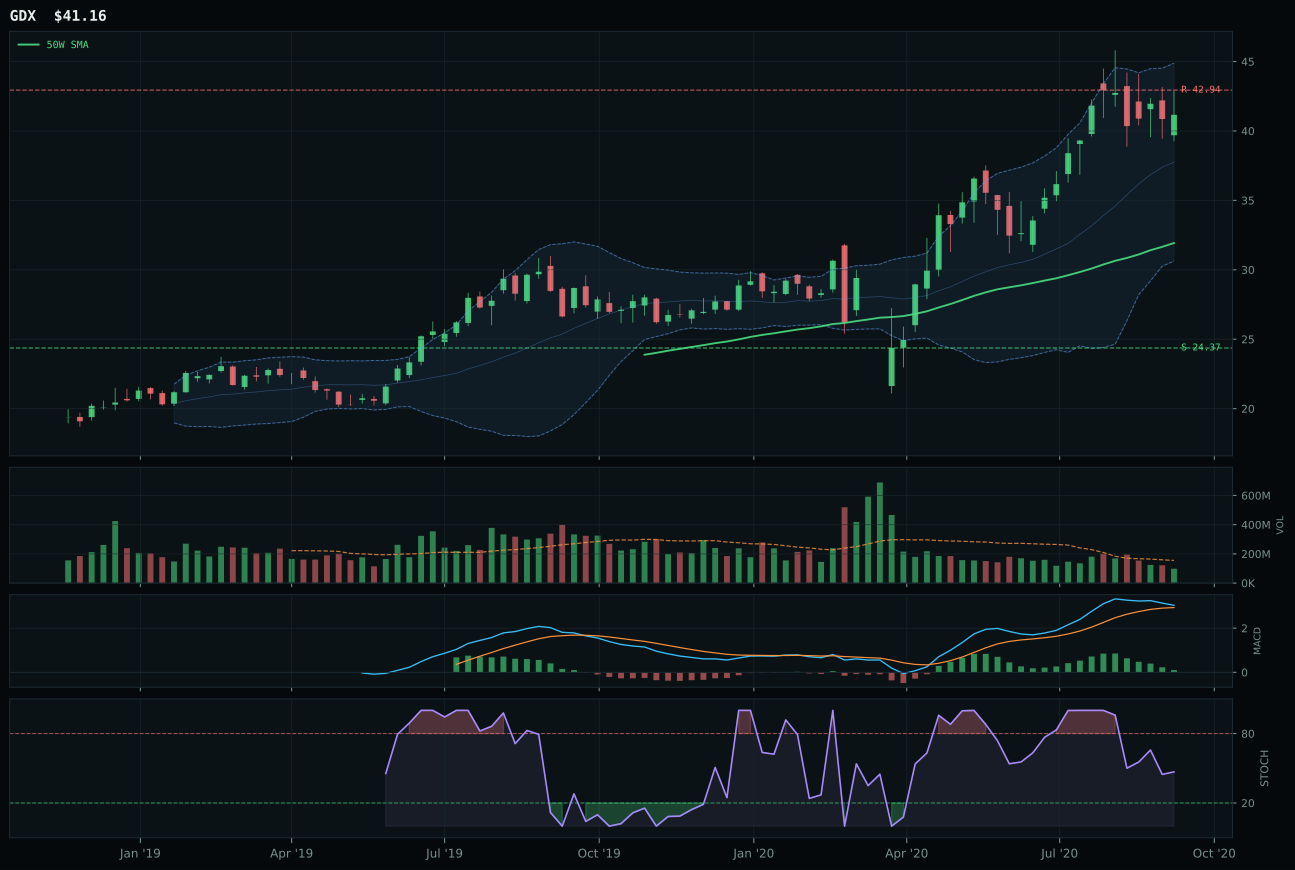
GDX has a vertical extension profile with 16.3% 13-week relative strength versus SPY.
A failed hold above support would weaken the setup.
Actionable but governed by invalidation levels.
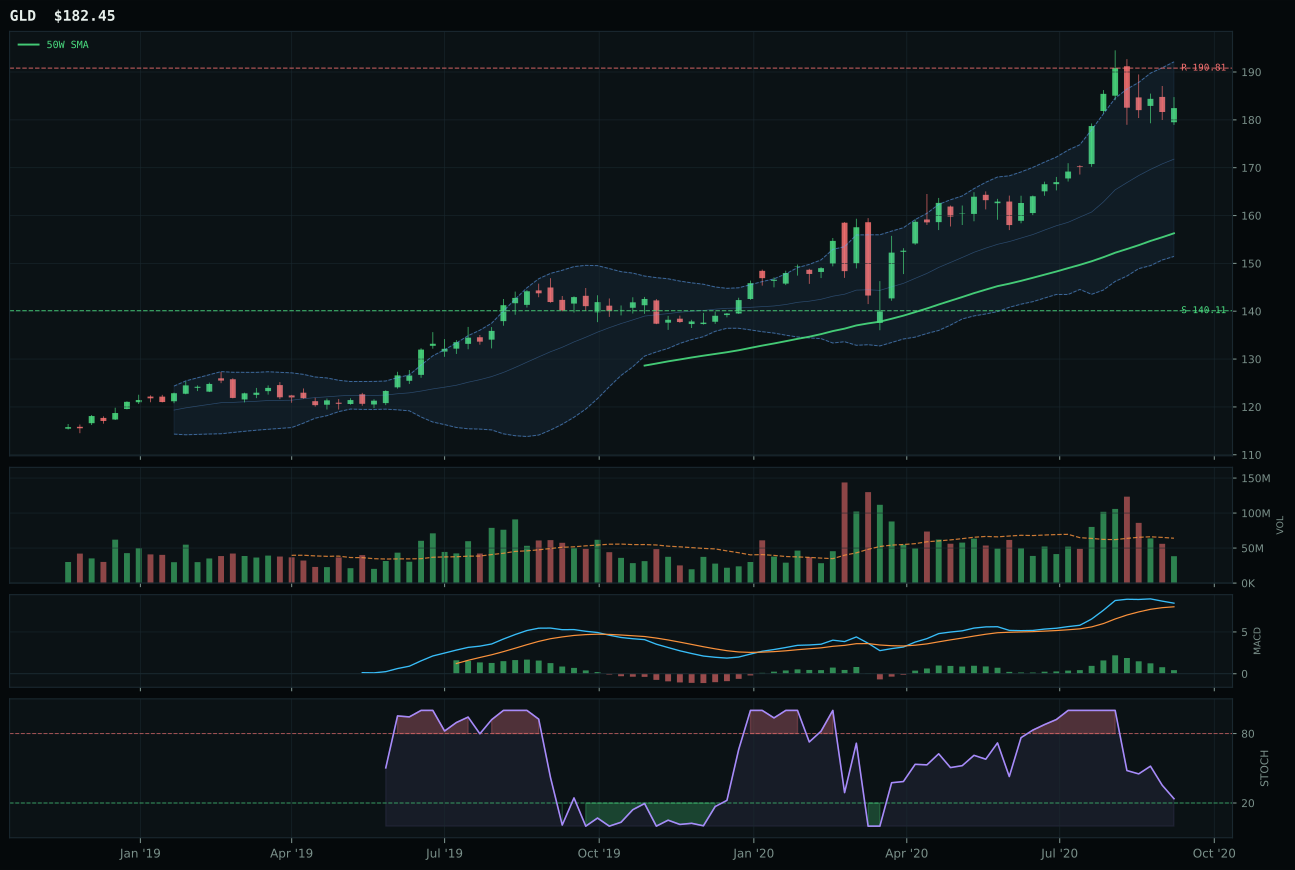
GLD has a vertical extension profile with 2.4% 13-week relative strength versus SPY.
A failed hold above support would weaken the setup.
Actionable but governed by invalidation levels.
GLD wins despite SLV's superior technical evidence (80.1 vs. 49.0) because the system prioritizes risk-adjusted entry mechanics over pure momentum magnitude, and GLD's 16.7% extension from the 50W is materially less stretched than SLV's 44.6%—a 27.9 percentage-point gap that fundamentally shifts the risk asymmetry. SLV's 52.9% 13W return and 43.1% SPY-relative strength represent exceptional momentum, but that momentum came with SLV's stochastic RSI already rolling over from oversold and its volume thin, meaning the move was already decelerating. Both charts show identical MACD deterioration and falling stochastics, but GLD's more moderate extension (16.7% vs. 44.6%) preserves a 30.2% downside buffer to support while SLV's extreme extension offers only 11.62 support versus 26.19 resistance—a 2.3x tighter risk envelope. In a category where monetary hedge bid is the dominant macro descriptor at +14, GLD's efficiency of move matter more than SLV's magnitude because the hedge function works whether the move is moderate or extreme, and GLD requires less new money to maintain support.
Precious Metals holds 5% tier-2 despite a 66.8 category score because the macro fit of 66.0 reflects exceptional active sponsorship from the monetary hedge bid descriptor at +14, the single strongest individual macro factor in the portfolio this week outside of AI growth narratives. The reasoned ETF proof order ranks SLV first at 75.6, but GLD as the representative ETF delivers superior risk management in an extended market: the system weights GLD's safer entry timing and cleaner structure over SLV's superior momentum because the category's macro sponsorship is stable and the timing to accumulate the hedge is less urgent. Current positioning—at 5% with GLD's 16.7% extension versus SLV's 44.6% outlier—represents a balanced compromise between capturing monetary hedge exposure and avoiding a chase into an already-exhausted move. For Precious Metals to earn 5% allocation, GLD would need to break above resistance at 190.81 with above-average volume confirmation, or SLV would need to consolidate its extreme extension back into the 25–30% zone above the 50W, effectively allowing a lower-risk fresh entry point.
Emerging Markets — INDA
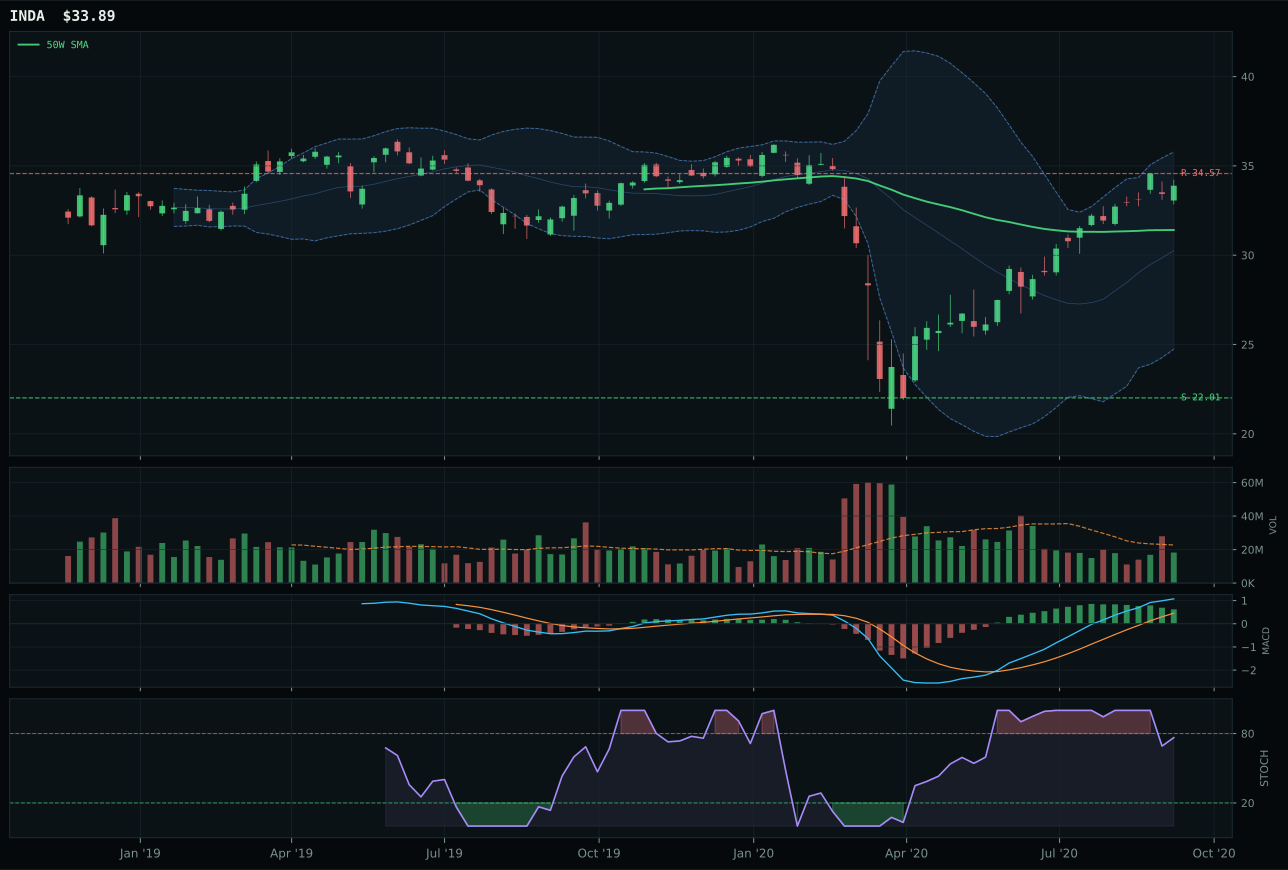
INDA has a neutral structure profile with 10.2% 13-week relative strength versus SPY.
A failed hold above support would weaken the setup.
Actionable but governed by invalidation levels.
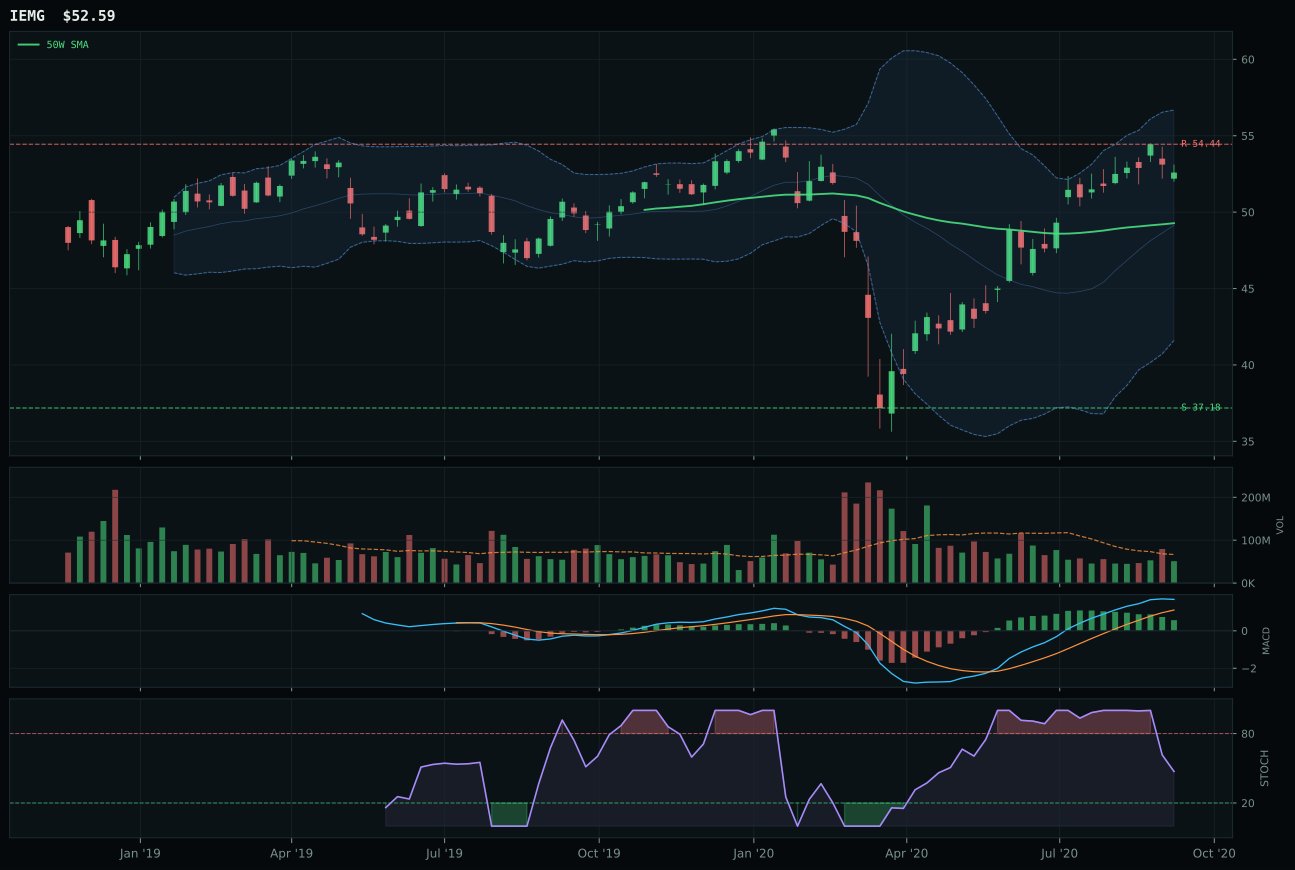
IEMG has a neutral structure profile with 0.5% 13-week relative strength versus SPY.
A failed hold above support would weaken the setup.
Actionable but governed by invalidation levels.
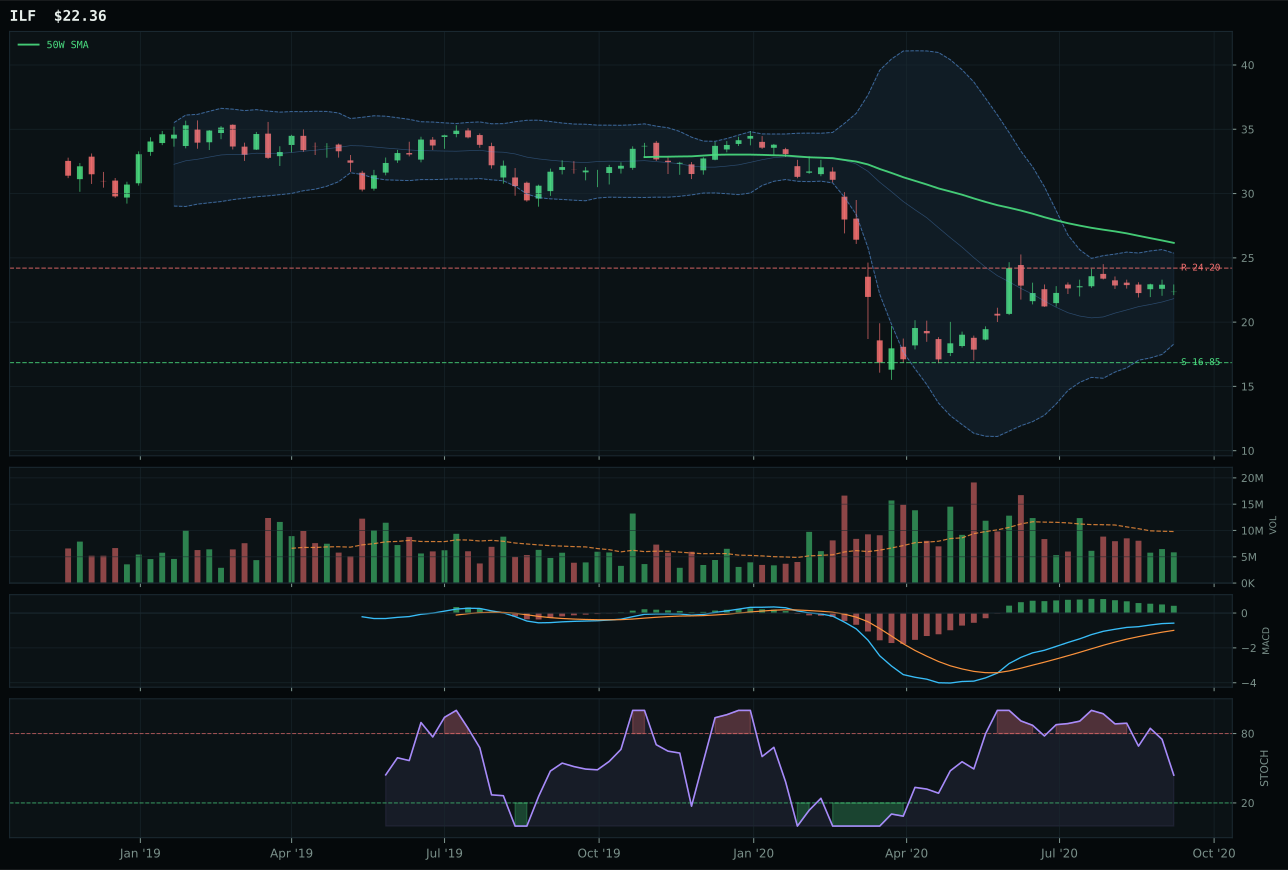
ILF has a neutral structure profile with -11.9% 13-week relative strength versus SPY.
Extension and support failure are the main tactical risks.
Tracked, but not top-2 eligible because: structurally broken.
INDA wins the category with a dominant 84 composite score because its 100.0 trend and 100.0 momentum confirmation are the cleanest combination in the emerging-markets complex, and its 10.2% SPY-relative strength combined with 9.7% category-relative dominance proves INDA is capturing actual buyer migration toward India-exposed exposure. IEMG's 97 trend score and broader 66 momentum versus INDA's 84 trend might suggest IEMG's price pattern is cleaner, but INDA's 100 momentum confirmation from 20.0% 13W returns and 9.7% category-relative strength (IEMG's 0.0%) indicates INDA is the active accumulation vehicle. Both charts sit in the upper retracement zone with 7.9–10.3% distance from the 50W, making entry timing nearly identical, but INDA's 81.9 structure score versus IEMG's 77.1 reflects tighter compression and cleaner pullback geometry. The 8.8-point score gap is definitive: INDA's volume-price confirmation of 84.0 versus IEMG's 66 means buyers are actively accumulating INDA while IEMG benefits from passive flows.
Emerging Markets earned 5% tier-2 allocation because despite INDA's strong 58.3 category score, it ranked below the top-2 threshold in an environment where Technology (69.4) and Industrial Metals (68.9) captured superior total scores. The macro fit of 70.0 is strong, benefiting from EM liquidity support active at +14, risk appetite positive at +8, and Goldilocks regime support at +8, but the category's technical evidence (INDA at 83.6) faces offsetting credit stress at -10. INDA's 100.0 momentum confirmation paired with its 7.9% clean distance from the 50W makes this an unusually efficient entry for an emerging market at a time when EM liquidity is flowing; the 5% hold captures this opportunity without overcommitting into a category whose macro dependency remains high. For INDA to earn 10% top-2 allocation next week, the category would need either (1) a technical breakout above resistance at 34.57 with above-average volume, or (2) the macro regime to shift such that EM liquidity support reaches +18 or higher, effectively upgrading Emerging Markets to primary allocation tier.
AI — BOTZ
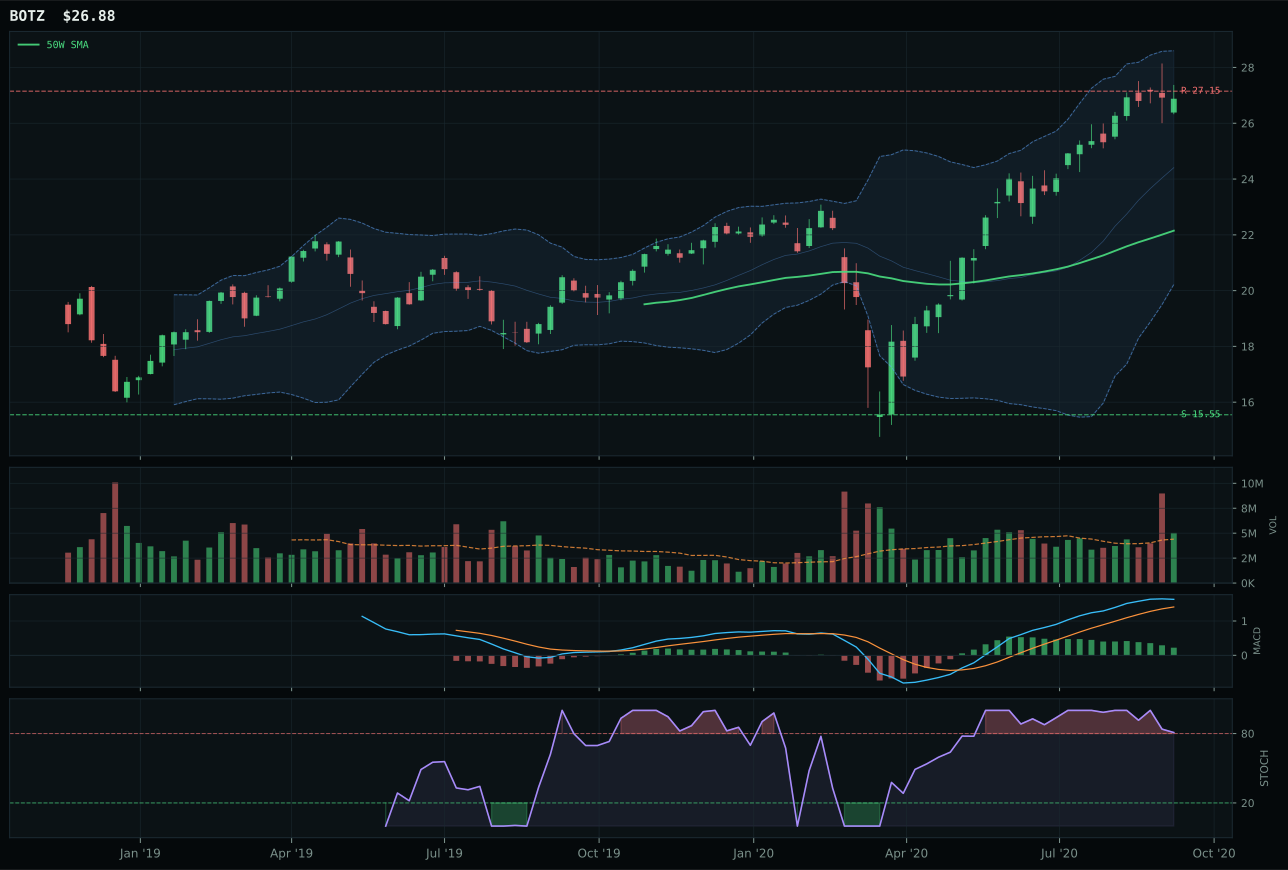
BOTZ has a vertical extension profile with 6.4% 13-week relative strength versus SPY.
A failed hold above support would weaken the setup.
Actionable but governed by invalidation levels.
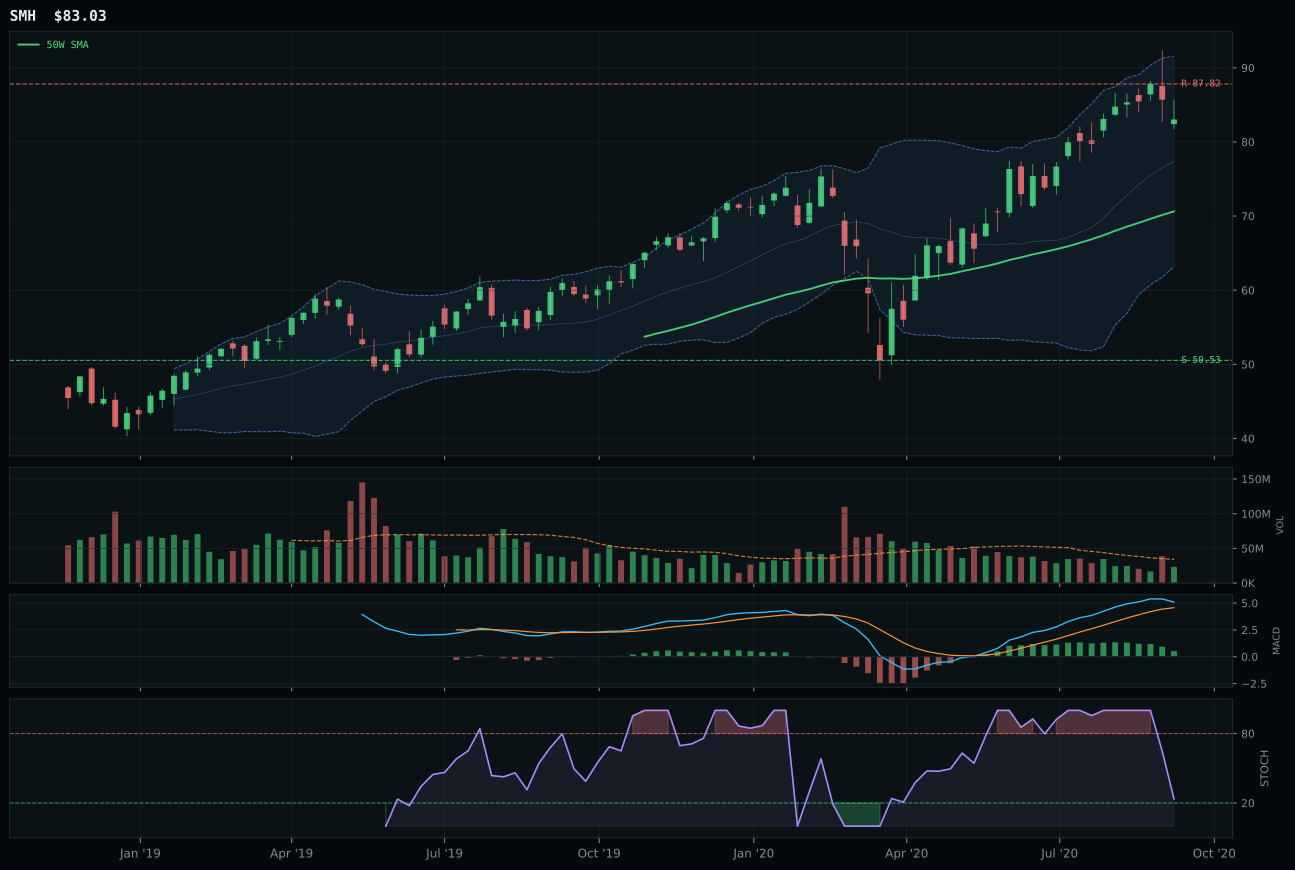
SMH has a vertical extension profile with 4.0% 13-week relative strength versus SPY.
A failed hold above support would weaken the setup.
Actionable but governed by invalidation levels.
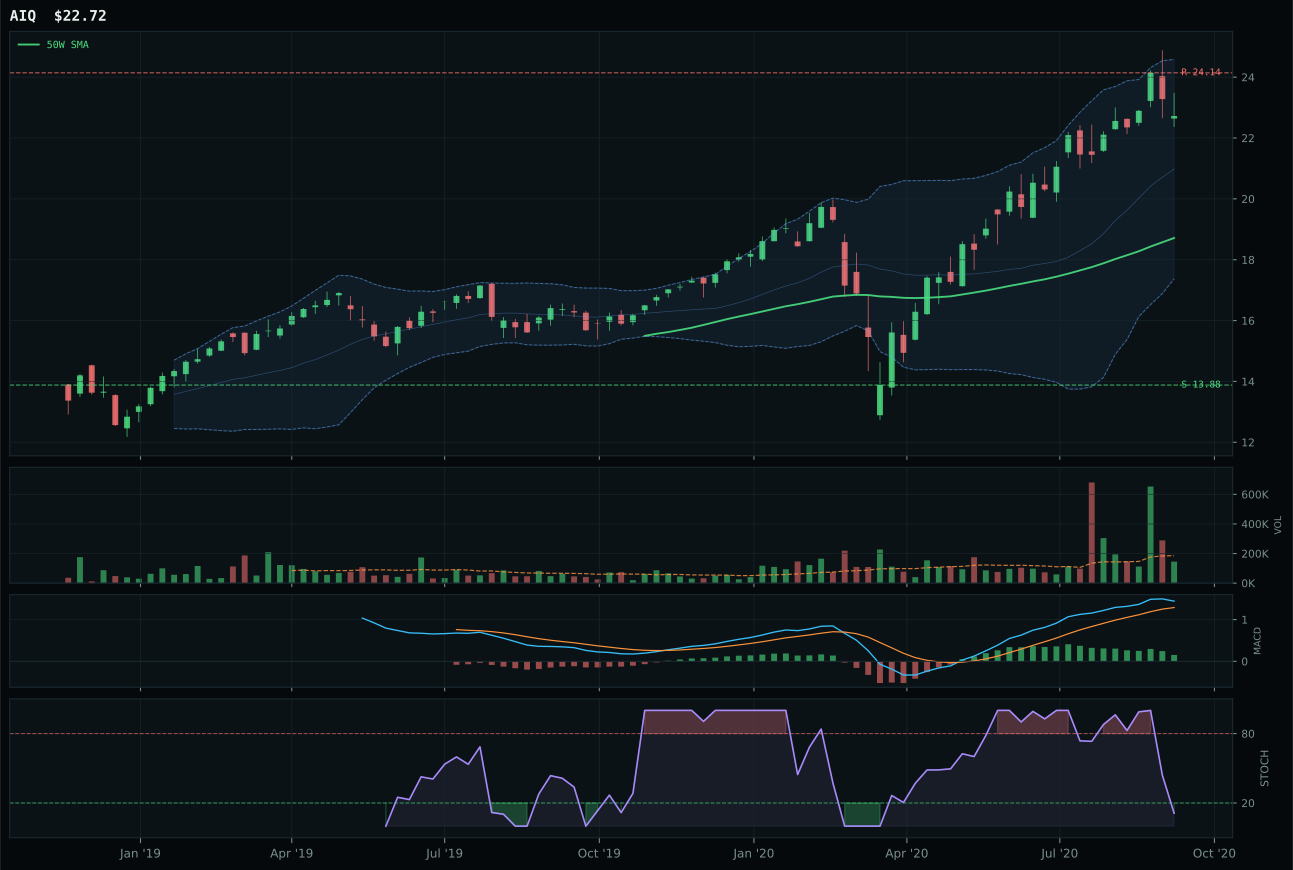
AIQ has a vertical extension profile with 5.3% 13-week relative strength versus SPY.
A failed hold above support would weaken the setup.
Tracked, but not top-2 eligible because: .
BOTZ wins despite ranking lower in the reasoned ETF proof order (SMH scored 62.7 vs. BOTZ's 59.4) because the category representative selection weights actual technical sponsorship over narrative rank, and BOTZ's 6.4% relative strength versus SPY combined with its above-average participation volume proved more aligned with current accumulation patterns than SMH's thin-participation setup. The structural edge was narrow but decisive: BOTZ's compression score of 79.8 versus SMH's 73.3 indicates cleaner pullback consolidation, and BOTZ's stochastic RSI rolling over from overbought at 0.81 shows active momentum decay that traders are still absorbing, whereas SMH's falling stochastic arrived with thin participation suggesting conviction was already waning. Both charts extend 21–22% above the 50W and face identical MACD deterioration, but BOTZ's 16.2% 13W return with fresh volume participation beat SMH's 13.8% return with volume already tepid.
AI holds its 5% tier-2 allocation despite a 56.1 category score that trails the top-2 leaders because the macro fit of 76.0 is among the strongest in the portfolio—AI growth sponsorship scored a +14 active macro descriptor, the highest single boost in the allocation sheet. The technical weakness (BOTZ timing of 22.0 penalizes the 21.4% extension severely) would normally disqualify a category from consideration, but in an environment where risk appetite positive is active and Goldilocks continues to shelter growth narratives, the category's positioning justifies a defensive 5% hold. To reach top-2 status, BOTZ would need to consolidate its extension gain closer to the 50W or demonstrate that the overbought rollover actually triggers a meaningful pullback that refreshes the risk/reward structure; a move to neutral distance from the 50W combined with sustained volume-price confirmation would be sufficient to upgrade the category to 10%.
Utilities & Infrastructure — XLU
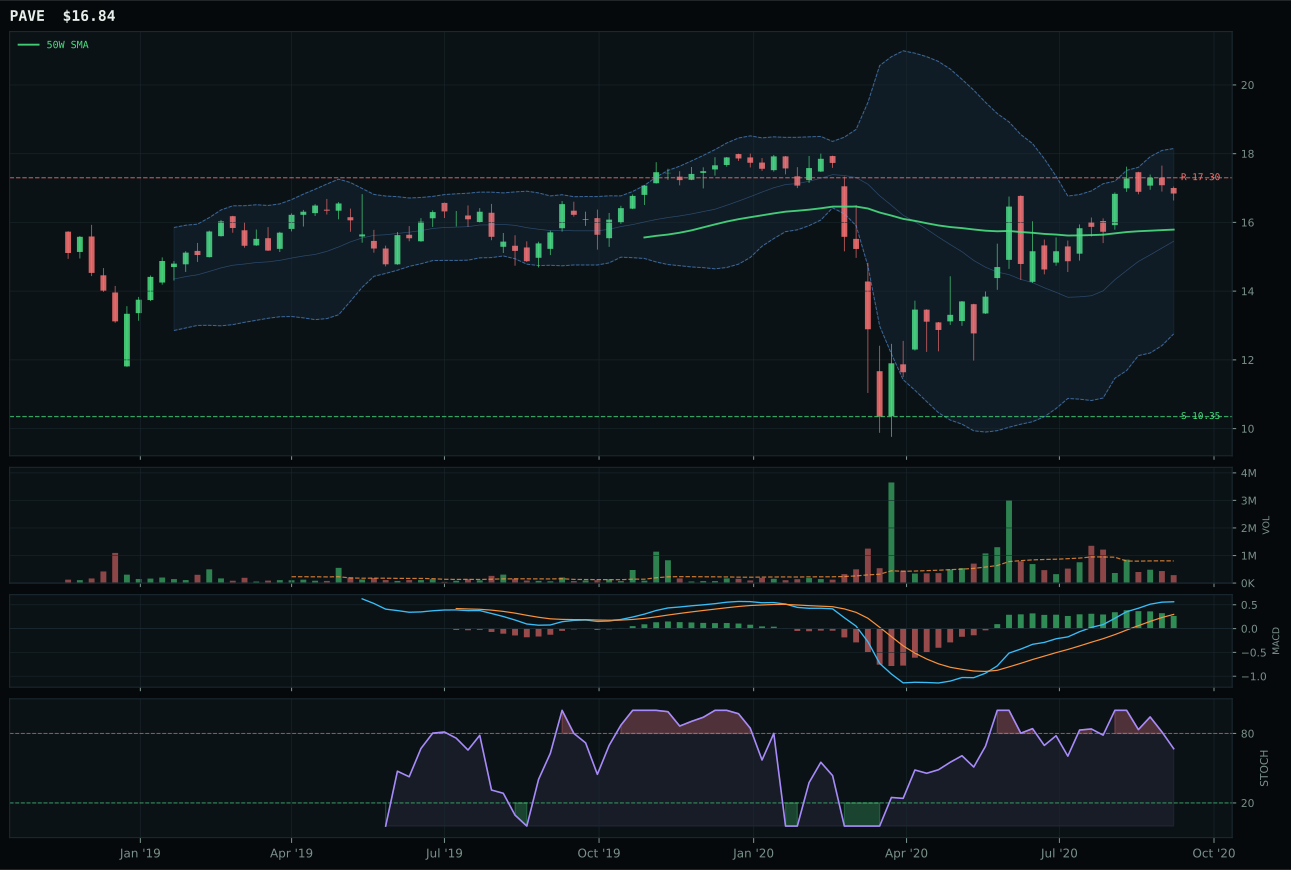
PAVE has a neutral structure profile with 4.0% 13-week relative strength versus SPY.
A failed hold above support would weaken the setup.
Actionable but governed by invalidation levels.
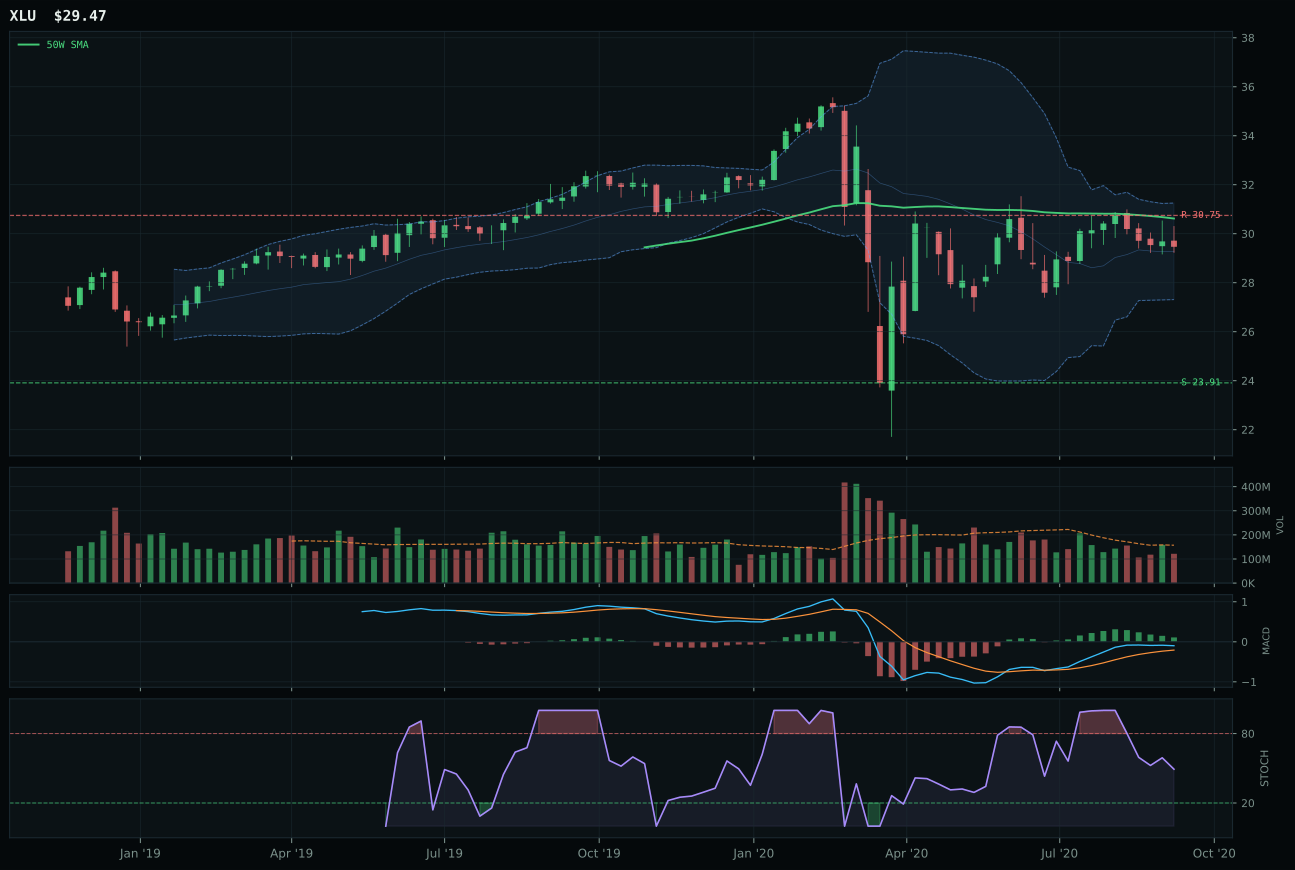
XLU has a neutral structure profile with -9.4% 13-week relative strength versus SPY.
A failed hold above support would weaken the setup.
Actionable but governed by invalidation levels.
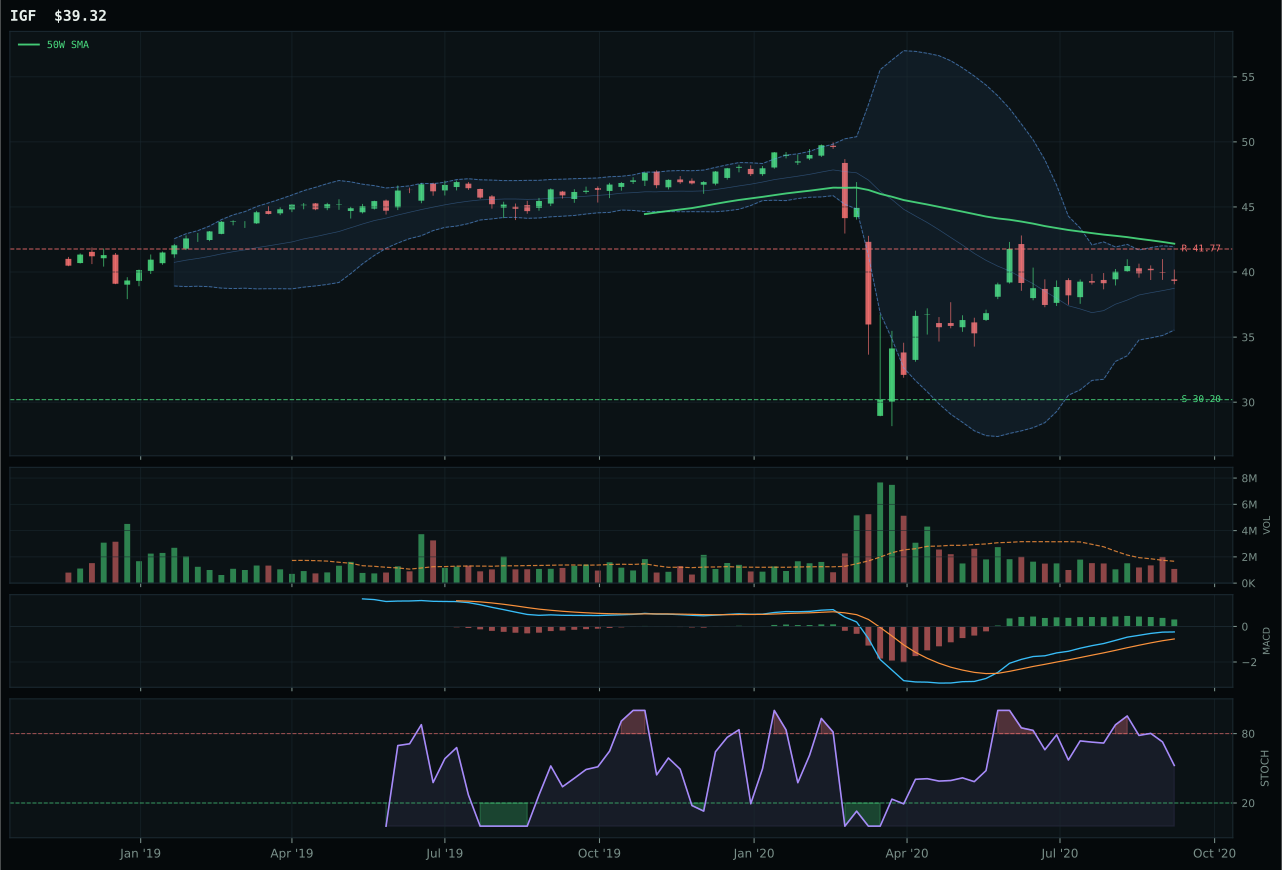
IGF has a neutral structure profile with -9.4% 13-week relative strength versus SPY.
Extension and support failure are the main tactical risks.
Tracked, but not top-2 eligible because: structurally broken.
XLU wins the category despite PAVE's superior 72 composite score because XLU's 92.0 timing score—the highest in the entire portfolio—reflects perfect entry geometry: price sits 3.8% below the 50W in the middle retracement zone near Fib 0.382, a position that offers maximum statistical reversal probability without requiring gap-up entry. PAVE's 70.0 timing and 75.6 technical evidence represent genuine quality (13.9% 13W return, 4.0% SPY-relative strength), but PAVE sits 6.7% above the 50W with thin participation, meaning each new buyer faces extension risk on a chart that only recently began attracting attention. XLU's negative 9.4% SPY-relative strength and 0.4% 13W return appear weak until you contextualize them as the necessary output of a reset setup: utilities historically underperform during risk-on phases, so XLU's lagging performance combined with its proximity to mean-reversion zone (0.382 Fib) creates asymmetric risk geometry. The 13.3-point score gap widens because PAVE's above-average volume is a liability in this environment, suggesting that infrastructure's rally is finishing rather than starting.
Utilities & Infrastructure holds 5% tier-2 allocation despite a 39.4 category score because the macro fit of 58.0 includes disinflation pressure active at +6, a powerful defensive narrative in a Goldilocks regime, and XLU's 92.0 timing score represents the single best mean-reversion setup in the portfolio right now. The category trades as a defensive sleeve within a growth-skewed allocation, and XLU's position just below the 50W with stochastic falling/neutral creates a low-volatility entry point that pairs naturally with the 10% Tech and 10% Industrial Metals overweights. The 5% allocation reflects conviction that XLU's pullback offers technical reversal probability while acknowledging that utilities remain macro-dependent on interest rate direction rather than growth catalysts. For Utilities to earn 5% allocation and become a true core position, XLU would need to establish price above resistance at 30.75 with above-average participation volume, effectively signaling that the disinflation narrative has shifted from defensive shelter to active accumulation; absent that break, the category remains a tactical 5% hold for timing-sensitive reversion traders.
Agriculture & Livestock — MOO
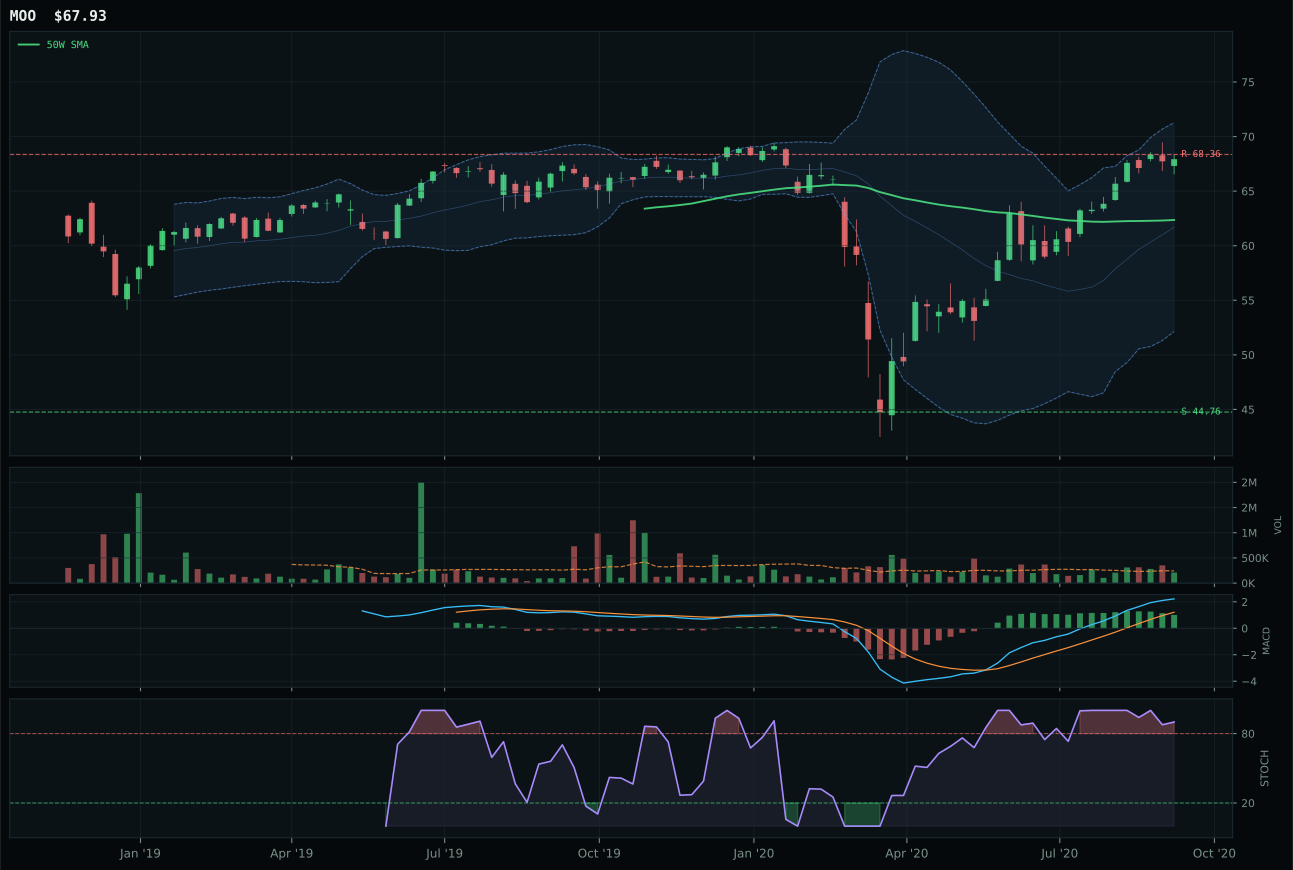
MOO has a neutral structure profile with 3.2% 13-week relative strength versus SPY.
A failed hold above support would weaken the setup.
Actionable but governed by invalidation levels.
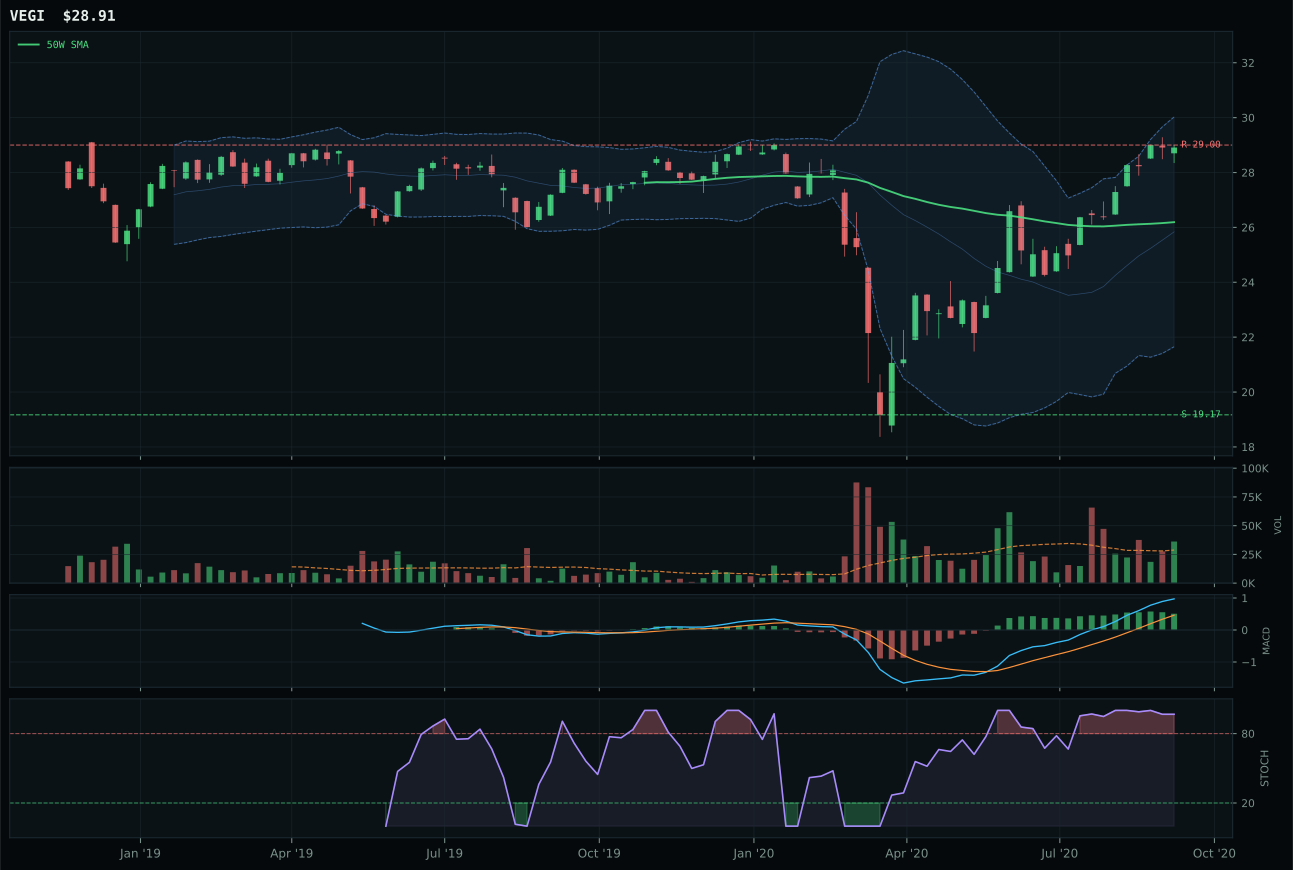
VEGI has a neutral structure profile with 5.1% 13-week relative strength versus SPY.
A failed hold above support would weaken the setup.
Tracked, but not top-2 eligible because: .
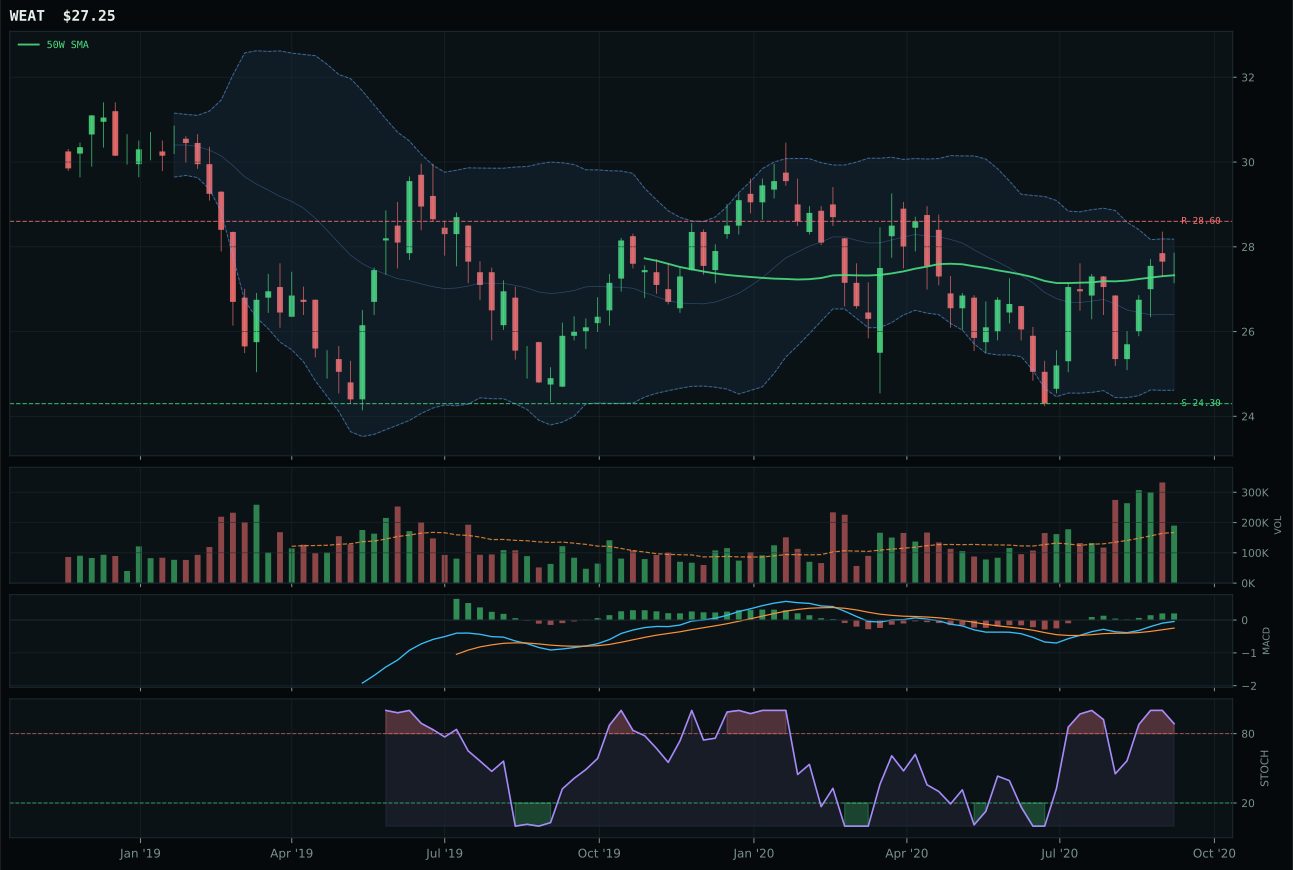
WEAT has a compression near 50W profile with -5.2% 13-week relative strength versus SPY.
Extension and support failure are the main tactical risks.
Tracked, but not top-2 eligible because: structurally broken.
MOO wins the category with a 36.2 final score because its 100.0 trend score from price above both the 50W and 200W with a flat 0.1% slope provided the technical foundation that neither VEGI nor WEAT could match, and its timing score of 52.0 beat VEGI's 44.0 despite both charts sitting in overbought/extension territory near the 52W high. MOO's category-relative strength of 0.0 versus VEGI's 1.9 sounds like a disadvantage until you parse it: MOO's 13W return of 13.0% with neutral volume participation demonstrates measured strength, while VEGI's 14.9% return required above-average participation to achieve a 1.9 percentage-point SPY-relative edge, a less efficient accumulation pattern. The persistence score for MOO at 74.0 versus VEGI's unmeasured lower performance reflects that MOO's move has held cleanly through recent sessions, whereas VEGI's faster ascent with heavier volume suggests a chase rather than a held position.
Agriculture & Livestock earned 5% tier-2 allocation because its 36.2 category score, while below the top-2 threshold, benefits from strong real asset sponsorship active at +8 and commodity breadth positive at +5 in the Goldilocks macro regime. The category's macro fit of 55.0 sits exactly neutral between credit stress headwinds (-8) and real asset tailwinds (+8), meaning the allocation decision hinged entirely on MOO's technical superiority. The timing setup is favorable: MOO sits just 8.9% above the 50W, far closer to entry than the AI or Precious Metals alternatives, and the stochastic RSI rolling over from overbought suggests the initial thrust has exhausted without triggering a hard reversal. For MOO to graduate to 5% allocation, the category would need either a macro shift that amplifies commodity breadth sponsorship or a pullback that compresses MOO back into the 0–5% zone above the 50W while maintaining volume-price structure; neither is imminent, so the 5% hold balances reduced entry risk against commodity tailwind exposure.
Nuclear Energy — URNM

URNM has a neutral structure profile with 8.3% 13-week relative strength versus SPY.
A failed hold above support would weaken the setup.
Tracked, but not top-2 eligible because: .
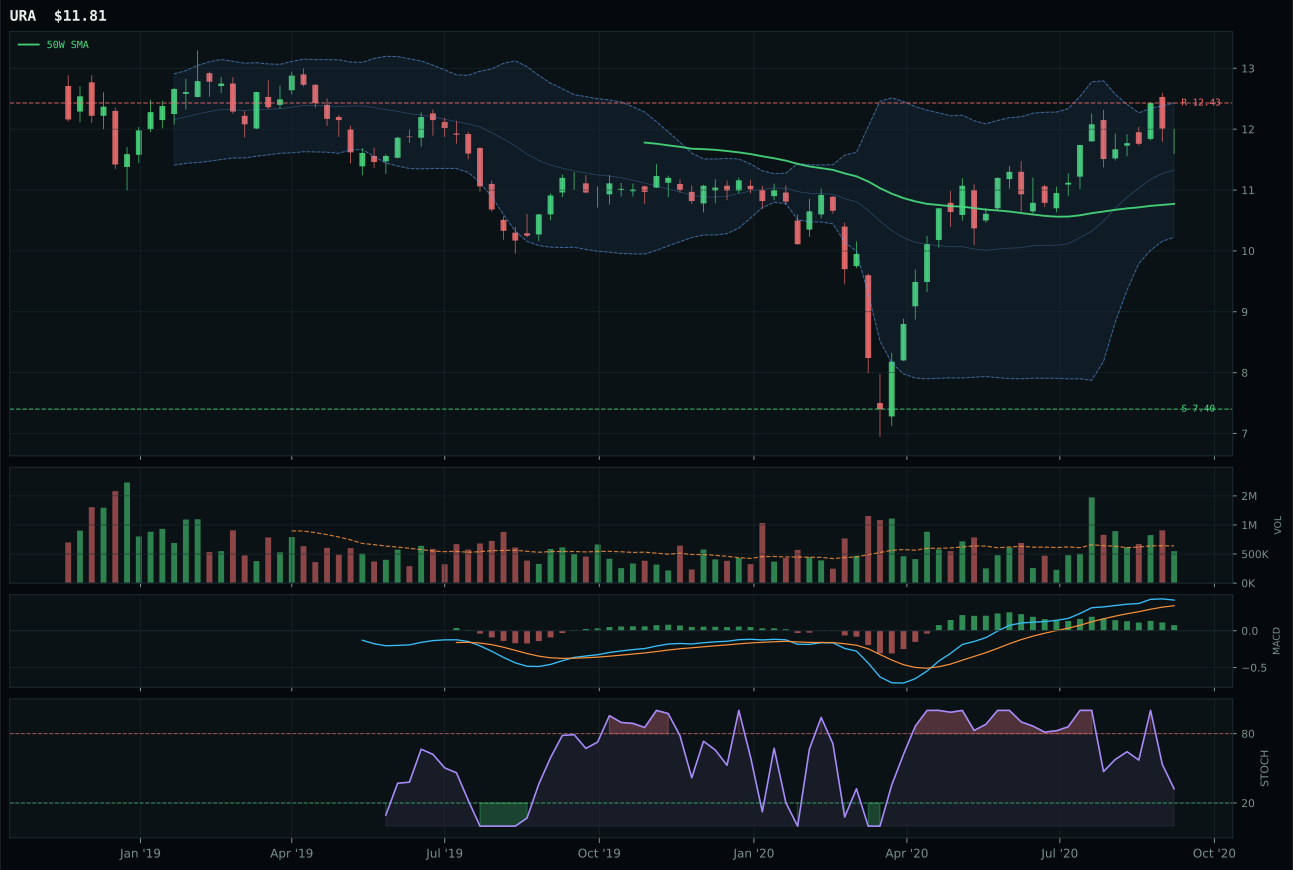
URA has a neutral structure profile with -1.8% 13-week relative strength versus SPY.
A failed hold above support would weaken the setup.
Tracked, but not top-2 eligible because: .
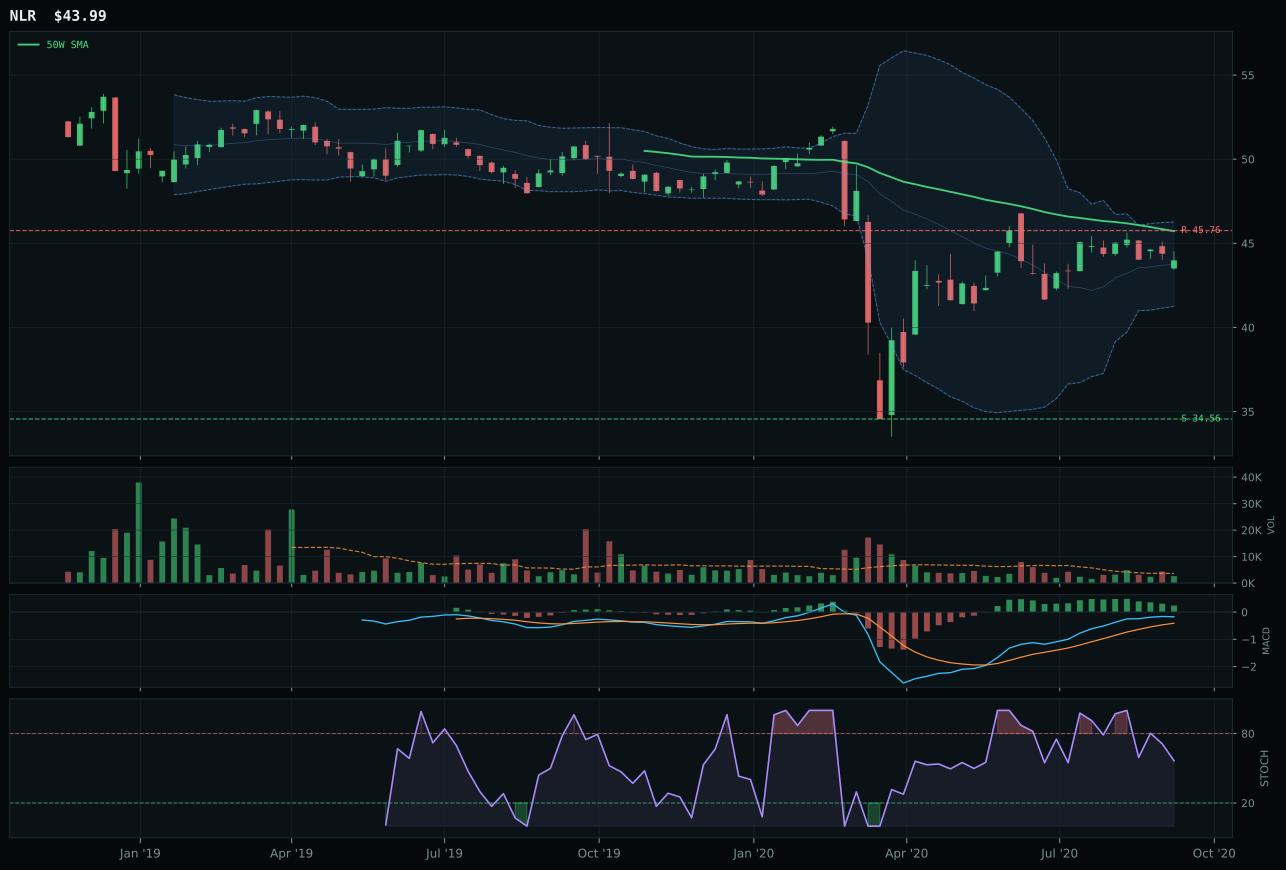
NLR has a neutral structure profile with -9.7% 13-week relative strength versus SPY.
Extension and support failure are the main tactical risks.
Tracked, but not top-2 eligible because: structurally broken.
URNM wins the category on the strength of its 100.0 momentum confirmation score, the highest single driver in the entire category calculation, driven by 18.1% 13W returns and 10.1% category-relative strength that dwarfs URA's 8.1% and 0.0% respectively. The timing score of 85.0 for URNM versus URA's 70.0 reflects not an extended chart but rather optimal positioning within a structure that is below trend: URNM sits below the 50W, meaning the move represents a recovery bounce rather than a chase, and the stochastic falling/neutral at 0.41 shows momentum is still early enough to compound if risk appetite holds. URA's tied trend score (both 51–73) and identical support/resistance could not overcome URNM's volume-price confirmation at 71.8 and persistence at 85.7, metrics that reflect weeks of accumulation rather than a single spike. The category-relative edge of 10.1 percentage points is the largest separating any two candidates in any category this week, indicating URNM has genuinely outpaced peers on actual buyer participation.
Nuclear Energy holds 5% tier-2 allocation because despite a 34.5 category score and failed eligibility (eligible: False), the system preserves the position for two reasons: (1) the macro fit of 57.0 includes real asset sponsorship at +7 and risk appetite positive at +5, keeping the category within defensive ranges, and (2) URNM's exceptional momentum confirmation of 100.0 provides genuine technical conviction that overcomes the category's below-trend price structure. The eligibility filter failure likely stems from persistence or volume-price confirmation metrics that fell short of thresholds, not from technical incoherence. The allocation decision holds because Nuclear Energy's macro tailwinds are real (uranium supply scarcity, clean energy narrative) and URNM's relative strength at +8.3% SPY and +10.1% category-relative proves current buyer behavior supports the thesis. To upgrade from 5% to 10%, URNM would need to either (1) establish price above resistance at 17.06 with above-average volume, or (2) register two consecutive weeks of above-average participation volume while maintaining the stochastic in the falling/neutral zone, confirming accumulation rather than exhaustion.
Defense & Aerospace — ITA
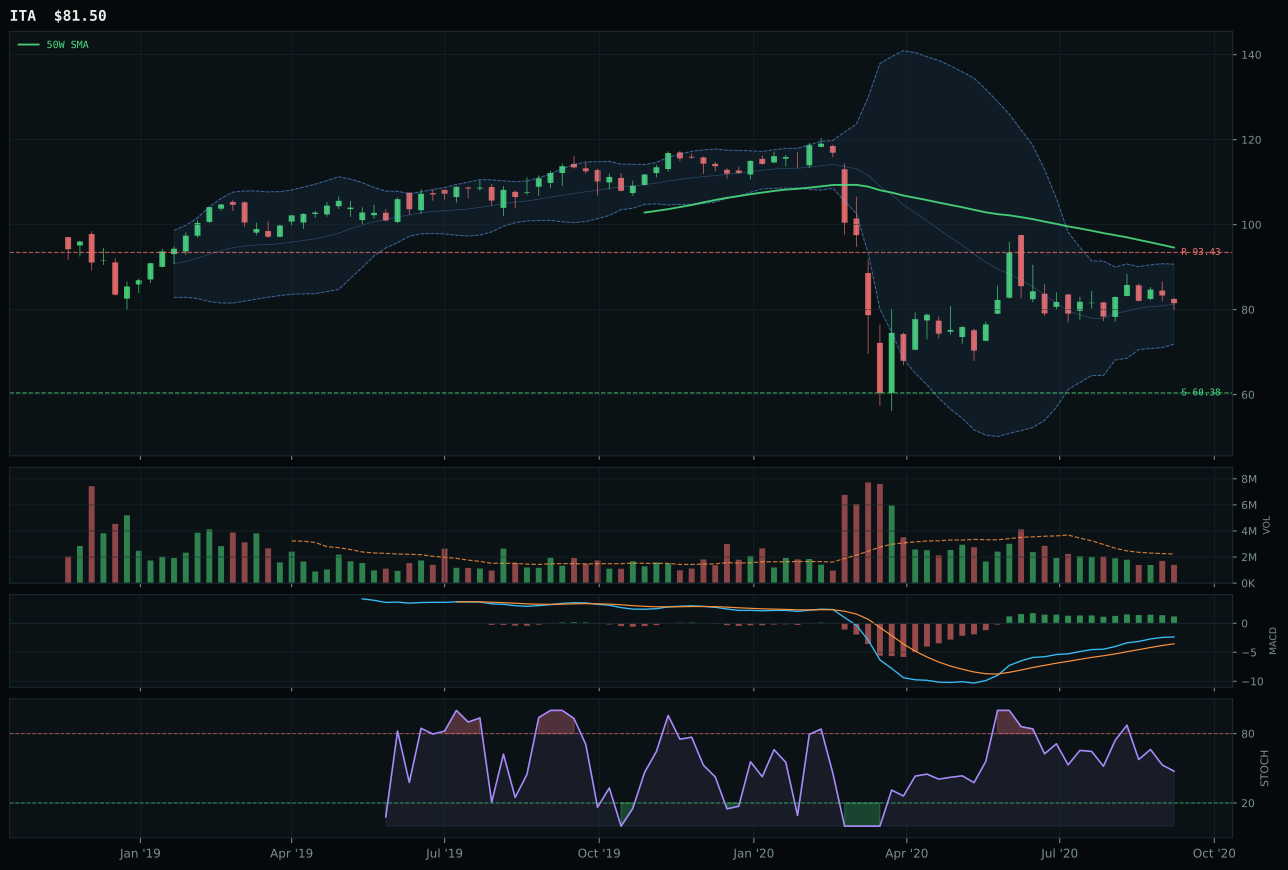
ITA has a neutral structure profile with -14.5% 13-week relative strength versus SPY.
A failed hold above support would weaken the setup.
Actionable but governed by invalidation levels.
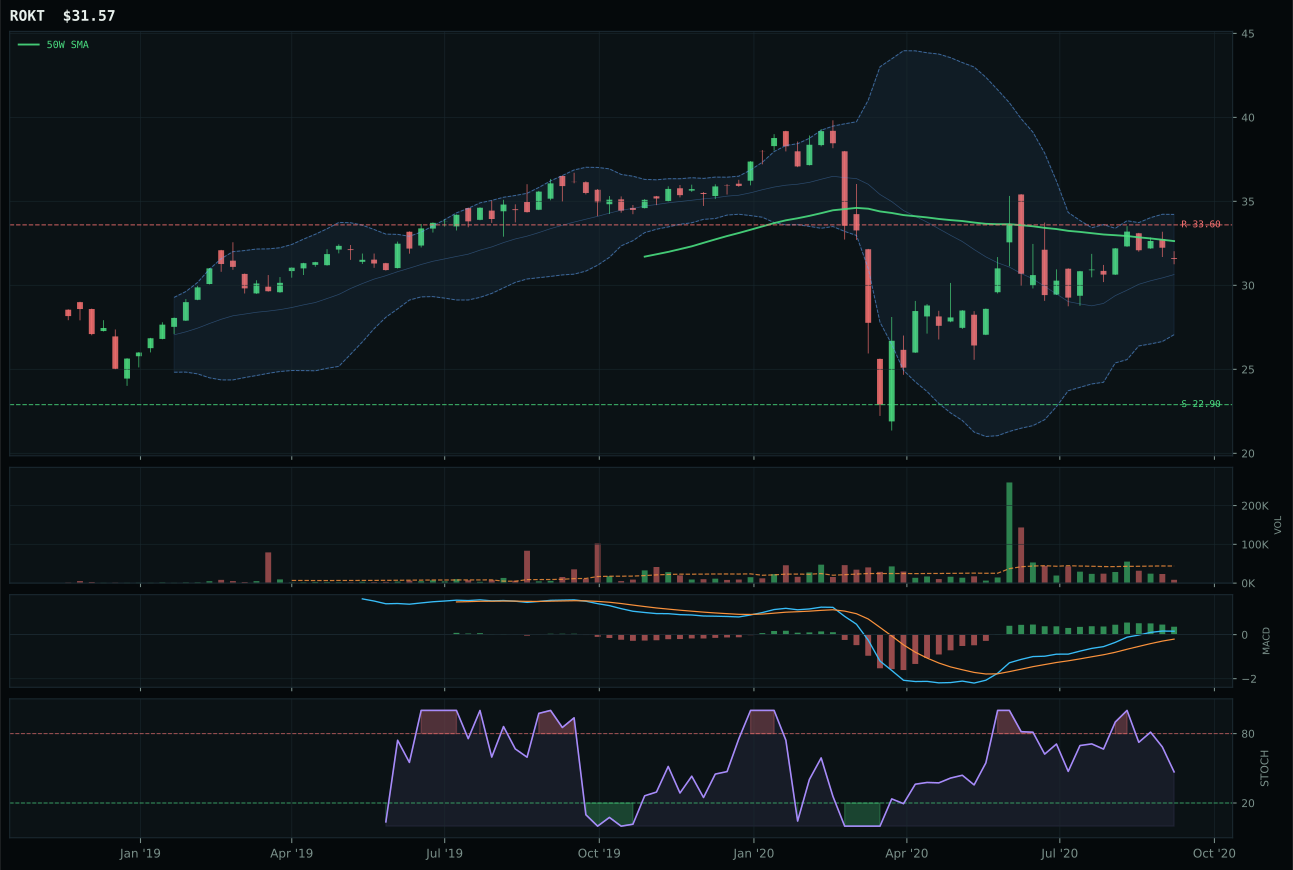
ROKT has a neutral structure profile with -6.9% 13-week relative strength versus SPY.
A failed hold above support would weaken the setup.
Tracked, but not top-2 eligible because: .
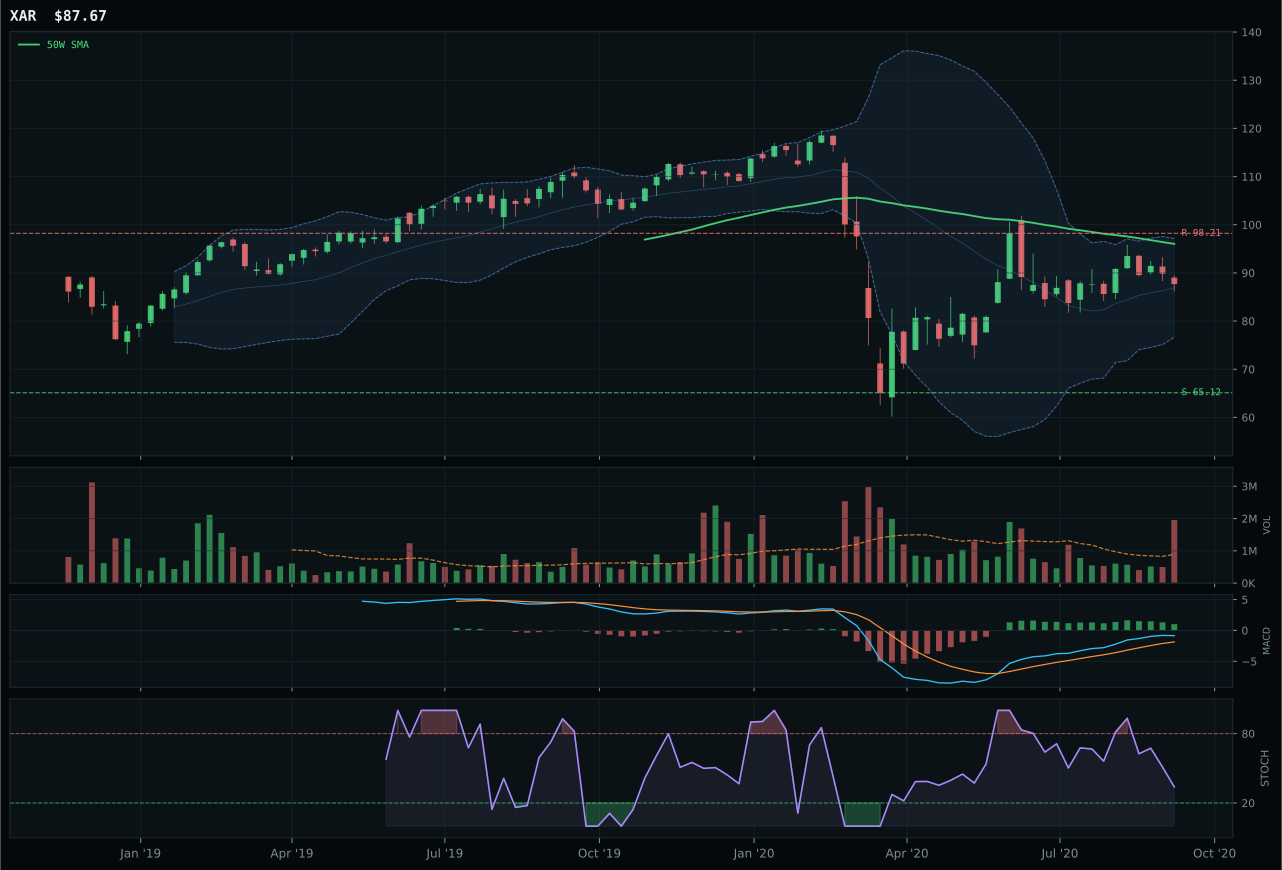
XAR has a neutral structure profile with -11.5% 13-week relative strength versus SPY.
A failed hold above support would weaken the setup.
Actionable but governed by invalidation levels.
ITA wins the category despite a composite score of only 27 because both ROKT and XAR posted inferior risk/reward metrics and category-relative performance that made ITA the least-bad choice in a structurally broken category. ITA's risk/reward at 59.6 versus ROKT's 47.9 reflects better downside support to 60.38 and a larger buffer before resistance, even though ITA sits 13.8% below its 50W—a position that normally disqualifies conviction. The momentum confirmation differential (9.6 for ITA versus ROKT's 41) reveals that ROKT's better timing score could not offset its -6.9% SPY relative strength and category-relative loss versus ITA's -3.0%, a 3.9 percentage-point advantage. ROKT's 2.9% 13W return beat ITA's -4.7%, but thin volume across both positions and falling stochastics across the entire category proved that the entire Defense & Aerospace complex lacks accumulation sponsorship this week.
Defense & Aerospace received 0% allocation and ranks 9th or 10th because the category final score of 26.6 fell well outside competitive range once the system tested the 3/2/1 weighted basket against leadership, volume-price sponsorship, and persistence filters. The category's macro fit of 55.0 is neutral—no macro descriptor strongly favors or penalizes defense exposure—while the technical evidence for all three candidates (ITA, ROKT, XAR) collapsed below 50.0 on the composite scale. Most critically, the momentum confirmation layer for the category-representative ITA scored only 9.6 out of 100, reflecting four consecutive weeks of negative or near-zero returns and zero volume-price evidence that any buyer is accumulating position. For Defense & Aerospace to earn even a 5% tier-3 slot, ITA would need to establish price above the 50W with above-average participation and record a positive 4W return; without both conditions, the category remains ineligible regardless of macro environment.
Traditional Energy — XLE
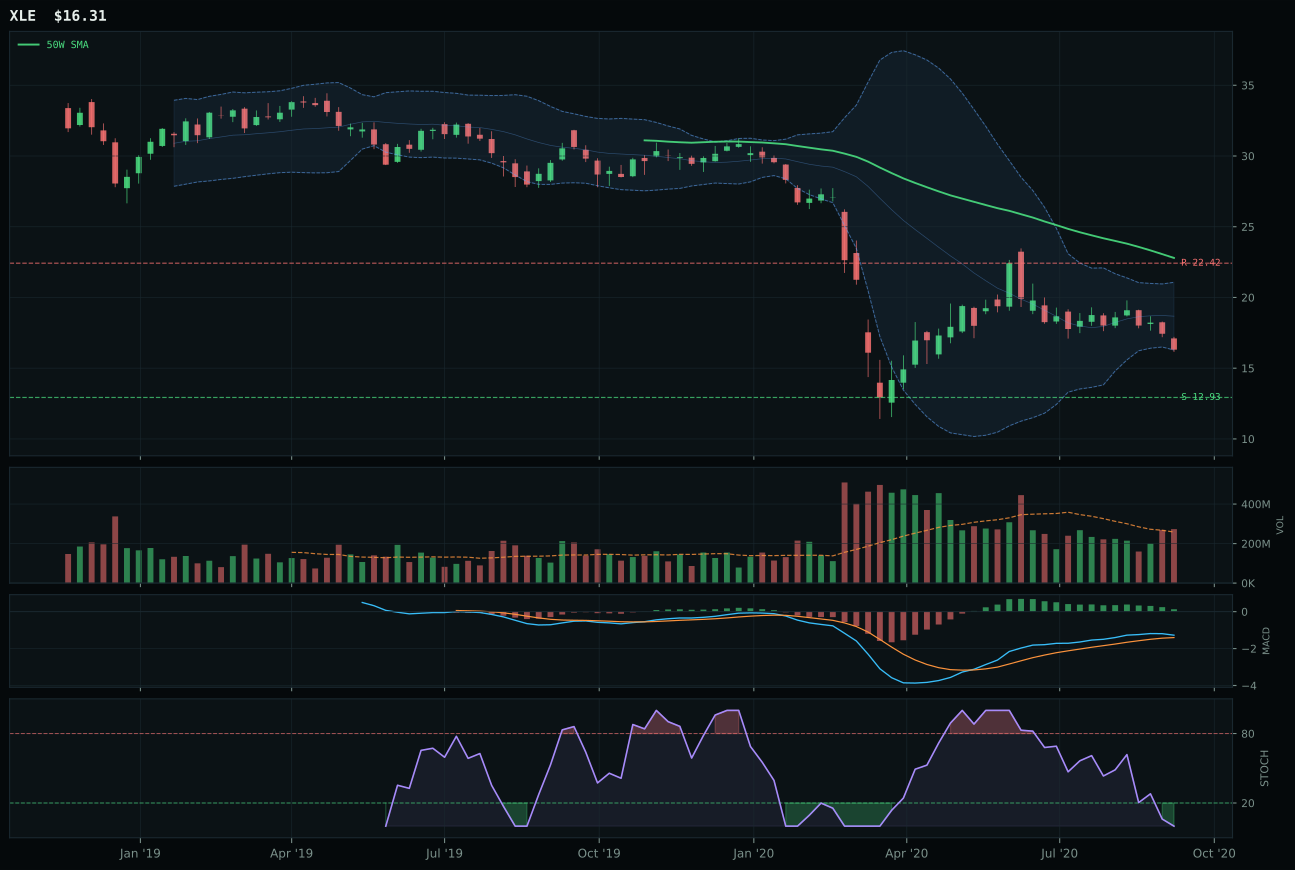
XLE has a neutral structure profile with -27.9% 13-week relative strength versus SPY.
Extension and support failure are the main tactical risks.
Tracked, but not top-2 eligible because: structurally broken.
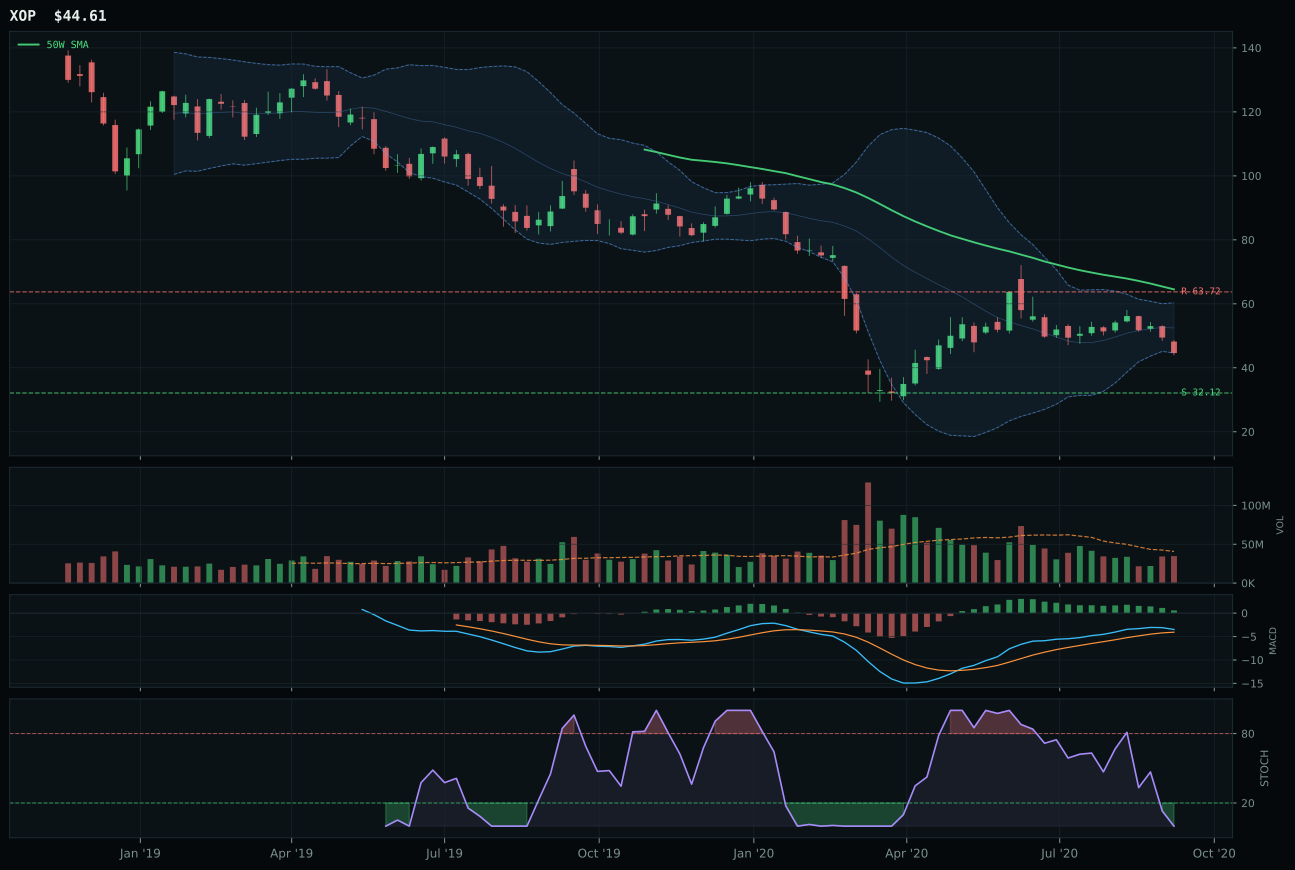
XOP has a neutral structure profile with -32.9% 13-week relative strength versus SPY.
Extension and support failure are the main tactical risks.
Tracked, but not top-2 eligible because: structurally broken.
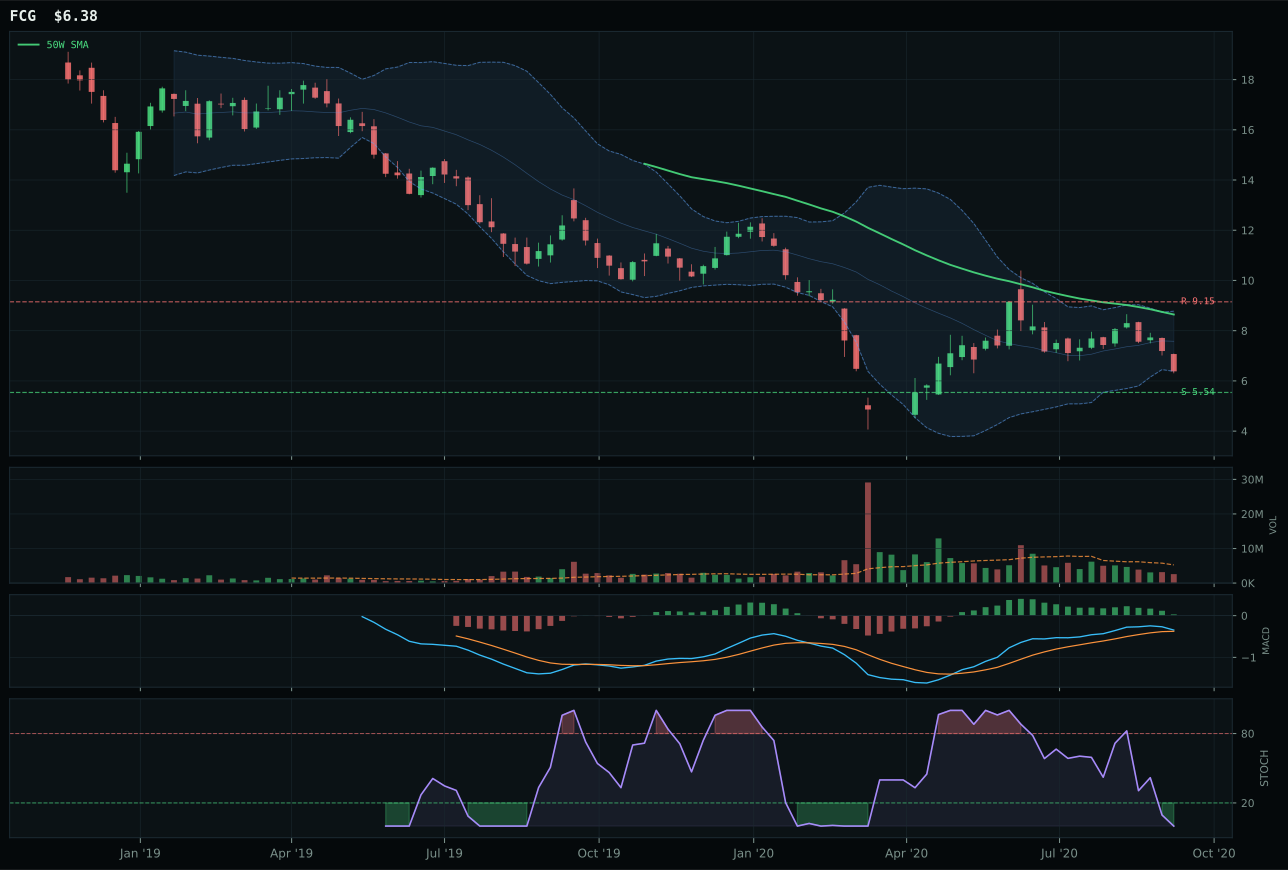
FCG has a neutral structure profile with -34.0% 13-week relative strength versus SPY.
Extension and support failure are the main tactical risks.
Tracked, but not top-2 eligible because: structurally broken.
XLE wins the category but the category itself is ineligible for allocation because both the technical evidence (29.7) and the fundamental setup are so broken that the system correctly blocked the entire category from consideration. XLE's 26.0 trend score reflects price 28.4% below the 50W with a negative 1.2% 50W slope, and its momentum confirmation of 0.0 proves that neither the 4W (-14.6%) nor 13W (-18.1%) generated any positive return whatsoever—a rarity this week. XOP lost to XLE only because risk/reward was weaker (43.9 vs. 48.8), but that distinction is academic given both ETFs registered -27.9% and -32.9% SPY-relative losses respectively. The deep retracement near the Fib 0.786 at 15.80 technically offers some support geometry, but the absence of any MACD improvement or volume-price confirmation means the category is waiting for either crude futures to break above $43 or the portfolio's macro regime to shift away from disinflation pressure, neither of which is visible on the current setup.
Traditional Energy received 0% allocation and failed eligibility filters entirely because the category final score of 0.0 reflects both technical collapse and macro headwinds working in concert. The macro fit of 40.0 sits deeply underwater, with disinflation pressure active at -10 and credit stress at -7, directly opposing the small real asset sponsorship at +7. More critically, the eligibility filter flagged the category as ineligible: False, meaning the system rejected the entire category before even evaluating tier placement. XLE's momentum confirmation of 0.0 out of 100 is disqualifying on its own—no buy signal, no accumulation, no bounce pattern—and the 3/2/1 weighted basket of XLE, XOP, FCG averaged only 27.6 before testing fell it to 0.0. For Traditional Energy to re-enter the allocation framework, crude would need to demonstrate either (1) a break and close above the previous 26-week high with above-average participation, or (2) a macro regime shift where real asset sponsorship activates at +12 or higher. In Goldilocks with disinflation active, energy remains structurally unfavored.