
2020-09-04
Informational purposes only. The content in this report, including allocations, analysis, and commentary, is provided solely for informational and educational purposes. It does not constitute financial advice, investment advice, trading advice, or any other type of advice. Past performance does not guarantee future results. Always conduct your own research and consult a qualified financial professional before making investment decisions.
Some tracked tickers were excluded due to missing live weekly price data: SGOV: Historical cache SGOV has only 14 usable weekly bars
Weekly Allocation
| Ticker | Category | Weight | Role |
|---|---|---|---|
| FSOL | 50% | Overlay | |
| SLV | Precious Metals | 10% | Top-2 (10%) |
| INDA | Emerging Markets | 10% | Top-2 (10%) |
| XLK | Technology | 5% | Tier-2 (5%) |
| PICK | Industrial Metals | 5% | Tier-2 (5%) |
| SMH | AI | 5% | Tier-2 (5%) |
| MOO | Agriculture & Livestock | 5% | Tier-2 (5%) |
| ITA | Defense & Aerospace | 5% | Tier-2 (5%) |
| XLU | Utilities & Infrastructure | 5% | Tier-2 (5%) |
Trade Instructions — Monday Open
Sell the tranche from 2020-08-07 (completing its 4-week hold). Buy the new tranche. Instructions show net portfolio changes — same-asset positions cancel, weight changes show the delta.
| Action | Ticker | Instruction |
|---|---|---|
| SELL | SMH | Sell 33% of SMH position (reduce 3.75% → 2.50%) |
| SELL | PAVE | Sell 33% of PAVE position (reduce 3.75% → 2.50%) |
| SELL | REMX | Sell 25% of REMX position (reduce 5.00% → 3.75%) |
| SELL | XAR | Sell 33% of XAR position (reduce 3.75% → 2.50%) |
| SELL | URA | Sell 50% of URA position (reduce 2.50% → 1.25%) |
| BUY | INDA | Buy INDA — 20.00% of freed cash (adds 1.25% to portfolio) |
| BUY | MOO | Buy MOO — 20.00% of freed cash (adds 1.25% to portfolio) |
| BUY | PICK | Buy PICK — 20.00% of freed cash (adds 1.25% to portfolio) |
| BUY | ITA | Buy ITA — 20.00% of freed cash (adds 1.25% to portfolio) |
| BUY | XLU | Buy XLU — 20.00% of freed cash (adds 1.25% to portfolio) |
Current Portfolio After Trade
Combined holdings across all 4 active tranches. Each tranche is 25% of the portfolio.
| Ticker | % of Portfolio | Weight Bar |
|---|---|---|
| FSOL | 37.50% | |
| FBTC | 12.50% | |
| INDA | 7.50% | |
| SLV | 7.50% | |
| XLK | 6.25% | |
| REMX | 3.75% | |
| BOTZ | 3.75% | |
| MOO | 3.75% | |
| PICK | 3.75% | |
| SMH | 2.50% | |
| PAVE | 2.50% | |
| XAR | 2.50% | |
| ITA | 2.50% | |
| URA | 1.25% | |
| FCG | 1.25% | |
| XLU | 1.25% |
Macro Regime — Goldilocks
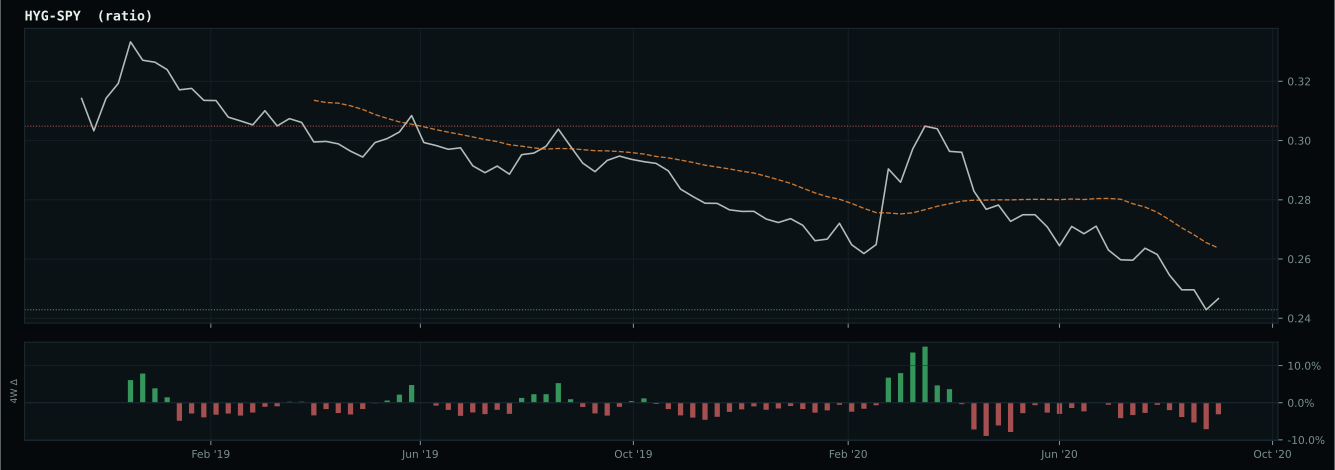
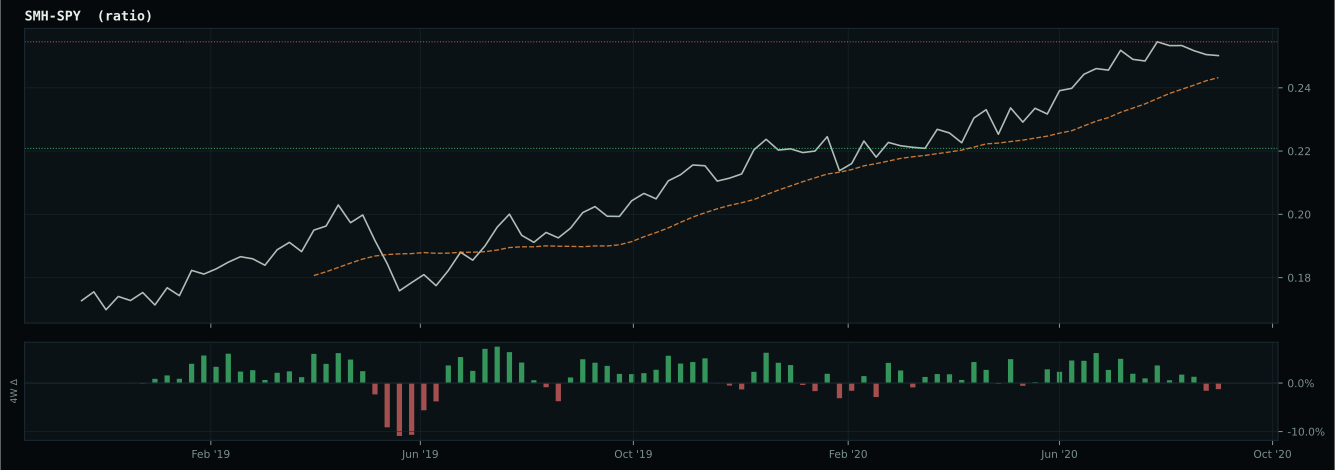
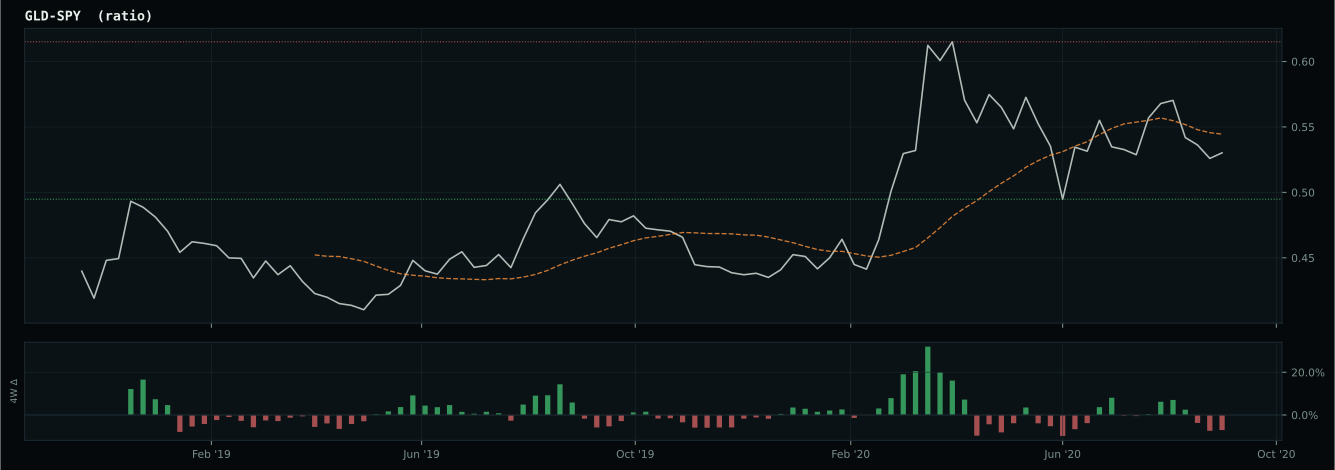
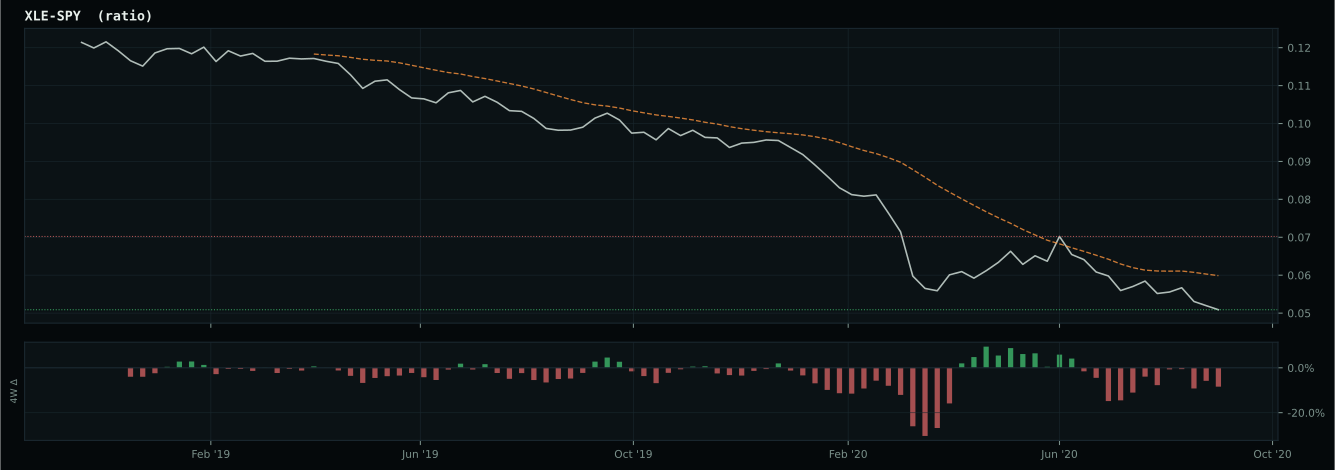
Macro Evidence Charts
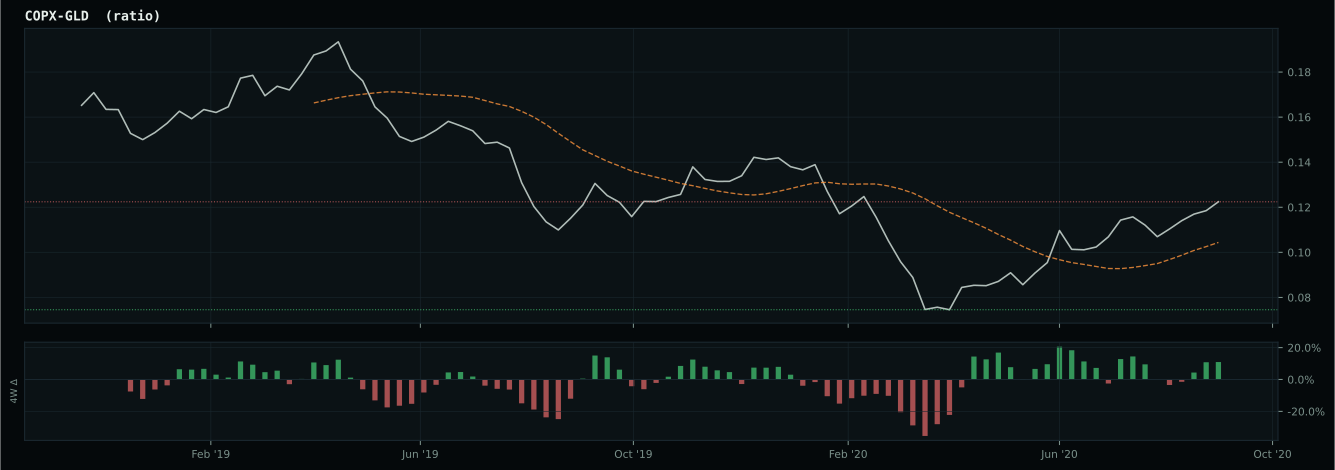
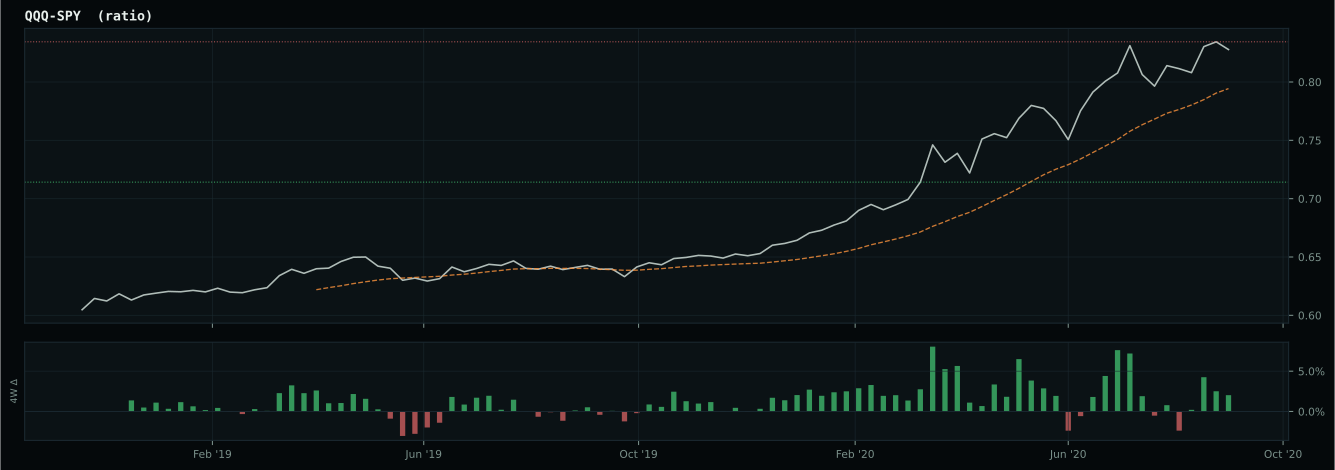
Market-implied signals behind the macro regime scores. Each ratio compares two assets; the direction and slope of the ratio is what the macro engine reads.
Crypto Regime — AltSeason
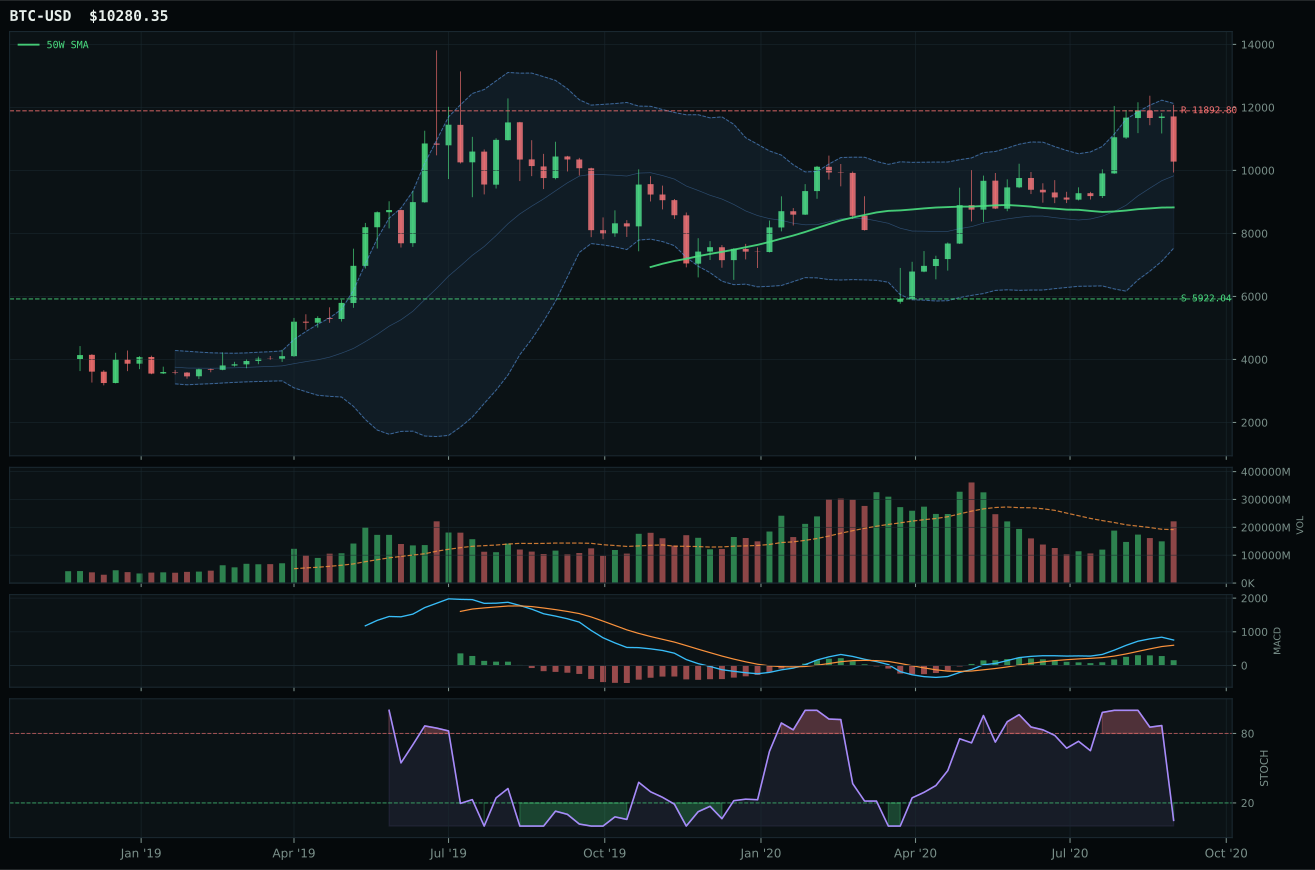
post-touch structure is too wide to count as a range; max/min close ratio is 2.21
TrendBTC confirmed: 2 consecutive closes above rising/flat 50W SMA
all available AltSeason conditions pass; missing optional confirmations skipped

Category Rankings
| Rank | Category | Winner | Score | Alloc | 4W Ret | Peers (4W) |
|---|---|---|---|---|---|---|
| 1 | Precious Metals | SLV | 67.7 | 20% | -8.67% | GLD -0.3% · GDX -1.3% |
| 2 | Emerging Markets | INDA | 61.6 | 20% | +4.54% | IEMG +1.5% · ILF -5.6% |
| 3 | Technology | XLK | 55.2 | 10% | +1.87% | IGV +5.6% · CIBR +4.1% |
| 4 | Industrial Metals | PICK | 53.5 | 10% | -2.76% | COPX -5.4% · REMX -5.0% |
| 5 | AI | SMH | 47.4 | 10% | +6.06% | AIQ +4.3% · BOTZ +6.0% |
| 6 | Agriculture & Livestock | MOO | 37.1 | 10% | -0.01% | WEAT +4.2% · VEGI +2.3% |
| 7 | Defense & Aerospace | ITA | 34.5 | 10% | -1.85% | XAR +1.1% · ROKT +3.2% |
| 8 | Utilities & Infrastructure | XLU | 33.9 | 10% | +2.39% | PAVE +1.4% · IGF -0.5% |
| 9 | Nuclear Energy | URNM | 32.8 | 0% | -9.66% | URA -7.5% · NLR +3.8% |
| 10 | Traditional Energy | XLE | — | 0% | -13.56% | XOP -11.9% · FCG -12.7% |
Precious Metals — SLV
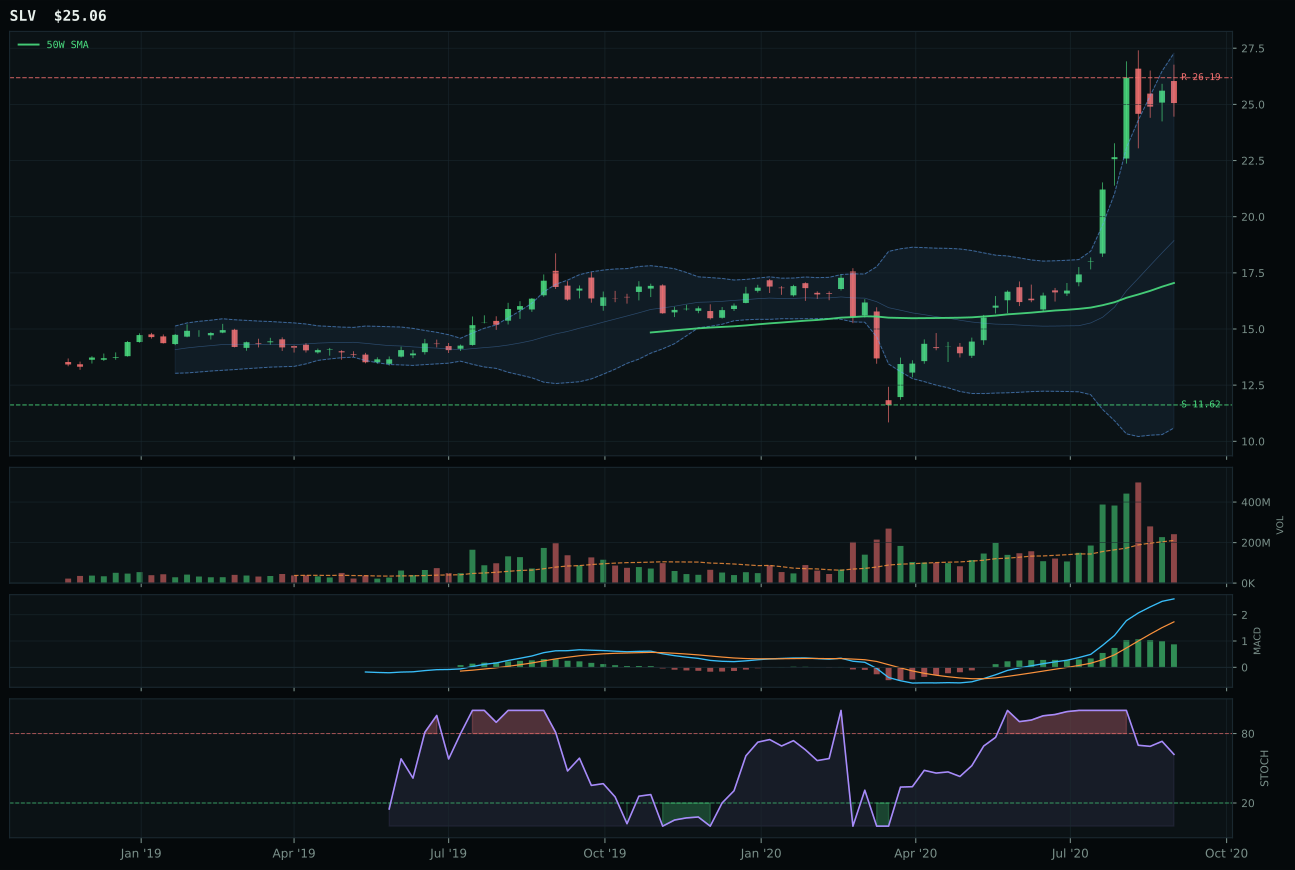
SLV has a vertical extension profile with 47.4% 13-week relative strength versus SPY.
A failed hold above support would weaken the setup.
Actionable but governed by invalidation levels.
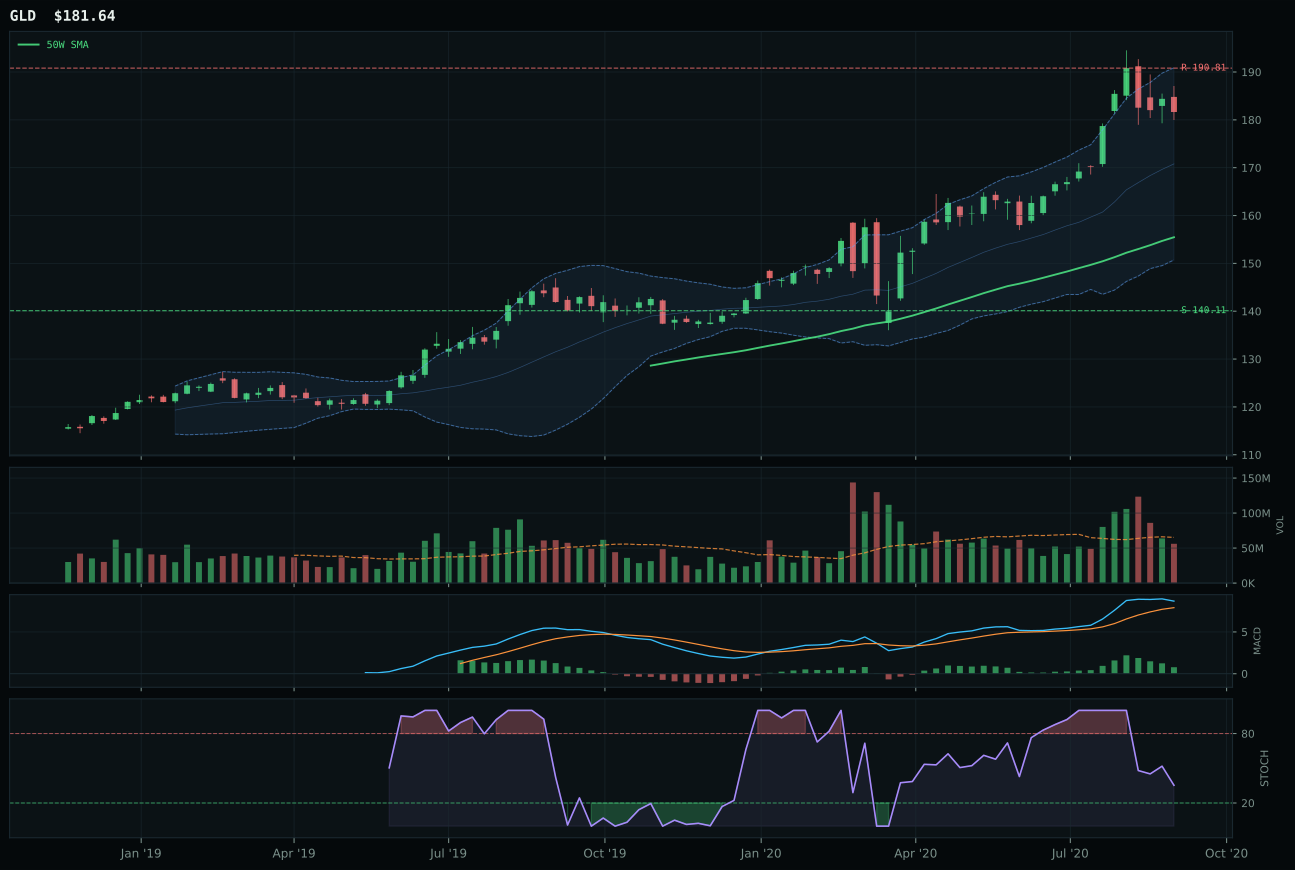
GLD has a vertical extension profile with 7.7% 13-week relative strength versus SPY.
A failed hold above support would weaken the setup.
Actionable but governed by invalidation levels.
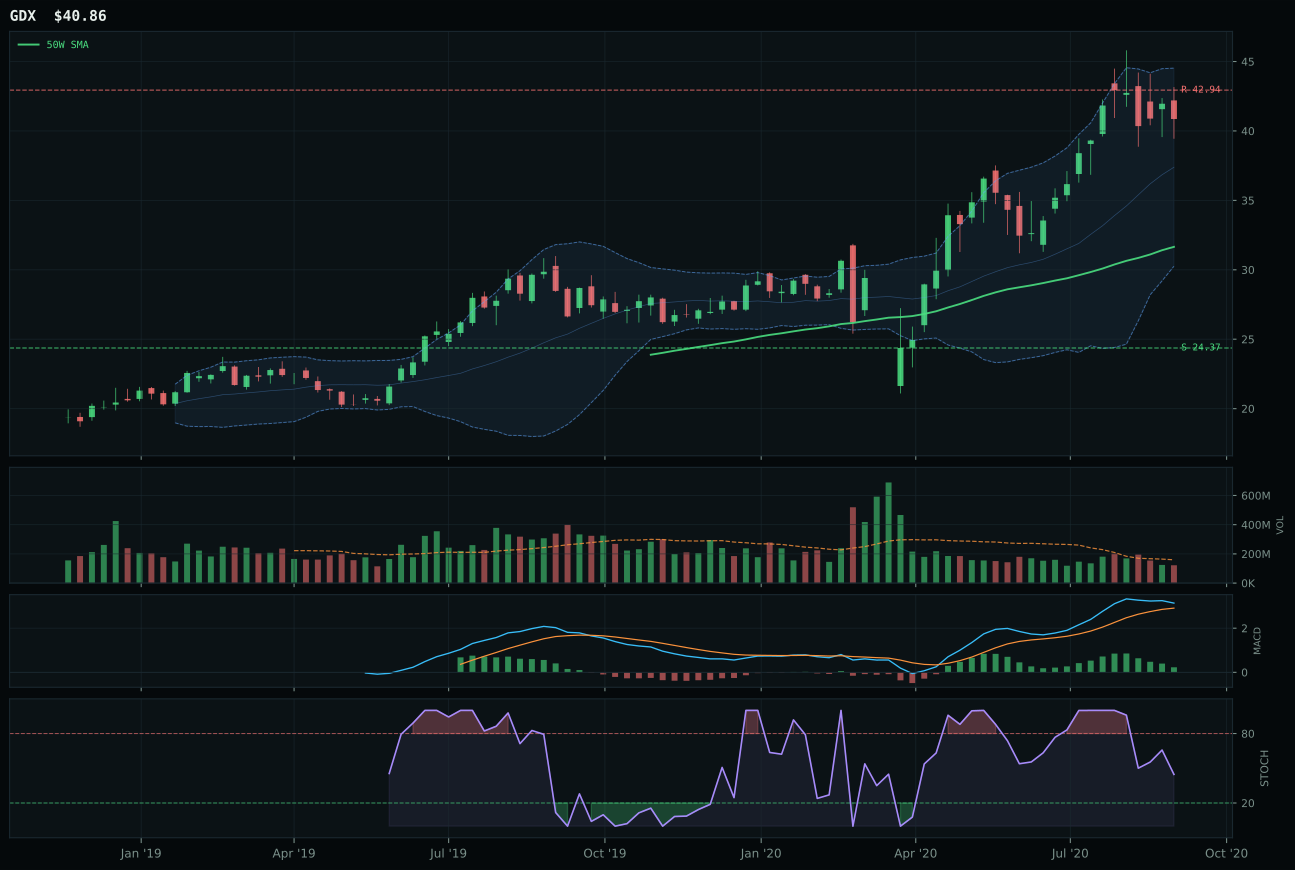
GDX has a vertical extension profile with 18.6% 13-week relative strength versus SPY.
A failed hold above support would weaken the setup.
Actionable but governed by invalidation levels.
SLV dominates Precious Metals with a 100.0 momentum confirmation score that reflects a stunning 54.7% 13-week return and 47.4% outperformance versus SPY—numbers that matter because they're paired with volume confirmation and category-relative strength of 28.8%. The silver ETF sits 47.0% above its 50-week and qualifies as a vertical-extension setup, yet its volume at 1.15x 20-week average shows accumulation rather than distribution, and MACD remains bullish. GLD, the runner-up, printed a cleaner structure score (79.6 versus 80.6) and better macro fit (68.0 versus 64.0) because gold's monetary-hedge narrative is stronger, but it trails dramatically on technical energy: GLD's 13-week return is only 15.0% with SPY relative strength of just 7.7%, and category-relative strength is minus 10.9%. The 0.9-point gap between them masks a fundamental divergence: SLV is the momentum leader, GLD is the narrative anchor.
Precious Metals earns top-2 status at 10% allocation because its 67.7 category score ranks second among all ten categories, and the setup combines the strongest momentum profile (SLV's 100 confirmation score) with active macro sponsorship. Monetary-hedge bid is live (+14), metals scarcity is active (+7), and both feed a category-level macro fit of 66.0—substantially stronger than Emerging Markets' 70.0. The risk is obvious: SLV trades only 4.3% below resistance while sitting 115.7% above support, which means the entire position lives on a technical knife-edge. If silver breaks below its 50-week support at 11.62, the unwind could be violent. The portfolio holds this overweight because the reward (continued precious-metals outperformance in a disinflation regime) justifies the entry risk given near-term momentum confirmation.
Emerging Markets — INDA
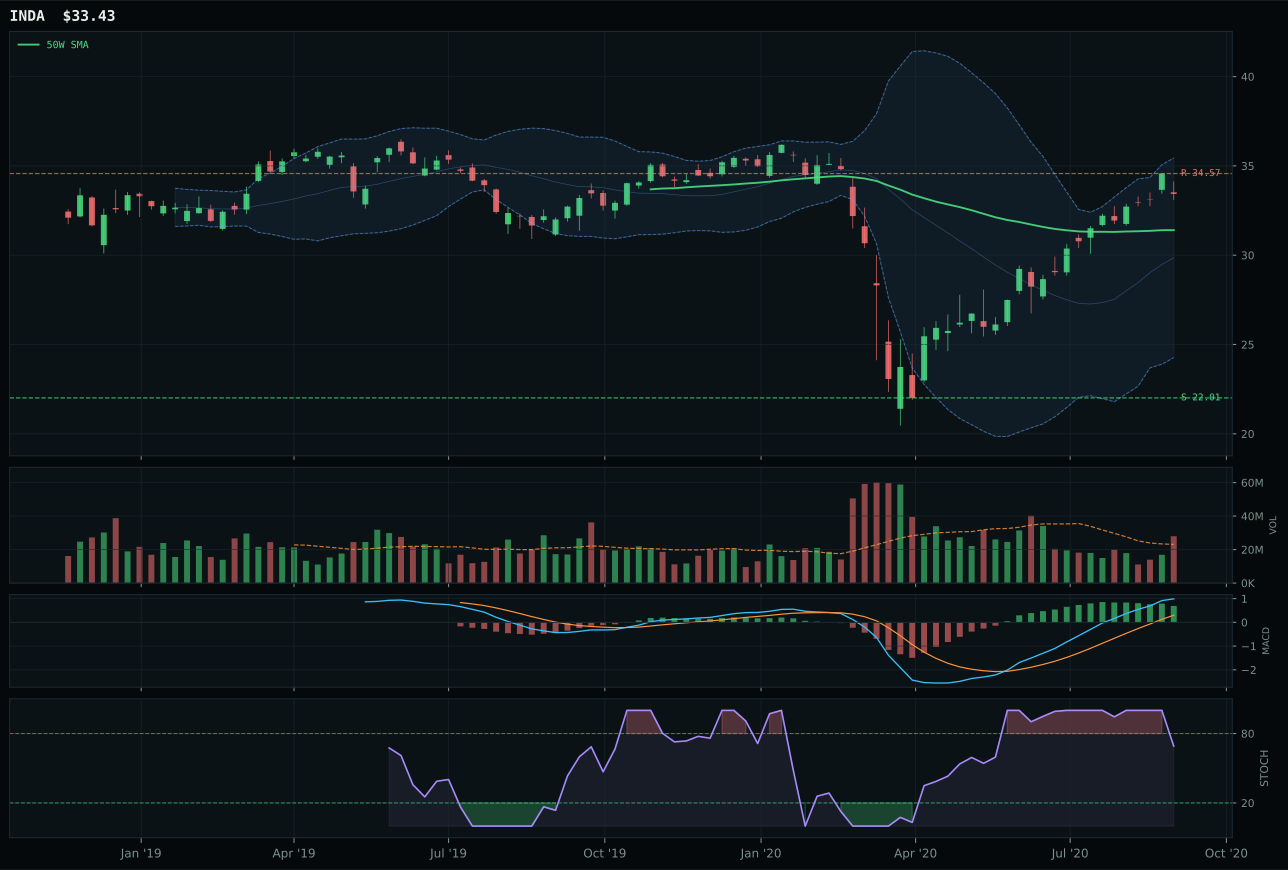
INDA has a neutral structure profile with 7.1% 13-week relative strength versus SPY.
A failed hold above support would weaken the setup.
Actionable but governed by invalidation levels.
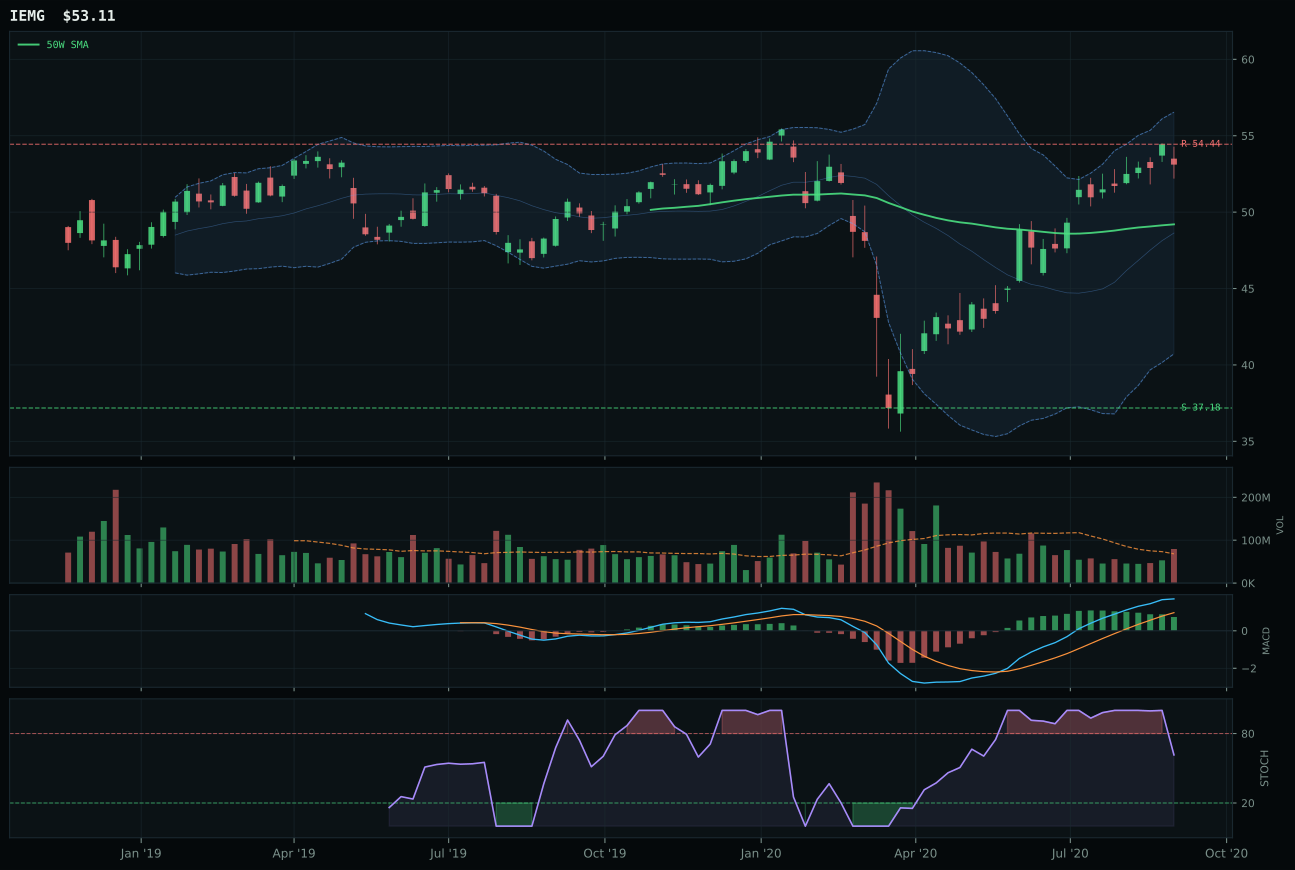
IEMG has a neutral structure profile with 1.5% 13-week relative strength versus SPY.
A failed hold above support would weaken the setup.
Actionable but governed by invalidation levels.
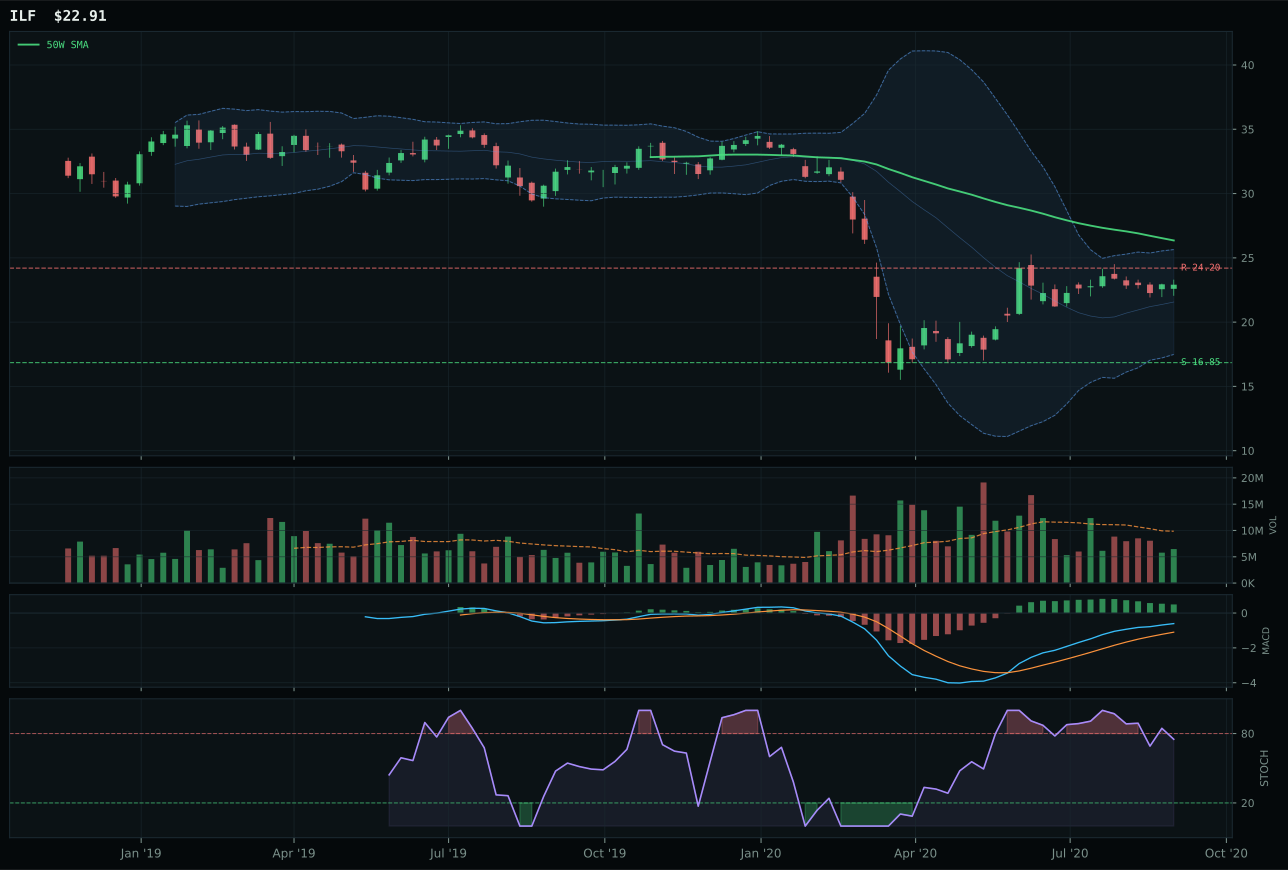
ILF has a neutral structure profile with -12.6% 13-week relative strength versus SPY.
Extension and support failure are the main tactical risks.
Tracked, but not top-2 eligible because: structurally broken.
INDA won Emerging Markets by delivering the highest technical evidence score in the entire portfolio at 84.9, combining perfect trend (100.0) with 98.3 momentum confirmation and 83.7 volume-price confirmation. India's quality-growth ETF sits only 6.5% above its 50-week moving average—a sweet spot between confirmed uptrend and low entry risk—with 14.4% 13-week return and 7.1% SPY relative strength. Its 84.4 structure score reflects compression and cleanliness that neither IEMG nor ILF can match, and its stochastic RSI remains falling-neutral at 0.69, signaling room for sustained appreciation. IEMG lost because its structure is less clean (79.3 versus 84.4), and category-relative strength printed zero versus INDA's 5.6%; both measures suggest INDA is capturing flows that broader emerging-market indices are missing.
Emerging Markets earns top-2 status at 10% allocation because its 61.6 category score ranks second-highest, and INDA's technical evidence (84.9) is the strongest ETF profile across all ten categories. EM liquidity support is active (+14), risk appetite positive is active (+8), and the Goldilocks macro regime adds +8, creating a 70.0 category-level macro fit. The category's only headwind is credit stress (-10), but it is outweighed by the convergence of India's structural growth story and near-term technical momentum. INDA's setup is conservative relative to the precious-metals overweight: price sits only 3.3% below resistance and 51.9% above support, offering balanced risk-reward. The allocation reflects confidence that emerging-market flows will sustain in a low-volatility macro environment where developed-market valuations remain full.
Technology — XLK
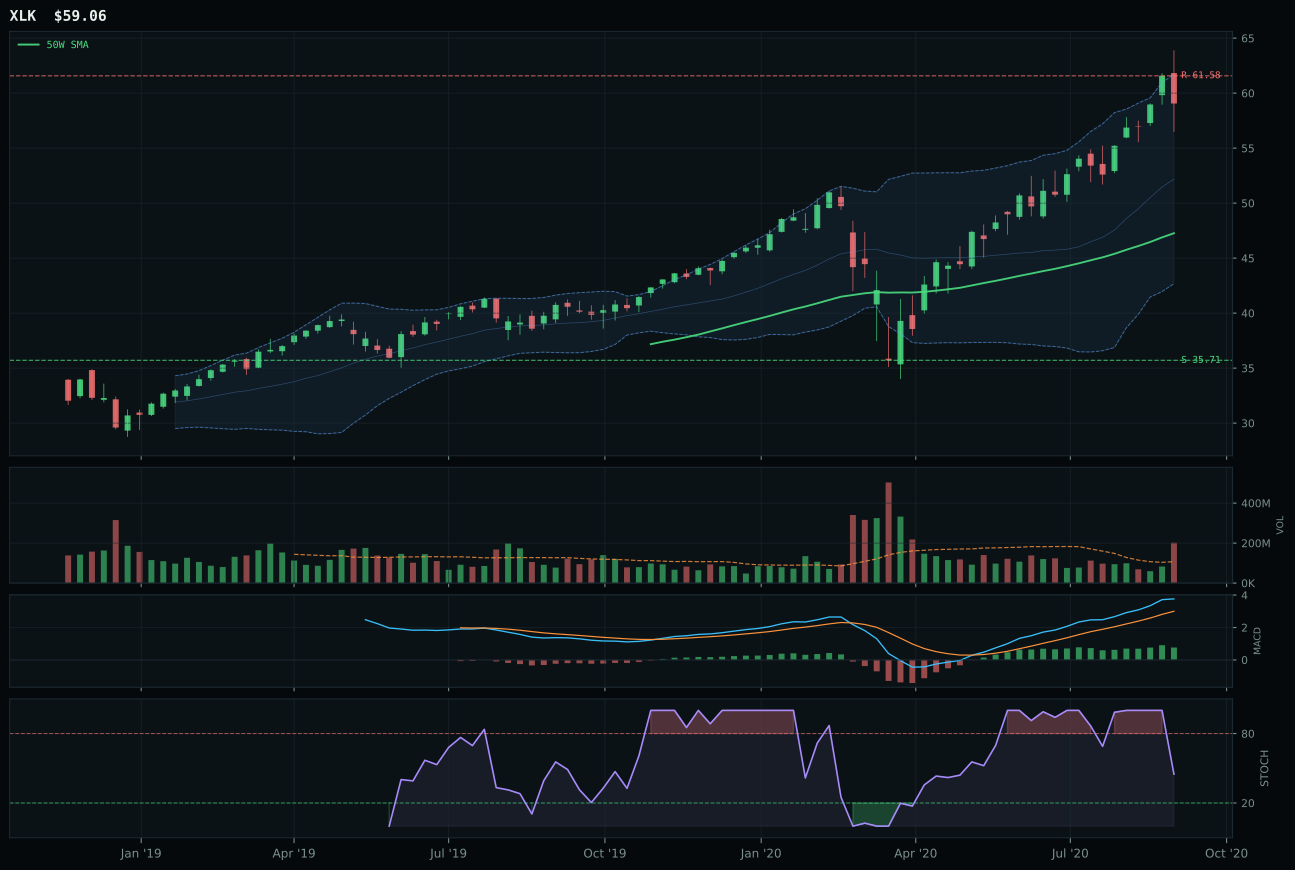
XLK has a vertical extension profile with 9.2% 13-week relative strength versus SPY.
A failed hold above support would weaken the setup.
Actionable but governed by invalidation levels.
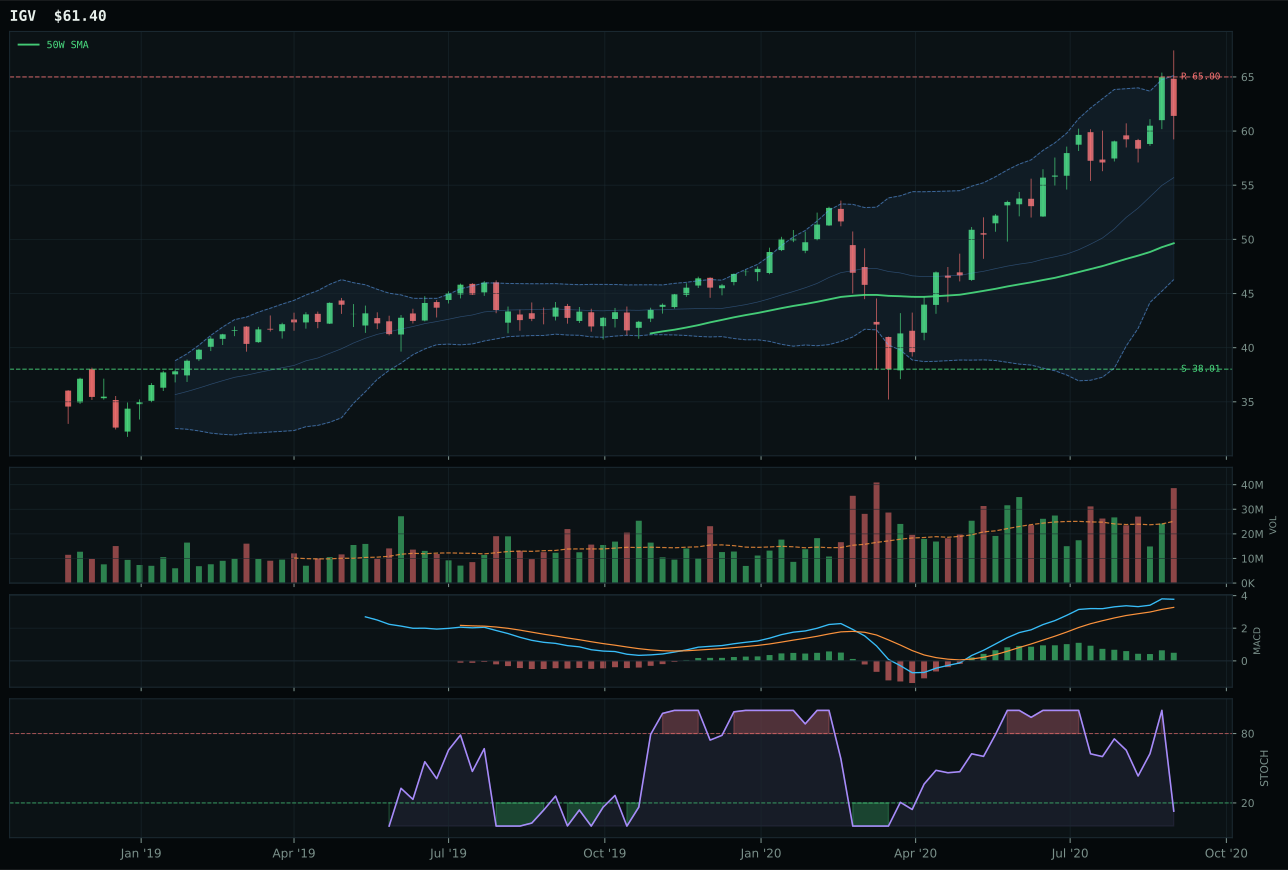
IGV has a vertical extension profile with 6.9% 13-week relative strength versus SPY.
A failed hold above support would weaken the setup.
Actionable but governed by invalidation levels.
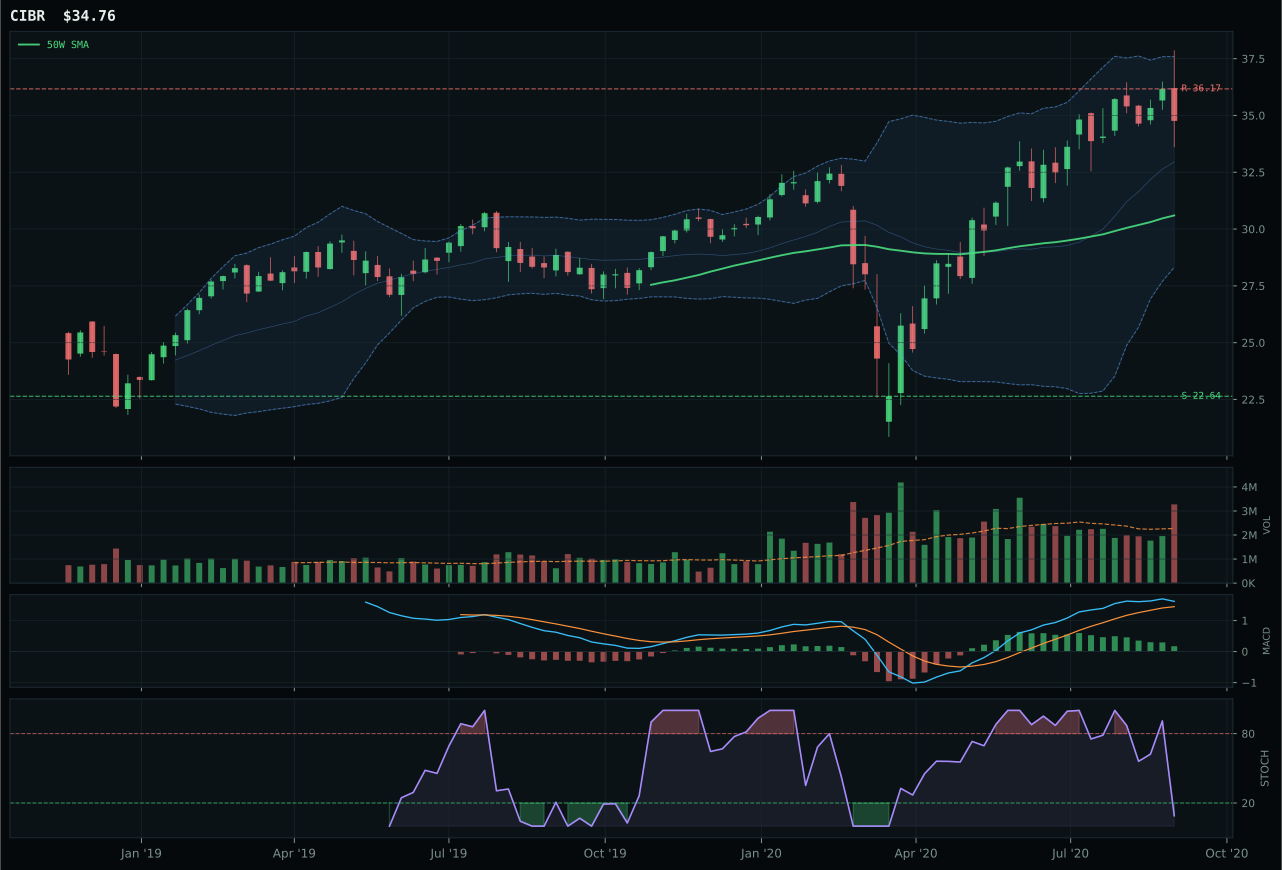
CIBR has a neutral structure profile with -1.8% 13-week relative strength versus SPY.
A failed hold above support would weaken the setup.
Actionable but governed by invalidation levels.
XLK won the technology category by delivering the cleanest momentum confirmation among its peers. The ETF sits 24.9% above its 50-week moving average with trend and relative-strength scores both at 100 and 9.2% outperformance versus SPY—a meaningful spread that tells you accumulation is happening despite the vertical extension. Its MACD is bullish and improving while stochastic RSI remains neutral, a rare combination that suggests early-stage momentum rather than exhaustion. IGV, the runner-up, lost ground on timing (48 versus XLK's 53) because its MACD has flattened and its category-relative strength printed at zero; that stalled momentum matters when both charts are extended and both carry entry risk.
Technology earns 5% allocation as a tier-2 category, held back by the same extension that makes XLK attractive. The Goldilocks regime and active AI growth sponsorship (+6) support the category, but the setup is structurally late—every buyer at current prices is stepping into a 24.9% lift from the 50-week average, which compresses the risk-reward to 38.1 on the upside and 65.4% downside. The category scored 55.2 overall, which ranked it below the two overweight categories (Precious Metals and Emerging Markets) and below Industrial Metals. To graduate to top-2 status, XLK would need either a pullback to reset entry risk or a fundamental widening of its relative-strength lead over the rest of the tech basket—neither present this week.
Industrial Metals — PICK
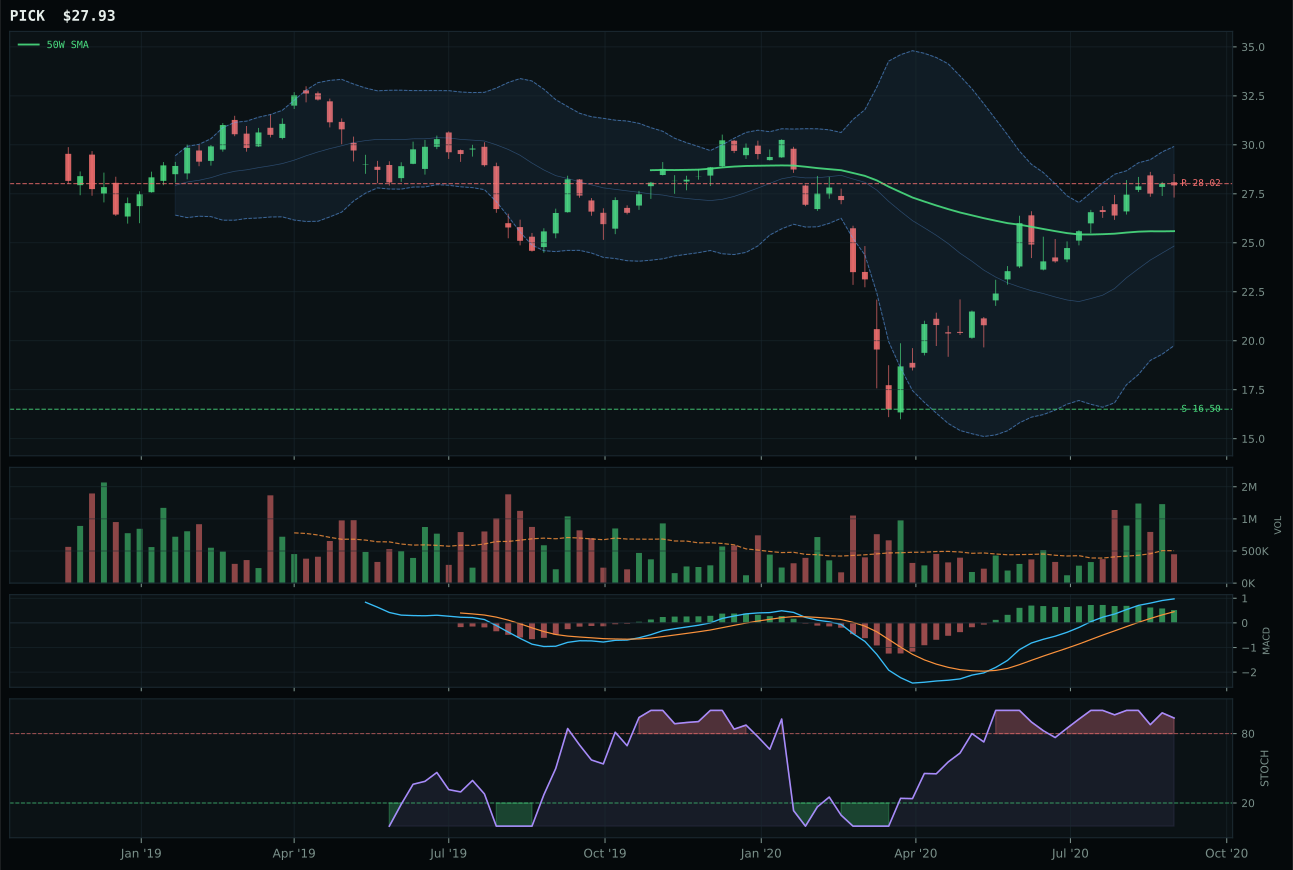
PICK has a neutral structure profile with 0.1% 13-week relative strength versus SPY.
A failed hold above support would weaken the setup.
Actionable but governed by invalidation levels.
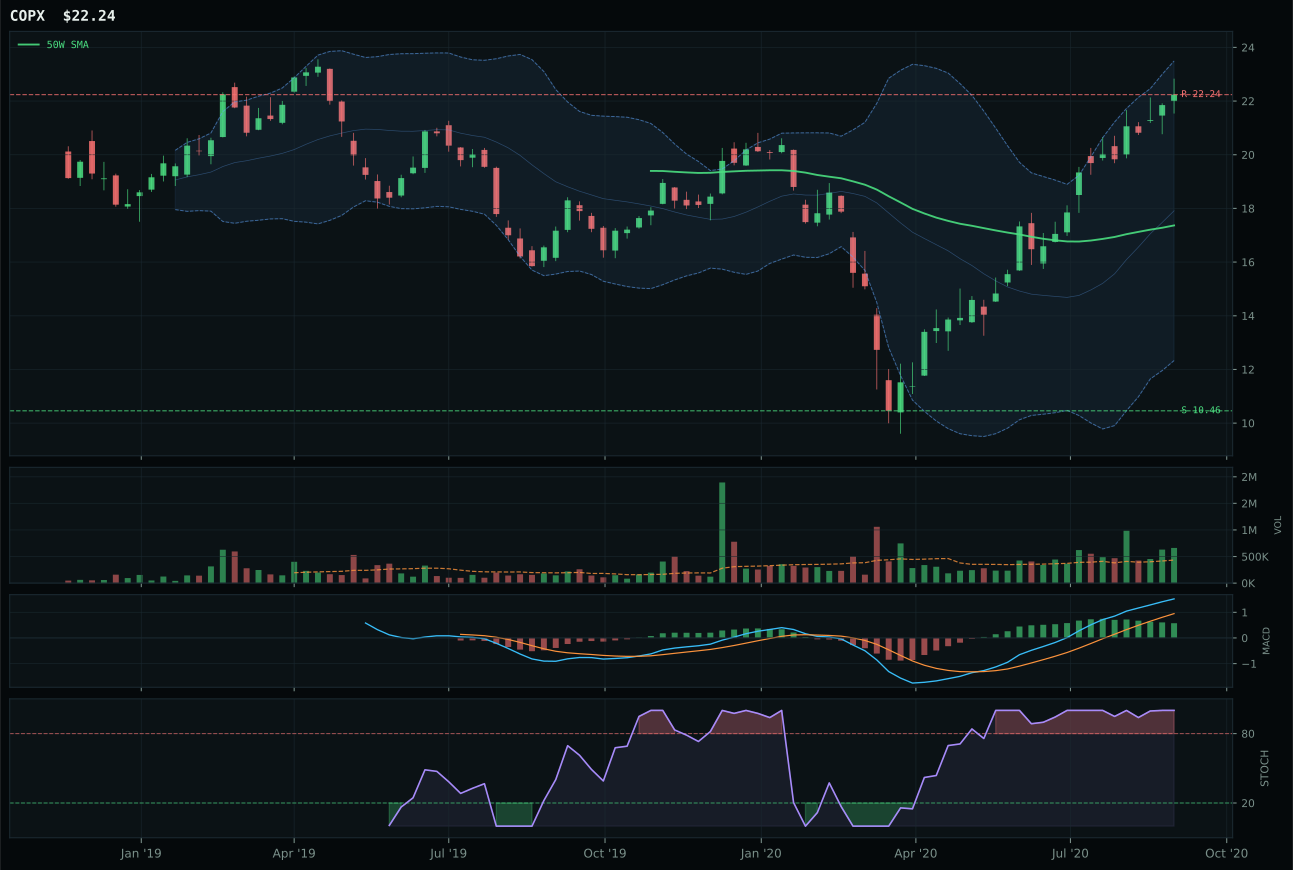
COPX has a vertical extension profile with 21.1% 13-week relative strength versus SPY.
A failed hold above support would weaken the setup.
Tracked, but not top-2 eligible because: .
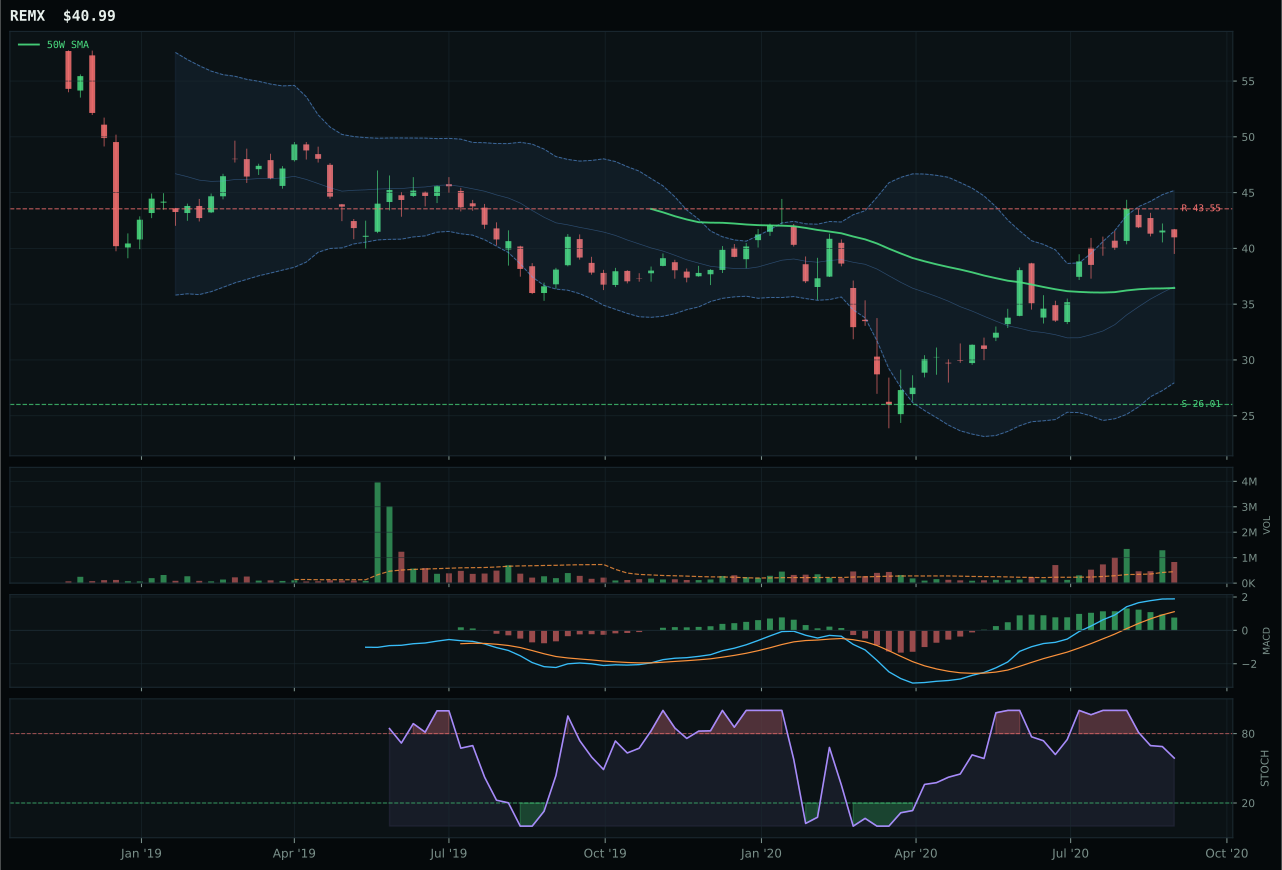
REMX has a neutral structure profile with 0.5% 13-week relative strength versus SPY.
A failed hold above support would weaken the setup.
Actionable but governed by invalidation levels.
PICK won Industrial Metals by offering a reset setup rather than chasing momentum. The ETF sits 9.1% above the 50-week—close enough to the moving average to imply solid technical health without the entry-risk penalty of a 40%+ extension—and its structure scores 75.8 with clean compression. MACD is bullish but flattening, and stochastic RSI sits overbought, which would normally be a red flag except that PICK's risk-reward (0.3% up to resistance, 69.3% down) gives the setup margin of safety. COPX, the runner-up, posted superior momentum (28.3% 13-week return versus PICK's 7.4%) and SPY relative strength (21.1% versus 0.1%), but it stretched to 28.1% above the 50-week, which compressed its timing score to just 32 and its risk-reward to a dangerous 43.3. When extended momentum leaders meet near-resistance, timing becomes paramount; PICK's 52 timing score beats COPX's 32 decisively.
Industrial Metals earns 5% as tier-2, supported by the strongest macro fit in the portfolio at 79.0. Metals scarcity (+14), commodity breadth positive (+10), and real-asset sponsorship (+6) all feed this category despite PICK's humble 7.4% recent return. The category's 53.5 score ranks it 5th, ahead of Defense, Agriculture, and Utilities, because the macro regime actively sponsors industrial demand. The technical setup, however, is pedestrian: PICK's 86.2 trend score looks impressive until you note it sits below the 200-week moving average, which in a mature commodity cycle often precedes pullbacks. The 5% slot is justified as a macro inflation hedge, but the position would only grow if copper (COPX's story) or industrial mining breadth confirmed a new leg of the scarcity trade with breakout volume.
AI — SMH
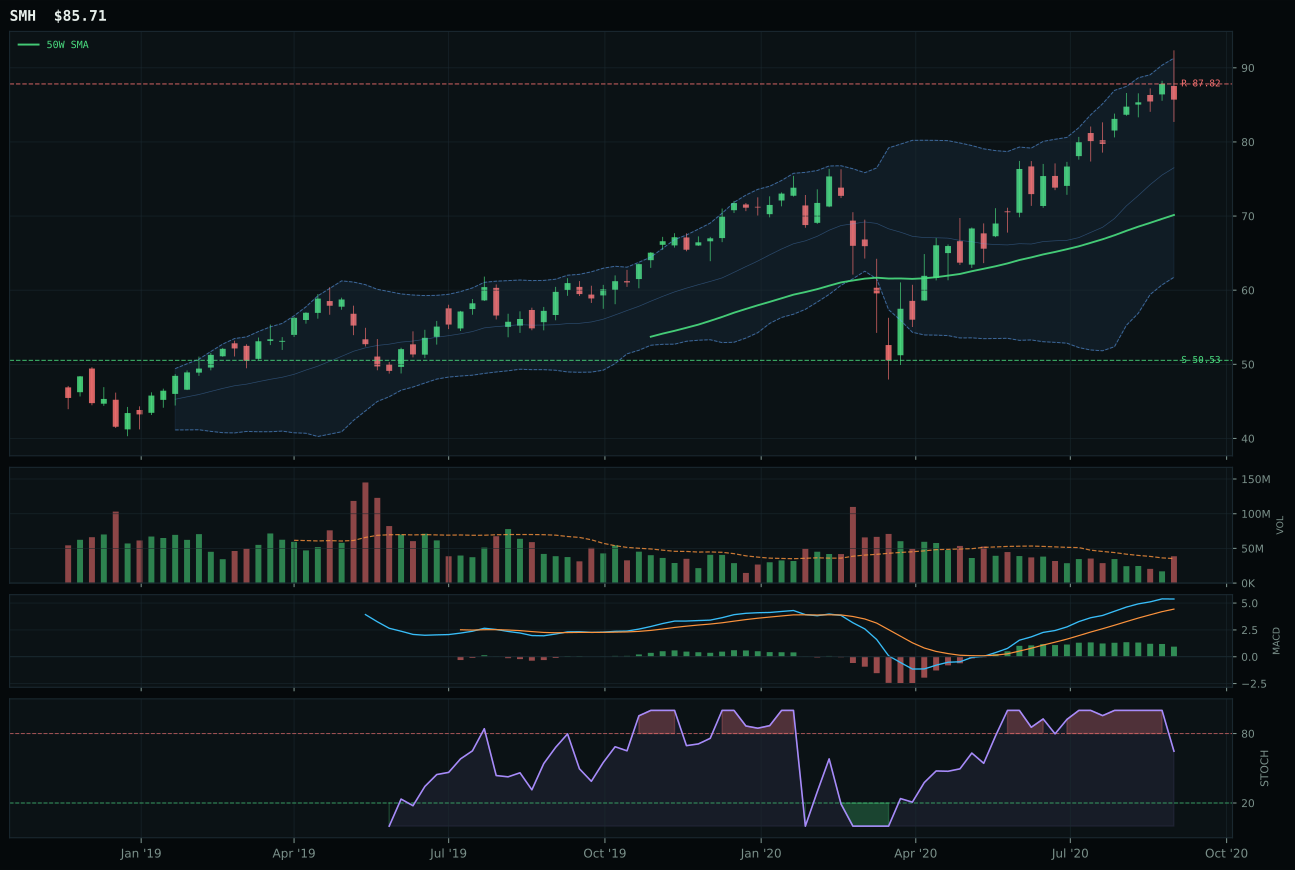
SMH has a vertical extension profile with 5.0% 13-week relative strength versus SPY.
A failed hold above support would weaken the setup.
Actionable but governed by invalidation levels.
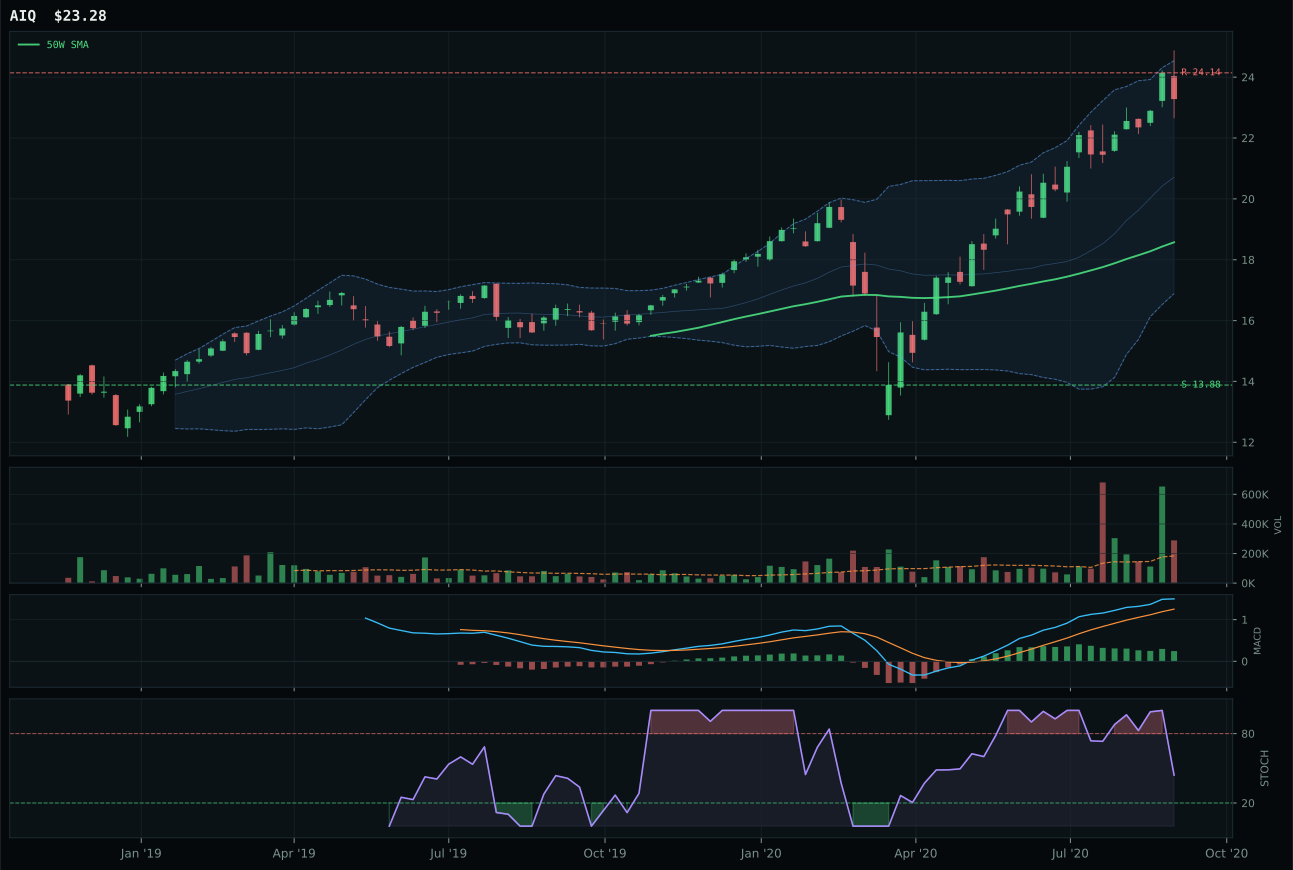
AIQ has a vertical extension profile with 7.7% 13-week relative strength versus SPY.
A failed hold above support would weaken the setup.
Tracked, but not top-2 eligible because: .
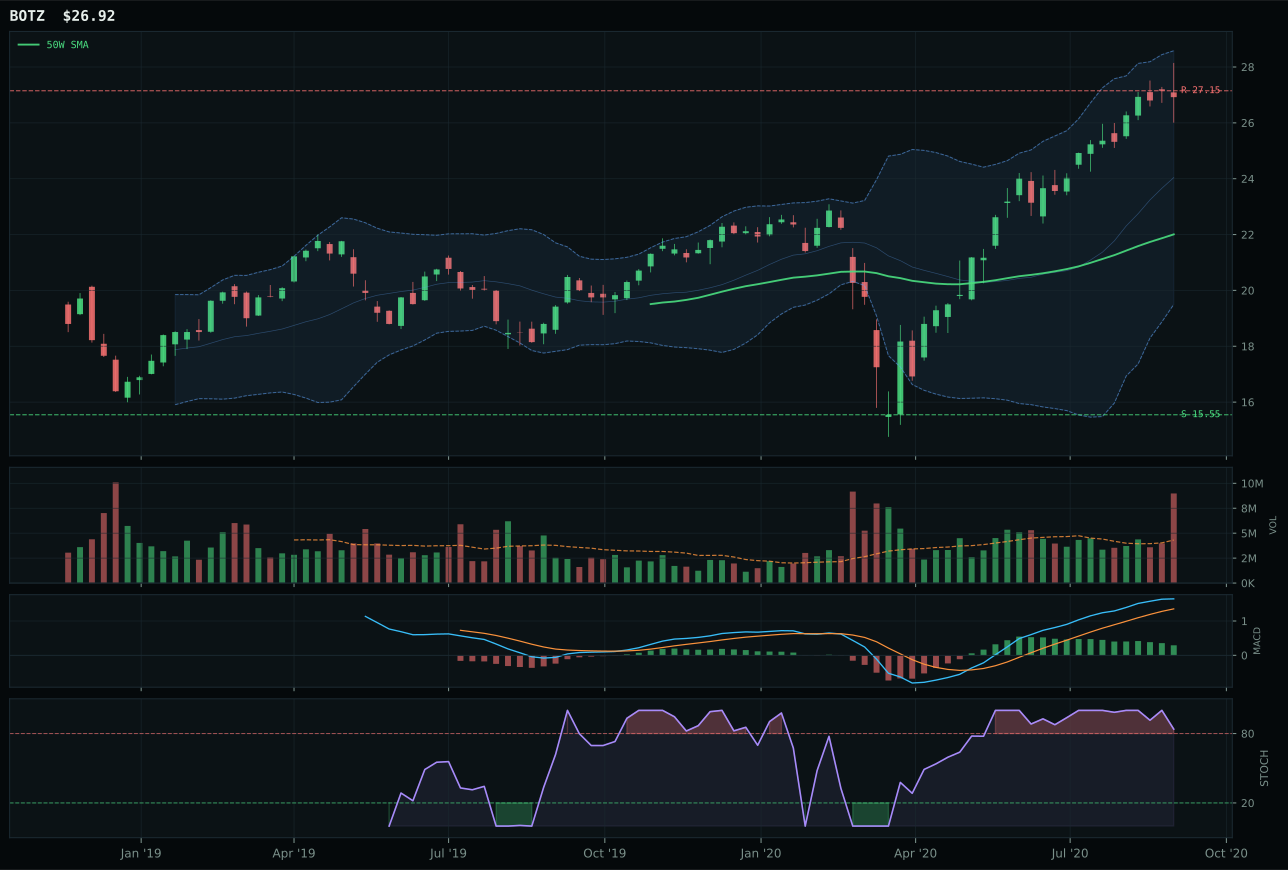
BOTZ has a vertical extension profile with 4.8% 13-week relative strength versus SPY.
A failed hold above support would weaken the setup.
Actionable but governed by invalidation levels.
SMH wins the AI category because it offers better structural hygiene than AIQ despite lower recent momentum. The semiconductor ETF's vertical extension at 22.2% above the 50-week is shorter than AIQ's chart thrust, and its volume sits at neutral rather than distribution pressure, suggesting less forced selling into strength. SMH's 77.5 structure score versus AIQ's 70.4 reflects cleaner compression, and that cleanliness translates to timing confidence (48 versus AIQ's oversold stochastic setup). AIQ actually printed a higher 13-week return (15.0% versus SMH's 12.3%) and better SPY relative strength (7.7% versus 5.0%), but those numbers arrived with distribution-pressure volume and deteriorating MACD, which the model penalizes heavily when evaluating late-stage setups.
AI earns 5% as tier-2 despite a 47.4 category score that sits below both Precious Metals (67.7) and Emerging Markets (61.6). The active AI growth sponsorship is powerful (+14), and Goldilocks accommodates risk appetite, but the category's technical evidence lags at only 60.9 on SMH—substantially weaker than the 84.9 score Emerging Markets achieved. The portfolio already holds concentrated exposure to AI semiconductors through SMH at 5%, and the risk-reward math is unfavorable: SMH trades only 2.4% below resistance while sitting 69.6% above support. The category would need either a macro shift toward growth acceleration or a technical reset (pullback to the 50-week) to justify a top-2 slot.
Agriculture & Livestock — MOO
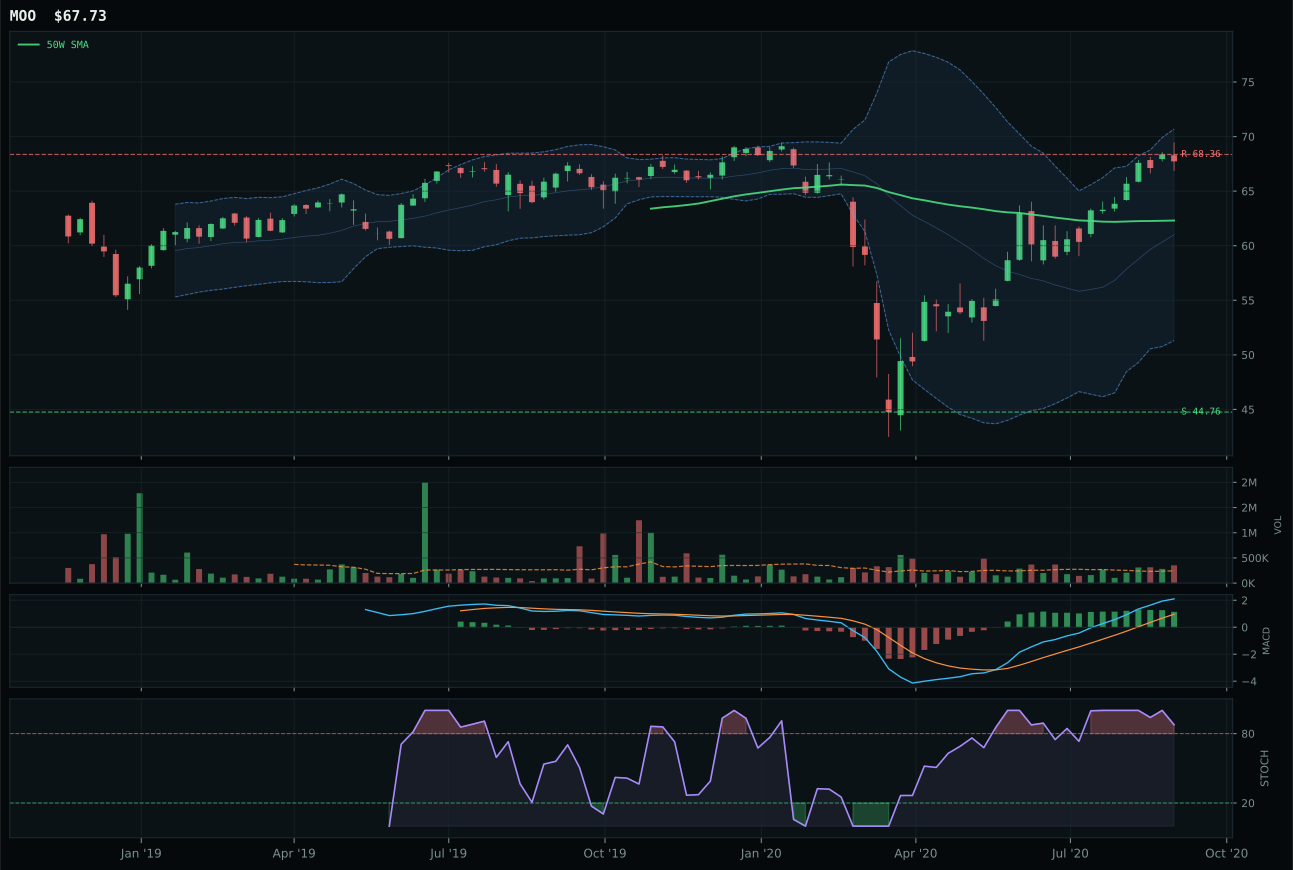
MOO has a neutral structure profile with 0.3% 13-week relative strength versus SPY.
A failed hold above support would weaken the setup.
Actionable but governed by invalidation levels.
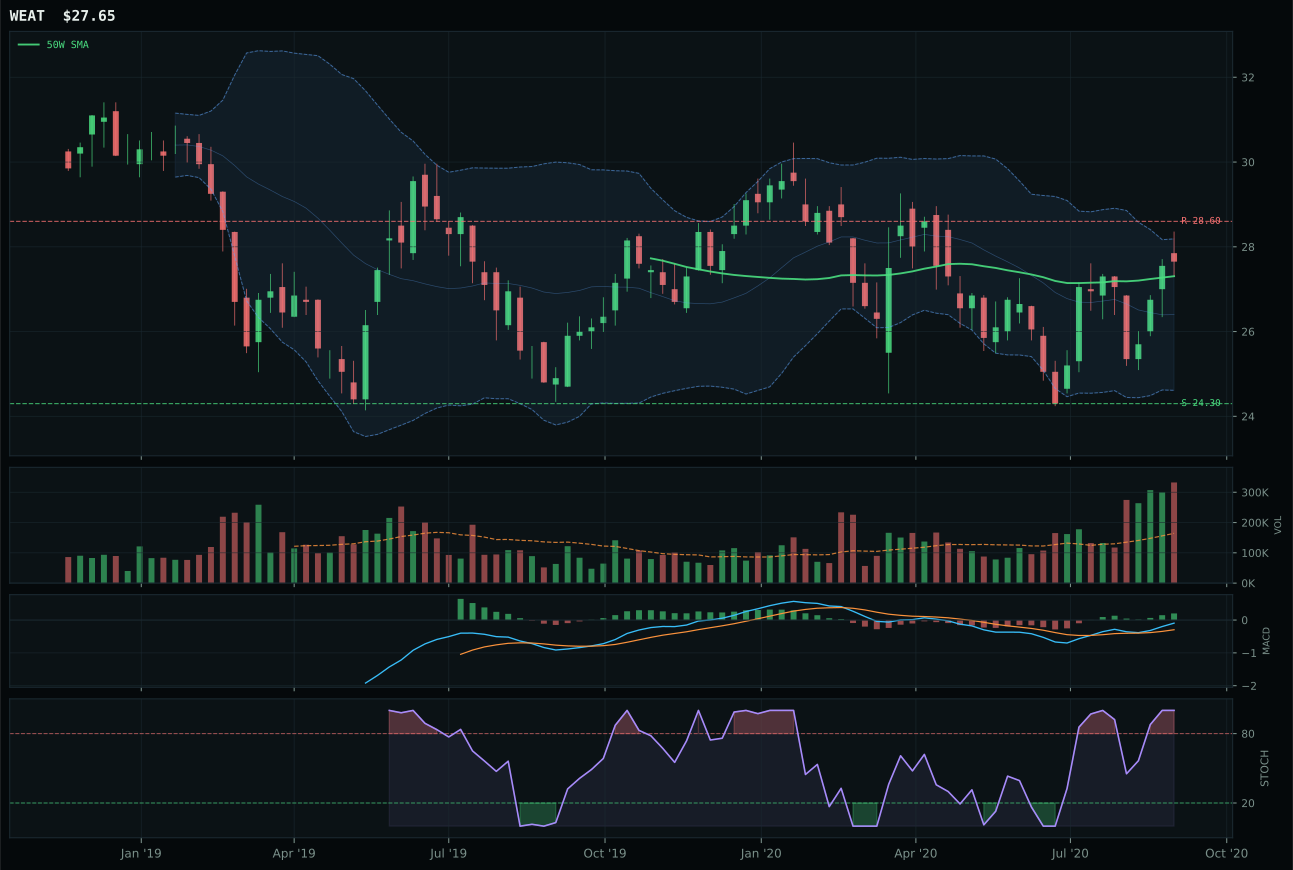
WEAT has a compression near 50W profile with -3.5% 13-week relative strength versus SPY.
A failed hold above support would weaken the setup.
Tracked, but not top-2 eligible because: .
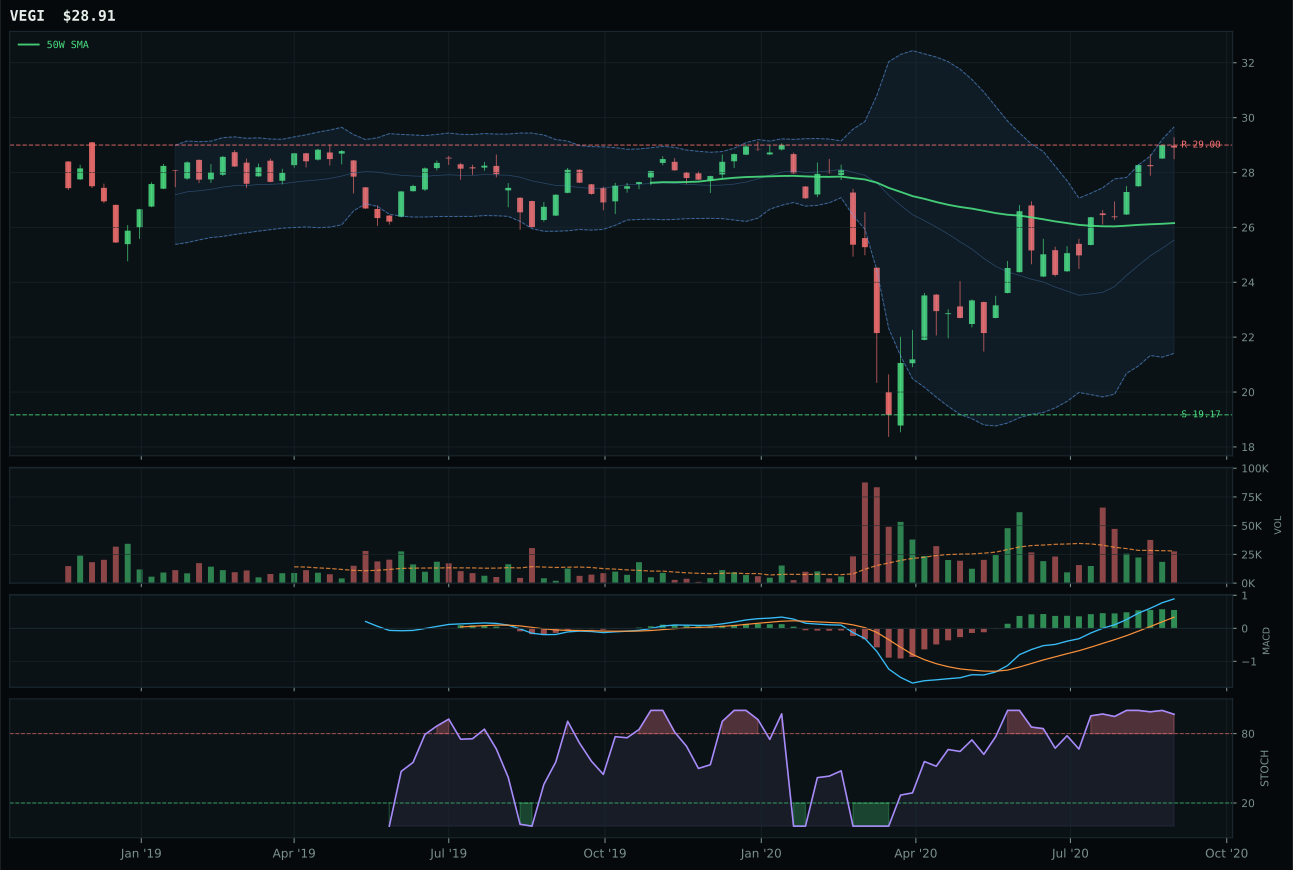
VEGI has a neutral structure profile with 1.5% 13-week relative strength versus SPY.
A failed hold above support would weaken the setup.
Tracked, but not top-2 eligible because: .
MOO won Agriculture by combining clean uptrend mechanics with neutral-to-positive breadth. Price sits 8.7% above the 50-week with trend at 96.5 and a flat 50-week slope (0.0%), meaning the advance is controlled rather than parabolic. Volume registers at 1.44x 20-week average, confirming above-average participation, and MACD remains bullish though flattening—a signal of mature but still-valid strength. WEAT, the runner-up, delivered higher timing scores (100 versus MOO's 52) because it sits near its 50-week, but it lost the category on relative strength (minus 3.8% versus MOO's 0.0%) and MACD deterioration (flattening versus improving). MOO's 13-week return of 7.6% is modest but sustained, which matters when timing is neutral and momentum confirmation scores 66.
Agriculture earns 5% as tier-2, ranking below both overweight categories and Industrial Metals despite real-asset sponsorship and positive commodity breadth. MOO's risk-reward is severely compressed: only 0.9% upside to resistance against 51.3% downside to support, which reflects the neutral-to-overbought setup. The category's 37.1 score ranks it 6th among ten, penalized by weak momentum confirmation on the winner and disinflation-pressure headwinds (-8 from the macro layer). The allocation would only expand if agriculture prices broke above resistance on volume and confirmed a new leg of the commodity cycle—neither condition is met this week.
Defense & Aerospace — ITA
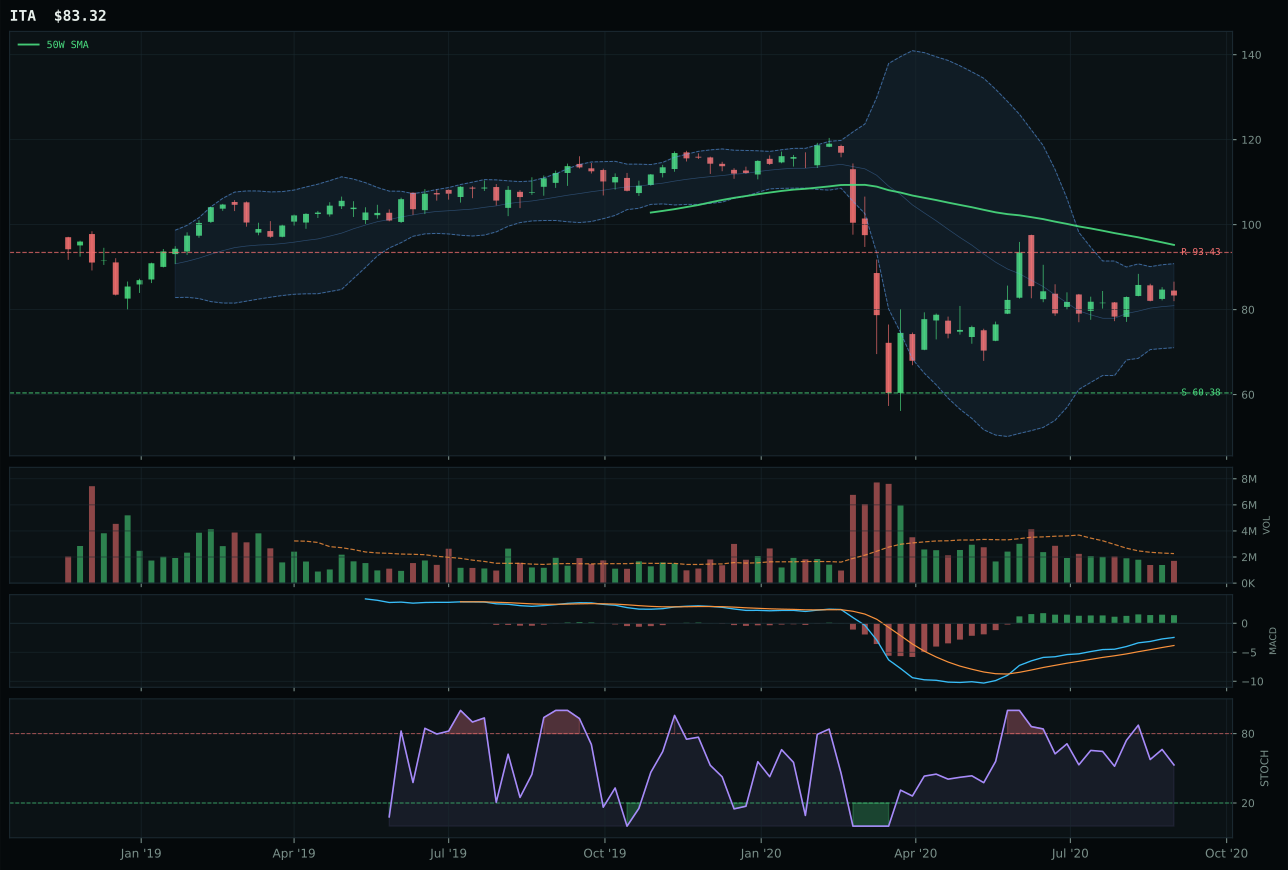
ITA has a neutral structure profile with -18.1% 13-week relative strength versus SPY.
A failed hold above support would weaken the setup.
Actionable but governed by invalidation levels.
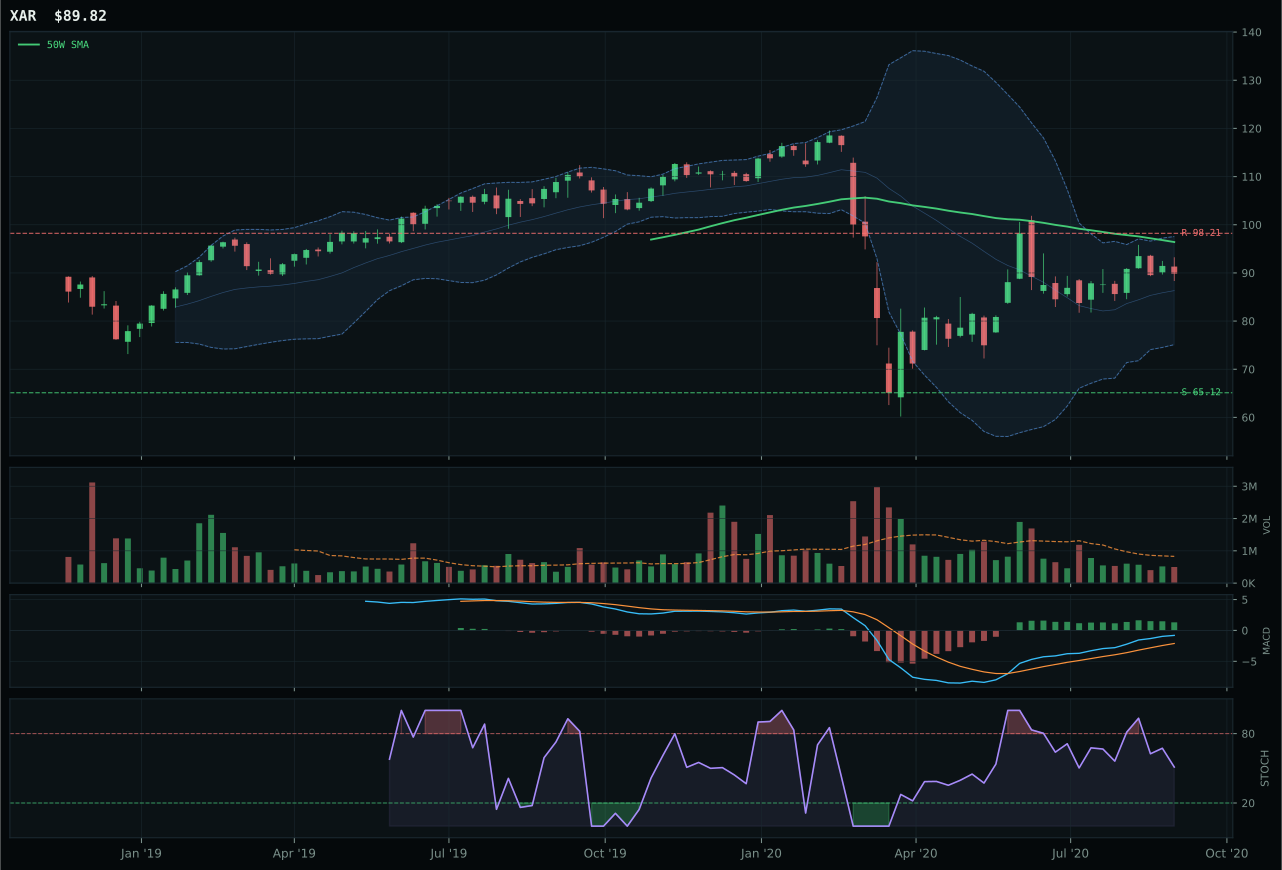
XAR has a neutral structure profile with -15.8% 13-week relative strength versus SPY.
A failed hold above support would weaken the setup.
Actionable but governed by invalidation levels.
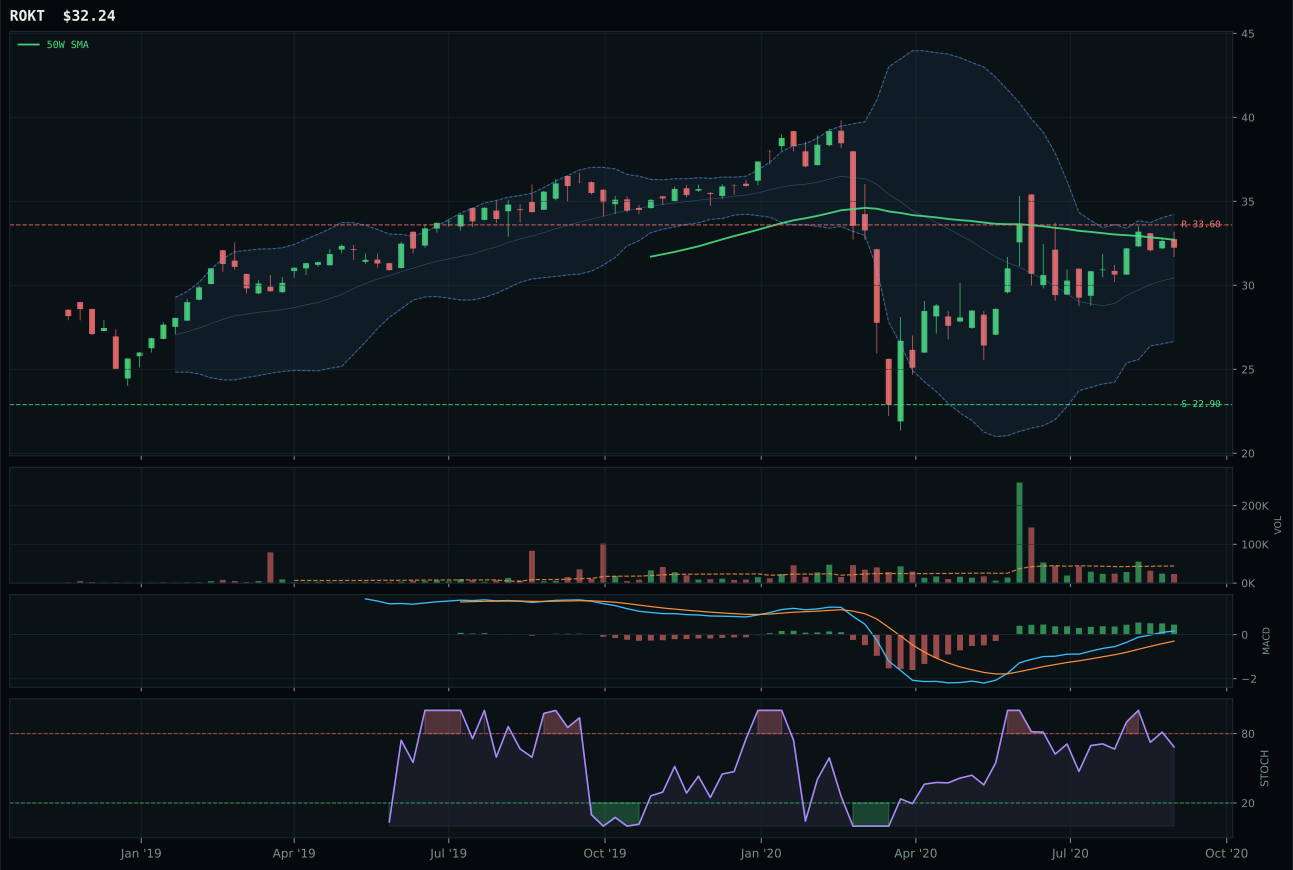
ROKT has a compression near 50W profile with -11.3% 13-week relative strength versus SPY.
A failed hold above support would weaken the setup.
Tracked, but not top-2 eligible because: .
ITA won Defense & Aerospace by default, as the entire category is structurally impaired: all three candidates sit below their 50-week moving averages with strong negative SPY relative strength (ITA down 18.1%, XAR down 15.8%). ITA's momentum confirmation scored only 18.9, and its 13-week return is minus 10.8%—yet it still beats XAR because its MACD is bullish and improving while XAR's has flattened. The score gap of minus 15.5 points between ITA and XAR is a warning flag: when even the category winner has this much structural damage, the entire sleeve is broken. ITA's only saving grace is that it sits further from the 50-week (down 12.5% versus XAR's minus 6.8%), which technically offers more upside room if support at 60.38 holds.
Defense & Aerospace receives 5% allocation as tier-2 only because the portfolio requires broad diversification; the category's 34.5 score reflects deep weakness. Its 25.8 technical evidence score on ITA is among the lowest in the portfolio, and macro conditions offer no tailwind—credit stress is the only active descriptor, and it contributes only +2. The category would need either SPY relative strength to reverse sharply or ITA's support to establish a decisive floor with volume confirmation before the sector merits a larger position. At current levels, this is purely a defensive hold pending evidence of accumulation.
Utilities & Infrastructure — XLU
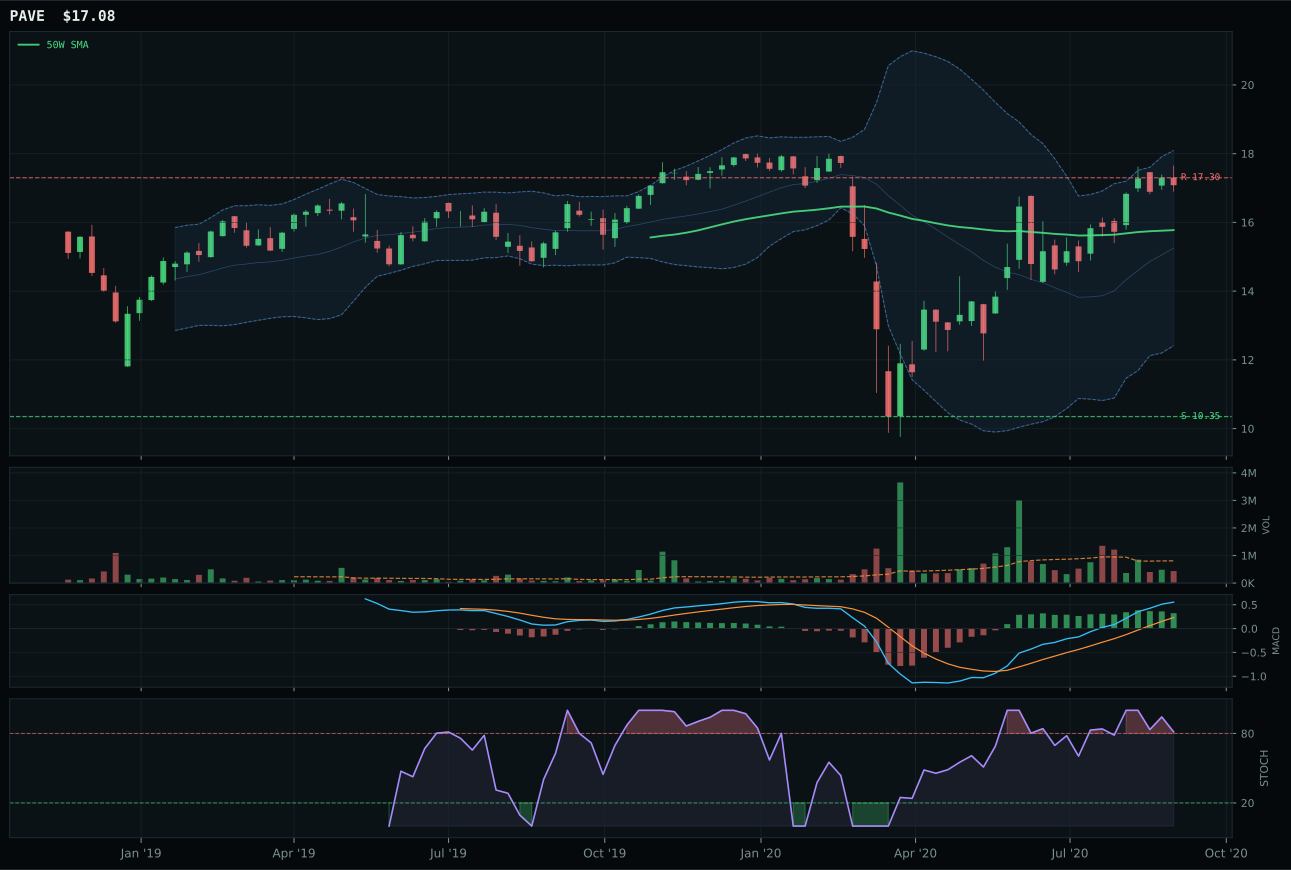
PAVE has a neutral structure profile with -3.5% 13-week relative strength versus SPY.
A failed hold above support would weaken the setup.
Actionable but governed by invalidation levels.
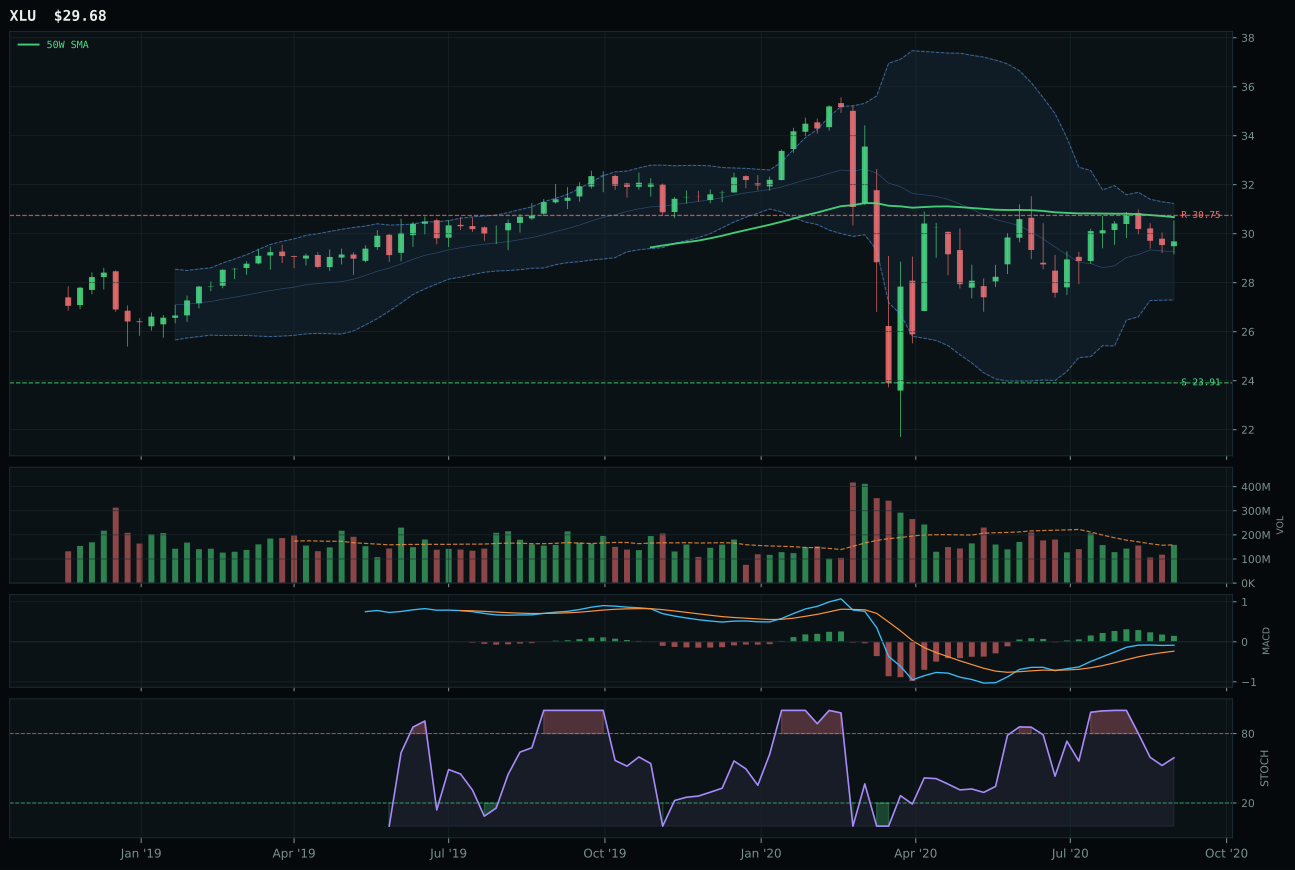
XLU has a neutral structure profile with -10.2% 13-week relative strength versus SPY.
A failed hold above support would weaken the setup.
Actionable but governed by invalidation levels.
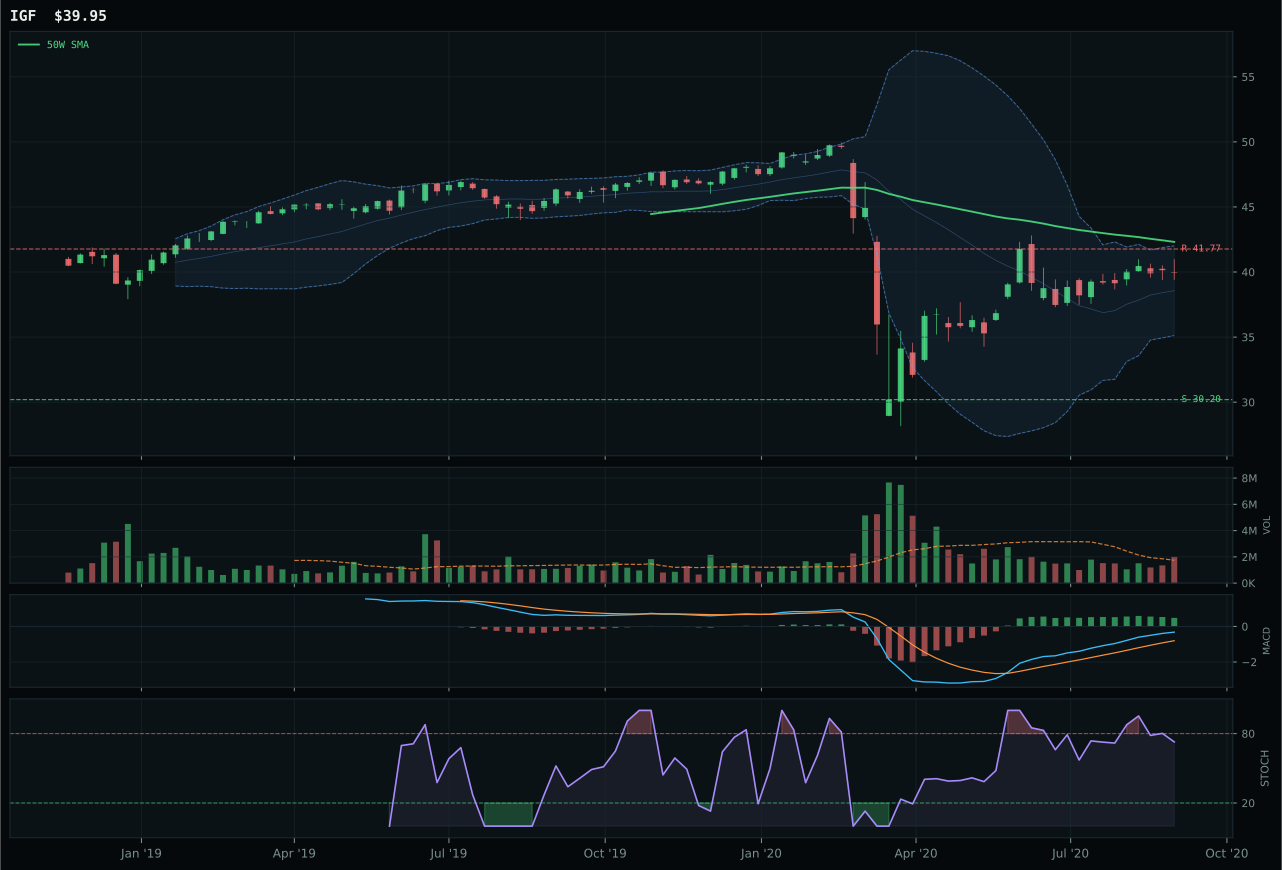
IGF has a neutral structure profile with -11.6% 13-week relative strength versus SPY.
Extension and support failure are the main tactical risks.
Tracked, but not top-2 eligible because: structurally broken.
XLU won Utilities & Infrastructure despite being down 3.0% over 13 weeks, because the category's entire framework is defensive pullback management, not momentum hunting. The utility ETF sits only 3.2% below its 50-week with a near-perfect 92.0 timing score—the highest in the category—because it occupies the decision zone near the 0.382 Fibonacci level where reversal risk is maximum. Its MACD is bullish but flattening, stochastic RSI is falling-neutral, and structure is clean (70.8), creating an ideal setup for a mean-reversion trade if risk appetite fades. PAVE, the runner-up, stretched 8.3% above the 50-week with a timing score of only 52 and stochastic RSI already overbought, which means it is extended into potential profit-taking. When utilities are the category choice, timing matters more than momentum—XLU's proximity to the moving average and its middle-zone Fibonacci placement offer a margin of safety that PAVE's extension does not.
Utilities & Infrastructure receives 5% as tier-2, ranking 7th among ten categories with a score of 33.9. The allocation is modest because XLU's technical evidence is only 48.4 and macro fit is neutral: disinflation pressure helps (+6), but risk appetite positive subtracts (-3), leaving no structural sponsorship. The category's purpose is defensive ballast, and it serves that function better when positioned near moving-average support (where XLU sits) rather than extended in momentum (where PAVE resides). The 5% slot would only expand if either broader equity weakness triggered sector rotation into utilities or inflation indicators reversed to support infrastructure capex. For now, this is a waiting position that benefits from any volatility spike without committing significant capital to a low-conviction setup.
Nuclear Energy — URNM
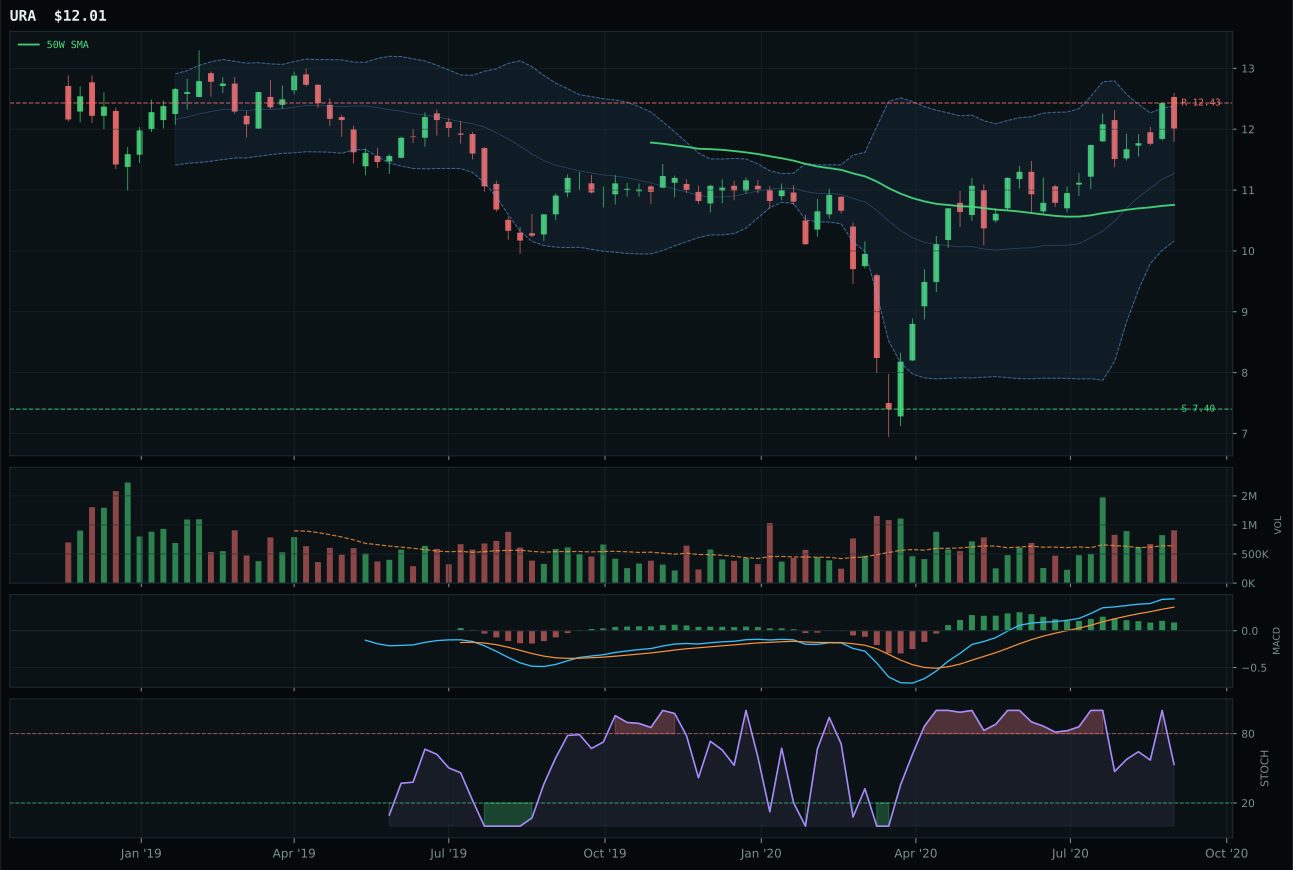
URA has a neutral structure profile with -1.0% 13-week relative strength versus SPY.
A failed hold above support would weaken the setup.
Tracked, but not top-2 eligible because: .
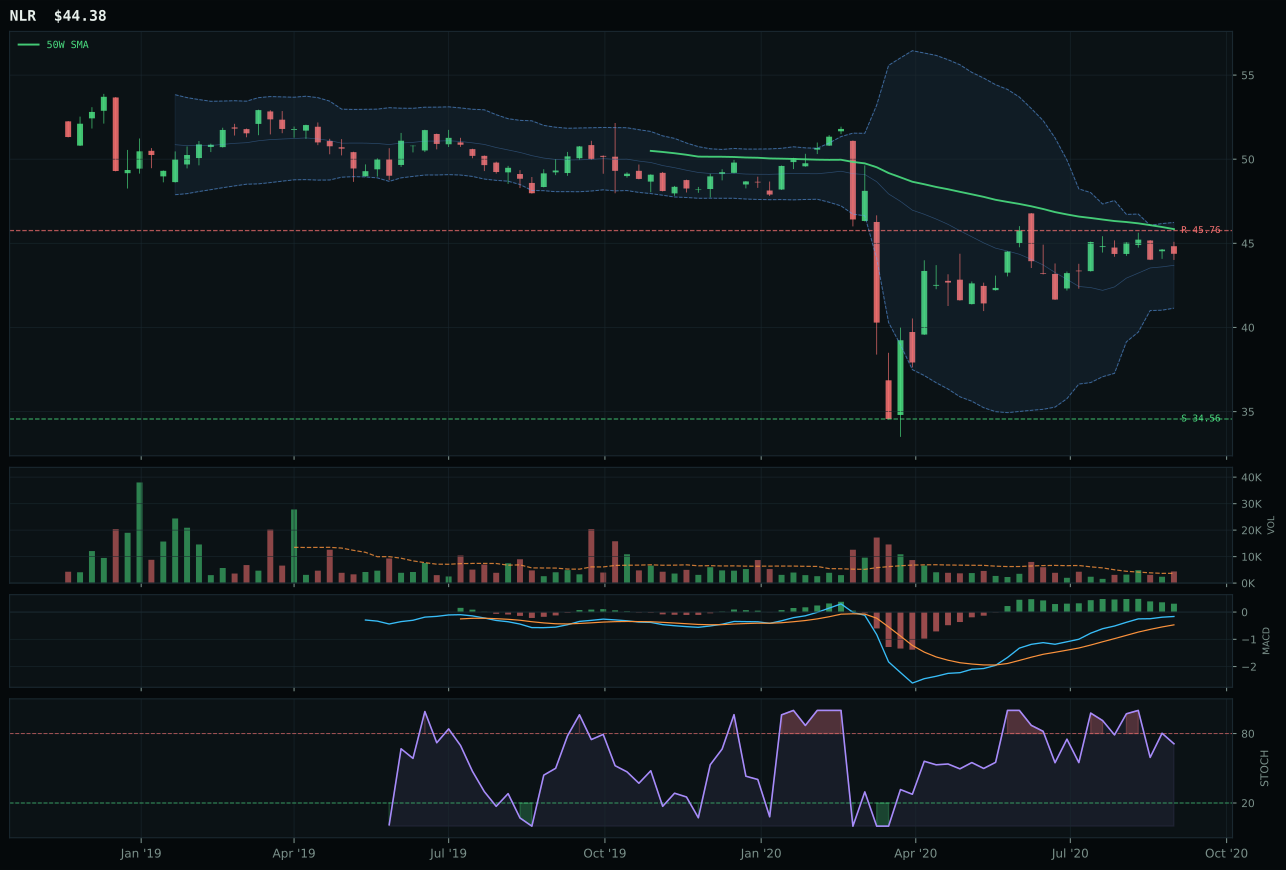
NLR has a neutral structure profile with -10.3% 13-week relative strength versus SPY.
Extension and support failure are the main tactical risks.
Tracked, but not top-2 eligible because: structurally broken.

URNM has a neutral structure profile with 10.2% 13-week relative strength versus SPY.
A failed hold above support would weaken the setup.
Tracked, but not top-2 eligible because: .
URNM won Nuclear Energy despite trailing URA on traditional ETF reasoned-score rankings (44.4 versus 45.0), because the model prioritizes timing and momentum confirmation when setups are uncertain. URNM's MACD is bullish and improving—a rare feature among extended uranium trades—while URA's has flattened, which is critical in a category where the winner has not yet established clean price action. URNM's 90.0 timing score reflects that improving MACD and its neutral-distance-to-50W placement, despite sitting below the moving average. The 100.0 momentum confirmation is real (17.5% 13-week return, 10.2% SPY relative strength, 11.2% category leadership), but it arrived with 2.15x volume, which reads as distribution pressure. URA's cleaner volume (above-average participation) and flattened MACD suggest the uranium move is exhausting, not accelerating.
Nuclear Energy receives 0% allocation despite URNM's positive technicals because the category's 32.8 score ranks 9th out of ten, ahead only of Traditional Energy's zero-score basement. The category's macro fit of 57.0 reflects real-asset sponsorship (+7) and AI-growth sponsorship (+5), but those cannot overcome the structural uncertainty of uranium's price discovery in a Goldilocks regime. URNM's setup is early-stage, with price below both the 50 and 200-week moving averages, which means any breakdown risks a cascade to deeper support. The portfolio excludes uranium exposure because capital is better deployed in Precious Metals (67.7 score, top-2 status) and Industrial Metals (53.5 score, clear macro sponsorship), both of which offer established price leadership. Nuclear would need a sustained breakout above 14.99 (the 0.236 Fibonacci level) with institutional volume confirmation to justify a position.
Traditional Energy — XLE
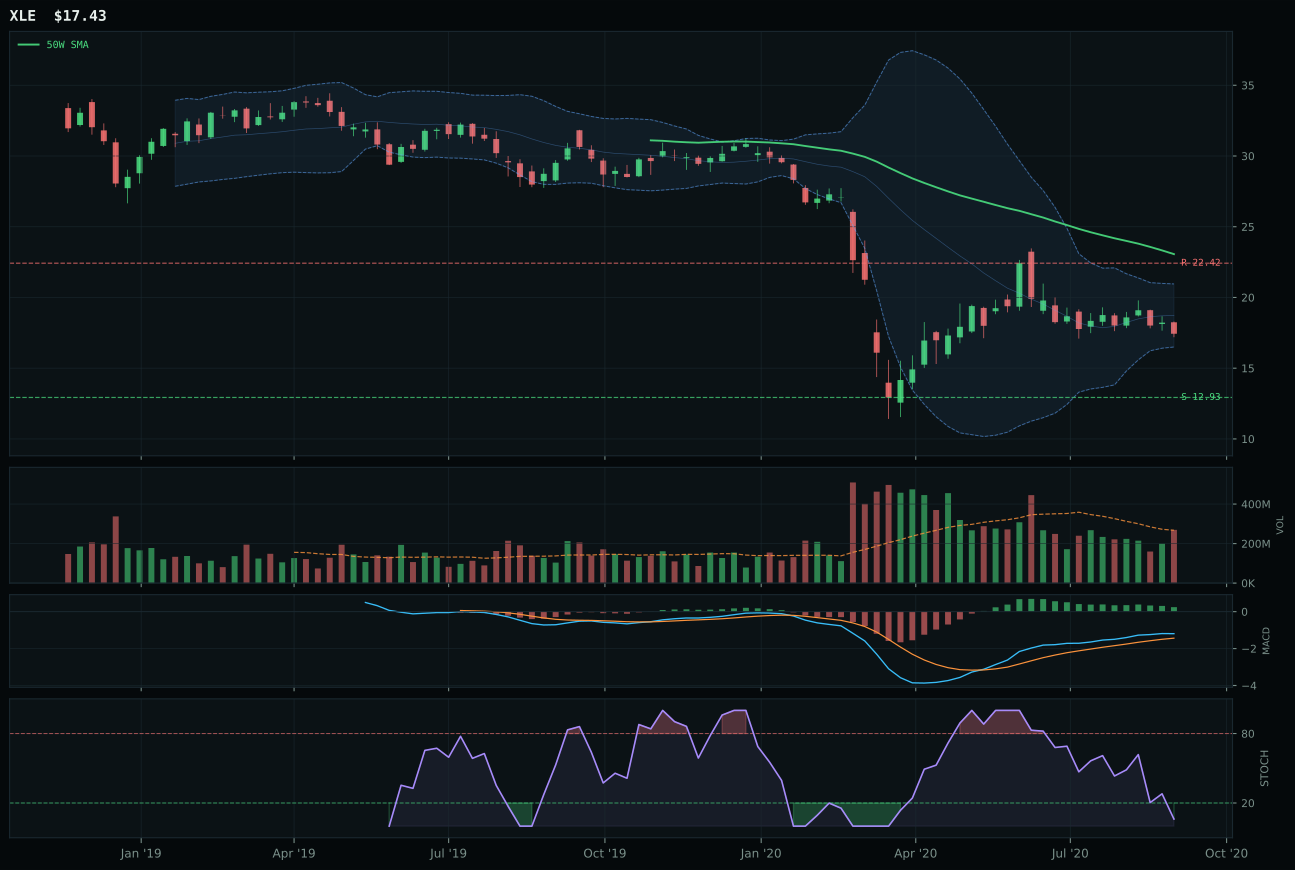
XLE has a neutral structure profile with -29.5% 13-week relative strength versus SPY.
Extension and support failure are the main tactical risks.
Tracked, but not top-2 eligible because: structurally broken.
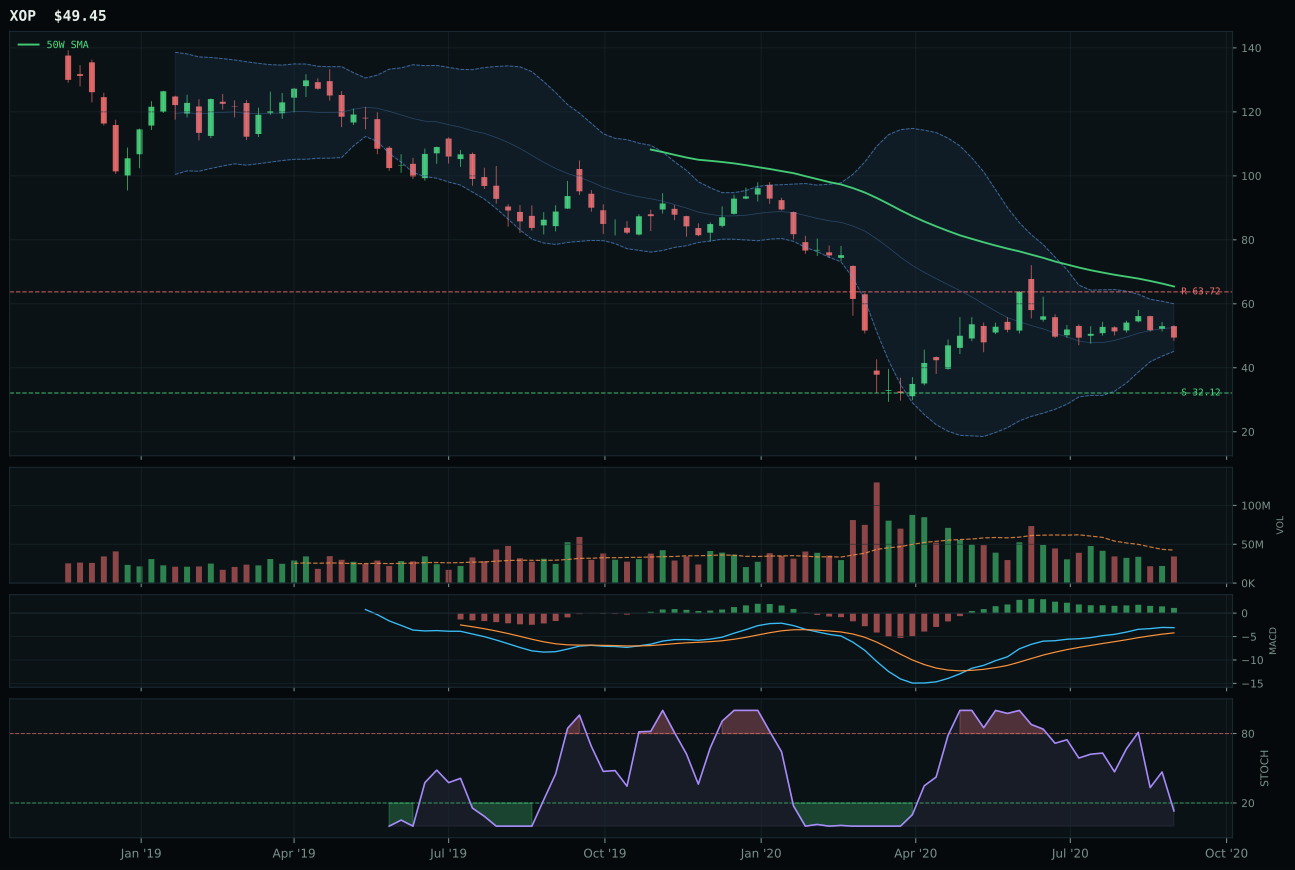
XOP has a neutral structure profile with -29.7% 13-week relative strength versus SPY.
Extension and support failure are the main tactical risks.
Tracked, but not top-2 eligible because: structurally broken.
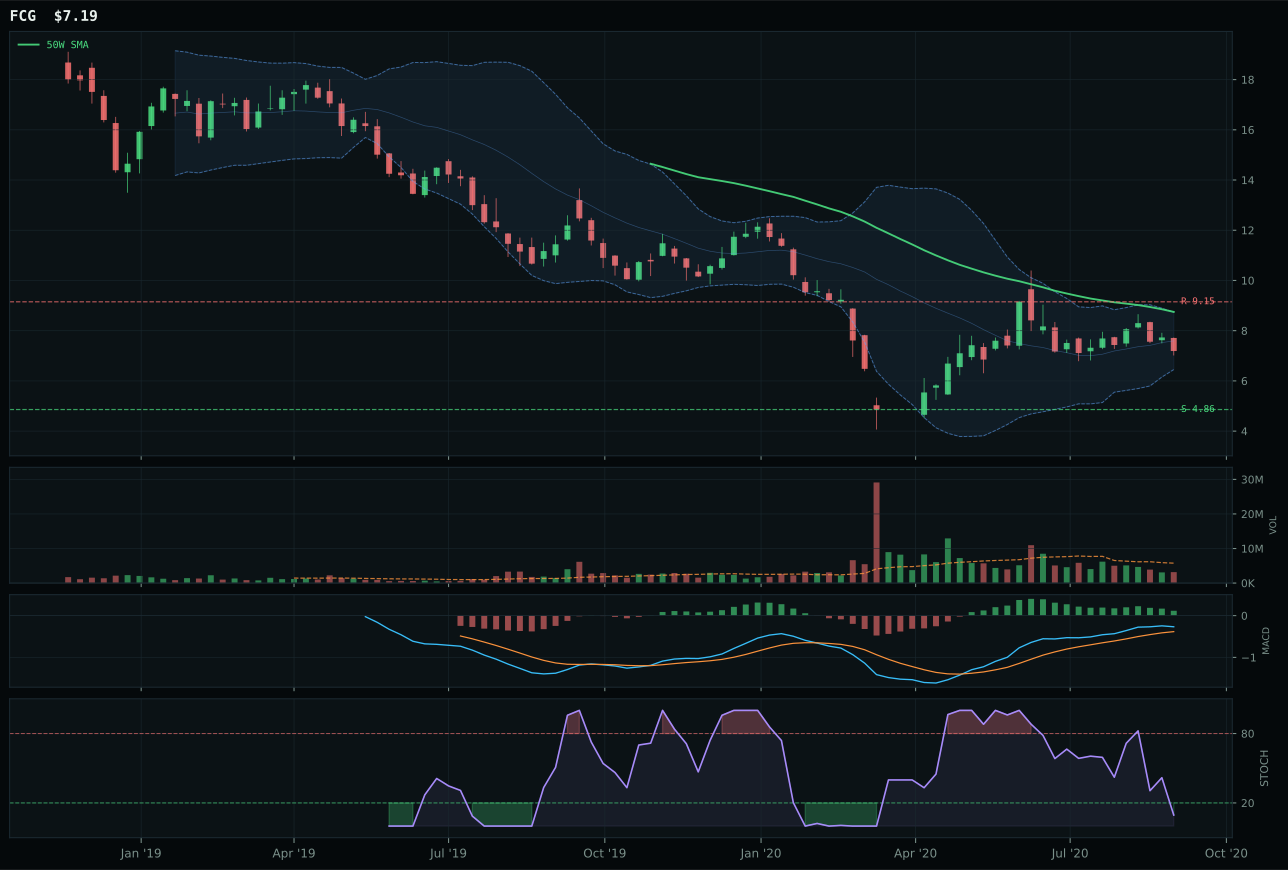
FCG has a neutral structure profile with -28.7% 13-week relative strength versus SPY.
Extension and support failure are the main tactical risks.
Tracked, but not top-2 eligible because: structurally broken.
XLE won a category with zero allocation because it is structurally broken, not because XLE itself is broken. The integrated energy ETF sits 24.4% below its 50-week moving average with minus 29.5% SPY relative strength and a 13-week return of minus 22.2%. Its momentum confirmation score is zero—matching its 4-week drawdown—and volume-price confirmation sits at only 27.2. XOP, the runner-up, is arguably worse: its technical evidence score is zero and it represents pure directional energy beta without the cash-flow stability of integrated players like XLE. The category's fatal flaw is the macro regime: disinflation pressure is active (-10), and real-asset sponsorship (+7) cannot overcome it when crude oil is under structural pressure from demand recession fears.
Traditional Energy receives 0% allocation because the category failed eligibility filters and scored 0.0 overall. Its 26.1 starting basket score decayed to zero after macro-quality and setup-quality checks, signaling deep structural weakness in a Goldilocks regime where growth stocks and precious metals are the preferred real-asset plays. Energy's macro fit of 40.0 is the second-weakest category (only Nuclear Energy, at 57.0, scores lower), dragged down by disinflation pressure (-10) and credit stress (-7). For energy to earn a portfolio slot, either crude prices would need to break above the 200-week moving average on volume, confirming a structural regime shift, or macro indicators would need to flip from disinflation to inflation acceleration. Neither is evident this week, making Traditional Energy a pure exclusion.