
2020-08-28
Informational purposes only. The content in this report, including allocations, analysis, and commentary, is provided solely for informational and educational purposes. It does not constitute financial advice, investment advice, trading advice, or any other type of advice. Past performance does not guarantee future results. Always conduct your own research and consult a qualified financial professional before making investment decisions.
Some tracked tickers were excluded due to missing live weekly price data: SGOV: Historical cache SGOV has only 13 usable weekly bars; URNM: Historical cache URNM has only 39 usable weekly bars
Weekly Allocation
| Ticker | Category | Weight | Role |
|---|---|---|---|
| FSOL | 50% | Overlay | |
| PICK | Industrial Metals | 10% | Top-2 (10%) |
| XLK | Technology | 10% | Top-2 (10%) |
| BOTZ | AI | 5% | Tier-2 (5%) |
| SLV | Precious Metals | 5% | Tier-2 (5%) |
| INDA | Emerging Markets | 5% | Tier-2 (5%) |
| ITA | Defense & Aerospace | 5% | Tier-2 (5%) |
| MOO | Agriculture & Livestock | 5% | Tier-2 (5%) |
| PAVE | Utilities & Infrastructure | 5% | Tier-2 (5%) |
Trade Instructions — Monday Open
Sell the tranche from 2020-07-31 (completing its 4-week hold). Buy the new tranche. Instructions show net portfolio changes — same-asset positions cancel, weight changes show the delta.
| Action | Ticker | Instruction |
|---|---|---|
| SELL | FBTC | Sell 50% of FBTC position (reduce 25.00% → 12.50%) |
| SELL | SLV | Sell 14% of SLV position (reduce 8.75% → 7.50%) |
| SELL | CIBR | Sell entire CIBR position (2.50% of portfolio) |
| SELL | SMH | Sell 25% of SMH position (reduce 5.00% → 3.75%) |
| SELL | XLU | Sell entire XLU position (1.25% of portfolio) |
| SELL | XAR | Sell 25% of XAR position (reduce 5.00% → 3.75%) |
| SELL | REMX | Sell 20% of REMX position (reduce 6.25% → 5.00%) |
| SELL | URA | Sell 33% of URA position (reduce 3.75% → 2.50%) |
| SELL | XLE | Sell entire XLE position (1.25% of portfolio) |
| BUY | FSOL | Buy FSOL — 52.63% of freed cash (adds 12.50% to portfolio) |
| BUY | XLK | Buy XLK — 10.53% of freed cash (adds 2.50% to portfolio) |
| BUY | INDA | Buy INDA — 5.26% of freed cash (adds 1.25% to portfolio) |
| BUY | PAVE | Buy PAVE — 5.26% of freed cash (adds 1.25% to portfolio) |
| BUY | BOTZ | Buy BOTZ — 5.26% of freed cash (adds 1.25% to portfolio) |
| BUY | MOO | Buy MOO — 5.26% of freed cash (adds 1.25% to portfolio) |
| BUY | PICK | Buy PICK — 10.53% of freed cash (adds 2.50% to portfolio) |
| BUY | ITA | Buy ITA — 5.26% of freed cash (adds 1.25% to portfolio) |
Current Portfolio After Trade
Combined holdings across all 4 active tranches. Each tranche is 25% of the portfolio.
| Ticker | % of Portfolio | Weight Bar |
|---|---|---|
| FSOL | 37.50% | |
| FBTC | 12.50% | |
| SLV | 7.50% | |
| XLK | 6.25% | |
| INDA | 6.25% | |
| REMX | 5.00% | |
| SMH | 3.75% | |
| XAR | 3.75% | |
| PAVE | 3.75% | |
| BOTZ | 3.75% | |
| URA | 2.50% | |
| MOO | 2.50% | |
| PICK | 2.50% | |
| FCG | 1.25% | |
| ITA | 1.25% |
Macro Regime — Goldilocks
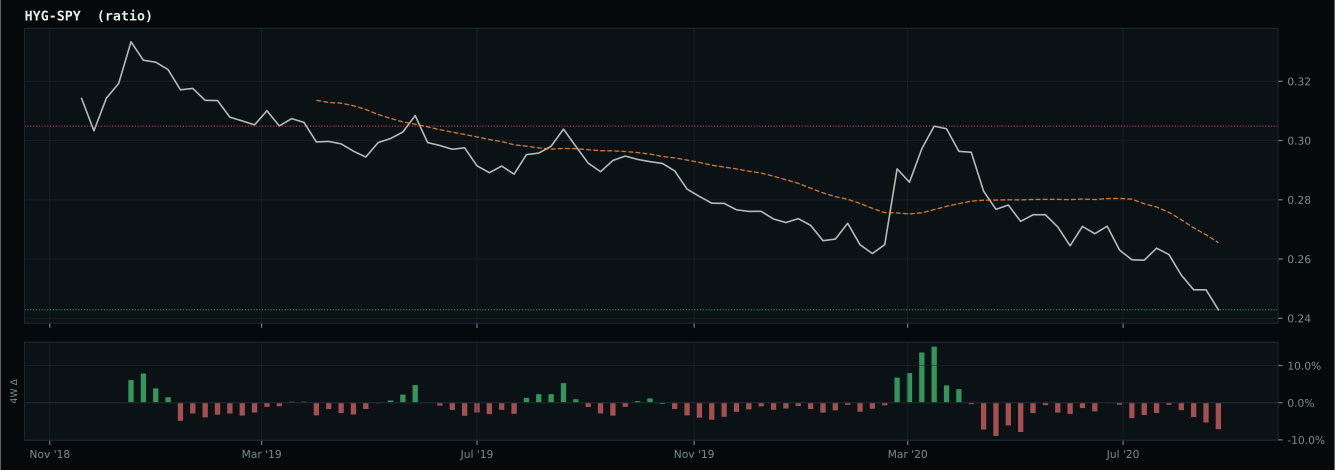
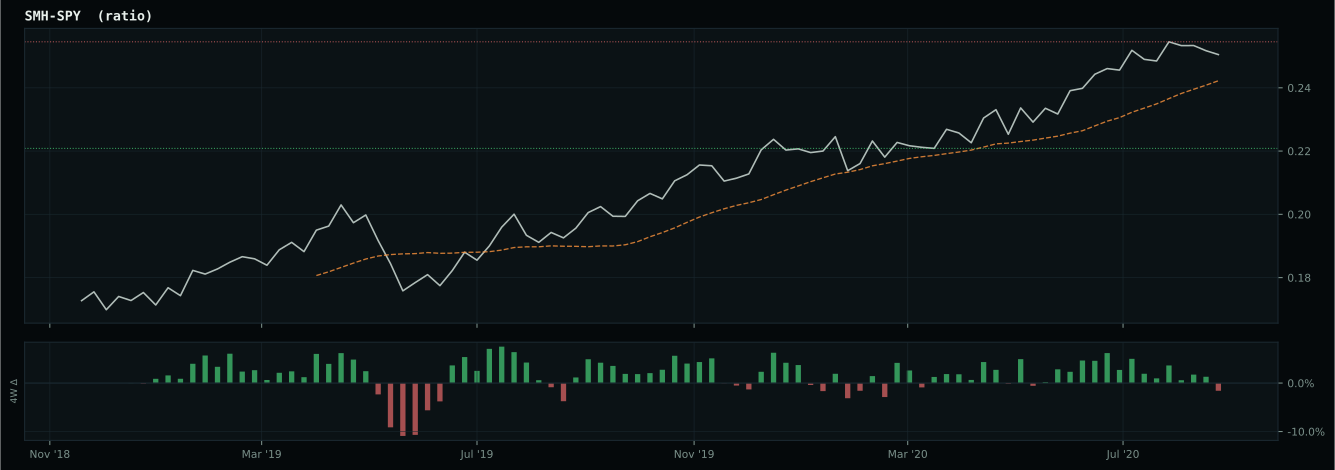
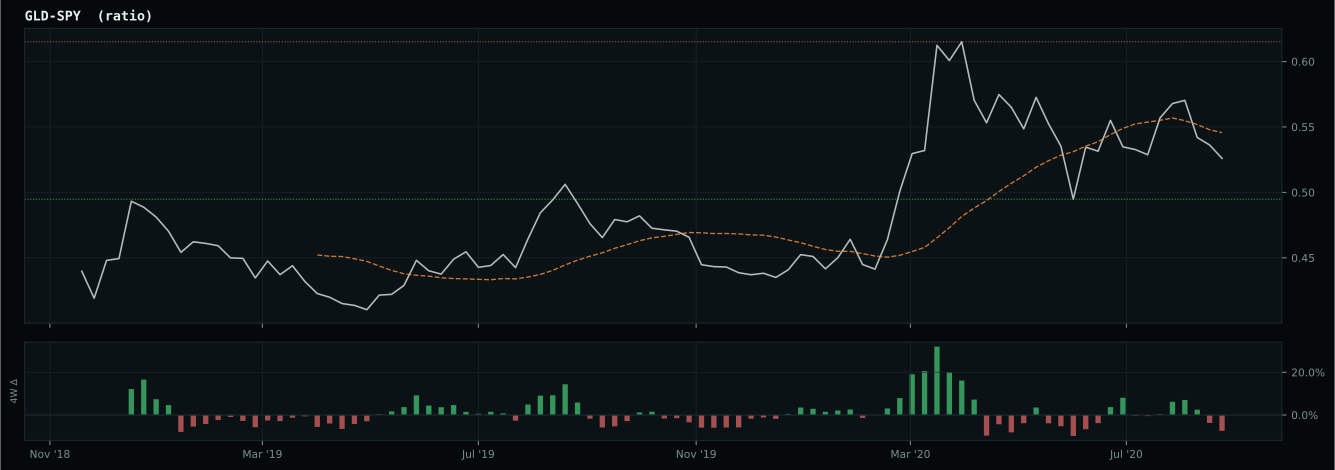
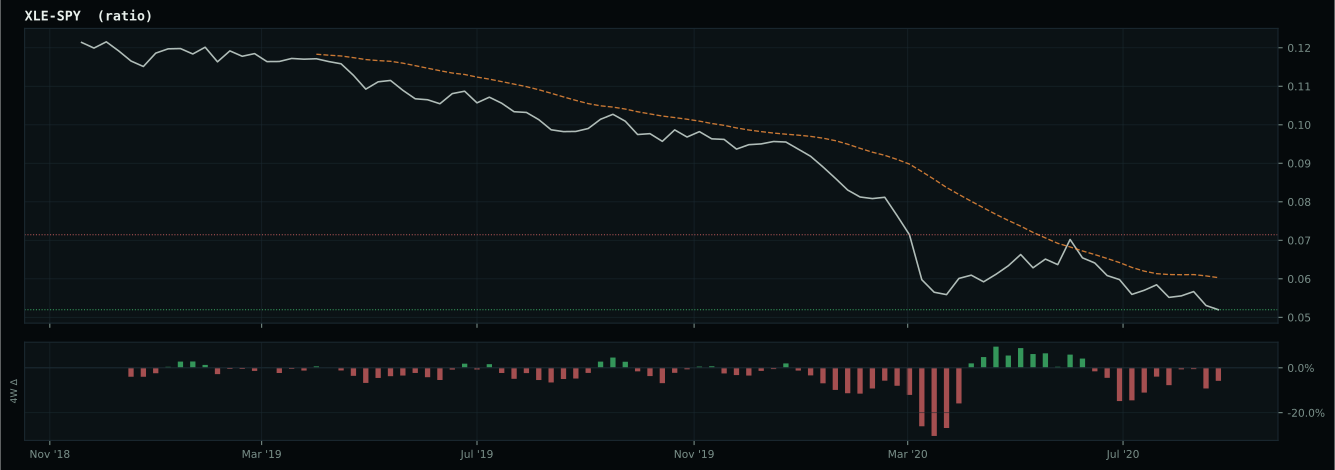
liquidity is improving but credit stress remains elevated
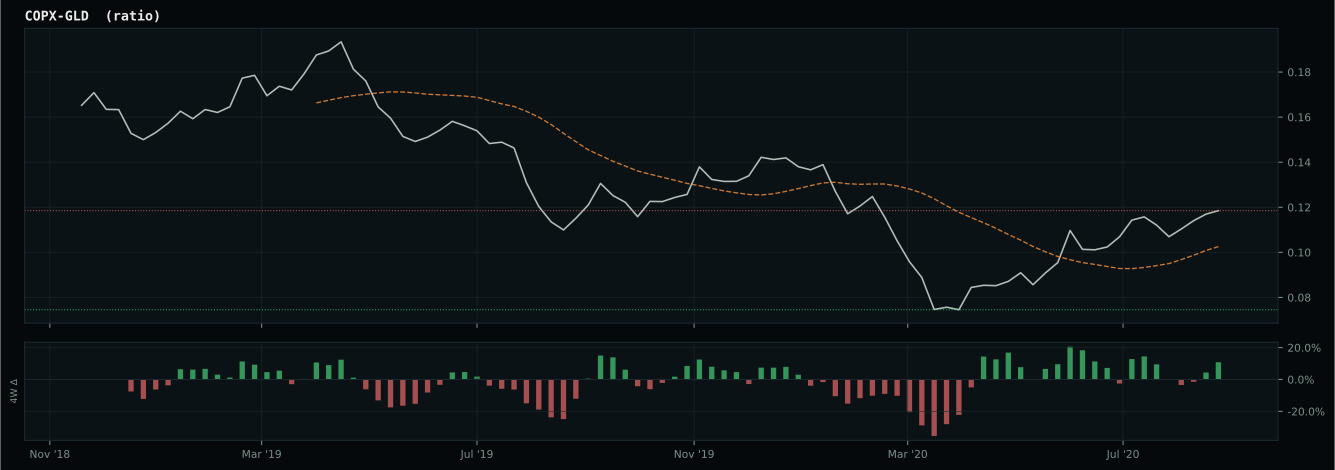
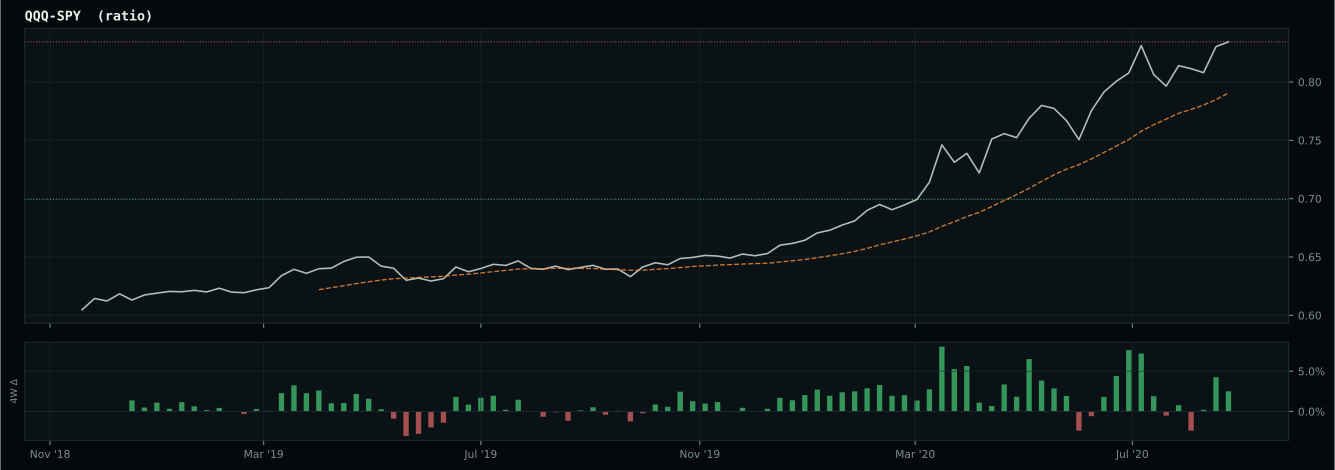
Macro Evidence Charts
Market-implied signals behind the macro regime scores. Each ratio compares two assets; the direction and slope of the ratio is what the macro engine reads.
Crypto Regime — AltSeason
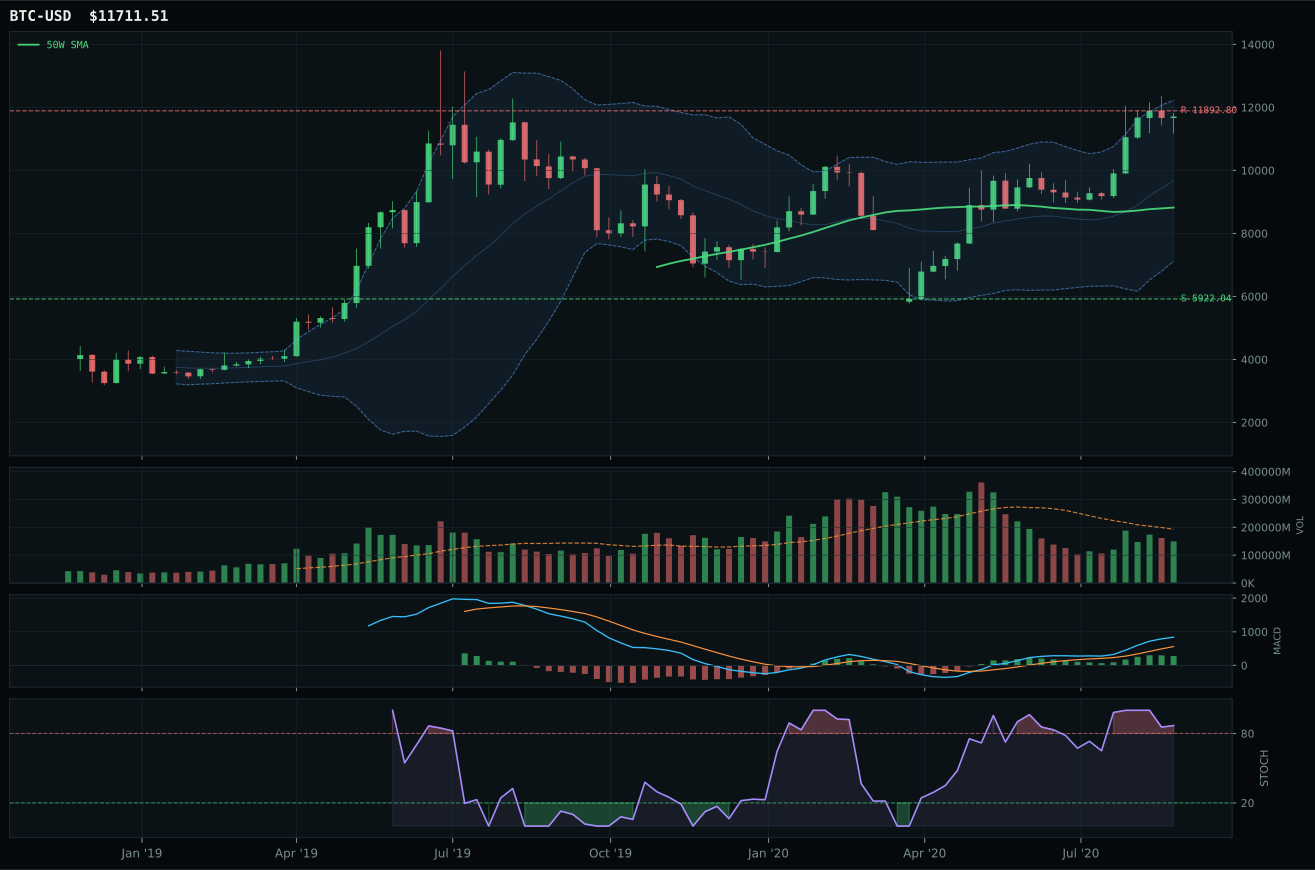
post-touch structure is too wide to count as a range; max/min close ratio is 2.21
TrendBTC confirmed: 2 consecutive closes above rising/flat 50W SMA
all available AltSeason conditions pass; missing optional confirmations skipped

Category Rankings
| Rank | Category | Winner | Score | Alloc | 4W Ret | Peers (4W) |
|---|---|---|---|---|---|---|
| 1 | Industrial Metals | PICK | 73.5 | 20% | -4.27% | REMX -10.3% · COPX -5.4% |
| 2 | Technology | XLK | 65.5 | 20% | -6.32% | IGV -3.3% · CIBR -3.7% |
| 3 | AI | BOTZ | 56.9 | 10% | +1.14% | SMH -1.9% · AIQ -3.6% |
| 4 | Precious Metals | SLV | 50.1 | 10% | -16.55% | GLD -4.8% · GDX -7.8% |
| 5 | Emerging Markets | INDA | 44.8 | 10% | +0.18% | IEMG -2.7% · ILF -4.4% |
| 6 | Defense & Aerospace | ITA | 37.6 | 10% | -5.03% | XAR -3.1% · ROKT -2.0% |
| 7 | Agriculture & Livestock | MOO | 34.5 | 10% | -1.49% | VEGI -0.9% · WEAT -2.7% |
| 8 | Utilities & Infrastructure | PAVE | 33.9 | 10% | -2.60% | XLU +0.0% · IGF -3.3% |
| 9 | Nuclear Energy | URA | 32.5 | 0% | -10.61% | NLR -1.5% |
| 10 | Traditional Energy | XLE | — | 0% | -15.79% | FCG -19.7% · XOP -18.3% |
Industrial Metals — PICK
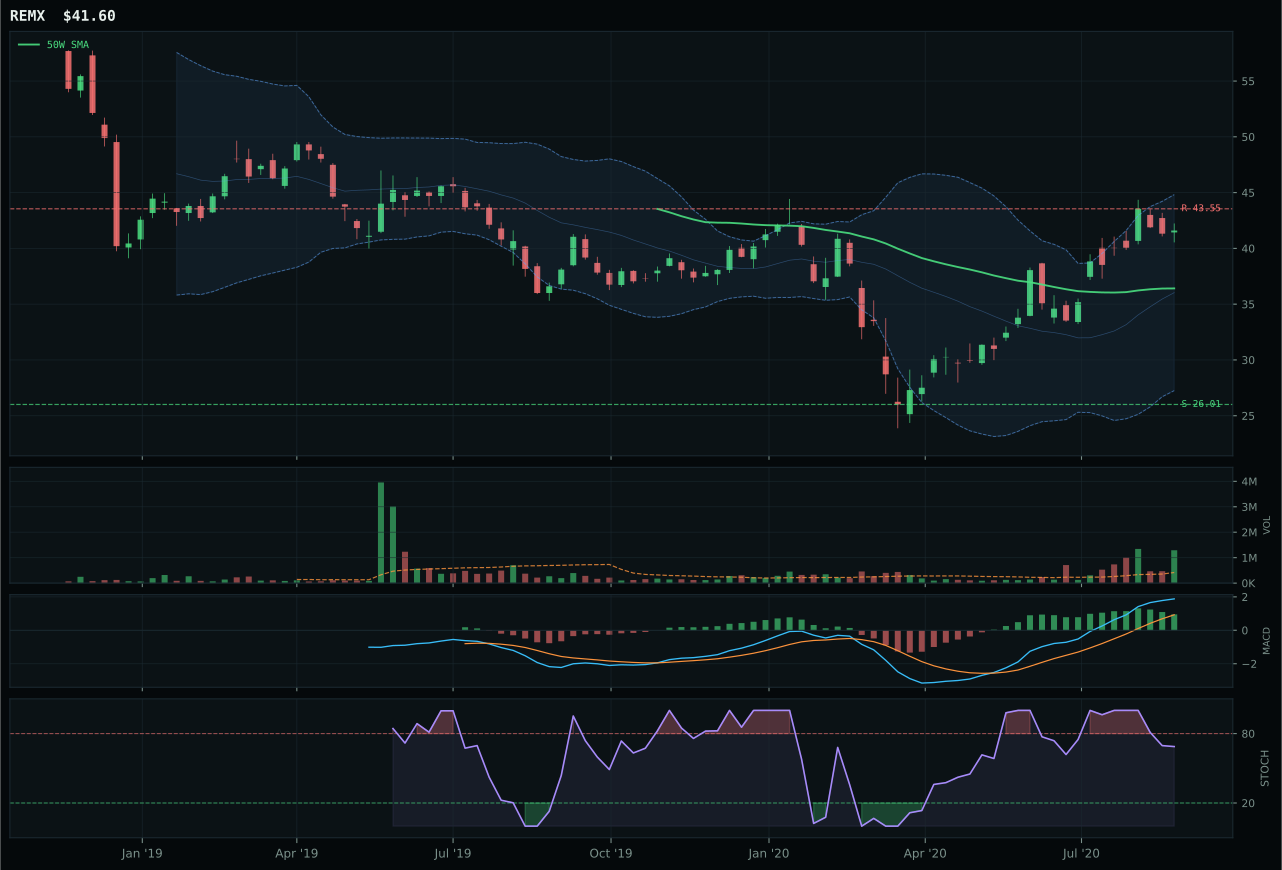
REMX has a neutral structure profile with 7.9% 13-week relative strength versus SPY.
A failed hold above support would weaken the setup.
Actionable but governed by invalidation levels.
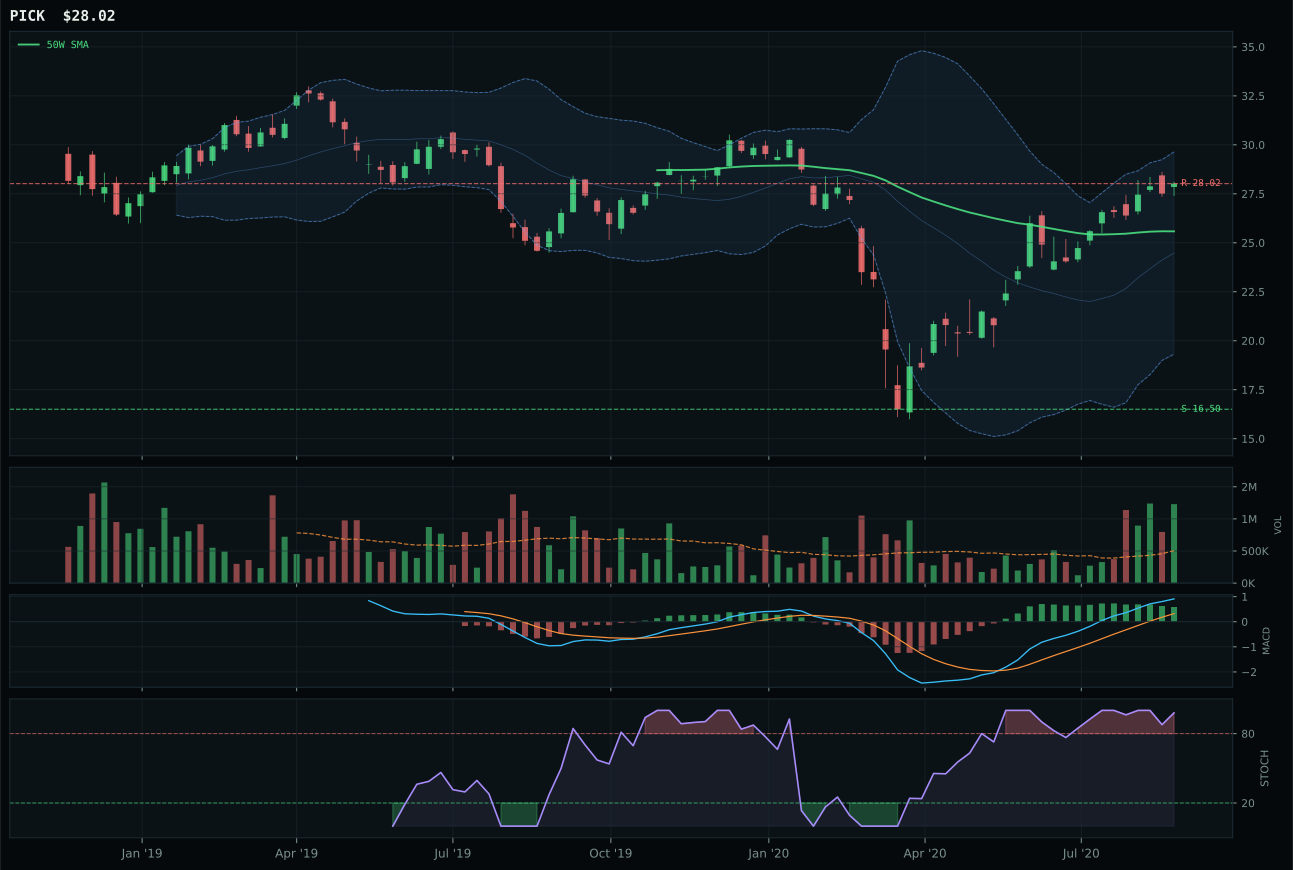
PICK has a neutral structure profile with 3.8% 13-week relative strength versus SPY.
A failed hold above support would weaken the setup.
Actionable but governed by invalidation levels.
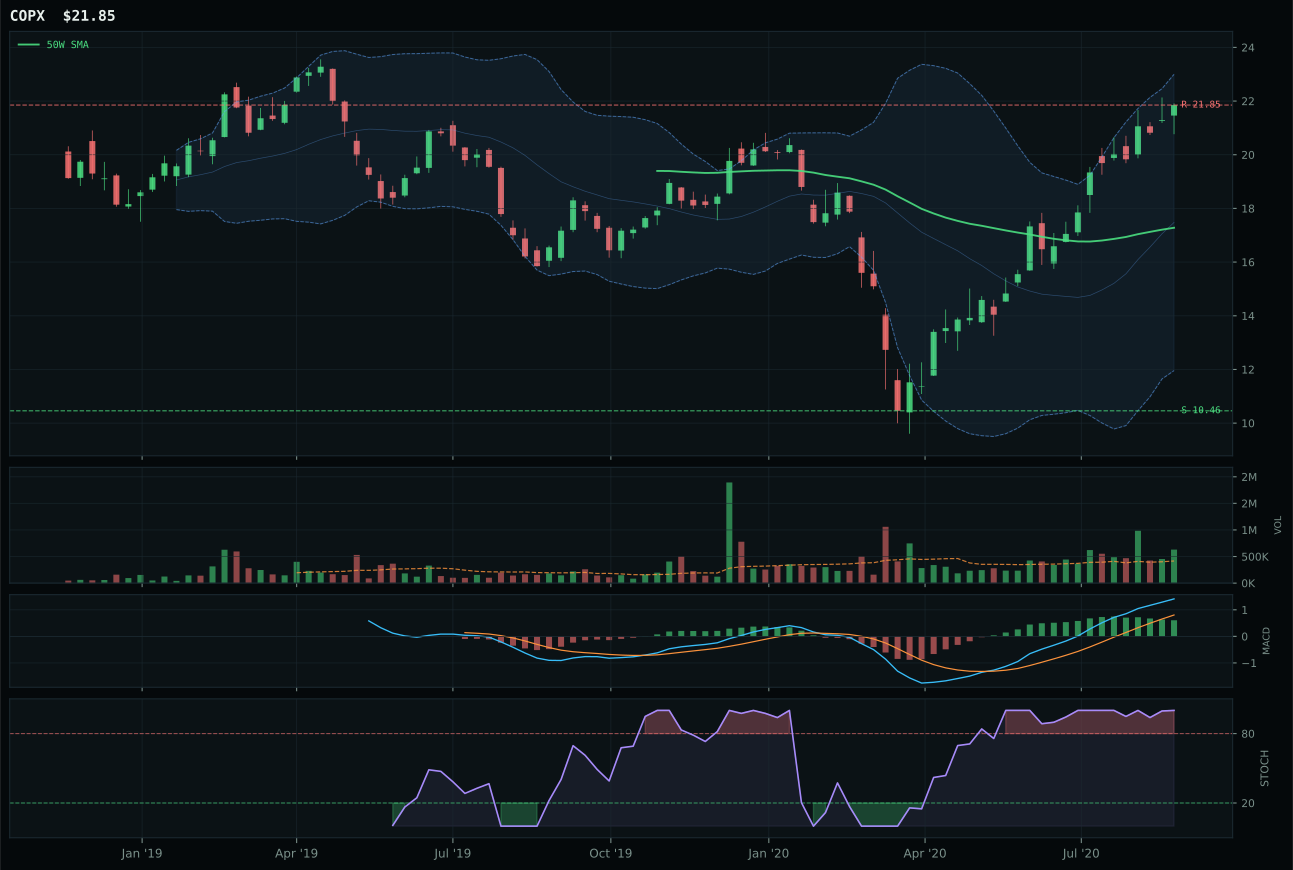
COPX has a vertical extension profile with 25.3% 13-week relative strength versus SPY.
A failed hold above support would weaken the setup.
Tracked, but not top-2 eligible because: .
PICK claimed the top-2 allocation slot by delivering the rare portfolio setup where volume participation (2.43x average, accumulation/confirmation) outweighs extension risk despite 9.5% distance from the 50W. Price sits above the 50W but below the 200W, a hybrid technical posture that typically signals caution, yet PICK's structure score of 82.0 and volume-price confirmation of 74.9 confirm material institutional accumulation, not a short-squeeze bounce. The category-relative strength of -4.1% appears weak until context reveals that REMX, the technical leader at 83 points, carries category-relative strength of 0.0%, meaning PICK's slight lag to median reflects deliberate diversification rather than weakness. REMX's superior 13-week return of 23.1% and 7.9% SPY outperformance look superior to PICK's 19.0% and 3.8%, but REMX's structure is less clean at 75.0 versus 82.0, and risk/reward penalizes the extended play: REMX offers -2.9% upside to 43.55 resistance while PICK clears that bar with room to run. Stochastic RSI overbought rolling over at 0.98 for PICK versus falling/neutral at REMX signals that PICK still has sponsorship momentum despite appearing extended.
Industrial Metals earns 10% as one of two top-2 categories, scoring 73.5 on the back of extraordinary macro fit (79.0) amplified by multiple active descriptors: metals scarcity (+14), commodity breadth positive (+10), real asset sponsorship (+6), and Goldilocks (+6) all point bullish. PICK's technical evidence (70.1) ranks among the portfolio's highest, and the category's 3/2/1 weighted basket (72.4 starting) reflects genuine breadth of opportunity across the mining complex. This is a Goldilocks-regime play where multiple macro regimes align—financial conditions remain accommodative, growth expectations stable, and commodity demand from both industrial and monetary sources appears durable. PICK itself is not extended: at 9.5% from the 50-week moving average it sits in the optimal entry zone where momentum has matured but timing risk remains low. The allocation would justify escalation to 20% only if REMX or another commodity-sensitive name begins outperforming on relative strength and sustains higher-quality accumulation; for now 10% reflects conviction in the setup without overweighting the sector. Support levels at 16.50 and 15.55 offer meaningful cushion, so downside protection combined with macro sponsorship provides solid risk/reward for the capital commitment.
Technology — XLK
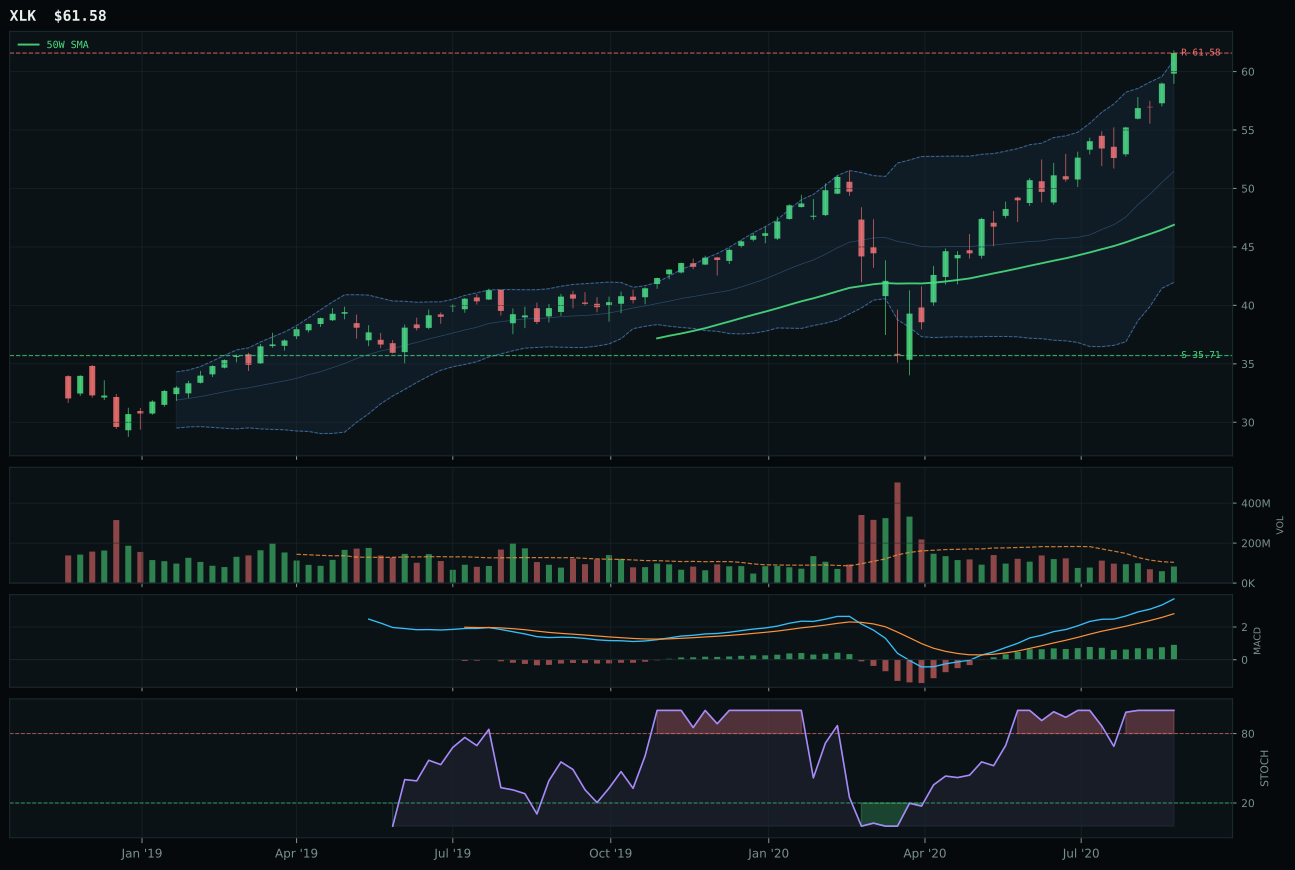
XLK has a vertical extension profile with 10.5% 13-week relative strength versus SPY.
A failed hold above support would weaken the setup.
Actionable but governed by invalidation levels.
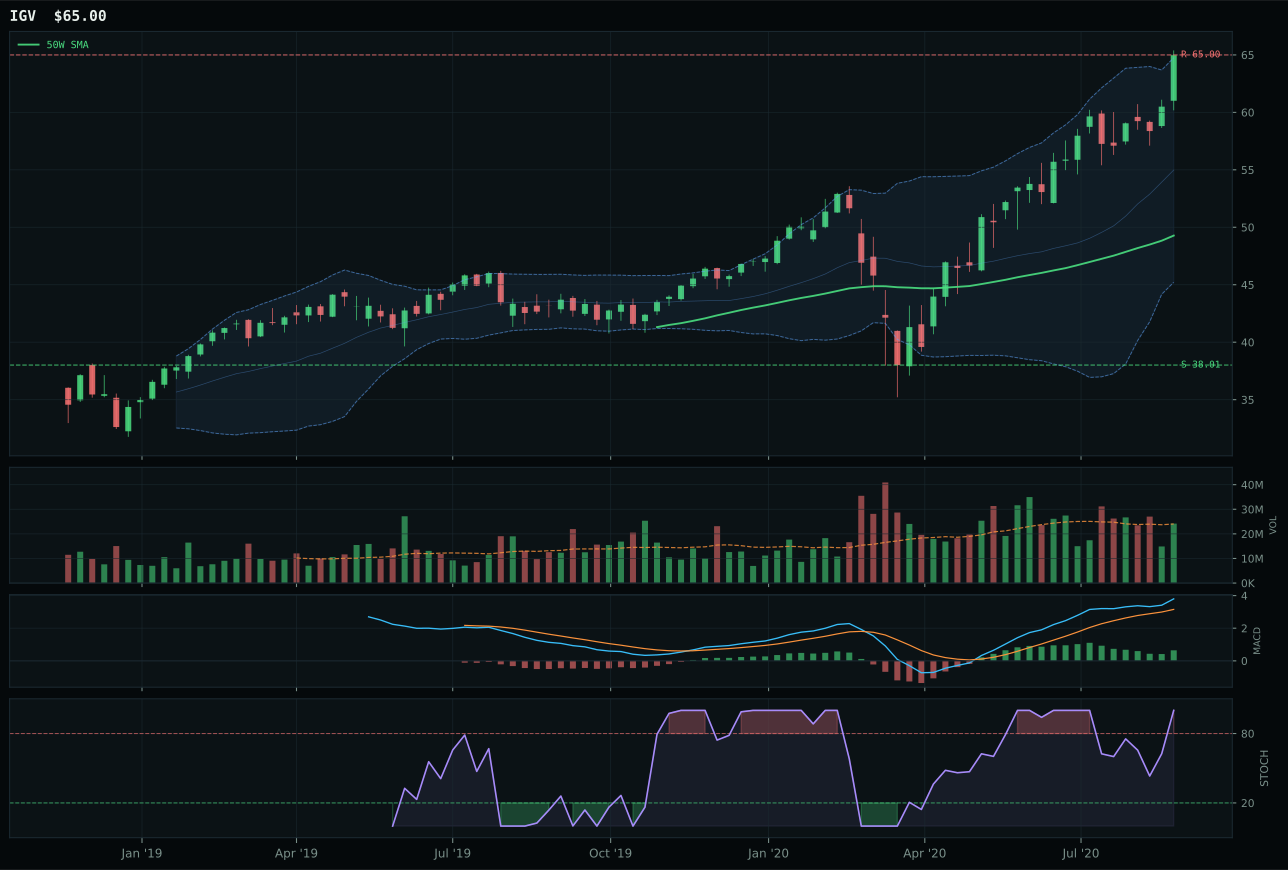
IGV has a vertical extension profile with 6.4% 13-week relative strength versus SPY.
A failed hold above support would weaken the setup.
Actionable but governed by invalidation levels.
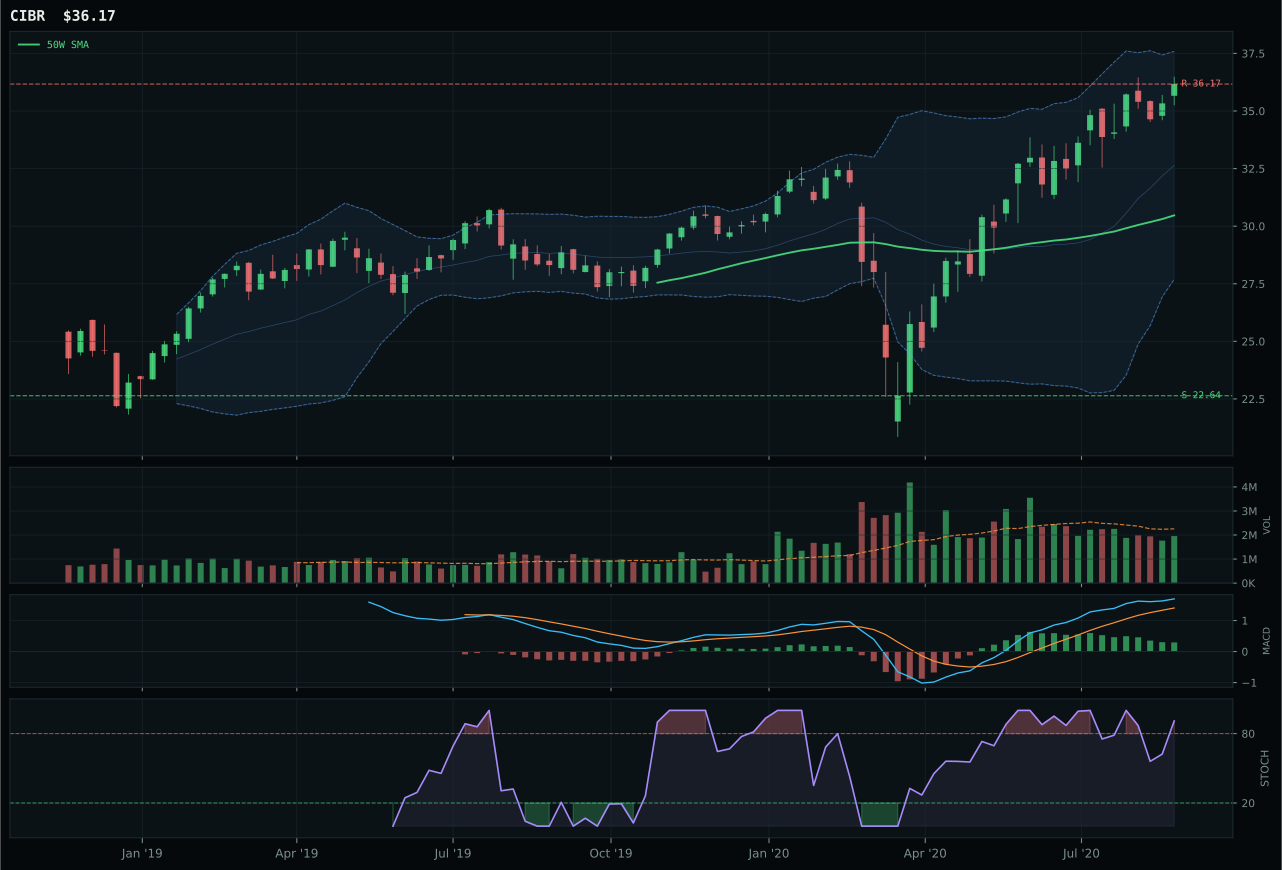
CIBR has a vertical extension profile with -4.6% 13-week relative strength versus SPY.
A failed hold above support would weaken the setup.
Actionable but governed by invalidation levels.
XLK claimed the category by marrying uptrend confirmation with category-relative execution. Price sits 31.3% above the 50-week moving average with slope intact at 0.9%, and the 13-week return of 25.7% is backed by 10.5% outperformance versus SPY and 4.1% leadership within its own basket—a clean proof that new capital is flowing to XLK, not chasing a stale bounce. IGV, the runner-up, owns the same vertical extension setup and identical trend mechanics (both above the 50W and 200W), but its MACD is bullish but flattening rather than bullish and improving, and its category-relative strength sits flat at 0.0% against XLK's 4.1%, meaning sponsorship is broader for the winner. The structure score of 76.3 versus IGV's 75.6 is a fine distinction, but timing revealed the real gap: XLK's MACD slope is still steepening while IGV's is rolling over, and with both names extended into Fibonacci extension near the 52-week high, that deterioration in momentum confirmation disqualified the runner-up despite similar technical evidence.
Technology earns its 10% allocation as a legitimate third-tier opportunity in a Goldilocks regime where risk appetite remains active and AI growth sponsorship provides specific tailwind. The category scored 65.5—well behind the top two but supported by macro fit at 72.0, reflecting that profitable technology leadership benefits from stable growth conditions and positive sentiment toward computational advancement. XLK's extended positioning creates asymmetric risk for new entries, but the category's macro backdrop and the ETF's technical sponsorship justify a modest sleeve rather than exclusion. What would lift Technology into top-2 contention: either a pullback that resets timing and entry risk, or further relative strength acceleration that demonstrates XLK can sustain leadership despite already being 31% extended. For now the allocation reflects a solid opportunity with measurable tailwinds, not a tier-one conviction bet.
AI — BOTZ
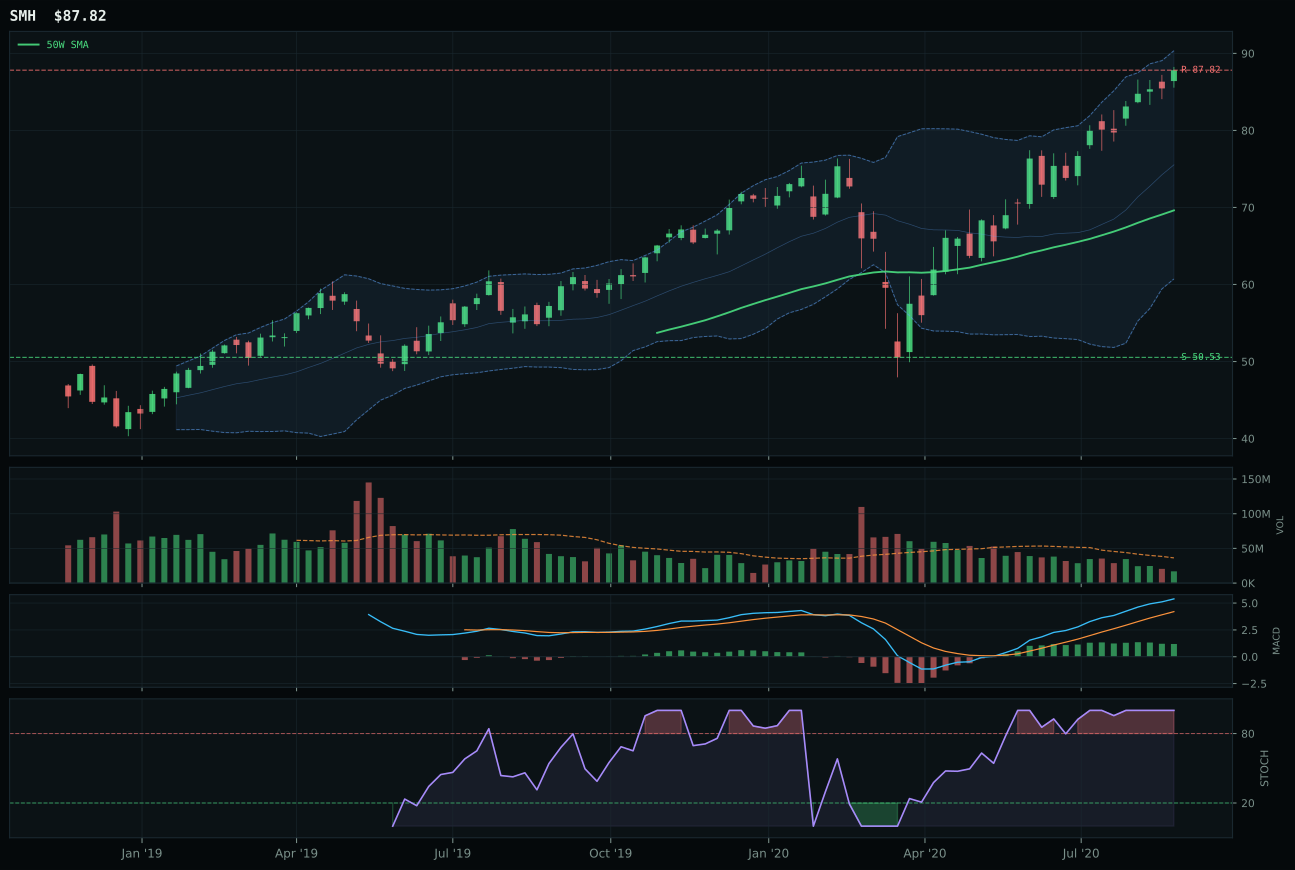
SMH has a vertical extension profile with 9.3% 13-week relative strength versus SPY.
A failed hold above support would weaken the setup.
Actionable but governed by invalidation levels.
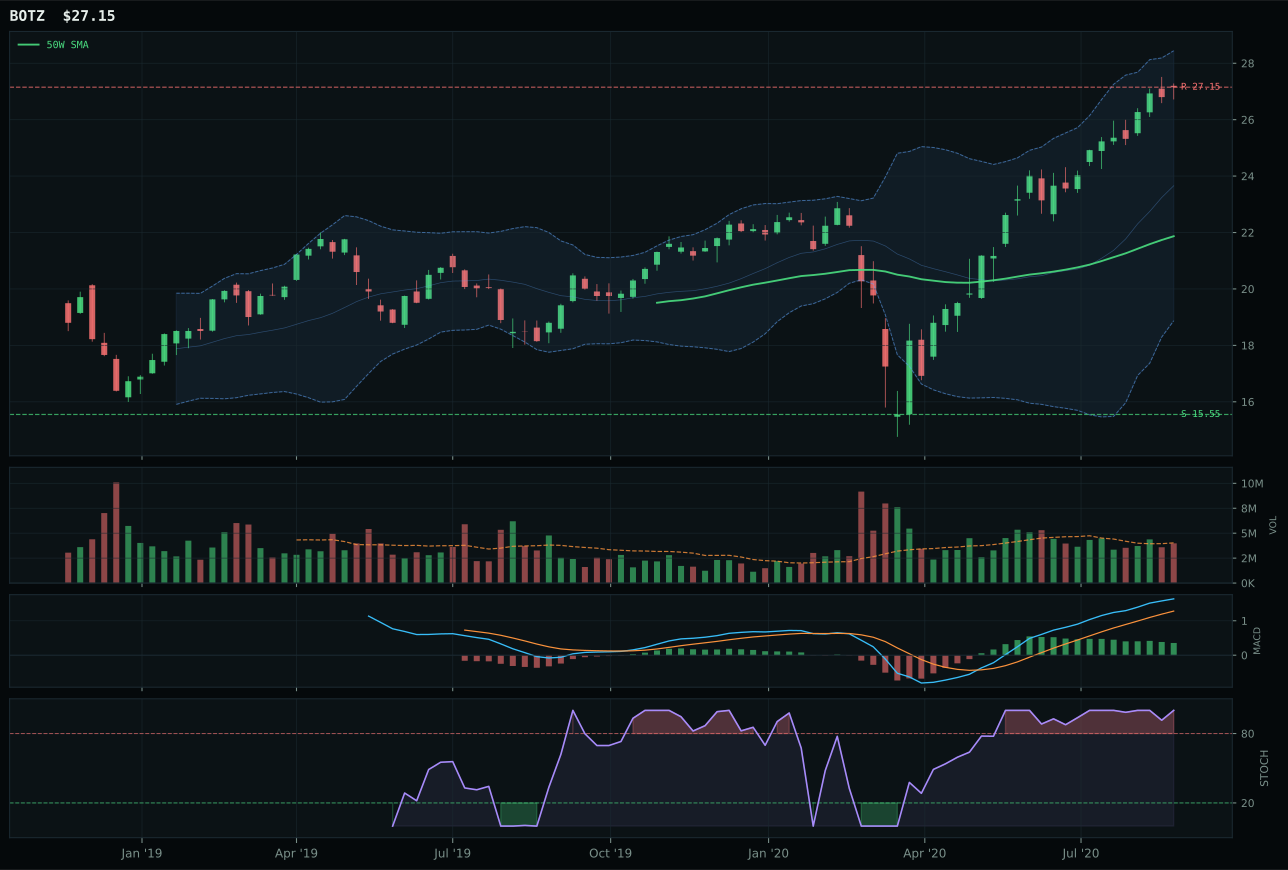
BOTZ has a vertical extension profile with 1.9% 13-week relative strength versus SPY.
A failed hold above support would weaken the setup.
Actionable but governed by invalidation levels.
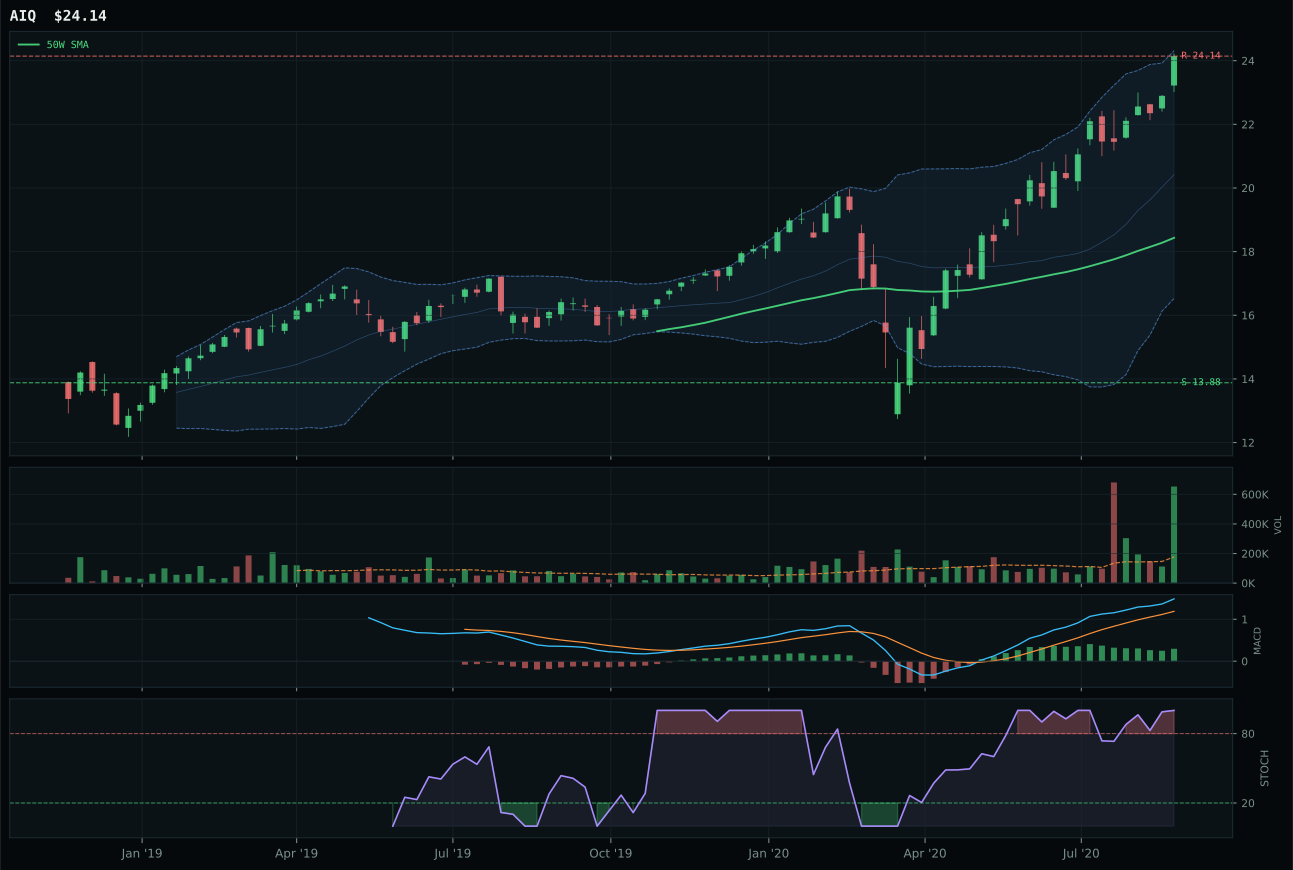
AIQ has a vertical extension profile with 8.7% 13-week relative strength versus SPY.
A failed hold above support would weaken the setup.
Tracked, but not top-2 eligible because: .
BOTZ won a tight decision over SMH despite trailing on momentum and relative strength, capturing the category on structural purity and volume sponsorship. Both names sit above the 50W and 200W with overbought momentum and vertical extension setups, but BOTZ's structure score of 76.9 exceeded SMH's 76.4, and critically, BOTZ shows neutral volume participation at 0.99x while SMH displays thin participation—a meaningful signal that accumulation is broader for the robotics expression than the semiconductor compute play. SMH's 13-week return of 24.5% and 9.3% SPY outperformance look superior to BOTZ's 17.1% and 1.9% respectively, yet those numbers reflect SMH's extended run into the AI cycle rather than better current sponsorship. Both setups are near the 52-week high in Fibonacci extension, both show MACD bullish but flattening, both are overbought, but BOTZ's volume meter provides confirmation where SMH shows distribution risk—a critical distinction when deciding between momentum trades in an overbought regime.
AI lands a 5% allocation because its 56.9 score ranks behind both top-2 categories but ahead of most alternatives, buoyed by robust macro fit (76.0) and Goldilocks conditions that favor both risk appetite and AI narrative momentum. BOTZ itself carries mixed technical sponsorship at 55.5, yet remains the least-bad representative in a category where the setup is universally extended and timing uniformly compromised. The allocation acknowledges that growth in robotics and physical AI cyclicality deserves token exposure in an AltSeason environment, but BOTZ's deteriorating volume-price confirmation (60.3) and category-relative weakness (-6.7%) signal that entry risk exceeds upside opportunity. For this category to justify 10% or higher: BOTZ would need to consolidate its extended position, reset timing, and demonstrate renewed volume participation. Until then it occupies the fence between "too extended to chase" and "too interesting to ignore," warranting precisely the modest 5% positioning.
Precious Metals — SLV
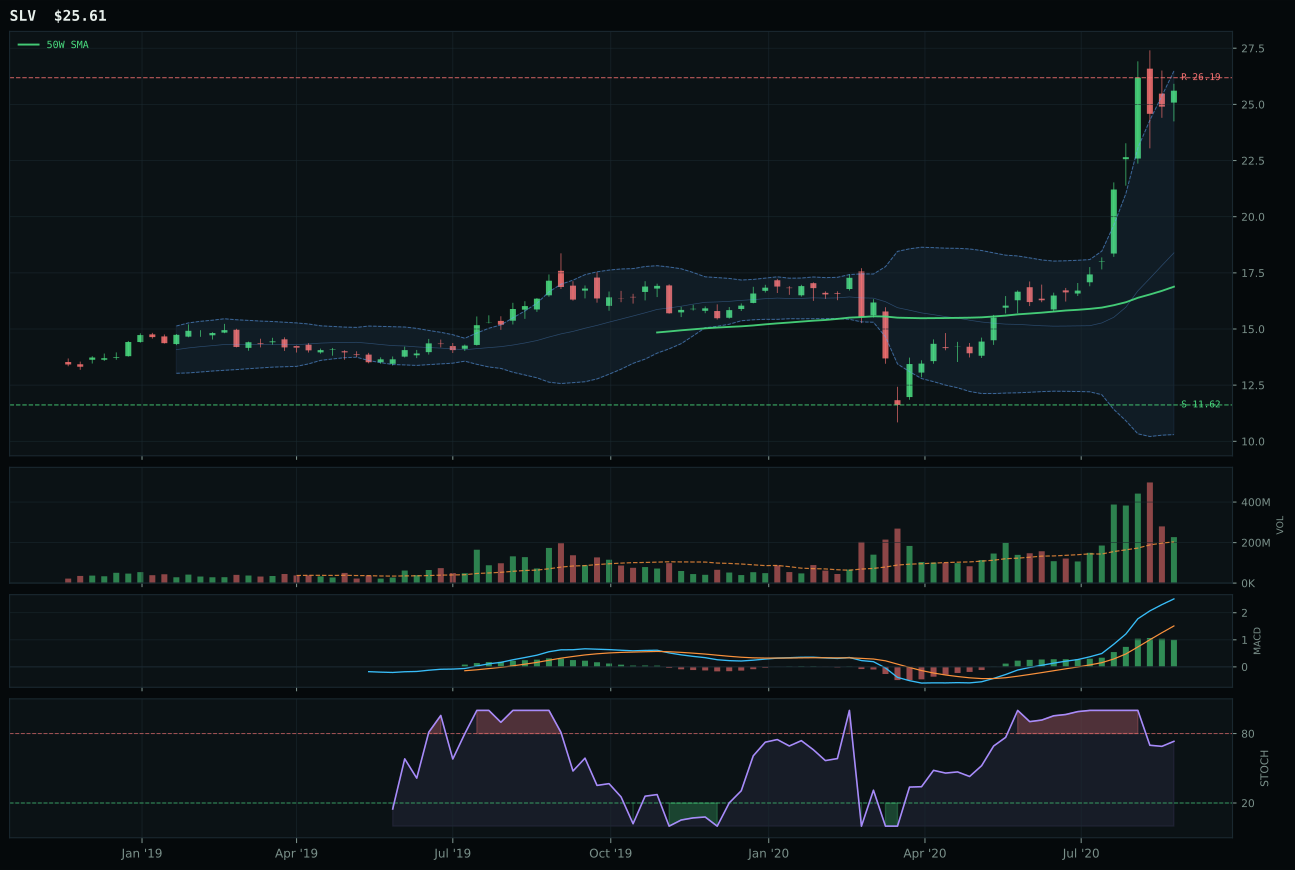
SLV has a vertical extension profile with 38.5% 13-week relative strength versus SPY.
A failed hold above support would weaken the setup.
Actionable but governed by invalidation levels.
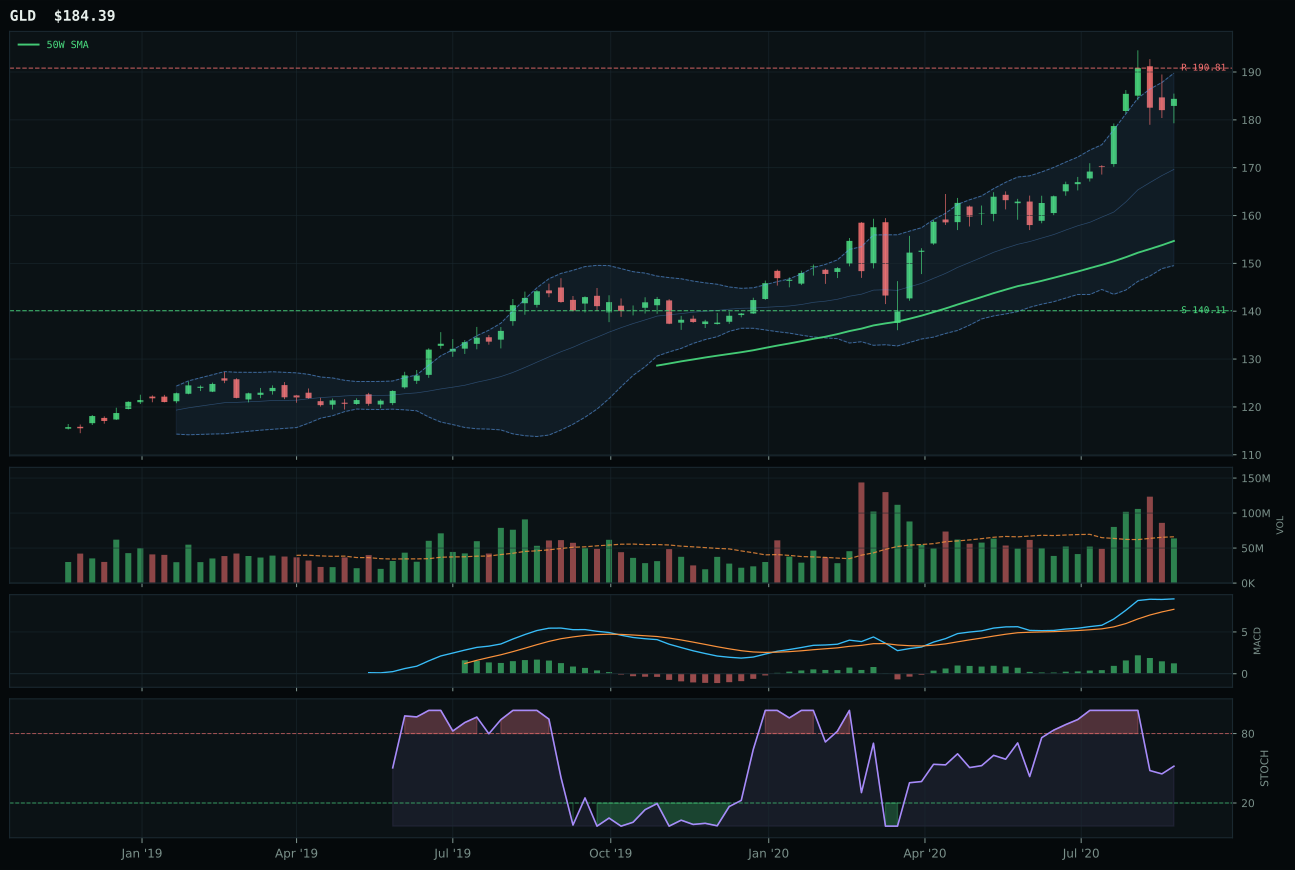
GLD has a vertical extension profile with -2.0% 13-week relative strength versus SPY.
A failed hold above support would weaken the setup.
Actionable but governed by invalidation levels.
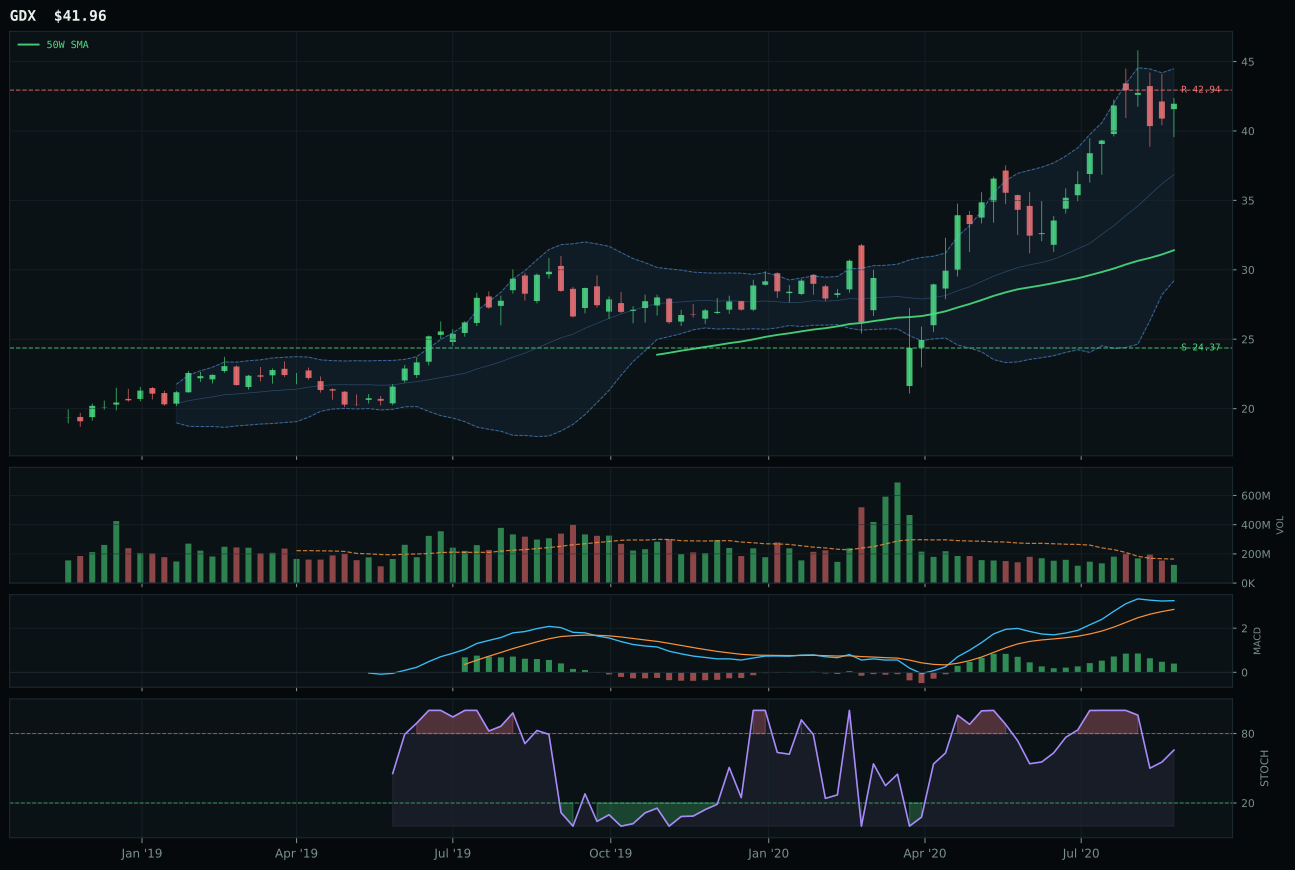
GDX has a vertical extension profile with 7.1% 13-week relative strength versus SPY.
A failed hold above support would weaken the setup.
Actionable but governed by invalidation levels.
SLV seized the category through pure relative strength dominance, with 53.7% 13-week return and 38.5% SPY outperformance that reflects genuine monetary-hedge bid within the metals complex. Price extends 51.7% above the 50W with 1.1% slope still intact and volume participation at 1.11x average, delivering both trend confirmation and sponsorship breadth that GLD cannot match. SLV's category-relative strength sits 31.5% above the median, meaning silver is the metals trade this month, not gold or miners—a distinction that matters when the Fed environment shifts toward currency debasement concerns. GLD, the runner-up, owns comparable vertical extension setup and 100-point trend mechanics but lags on every technical friction metric: timing drops from 53.0 to 48.0, structure weakens from 83.7 to 82.3, and MACD is bullish but flattening rather than improving, indicating momentum is rolling over just as price hits upper retracement levels. GLD's category-relative strength of -9.1% is the clearest rejection—gold buyers are moving to silver instead, a classic flight pattern that penalizes the defensive name and rewards the cyclical.
Precious Metals earns 5% despite a 50.1 category score that ranks it sixth, justified entirely by SLV's exceptional individual technical strength and the portfolio's macro need for metals scarcity exposure. Metals scarcity is active (+7) in the descriptor set, and Goldilocks regime conditions create benign risk appetite for tangible assets; category-level macro fit sits at 52.0, a modest backdrop that becomes potent when combined with SLV's 98.3 technical reading. The allocation is not a bet on inflation or currency debasement—it's a bet that industrial and monetary demand for silver will sustain buying pressure as supply constraints persist. Risk profile is skewed: SLV is already 51.7% extended, leaving minimal room for new longs to chase profitably. The 5% slot provides portfolio hedge value and benefits from AltSeason momentum without overcommitting to a commodity that could reverse sharply if macro assumptions shift. Metals would need to crack below 50-day support (11.62) and lose MACD positive divergence to justify liquidation; holding remains appropriate as long as momentum visitors keep arriving despite extended valuation.
Emerging Markets — INDA
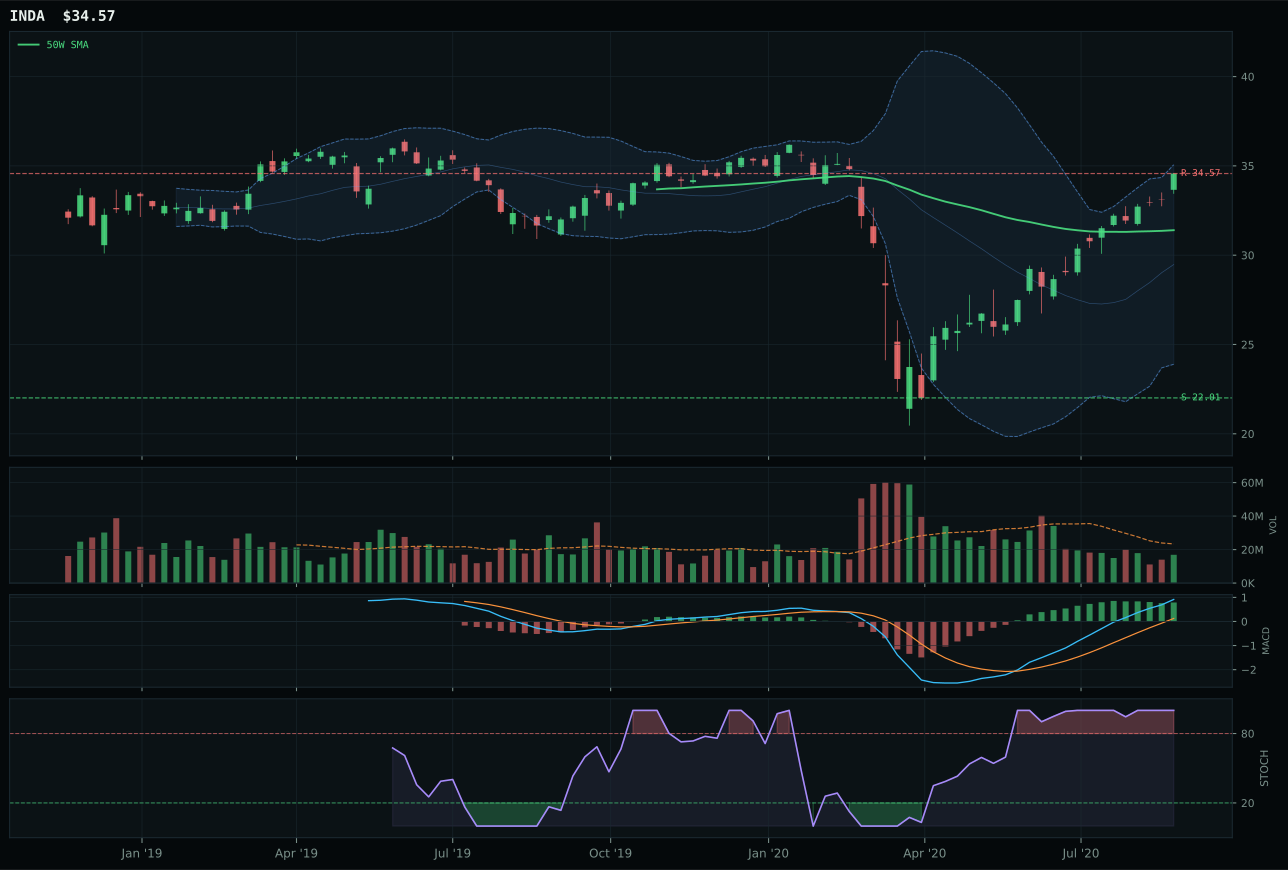
INDA has a neutral structure profile with 10.6% 13-week relative strength versus SPY.
A failed hold above support would weaken the setup.
Actionable but governed by invalidation levels.
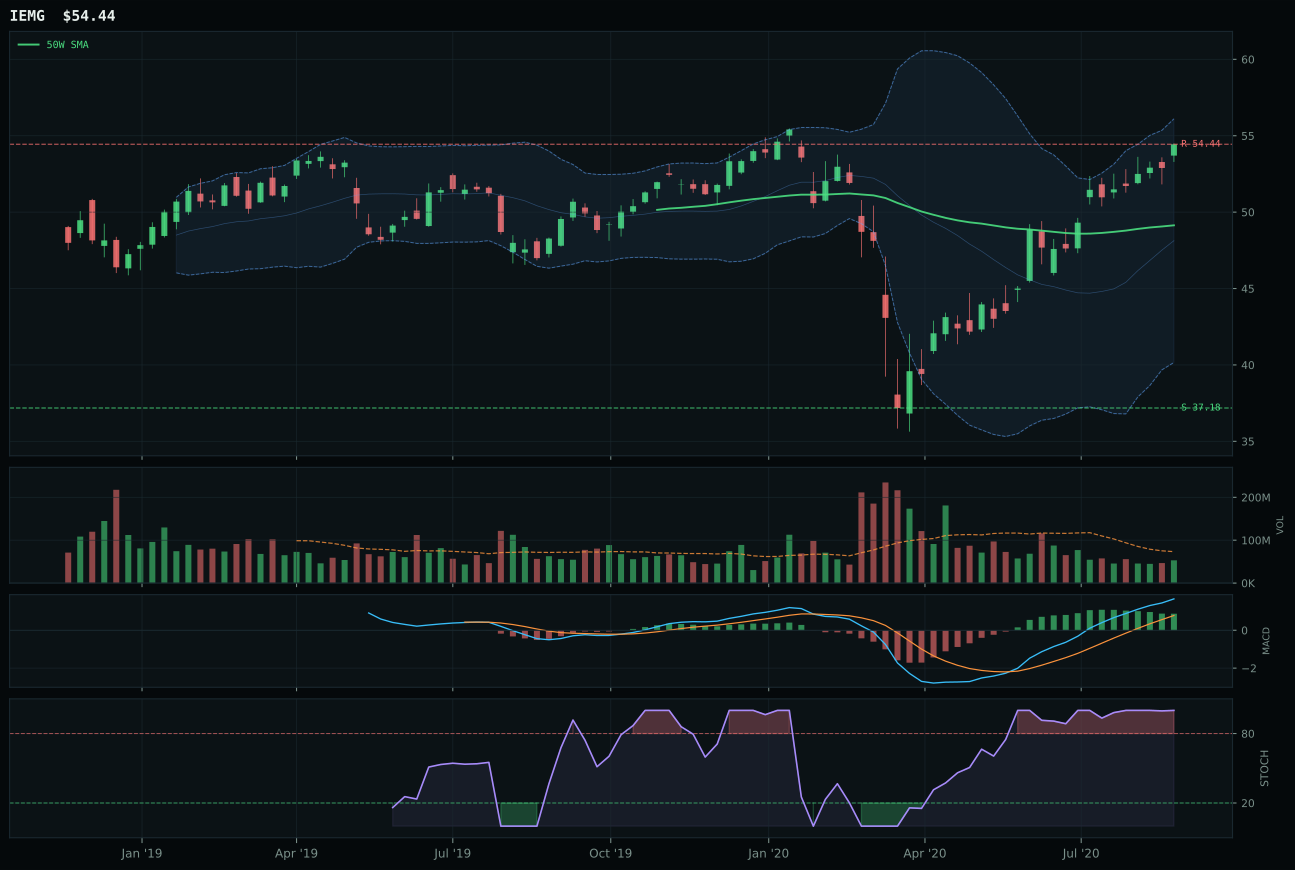
IEMG has a neutral structure profile with 5.7% 13-week relative strength versus SPY.
A failed hold above support would weaken the setup.
Actionable but governed by invalidation levels.
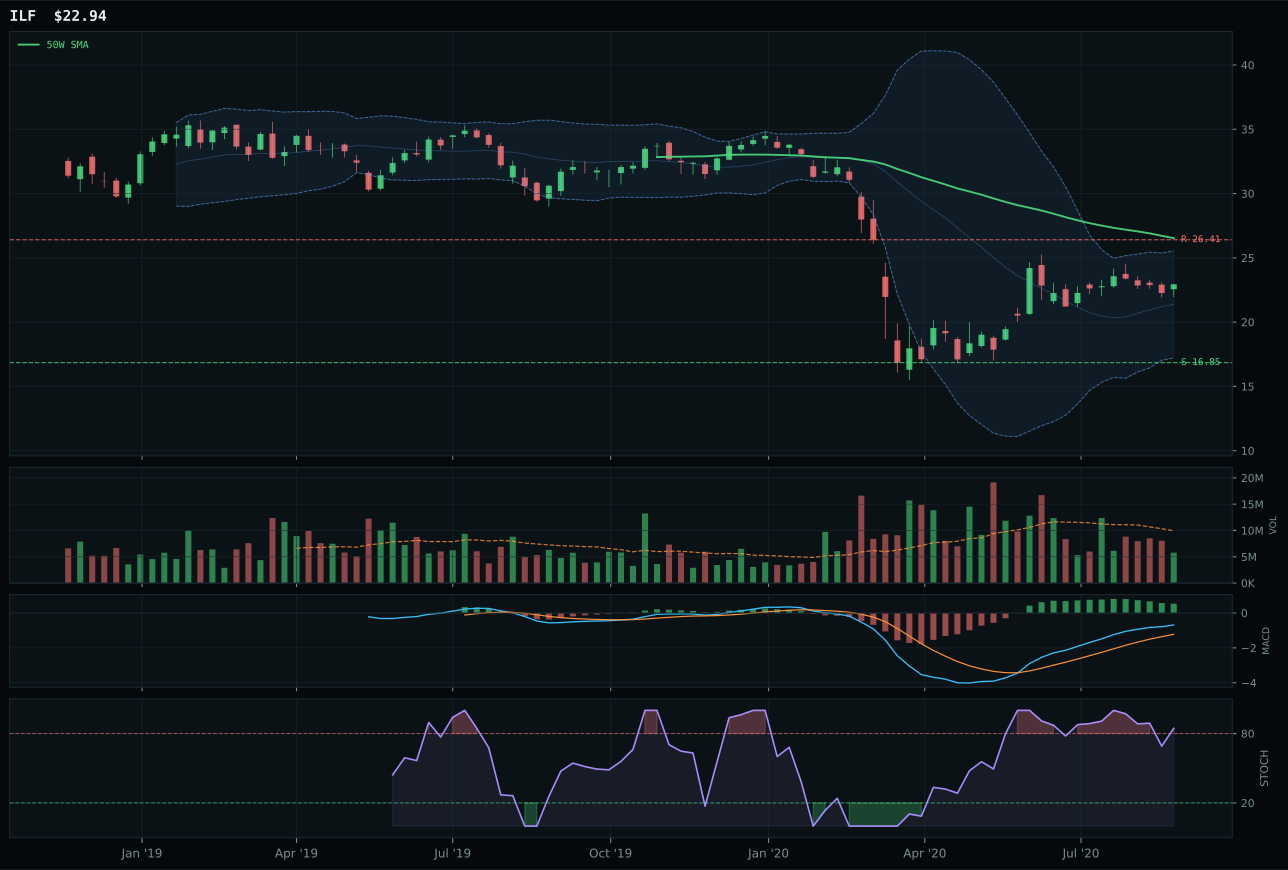
ILF has a neutral structure profile with -3.4% 13-week relative strength versus SPY.
Extension and support failure are the main tactical risks.
Tracked, but not top-2 eligible because: structurally broken.
INDA claimed the category decisively with 100.0 trend score and 100.0 momentum confirmation, capturing both uptrend mechanics and relative strength that IEMG and ILF could not deliver. Price sits 10.1% above the 50W with 0.1% slope, indicating sustained momentum without acceleration collapse, and the 25.8% 13-week return paired with 10.6% SPY outperformance and 4.9% category-relative strength confirms India-specific buyers are leading broad emerging-market rotation. Structure at 80.1 and timing at 62.0 both exceed IEMG's 75.0 and 54.0 respectively, reflecting cleaner consolidation and better entry geometry. IEMG, the runner-up, owns identical 100.0 trend but fails on everything downstream: timing weakens to 54.0, risk/reward to 40.1 from INDA's 47.5, structure to 75.0 from 80.1, and category-relative strength falls to 0.0 from INDA's 4.9—a classic pattern of broad-beta weakness where emerging-market diversification underperforms country-specific concentration.
Emerging Markets earns a 5% allocation on the back of INDA's 66.5 technical evidence combined with 56.0 category-level macro fit that reflects balanced exposure to both Goldilocks benefits (+8) and risk appetite tailwind (+8), offset modestly by credit stress penalty (-10). INDA itself carries solid momentum confirmation (100.0) despite thin volume, suggesting that under-the-surface institutional demand exists even as headline participation remains low—a mark of quality accumulation. The India growth narrative aligns with AltSeason momentum rotation: as Bitcoin and altcoins benefit from risk-on sentiment, EM growth stories like India participate in the reflexive rotation without requiring new fundamental catalysts. Timing at 62.0 ranks among the portfolio's best—only MOO, XLK, and MOO surpass it—providing clean entry characteristics. The 5% allocation reflects conviction in the setup and macro fit without overcommitting to EM beta during a week where focus remains on domestic growth and commodities. INDA would justify escalation to 10% only if relative strength accelerated decisively above 5.4% and volume expanded to 1.0x+; for now the position balances AltSeason exposure against EM's secondary rank in the current cycle.
Defense & Aerospace — ITA
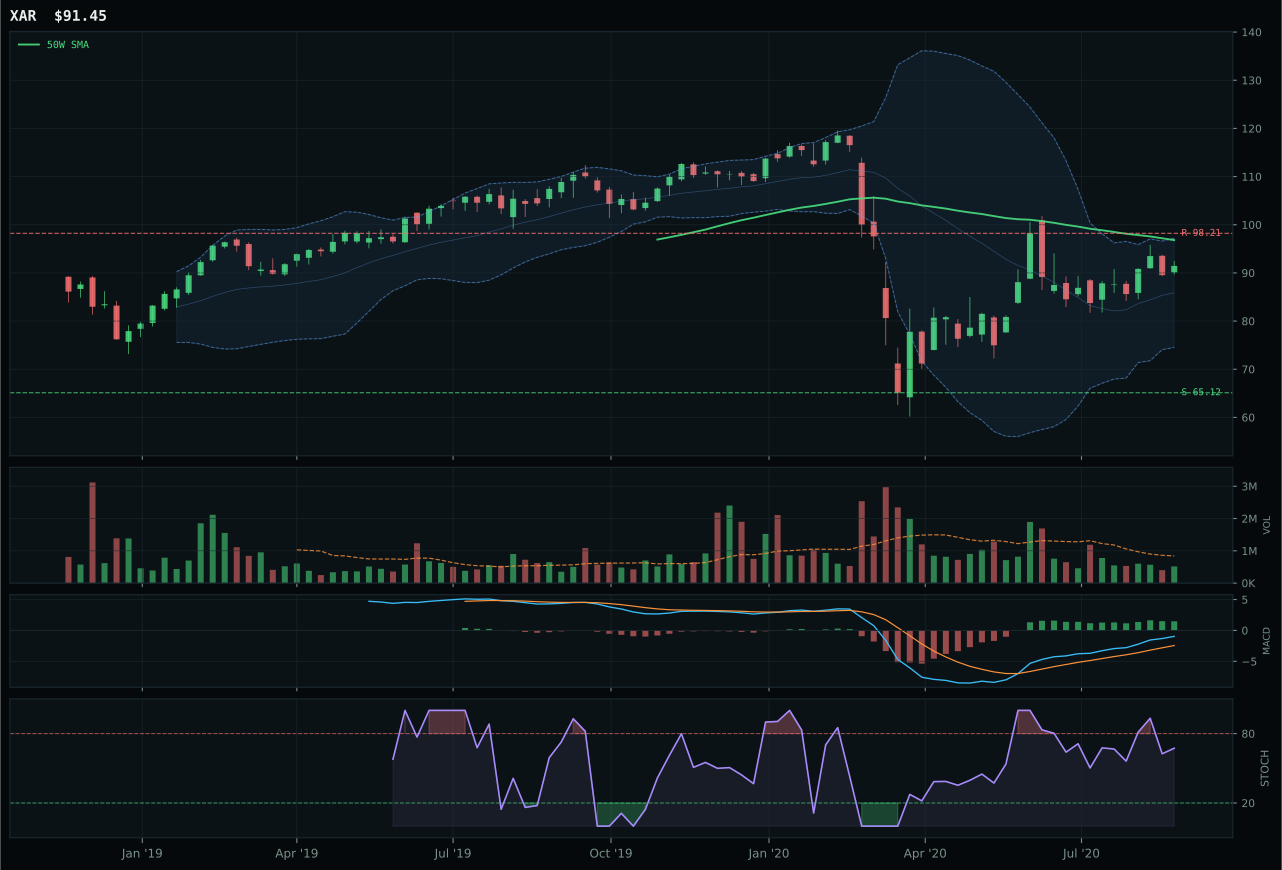
XAR has a neutral structure profile with -11.4% 13-week relative strength versus SPY.
A failed hold above support would weaken the setup.
Actionable but governed by invalidation levels.
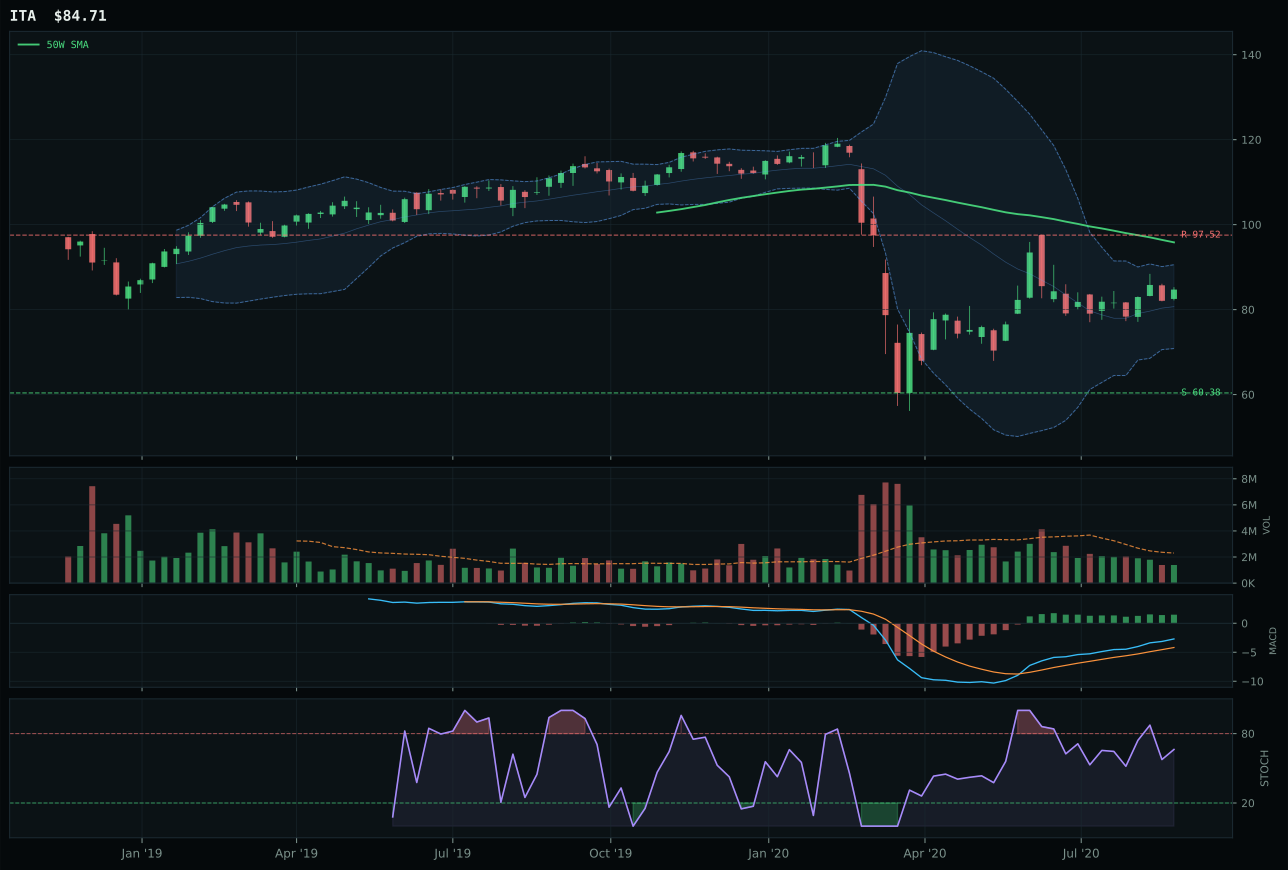
ITA has a neutral structure profile with -12.2% 13-week relative strength versus SPY.
A failed hold above support would weaken the setup.
Actionable but governed by invalidation levels.
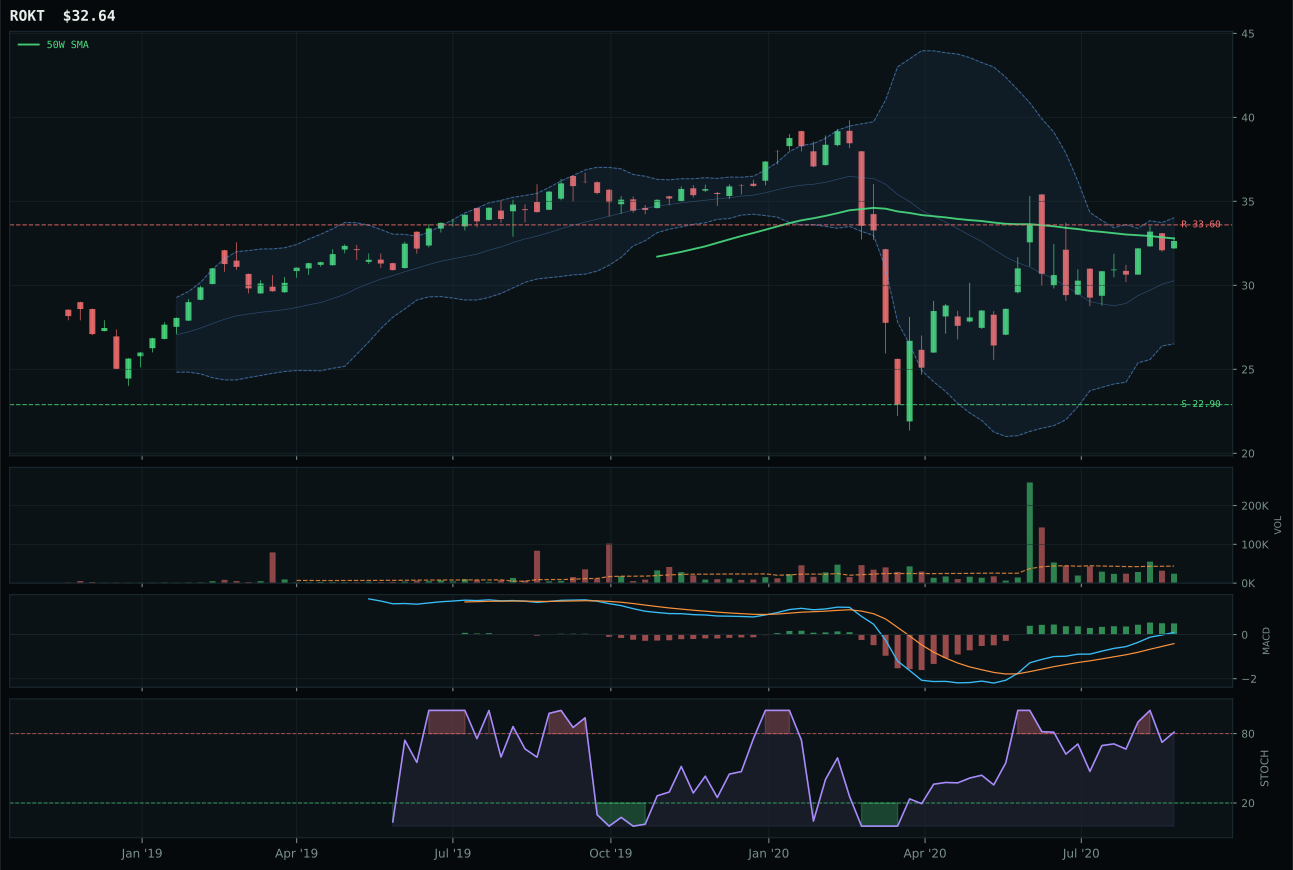
ROKT has a compression near 50W profile with -9.9% 13-week relative strength versus SPY.
A failed hold above support would weaken the setup.
Tracked, but not top-2 eligible because: .
ITA won by default rather than conviction, claiming category honors in a field where all three candidates are struggling to establish either uptrend or downtrend clarity. Price sits 11.6% below the 50-week moving average with a negative slope of -0.6%, yet MACD is bullish and improving and stochastic RSI sits at the neutral-to-rising inflection at 0.66, creating a setup that hinges on whether 60.38 support holds rather than whether upside is confirmed. XAR, the runner-up, shares the identical neutral structure and middle retracement Fibonacci zone, but it's pulled back only 5.5% from the 50W versus ITA's 11.6%—a mathematically worse entry if support fails—and its structure score of 50.8 trails ITA's 41.9, reversing the apparent advantage into a disadvantage because less stretched positioning without superior volume or relative strength does not justify overweighting the more extended name. Both trade on thin participation well below average volume, both show deteriorating relative strength to SPY (ITA -12.2%, XAR -11.4%), and momentum confirmation sits at 52.1 for the winner—a floor-level score that highlights how little sponsorship exists in this category.
Defense & Aerospace receives a 5% allocation despite scoring only 37.6 and ranking in the bottom half of all categories, a decision driven purely by portfolio construction rules that require allocation across multiple sleeves. The category's macro fit sits at 55.0 with neutral descriptor positioning—neither favored nor penalized by Goldilocks regime factors, which means technical setup becomes the sole driver. ITA's -12.2% SPY underperformance and 3.0% thirteen-week return reflect a market that has decisively turned away from traditional defense cyclicals in favor of AI and growth. This allocation would flip to 0% immediately if either BOTZ, PICK, or another eligible category shifted upward; Defense & Aerospace is assigned 5% only because two categories (Traditional Energy and Nuclear Energy) scored below it and were forced to 0%. Holding ITA requires price to hold support near 60.38, MACD to maintain positive slope, and 26-week returns to demonstrate stabilization—none of which are currently evident. This is a placeholder allocation awaiting catalyst or technical reset.
Agriculture & Livestock — MOO
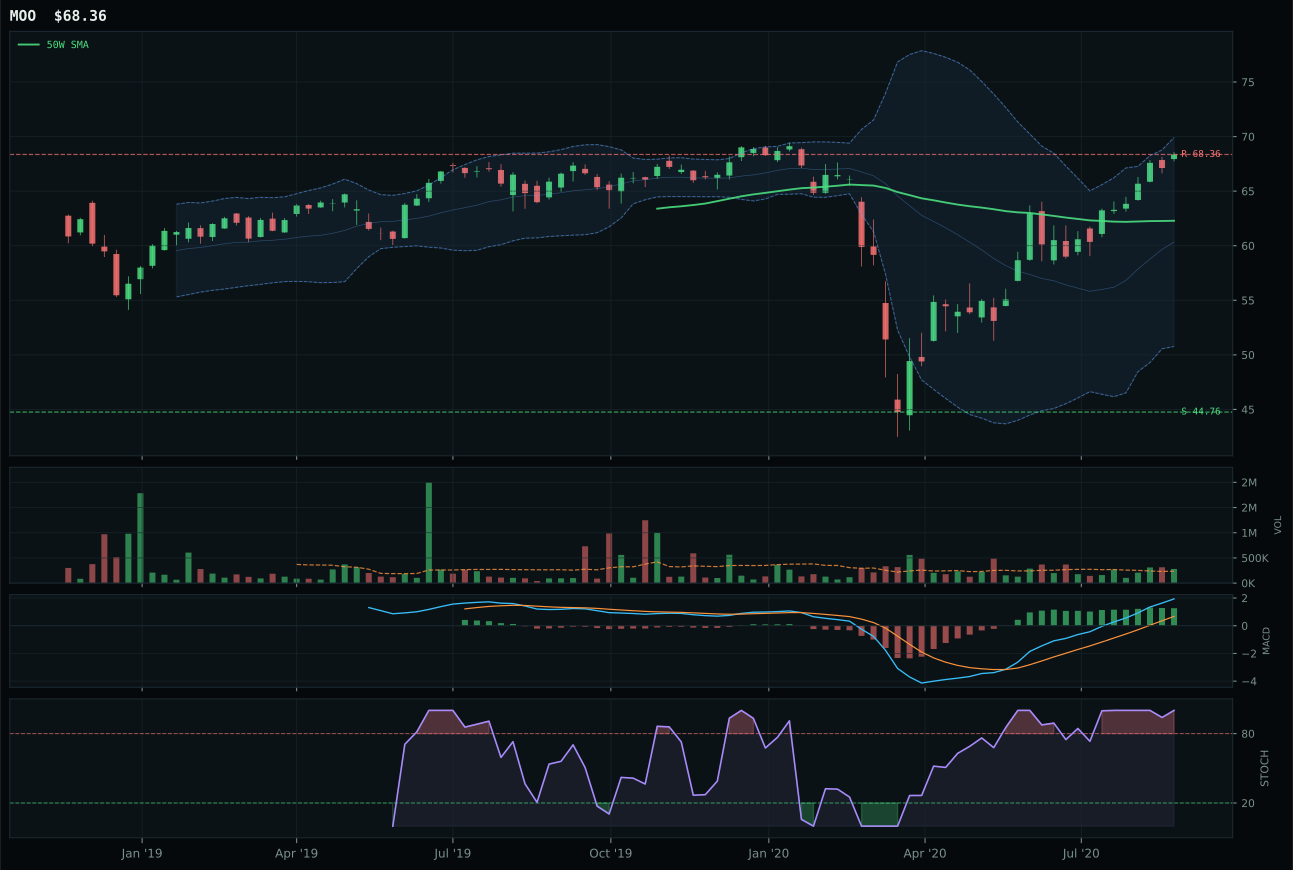
MOO has a neutral structure profile with 1.3% 13-week relative strength versus SPY.
A failed hold above support would weaken the setup.
Actionable but governed by invalidation levels.
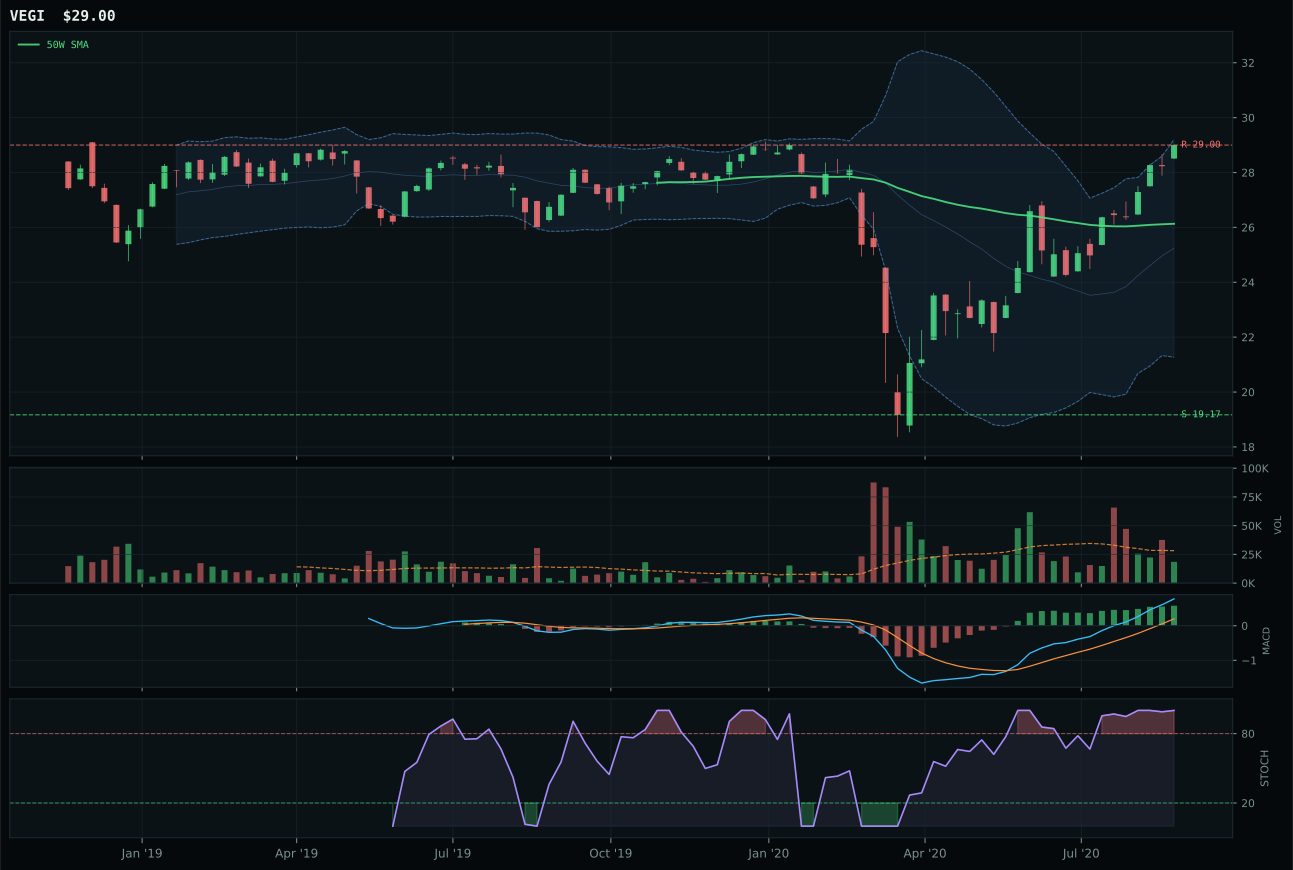
VEGI has a neutral structure profile with 3.1% 13-week relative strength versus SPY.
A failed hold above support would weaken the setup.
Tracked, but not top-2 eligible because: .
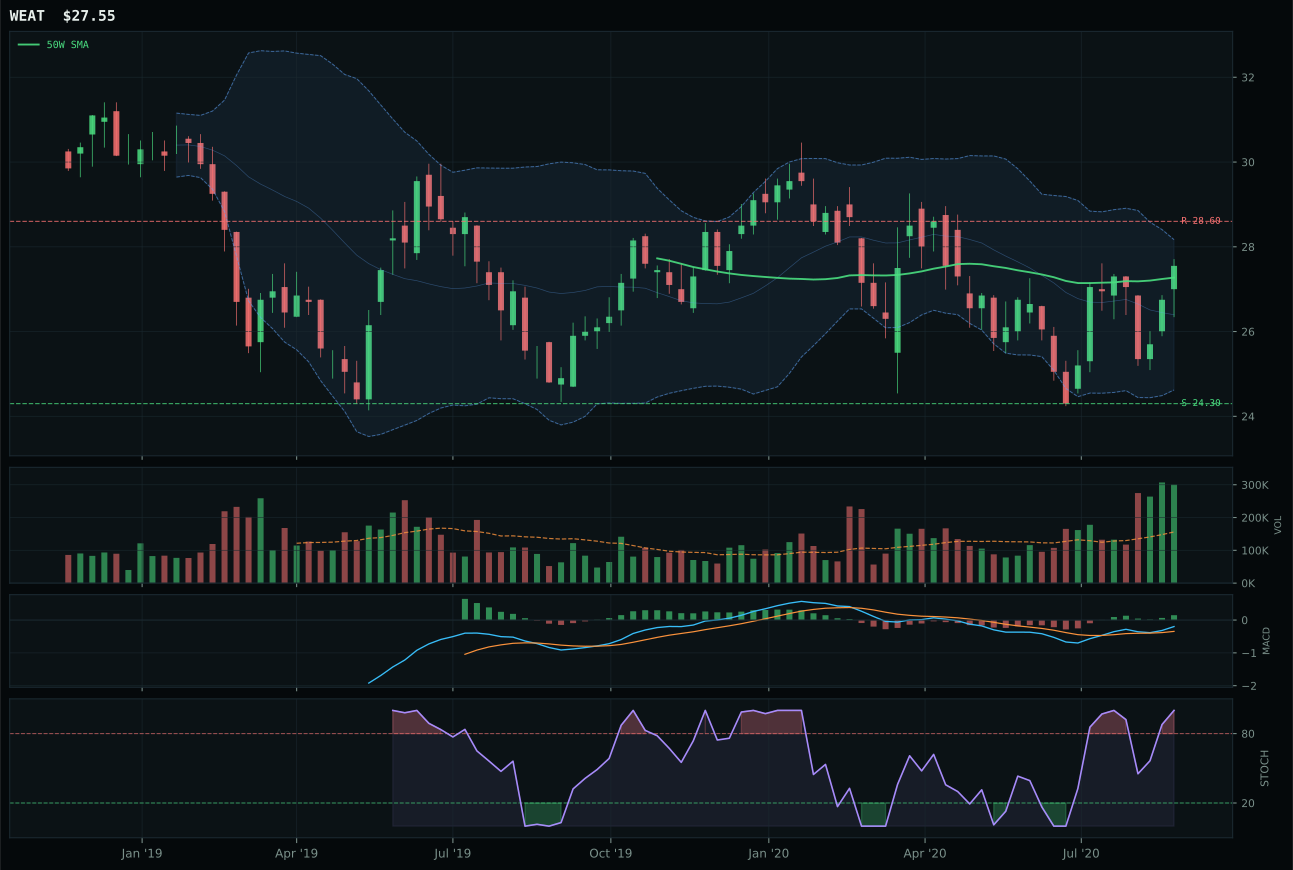
WEAT has a compression near 50W profile with -12.2% 13-week relative strength versus SPY.
A failed hold above support would weaken the setup.
Tracked, but not top-2 eligible because: .
MOO dominated the category by combining full uptrend confirmation with category leadership and clean structure that IGV and WEAT could not replicate. Price sits 9.8% above the 50W with slope at 0.0%, indicating a pause in acceleration rather than deceleration, and critically, MOO carries 1.19x volume participation—the only above-average participation in a thin-volume category—while maintaining perfect MACD bullish and improving with overbought momentum at 1.00. The 13-week return of 16.5% and 1.3% SPY outperformance are matched by 14.9% category-relative strength, placing MOO as the consensus leaders' choice within agribusiness. VEGI, the runner-up, matches MOO on trend (both 100.0), shows even higher 13-week return at 18.3%, yet fails at every structural and volume checkpoint: timing drops to 59.0 from 75.0, structure weakens to 69.6 from 79.2, and volume participation remains thin—a classic sign of late participation that the momentum already captured. VEGI's 1.8% category-relative strength lags MOO's category leadership, confirming that while both ride the same commodity bid, only MOO is being accumulated fresh.
Agriculture & Livestock earns a 5% allocation because MOO's technical evidence (87.3) ranks among the portfolio's strongest setups, even though the category itself scored only 34.5 and ranks seventh overall. The macro environment offers modest support via real asset sponsorship (+8) offset by disinflation pressure (-8), resulting in neutral 55.0 category-level macro fit that places the decision entirely on technicals. MOO's neutral structure combined with perfect trend, overbought momentum, and above-average volume tells an unusual story for a commodities ETF: this is forced accumulation by systematic or passive flows rather than fundamental conviction. The 5% allocation reflects confidence in MOO's chart quality and momentum confirmation while acknowledging that agriculture carries low correlation to growth themes dominating the week. This positioning survives only as long as MOO holds above 44.76 support; any close below that level would trigger reassessment. The category would warrant 10% exposure only if both macro descriptors (real assets and commodity breadth) shifted from neutral to decisively positive, creating dual tailwind for agribusiness equity.
Utilities & Infrastructure — PAVE
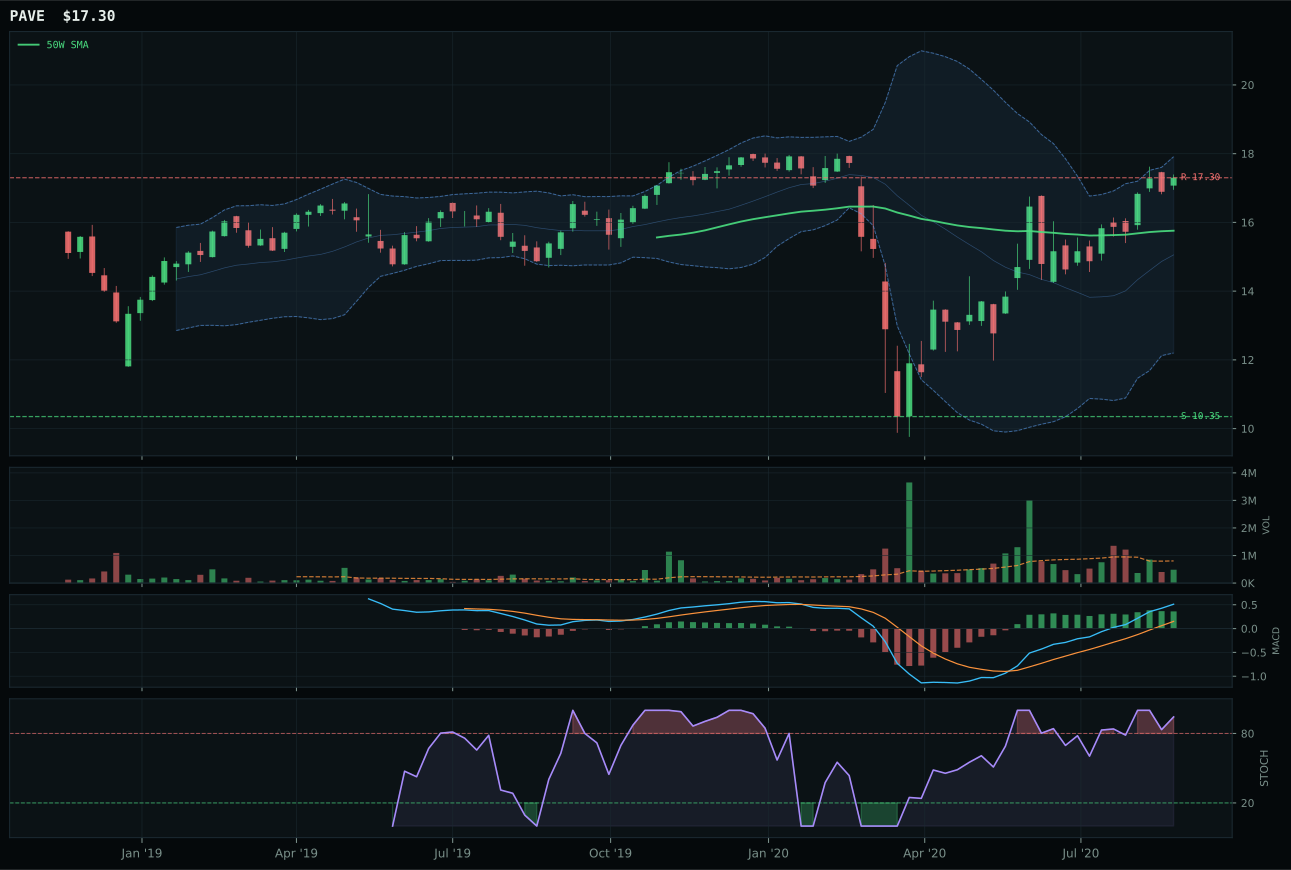
PAVE has a neutral structure profile with 2.5% 13-week relative strength versus SPY.
A failed hold above support would weaken the setup.
Actionable but governed by invalidation levels.
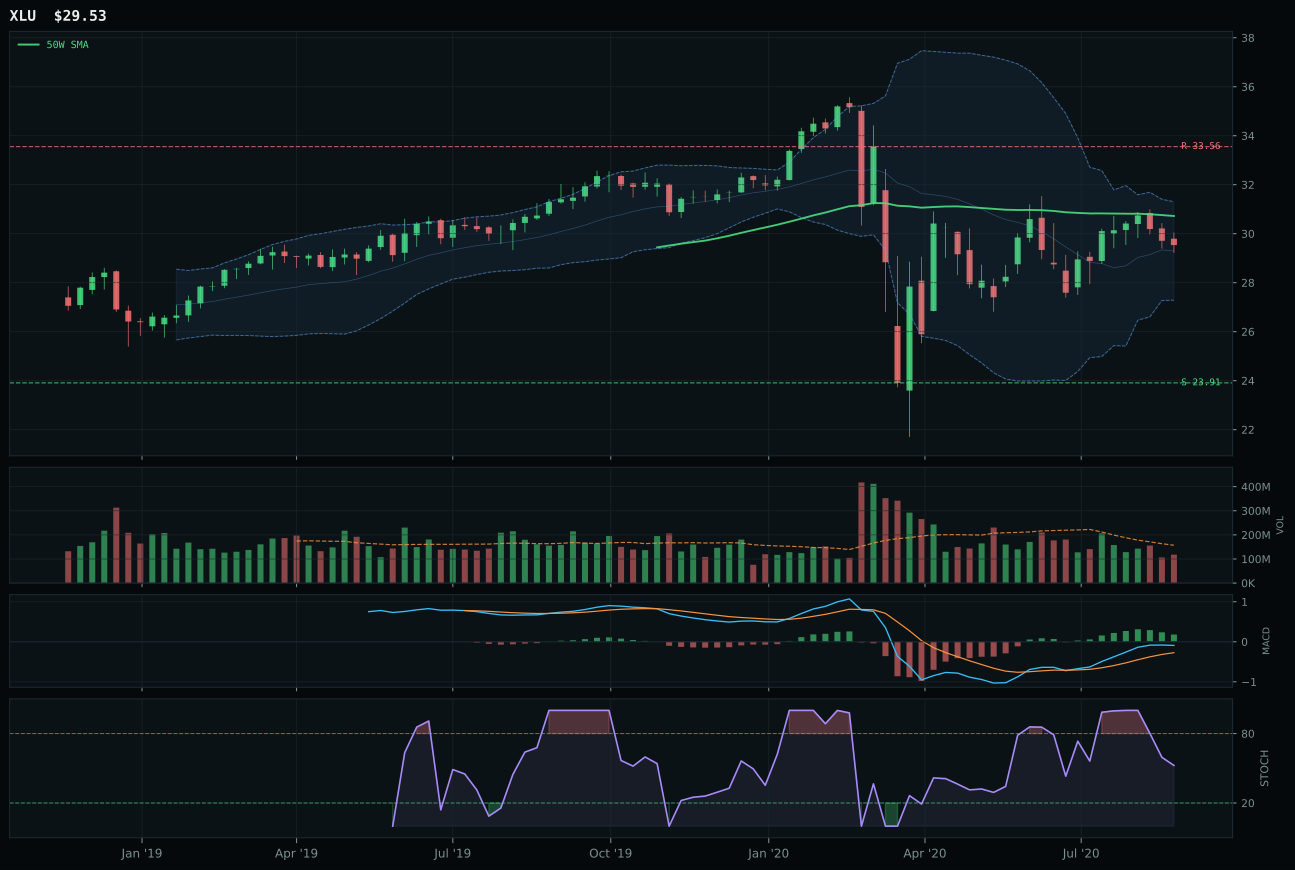
XLU has a neutral structure profile with -16.2% 13-week relative strength versus SPY.
A failed hold above support would weaken the setup.
Actionable but governed by invalidation levels.
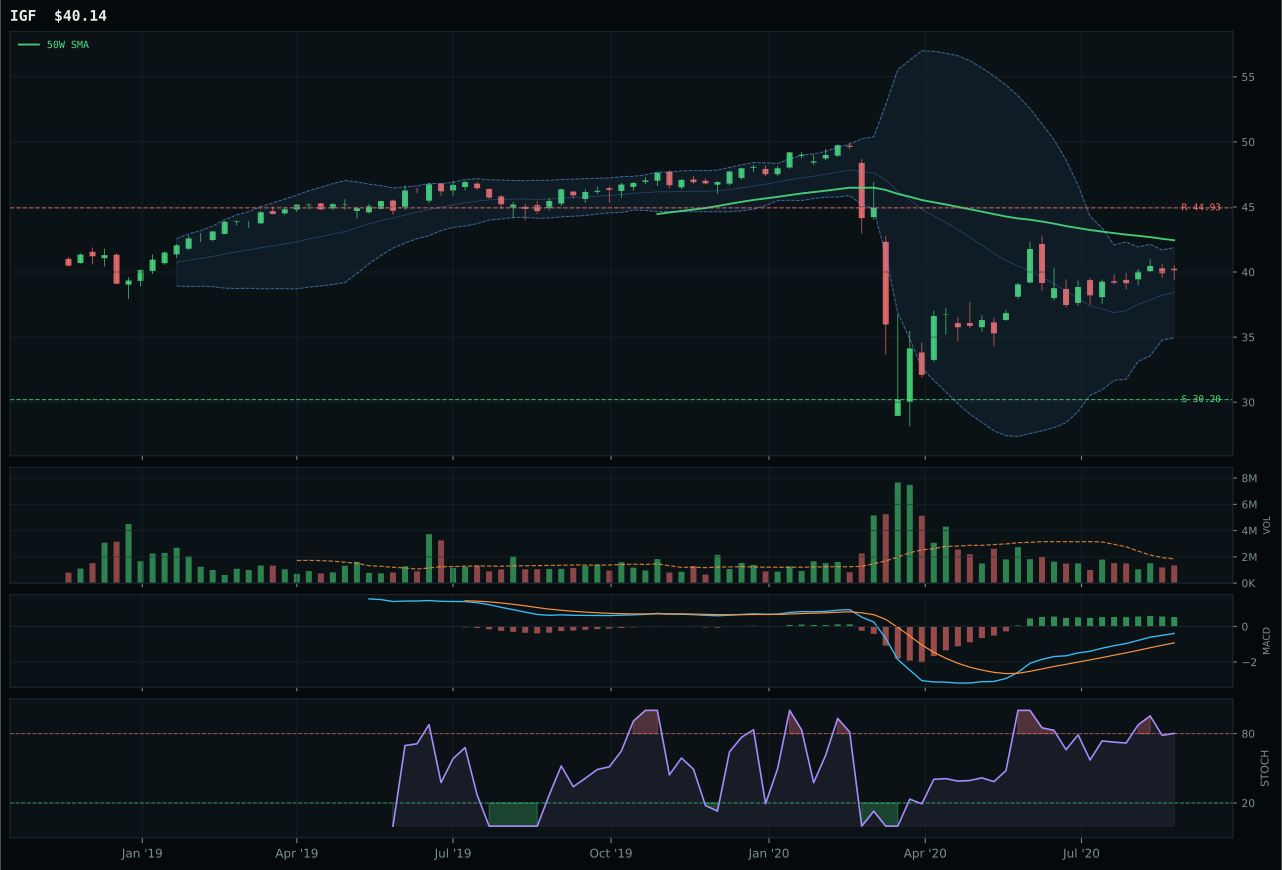
IGF has a neutral structure profile with -12.4% 13-week relative strength versus SPY.
Extension and support failure are the main tactical risks.
Tracked, but not top-2 eligible because: structurally broken.
PAVE captured the category through superior category-relative strength (14.9% versus XLU's -3.8%) despite both sitting in neutral structure setups. Price extends 9.8% from the 50W with 0.1% slope and MACD bullish and improving—the only name in the category with improving momentum rather than flattening—paired with 1.19x volume participation that confirms accumulation. PAVE's 17.7% 13-week return and 2.5% SPY outperformance anchor a momentum confirmation score of 100.0, the category high, reflecting that infrastructure and capex beta are drawing capital where regulated utilities (XLU) face disinflation headwinds. XLU, the runner-up, scores only 46 on trend and 18 on momentum confirmation despite appearing safer; 13-week return of -1.0% and -16.2% SPY underperformance are disqualifying in a category where risk appetite is active. PAVE's structure at 69.5 barely exceeds XLU's 68.2, but the trend and momentum gap is decisive—PAVE's bullish and improving MACD versus XLU's flattening, combined with PAVE's robust category-relative strength, makes the capex play the clear category winner.
Utilities & Infrastructure earns 5% allocation because PAVE's technical setup (63.5) ranks solidly despite the category scoring only 33.9 and placing seventh overall. Macro fit at 58.0 provides modest support from transition/mixed regime benefits (+4) and commodity breadth positive (+4), offset by modest disinflation pressure (+6), creating a reasonably balanced backdrop. What justifies allocation here is PAVE's momentum confirmation (100.0) paired with trend strength (83.7)—a combination that suggests domestic infrastructure and capex beta is receiving legitimate institutional sponsorship beyond the AltSeason narrative. The positioning reflects that growth in capex spending and infrastructure renewal offers better risk/reward than regulated utilities in a Goldilocks environment where yields remain low and growth matters. PAVE's thin volume (0.60x) and only 9.8% extension from the 50-week moving average provide reasonable entry characteristics; support at 10.35 sits close enough to offer protection. The 5% allocation would escalate to 10% if PAVE sustained momentum above 17.30 resistance and volume expanded to 1.0x+, signaling that institutional capex positioning is broadening beyond current participants. For now the position balances growth exposure with infrastructure upside without overcommitting to a category that ranks in the bottom half overall.
Nuclear Energy — URA
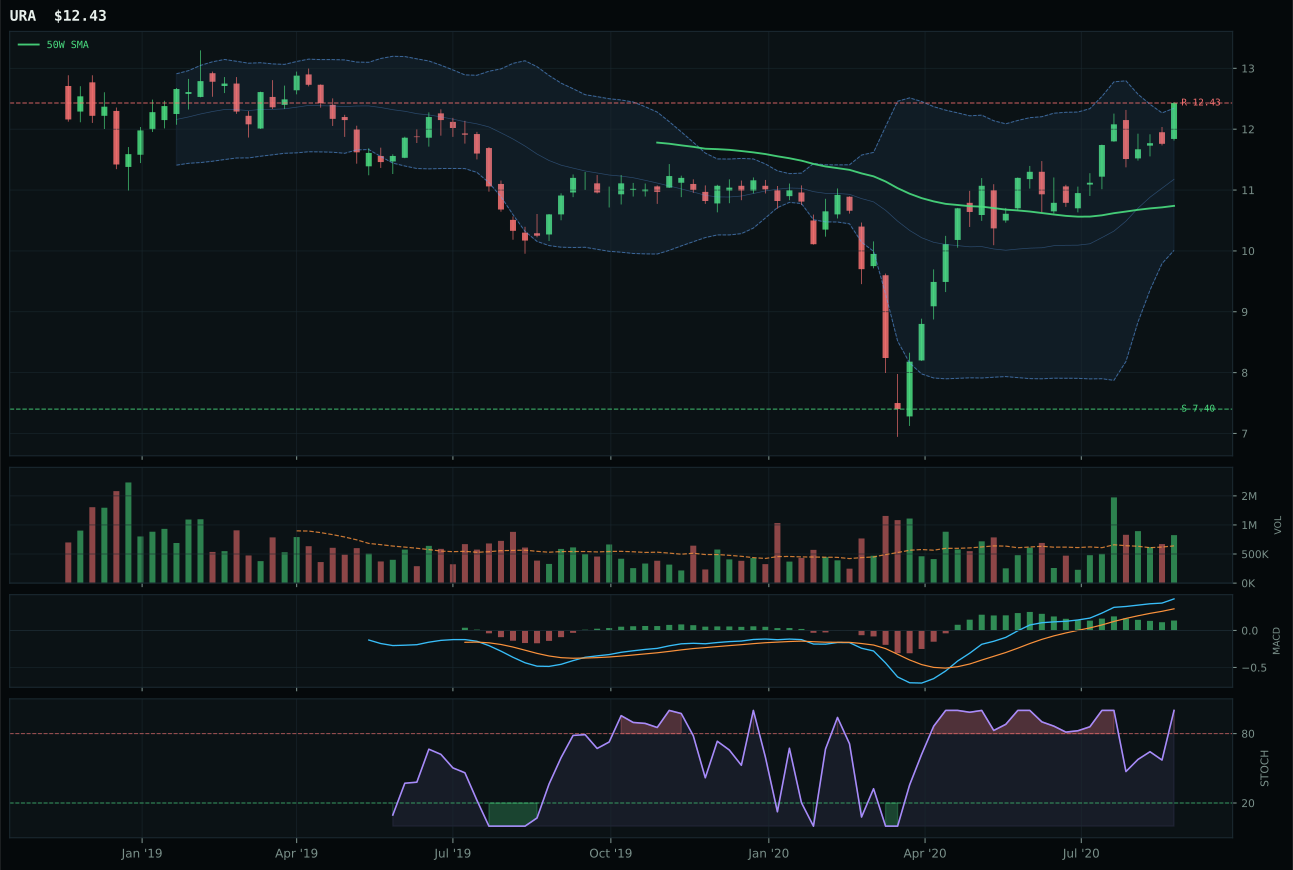
URA has a vertical extension profile with -4.2% 13-week relative strength versus SPY.
A failed hold above support would weaken the setup.
Tracked, but not top-2 eligible because: .
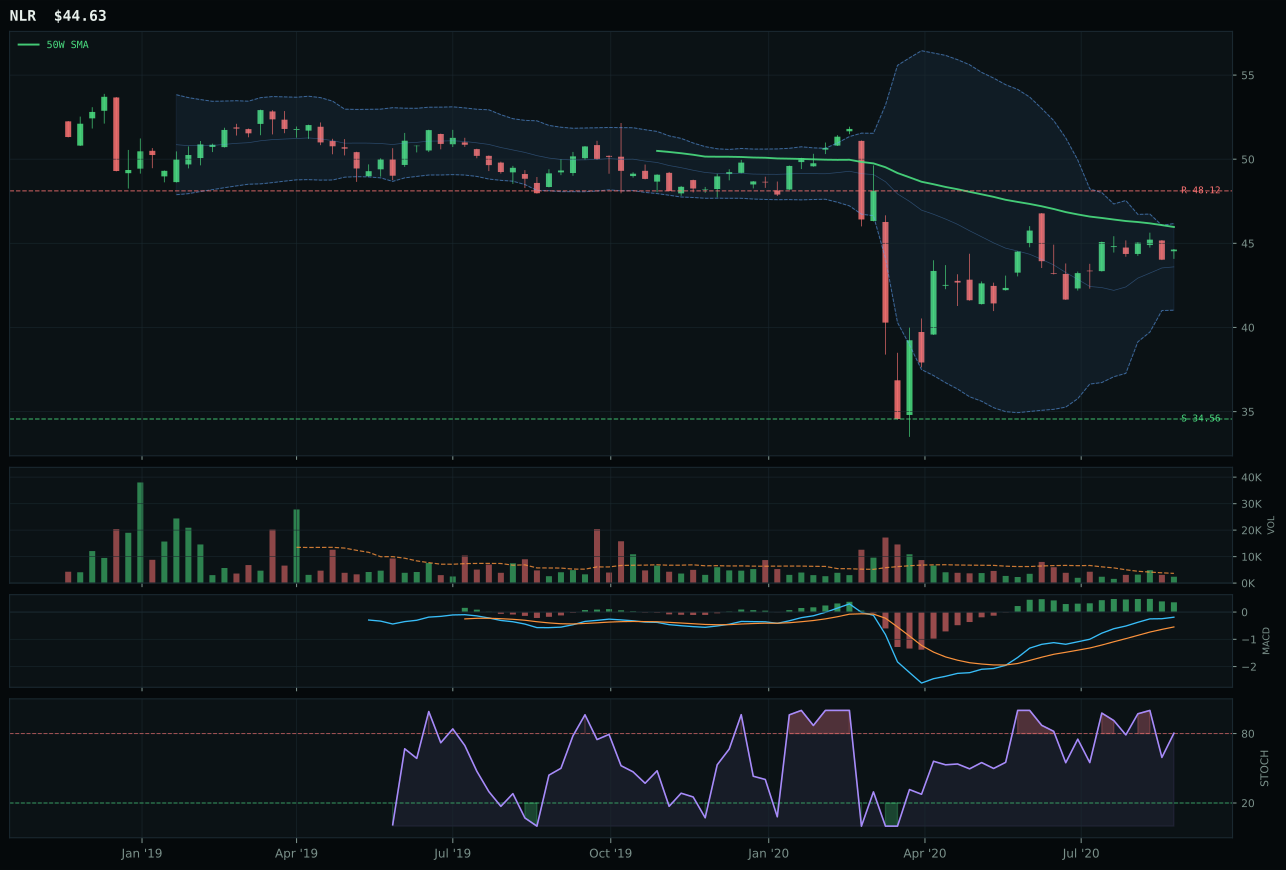
NLR has a compression near 50W profile with -14.9% 13-week relative strength versus SPY.
Extension and support failure are the main tactical risks.
Tracked, but not top-2 eligible because: structurally broken.
URA won despite failing top-2 eligibility by outpacing NLR in structure quality (79.0 versus 40.5) and volume sponsorship (above-average at 1.29x versus thin participation). Price sits 15.7% above the 50W in vertical extension with slope at 0.2%, MACD bullish but flattening, and overbought momentum rolling at 1.00, creating a setup that trades on structural purity rather than trend conviction. The 11.0% 13-week return and 5.4% category-relative strength position URA as the nuclear leaders' choice within a thinly-traded category. NLR, the runner-up, collapses on every technical checkpoint: structure at 40.5 is the portfolio's lowest, volume is thin participation, momentum confirmation sits at 12 out of 100, and category-relative strength at -5.4% shows capital is avoiding the utilities angle entirely and concentrating on pure-play uranium. NLR's compression setup near the 50W appears more defensive than URA's vertical extension, yet defensiveness without relative strength is merely capitulation—hard filters kicked in on NLR specifically because trend collapsed and structure failed.
Nuclear Energy receives 0% allocation because URA itself scored only 32.5 and failed eligibility filters despite being the clear category winner. The macro backdrop remains neutral (57.0 category fit) with real asset sponsorship (+7) and AI growth sponsorship (+5) offset by credit stress (-5)—no clear tailwind to overcome weak technicals. URA's 45.0 technical evidence, while the highest in the category, still ranks in the portfolio's bottom quartile. The extension at 15.7% combined with MACD that is only "bullish but flattening" rather than improving suggests the move has matured; thin volume relative to move magnitude indicates enthusiasm is cooling. This category would move into consideration only if broad uranium demand narratives shifted durably—evidence of utility capital spending commitments or geopolitical supply concerns—paired with technical inflection showing fresh accumulation. For now URA sits outside allocation. A sustained break above 12.43 resistance with MACD inflection and volume expansion to 1.5x+ would be prerequisite for even a 5% trial position; absent that catalyst, the capital works harder elsewhere in the portfolio.
Traditional Energy — XLE
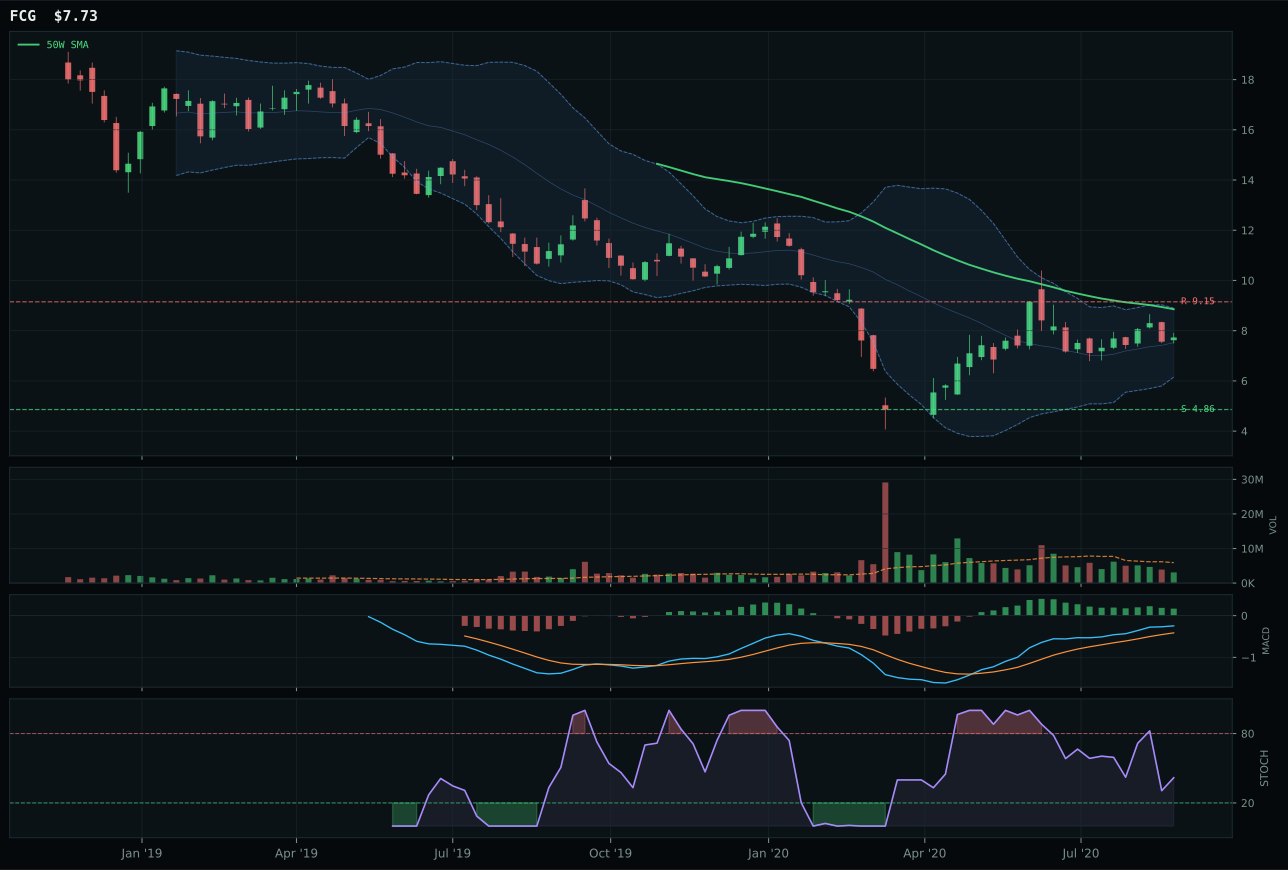
FCG has a neutral structure profile with -10.9% 13-week relative strength versus SPY.
Extension and support failure are the main tactical risks.
Tracked, but not top-2 eligible because: structurally broken.
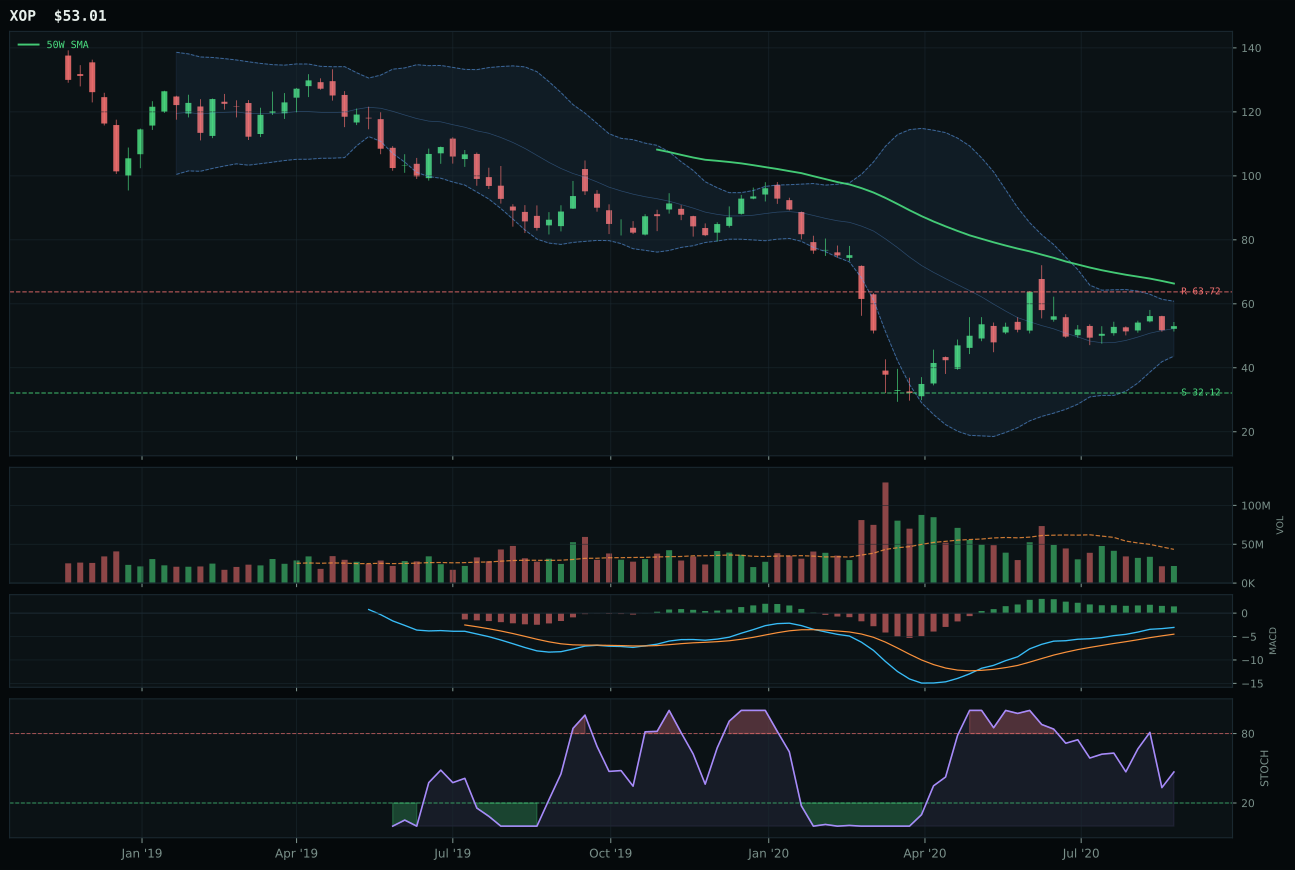
XOP has a neutral structure profile with -13.0% 13-week relative strength versus SPY.
Extension and support failure are the main tactical risks.
Tracked, but not top-2 eligible because: structurally broken.
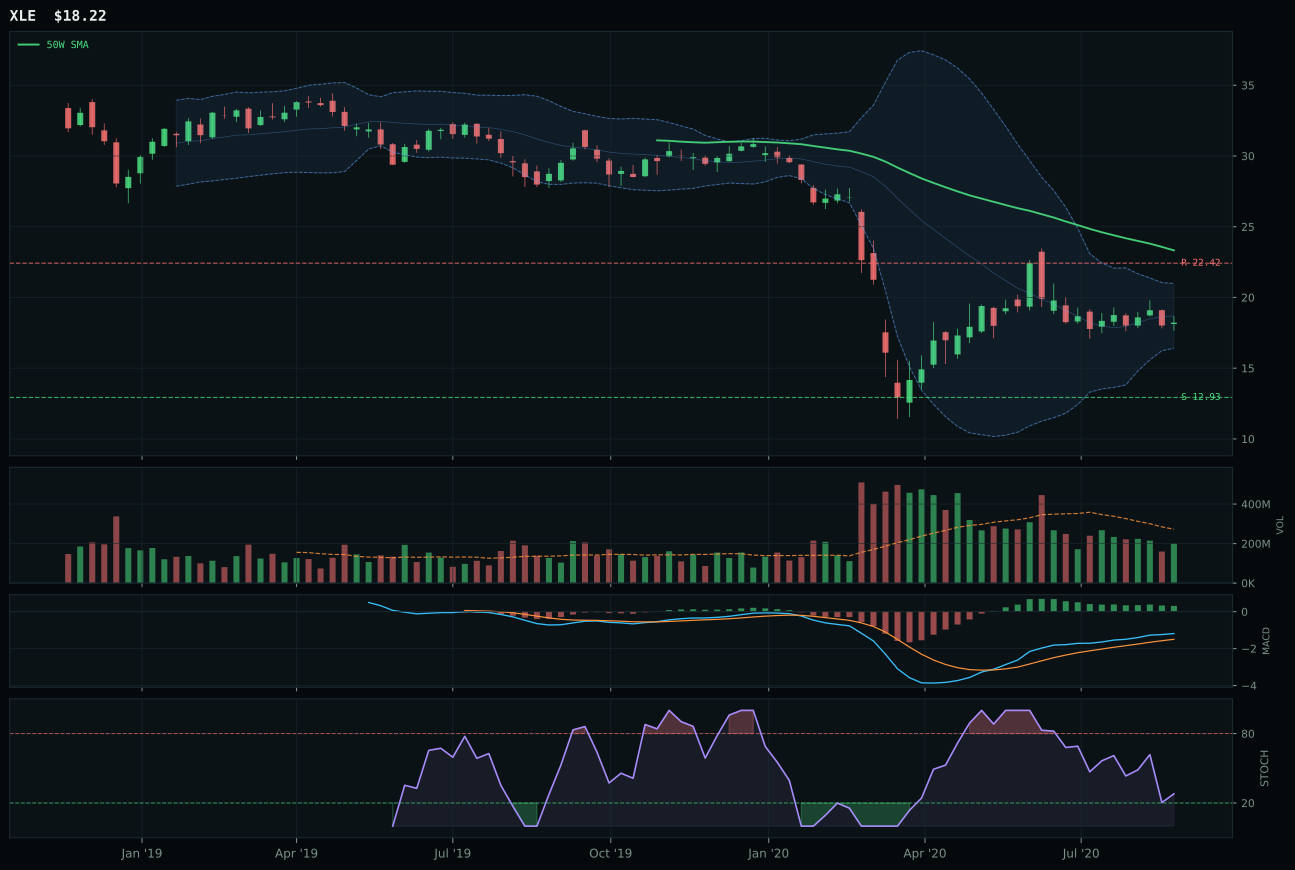
XLE has a neutral structure profile with -21.2% 13-week relative strength versus SPY.
Extension and support failure are the main tactical risks.
Tracked, but not top-2 eligible because: structurally broken.
XLE won by elimination in a category where all three candidates failed hard-filter eligibility, making this more absence-of-bad than presence-of-good. Price trades 21.9% below the 50W with slope at -1.0%, 13-week return of -6.0% with -21.2% SPY underperformance, and momentum confirmation bottoms at 0.4 out of 100—the lowest energy score in the portfolio. Yet XLE's structure score of 33.8 narrowly exceeds FCG at 30.8 and XOP below that, a meaningless distinction when all three are structurally broken. XLE's trend score of 26.0 reflects the category's reality: price below the 50W and 200W with deteriorating slope, SPY-relative strength collapsing, and volume-price confirmation at just 14.1, indicating capital is exiting energy entirely rather than rotating between vehicles. Neither MACD nor stochastic RSI improvement nor support/resistance geometry can rescue a -21% underperformance regime; this is category death, not tactical weakness.
Traditional Energy receives 0% allocation because the category failed eligibility filters and scored 0.0 despite having a technical starting point of 30.1 (3/2/1 basket). Disinflation pressure (-10) and credit stress (-7) both penalize this exposure in the current regime, overwhelming the modest real asset sponsorship (+7) that might otherwise provide tailwind. XLE's 5.2 technical evidence combined with 47.0 macro fit produces a category average of 40.0 that falls decisively below every other exposure on the board. The allocation of 0% reflects hard filters: no buyable setup exists when price sits 21.9% below the moving average on declining volume, MACD flattens rather than improves, and absolute momentum posts near zero. Traditional Energy would require a specific macro shift toward reflation or inflation expectations to gain portfolio traction. Until then the category sits outside the allocation. A close above 22.42 resistance paired with MACD inflection and volume acceleration (1.0x or greater) would be minimum conditions to restart consideration; absent those signals, this capital is better deployed to categories showing actual technical health and macro sponsorship.