
2020-08-21
Informational purposes only. The content in this report, including allocations, analysis, and commentary, is provided solely for informational and educational purposes. It does not constitute financial advice, investment advice, trading advice, or any other type of advice. Past performance does not guarantee future results. Always conduct your own research and consult a qualified financial professional before making investment decisions.
Some tracked tickers were excluded due to missing live weekly price data: SGOV: Historical cache SGOV has only 12 usable weekly bars; URNM: Historical cache URNM has only 38 usable weekly bars
Weekly Allocation
| Ticker | Category | Weight | Role |
|---|---|---|---|
| FSOL | 50% | Overlay | |
| SLV | Precious Metals | 10% | Top-2 (10%) |
| INDA | Emerging Markets | 10% | Top-2 (10%) |
| XLK | Technology | 5% | Tier-2 (5%) |
| SMH | AI | 5% | Tier-2 (5%) |
| REMX | Industrial Metals | 5% | Tier-2 (5%) |
| XAR | Defense & Aerospace | 5% | Tier-2 (5%) |
| PAVE | Utilities & Infrastructure | 5% | Tier-2 (5%) |
| URA | Nuclear Energy | 5% | Tier-2 (5%) |
Trade Instructions — Monday Open
Sell the tranche from 2020-07-24 (completing its 4-week hold). Buy the new tranche. Instructions show net portfolio changes — same-asset positions cancel, weight changes show the delta.
| Action | Ticker | Instruction |
|---|---|---|
| SELL | SLV | Sell 22% of SLV position (reduce 11.25% → 8.75%) |
| SELL | CIBR | Sell 67% of CIBR position (reduce 7.50% → 2.50%) |
| SELL | SMH | Sell 20% of SMH position (reduce 6.25% → 5.00%) |
| SELL | MOO | Sell 67% of MOO position (reduce 3.75% → 1.25%) |
| SELL | XAR | Sell 20% of XAR position (reduce 6.25% → 5.00%) |
| SELL | XLE | Sell 67% of XLE position (reduce 3.75% → 1.25%) |
| SELL | REMX | Sell 17% of REMX position (reduce 7.50% → 6.25%) |
| SELL | XLU | Sell 67% of XLU position (reduce 3.75% → 1.25%) |
| BUY | URA | Buy URA — 6.67% of freed cash (adds 1.25% to portfolio) |
| BUY | FSOL | Buy FSOL — 66.67% of freed cash (adds 12.50% to portfolio) |
| BUY | XLK | Buy XLK — 6.67% of freed cash (adds 1.25% to portfolio) |
| BUY | INDA | Buy INDA — 13.33% of freed cash (adds 2.50% to portfolio) |
| BUY | PAVE | Buy PAVE — 6.67% of freed cash (adds 1.25% to portfolio) |
Current Portfolio After Trade
Combined holdings across all 4 active tranches. Each tranche is 25% of the portfolio.
| Ticker | % of Portfolio | Weight Bar |
|---|---|---|
| FBTC | 25.00% | |
| FSOL | 25.00% | |
| SLV | 8.75% | |
| REMX | 6.25% | |
| SMH | 5.00% | |
| XAR | 5.00% | |
| INDA | 5.00% | |
| URA | 3.75% | |
| XLK | 3.75% | |
| CIBR | 2.50% | |
| PAVE | 2.50% | |
| BOTZ | 2.50% | |
| MOO | 1.25% | |
| XLE | 1.25% | |
| XLU | 1.25% | |
| FCG | 1.25% |
Macro Regime — Goldilocks
Macro Evidence Charts
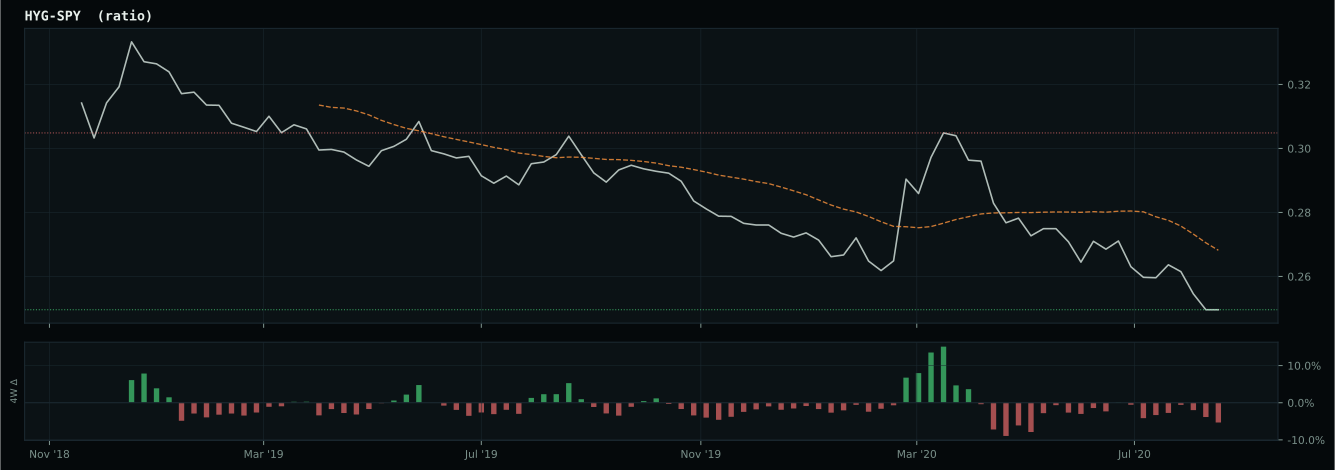
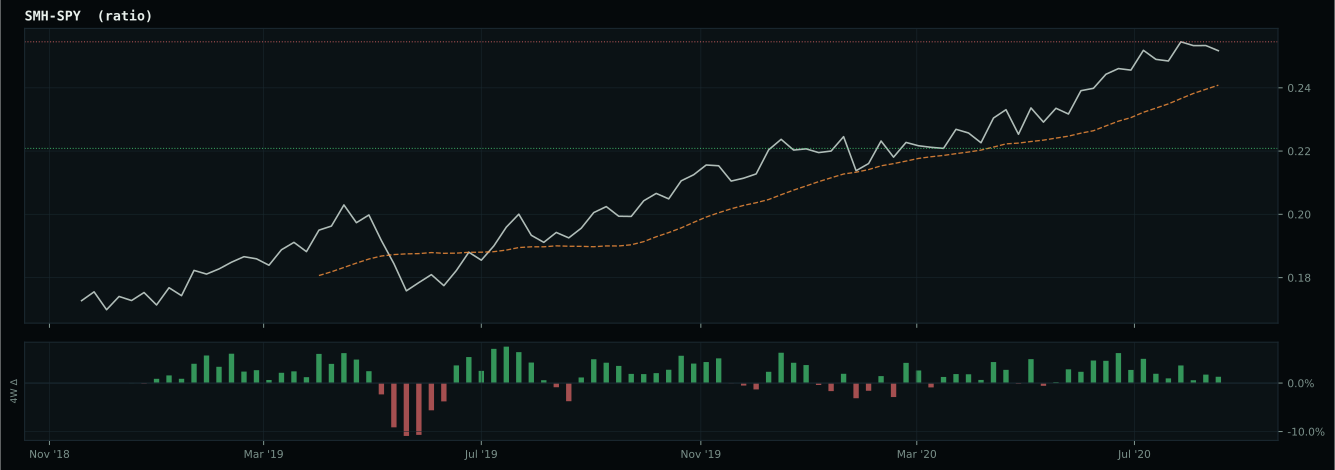
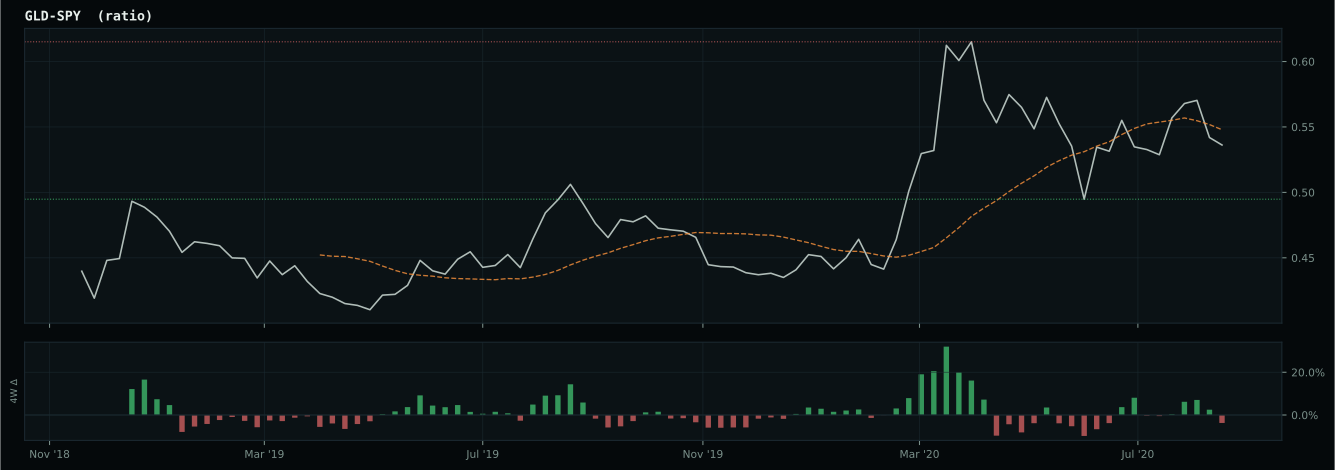
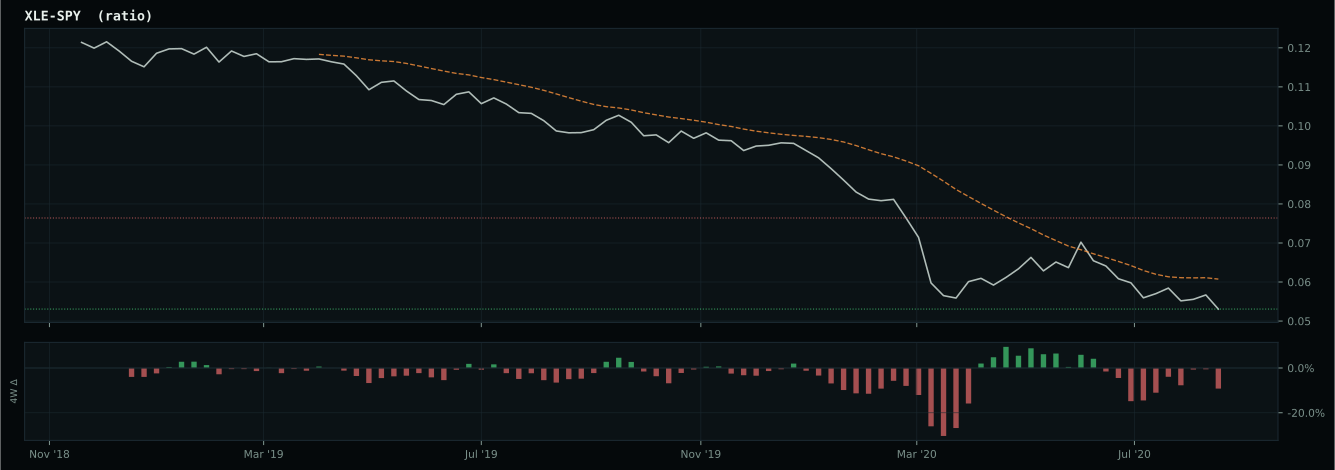
Market-implied signals behind the macro regime scores. Each ratio compares two assets; the direction and slope of the ratio is what the macro engine reads.
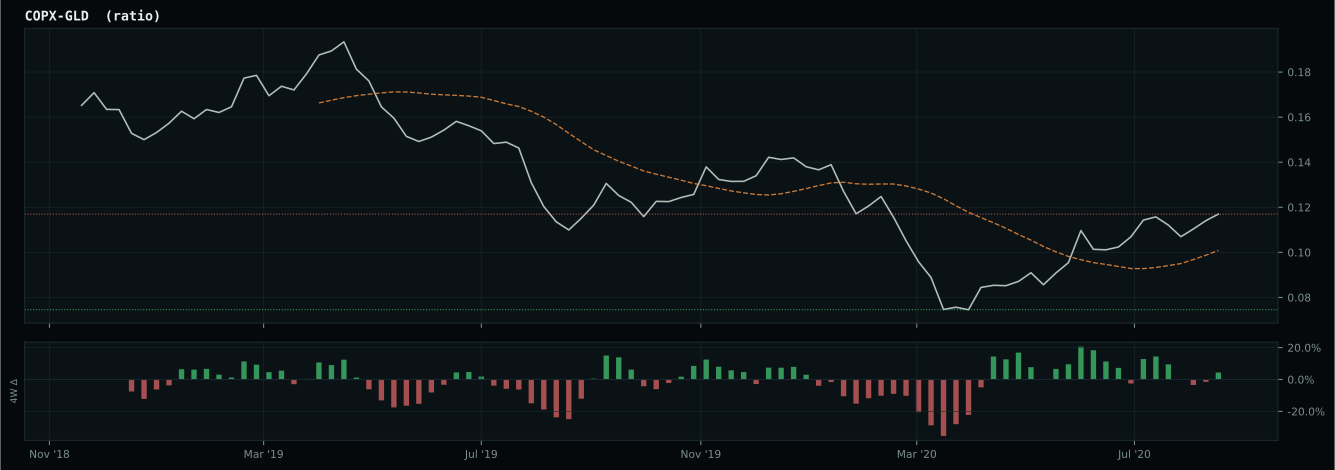
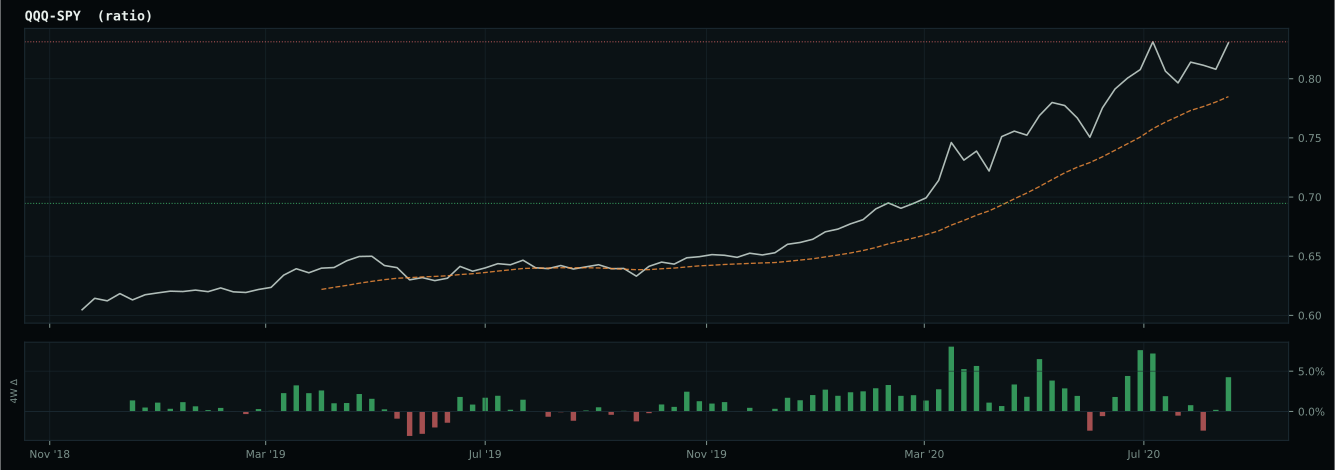
Crypto Regime — AltSeason
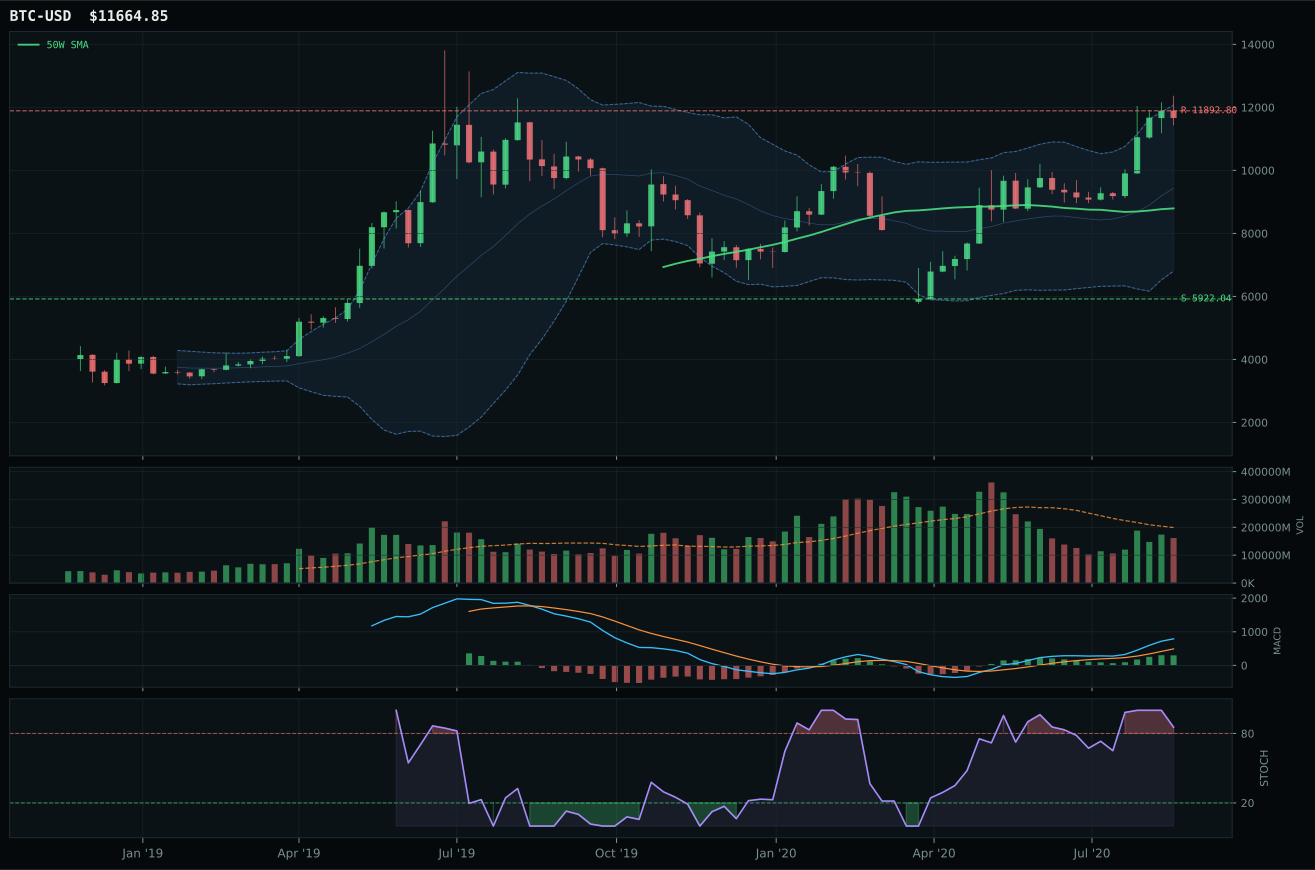
post-touch structure is too wide to count as a range; max/min close ratio is 2.21
TrendBTC confirmed: 2 consecutive closes above rising/flat 50W SMA
all available AltSeason conditions pass; missing optional confirmations skipped

Category Rankings
| Rank | Category | Winner | Score | Alloc | 4W Ret | Peers (4W) |
|---|---|---|---|---|---|---|
| 1 | Precious Metals | SLV | 61.6 | 20% | -3.51% | GLD -1.7% · GDX -3.3% |
| 2 | Emerging Markets | INDA | 60.5 | 20% | -0.27% | IEMG -2.4% · ILF -3.6% |
| 3 | Technology | XLK | 58.7 | 10% | -8.48% | CIBR -5.4% · IGV -3.7% |
| 4 | AI | SMH | 55.1 | 10% | -4.28% | AIQ -3.5% · BOTZ -1.4% |
| 5 | Industrial Metals | REMX | 53.4 | 10% | -1.71% | COPX +2.7% · PICK -0.1% |
| 6 | Defense & Aerospace | XAR | 43.2 | 10% | -0.73% | ITA -1.7% · ROKT -1.3% |
| 7 | Utilities & Infrastructure | PAVE | 41.1 | 10% | -1.00% | XLU -3.3% · IGF -4.7% |
| 8 | Nuclear Energy | URA | 36.1 | 10% | -2.62% | NLR -2.3% |
| 9 | Agriculture & Livestock | MOO | 34.4 | 0% | -1.24% | VEGI -0.4% · WEAT +5.6% |
| 10 | Traditional Energy | XLE | — | 0% | -11.01% | FCG -13.0% · XOP -12.5% |
Precious Metals — SLV
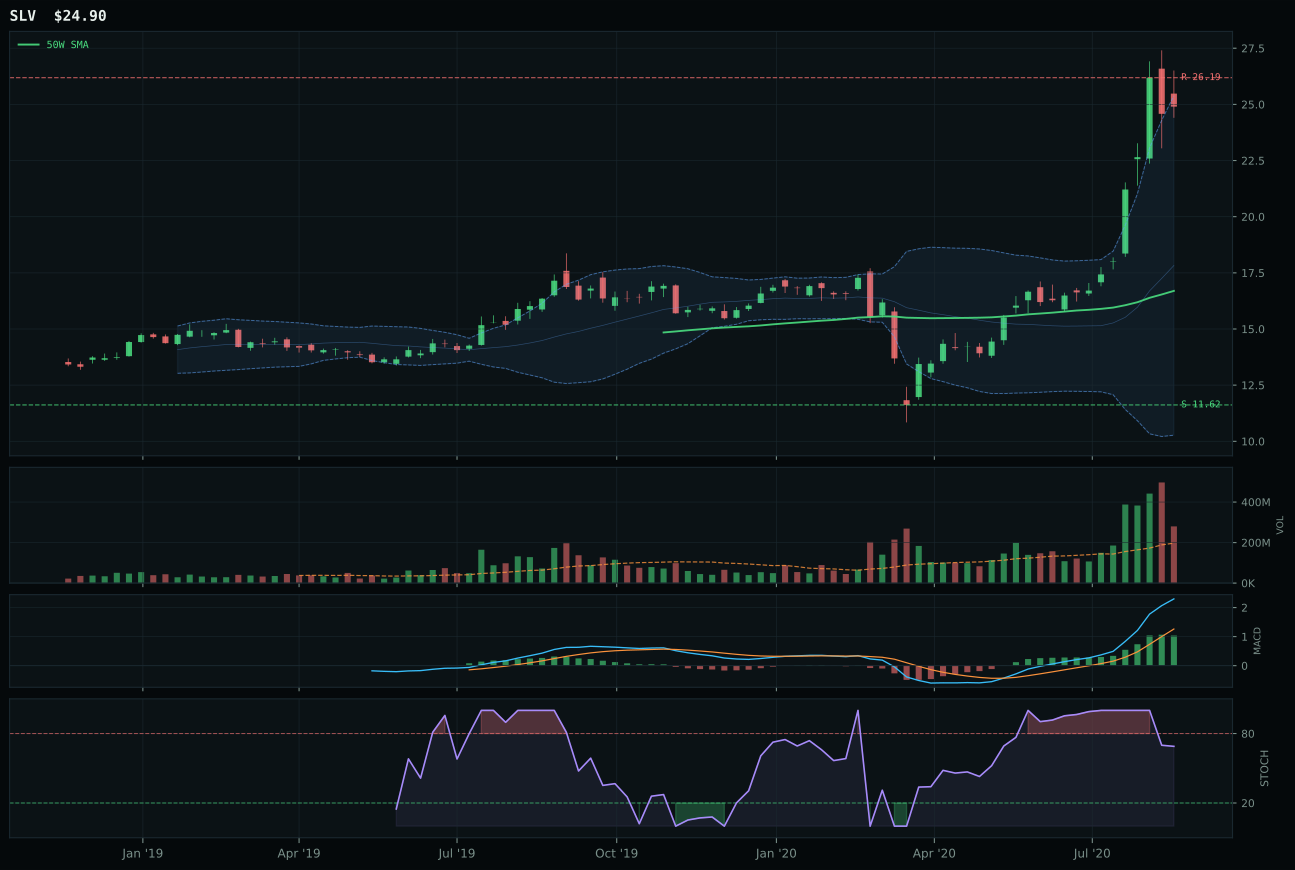
SLV has a vertical extension profile with 40.3% 13-week relative strength versus SPY.
A failed hold above support would weaken the setup.
Actionable but governed by invalidation levels.
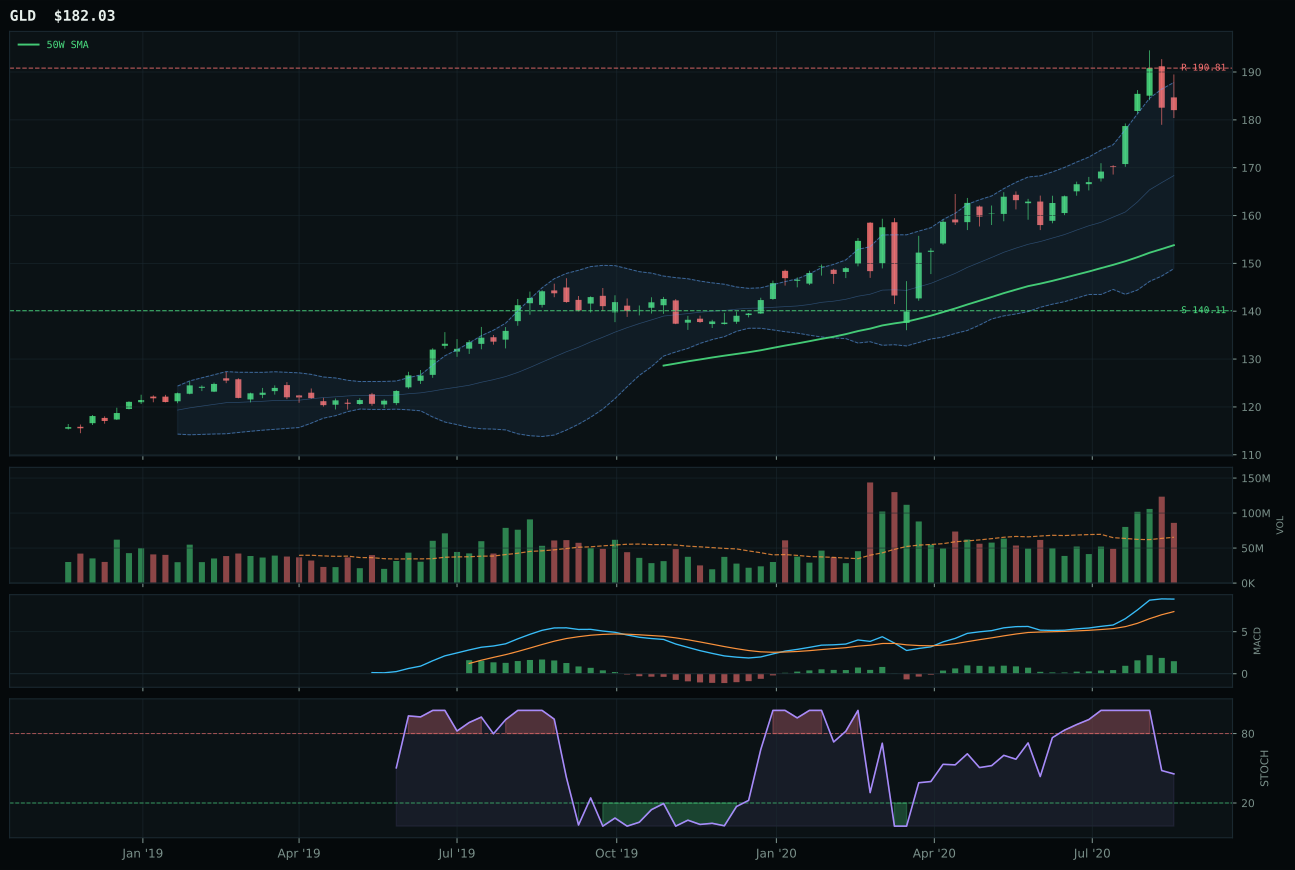
GLD has a vertical extension profile with -3.4% 13-week relative strength versus SPY.
A failed hold above support would weaken the setup.
Actionable but governed by invalidation levels.
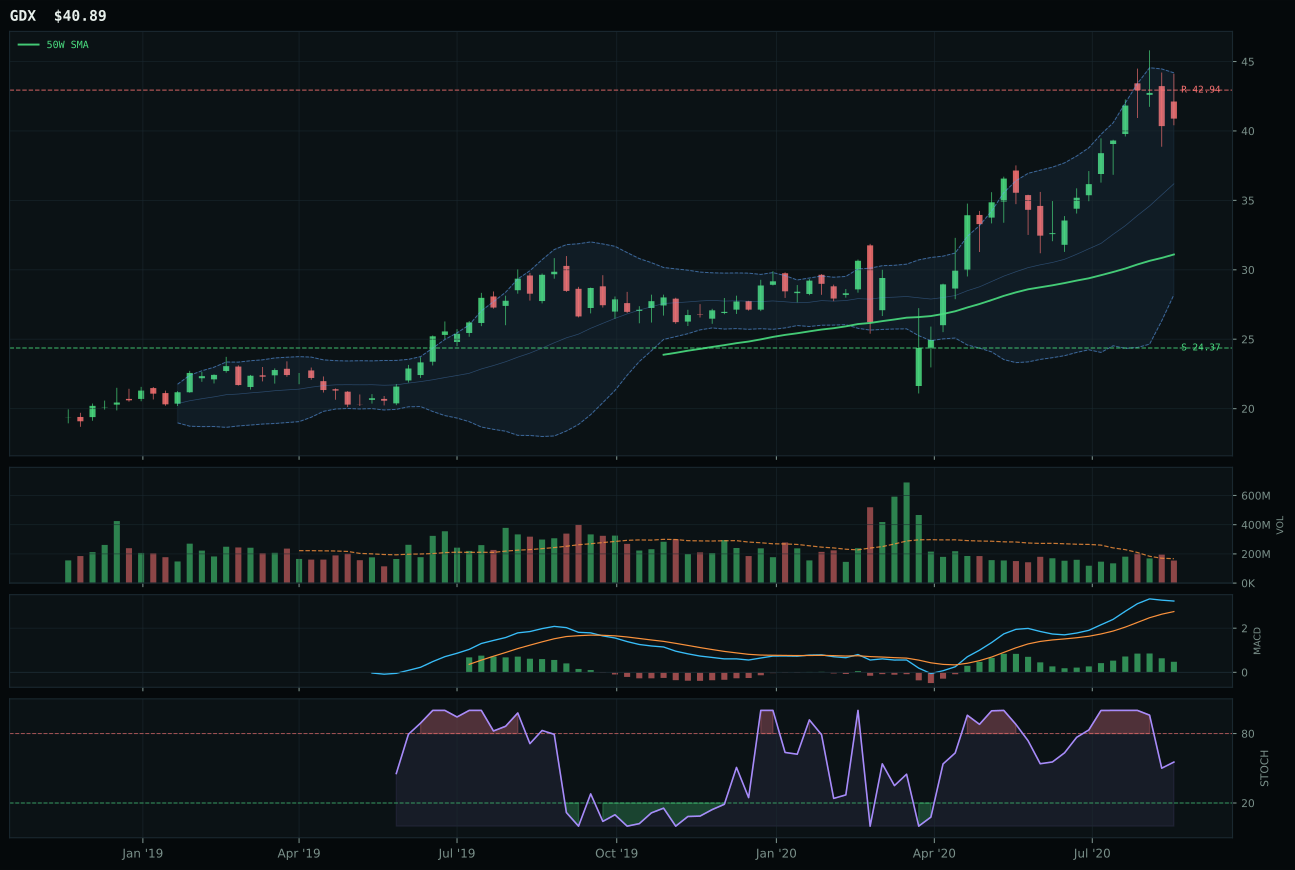
GDX has a vertical extension profile with 0.1% 13-week relative strength versus SPY.
A failed hold above support would weaken the setup.
Actionable but governed by invalidation levels.
SLV earned the top-2 overweight by delivering the strongest relative strength inside its own category and exceptional volume-price sponsorship. The fund is 49.1% extended from the 50-week moving average with a 55.2% thirteen-week return and a stunning 40.3% relative strength to SPY—numbers that mean silver is being accumulated hard by institutions willing to pay for positioning. The runner-up, GLD (gold as a clean monetary hedge), sits only 2.0 points below in category score but trails catastrophically in category-relative strength at -3.5%, indicating that diversified buyers prefer silver's hybrid monetary-plus-industrial beta over pure gold. MACD is bullish and improving for both, but SLV's volume at 1.42x the 20W average dwarfs GLD's confirmation, and the volume-price persistence score of 100.0 for SLV versus lower for GLD tells you the move is being accumulated, not distributed. Entry risk is real at 49% extension, but the technical sponsorship and relative strength are so pronounced that the risk asymmetry has shifted toward continuation.
Precious Metals earned 10% allocation as a top-2 category, reflecting the strength of SLV's technical setup and the macro alignment with the metals scarcity descriptor active at +7 and disinflation pressure at +6. The category score of 61.6 ranks it in the upper tier, driven by the 3/2/1 weighted basket score of 73.7 before the reasoner's final tests. The Goldilocks regime is supporting real asset sponsorship and providing a bid for inflation hedges, and the active metals scarcity descriptor directly favors this category. SLV's 100.0 technical evidence score is exceptional, reflecting perfect trend confirmation and world-class relative strength; GLD's lower score reflects its lagging category-relative strength despite sound macro merit. The 10% allocation is justified on risk-adjusted grounds: this is one of the two highest-scoring categories, and the technical confirmation in SLV is clean enough to sustain the extended entry. The risk is that the metals complex is now trading on scarcity narratives and inflation hedging rather than fundamentals; a shift toward disinflation surprise or a setback in industry demand could reset the setup sharply. At present, the positioning is warranted.
Emerging Markets — INDA
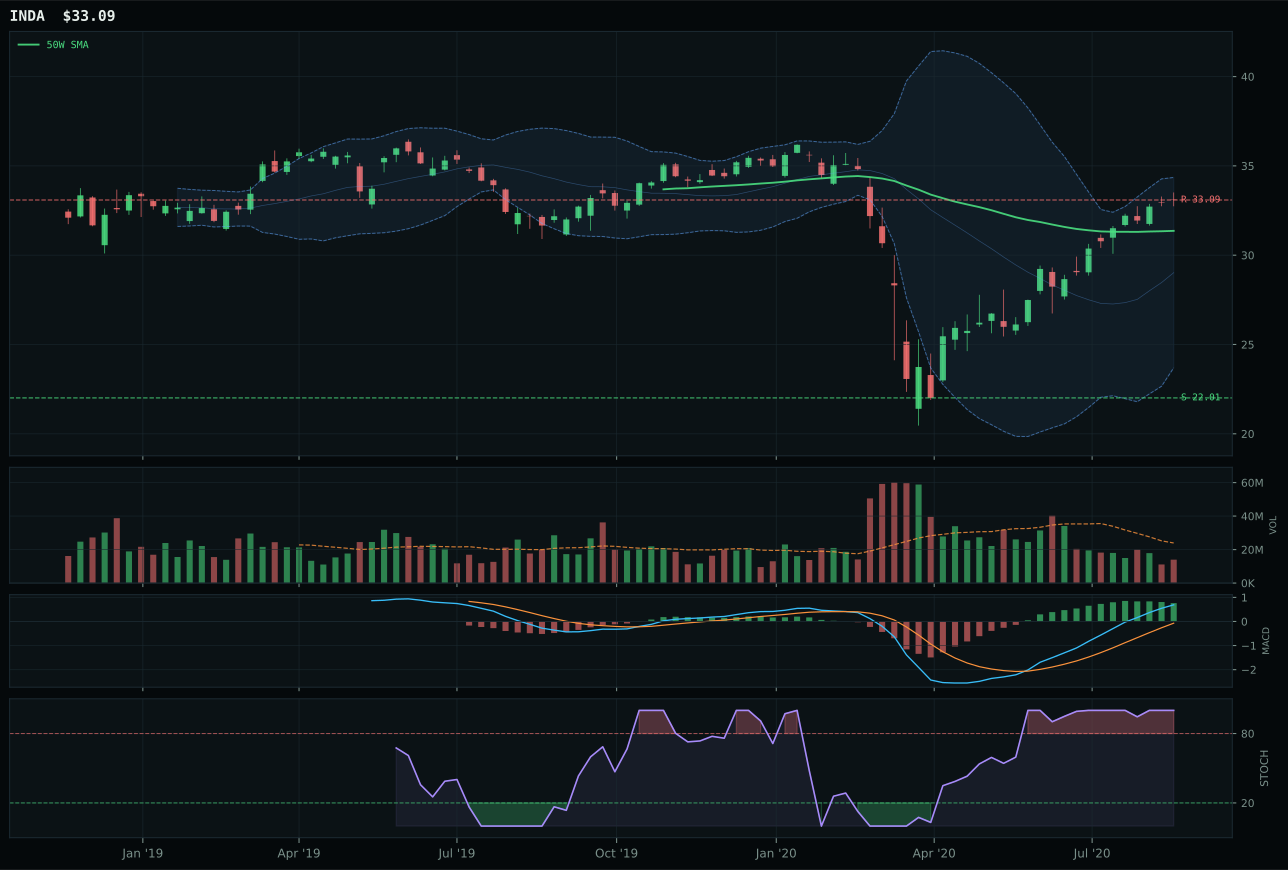
INDA has a neutral structure profile with 11.8% 13-week relative strength versus SPY.
A failed hold above support would weaken the setup.
Actionable but governed by invalidation levels.
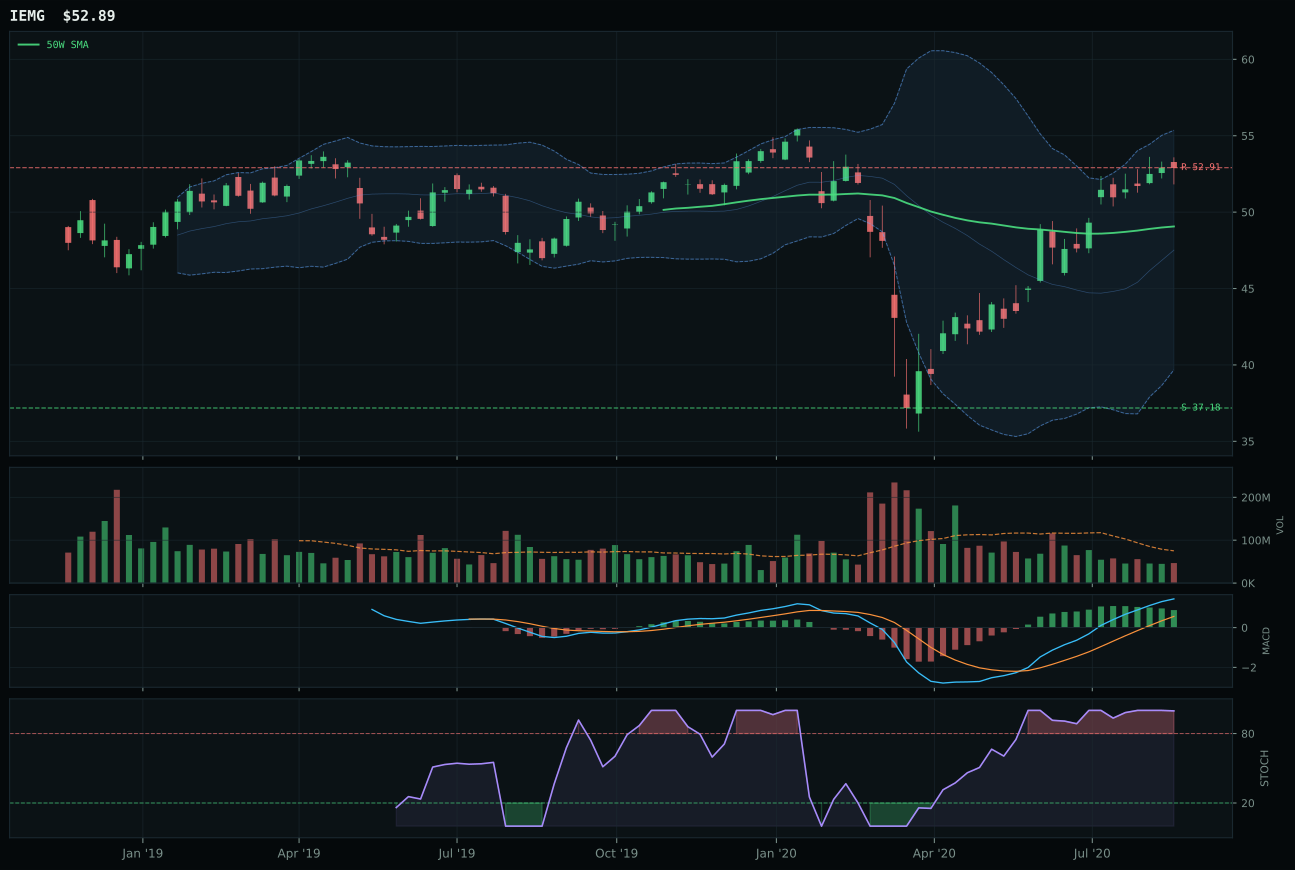
IEMG has a neutral structure profile with 6.6% 13-week relative strength versus SPY.
A failed hold above support would weaken the setup.
Actionable but governed by invalidation levels.
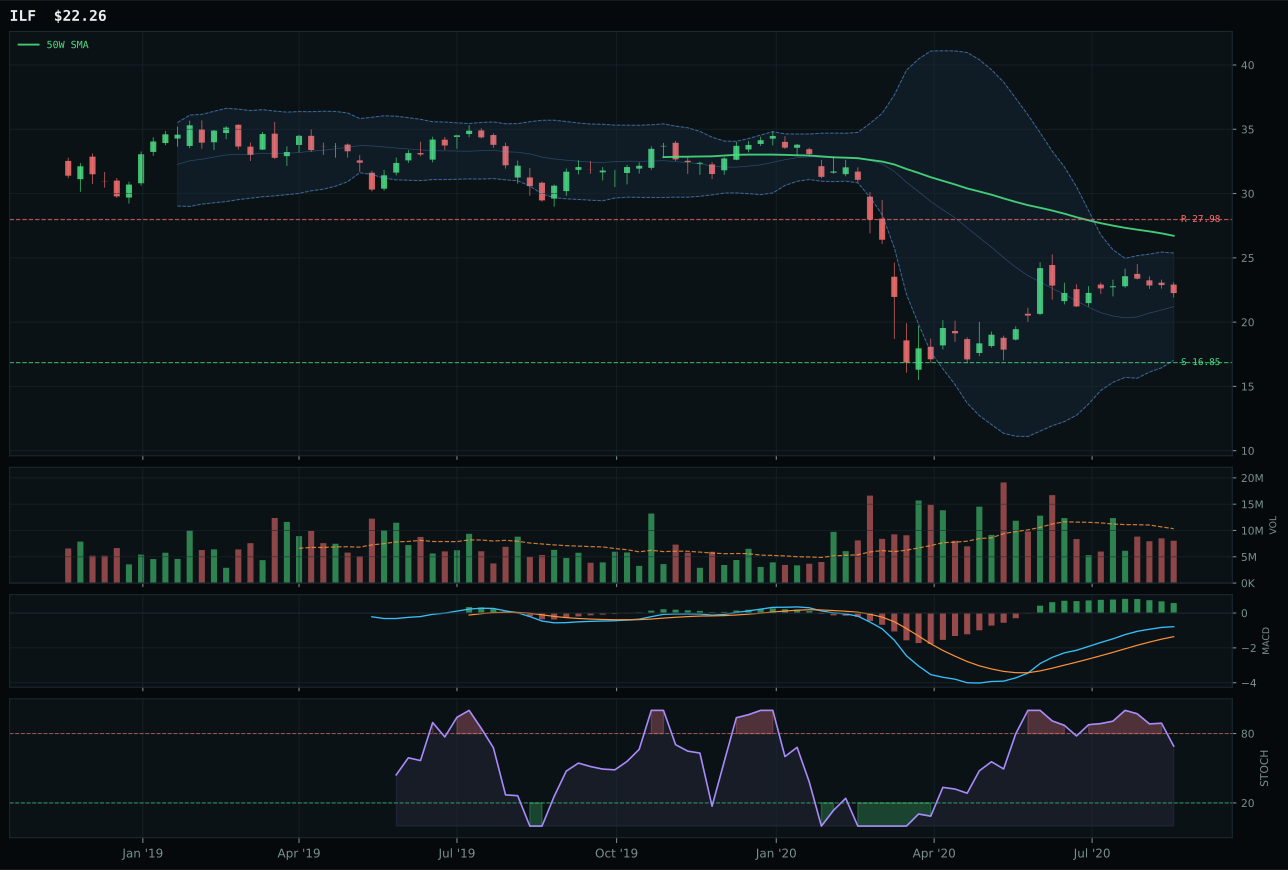
ILF has a neutral structure profile with -0.5% 13-week relative strength versus SPY.
Extension and support failure are the main tactical risks.
Tracked, but not top-2 eligible because: structurally broken.
INDA secured the Emerging Markets category win and earned top-2 allocation on the strength of its trend purity and exceptional relative strength inside the basket. The fund is just 5.5% above the 50W—a controlled entry point free from the extension stress that plagues extended leaders—with price above both the 50W and 200W and a 0.1% slope that is stable rather than deteriorating. The thirteen-week return of 26.7% paired with 11.8% relative strength to SPY tells you that institutional buyers are choosing India quality exposure over broad emerging markets (IEMG, which lagged at 6.6%) or Latin America (ILF, which scored much lower). Category-relative strength of 5.2% for INDA versus 0.0% for IEMG is decisive; the basket is tilting toward India. MACD is bullish but flattening, a sign the immediate momentum is slowing, but the structure is exceptionally clean at 80.0, and volume-price persistence at 78.3 shows that the accumulation is real and not a bounce. The score gap of 7.2 points over IEMG is close enough to indicate both are quality setups, but INDA's relative leadership and tighter entry point earned the top spot.
Emerging Markets earned 10% allocation as a top-2 category, reflecting INDA's technical merit and the portfolio's macro alignment with the emerging market liquidity support descriptor active at +14 and risk appetite positive at +8. The category score of 60.5 places it in the upper tier alongside Precious Metals, and the basket-level macro fit of 70.0 is strong. Goldilocks is providing a +8 boost, and EM liquidity support is the single strongest descriptor in the macro environment. INDA's 81.2 technical evidence score is excellent, driven by trend, relative strength, and volume-price sponsorship, making this a clean macro-plus-technical signal. The 10% allocation is justified as a high-conviction position in a regime where risk appetite is positive and emerging market capital flows are supported by central bank liquidity. The tension to monitor is that INDA's entry is tight and structure is clean, meaning there is limited room for a pullback before the setup resets; any move below the 50W on volume would signal a change in the accumulation pattern. At present, the allocation is well-calibrated to the macro regime and technical setup.
Technology — XLK
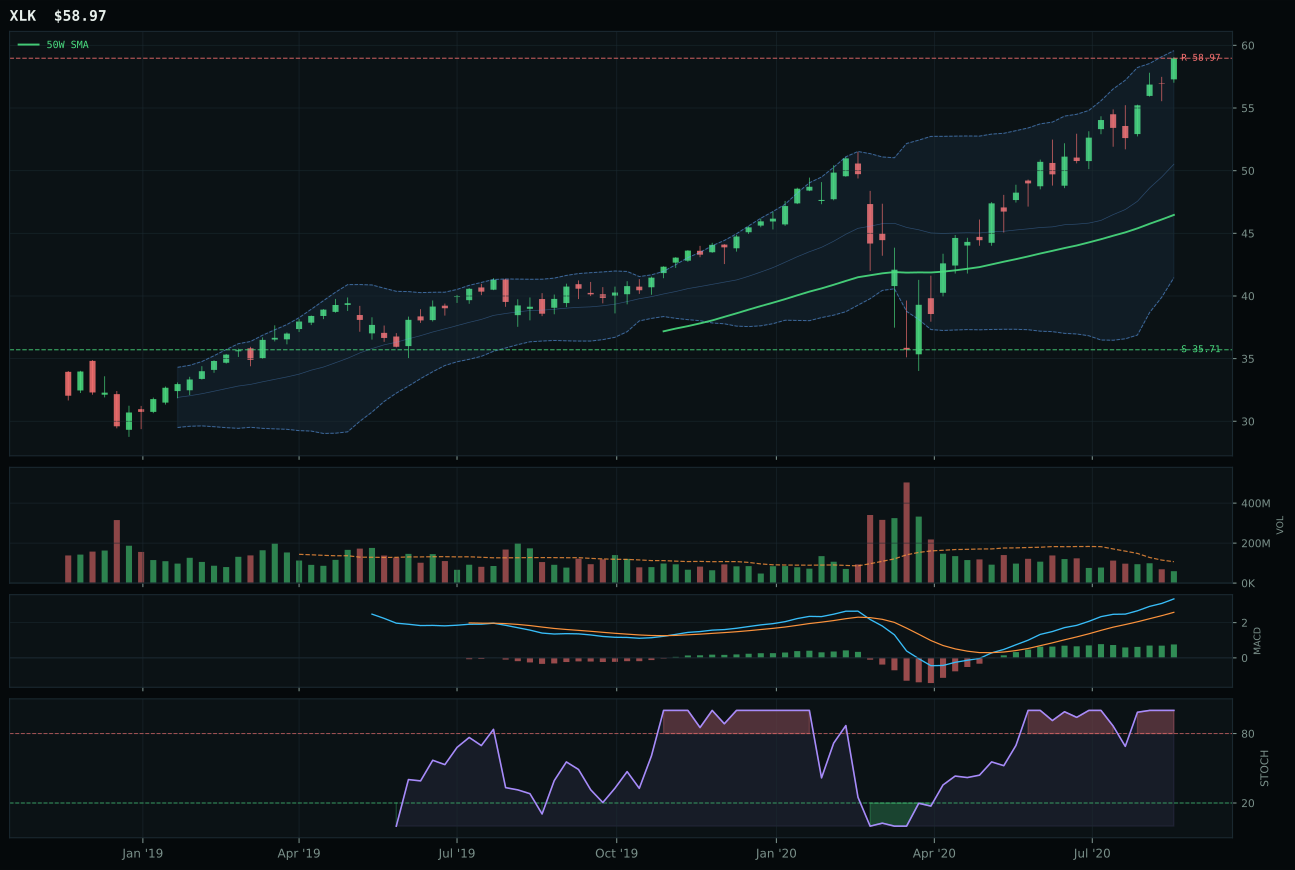
XLK has a vertical extension profile with 7.3% 13-week relative strength versus SPY.
A failed hold above support would weaken the setup.
Actionable but governed by invalidation levels.
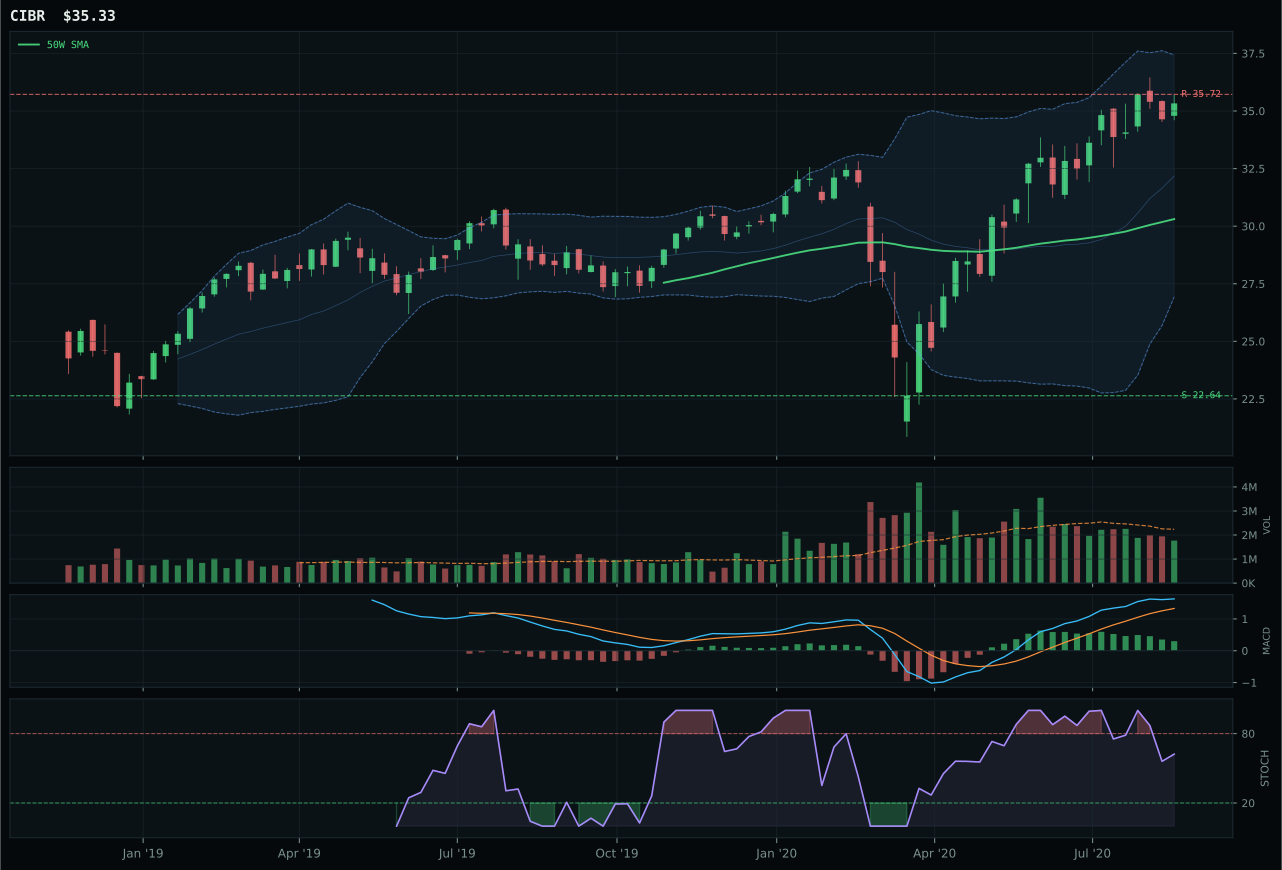
CIBR has a vertical extension profile with -1.5% 13-week relative strength versus SPY.
A failed hold above support would weaken the setup.
Actionable but governed by invalidation levels.
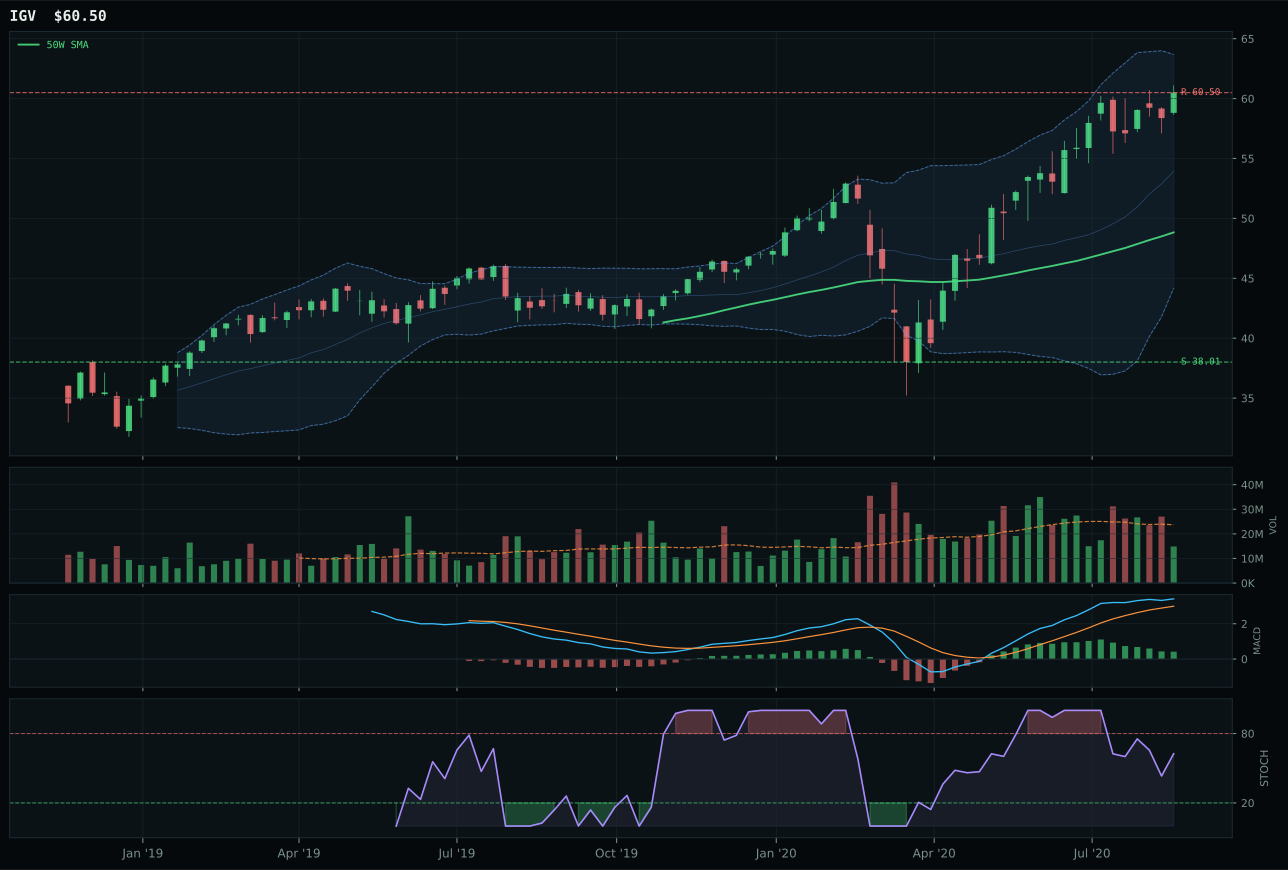
IGV has a vertical extension profile with 1.0% 13-week relative strength versus SPY.
A failed hold above support would weaken the setup.
Actionable but governed by invalidation levels.
XLK secured the category win on the strength of its relative leadership within the three-ETF basket and cleaner technical confirmation. The fund sits 26.9% above its 50-week moving average with price above both the 50W and 200W, supported by a 50W slope of 0.8% that has not deteriorated—the hallmark of a trend still being built, not yet exhausted. Category-relative strength of 6.3% versus the median tells you that technology buyers are specifically favoring XLK's broad profitable exposure over cybersecurity (CIBR, which lagged at -2.5%) and cloud infrastructure (IGV). MACD is bullish and improving, a detail that matters because CIBR's MACD is flattening; that divergence is the technical reason the runner-up lost ground despite matching XLK's vertical extension setup. The 22.2% thirteen-week return and 7.3% relative strength to SPY show institutional accumulation, but thin volume at 0.55x the 20-week average means the entry risk is real—every new buyer is chasing a move that has already run hard.
Technology earned 5% allocation as a tier-2 category, ranking below the two overweighted sleeves but ahead of six others. The decision to hold rather than exclude reflects XLK's technical merit in an environment where Goldilocks macro is active and AI growth sponsorship is live, both of which support risk-on rotation into profitable technology names. The category's macro fit of 72.0 at the basket level is solid: disinflation pressure and risk appetite positive are both active descriptors that favor tech, and credit stress is present but weighted down by the +9 from Goldilocks and +6 from AI sponsorship. Tier-2 placement acknowledges that entry risk has compromised the setup—the fund is extended, volume is thin, and momentum confirmation is not yet showing fresh accumulation waves. For technology to move into the top-2, the setup would need to reset closer to the 50W with volume expanding to confirm the next leg of the trend, or the allocation would require a new catalyst that meaningfully shifts the macro backdrop.
AI — SMH
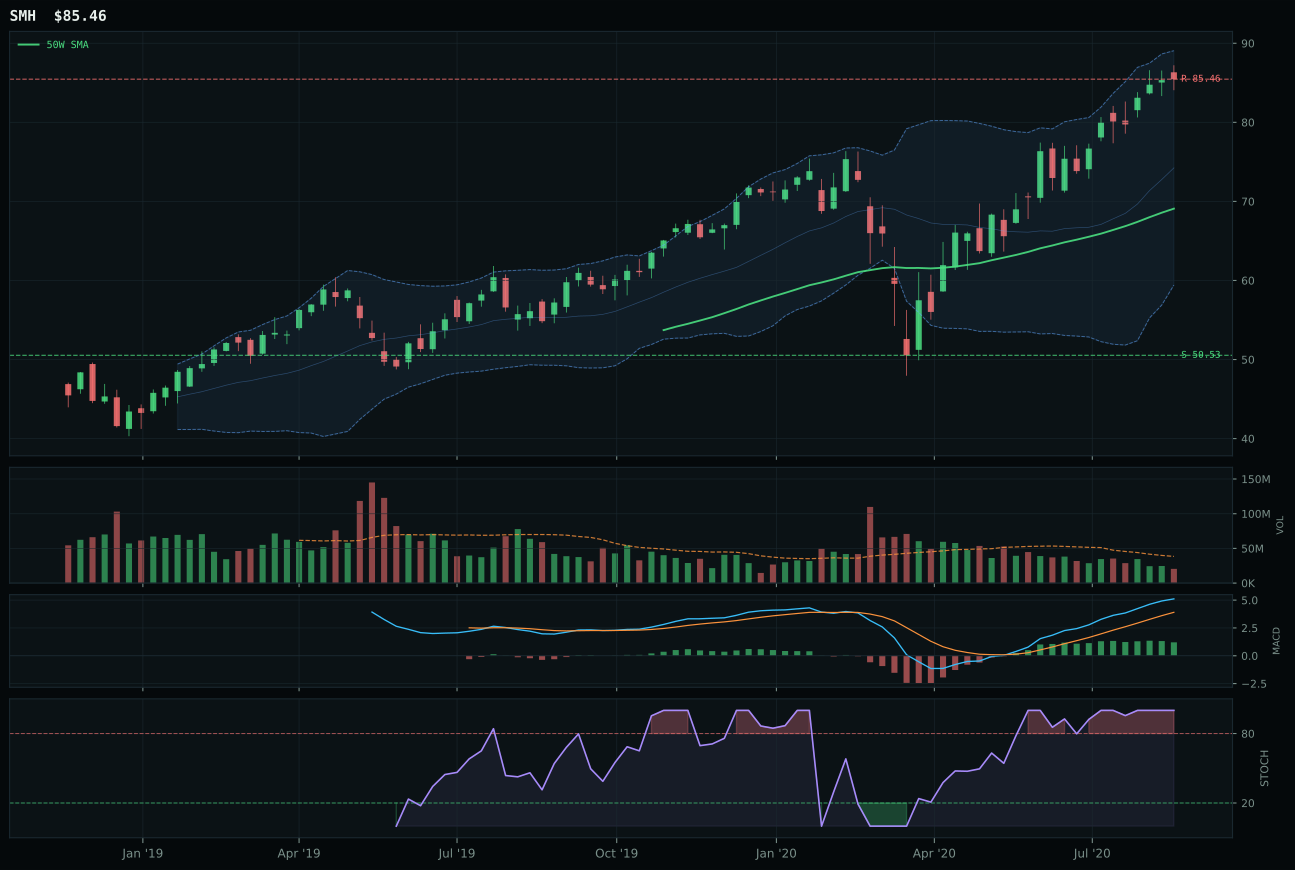
SMH has a vertical extension profile with 9.0% 13-week relative strength versus SPY.
A failed hold above support would weaken the setup.
Actionable but governed by invalidation levels.
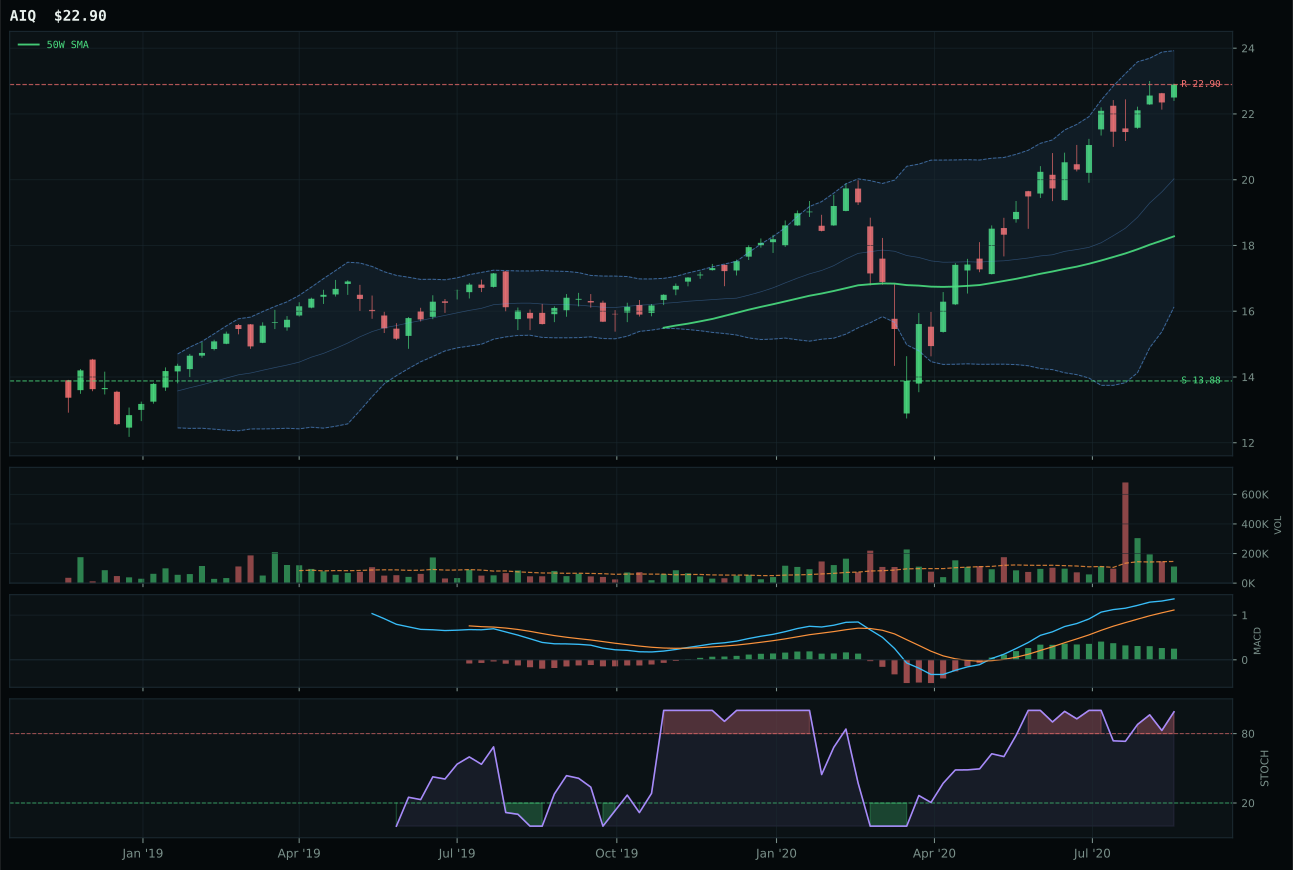
AIQ has a vertical extension profile with 5.5% 13-week relative strength versus SPY.
A failed hold above support would weaken the setup.
Tracked, but not top-2 eligible because: .
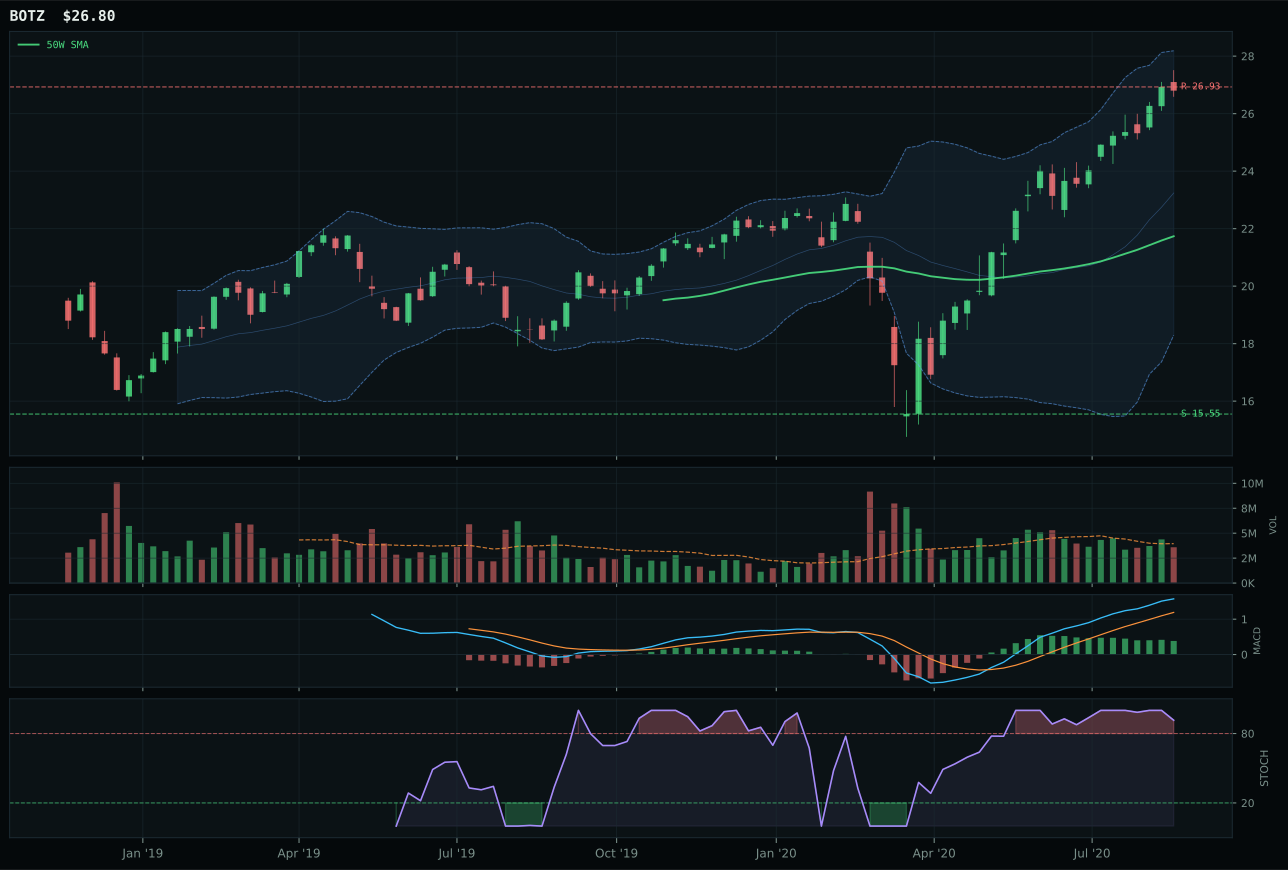
BOTZ has a vertical extension profile with 3.6% 13-week relative strength versus SPY.
A failed hold above support would weaken the setup.
Actionable but governed by invalidation levels.
SMH dominates the AI category with a 9.0% relative strength advantage over SPY and the broadest technical confirmation in the basket. Semiconductor leadership is the hardware expression of AI deployment, and SMH's 23.9% thirteen-week return paired with a 100.0 trend score (price above 50W and 200W with a 0.7% slope) reflects institutional conviction that compute capacity will be in structural demand. The runner-up, AIQ (AI software and applications), fell short by 34.9 points despite a 5.5% SPY relative strength because its structure was less clean (73.5 vs 76.0) and it showed zero category-relative strength—a tell that software exposure is not currently the preferred beta within the AI theme. SMH's volume at 0.53x the 20W average is thin, which is why timing scored only 32.0 out of 100; the fund is 23.7% extended from the 50W, placing every new buyer in a chase mentality. However, MACD bullish and flattening combined with stochastic RSI overbought momentum at 1.00 means the setup is extended but not yet broken.
AI sits at 5% allocation as a tier-2 holding despite a category score of 55.1. The macro regime of Goldilocks is actively supporting AI growth sponsorship at +14 and risk appetite positive at +10, which would ordinarily push the category higher; the shortfall is pure technical—SMH's extension and thin volume have not yet triggered enough new accumulation to warrant overweight status. The category's macro fit of 76.0 is strong, making it a natural candidate for tier-2 protection rather than exclusion. For AI to move into the top-2 sleeves, SMH would need to consolidate within 10-15% of the 50W on above-average volume, resetting the entry signal for the next wave of institutional buyers. Alternatively, a sharp expansion in volume-price sponsorship or a material deterioration in the two top-ranked categories would open space. The tension here is real: the macro case is excellent, but the technicals say the easy money has been made and the setup is now thinly held at an extended level.
Industrial Metals — REMX
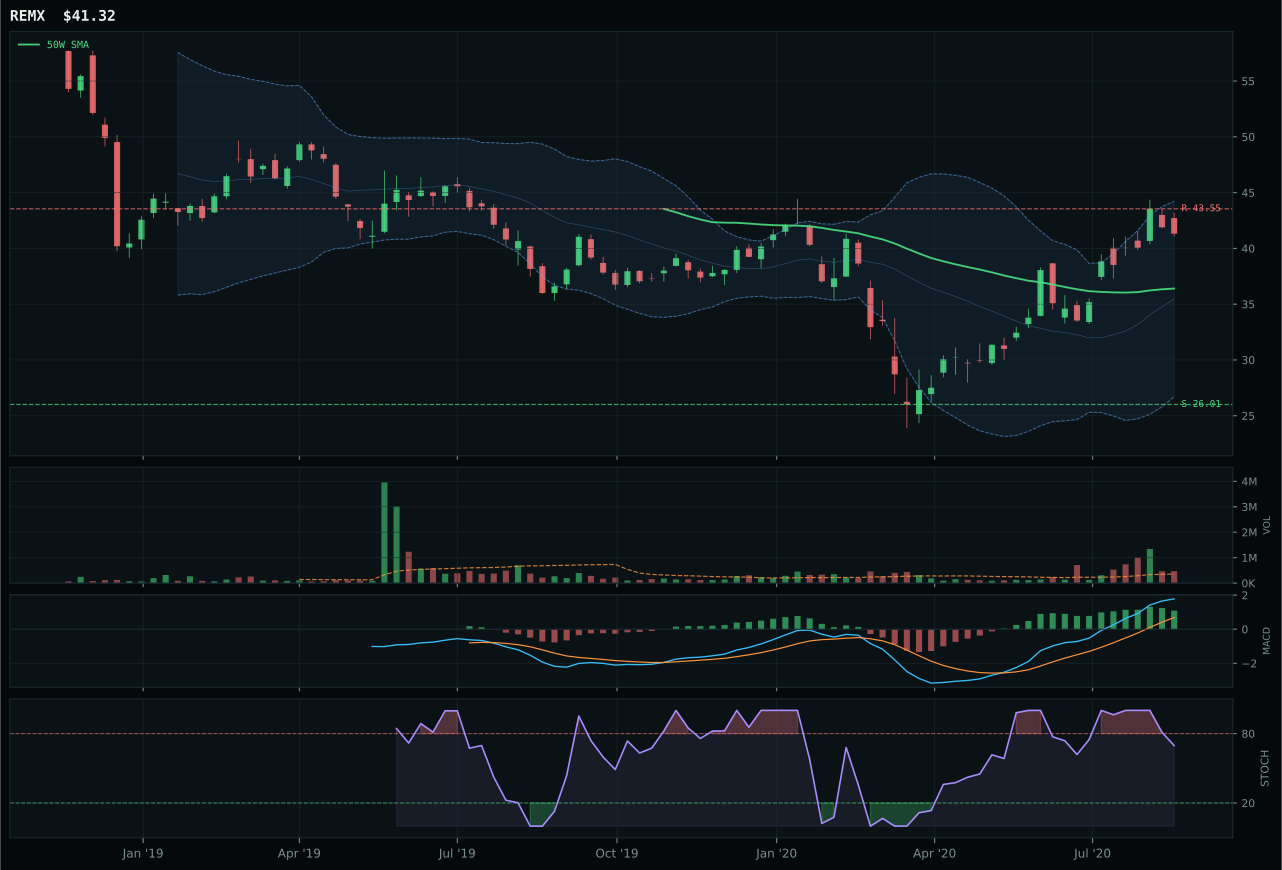
REMX has a neutral structure profile with 12.5% 13-week relative strength versus SPY.
A failed hold above support would weaken the setup.
Actionable but governed by invalidation levels.
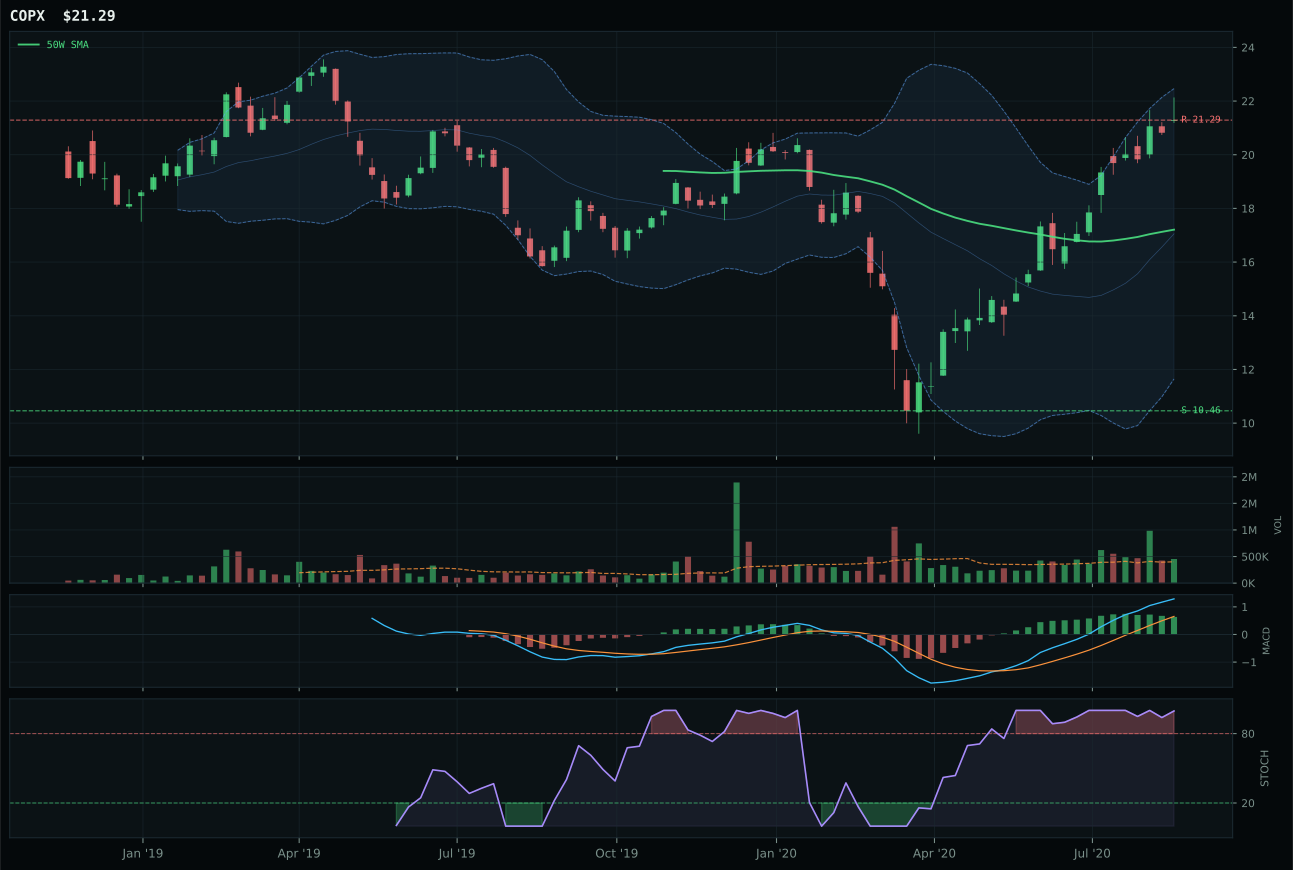
COPX has a vertical extension profile with 28.7% 13-week relative strength versus SPY.
A failed hold above support would weaken the setup.
Tracked, but not top-2 eligible because: .
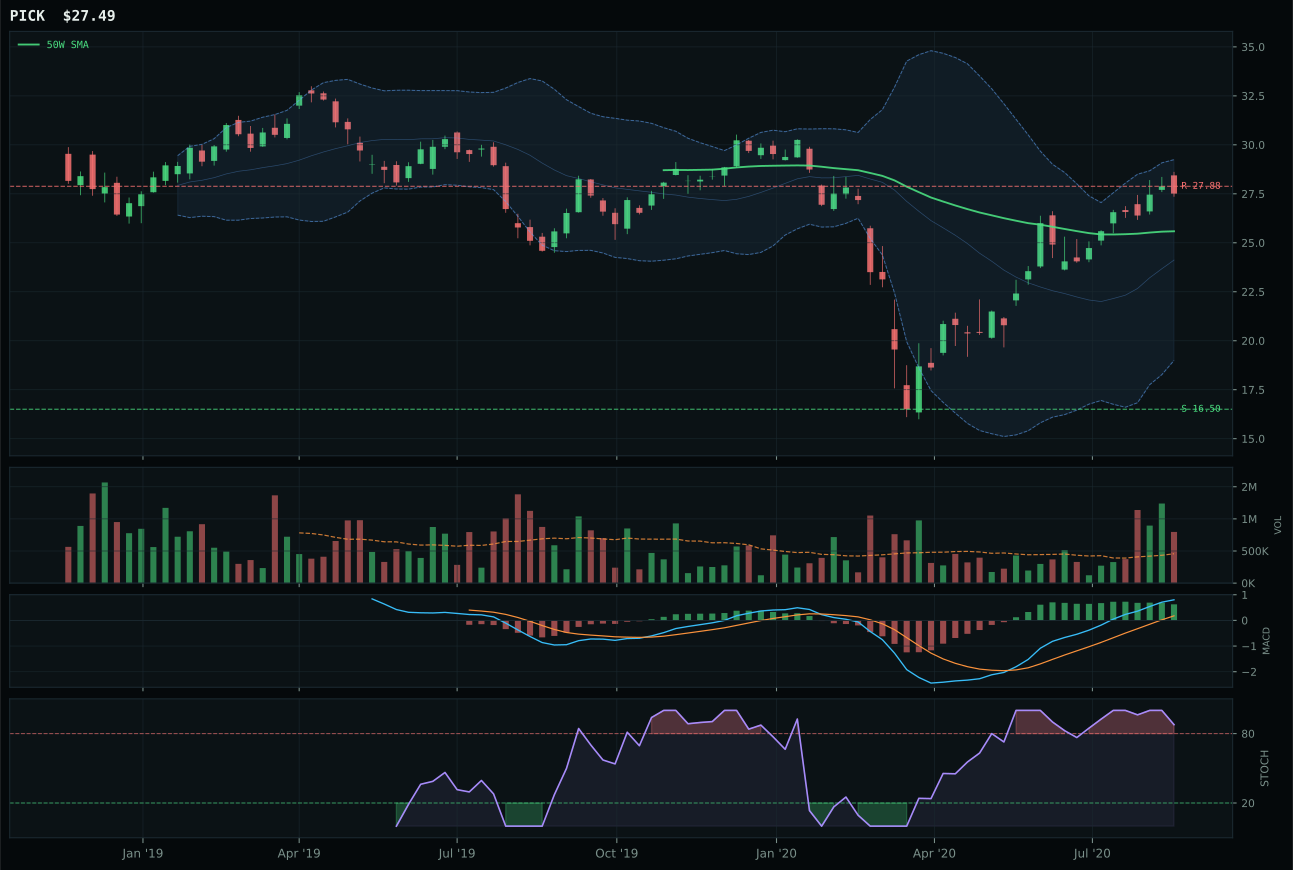
PICK has a neutral structure profile with 7.8% 13-week relative strength versus SPY.
A failed hold above support would weaken the setup.
Actionable but governed by invalidation levels.
REMX wins Industrial Metals despite being below the 50W, which tells you the decision is driven by structure and timing rather than momentum chase. The fund sits 13.5% below the 50-week moving average but above the 200W, placing it in a pullback zone where the next accumulation wave will not face extension resistance. The stochastic RSI is falling mid-zone at 0.70 and MACD is bullish but flattening, creating a reset setup that scores 70.0 on timing versus COPX's 32.0—a 38-point advantage on one metric. REMX's thirteen-week return of 27.4% is exceptional, and the 12.5% relative strength to SPY shows institutional demand for rare earth supply-chain scarcity positioning. Volume is above-average at 1.31x the 20W, confirming accumulation; the runner-up COPX is more extended (23.7% above 50W) and more overbought (stochastic RSI at overbought momentum), placing it at risk of profit-taking. Category-relative strength is neutral at 0.0% for REMX, so the win is on technical purity, not on outperformance.
Industrial Metals earned 5% allocation as a tier-2 category, sitting in the second-rank group where the macro case is strong but technical entry timing or relative strength arguments reserve the full tier-1 slot. The category score of 53.4 ranks it solidly in the middle, supported by an exceptional 79.0 category-level macro fit driven by the metals scarcity descriptor active at +14, commodity breadth positive at +10, real asset sponsorship at +6, and Goldilocks regime benefit at +6. Those macro tailwinds argue for holding tier-2 rather than dropping to zero, and REMX's 78.3 technical evidence score justifies the allocation. The tier-2 status rather than top-2 reflects that the 3/2/1 weighted basket score of 59.5 was materially lower than the category scores for Precious Metals (61.6) and Emerging Markets (60.5), and REMX's pullback setup, while technically sound, lacks the immediacy of a clean breakout. To move into tier-1, Industrial Metals would need REMX to break decisively above the 50W on increasing volume, or COPX to correct and present a better entry. At 5%, the allocation captures the strong metals scarcity thesis without overcommitting to an extended entry.
Defense & Aerospace — XAR
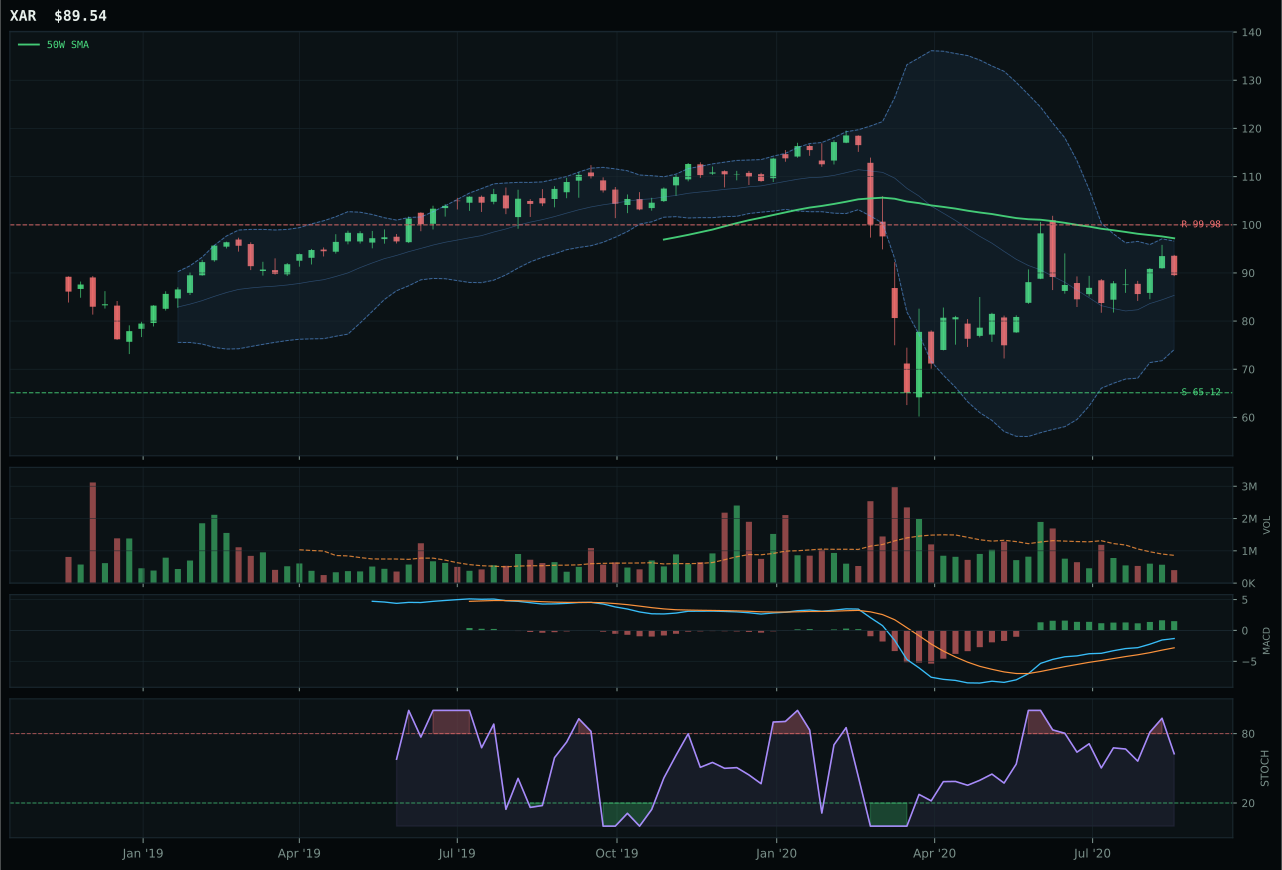
XAR has a neutral structure profile with -4.2% 13-week relative strength versus SPY.
A failed hold above support would weaken the setup.
Actionable but governed by invalidation levels.
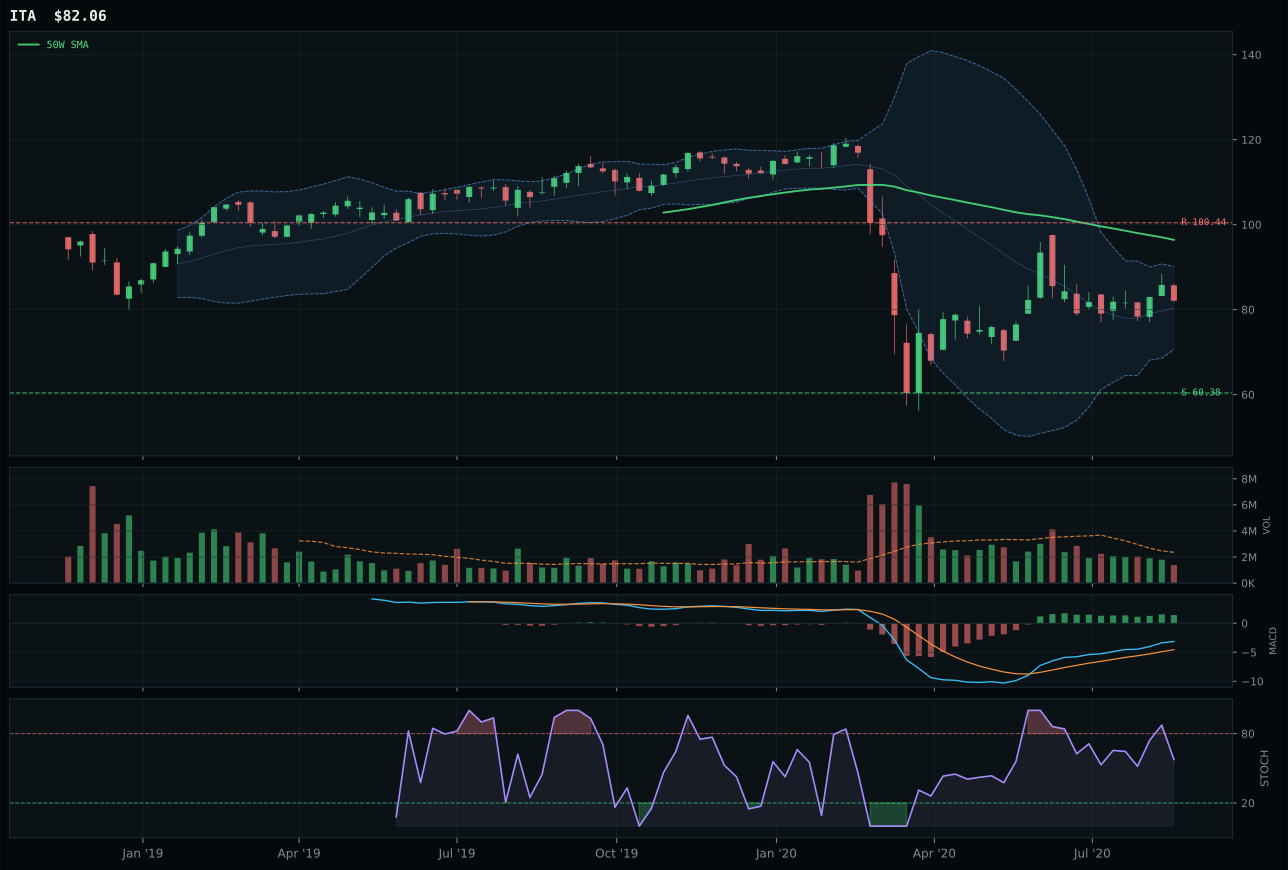
ITA has a neutral structure profile with -7.6% 13-week relative strength versus SPY.
A failed hold above support would weaken the setup.
Actionable but governed by invalidation levels.
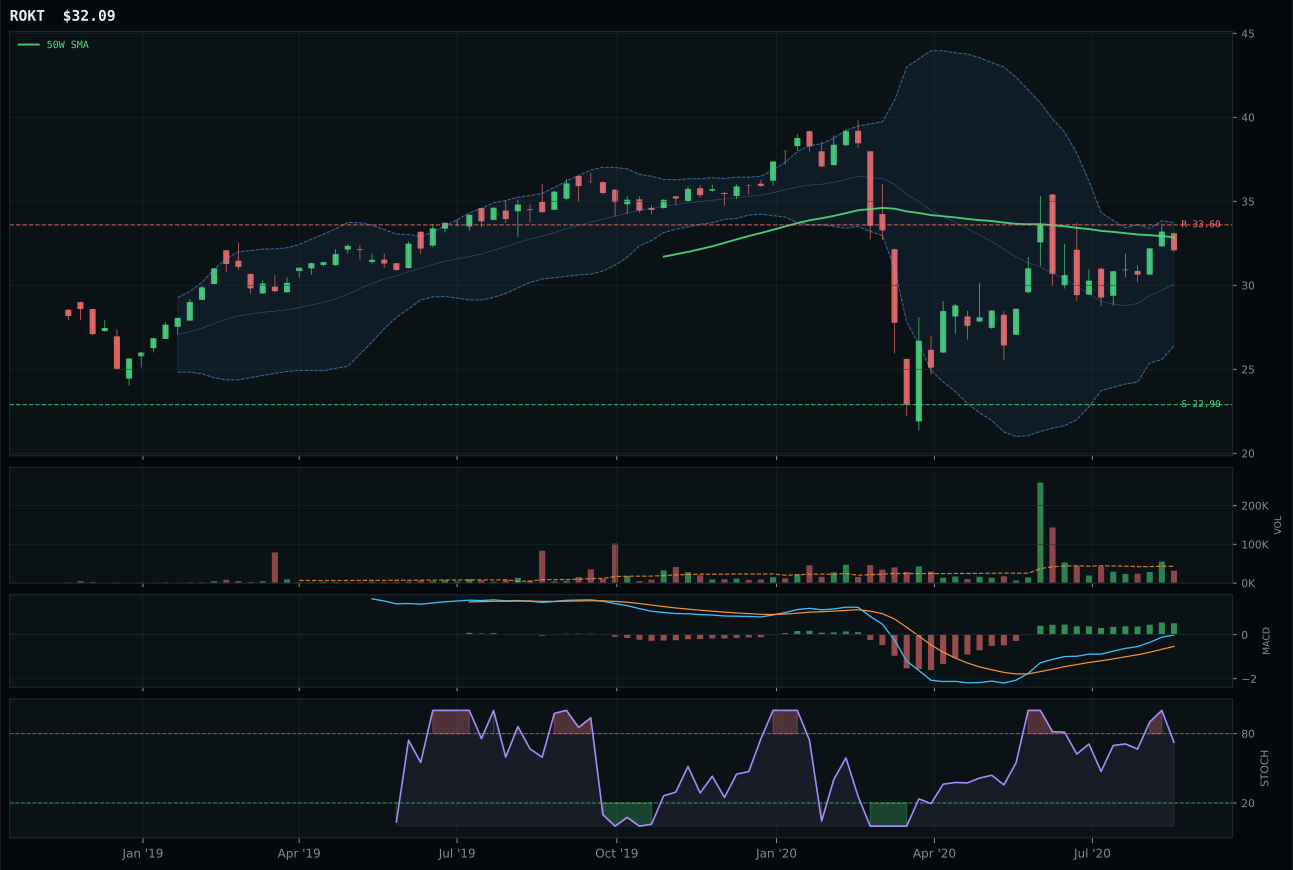
ROKT has a compression near 50W profile with -2.7% 13-week relative strength versus SPY.
A failed hold above support would weaken the setup.
Tracked, but not top-2 eligible because: .
XAR wins the Defense & Aerospace category on timing and risk-reward advantage, not on momentum. The fund is 7.9% below its 50-week moving average while price remains above the 200W—a pullback, not a breakdown. This inverted setup is actually favorable for timing because the stochastic RSI is rising mid-zone at 0.63 and MACD is bullish and improving, meaning the next leg of accumulation will not face the entry friction of chasing a 50W extension. XAR scored 90.0 for timing versus ITA's 63.0, a decisive edge that reflects the setup's readiness rather than its momentum. The thirteen-week return of 10.7% is modest, and the -4.2% relative strength to SPY signals that defense has lagged the broad market; however, category-relative strength held at 0.0%, meaning XAR is the category's leadership even if the category itself is not attracting capital flows. The score gap of 23.3 points over ITA (defense-prime durability) reflects XAR's cleaner structure and superior risk-reward positioning.
Defense & Aerospace earned 5% allocation despite a category score of only 43.2, placing it in tier-2 where weaker categories receive 5% by rota. The macro fit at 55.0 is neutral; the category lacks a strong descriptor profile to benefit from the current Goldilocks environment, though modest credit stress support (+2) and transition/mixed regime benefit (+3) keep it from falling out entirely. The technical evidence from XAR is reasonably strong at 69.8, which explains tier-2 allocation: the fund is a legitimate trading setup on a pullback, but neither the macro case nor the momentum case is compelling enough for overweight. Defense would need to show fresh accumulation with volume rising through the 20-day average to justify a move toward tier-1, or the macro environment would need to pivot toward credit stress concerns that typically elevate defensive rotation. At 5%, the position is a structural hedge and rebalance placeholder rather than a conviction trade.
Utilities & Infrastructure — PAVE
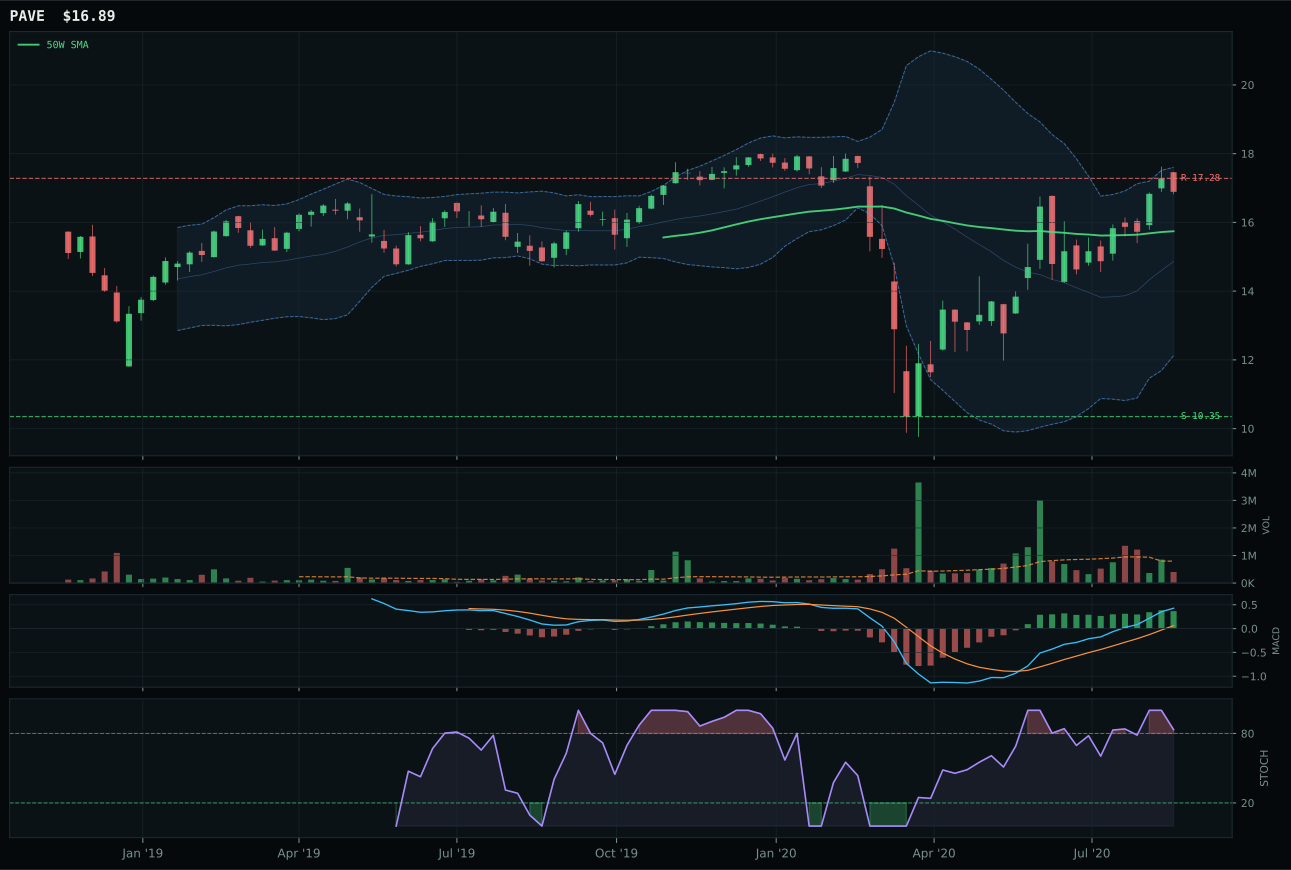
PAVE has a neutral structure profile with 7.1% 13-week relative strength versus SPY.
A failed hold above support would weaken the setup.
Actionable but governed by invalidation levels.
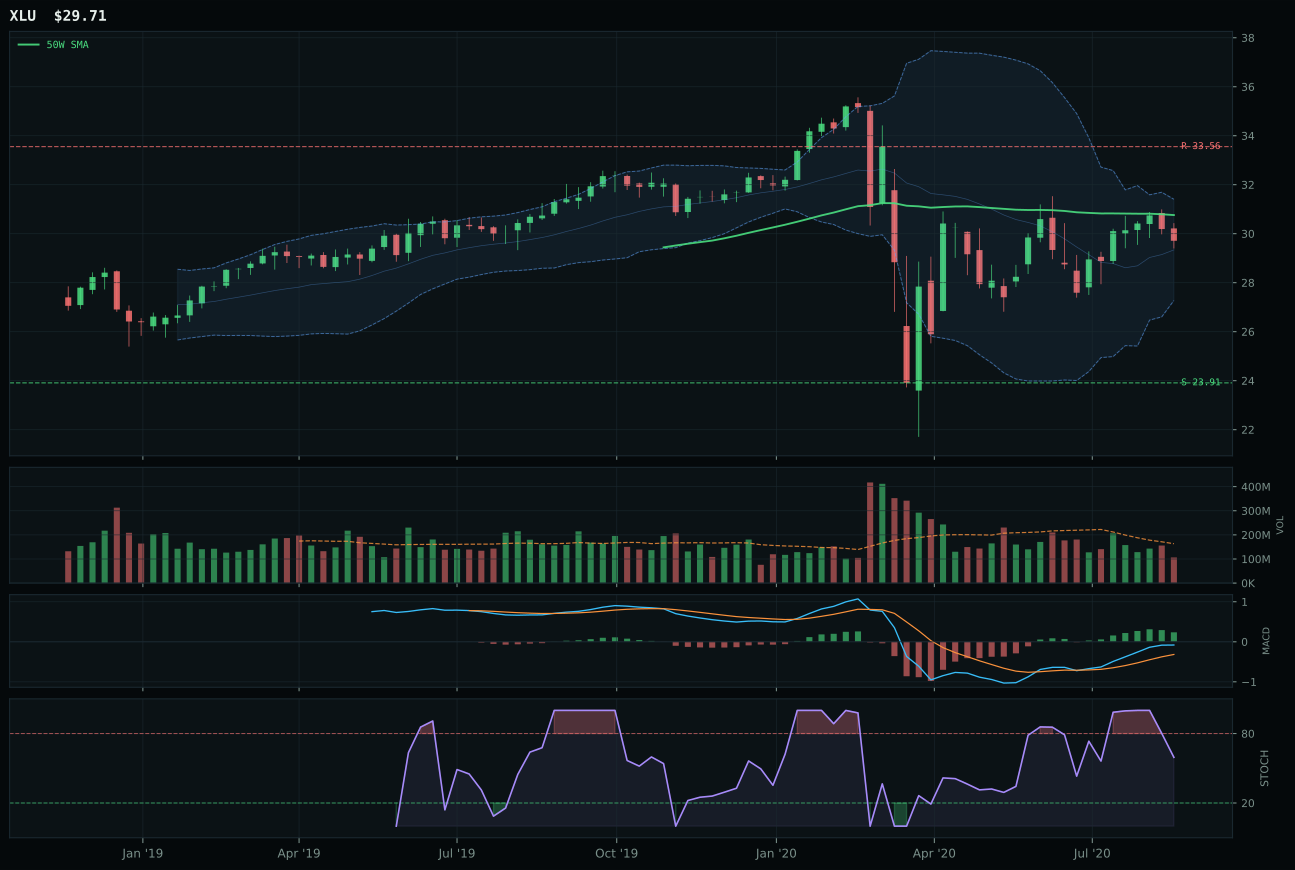
XLU has a neutral structure profile with -9.7% 13-week relative strength versus SPY.
A failed hold above support would weaken the setup.
Actionable but governed by invalidation levels.
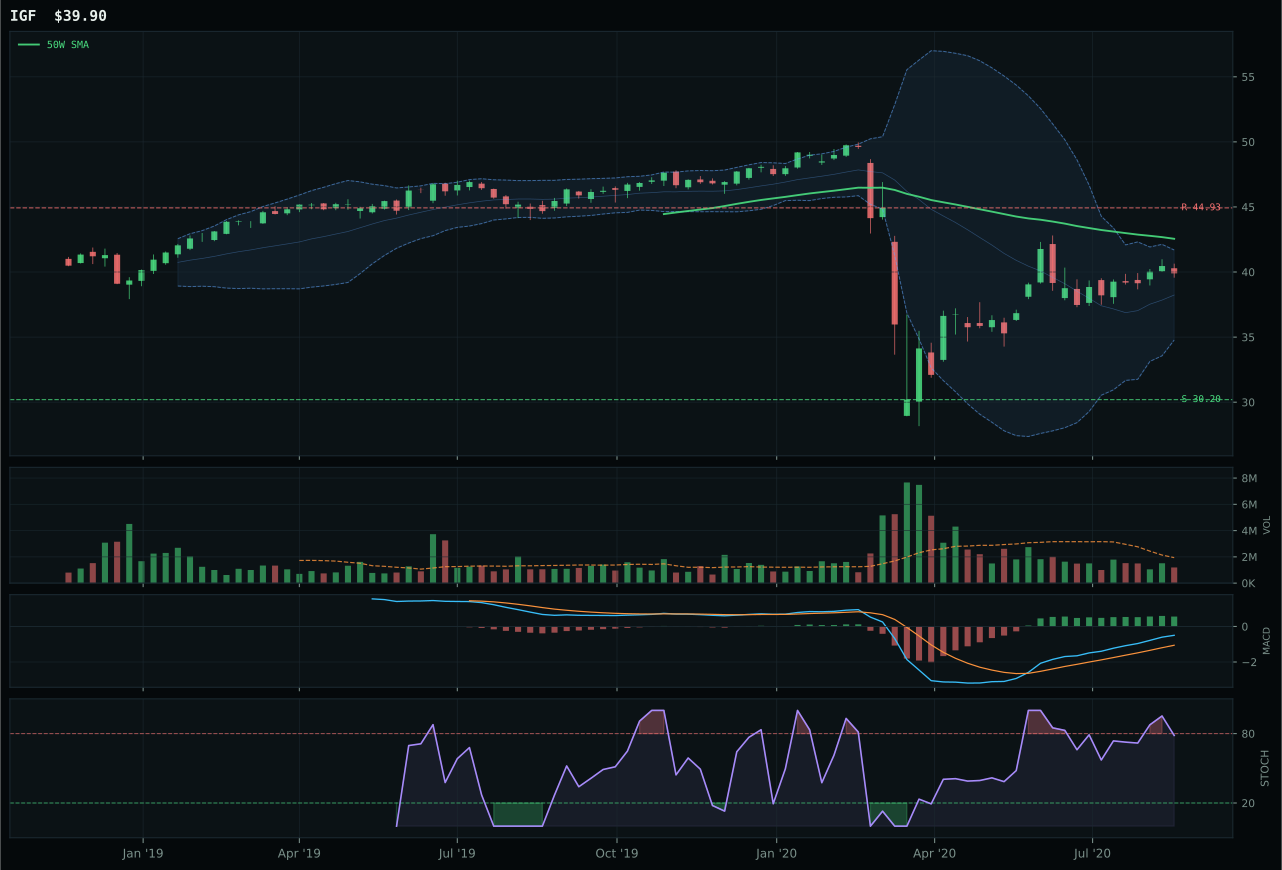
IGF has a neutral structure profile with -6.6% 13-week relative strength versus SPY.
Extension and support failure are the main tactical risks.
Tracked, but not top-2 eligible because: structurally broken.
PAVE wins the Utilities & Infrastructure category by offering superior relative strength and more favorable timing than XLU (the traditional regulated utility anchor). PAVE sits 7.3% below the 50W while price remains above the 200W—a pullback setup similar to other winners this week—but the critical difference is category-relative strength of 13.7% versus XLU's -3.1%. That spread tells you infrastructure capex beta is outperforming defensive regulation; institutional buyers prefer the growth optionality of PAVE over XLU's flat income profile. PAVE's MACD is bullish and improving (not merely bullish but flattening like XLU), and the stochastic RSI is overbought momentum at 0.83, which is elevated but not yet rolling over. The twenty-two percent thirteen-week return significantly exceeds XLU's 5.2%, and the 7.1% relative strength to SPY versus XLU's -9.7% shows that infrastructure is attracting capital in a way utilities are not. The score gap of 23.1 points is decisive, reflecting PAVE's cleaner momentum and superior relative positioning.
Utilities & Infrastructure earned 5% allocation as a tier-2 category, holding its position despite a category score of only 41.1 that ranks it in the lower half of the allocation set. The macro fit at 58.0 is moderate; transition/mixed regime provides +4, disinflation pressure offers +6, and risk appetite positive is present but slightly negative at -2. PAVE's technical evidence of 78.6 is the category's saving grace, justifying tier-2 retention rather than exclusion. The allocation reflects PAVE's superior relative strength within the basket and its bullish-and-improving MACD, which signals active accumulation rather than distribution. To move into tier-1, Utilities & Infrastructure would require either a meaningful expansion of the disinflation pressure macro case (which would favor XLU's defensive income profile), or PAVE would need to consolidate closer to the 50W and then break above it on accelerating volume. At 5%, the position captures PAVE's infrastructure capex beta without overcommitting to a category that lacks strong macro sponsorship. The allocation is structural rebalancing rather than conviction.
Nuclear Energy — URA
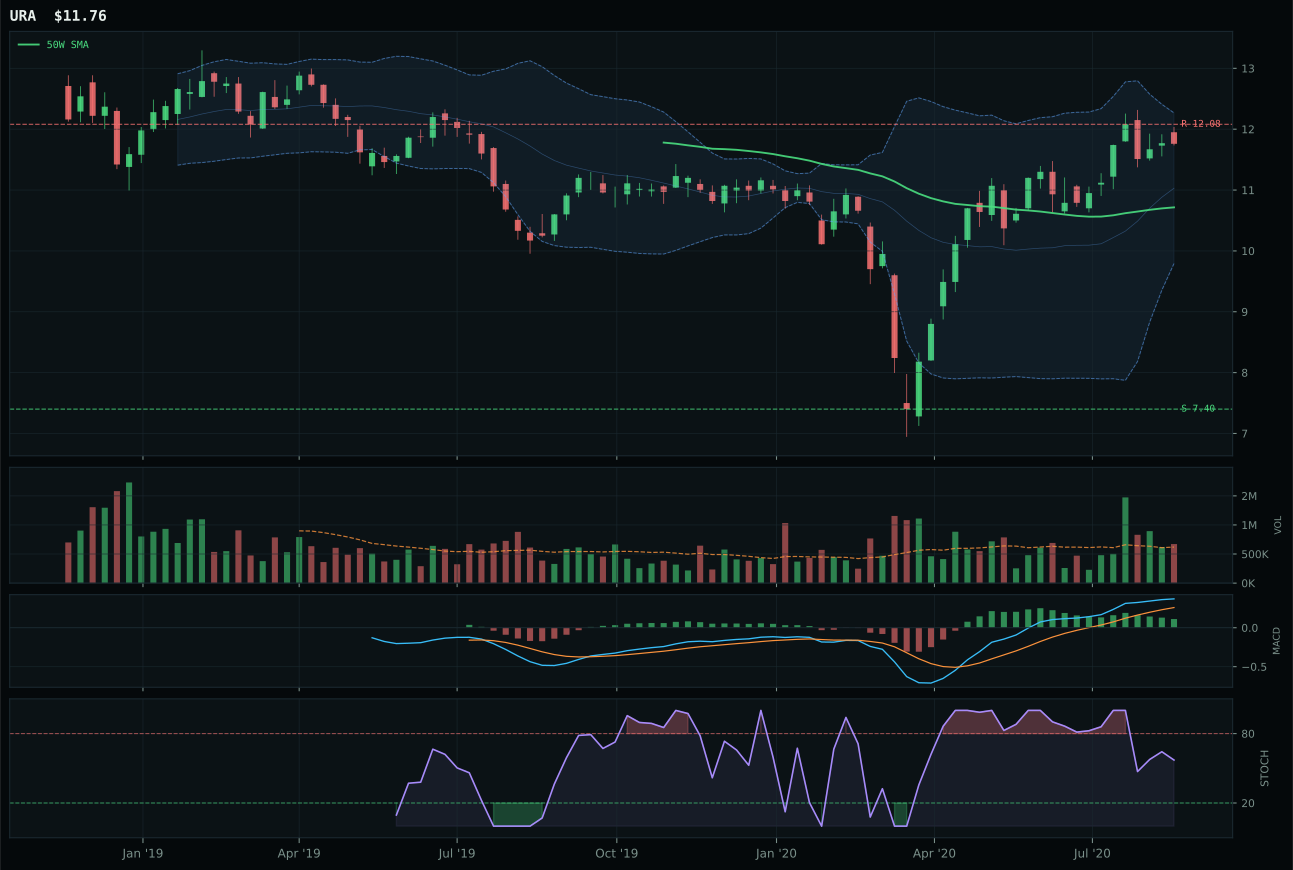
URA has a neutral structure profile with -4.1% 13-week relative strength versus SPY.
A failed hold above support would weaken the setup.
Tracked, but not top-2 eligible because: .
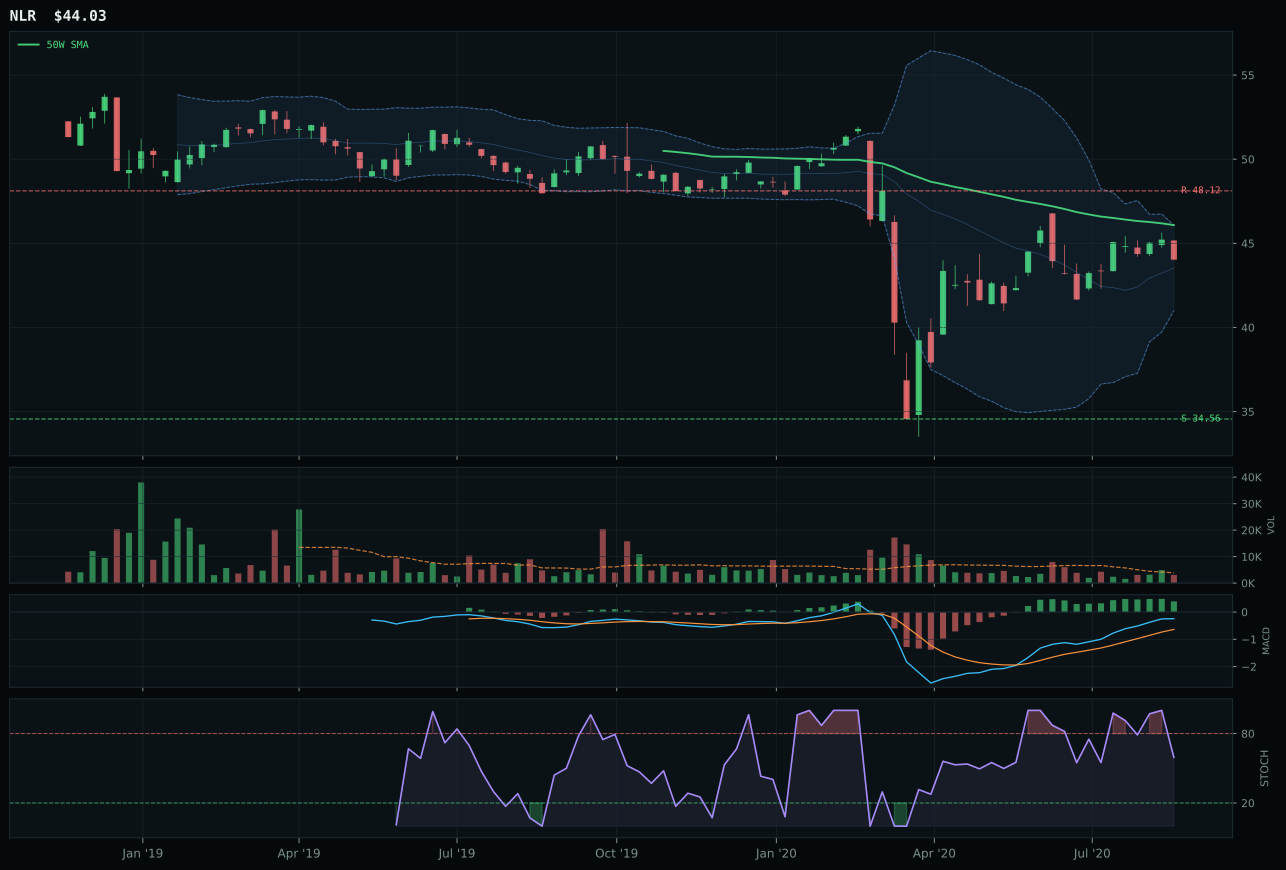
NLR has a neutral structure profile with -10.9% 13-week relative strength versus SPY.
Extension and support failure are the main tactical risks.
Tracked, but not top-2 eligible because: structurally broken.
URA wins Nuclear Energy on timing and structure quality, but the category itself failed an eligibility filter. The fund sits 9.7% below the 50W but above the 200W, placing it in the healthy pullback zone where the next accumulation leg will not face extension resistance. The stochastic RSI is rising mid-zone at 0.57 and MACD is bullish but flattening, creating a coiling setup that scores 78.0 on timing—one of the best scores in the entire portfolio. The structure is clean at 76.3, with compression and cleanliness both near 75%, suggesting a compressed range that is ready for the next directional move. The thirteen-week return of 10.8% is solid, and category-relative strength of 3.4% shows that URA is the preferred nuclear expression. However, the runner-up NLR (nuclear utilities) is so broken—structure at only 42.1, stochastic RSI falling/neutral, hard filter active for structural damage—that the category's eligibility was compromised. The score gap of 46.5 points is immense, reflecting a basket with one weak link that cannot be ignored.
Nuclear Energy earned 5% allocation despite an ineligible flag for the category, placing it in tier-2 as a structural hedge rather than a conviction position. The category score of 36.1 is middling, and the ineligible designation means the reasoner identified a hard technical or macro condition that prevents full confidence in the category's setup. URA's 45.0 technical evidence is moderate, reflecting the pullback setup that is waiting for confirmation rather than actively accumulating. The macro fit at 57.0 is neutral; real asset sponsorship is active at +7 and AI growth sponsorship at +5, but those are not strong enough to overcome the basket-level fragility created by NLR's breakdown. The 5% allocation is a placeholder for mean-reversion exposure in a category with good timing but insufficient conviction. For nuclear to move into tier-1, URA would need to break above the 50W with volume expanding to 1.2x+ the 20W average, or NLR would need to stabilize structurally so the basket is not anchored by a broken link. At present, the category is held for optionality but not as a core conviction.
Agriculture & Livestock — MOO
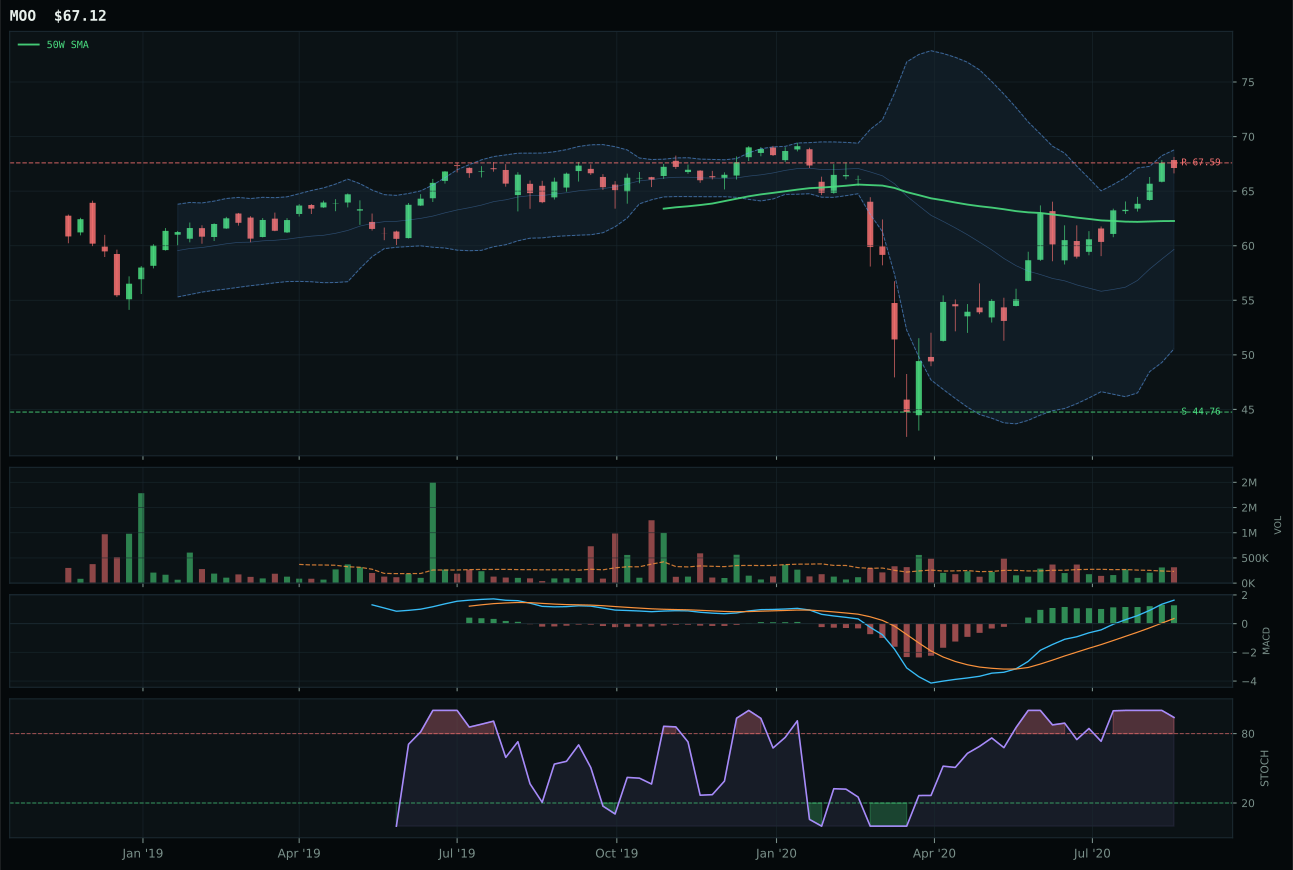
MOO has a neutral structure profile with 7.0% 13-week relative strength versus SPY.
A failed hold above support would weaken the setup.
Actionable but governed by invalidation levels.
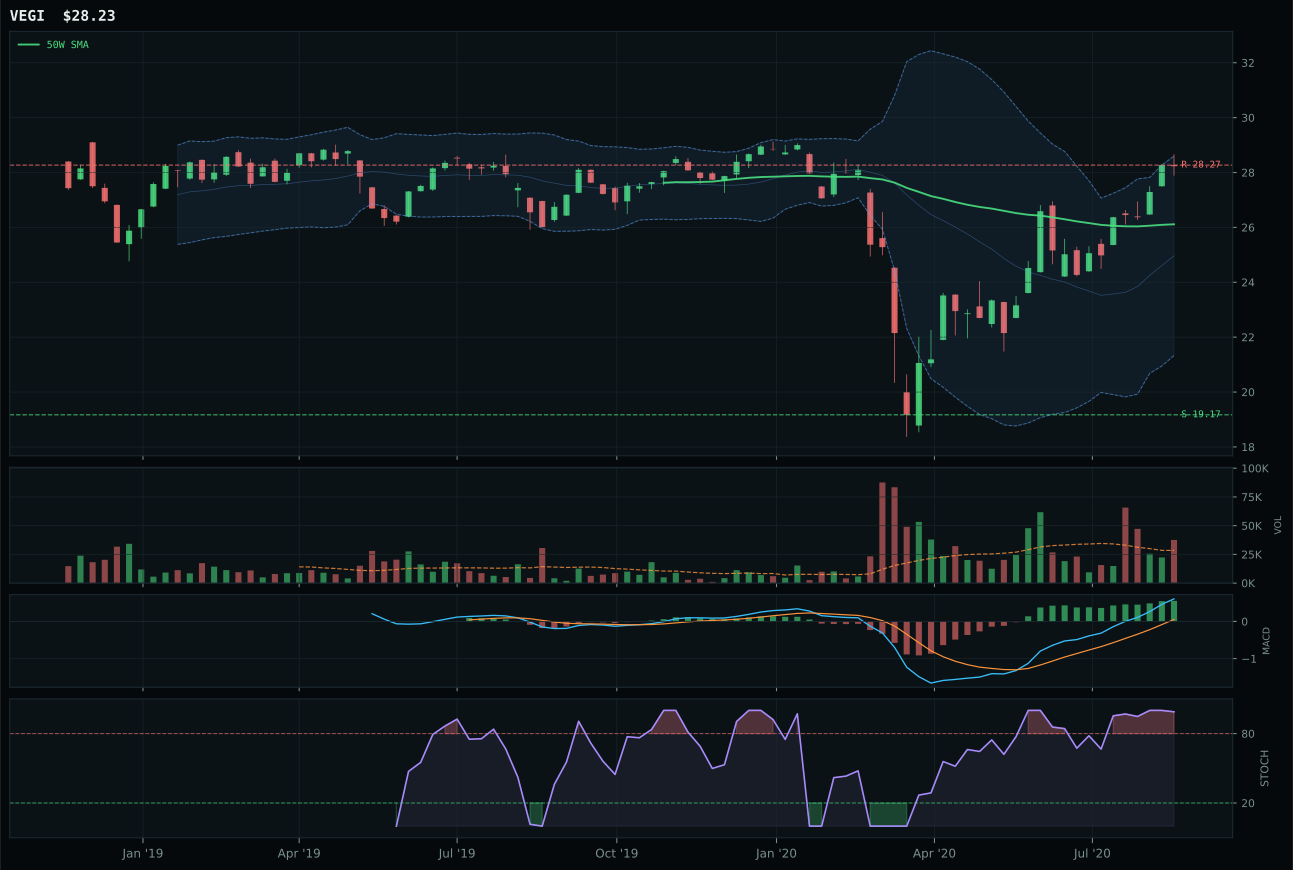
VEGI has a neutral structure profile with 7.0% 13-week relative strength versus SPY.
A failed hold above support would weaken the setup.
Tracked, but not top-2 eligible because: .
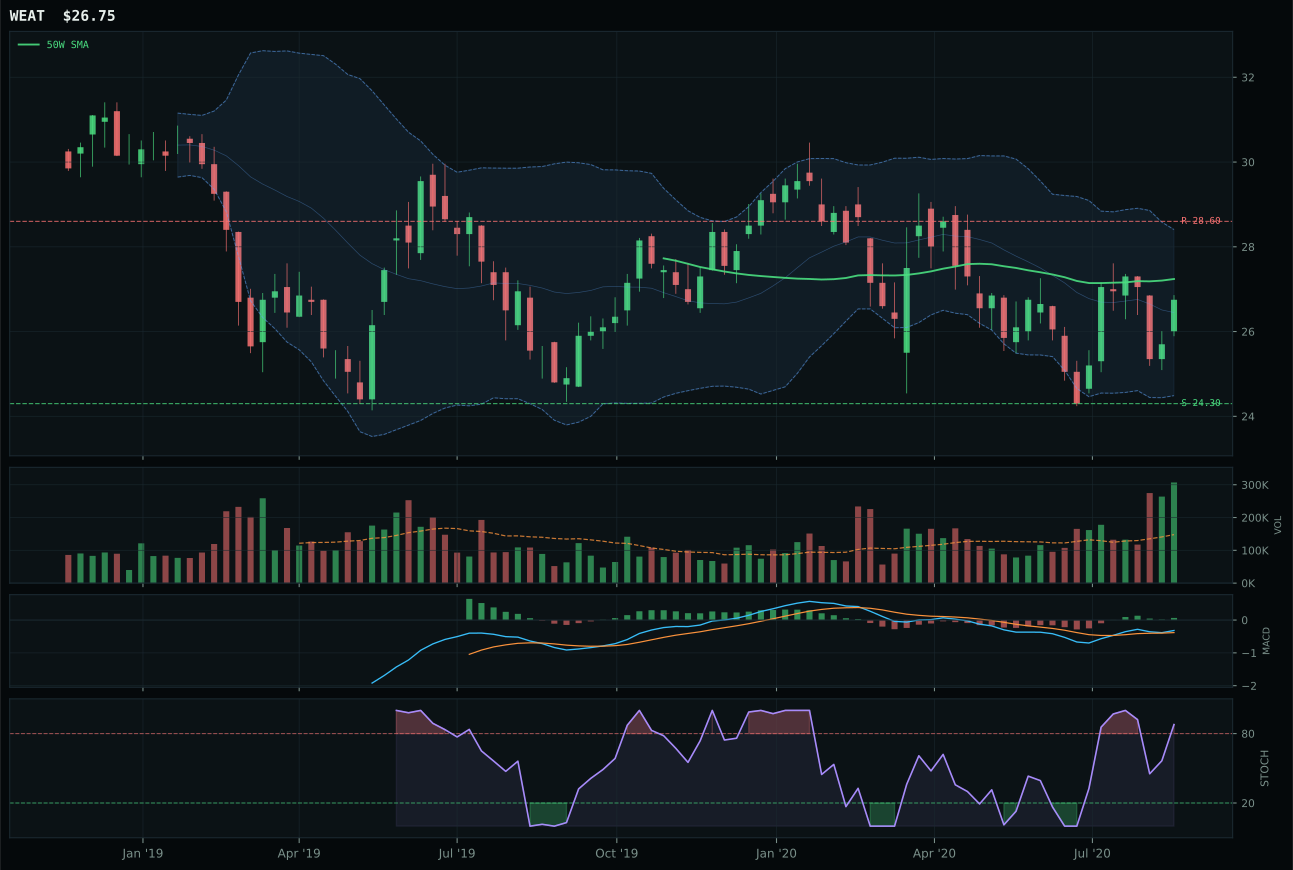
WEAT has a compression near 50W profile with -12.4% 13-week relative strength versus SPY.
Extension and support failure are the main tactical risks.
Tracked, but not top-2 eligible because: structurally broken.
MOO wins the Agriculture & Livestock category decisively on technical breadth and volume confirmation. The fund is positioned just 7.8% above the 50-week moving average—a controlled entry point free from extension stress—while maintaining a trend score of 100.0 from price above both the 50W and 200W with a zero slope and 7.0% SPY relative strength. Volume is above-average at 1.36x the 20W average, which is the critical difference from peers: VEGI shows identical momentum (21.9% thirteen-week return, 7.0% relative strength) but with less-clean structure and lower volume participation. MACD is bullish and improving, and the stochastic RSI is overbought rolling over rather than stuck at the ceiling, suggesting the accumulation phase is already underway. MOO's category-relative strength sits at 0.0%, meaning it is the category median; VEGI is not beating it on momentum or macro exposure, merely matching it while trailing on structure and volume. The 22-point gap over VEGI reflects XLK's superior technical sponsorship, not a performance gap.
Agriculture & Livestock earned 0% allocation this week, ranking ninth or tenth among the ten categories and sitting outside the portfolio entirely. The category score of 34.4 places it at the bottom tier where allocation is not justified despite MOO's solid technical setup. The macro fit at 55.0 is neutral; real asset sponsorship is active at +8, and commodity breadth positive is live at +5, but those supports are offset by disinflation pressure at -8, creating a wash. The technical evidence is strong at 76.7 for MOO, but it is not enough to overcome the broader category ranking. Agriculture would need to either consolidate MOO's gains on much heavier volume (currently thin at 0.58x the 20W) to signal institutional accumulation, or the macro environment would need to flip sharply toward hard inflation or supply disruption fears. At present, the category is subordinate to the higher-scoring tech, AI, precious metals, and emerging markets sleeves, and there is insufficient tail risk or structural support to justify allocation. A move above 5% on volume would be the first signal that a reallocation is warranted.
Traditional Energy — XLE
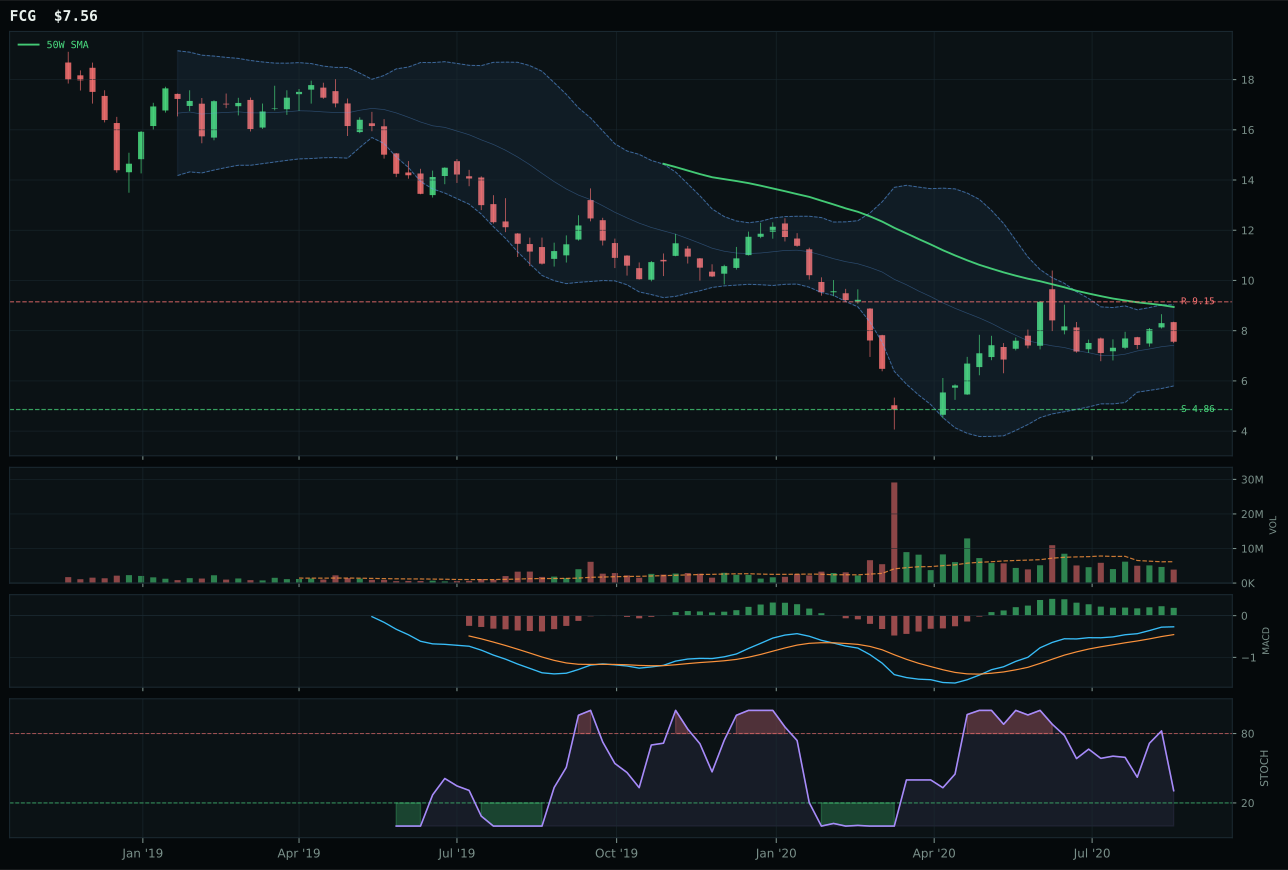
FCG has a neutral structure profile with -15.4% 13-week relative strength versus SPY.
Extension and support failure are the main tactical risks.
Tracked, but not top-2 eligible because: structurally broken.
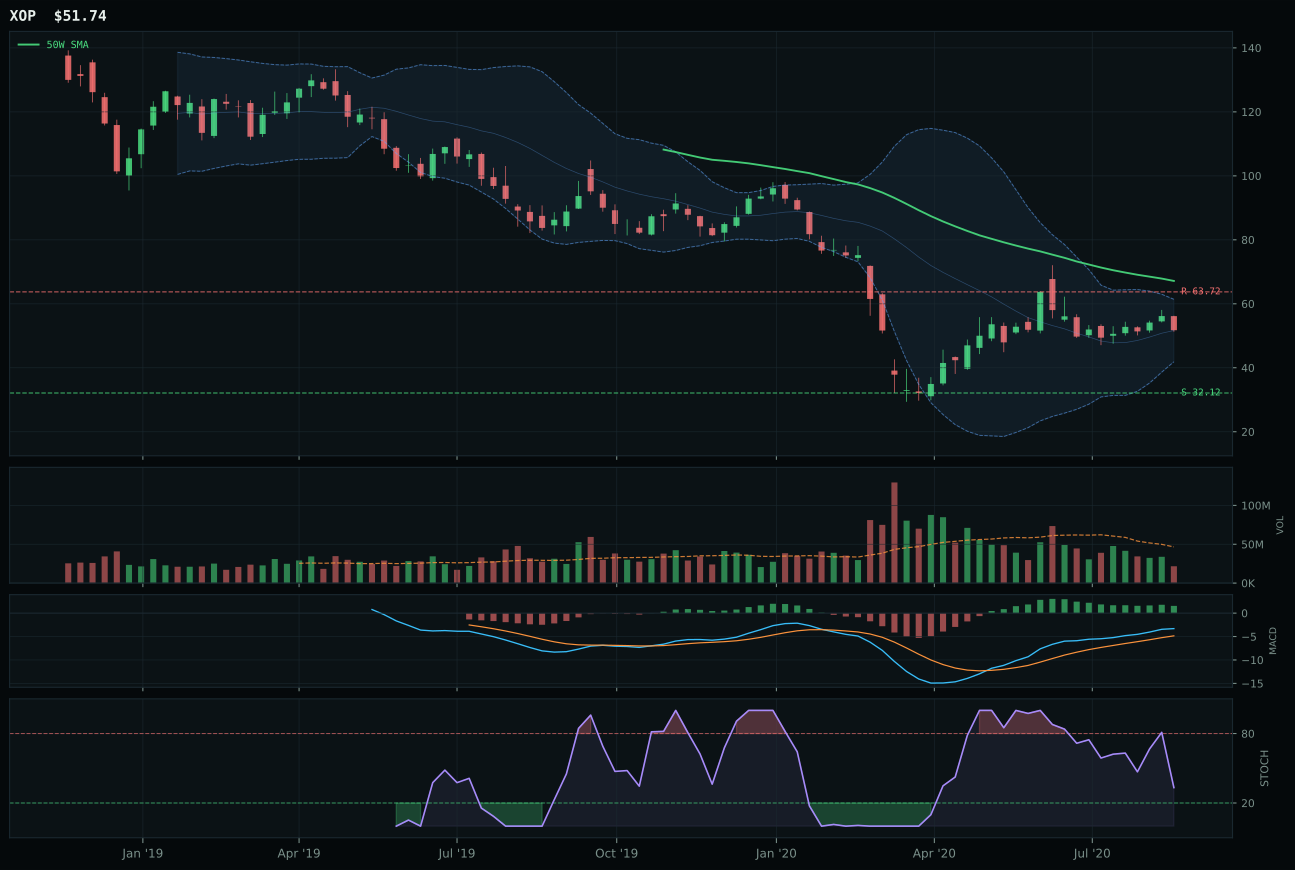
XOP has a neutral structure profile with -17.0% 13-week relative strength versus SPY.
Extension and support failure are the main tactical risks.
Tracked, but not top-2 eligible because: structurally broken.
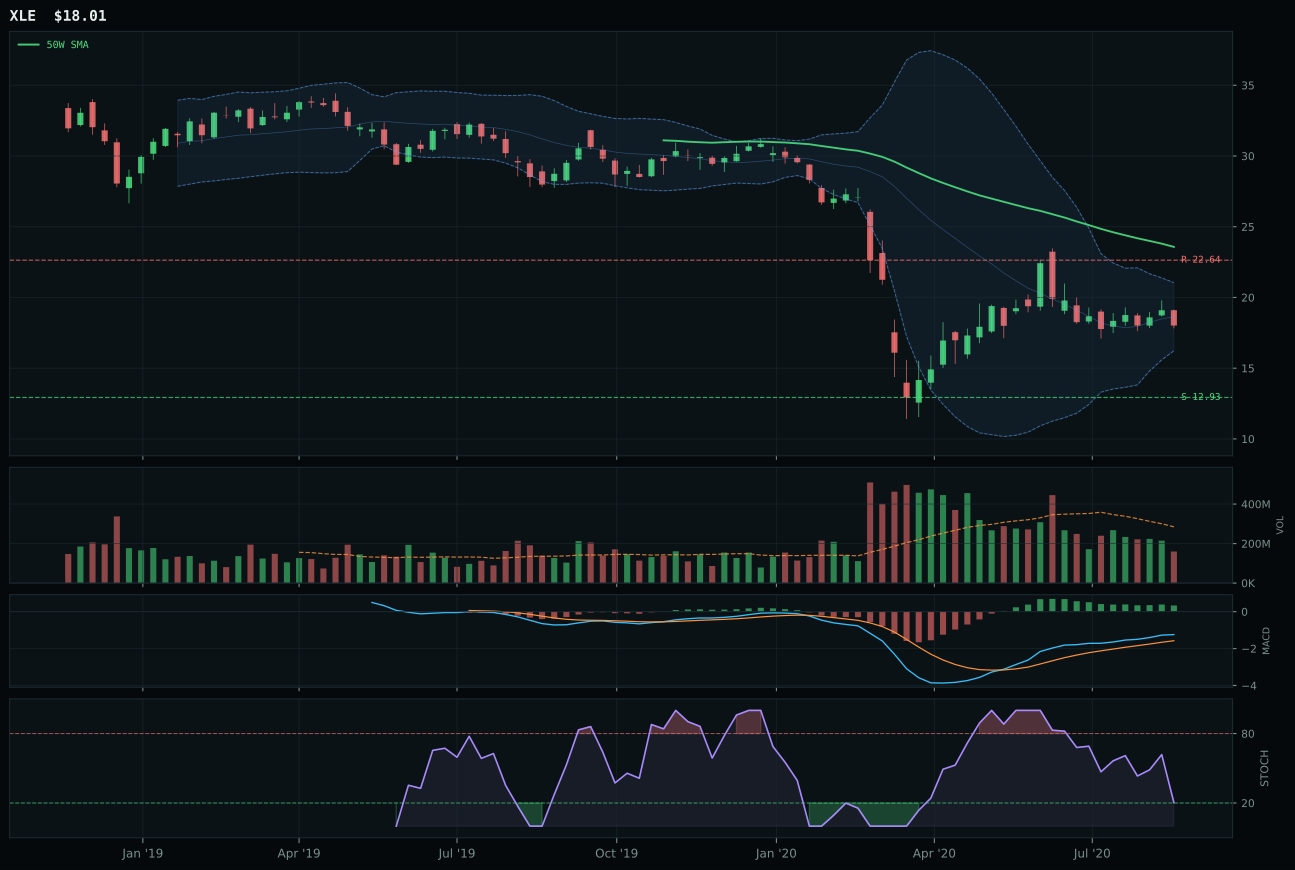
XLE has a neutral structure profile with -21.3% 13-week relative strength versus SPY.
Extension and support failure are the main tactical risks.
Tracked, but not top-2 eligible because: structurally broken.
XLE wins the energy category by default in a catastrophically broken field—but it does not win allocation because the category itself failed eligibility. The fund is 23.6% below the 50W and below the 200W as well, putting price in the deep retracement zone near the 0.618 Fibonacci level where support has become a real test. The thirteen-week return of -6.4% and relative strength of -21.3% to SPY are the real killers: energy is not just lagging the market, it is actively declining in absolute terms. Stochastic RSI at 0.20 is near the low, and volume is thin at 0.56x the 20W, meaning there is little evidence of accumulation at these levels. MACD is still bullish but flattening, which is the only technical thread keeping the setup from a complete break, but the momentum confirmation score of 0.0 reflects the absence of any persuasive evidence that buyers have arrived. Runner-up FCG (natural gas) scored 32.5 on technical evidence versus XLE's 16.8, yet XLE still won on being marginally less broken; the gap is -8.9 points, a massive intra-category divergence that signals neither ETF is viable.
Traditional Energy earned 0% allocation as the lowest-ranked category, with an ineligible flag that removed it from consideration even for tier-3 status. The category score of 0.0 reflects a hard filter failure: the technical evidence was so poor (XLE at just 5.5, MACD/stochastic RSI flattening and rolling over, volume-price confirmation at only 15.7) that the reasoner rightfully excluded it. The macro fit at 40.0 is the worst in the portfolio; disinflation pressure is active at -10, credit stress at -7, and real asset sponsorship can only muster +7. The only active descriptor helping energy is real asset sponsorship, but it is being overwhelmed by the macro headwinds. Energy would need a fundamental reset in price action—ideally, a recovery above the 50W on heavy volume with stochastic RSI rising from oversold—before any allocation would be warranted. Moreover, the macro regime would need to flip toward hard inflation or supply-side stress to justify re-entry. At present, energy is out of the portfolio entirely, and that exclusion is technically and macro-justified.