
2020-08-14
Informational purposes only. The content in this report, including allocations, analysis, and commentary, is provided solely for informational and educational purposes. It does not constitute financial advice, investment advice, trading advice, or any other type of advice. Past performance does not guarantee future results. Always conduct your own research and consult a qualified financial professional before making investment decisions.
Some tracked tickers were excluded due to missing live weekly price data: SGOV: Historical cache SGOV has only 11 usable weekly bars; URNM: Historical cache URNM has only 37 usable weekly bars
Weekly Allocation
| Ticker | Category | Weight | Role |
|---|---|---|---|
| FBTC | 50% | Overlay | |
| REMX | Industrial Metals | 10% | Top-2 (10%) |
| BOTZ | AI | 10% | Top-2 (10%) |
| XLK | Technology | 5% | Tier-2 (5%) |
| INDA | Emerging Markets | 5% | Tier-2 (5%) |
| XAR | Defense & Aerospace | 5% | Tier-2 (5%) |
| SLV | Precious Metals | 5% | Tier-2 (5%) |
| MOO | Agriculture & Livestock | 5% | Tier-2 (5%) |
| FCG | Traditional Energy | 5% | Tier-2 (5%) |
Trade Instructions — Monday Open
Sell the tranche from 2020-07-17 (completing its 4-week hold). Buy the new tranche. Instructions show net portfolio changes — same-asset positions cancel, weight changes show the delta.
| Action | Ticker | Instruction |
|---|---|---|
| SELL | XLK | Sell 60% of XLK position (reduce 6.25% → 2.50%) |
| SELL | BOTZ | Sell 50% of BOTZ position (reduce 5.00% → 2.50%) |
| SELL | INDA | Sell 33% of INDA position (reduce 3.75% → 2.50%) |
| SELL | SLV | Sell 10% of SLV position (reduce 12.50% → 11.25%) |
| SELL | MOO | Sell 25% of MOO position (reduce 5.00% → 3.75%) |
| SELL | XAR | Sell 17% of XAR position (reduce 7.50% → 6.25%) |
| SELL | COPX | Sell entire COPX position (2.50% of portfolio) |
| SELL | URA | Sell 50% of URA position (reduce 5.00% → 2.50%) |
| BUY | REMX | Buy REMX — 15.38% of freed cash (adds 2.50% to portfolio) |
| BUY | FBTC | Buy FBTC — 76.92% of freed cash (adds 12.50% to portfolio) |
| BUY | FCG | Buy FCG — 7.69% of freed cash (adds 1.25% to portfolio) |
Current Portfolio After Trade
Combined holdings across all 4 active tranches. Each tranche is 25% of the portfolio.
| Ticker | % of Portfolio | Weight Bar |
|---|---|---|
| FBTC | 25.00% | |
| FSOL | 12.50% | |
| SLV | 11.25% | |
| CIBR | 7.50% | |
| REMX | 7.50% | |
| XAR | 6.25% | |
| SMH | 6.25% | |
| MOO | 3.75% | |
| XLE | 3.75% | |
| XLU | 3.75% | |
| INDA | 2.50% | |
| URA | 2.50% | |
| BOTZ | 2.50% | |
| XLK | 2.50% | |
| PAVE | 1.25% | |
| FCG | 1.25% |
Macro Regime — Late-Cycle Reflation
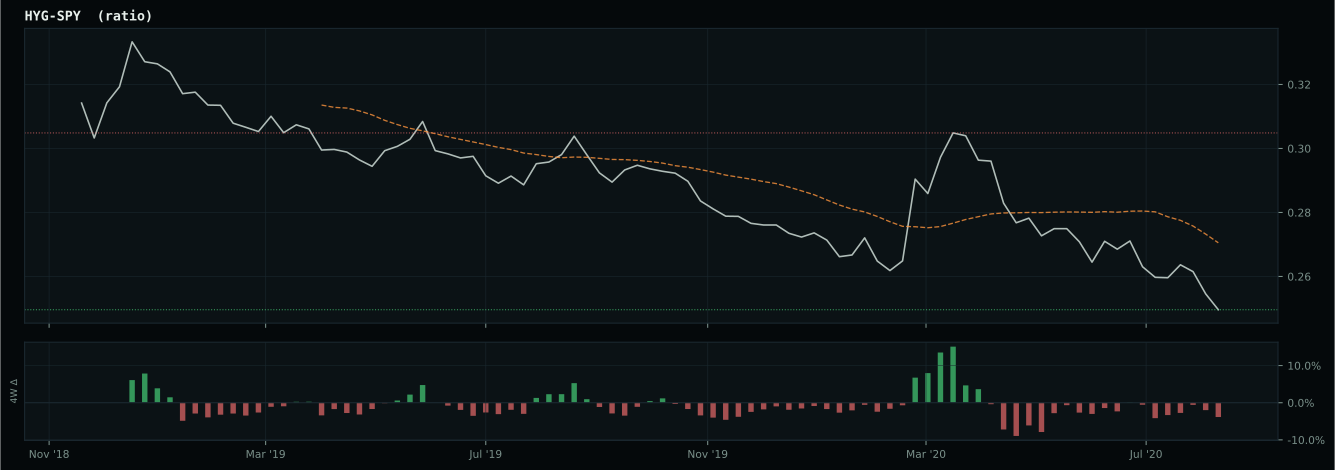
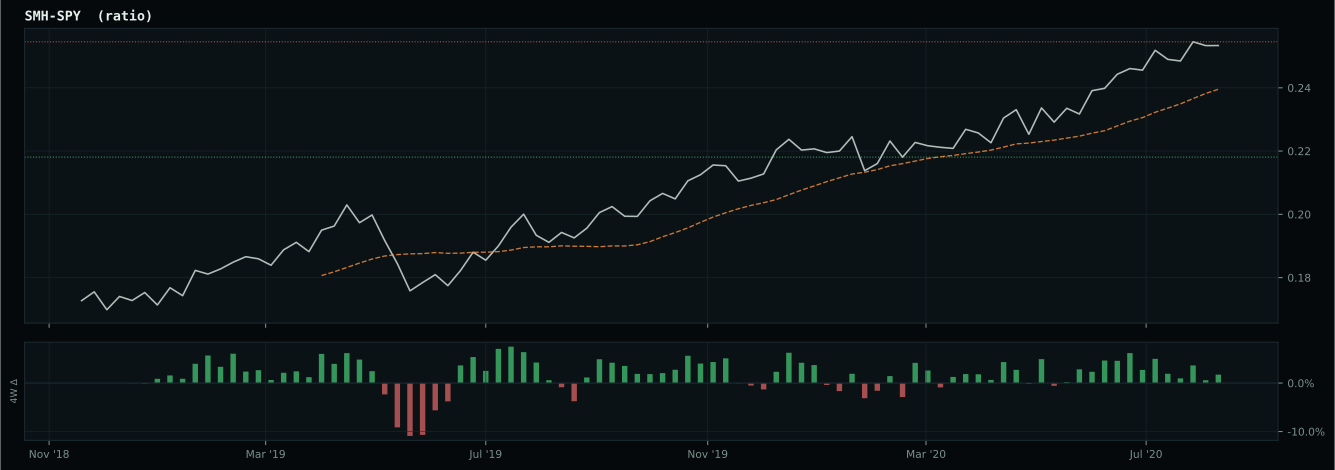
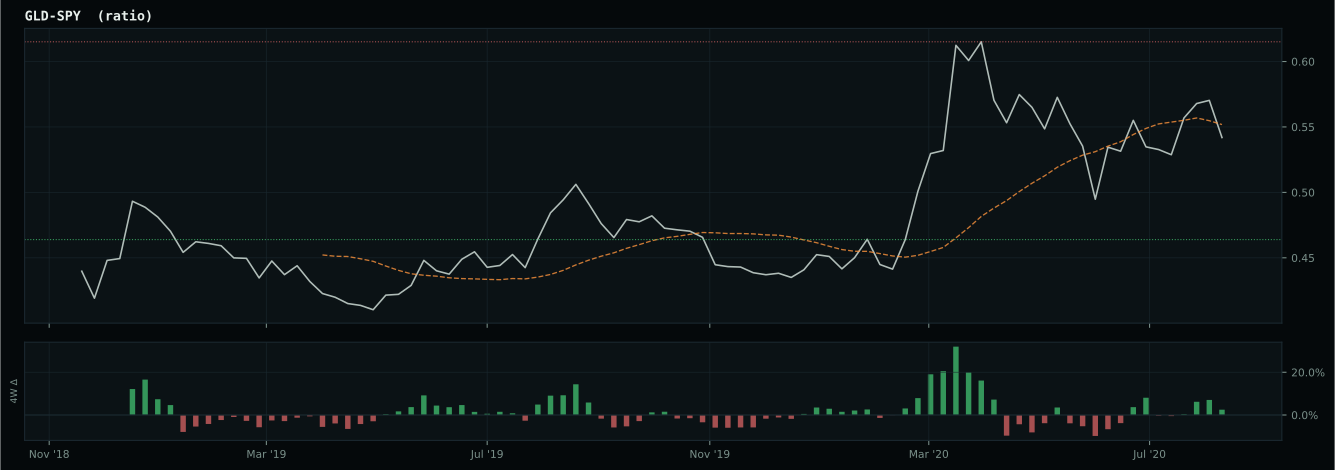
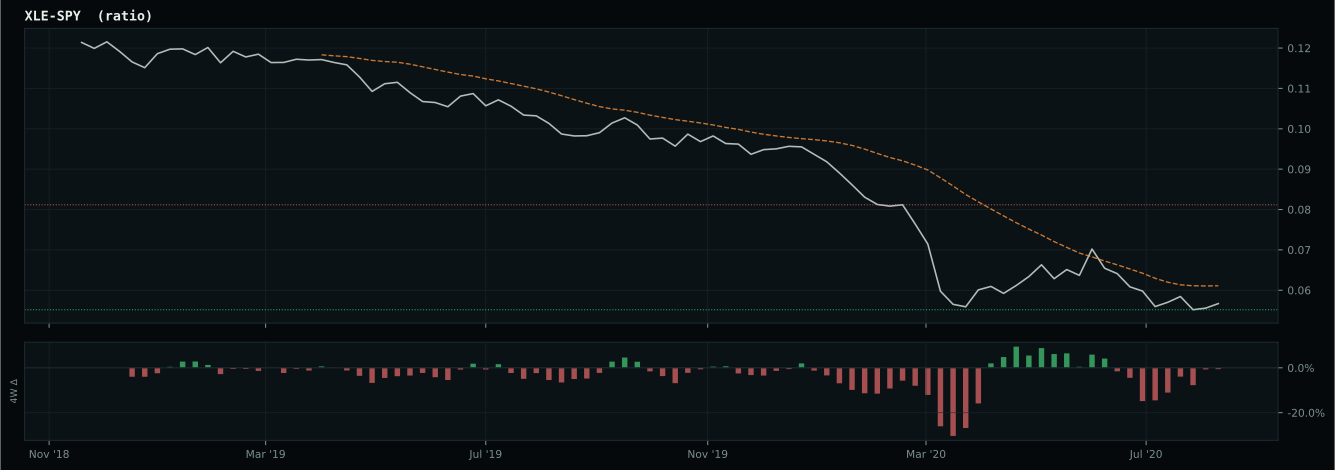
Macro Evidence Charts
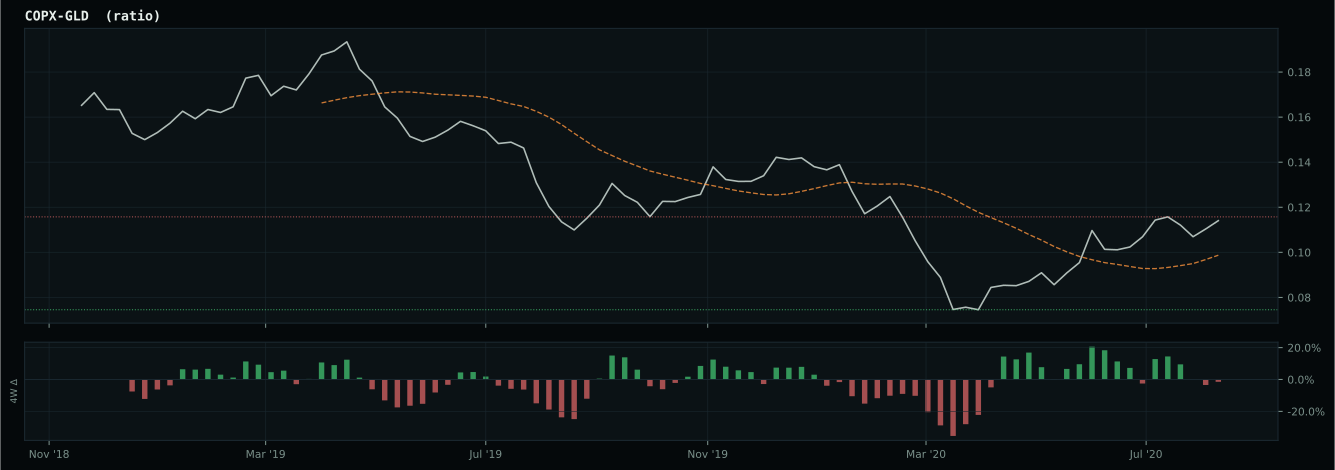
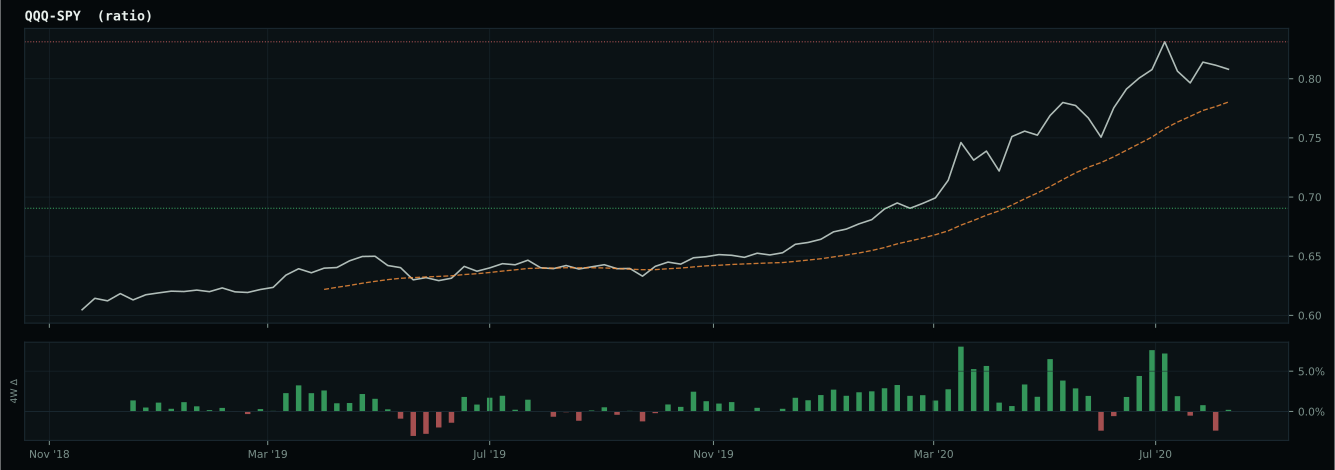
Market-implied signals behind the macro regime scores. Each ratio compares two assets; the direction and slope of the ratio is what the macro engine reads.
Crypto Regime — TrendBTC
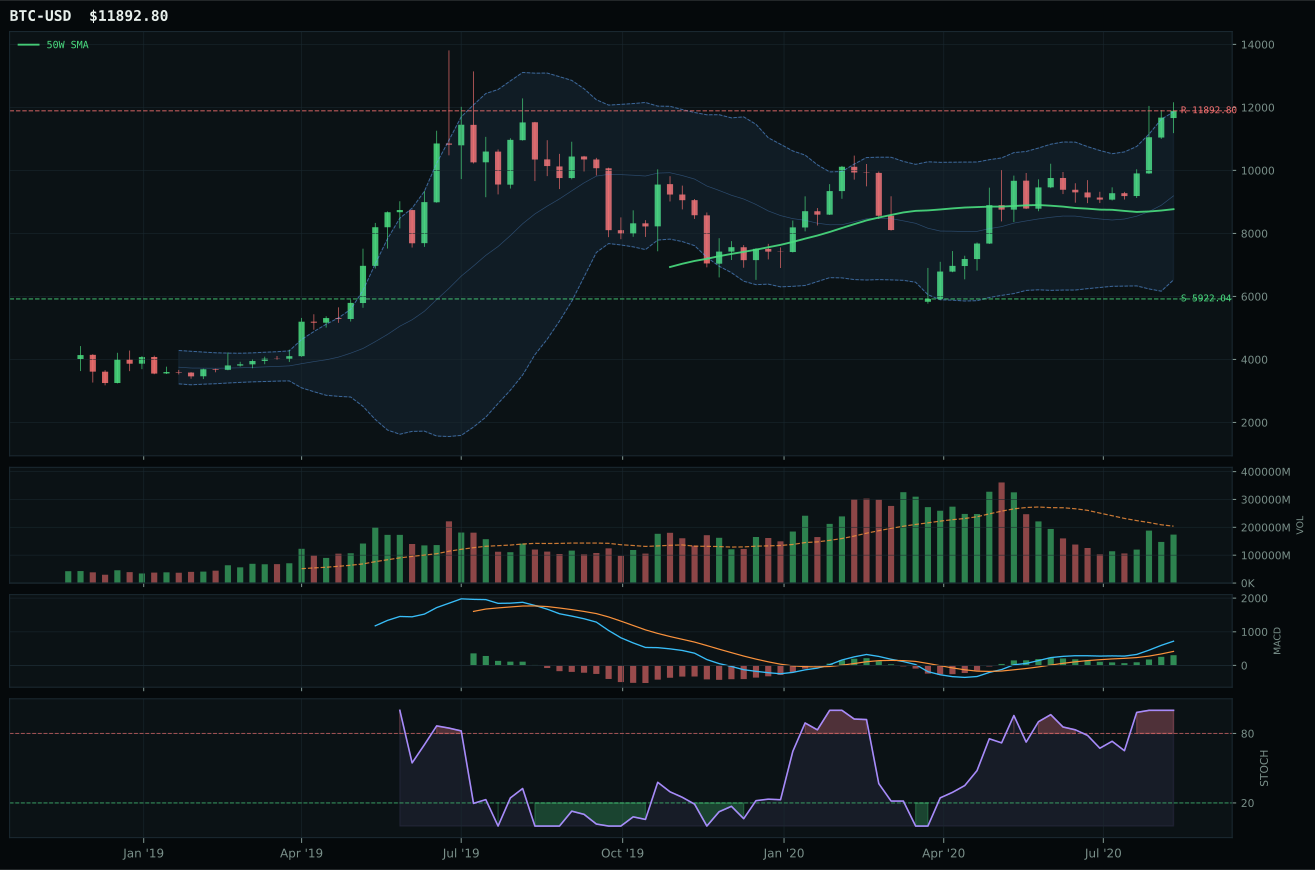
post-touch structure is too wide to count as a range; max/min close ratio is 2.17
TrendBTC confirmed: 2 consecutive closes above rising/flat 50W SMA
one or more available conditions failed

Category Rankings
| Rank | Category | Winner | Score | Alloc | 4W Ret | Peers (4W) |
|---|---|---|---|---|---|---|
| 1 | Industrial Metals | REMX | 68.4 | 20% | -6.74% | PICK +0.6% · COPX +5.2% |
| 2 | AI | BOTZ | 54.6 | 20% | +0.89% | SMH -1.6% · AIQ +2.5% |
| 3 | Technology | XLK | 53.2 | 10% | +0.24% | IGV +2.6% · CIBR -1.4% |
| 4 | Emerging Markets | INDA | 50.0 | 10% | +3.08% | IEMG +0.1% · ILF -1.4% |
| 5 | Defense & Aerospace | XAR | 48.4 | 10% | -5.66% | ITA -4.4% · ROKT -4.0% |
| 6 | Precious Metals | SLV | 46.6 | 10% | -1.37% | GLD -0.6% · GDX -0.6% |
| 7 | Agriculture & Livestock | MOO | 45.1 | 10% | +0.52% | VEGI +2.8% · WEAT +5.0% |
| 8 | Traditional Energy | FCG | 40.8 | 10% | -22.90% | XOP -20.0% · XLE -14.4% |
| 9 | Nuclear Energy | NLR | 36.8 | 0% | -1.57% | URA -0.4% |
| 10 | Utilities & Infrastructure | PAVE | 36.0 | 0% | -1.95% | XLU -2.0% · IGF -1.6% |
Industrial Metals — REMX
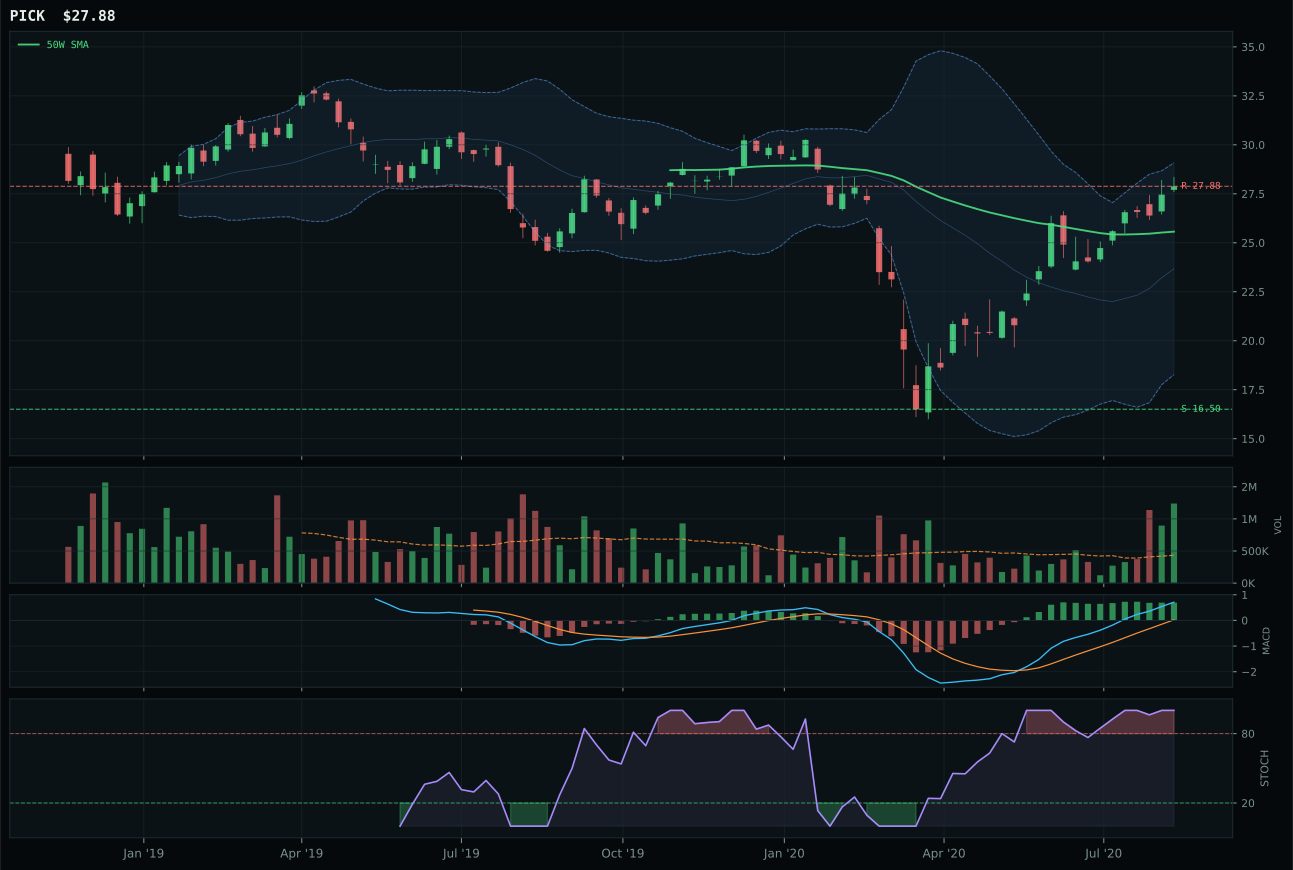
PICK has a neutral structure profile with 16.4% 13-week relative strength versus SPY.
A failed hold above support would weaken the setup.
Actionable but governed by invalidation levels.
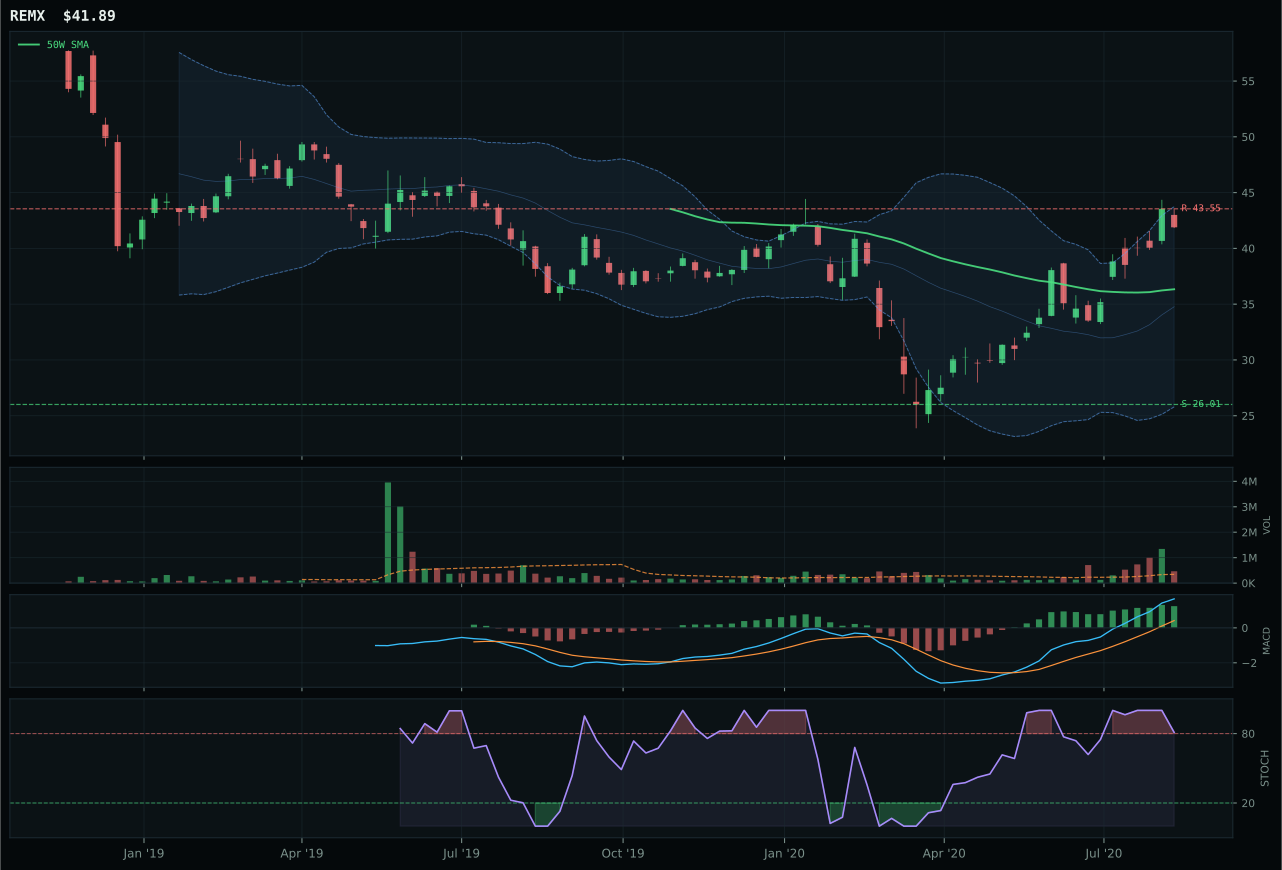
REMX has a vertical extension profile with 17.5% 13-week relative strength versus SPY.
A failed hold above support would weaken the setup.
Actionable but governed by invalidation levels.
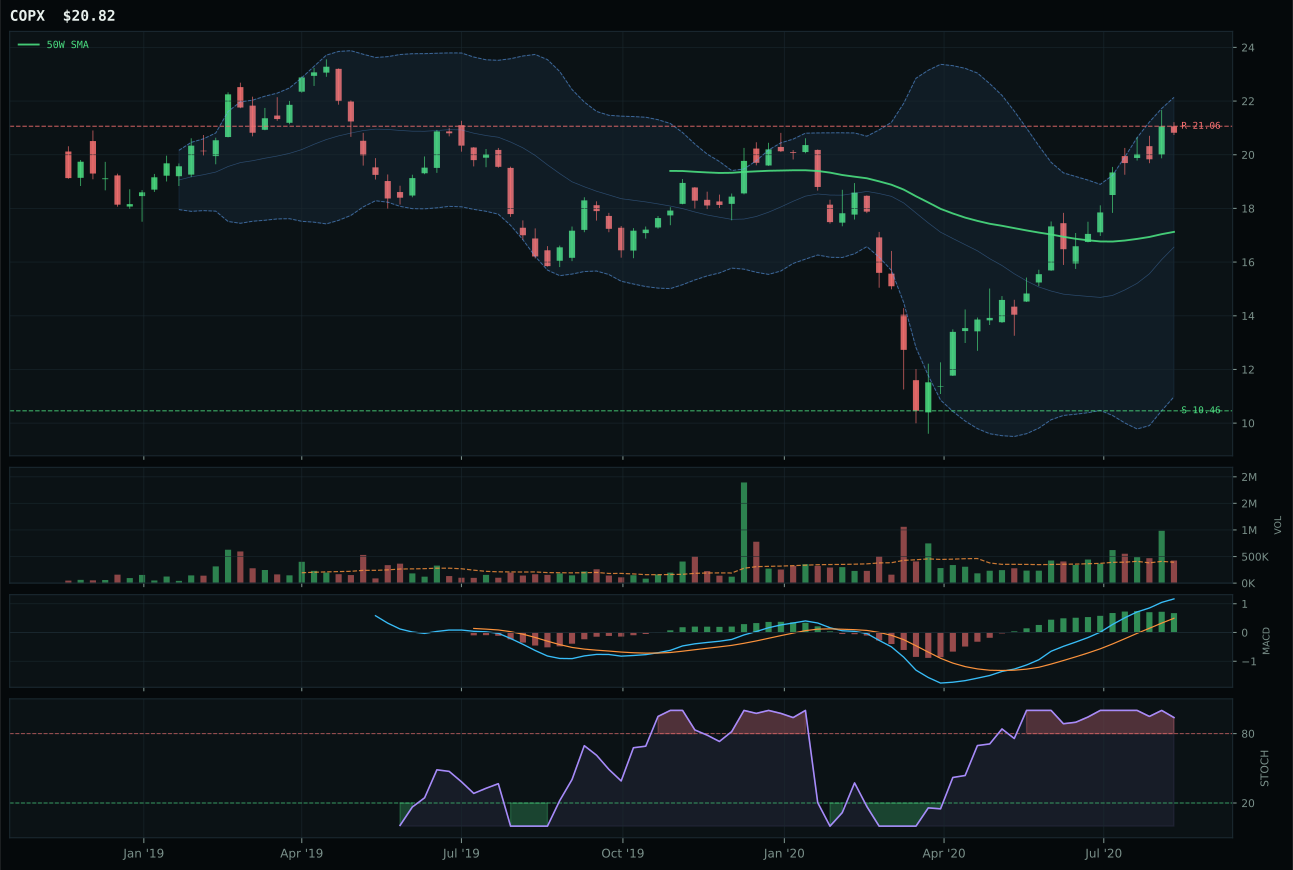
COPX has a vertical extension profile with 30.6% 13-week relative strength versus SPY.
A failed hold above support would weaken the setup.
Tracked, but not top-2 eligible because: .
REMX claimed the top-2 slot by offering the exact opposite profile of most category winners: a pullback setup (15.3% above the 50W but MACD improving, not flattening) combined with the strongest category-relative strength in the portfolio. The 17.5% SPY outperformance and 0.0% category-relative positioning means REMX is leading the miners despite technical indicators that suggest compression and roll-over risk, a sign that real money is entering on the reset rather than chasing extended moves. PICK's 83.1 reasoned ranking looks stronger on paper—93.6 technical evidence, neutral structure, accumulation volume—but its bullish-but-flattening MACD and -1.1% category-relative underperformance reveal it's not the leader even though its trend structure appears cleaner. The 35.0 timing score for REMX reflects the pullback opportunity, and while stochastic RSI is rolling over at 0.81, the 65.3 volume-price confirmation and 82.4 persistence prove the accumulation is real. This is a category where entry timing trumps trend quality.
Industrial Metals earned a 10% top-2 allocation based on its 68.4 final score, the highest-ranked category in the portfolio this week, because it combined powerful macro tailwinds with a clean technical confirmation. The category's 65.0 macro fit benefited from Late-Cycle Reflation (+10 bps), active metals scarcity (+14 bps), and real-asset sponsorship (+6 bps)—totaling nearly +30 bps of macro support—while REMX's above-average volume participation (1.36x) and improving MACD provided technical proof that the move has institutional weight. The tension is real: REMX sits 15.3% above its 50W with stochastic RSI overbought and rolling over at 0.81, creating entry-risk compression that limited the timing score to only 35.0. However, the category's macro positioning—metals scarcity and real-asset inflation in a reflation regime—remains intact regardless of near-term chart overbought conditions, and REMX's persistence at 82.4 indicates that volume-relative-strength is confirming the move despite extended positioning. If macro narratives around supply shortages or inflation pressure weaken, this category will face immediate re-evaluation; but in the current regime where Late-Cycle Reflation and real-asset sponsorship are active, the 10% overweight is justified as a structural inflation hedge, not merely a momentum chase.
AI — BOTZ
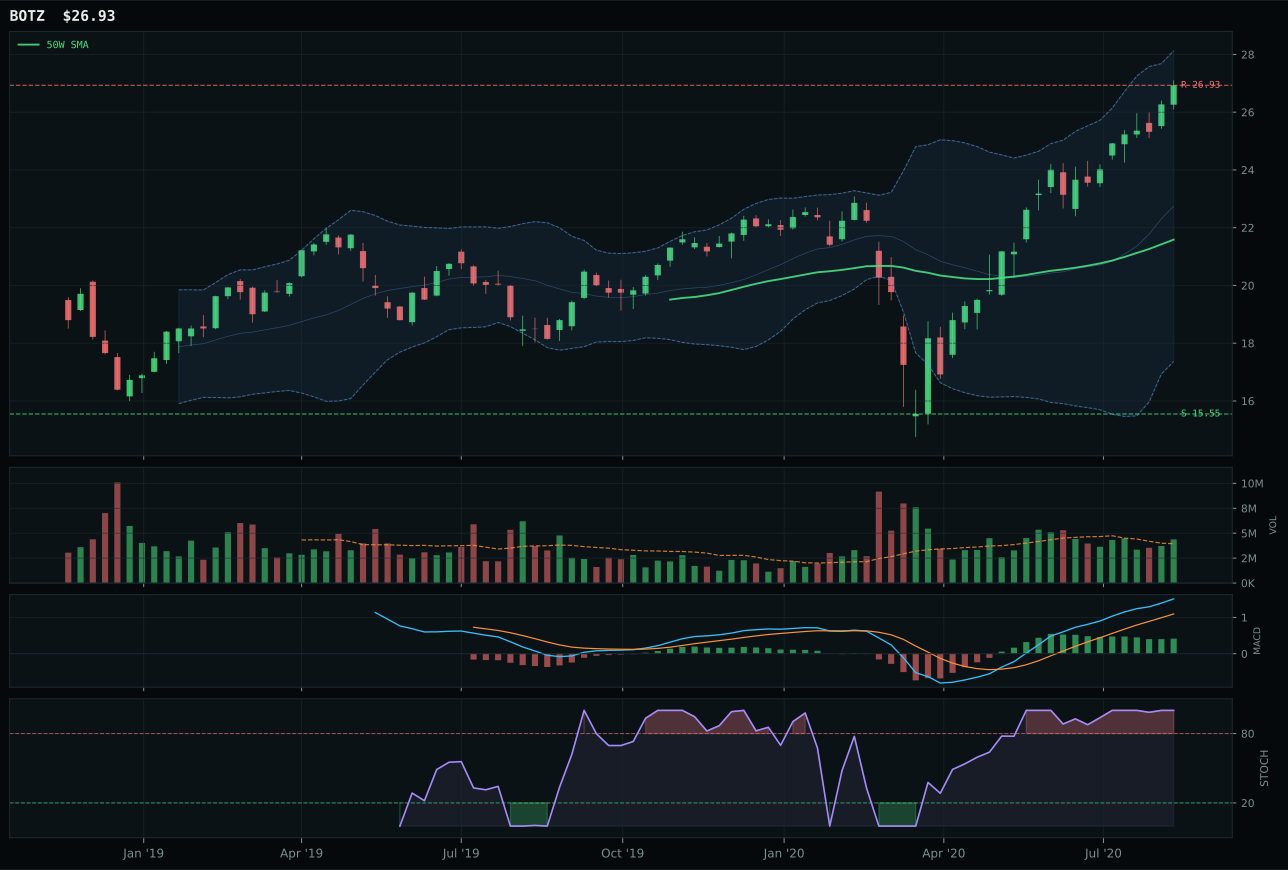
BOTZ has a vertical extension profile with 9.5% 13-week relative strength versus SPY.
A failed hold above support would weaken the setup.
Actionable but governed by invalidation levels.
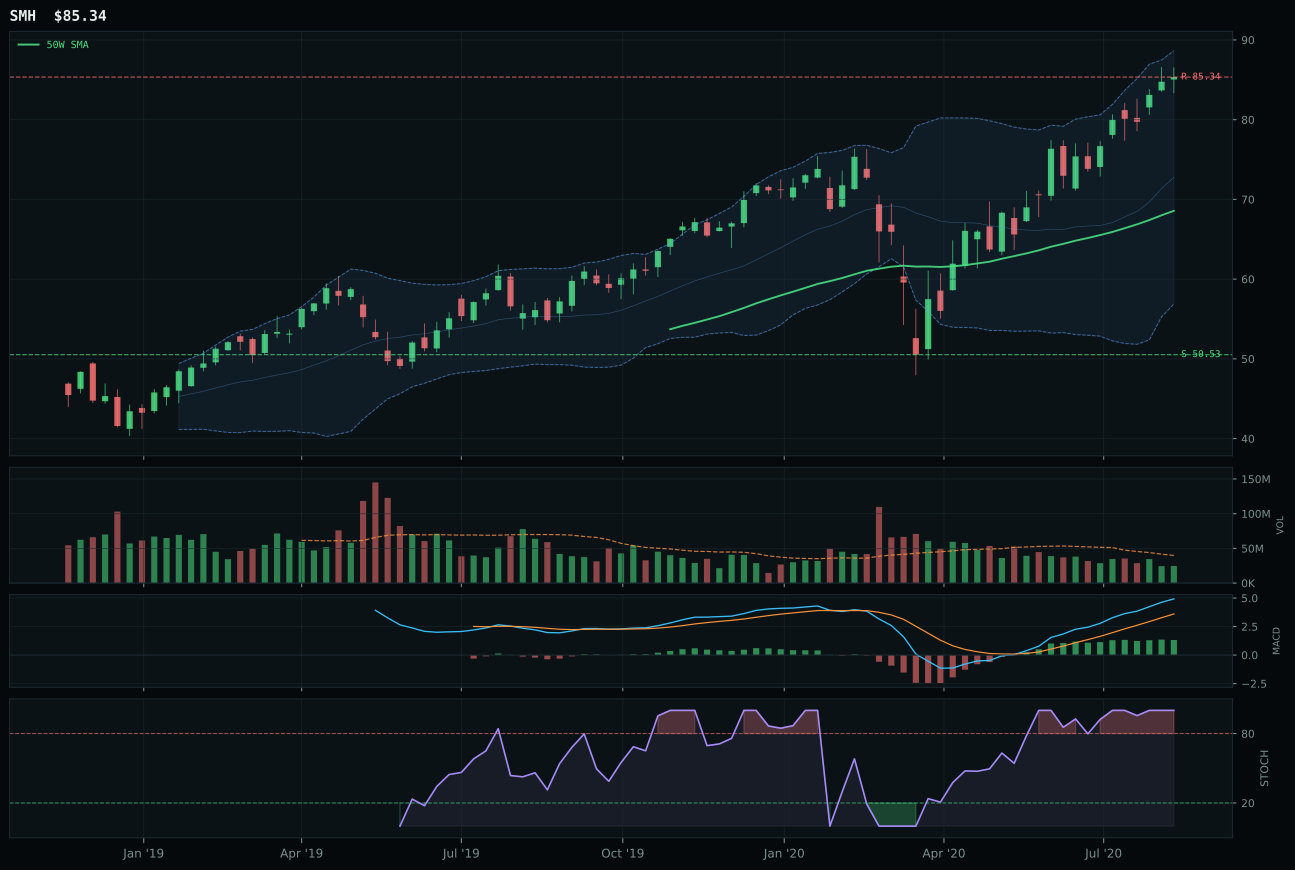
SMH has a vertical extension profile with 12.4% 13-week relative strength versus SPY.
A failed hold above support would weaken the setup.
Actionable but governed by invalidation levels.
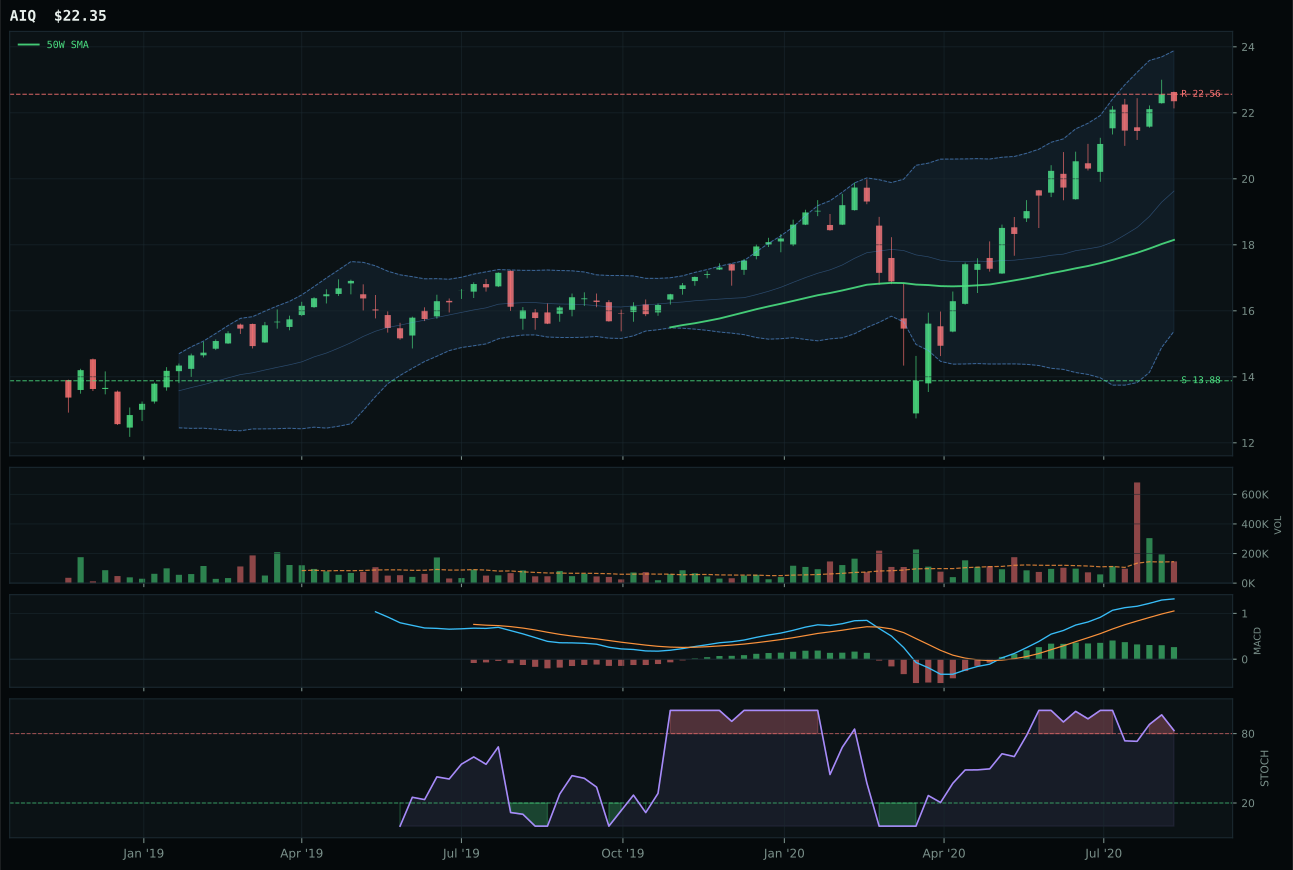
AIQ has a vertical extension profile with 4.3% 13-week relative strength versus SPY.
A failed hold above support would weaken the setup.
Tracked, but not top-2 eligible because: .
BOTZ claimed the AI category despite being structurally identical to SMH on timing (both at 32.0) and momentum confirmation (both at 100.0), winning on the strength of superior structure cleanliness (81.7 vs. 75.8) and, critically, above-average volume participation (1.11x) that confirmed accumulation versus SMH's thin participation and distribution risk. The 1.0-point margin reflects an extremely close technical call between two robotics/AI compute plays, both sitting 24-27% above their respective 50-week averages in vertical extensions with overbought stochastic RSI readings. BOTZ's 9.5% relative strength versus SPY and perfect category-relative parity (0.0%) provided the tie-breaker, while SMH's 12.4% SPY-relative strength was offset by its 2.9% category outperformance—a sign that SMH's gains were driven by category tailwinds rather than independent sponsorship. Volume confirmation became the operative difference: BOTZ's above-average buying pressure on an extended chart offered better proof that this move has institutional weight behind it, whereas SMH's thin volume on 30.1% thirteen-week gains exposed more mechanical short-covering or momentum chasing.
AI earned a 10% top-2 overweight allocation based on its 54.6 final category score, the second-highest ranking among all ten categories this week. The portfolio entered this period with Late-Cycle Reflation and three major tailwinds: risk appetite actively positive, AI growth sponsorship at +14 basis points of macro fit, and liquidity stress dragging at only -12 bps (offset by the reflation regime itself). BOTZ's 100.0 trend score, 100.0 momentum confirmation, and 9.5% SPY-relative strength created a rare combination of technical purity and macro alignment that justified committing fresh capital at the 10% sleeve level. The tension within the category is real—timing scores at 32.0 and overbought stochastic RSI across all three ETFs signal that entry risk is maximal—but the absolute RS relative to broad equities and the intact 50W/200W structure in both BOTZ and SMH created enough asymmetry to warrant top-2 treatment. If macro descriptors shift and risk appetite rolls over, this category will lose its primary gravitational center, but while AI growth remains an active positive in this regime, the category's rank is earned, not inherited.
Technology — XLK
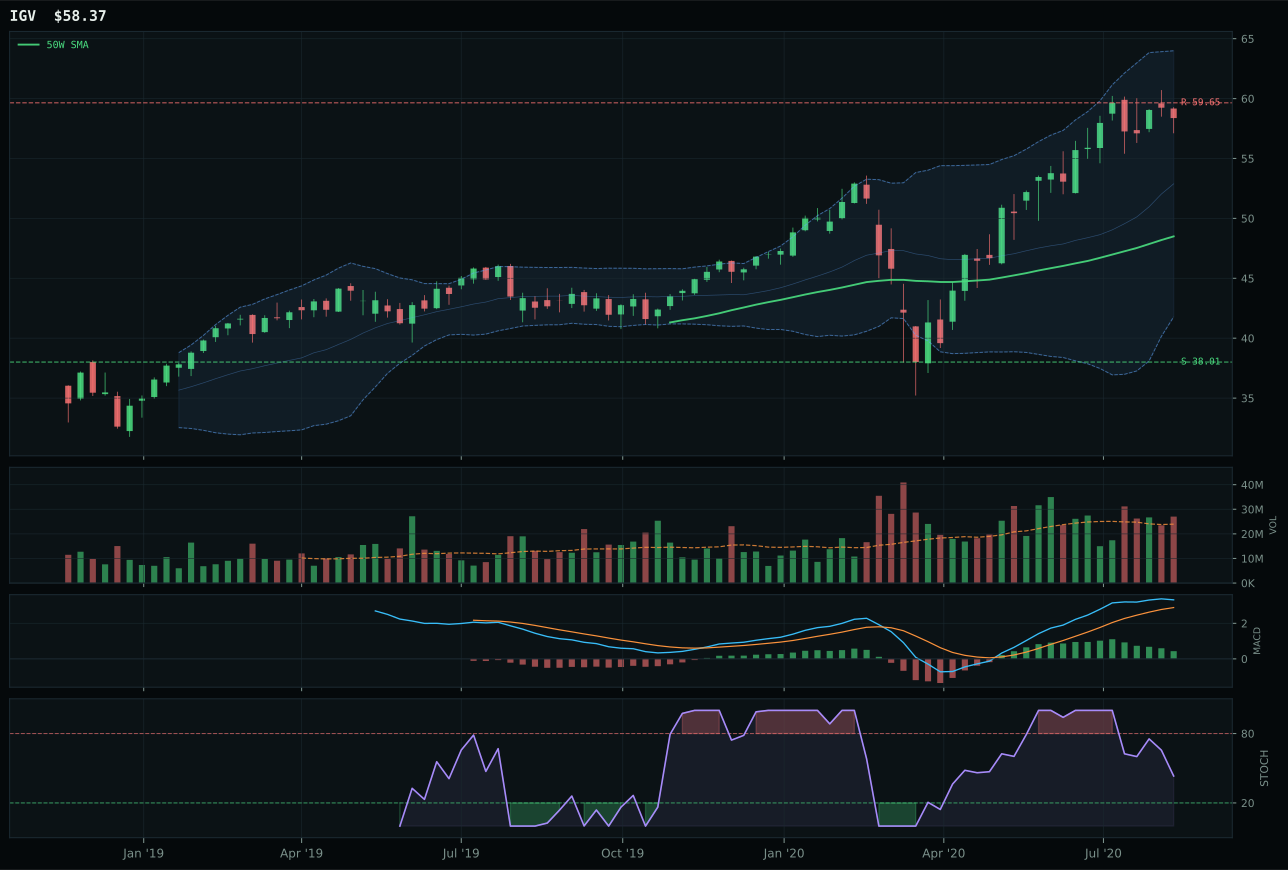
IGV has a vertical extension profile with -1.9% 13-week relative strength versus SPY.
A failed hold above support would weaken the setup.
Actionable but governed by invalidation levels.
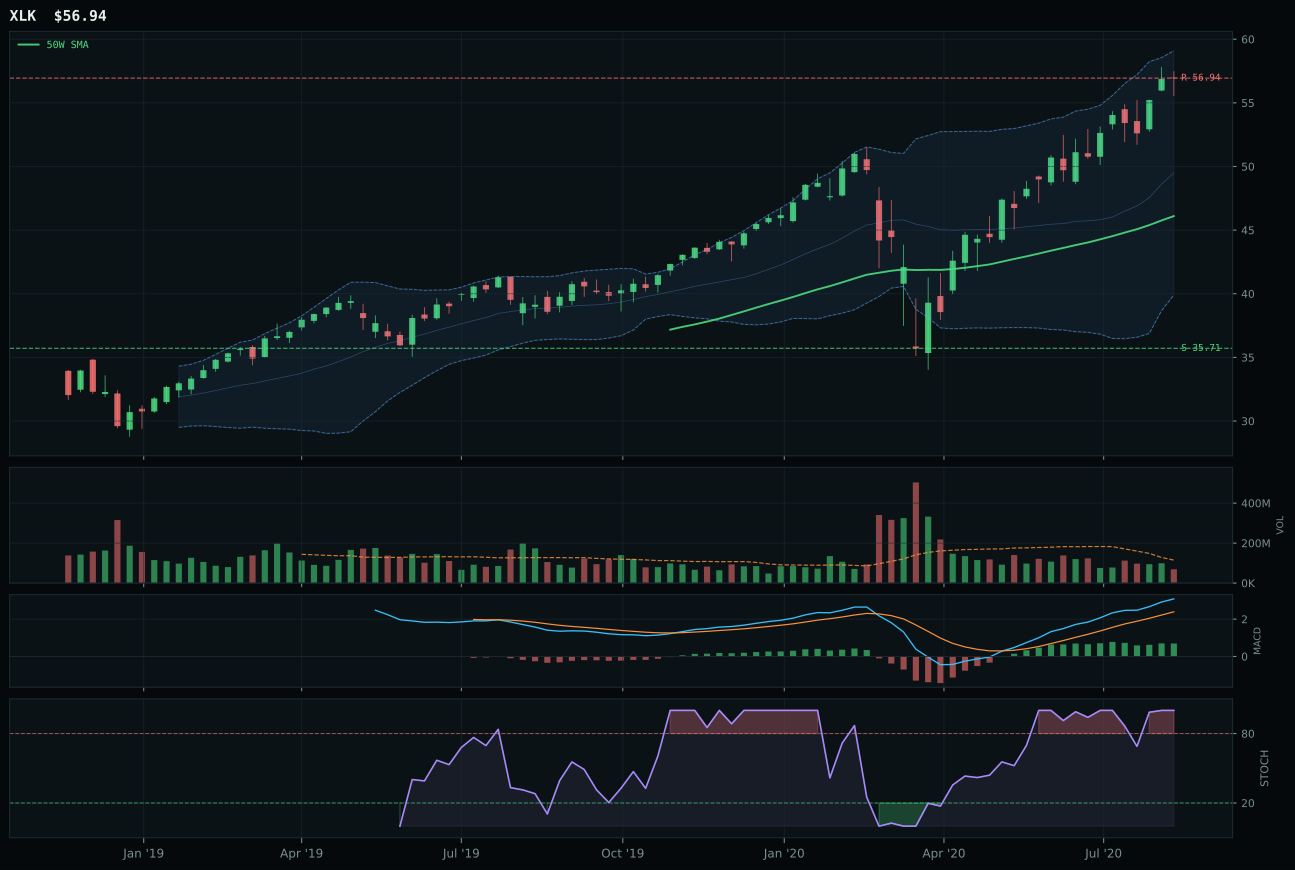
XLK has a vertical extension profile with 4.2% 13-week relative strength versus SPY.
A failed hold above support would weaken the setup.
Actionable but governed by invalidation levels.
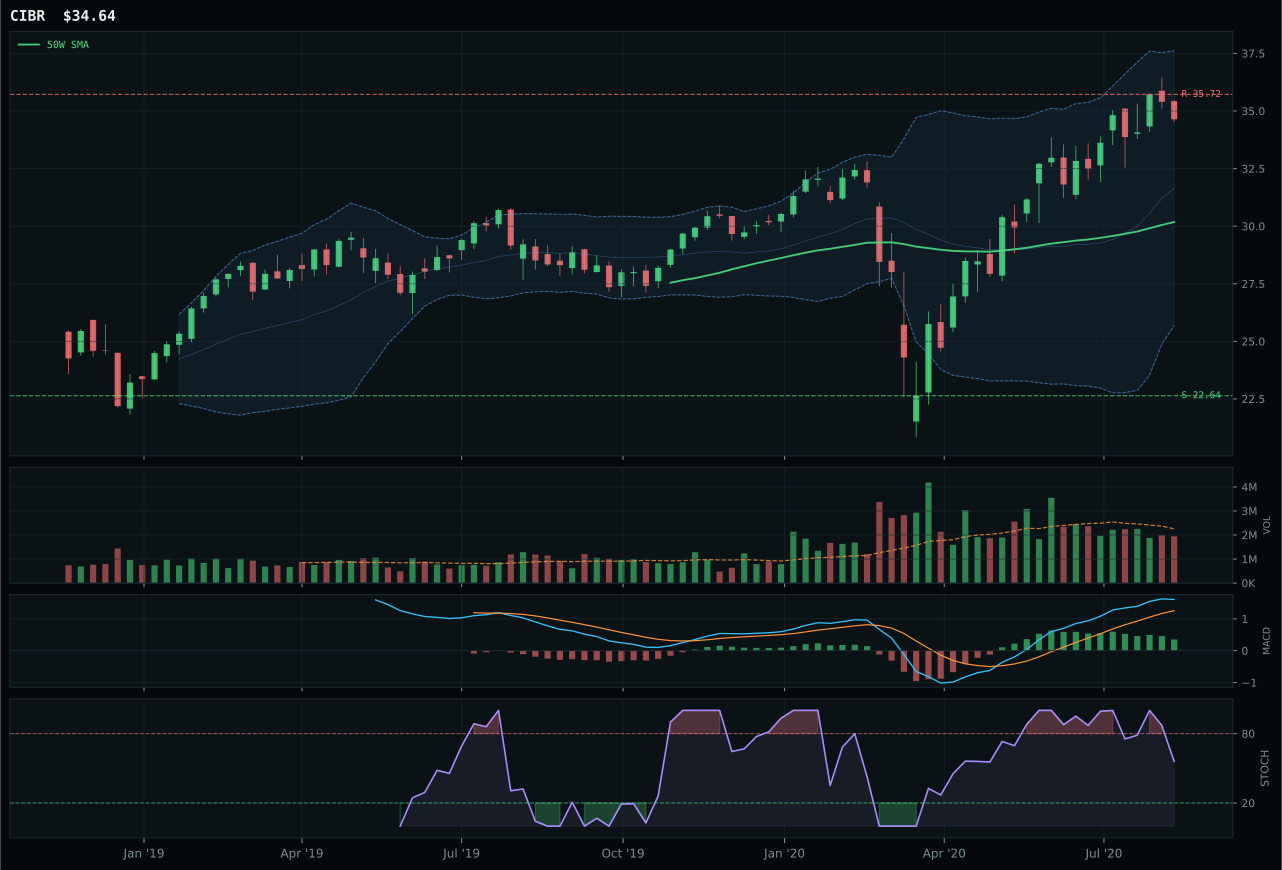
CIBR has a neutral structure profile with -2.0% 13-week relative strength versus SPY.
A failed hold above support would weaken the setup.
Actionable but governed by invalidation levels.
XLK won the Technology category by capturing the only meaningful relative strength advantage in the basket, posting a 6.1% edge over category peers while maintaining a 4.2% advantage versus SPY. The setup itself carries significant entry risk—the fund sits 23.5% above its 50-week moving average in a vertical extension with overbought stochastic momentum and MACD already flattening, which explains why the timing score compressed to just 32.0 despite perfect trend structure. What distinguished XLK from IGV was precisely this relative strength discipline: IGV's -1.9% RS versus SPY and 0.0% category-relative standing left it fighting against both absolute and peer momentum, while IGV's stochastic RSI showed falling rather than sustained overbought pressure. The 4.9-point category score gap versus IGV reflects a clean technical victory in peer leadership, not a compelling setup quality.
Technology earned a 5% allocation as a tier-2 position, reflecting its rank outside the top two categories this week. The portfolio's macro regime—Late-Cycle Reflation with active risk-appetite support and AI sponsorship—should theoretically favor broad technology exposure, yet the category's 53.2 final score placed it below both Industrial Metals (68.4) and AI (54.6), driven by timing compression in XLK's extended chart position and deteriorating MACD confirmation across the basket. The allocation honors XLK's relative strength and intact above-50W trend structure, but the risk asymmetry has shifted sharply: every new buyer at current levels is late to the initial move, and the macro fit (44.0/100) lags the technical evidence (62.0/100 weighted) by enough to keep this category in a holding rather than accumulation posture. If XLK were to pull back toward the 50-week moving average with volume contracting, the category could re-enter contention for top-2 weight, but at current prices it remains a value-extraction, not a new capital deployment opportunity.
Emerging Markets — INDA
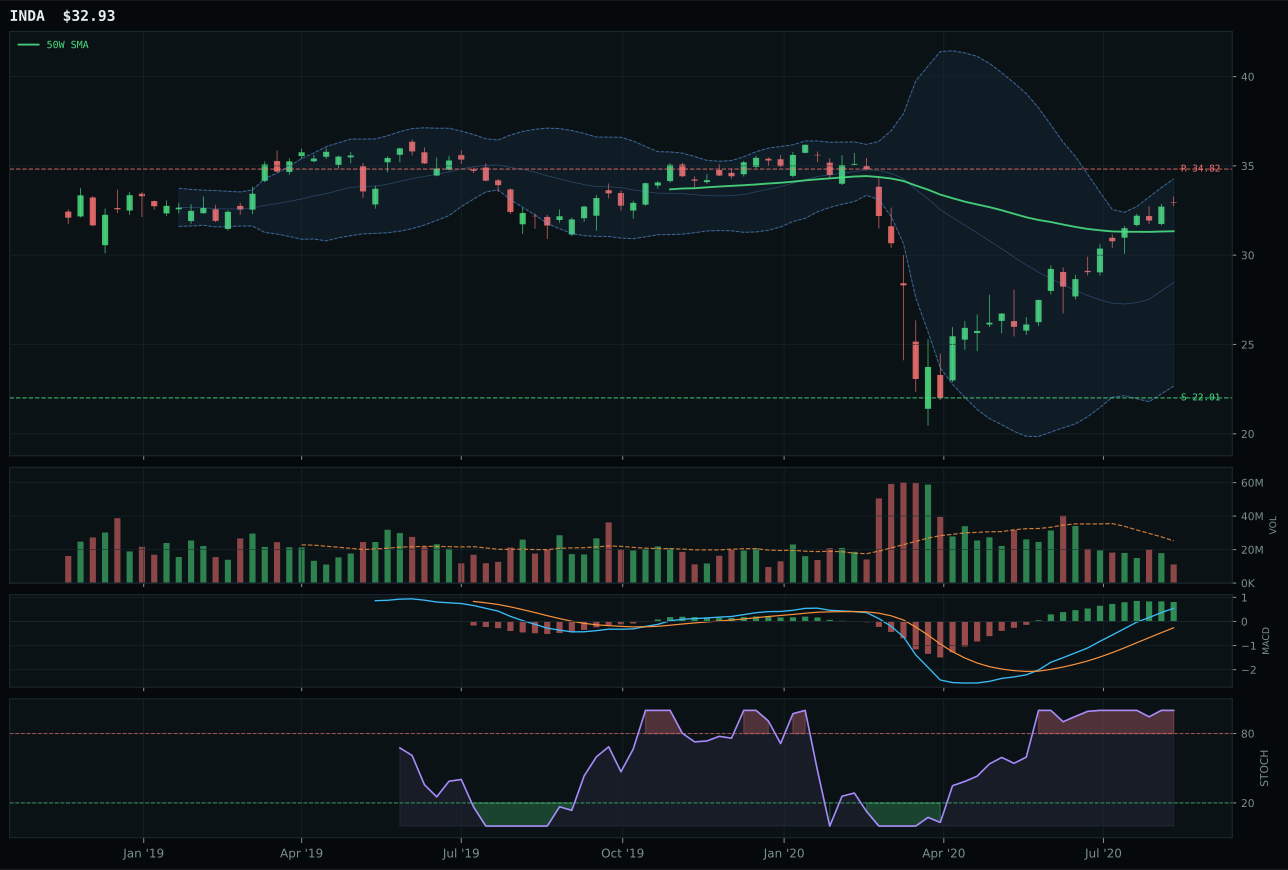
INDA has a neutral structure profile with 9.0% 13-week relative strength versus SPY.
A failed hold above support would weaken the setup.
Actionable but governed by invalidation levels.
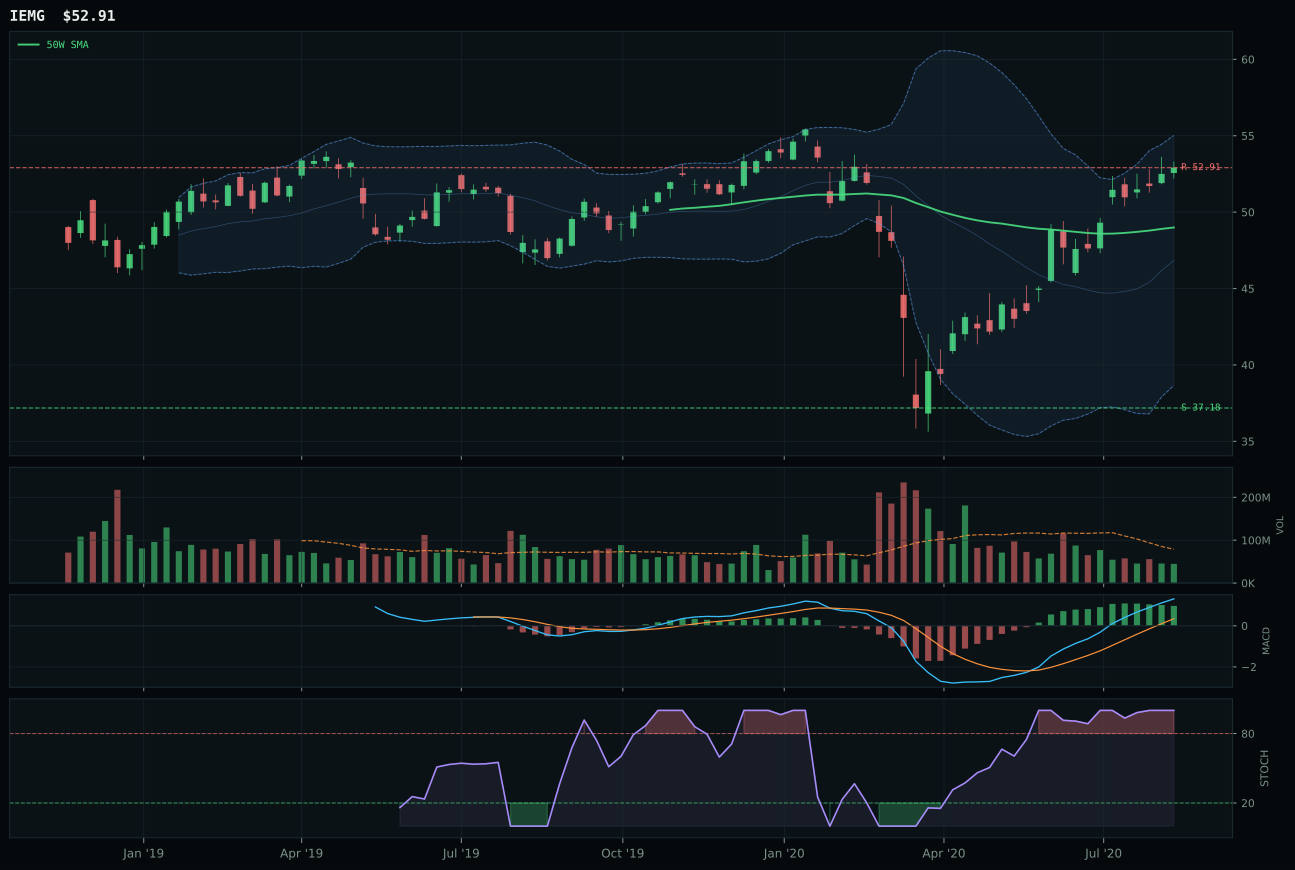
IEMG has a neutral structure profile with 5.3% 13-week relative strength versus SPY.
A failed hold above support would weaken the setup.
Actionable but governed by invalidation levels.
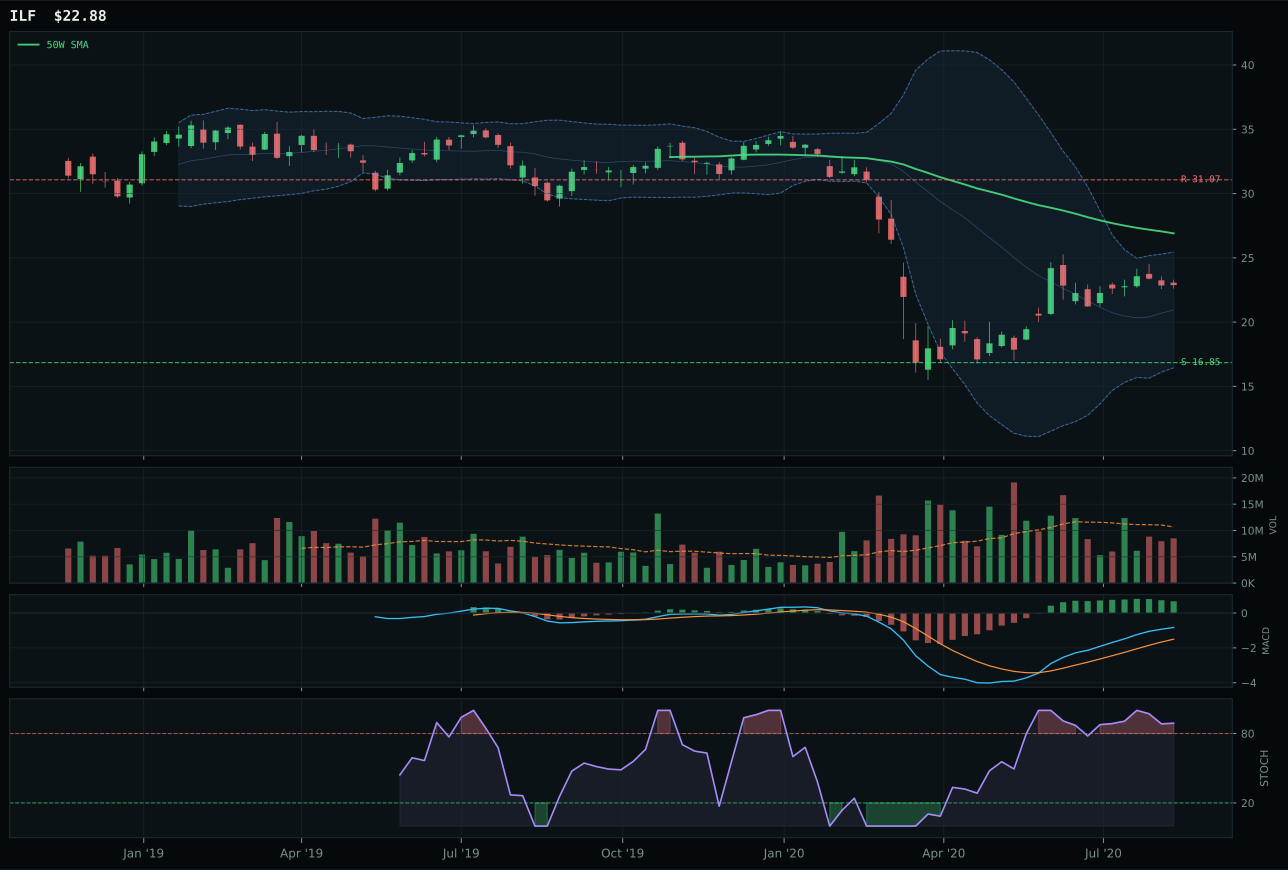
ILF has a neutral structure profile with 10.4% 13-week relative strength versus SPY.
Extension and support failure are the main tactical risks.
Tracked, but not top-2 eligible because: structurally broken.
INDA claimed the category by delivering the cleanest technical execution despite thin volume participation: a 77.7 technical score driven by perfect trend (100.0), solid structure (79.6), and superior MACD confirmation (bullish and improving versus IEMG's bullish but flattening). The 26.7% thirteen-week return and 9.0% SPY outperformance put INDA in the pack, but the category-relative strength of 0.0% shows it's the legitimate leader, not a follower. IEMG's 5.3% RS versus SPY looks reasonable until you realize it lagged category-relative by 3.7%, revealing it was outpaced by INDA despite similar headline momentum. The 79.4 volume-price confirmation means INDA's move is cleaner despite thin participation (0.44x), a quality signal that matters more than volume magnitude in emerging markets. The 75.0 timing score reflects a reasonable 5.1% distance from the 50W with MACD improving—not extended, not reset, just properly positioned for a continuation setup.
Emerging Markets earned 5% as a tier-2 allocation despite its 50.0 score ranking it sixth overall, because the category's macro fit (38.0/100) was weak, dragged down by active credit stress (-10 bps) and liquidity stress (-10 bps) that offset the modest risk-appetite support (+8 bps). The allocation honors INDA's superior technical setup—100.0 trend score, 100.0 momentum confirmation, 79.6 structure—and India-specific growth narratives that justify a hold, but the macro regime's stress signals (credit and liquidity) create a headwind that prevented this category from ascending to higher tiers. INDA's thin participation (0.44x average volume) is a secondary concern but reinforces that the 26.7% thirteen-week gains came from price momentum rather than volume accumulation, a distinction that matters in a late-cycle reflation environment where volume quality often precedes reversal. To push Emerging Markets into tier-1 consideration, credit stress would need to reverse (currently -10 bps, a material drag), or INDA would need to prove that the relative strength (9.0% SPY-relative, 0.0% category-relative) persists with improving volume sponsorship. Currently, the category sits as a quality-growth hedge that is technically sound but macroeconomically under-tailwinds, making it a 5% holding rather than a capital-deployment candidate.
Defense & Aerospace — XAR
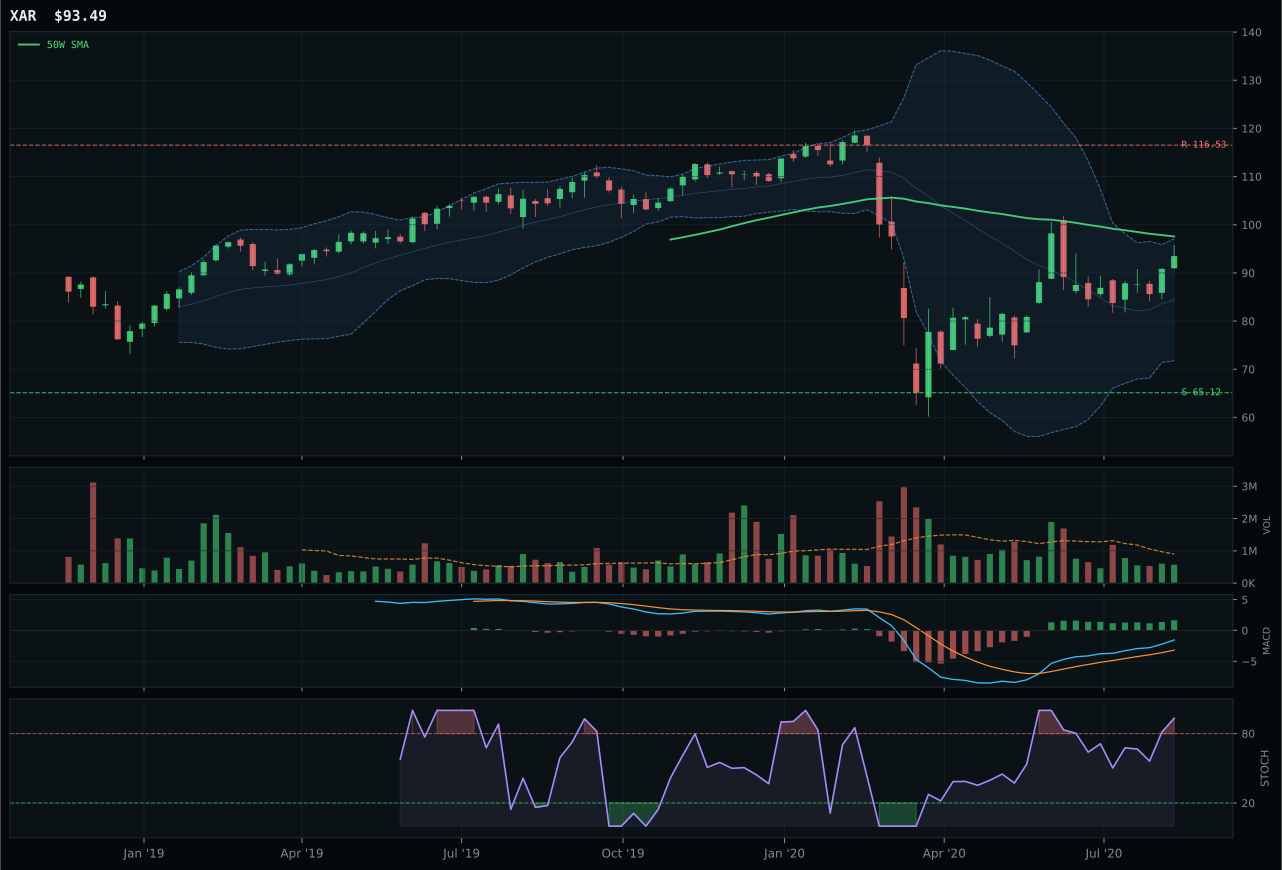
XAR has a neutral structure profile with 7.0% 13-week relative strength versus SPY.
A failed hold above support would weaken the setup.
Actionable but governed by invalidation levels.
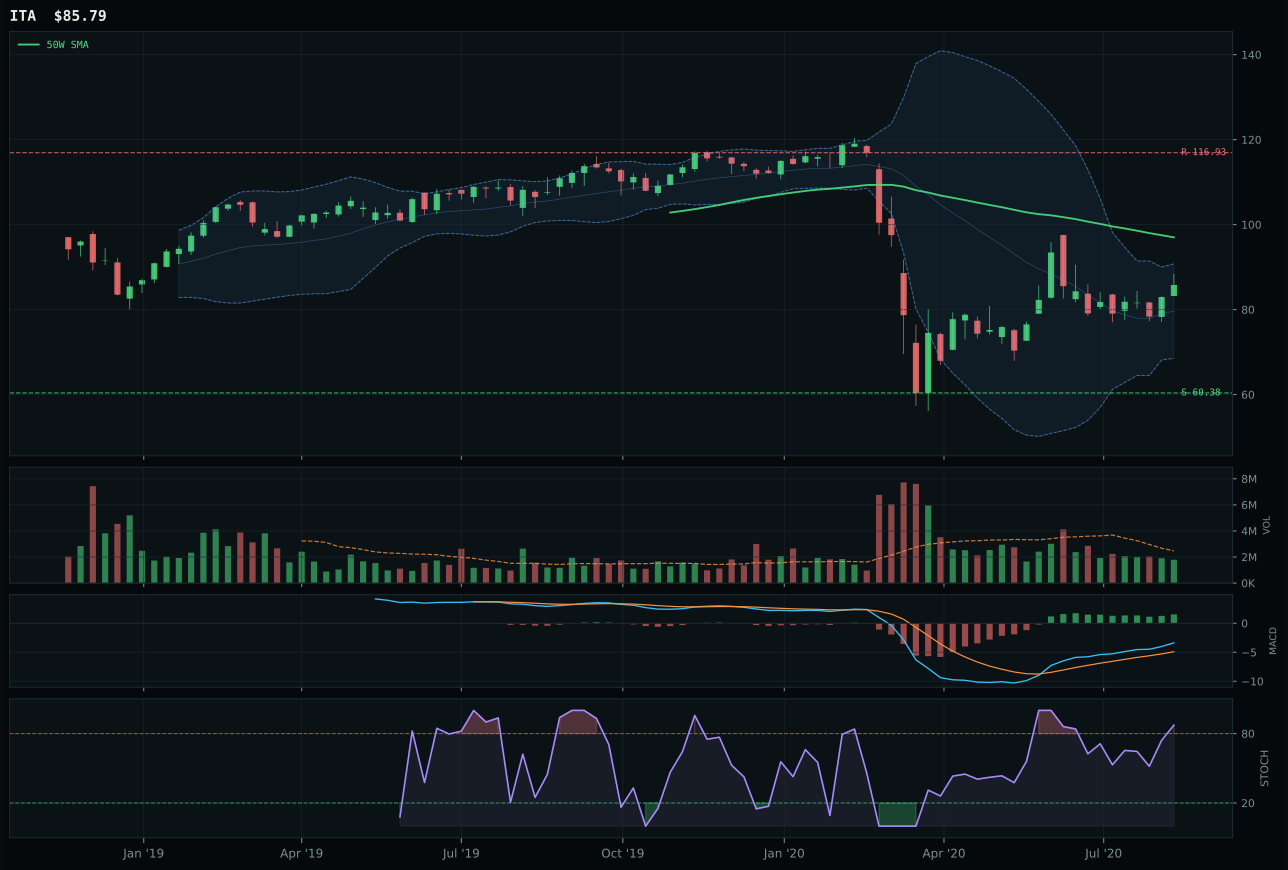
ITA has a neutral structure profile with 4.3% 13-week relative strength versus SPY.
A failed hold above support would weaken the setup.
Actionable but governed by invalidation levels.
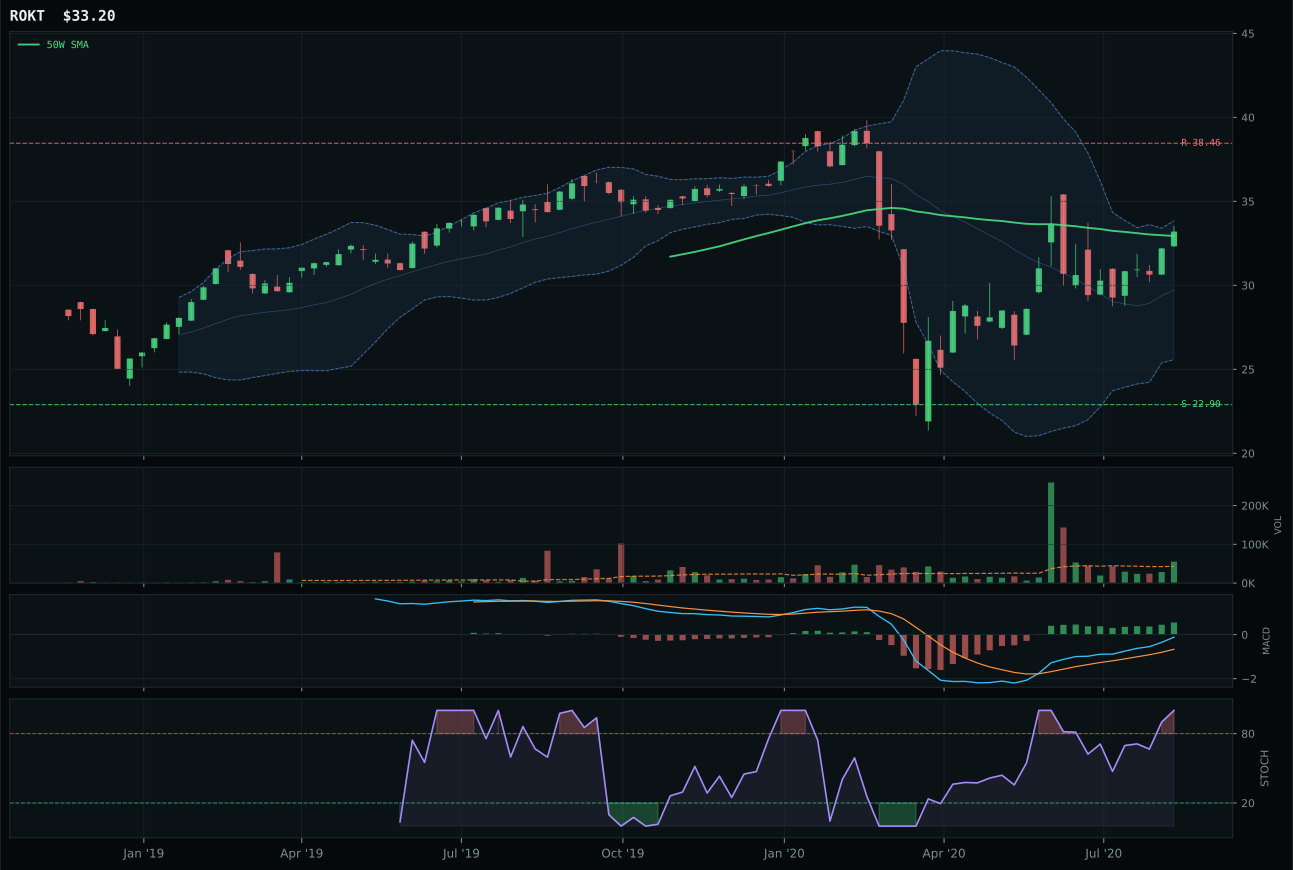
ROKT has a compression near 50W profile with 8.0% 13-week relative strength versus SPY.
A failed hold above support would weaken the setup.
Tracked, but not top-2 eligible because: .
XAR took the category not by upside momentum but by timing precision: a 97.0 timing score that reflects sitting -4.2% below the 50W in the middle Fibonacci retracement zone, where MACD is improving and the stochastic RSI remains overbought but not yet rolled over. This is the exact setup where a pullback has found its floor and the next bounce has the highest probability. The 24.7% thirteen-week return proves strength is real, but the -4.2% distance from the 50W means XAR already paid the price for greed—it's reset rather than extended, a massive tactical advantage over ITA. ITA's 55.0 timing score reflects being further from support and less cleanly positioned; its 4.3% RS versus SPY is decent but lagged XAR's 7.0%, and the 20.8-point score gap is driven entirely by timing and structure discipline. Volume remains thin across the board (0.63x for XAR), but that's a category characteristic here, not a XAR problem.
Defense & Aerospace received 5% as a tier-2 holding despite the category's 48.4 score placing it fifth in the portfolio ranking. The macro regime supports defense positioning—Late-Cycle Reflation, transition/mixed geopolitical factors, and active energy scarcity created a +6 bps macro fit benefit—yet the category could not overcome its structural weak spot: XAR's trend score of only 75.0 (price below the 50W) and a risk/reward of 38.2 that offers minimal upside buffer. The allocation acknowledges that XAR's timing setup at 97.0 is legitimate and that if support holds, the category has repricing room, but the absence of a clear momentum confirmation—category-relative strength is flat at 0.0%—and thin participation keep this as a value-hedge rather than a growth allocation. To earn top-2 consideration, this category would need either a break above the 50W with volume acceleration or a sustained breakdown below support that creates a washout entry point; currently it sits in no-man's-land, where momentum is nascent and mean reversion incomplete.
Precious Metals — SLV
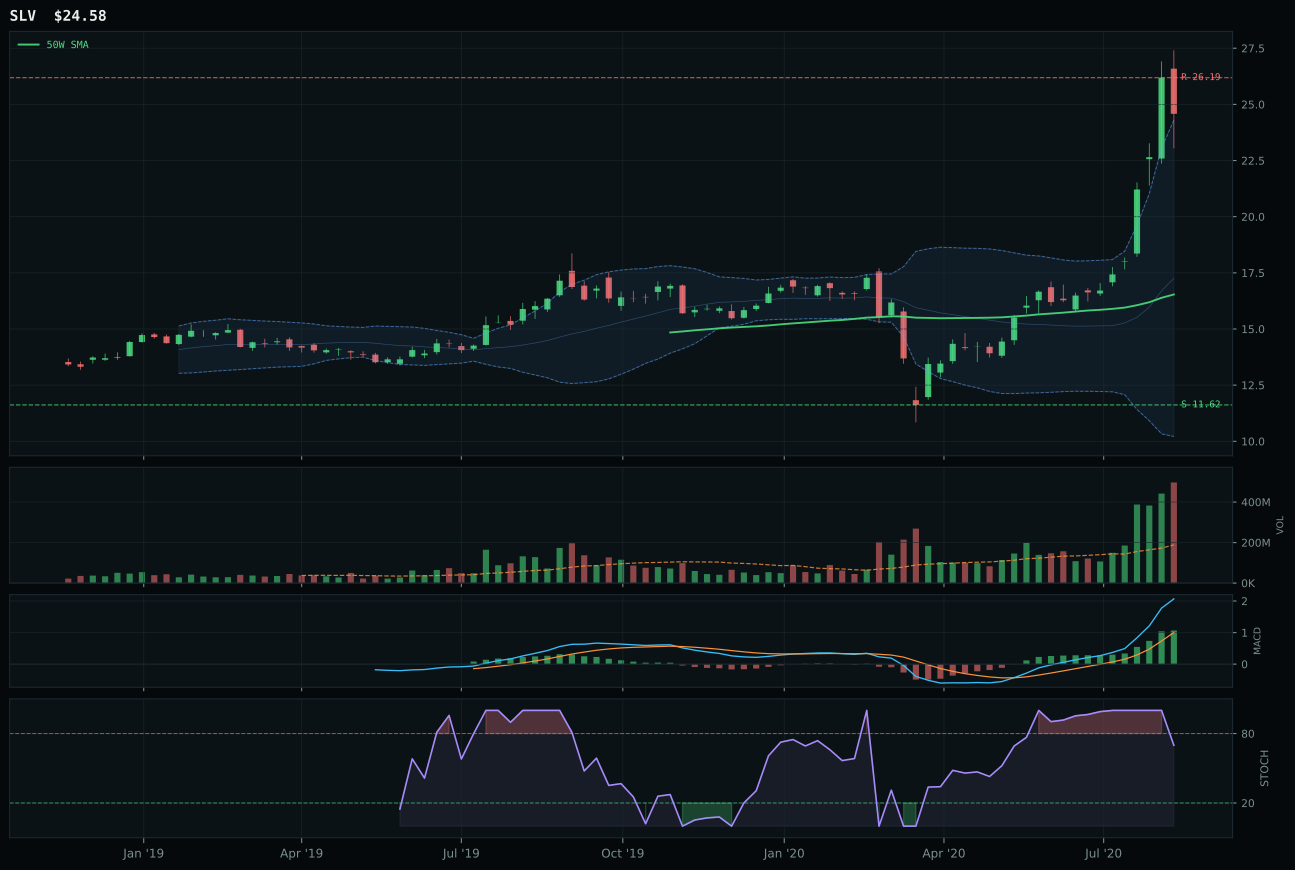
SLV has a vertical extension profile with 40.8% 13-week relative strength versus SPY.
A failed hold above support would weaken the setup.
Actionable but governed by invalidation levels.
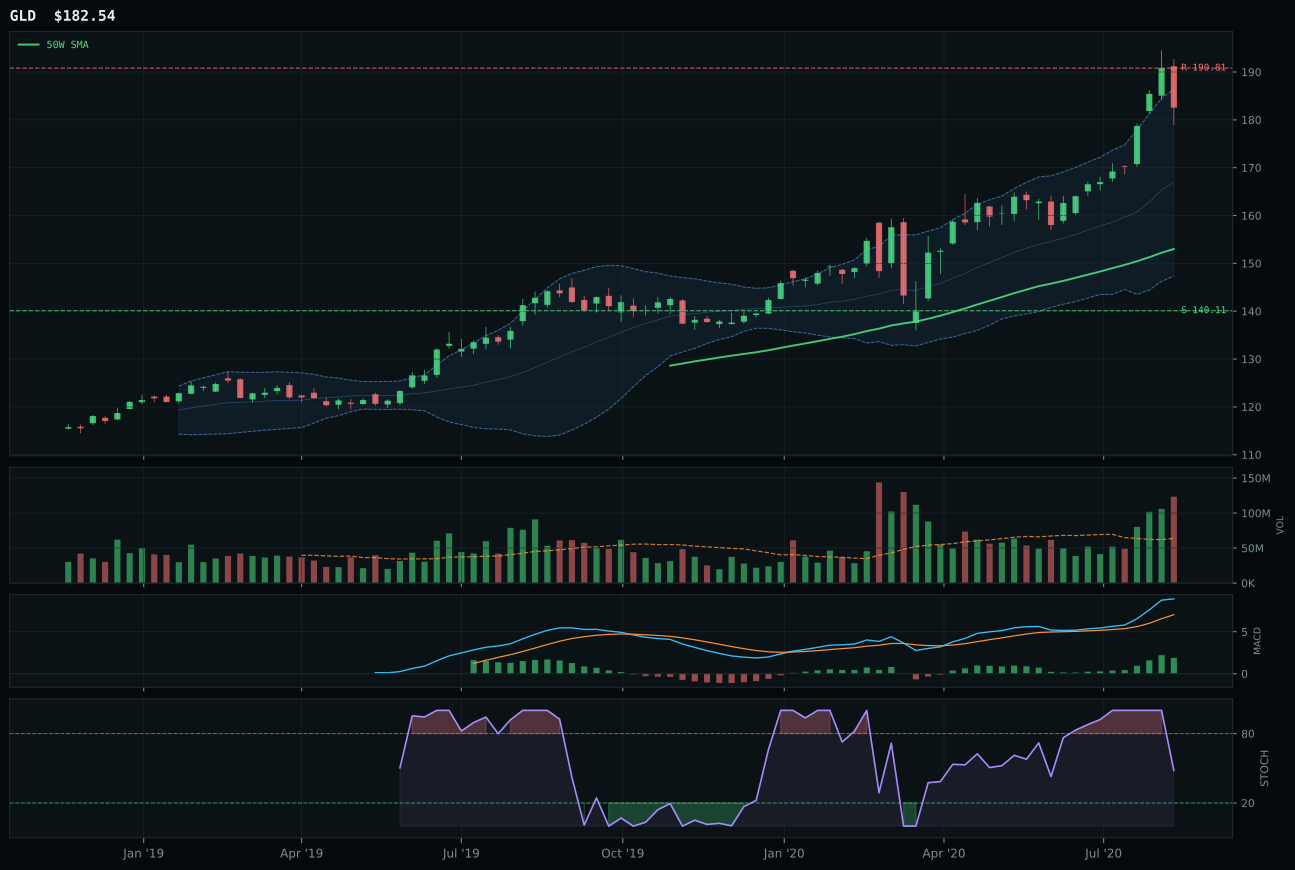
GLD has a vertical extension profile with -6.3% 13-week relative strength versus SPY.
A failed hold above support would weaken the setup.
Actionable but governed by invalidation levels.
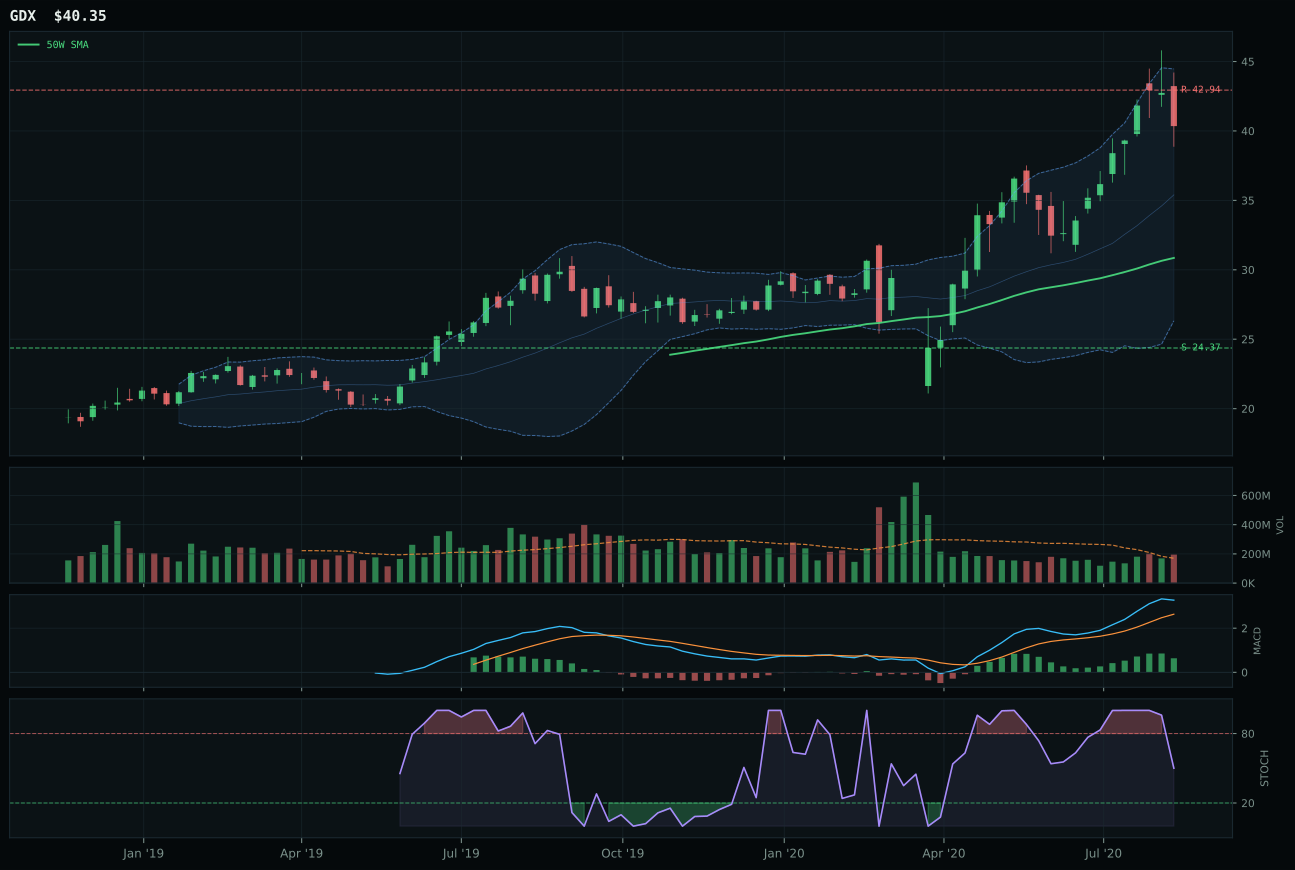
GDX has a vertical extension profile with -7.3% 13-week relative strength versus SPY.
A failed hold above support would weaken the setup.
Actionable but governed by invalidation levels.
SLV won the category decisively through category-relative strength that GLD and GDX couldn't approach: a 47.1% RS advantage over the category median versus GLD's flat 0.0%, which translates to SLV being the only metals exposure actually outperforming its peer set. The 58.5% thirteen-week return and 40.8% SPY outperformance are headline-grabbing, but the real story is volume: 2.63x average participation means institutional money is actively accumulating, not chasing price. The 85.4 volume-price confirmation and perfect 100.0 persistence score reflect a move that has been picked up by real buyers at every level, creating a rare condition where extension is backed by accumulation. GLD's -6.3% RS versus SPY and collapsing technical evidence (34.1/100) reveal gold is dead money—the reflation narrative is moving toward industrial and hybrid metals like silver, not defensive gold. The 48.6% extension above the 50W is uncomfortable entry-wise, but stochastic RSI's falling neutral state (0.70) signals the momentum hasn't rolled over yet.
Precious Metals earned 5% despite its 46.6 score placing it eighth in the category rankings, because the macro regime—inflation pressure active at +5 bps and metals scarcity at +7 bps—created a structural case for real-asset hedges in a reflation scenario. The allocation carries substantial risk: SLV is 48.6% above its 50W with risk/reward showing -6.1% upside to resistance and 111.5% downside to support, a 17-to-1 adverse ratio that reflects the extended nature of the move. However, the 85.4% volume-price confirmation and 100.0% persistence scores indicate that despite the extreme distance from the mean, volume and relative strength are confirming rather than rolling over, which provides more than token support for holding this position. The category's real vulnerability is not the chart (which is dangerous but confirmed) but the regime-dependent nature of its macro fit: if risk appetite remains active and liquidity stress does not worsen, the inflation-plus-scarcity thesis can persist. If either reverses, SLV's 48.6% extension becomes a liability with no support until much lower prices. The 5% weight is a modest inflation-hedge allocation that assumes the macro regime does not deteriorate; if it does, this category will be a first-cut reduction candidate despite its current technical sponsorship.
Agriculture & Livestock — MOO
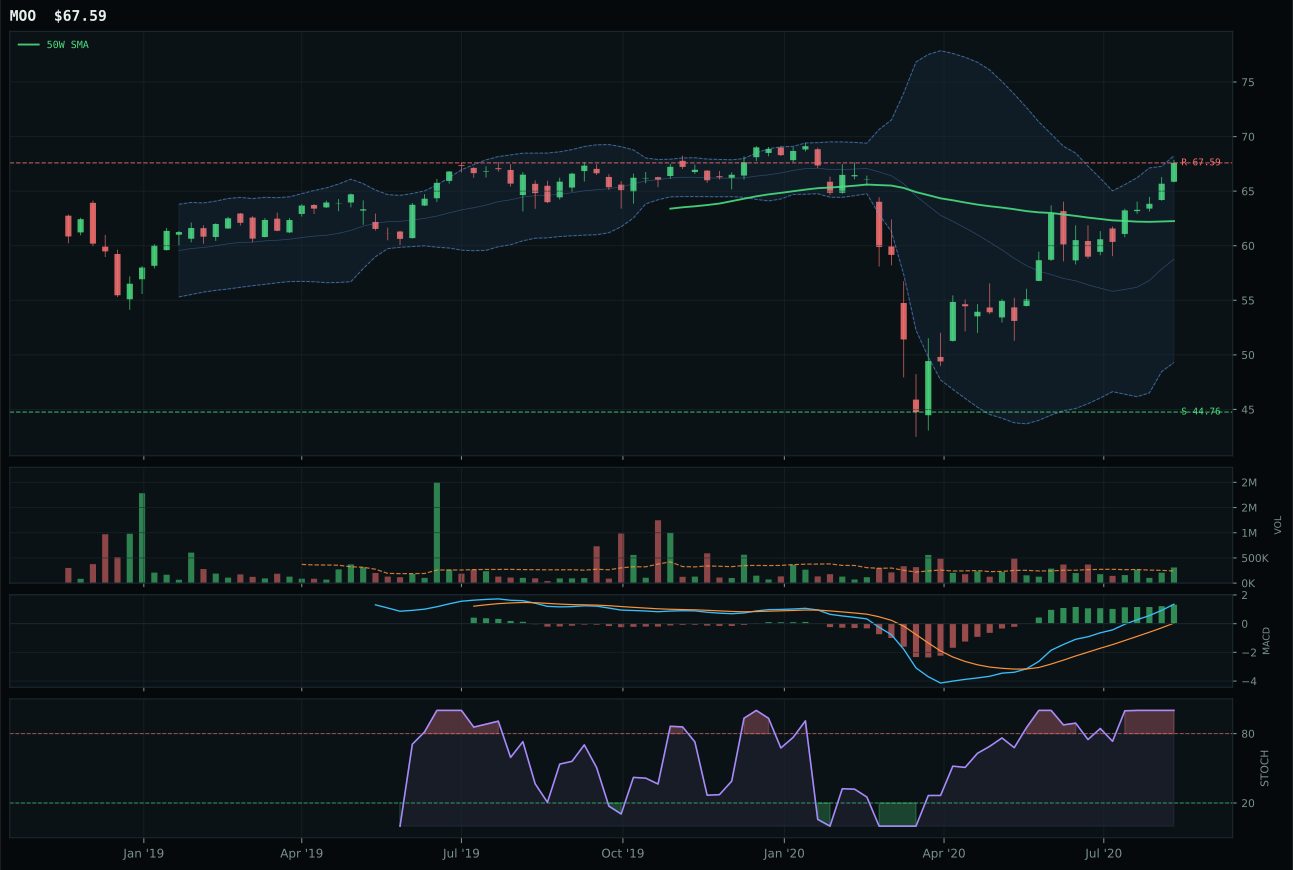
MOO has a neutral structure profile with 9.6% 13-week relative strength versus SPY.
A failed hold above support would weaken the setup.
Actionable but governed by invalidation levels.
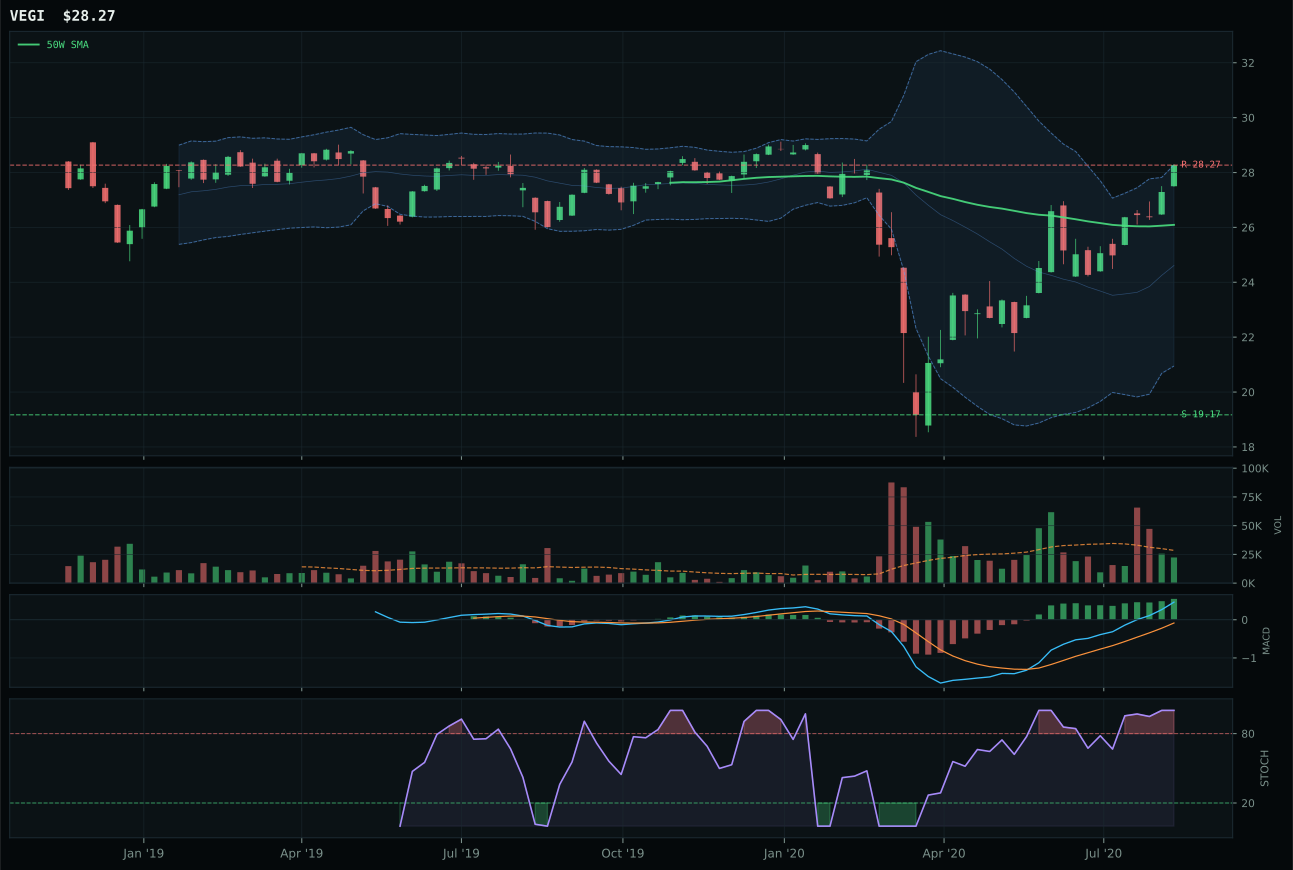
VEGI has a neutral structure profile with 10.0% 13-week relative strength versus SPY.
A failed hold above support would weaken the setup.
Tracked, but not top-2 eligible because: .
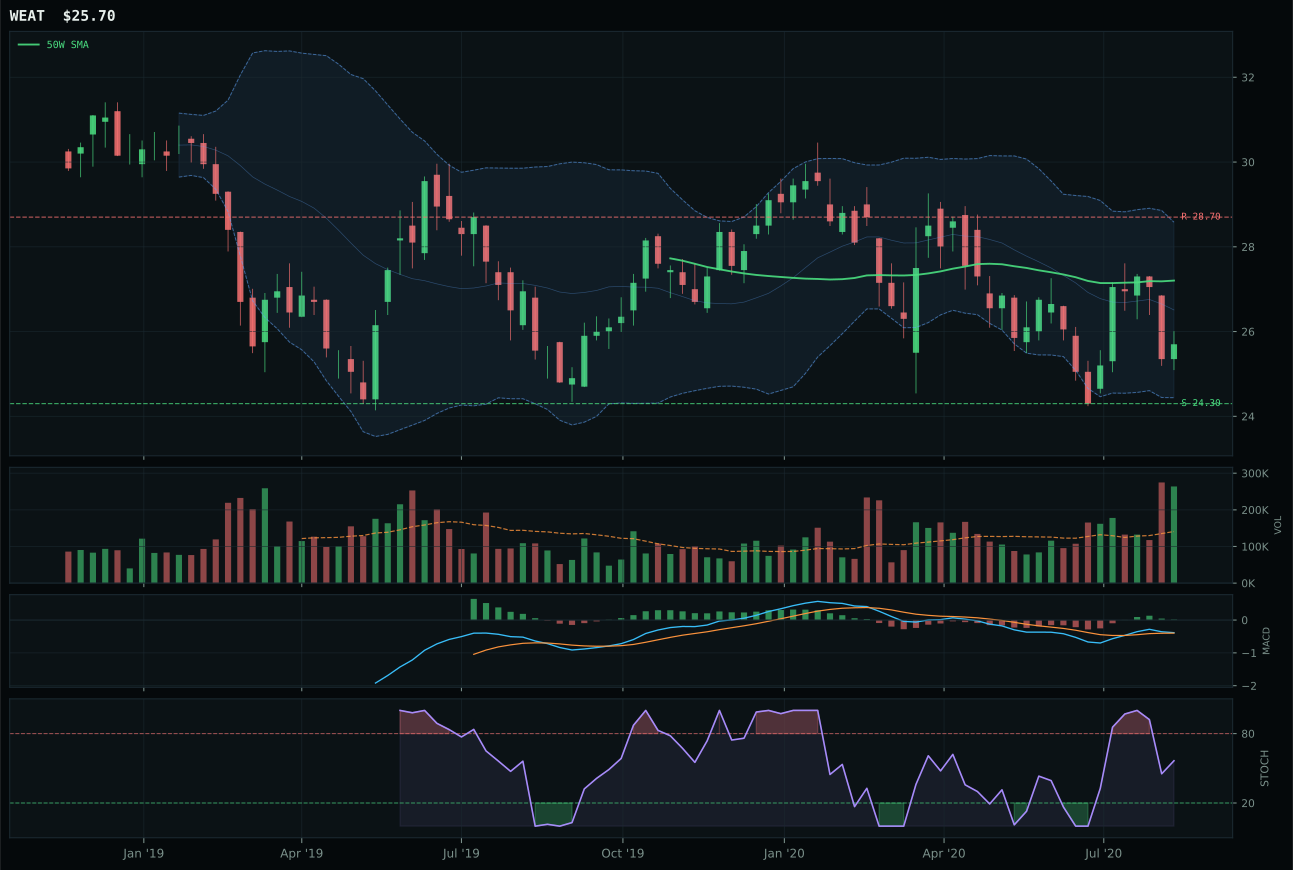
WEAT has a neutral structure profile with -18.2% 13-week relative strength versus SPY.
Extension and support failure are the main tactical risks.
Tracked, but not top-2 eligible because: structurally broken.
MOO dominated its category with a 91.0 technical score and 87.2 reasoned ranking that reflected every dimension of quality: trend 100, structure 81.2, volume-price confirmation 84.5, and persistence 78.8. The 27.3% thirteen-week return coupled with 9.6% SPY-relative strength and above-average volume participation (1.29x) created a rare setup where the move is both strong and legitimately accumulated. VEGI looks similar on headline returns (27.6% thirteen-week), but its neutral volume participation and 73.3 structure score reveal it's moving on price action alone, not institutional buying. The 21.4-point score gap is driven by MOO's superior volume confirmation (84.5 vs 82 for VEGI) and cleaner structure (81.2 vs 73.3)—mechanics that matter more than headline momentum in a market where participation is thinning everywhere else. MOO's risk-reward of 39.8/100 is weak on the upside, but the 51.0% downside cushion to support means there's room to be wrong.
Agriculture & Livestock claimed 5% despite its 45.1 final score ranking it seventh overall, significantly lower than Industrial Metals (68.4) and AI (54.6), because the category's macro fit at 85.0/100 was the highest in the portfolio this week. The 5% allocation overlay regime meant this 5% slot was halved from its normal 10% tier, but even at that reduced size, the macro case for real-asset inflation plays during Late-Cycle Reflation with active supply shortage and inflation pressure created a structural allocation rationale independent of MOO's technical setup alone. The category's challenge is that MOO is extended at 8.6% above the 50W and already at near-52W highs, meaning further upside requires momentum to sustain despite overbought conditions; if stochastic RSI rolls over or volume drops below the current 1.29x multiple, the setup deteriorates quickly. The allocation is thesis-driven (reflation + supply shock) rather than setup-driven (extended chart with timing risk), which places it in a different mental model than the top-2 categories. To push Agriculture & Livestock into higher-tier weight, MOO would need to reset toward the 50W with preserved relative strength, or the macro regime would need to shift away from the current supply-shock narrative.
Traditional Energy — FCG
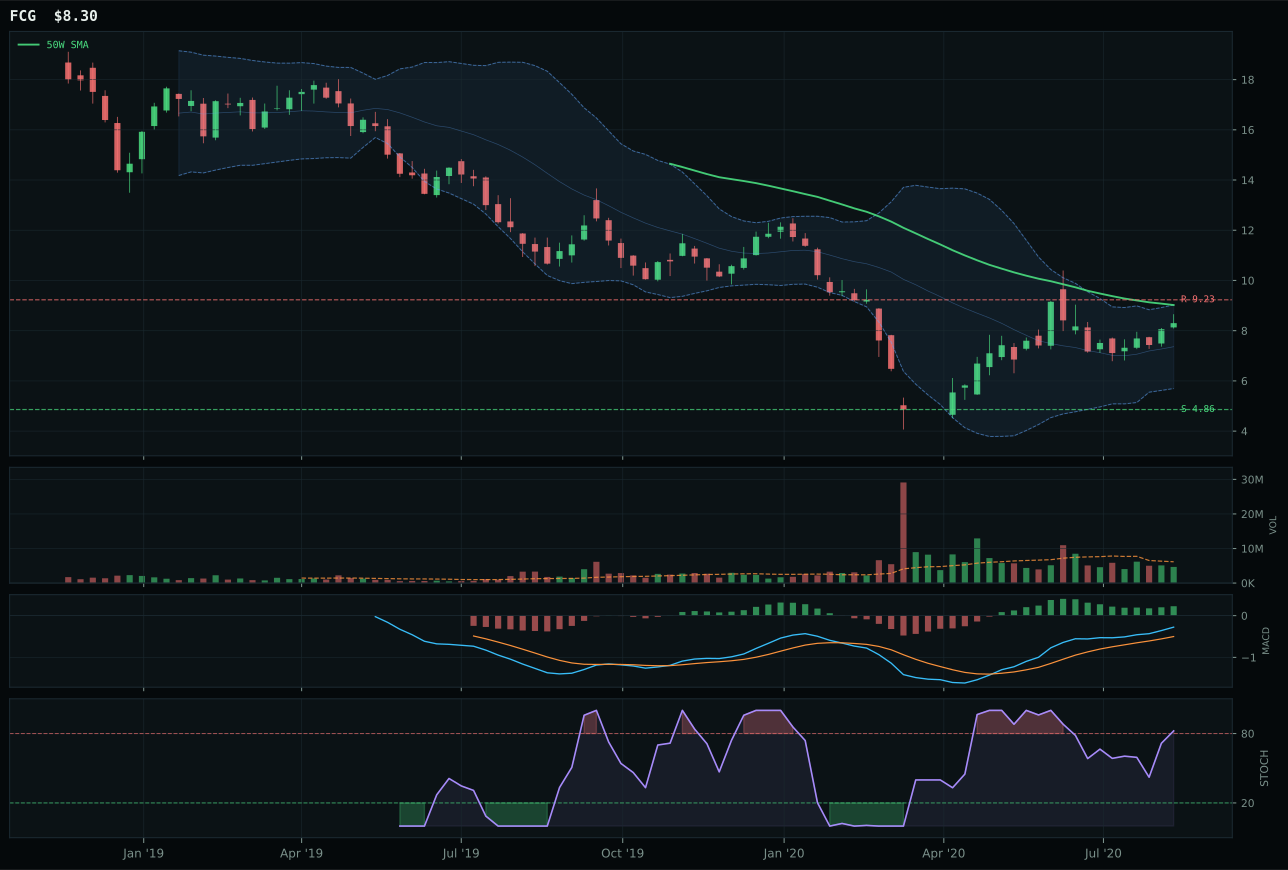
FCG has a neutral structure profile with 3.5% 13-week relative strength versus SPY.
Extension and support failure are the main tactical risks.
Tracked, but not top-2 eligible because: structurally broken.
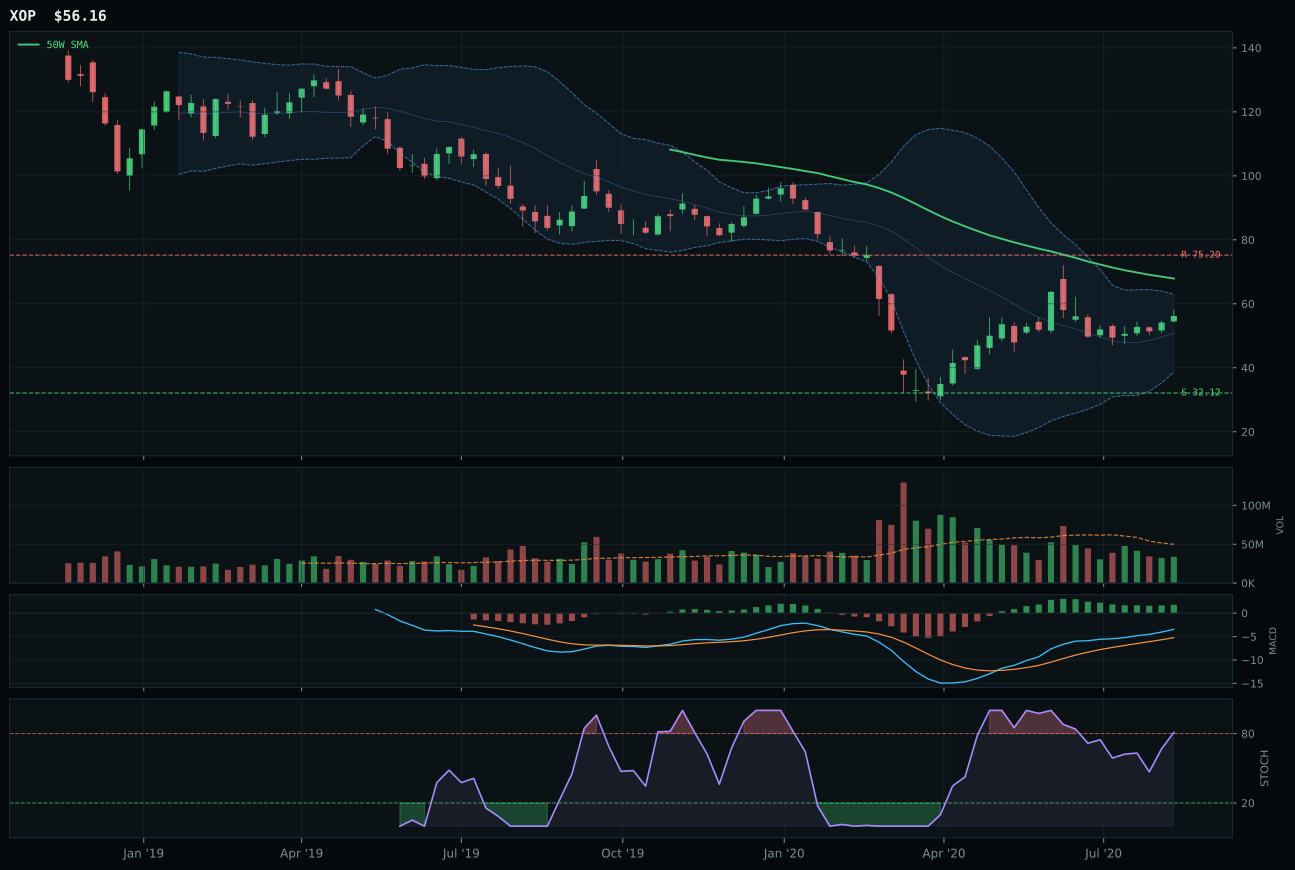
XOP has a neutral structure profile with -0.5% 13-week relative strength versus SPY.
Extension and support failure are the main tactical risks.
Tracked, but not top-2 eligible because: structurally broken.
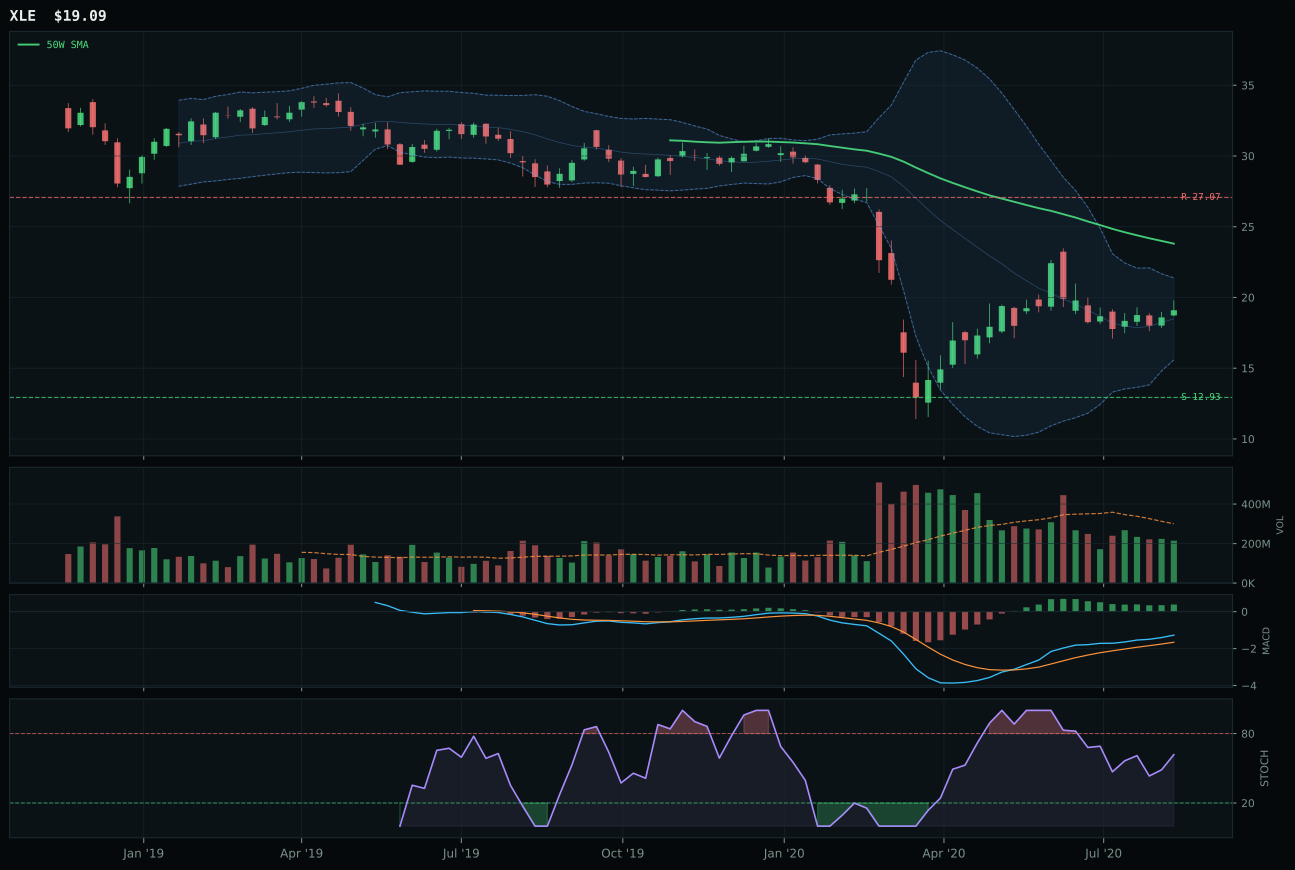
XLE has a neutral structure profile with -11.5% 13-week relative strength versus SPY.
Extension and support failure are the main tactical risks.
Tracked, but not top-2 eligible because: structurally broken.
FCG won the category through timing advantage, posting an 83.0 timing score that reflects sitting -6.6% below the 50W in the middle Fibonacci retracement zone with MACD improving and stochastic RSI in rising mid-zone—the exact setup for a low-risk entry into a category with macro tailwinds. The 21.2% thirteen-week return proves strength is real despite the below-50W price position, and the 4.0% category-relative strength gives FCG credibility within its peers. XOP's 55.0 timing score reflects greater extension (price higher from support) and overbought momentum (stochastic at 1.00), making it a riskier entry despite a headline 17.1% thirteen-week return. Volume remains thin across the board—FCG at 0.76x is neutral but tells the story of energy's structural participation problem. The category-relative advantage for FCG (4.0% vs 0.0% for XOP) is small but decisive in breaking a tie where timing is the only real differentiator between two mediocre technical setups.
Traditional Energy earned only 5% despite the macro regime strongly favoring it—Late-Cycle Reflation (+12 bps), energy scarcity (+16 bps), inflation pressure (+10 bps), and supply shortage (+9 bps) created a 65.0 macro fit, the highest category fit score outside of Agriculture—because the representative ETF (FCG) failed structural eligibility. FCG's poor risk/reward (31.6/100), weak trend (50.3/100 for price below both moving averages), and structurally broken setup (eligible: False) disqualified the category from higher consideration despite its powerful macro narrative. The allocation honors the regime's energy scarcity thesis and FCG's 83.0 timing score, acknowledging that a pullback setup near the 50W with improving MACD presents a lower-risk entry for tactical inflation positioning. However, this is explicitly a top-of-the-cycle trade with deteriorating risk-adjusted returns: FCG's upside to resistance is -10.1% while downside to support stretches to 109.6%, a 10-to-1 ratio that inverts all traditional allocation discipline. To earn higher weight, Traditional Energy would require either a substantial reset of price toward support levels (creating a less extended entry) or a significant macro acceleration that forced energy prices higher despite poor technical structure—neither is currently in place. This allocation is macro-driven conviction overlaid on technically broken positioning, a classic late-cycle energy trade.
Nuclear Energy — NLR
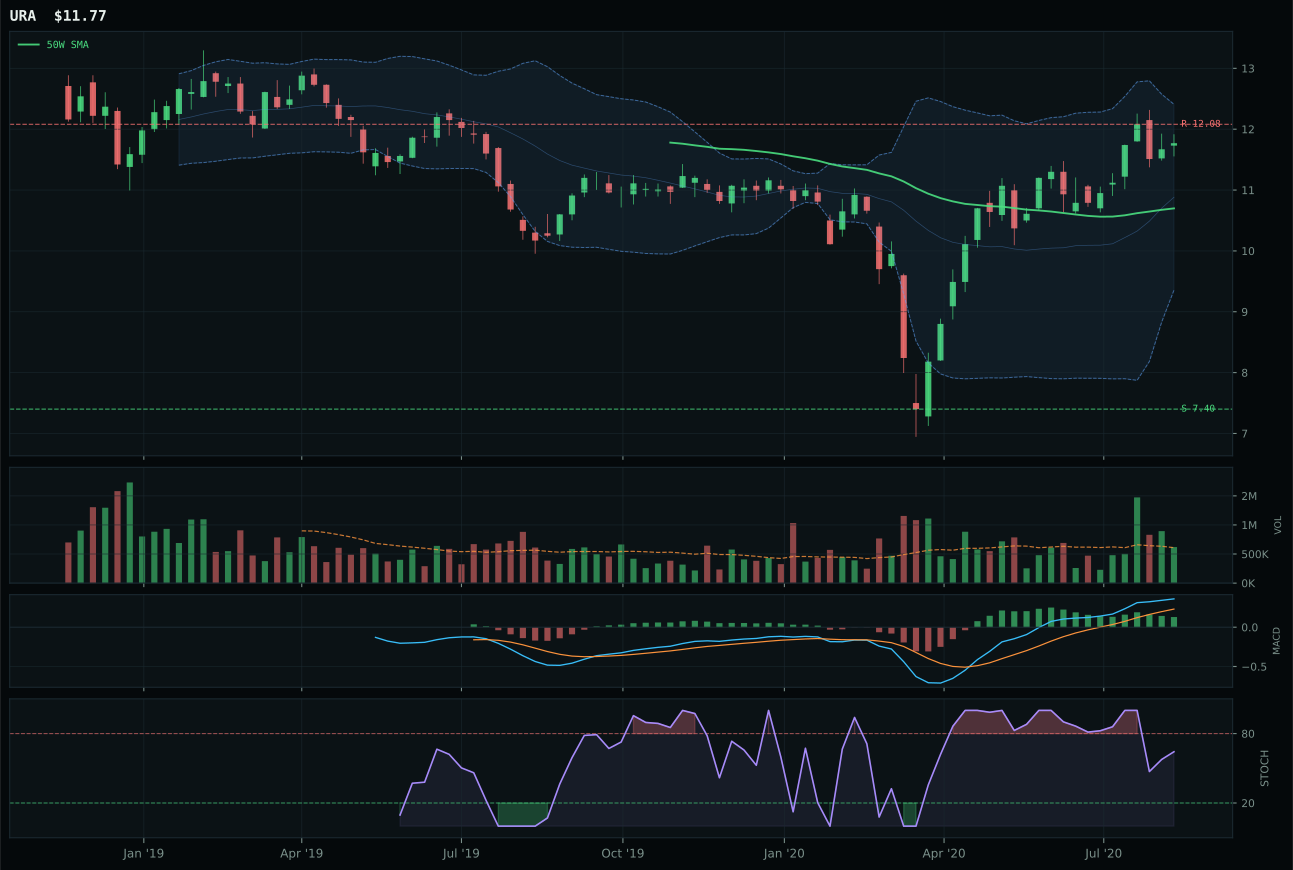
URA has a neutral structure profile with -4.2% 13-week relative strength versus SPY.
A failed hold above support would weaken the setup.
Tracked, but not top-2 eligible because: .
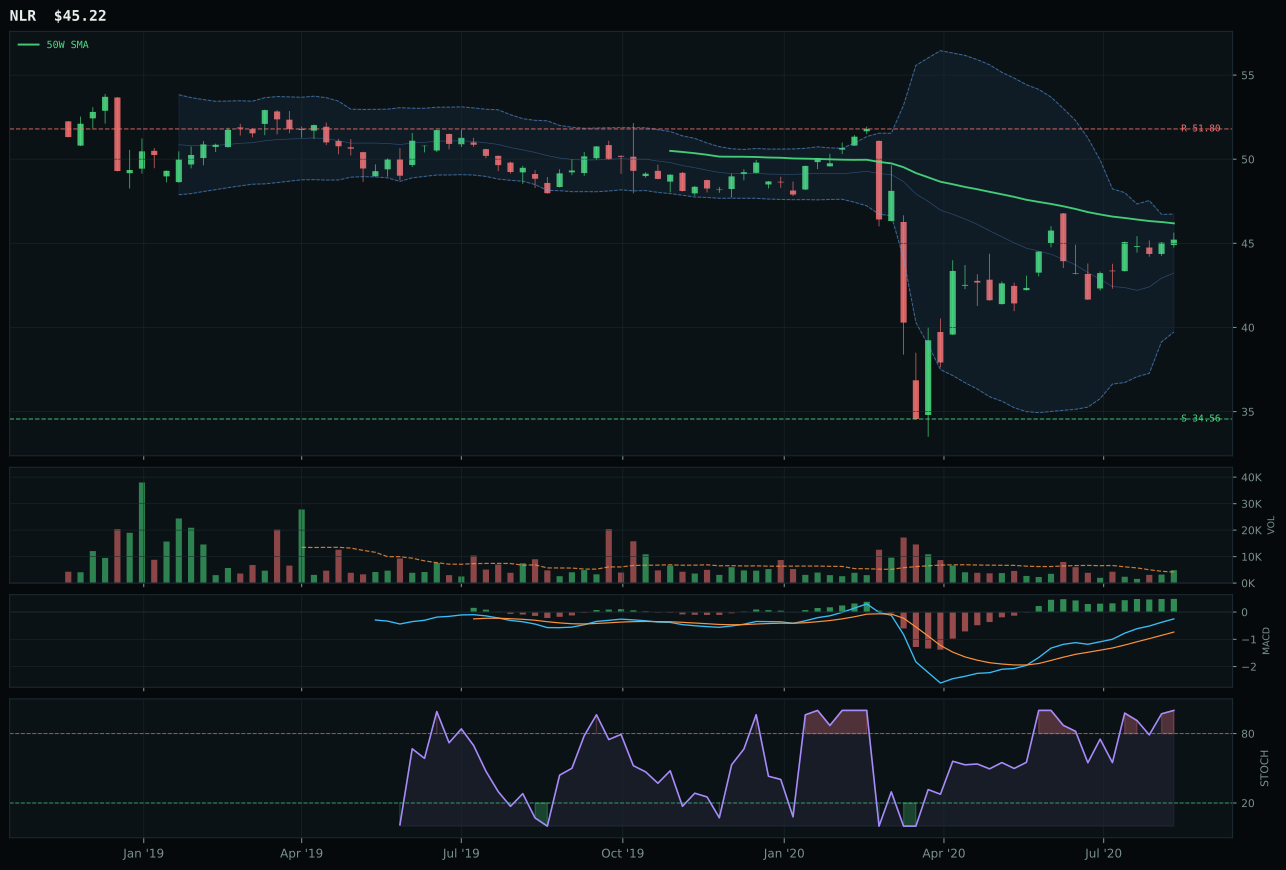
NLR has a compression near 50W profile with -8.5% 13-week relative strength versus SPY.
Extension and support failure are the main tactical risks.
Tracked, but not top-2 eligible because: structurally broken.
NLR won the category through an uncommon path: perfect timing (100.0 score) at -2.1% below the 50W in the upper Fibonacci retracement zone with MACD improving, stochastic RSI overbought, and compression setup that signals potential breakout if support holds. The 9.1% thirteen-week return is weak, and the -8.5% RS versus SPY is a major headwind, yet the category-relative strength of -2.2% still allows NLR to lead URA's 2.2%. The real win is structural: NLR's 47.3 structure score reflects genuine compression (82.4 compression metric) rather than extension or breakdown, a pattern that offers expansion potential without requiring the current price level to hold perfectly. URA's technical evidence (45.0) lagged despite a neutral structure, and its 70.0 timing score (versus 100.0 for NLR) reflects being 10.0% extended from the 50W rather than sitting at the decision line. Above-average volume participation (1.18x) for NLR adds credibility to the setup despite the weak thirteen-week momentum.
Nuclear Energy received 0% allocation this week, ranked among the lowest categories (9th or 10th), because despite the macro regime supporting energy exposure generally (Late-Cycle Reflation, energy scarcity +9 bps, real-asset sponsorship +7 bps), the representative NLR failed structural eligibility due to its severely compromised trend and relative strength. The category-level macro fit stood at 69.0/100, competitive with many allocated categories, but NLR's 32.2 trend score and -8.5% RS versus SPY placed it outside the acceptable bounds for even a 5% sleeve when other categories offered superior risk/reward with macro support. The 57.1 momentum confirmation and 100.0 timing score created a superficial appeal as a mean-reversion trade, but NLR's low persistence (51.9/100) and weak volume-price confirmation (41.5/100) signaled that even if the 50W compression triggered a bounce, the follow-through would likely deteriorate. To earn a 5% allocation, Nuclear Energy would need either URA to overtake NLR in the proof order (currently URA 45.0, NLR 42.0), which requires trend recovery and relative strength improvement, or NLR to establish a 200W cross with velocity and volume confirmation—neither condition is met. This category was excluded entirely rather than allocated defensively, a signal that the macro support for energy is insufficient to compensate for deteriorating technical structure in this specific sub-sector.
Utilities & Infrastructure — PAVE
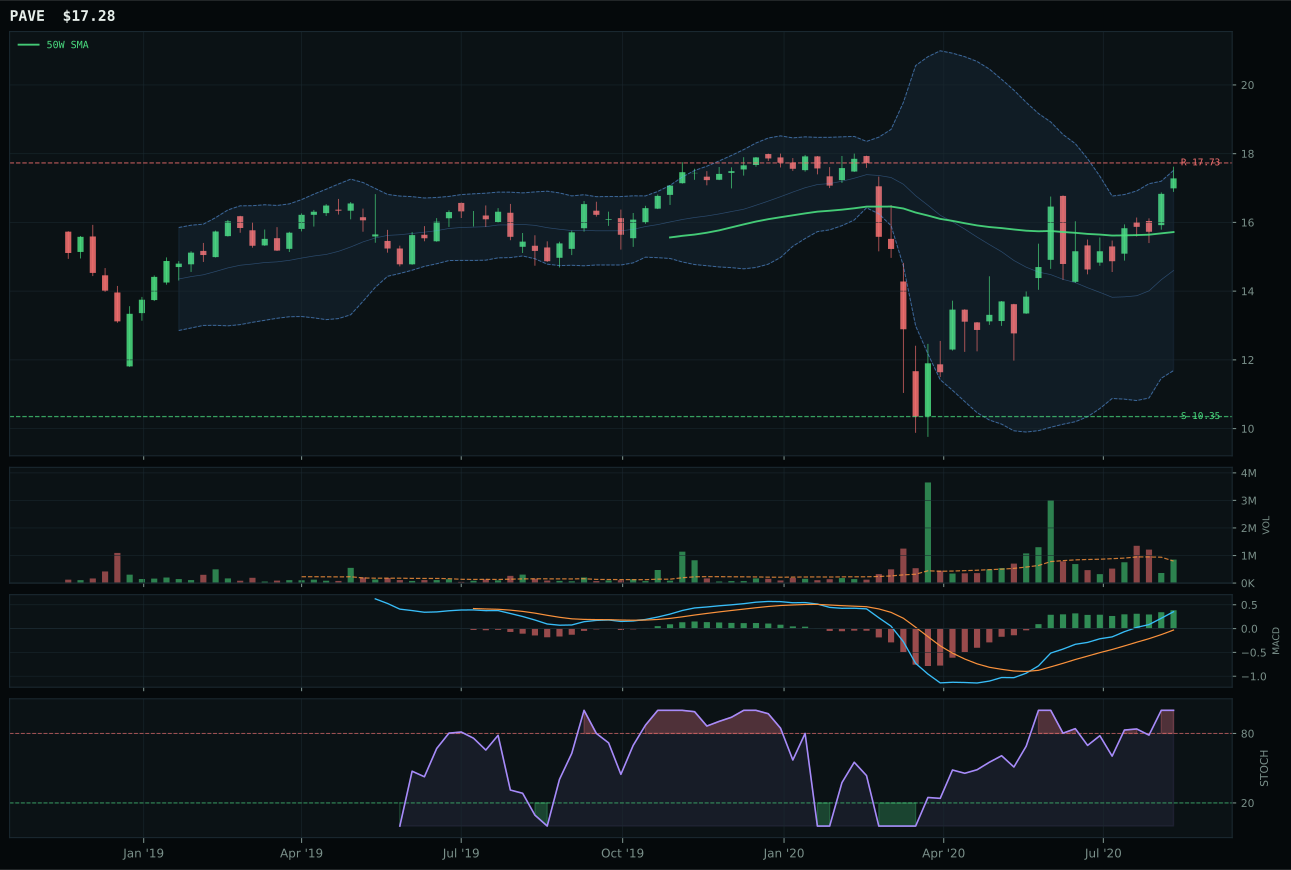
PAVE has a neutral structure profile with 17.7% 13-week relative strength versus SPY.
A failed hold above support would weaken the setup.
Actionable but governed by invalidation levels.
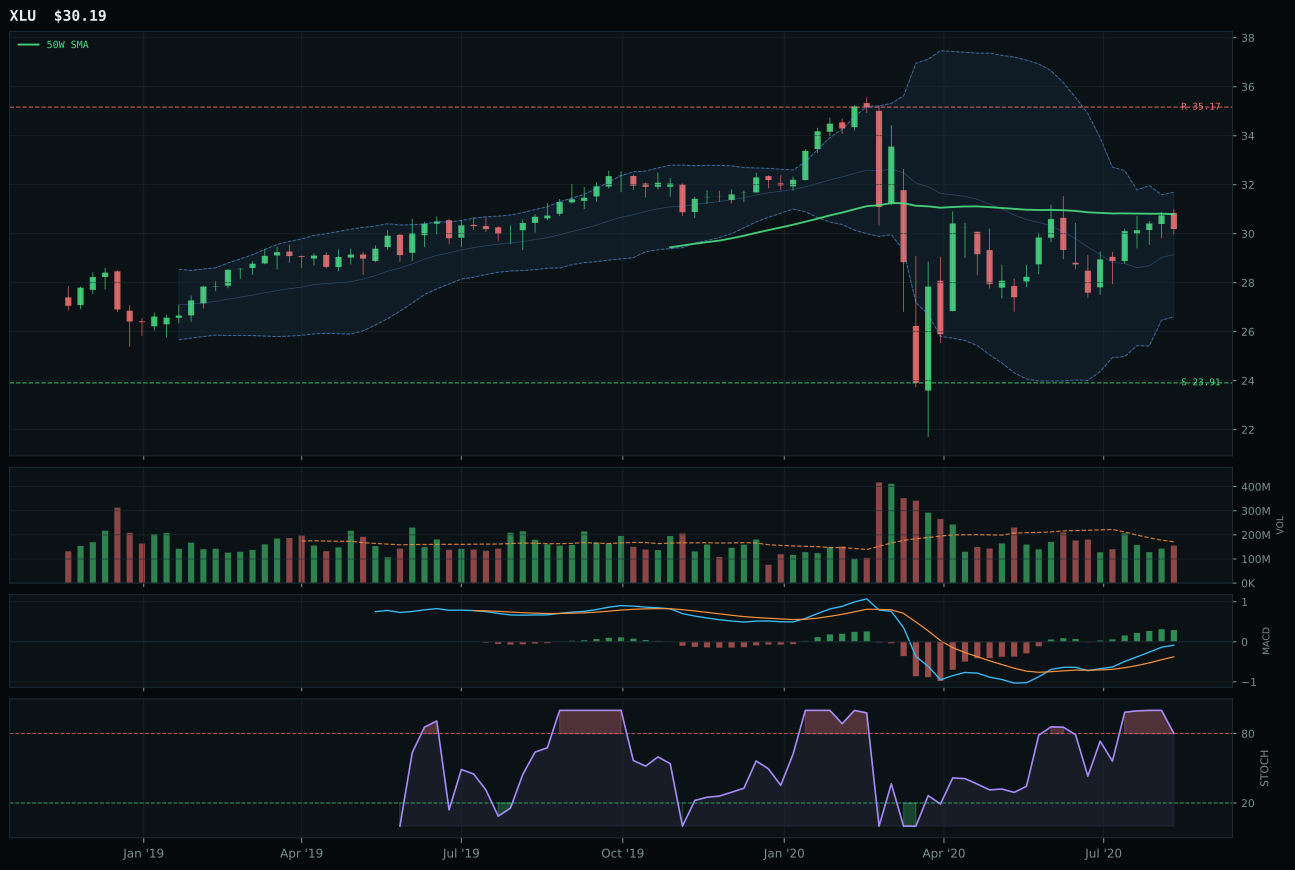
XLU has a compression near 50W profile with -7.5% 13-week relative strength versus SPY.
A failed hold above support would weaken the setup.
Actionable but governed by invalidation levels.
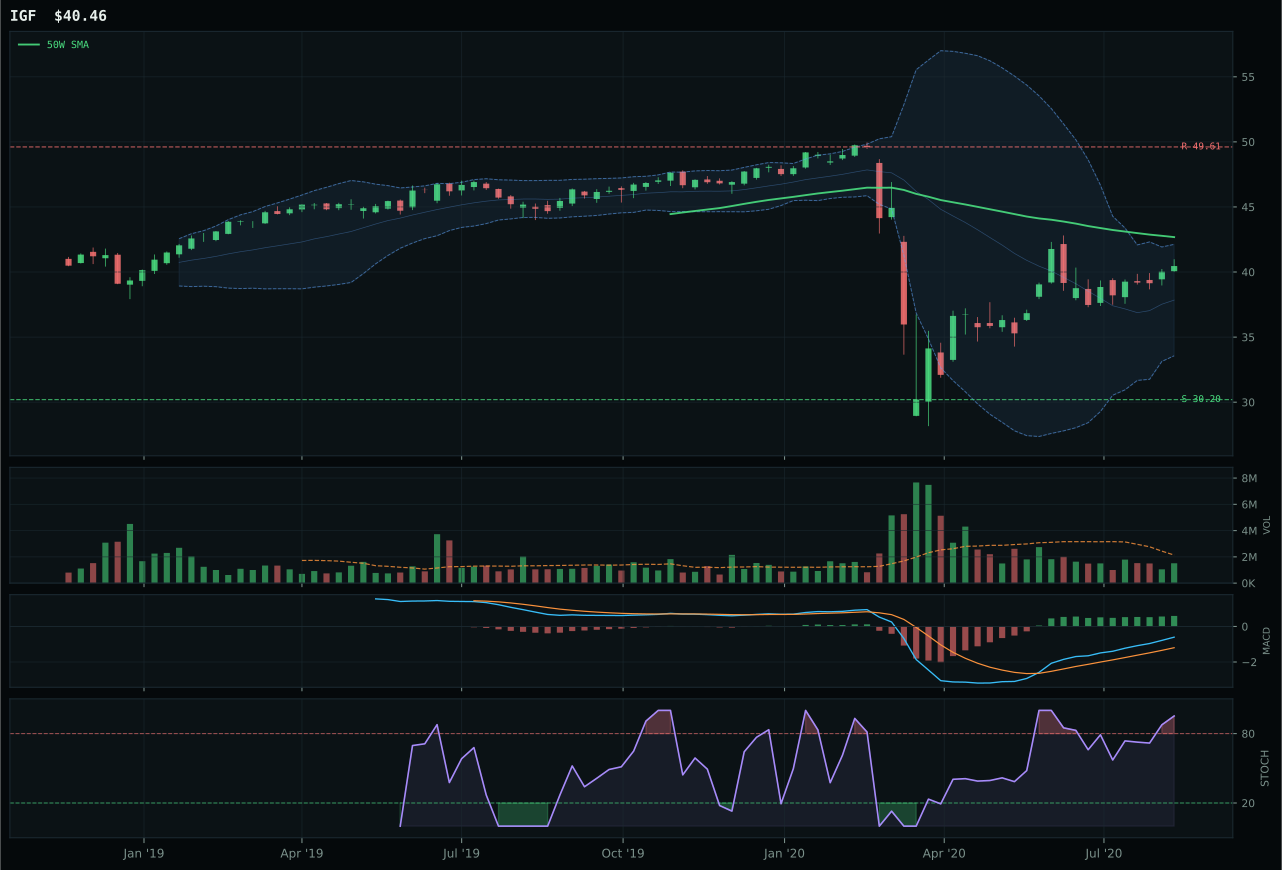
IGF has a neutral structure profile with -3.0% 13-week relative strength versus SPY.
Extension and support failure are the main tactical risks.
Tracked, but not top-2 eligible because: structurally broken.
PAVE dominated the category through superior category-relative strength (20.7% versus XLU's negative 4.5%) combined with a rare late-cycle setup: price above the 50W but below the 200W, sitting at the Fibonacci 0.236 near the 52-week high with MACD improving and stochastic overbought but not yet rolled over. The 35.3% thirteen-week return and 17.7% SPY outperformance confirm PAVE is the growth play, not the utility defensive play that XLU represents. The 94.4 technical score reflects nearly perfect execution: 90.0 trend, 100.0 momentum, 88.0 volume-price confirmation, and 93.5 persistence—metrics that show real institutional accumulation behind the move. XLU's compression setup and falling stochastic RSI (overbought rolling over) mark it as a mean-reversion candidate rather than a continuation play, while PAVE's still-improving setup offers more legs. The 72.9 structure score for PAVE reflects neutral structure that's clean and organized, a foundation that supports the current 35.3% thirteen-week momentum rather than penalizing it.
Utilities & Infrastructure received 0% allocation, excluded entirely from the portfolio, because PAVE's dominant technical score (94.4) could not overcome the category's weak macro fit (43.0/100) and failure to achieve top-2 ranking. The category scored 36.0 overall, ranking 9th or 10th, despite PAVE's superior chart evidence: inflation pressure is actively negative (-6 bps) in a regime where cap-intensive real assets should benefit from reflation narratives, while risk appetite support is marginal. PAVE's 35.3% thirteen-week return and 17.7% SPY-relative strength created real technical merit, but allocating 5% to a category with negative macro headwinds (inflation concerns hurt utility valuations, contrary to the reflation thesis) would have diluted capital from categories with aligned technical and macro signals. The category's exclusion was a portfolio-level trade-off: PAVE itself is technically sound, but the Utilities & Infrastructure category's thin macro fit relative to Infrastructure plus energy-scarcity narratives elsewhere in the portfolio made the opportunity cost of a 5% slot too high. To earn even a 5% sleeve, the category would need inflation pressure to reverse (currently -6 bps, a material drag for utility valuations), or PAVE would need to demonstrate volume participation deterioration that would lower its technical standing and thus make its relative strength less compelling relative to competing categories.