
2020-08-07
Informational purposes only. The content in this report, including allocations, analysis, and commentary, is provided solely for informational and educational purposes. It does not constitute financial advice, investment advice, trading advice, or any other type of advice. Past performance does not guarantee future results. Always conduct your own research and consult a qualified financial professional before making investment decisions.
Some tracked tickers were excluded due to missing live weekly price data: SGOV: Historical cache SGOV has only 10 usable weekly bars; URNM: Historical cache URNM has only 36 usable weekly bars
Weekly Allocation
| Ticker | Category | Weight | Role |
|---|---|---|---|
| FSOL | 50% | Overlay | |
| SLV | Precious Metals | 10% | Top-2 (10%) |
| SMH | AI | 10% | Top-2 (10%) |
| XLK | Technology | 5% | Tier-2 (5%) |
| INDA | Emerging Markets | 5% | Tier-2 (5%) |
| PAVE | Utilities & Infrastructure | 5% | Tier-2 (5%) |
| REMX | Industrial Metals | 5% | Tier-2 (5%) |
| XAR | Defense & Aerospace | 5% | Tier-2 (5%) |
| URA | Nuclear Energy | 5% | Tier-2 (5%) |
Trade Instructions — Monday Open
Sell the tranche from 2020-07-10 (completing its 4-week hold). Buy the new tranche. Instructions show net portfolio changes — same-asset positions cancel, weight changes show the delta.
| Action | Ticker | Instruction |
|---|---|---|
| SELL | SLV | Sell 17% of SLV position (reduce 15.00% → 12.50%) |
| SELL | SMH | Sell 29% of SMH position (reduce 8.75% → 6.25%) |
| SELL | IGV | Sell entire IGV position (2.50% of portfolio) |
| SELL | XLU | Sell 40% of XLU position (reduce 6.25% → 3.75%) |
| SELL | XAR | Sell 14% of XAR position (reduce 8.75% → 7.50%) |
| SELL | MOO | Sell 33% of MOO position (reduce 7.50% → 5.00%) |
| SELL | COPX | Sell 50% of COPX position (reduce 5.00% → 2.50%) |
| SELL | URA | Sell 20% of URA position (reduce 6.25% → 5.00%) |
| BUY | XLK | Buy XLK — 7.14% of freed cash (adds 1.25% to portfolio) |
| BUY | INDA | Buy INDA — 7.14% of freed cash (adds 1.25% to portfolio) |
| BUY | REMX | Buy REMX — 7.14% of freed cash (adds 1.25% to portfolio) |
| BUY | FSOL | Buy FSOL — 71.43% of freed cash (adds 12.50% to portfolio) |
| BUY | PAVE | Buy PAVE — 7.14% of freed cash (adds 1.25% to portfolio) |
Current Portfolio After Trade
Combined holdings across all 4 active tranches. Each tranche is 25% of the portfolio.
| Ticker | % of Portfolio | Weight Bar |
|---|---|---|
| SLV | 12.50% | |
| FBTC | 12.50% | |
| FSOL | 12.50% | |
| CIBR | 7.50% | |
| XAR | 7.50% | |
| SMH | 6.25% | |
| XLK | 6.25% | |
| MOO | 5.00% | |
| URA | 5.00% | |
| BOTZ | 5.00% | |
| REMX | 5.00% | |
| INDA | 3.75% | |
| XLE | 3.75% | |
| XLU | 3.75% | |
| COPX | 2.50% | |
| PAVE | 1.25% |
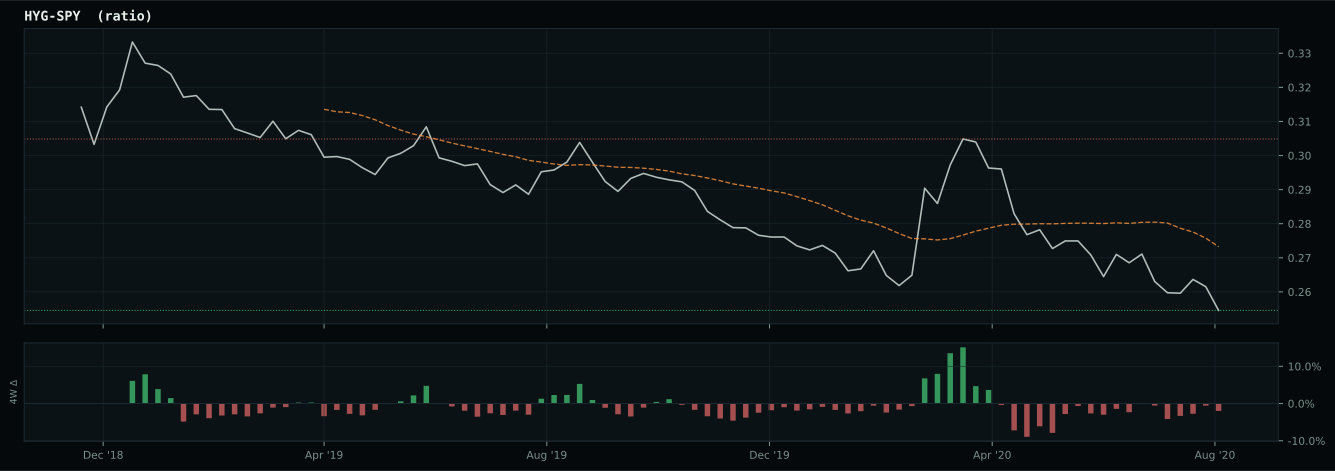
Macro Regime — Goldilocks
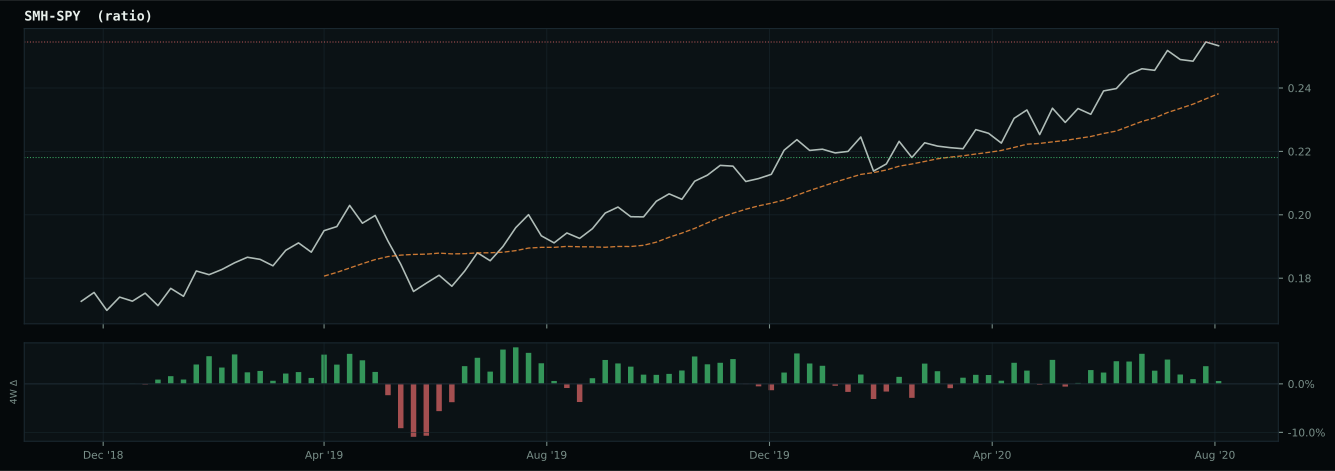
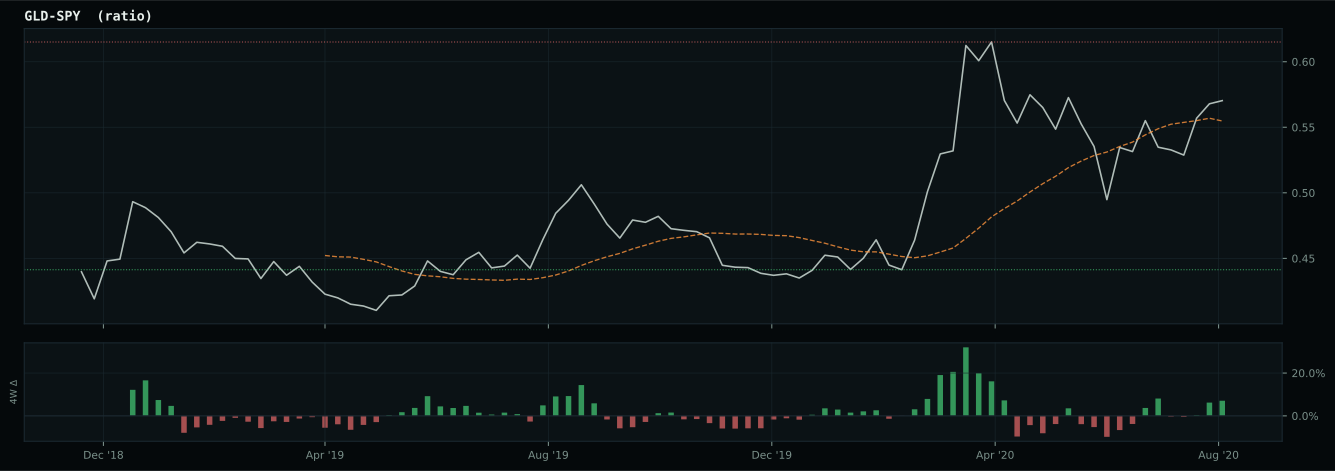
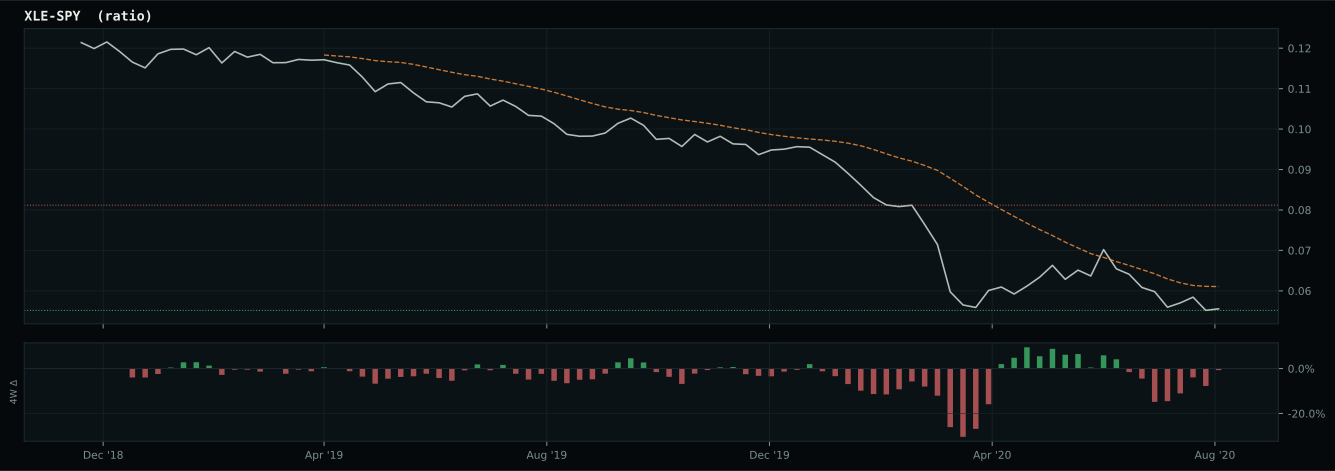
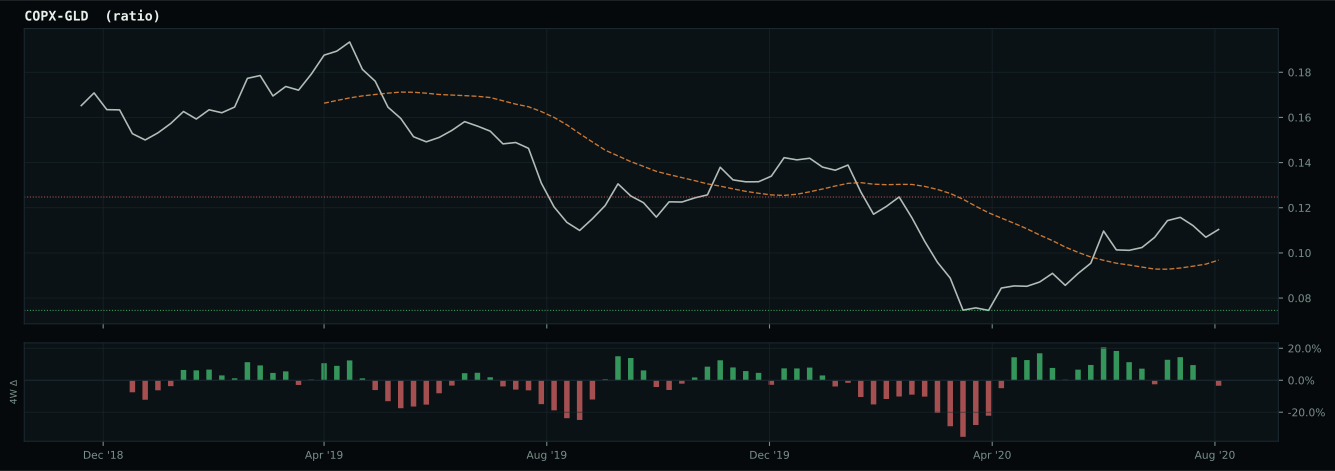
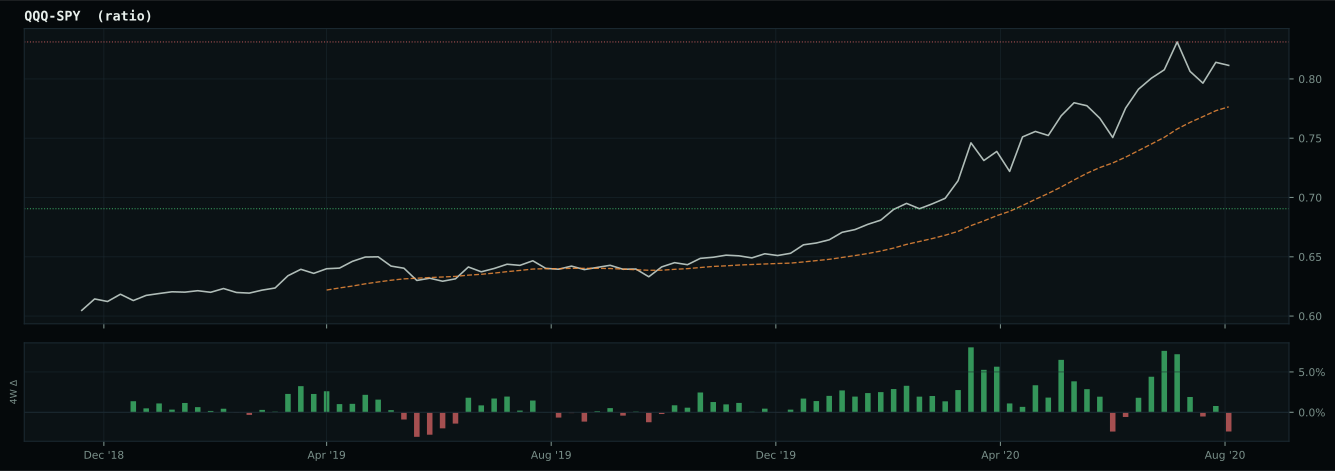
Macro Evidence Charts
Market-implied signals behind the macro regime scores. Each ratio compares two assets; the direction and slope of the ratio is what the macro engine reads.
Crypto Regime — AltSeason
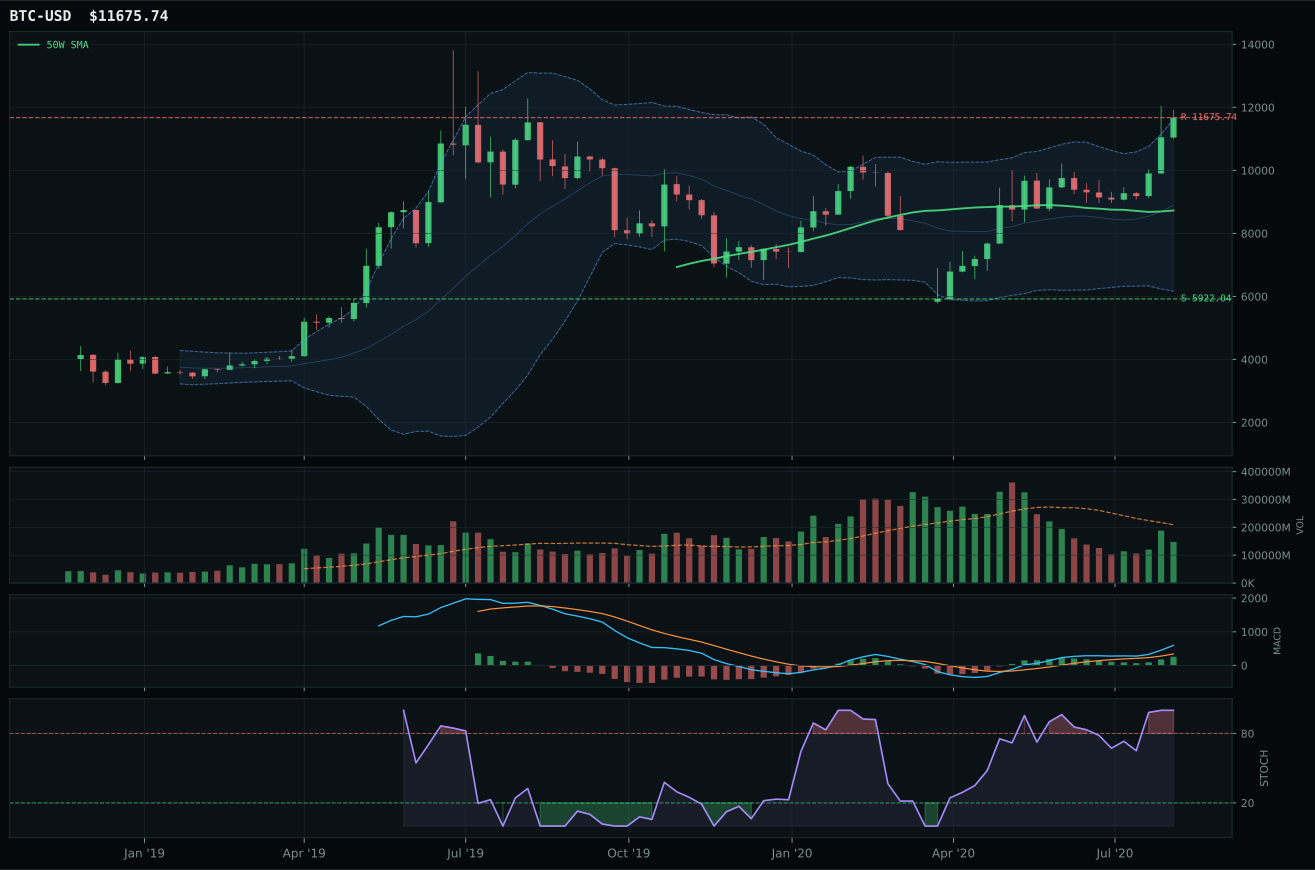
post-touch structure is too wide to count as a range; max/min close ratio is 2.05
TrendBTC confirmed: 2 consecutive closes above rising/flat 50W SMA
all available AltSeason conditions pass; missing optional confirmations skipped

Category Rankings
| Rank | Category | Winner | Score | Alloc | 4W Ret | Peers (4W) |
|---|---|---|---|---|---|---|
| 1 | Precious Metals | SLV | 76.0 | 20% | -8.09% | GLD -6.1% · GDX -8.2% |
| 2 | AI | SMH | 67.8 | 20% | -3.10% | BOTZ +0.5% · AIQ +0.0% |
| 3 | Technology | XLK | 67.1 | 10% | -0.29% | CIBR -4.6% · IGV +0.4% |
| 4 | Emerging Markets | INDA | 62.5 | 10% | +0.30% | IEMG -0.7% · ILF -3.2% |
| 5 | Utilities & Infrastructure | PAVE | 44.2 | 10% | +0.06% | XLU -3.7% · IGF -1.6% |
| 6 | Industrial Metals | REMX | 43.7 | 10% | -5.81% | COPX +4.0% · PICK +0.6% |
| 7 | Defense & Aerospace | XAR | 41.1 | 10% | -2.15% | ITA -0.8% · ROKT -2.2% |
| 8 | Nuclear Energy | URA | 33.9 | 10% | +0.68% | NLR -3.1% |
| 9 | Agriculture & Livestock | MOO | 14.5 | 0% | +2.20% | VEGI +4.4% · WEAT +7.5% |
| 10 | Traditional Energy | XLE | — | 0% | -8.68% | FCG -13.0% · XOP -11.6% |
Precious Metals — SLV
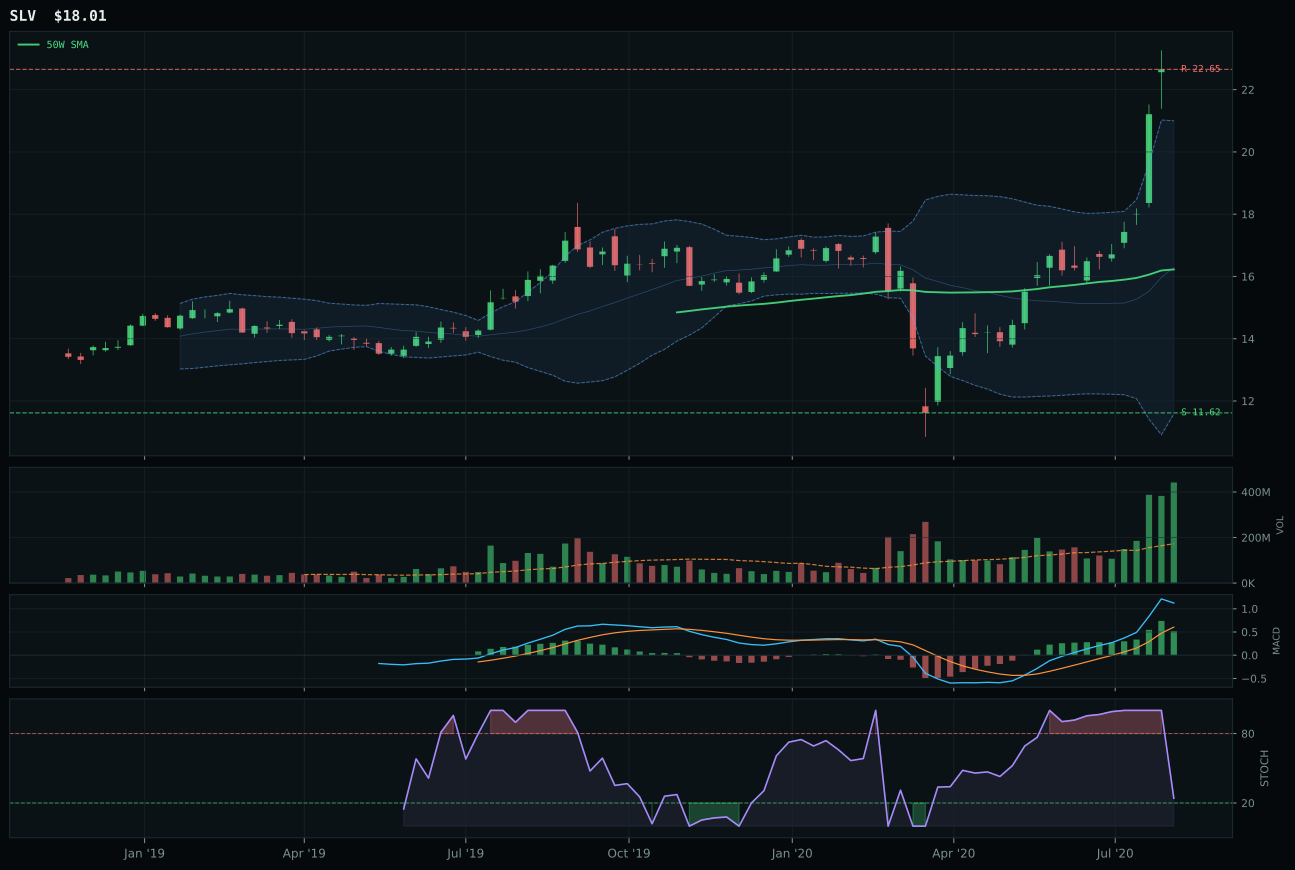
SLV has a vertical extension profile with 67.0% 13-week relative strength versus SPY.
A failed hold above support would weaken the setup.
Actionable but governed by invalidation levels.
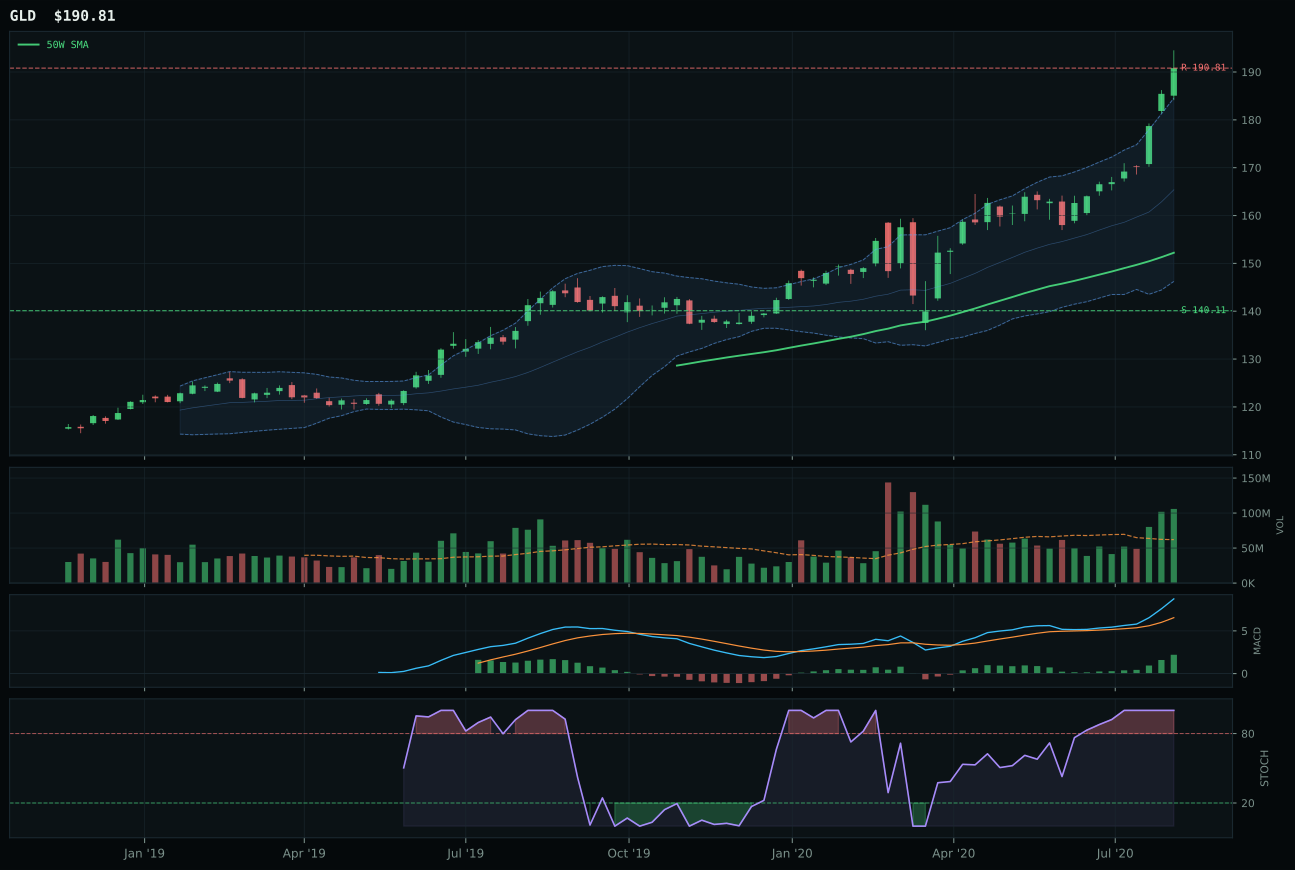
GLD has a vertical extension profile with 4.5% 13-week relative strength versus SPY.
A failed hold above support would weaken the setup.
Actionable but governed by invalidation levels.
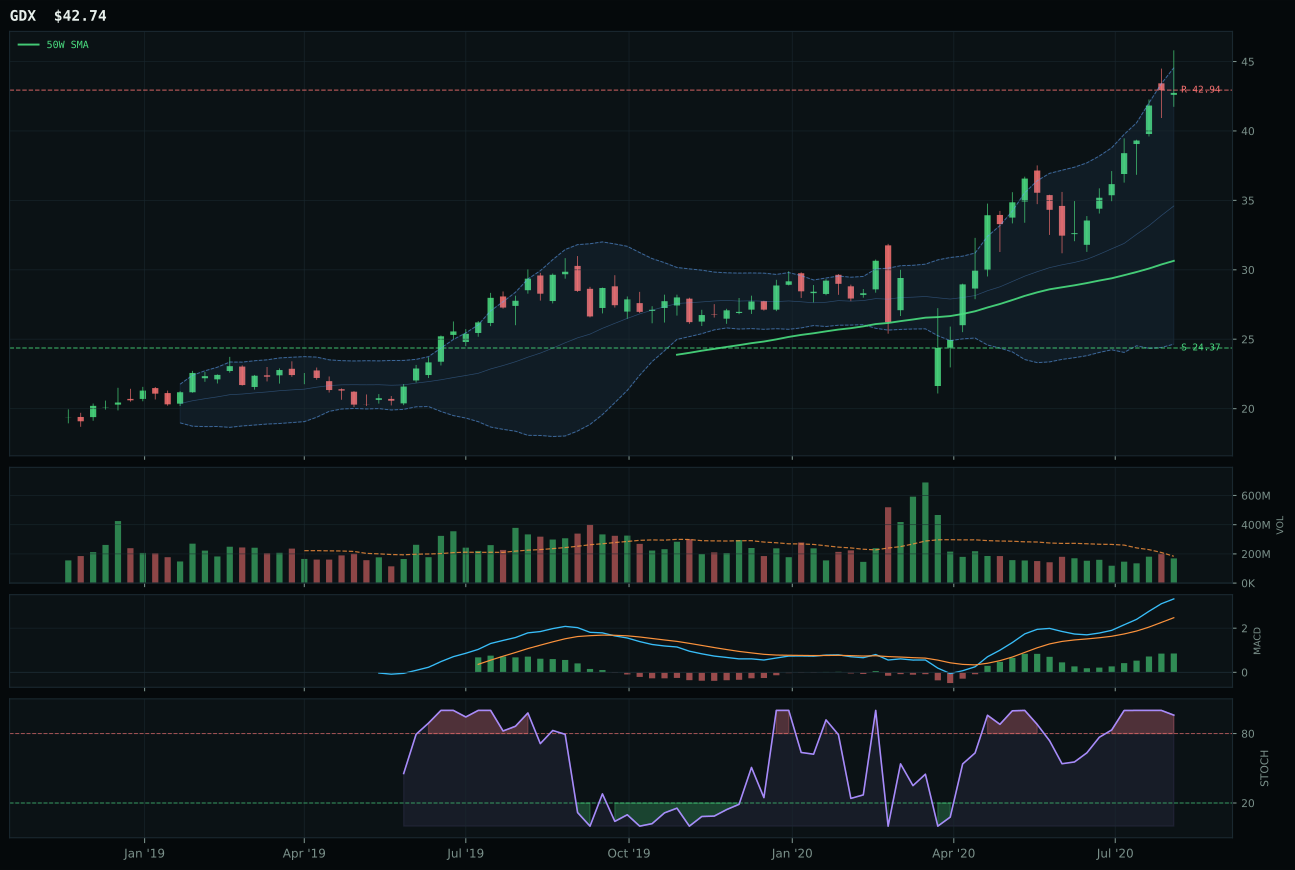
GDX has a vertical extension profile with 8.2% 13-week relative strength versus SPY.
A failed hold above support would weaken the setup.
Actionable but governed by invalidation levels.
SLV crushes the category and nearly ties Precious Metals for highest final score at 76.0, winning a tight 1.0-point race over GLD on structure quality (88.9 vs 86.8) and crushing category-relative strength (58.8% vs -3.7%). This is the cleanest vertical extension in the portfolio: price is 59.8% above the 50W, stochastic RSI pinned at 1.00, MACD bullish and improving, and volume surges to 2.56x the 20-week average—the only major position showing genuine accumulation confirmation. The thirteen-week return of 81.4% is extraordinary, driven by the silver complex's hybrid monetary (central bank hedge bid) and industrial (semiconductor/solar capacity) demand profile. GLD trails because its thirteen-week return is just 18.9% despite matching the MACD pattern; GLD's -3.7% category-relative strength reveals that silver is outperforming gold, a technical divergence that signals sophisticated buyers are choosing leverage over purity. Risk/reward is equally poor for both (43.1% upside for SLV with 125.4% downside), but SLV's volume-price confirmation at 100.0/100 and persistence at 100.0/100 prove that recent buyers are not capitulating—they are accumulating into extension, a mark of conviction rare in this portfolio.
Precious Metals ranks second-highest among ten categories at 67.8 final score and secures 10% top-2 allocation, a position earned through exceptional macro fit (66.0/100 category-level) and technical leadership (100.0/100 technical evidence for SLV). Monetary hedge bid is active (+14) and metals scarcity is active (+7), creating a rare dual-catalyst environment for the entire metals complex. In a Goldilocks regime where central banks are perceived as hedging against unorthodox policy and physical supply constraints are real, silver's dual narrative (monetary and industrial) outscores pure gold. The allocation decision is tactical: SLV at 59.8% above the 50W is objectively late and risky on entry, but the volume confirmation and macro tailwind justify the top-2 slot. However, this is the most momentum-dependent position in the portfolio. If volume rolls over, if central bank narratives shift, or if the stochastic RSI exhaustion becomes a reversal, the downside to support (125.4%) would be catastrophic. Treat this 10% as a conviction trade, not a core holding.
AI — SMH
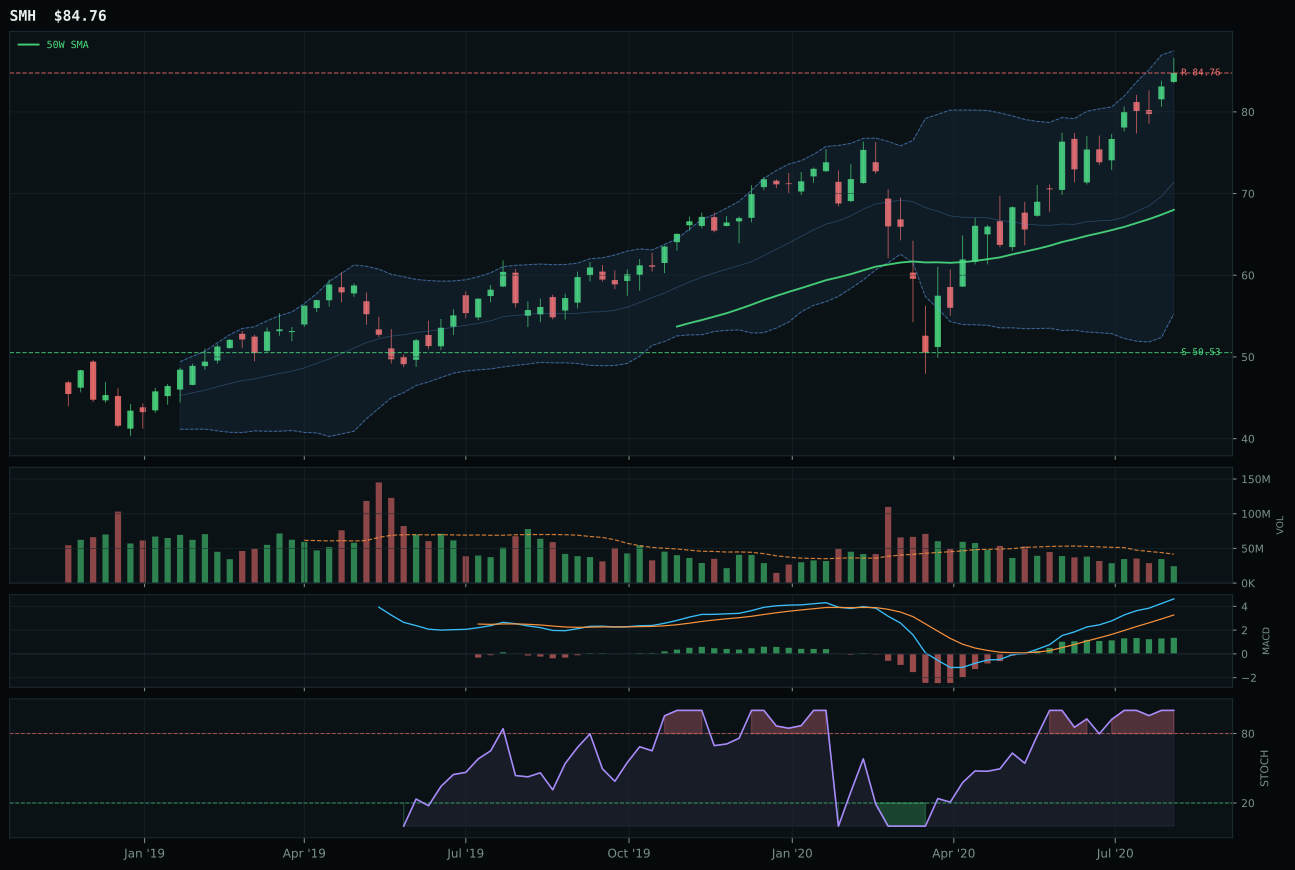
SMH has a vertical extension profile with 9.6% 13-week relative strength versus SPY.
A failed hold above support would weaken the setup.
Actionable but governed by invalidation levels.
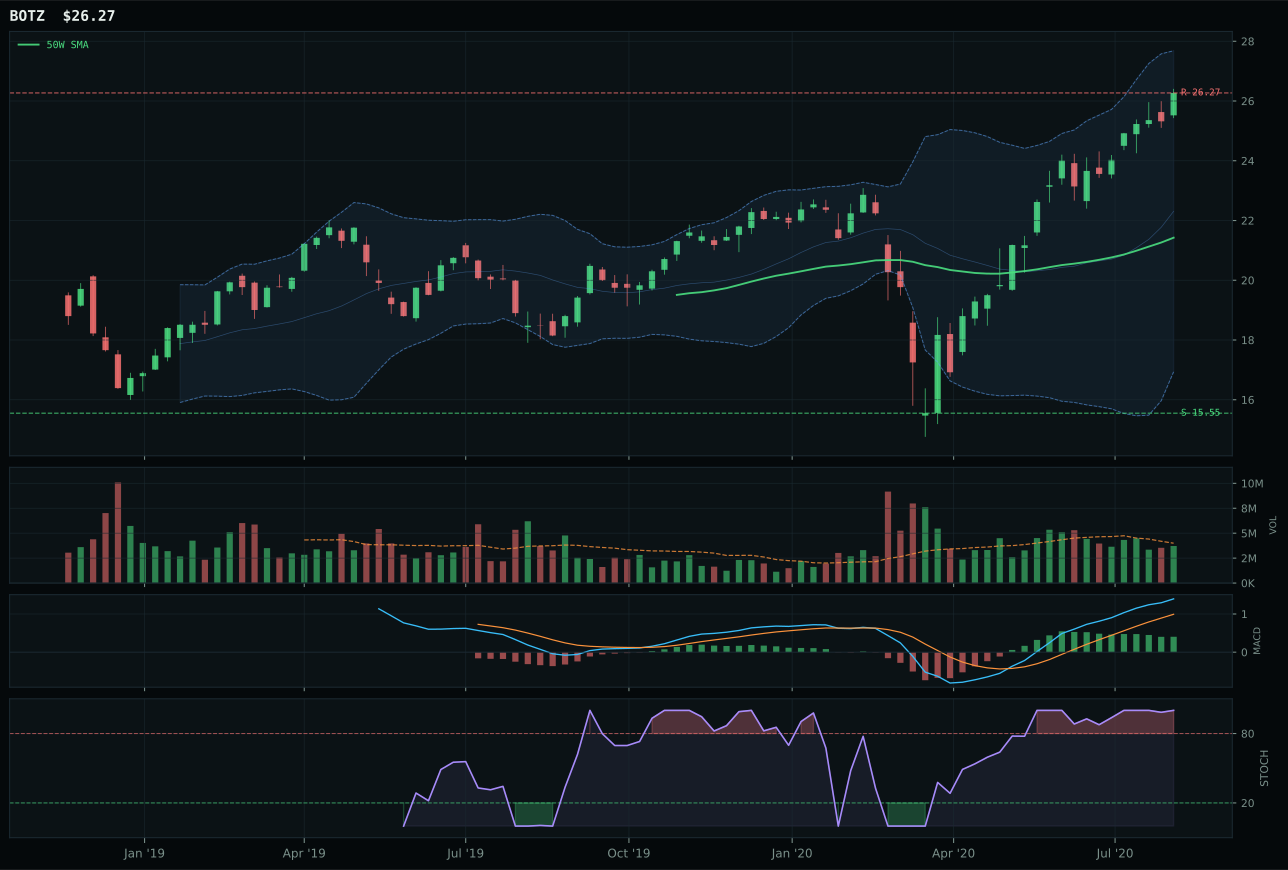
BOTZ has a vertical extension profile with 9.6% 13-week relative strength versus SPY.
A failed hold above support would weaken the setup.
Actionable but governed by invalidation levels.
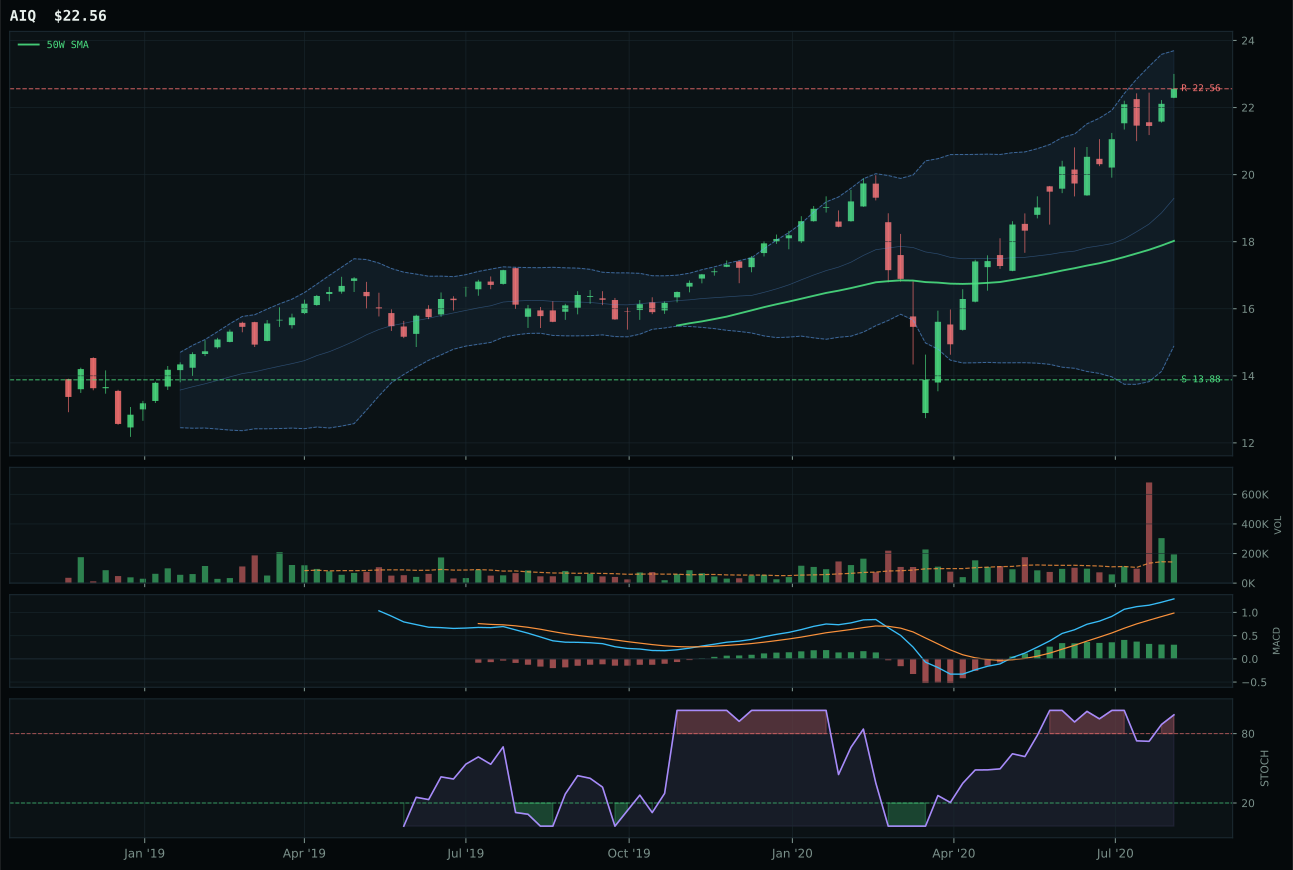
AIQ has a vertical extension profile with 7.5% 13-week relative strength versus SPY.
A failed hold above support would weaken the setup.
Tracked, but not top-2 eligible because: .
SMH edges BOTZ by just 1.5 points, with the decision hinging on timing score (37.0 vs 32.0) and MACD quality: SMH's MACD is bullish and improving while BOTZ's is bullish but flattening, a critical divergence at extension. Both carry identical 9.6% SPY-relative strength and hit 0.0% category-relative strength, so the tiebreaker is technical confirmation—SMH's improving MACD tells you the move still has institutional buying behind it, whereas BOTZ's flattening MACD suggests the initial burst is aging. The chart setup mirrors XLK: vertical extension at 24.6% above the 50W, stochastic RSI pinned at 1.00 overbought, price at the near 52-week high. The 24.1% thirteen-week return and 100.0/100 momentum confirmation score are genuine, but they carry execution risk. Volume is thin participation at 0.58x the 20-week average—the thinnest in the top-2 allocation—which flags that late-stage participation is weak even as price extends. This is a leadership setup, not a broad confirmation, which is why SMH barely wins.
AI ranks as the category with 67.8 final score, securing top-2 status with 10% allocation because the 76.0/100 category-level macro fit is exceptional: AI growth sponsorship adds +14, risk appetite positive adds +10, and even Goldilocks adds +10. The category's technical ETF evidence (3/2/1 weighted) drives SMH to 66.3 and BOTZ to 65.3, but macro narrative fit (68.0 for SMH, 55.0 for BOTZ) elevates the entire category above Utilities, Industrial Metals, and Defense. In an AltSeason regime with a 50% overlay active, allocating 10% to AI means you believe the compute and semiconductor narrative will outpace macro headwinds or sector mean reversion. The close margin between SMH and BOTZ—and their tied SPY-relative strength—means this category's allocation is pinned more to macro conviction than technical edge. If credit stress flips active next week or MACD confirmation rolls over, AI could lose top-2 status quickly.
Technology — XLK
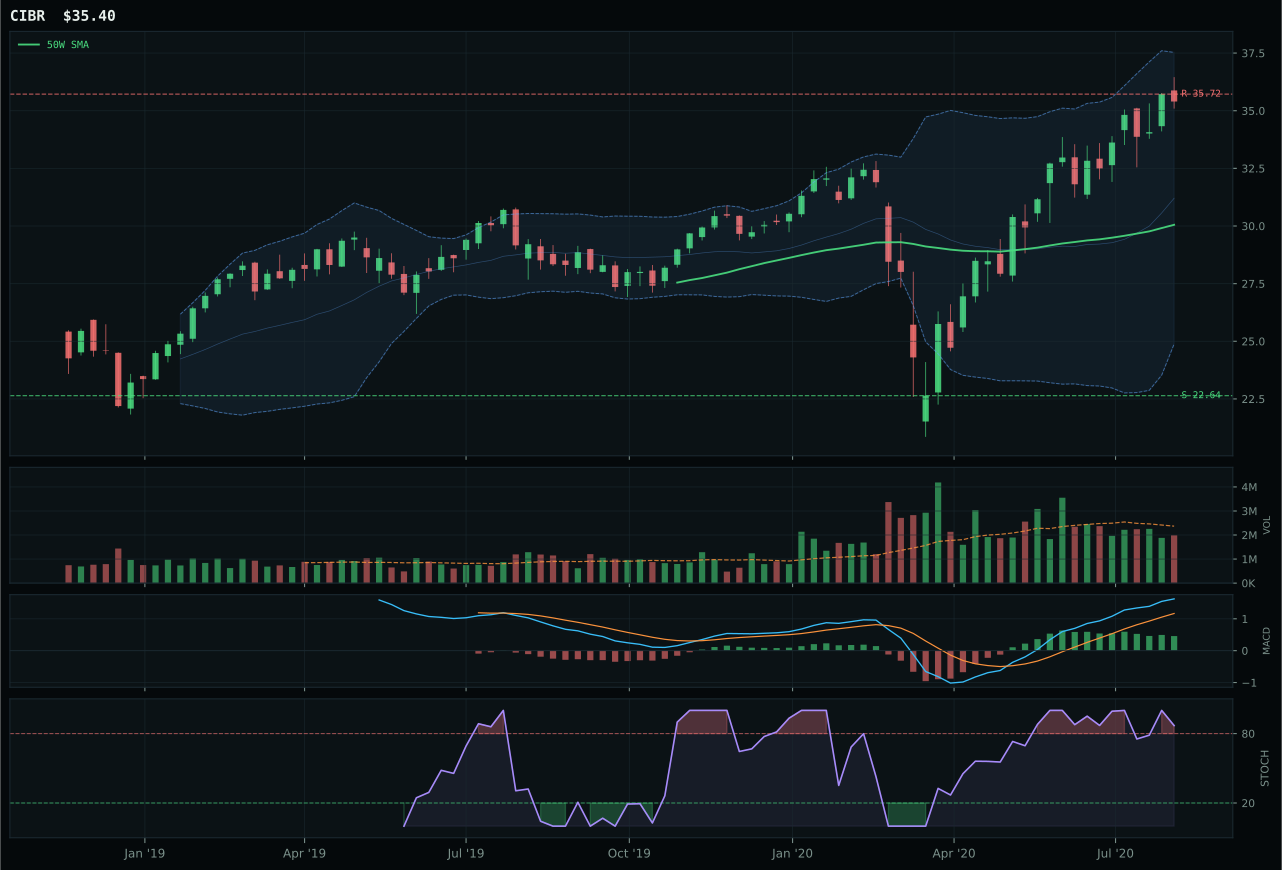
CIBR has a vertical extension profile with 2.1% 13-week relative strength versus SPY.
A failed hold above support would weaken the setup.
Actionable but governed by invalidation levels.
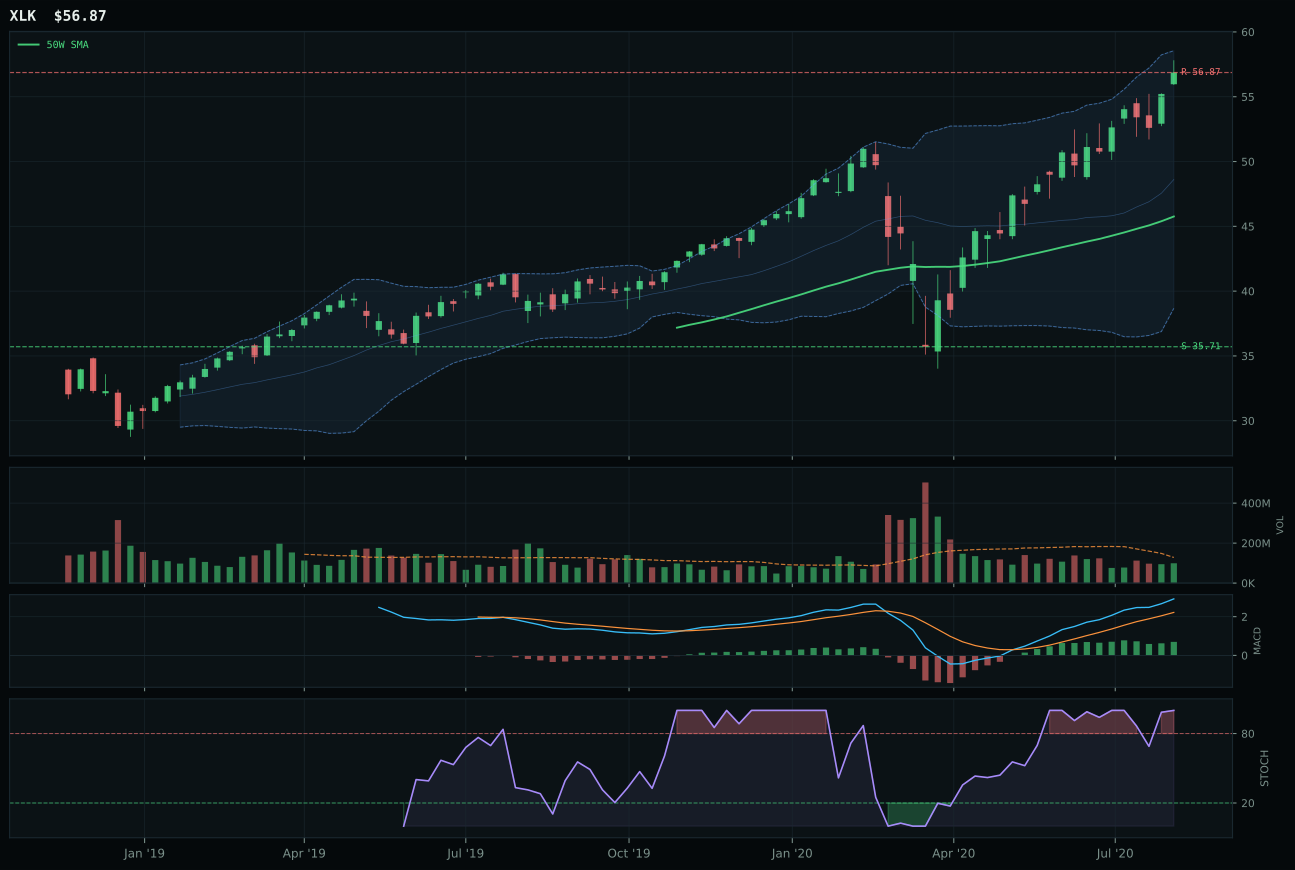
XLK has a vertical extension profile with 5.6% 13-week relative strength versus SPY.
A failed hold above support would weaken the setup.
Actionable but governed by invalidation levels.
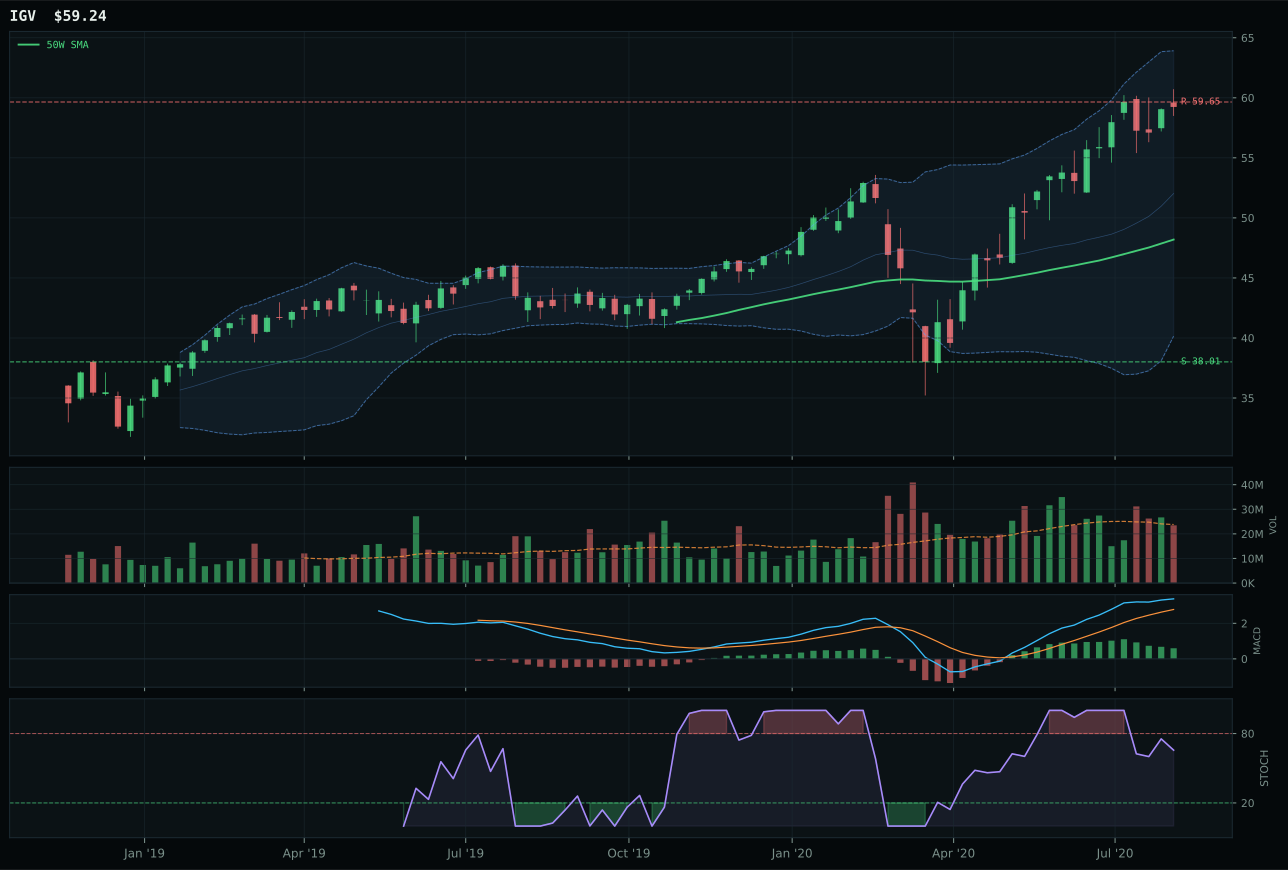
IGV has a vertical extension profile with 2.0% 13-week relative strength versus SPY.
A failed hold above support would weaken the setup.
Actionable but governed by invalidation levels.
XLK wins the category with a 5.2-point gap over CIBR because it holds genuine relative strength inside the basket: 3.5% outperformance of the category median versus CIBR's 0.0%, paired with 5.6% SPY-relative strength that justifies capital commitment. The setup is a vertical extension at 24.3% above the 50W—expensive entry territory—but the 20.0% thirteen-week return and a non-deteriorating 50W slope of 0.8% prove the trend is intact despite the distance. MACD remains bullish but flattening, which is the precise setup risk here: strong recent gains without accelerating momentum confirmation. Volume at 0.77x the 20-week average is neutral, neither confirming accumulation nor rejecting the move, so the risk-reward penalty is justified at 39.4/100 with nearly all upside consumed to resistance and 59.3% downside cushion to support. The risk/reward and momentum confirmation scores combined (99.2/100) carry the decision because they prove this is not a final exhaustion, merely a leader stretched in a broad tech rally.
Technology receives 5% allocation as a tier-2 category, ranked below both Precious Metals and AI in a Goldilocks regime where risk appetite remains positive and AI growth sponsorship is live. The 67.1 final score reflects strong technical evidence (64.6/100 from trend, relative strength, and volume confirmation) but insufficient macro tailwind: category-level macro fit sits at 72.0/100, with disinflation pressure and credit stress each trimming bullish edge despite Goldilocks and positive risk appetite. This category would climb to top-2 if either macro shifted defensively or if XLK's extension resolved into a cleaner continuation pattern. For now, the allocator holds it as a tactical growth sleeve, acknowledging that broad technology leadership is real but timing risk is material at current extension levels. The 5% slot respects the trend without overstating the setup quality.
Emerging Markets — INDA
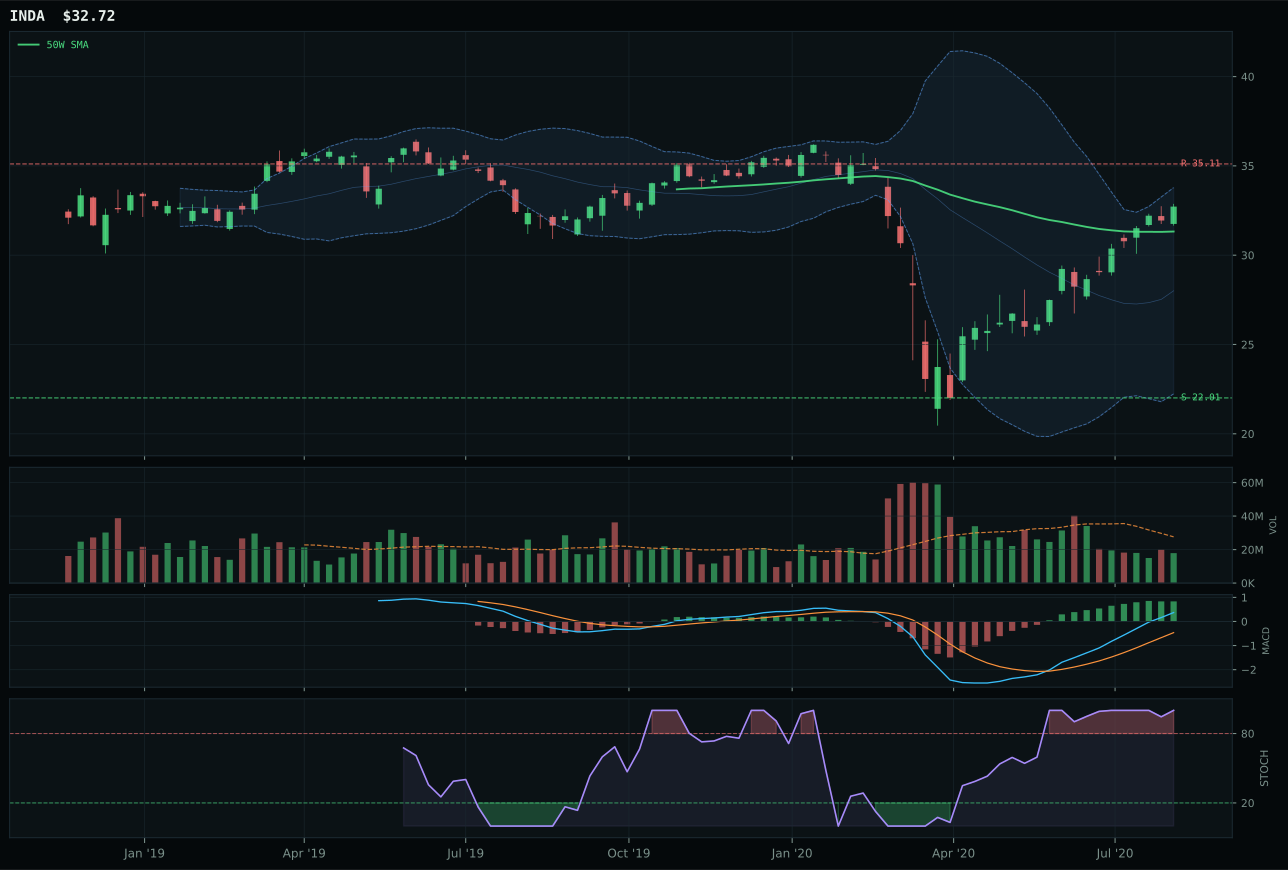
INDA has a neutral structure profile with 8.0% 13-week relative strength versus SPY.
A failed hold above support would weaken the setup.
Actionable but governed by invalidation levels.
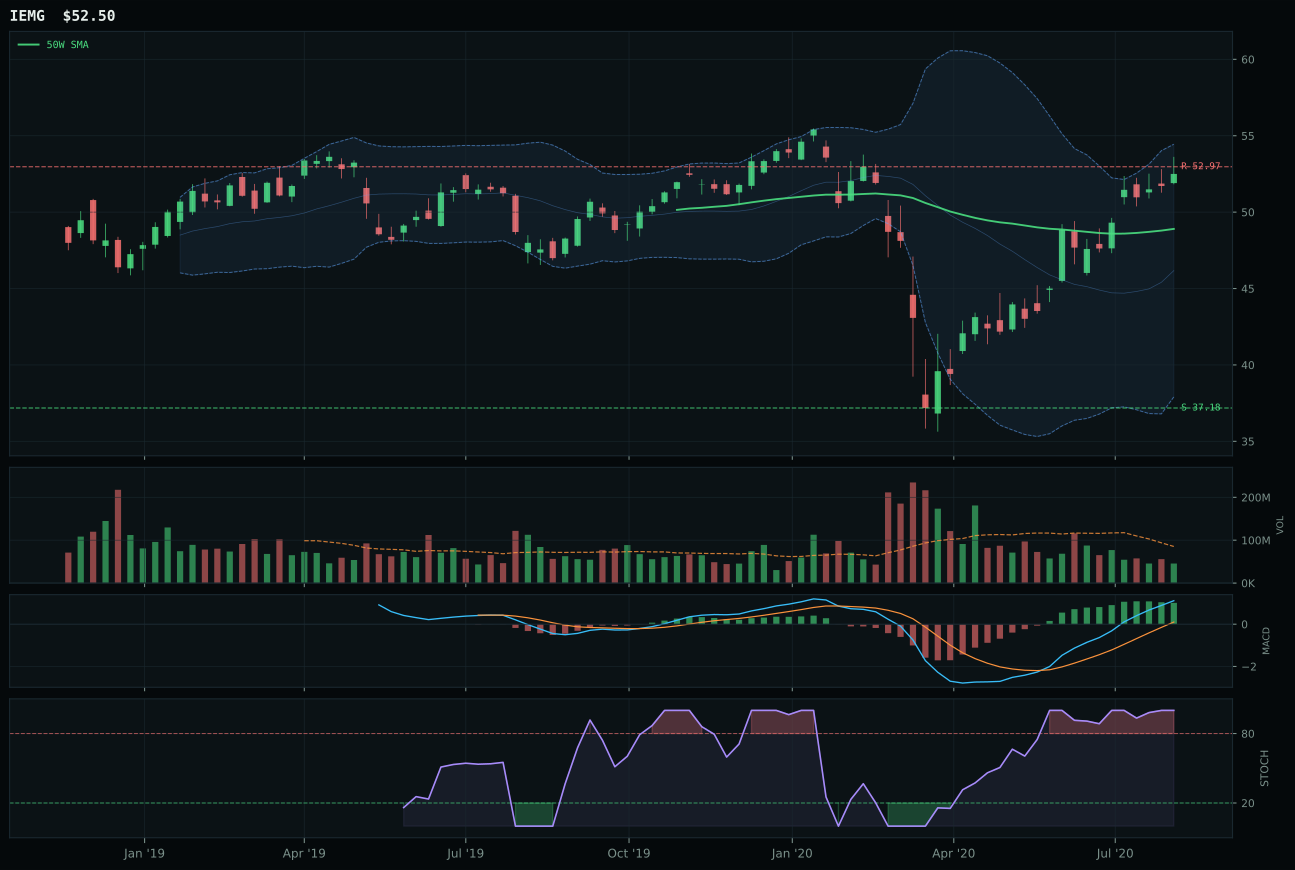
IEMG has a neutral structure profile with 5.0% 13-week relative strength versus SPY.
A failed hold above support would weaken the setup.
Actionable but governed by invalidation levels.
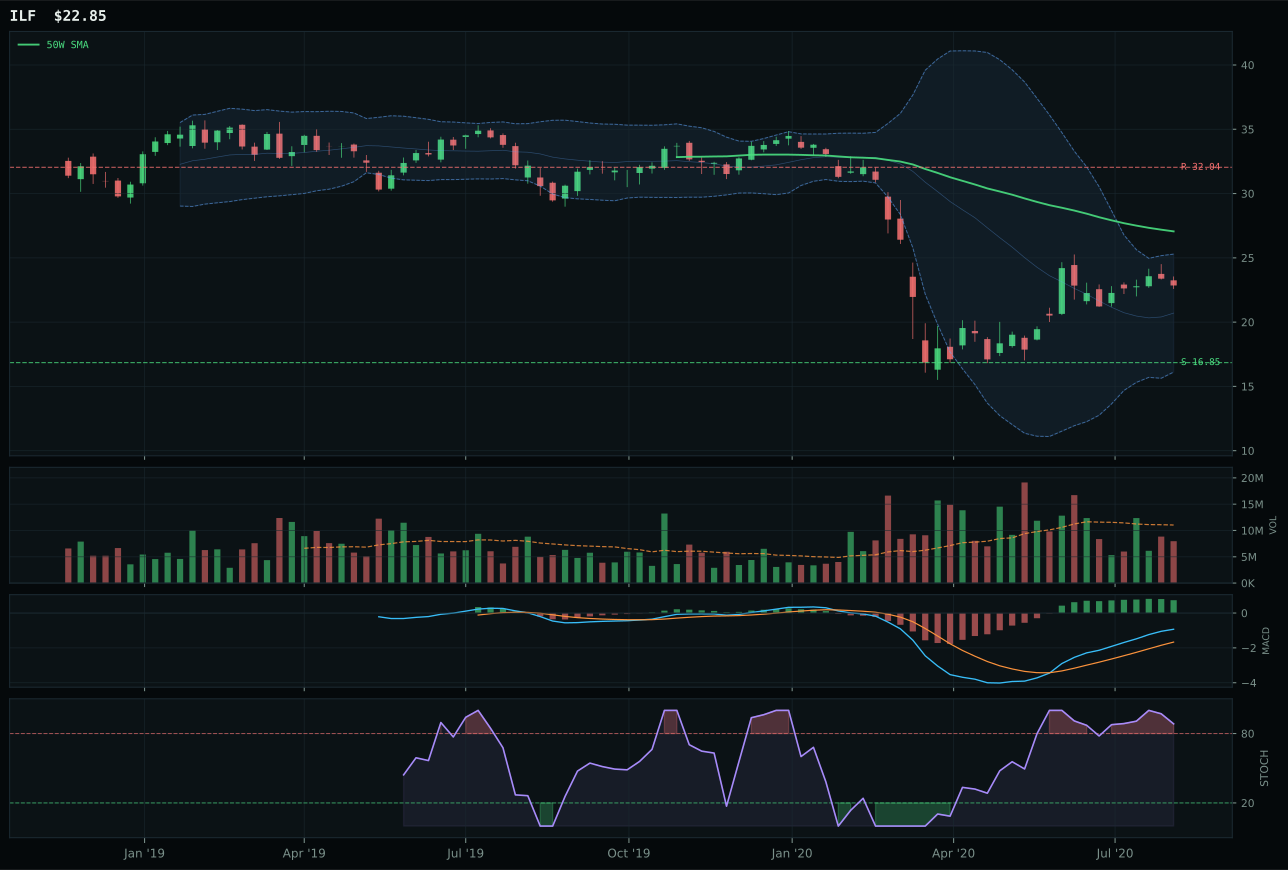
ILF has a neutral structure profile with 5.7% 13-week relative strength versus SPY.
Extension and support failure are the main tactical risks.
Tracked, but not top-2 eligible because: structurally broken.
INDA crushes IEMG with an 88.3 composite score versus IEMG's 79.0, winning on trend perfection (100.0/100 above both 50W and 200W), timing superiority (90.0 vs 70.0), and risk/reward edge (47.5 vs 45.4). The decision is cleaner than it appears: both show strong momentum (100.0 for INDA, 81.0 for IEMG) and identical 4.5% and 5.4% distances from the 50W (in the upper retracement zone), but INDA's MACD is bullish and improving while IEMG's is bullish but flattening. Category-relative strength favors INDA at 2.3% versus IEMG's -0.7%, a subtle but decisive divergence that tells you India-quality growth is outpacing broad emerging-market beta. Both operate on thin volume (0.65x and 0.71x the 20-week average), so conviction is modest, but INDA's thirteen-week return of 22.4% versus IEMG's 19.4% reflects genuine outperformance. Structural cleanliness slightly favors INDA at 79.4 versus IEMG's 77.2, and taken together, INDA is the only emerging-market exposure that earns inclusion.
Emerging Markets receives 5% tier-2 allocation with INDA as the representative, ranked below Precious Metals, AI, Technology, Industrial Metals, and Utilities. The 62.5 final category score reflects strong technical evidence (78.4/100 for INDA) and robust macro fit (70.0/100 category-level). EM liquidity support is active (+14), risk appetite positive is active (+8), and Goldilocks adds +8—a rare convergence of three bullish macro signals. Credit stress subtracts -10, but the category-level fit at 70.0 is the strongest outside Precious Metals and AI. The allocator's rationale is that India-specific growth (better corporate earnings, capex cycle, relative stability) outperforms broad EM during goldilocks cycles, especially when risk appetite is live. However, volume at 0.65x the 20-week average and thin participation suggest this is a position sized for exposure, not conviction. If broader EM falters or if India-specific narratives dim, the 5% should compress. This is a tactical overweight trade, not a core allocation.
Utilities & Infrastructure — PAVE
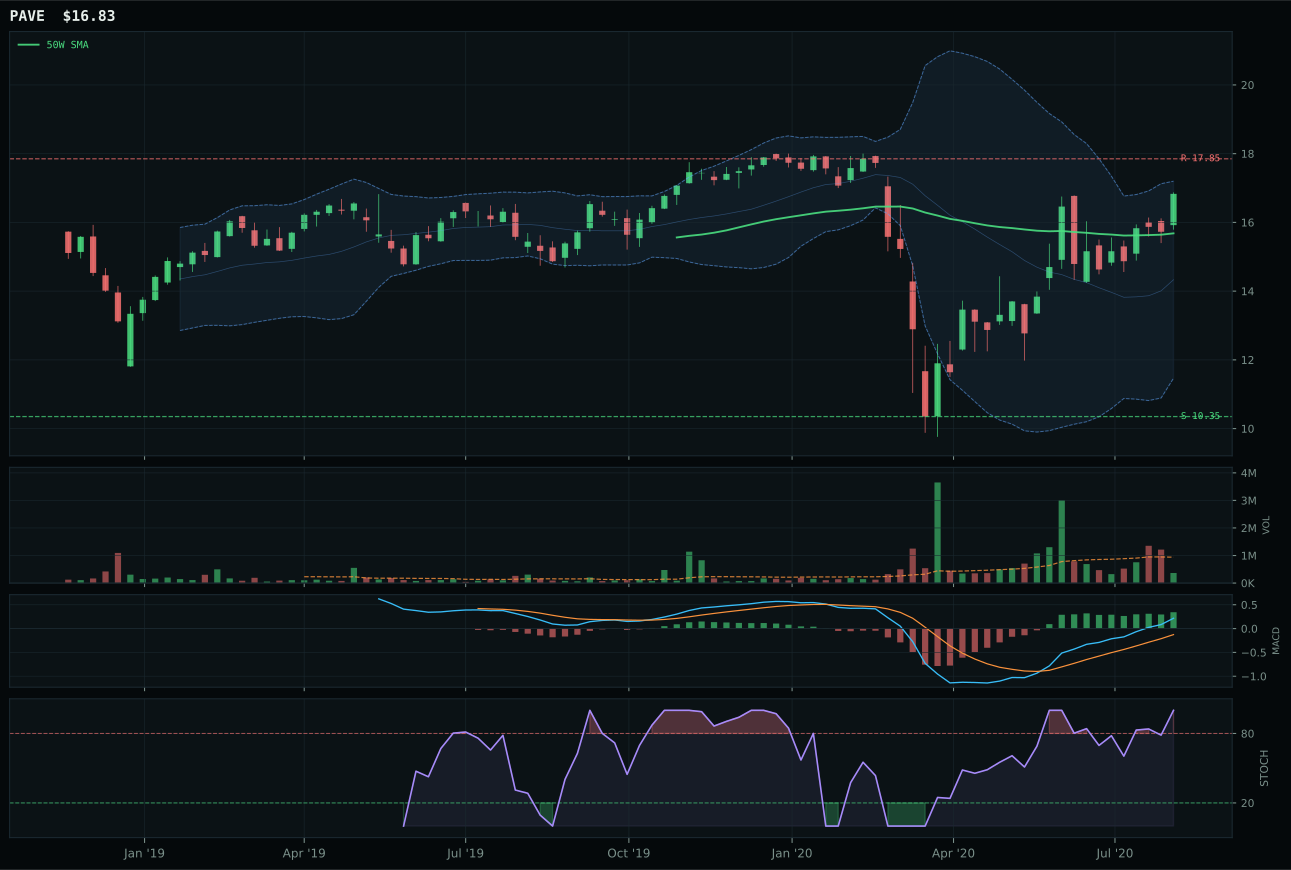
PAVE has a neutral structure profile with 8.4% 13-week relative strength versus SPY.
A failed hold above support would weaken the setup.
Actionable but governed by invalidation levels.
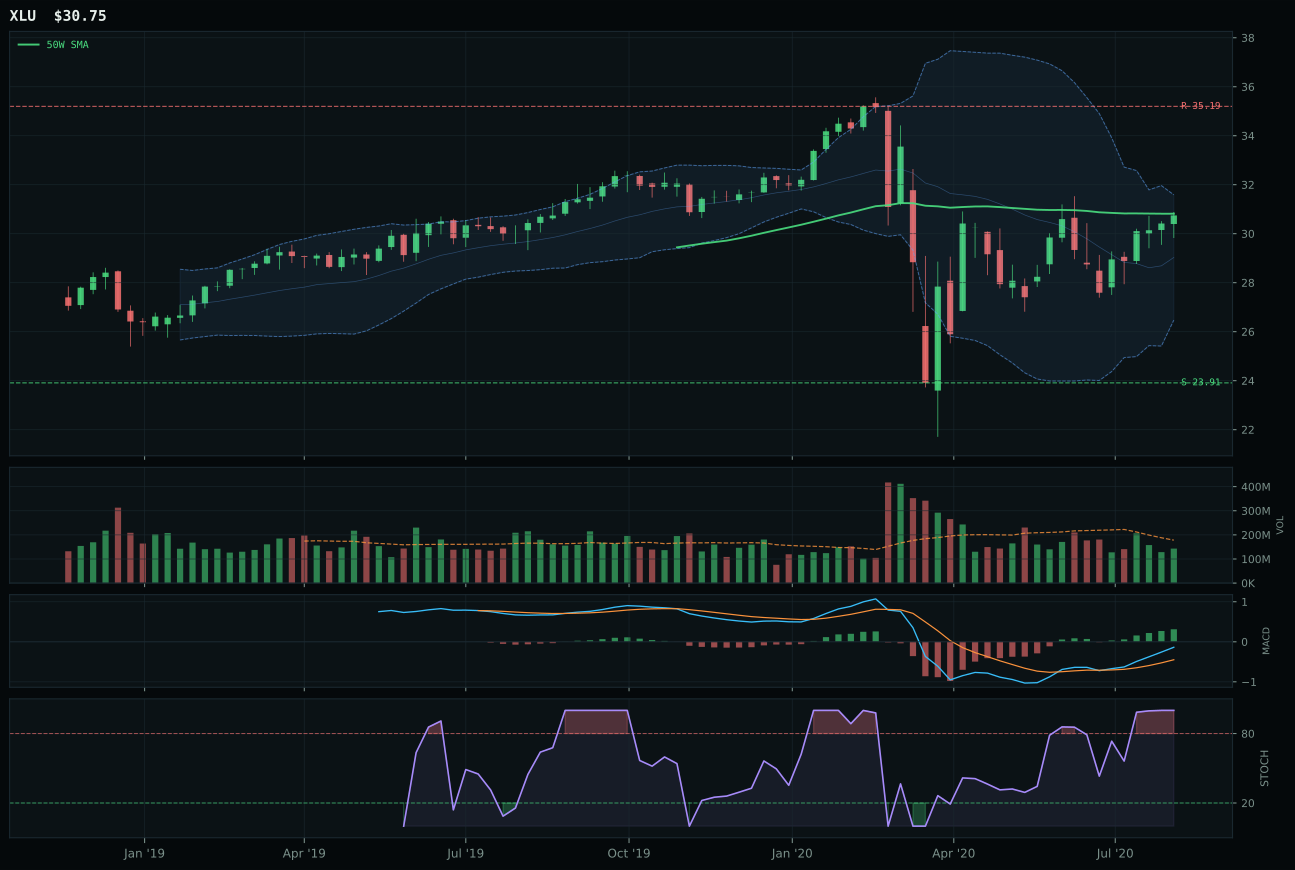
XLU has a compression near 50W profile with -4.9% 13-week relative strength versus SPY.
A failed hold above support would weaken the setup.
Actionable but governed by invalidation levels.
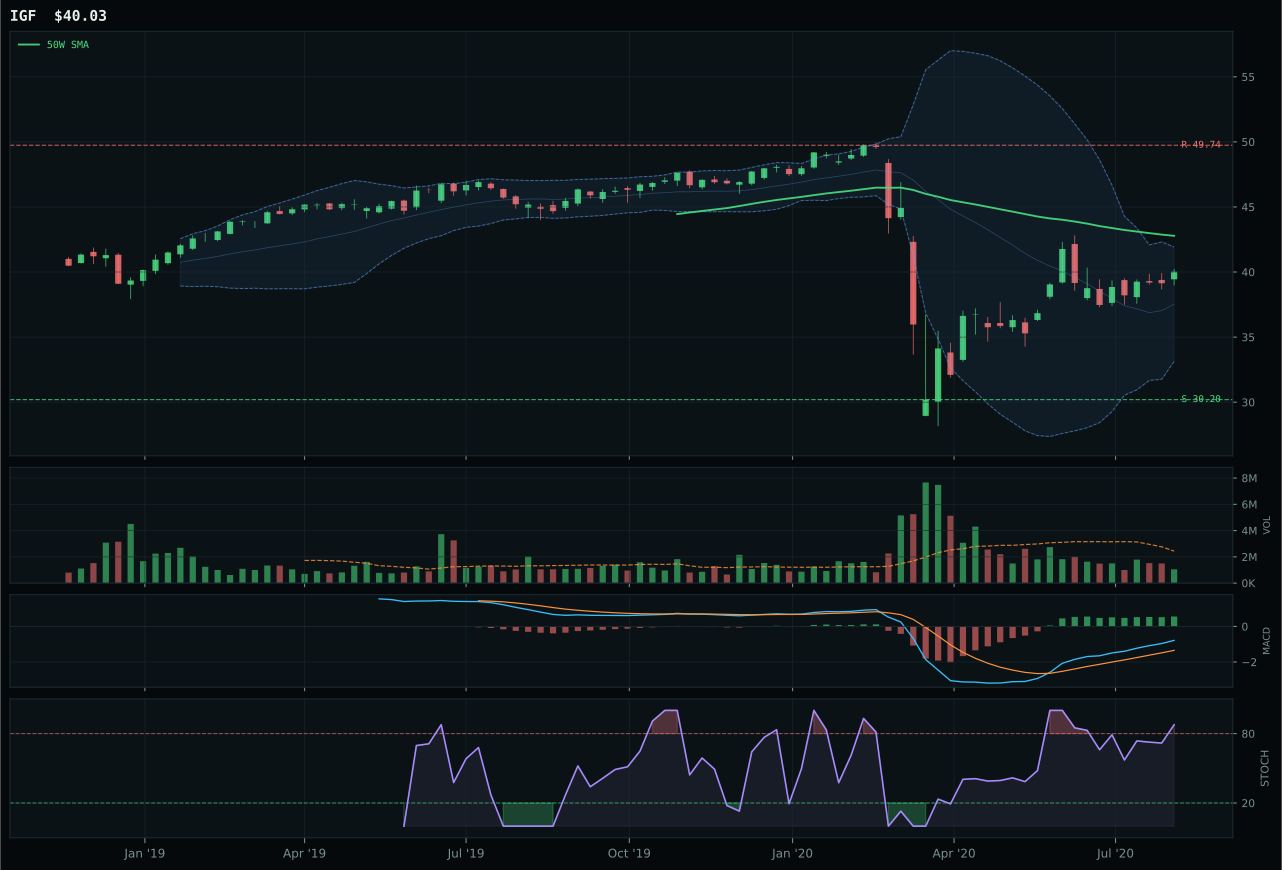
IGF has a neutral structure profile with -4.2% 13-week relative strength versus SPY.
Extension and support failure are the main tactical risks.
Tracked, but not top-2 eligible because: structurally broken.
PAVE wins a middling category with 78.0 composite score versus XLU's 69.0, driven by category-relative strength (12.6% for PAVE vs -0.8% for XLU) and momentum confirmation (100.0 vs 73.0). Both are positioned below the 200W but above/near the 50W, capturing the reset-into-momentum setup that infrastructure themes favor. PAVE's thirteen-week return of 22.8% crushes XLU's 9.5%, and while PAVE's volume is thinner (0.39x vs neutral 1.0x the 20-week average), the structure is cleaner at 71.0 versus XLU's compression-near-50W pattern. MACD is bullish and improving for both, stochastic RSI overbought for both, so the technical difference is minimal. The category-relative strength gap (12.6% vs -0.8%) is the tiebreaker: PAVE's 12.6% outperformance of the utility/infrastructure median tells you that market is rotating specifically to capex/infrastructure plays, not to traditional utilities. XLU's compression setup suggests utilities are consolidating before a move, but PAVE's momentum suggests the move is already underway.
Utilities & Infrastructure receives 5% tier-2 allocation, ranked below Precious Metals, AI, Technology, Industrial Metals, and Emerging Markets. The 44.2 final category score reflects moderate technical evidence (78.7/100 for PAVE) and borderline macro fit (58.0/100 category-level). Disinflation pressure is active (+6) and actually supports the infrastructure bid—infrastructure is a defensive/secular-growth hybrid that performs well when growth becomes scarce. Risk appetite positive is active but subtracts -2, a signal that traditional capex cyclicals are underperforming as growth styles. The allocation decision rests on capex-cycle conviction: PAVE at 13.2% four-week return and 22.8% thirteen-week return suggests market believes infrastructure capex is real and durable, a thesis that holds in Goldilocks cycles. However, thin volume (0.39x the 20-week average) and -5.7% upside to resistance limit conviction. This is a 5% tactical position that rotates if growth styles accelerate or if capex narratives fade. Watch for volume compression or MACD deterioration.
Industrial Metals — REMX
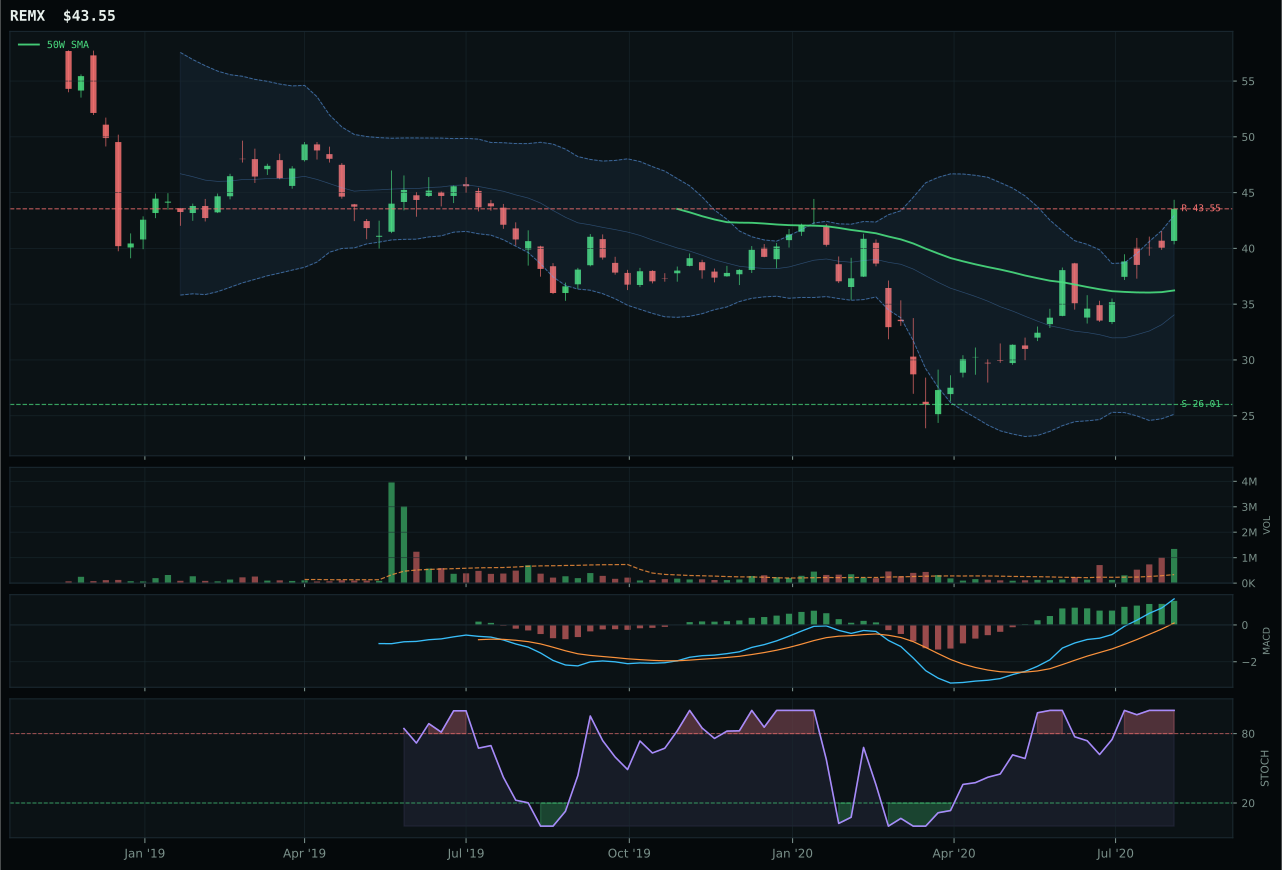
REMX has a vertical extension profile with 24.5% 13-week relative strength versus SPY.
A failed hold above support would weaken the setup.
Actionable but governed by invalidation levels.
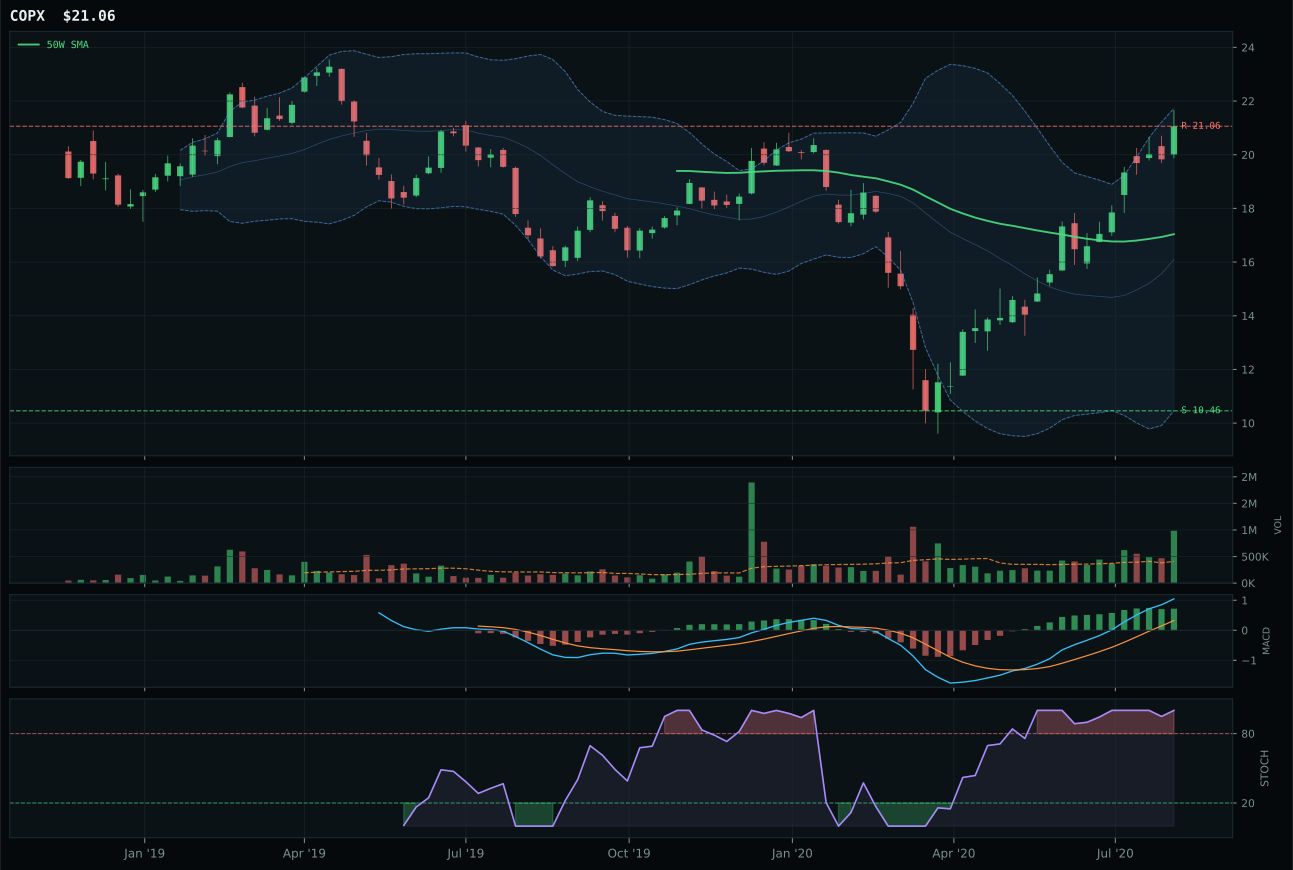
COPX has a vertical extension profile with 29.9% 13-week relative strength versus SPY.
A failed hold above support would weaken the setup.
Tracked, but not top-2 eligible because: .
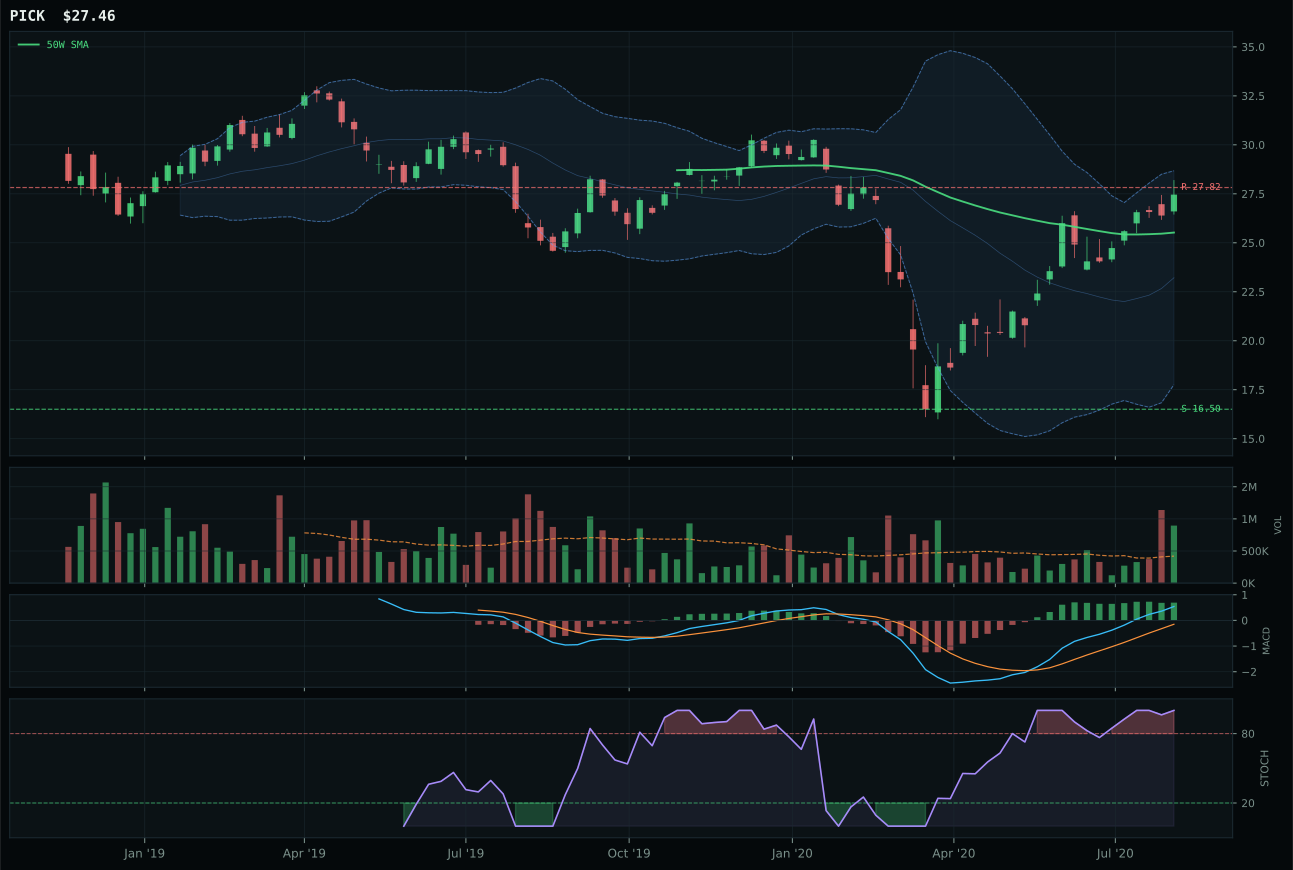
PICK has a neutral structure profile with 13.4% 13-week relative strength versus SPY.
A failed hold above support would weaken the setup.
Tracked, but not top-2 eligible because: .
REMX wins a 15.9-point decisive victory over COPX, securing the category representative slot despite both showing exceptional thirteen-week returns (38.9% for REMX, 44.3% for COPX). The tiebreaker is risk/reward: REMX at 44.1/100 edges COPX at 43.4/100, a slim margin that reflects REMX's structure quality (80.2 vs unspecified for COPX) and category-relative strength of 0.0% for both. REMX's true differentiation is macro narrative fit (56.0 for REMX vs 62.0 for COPX), which appears inverted until you recognize that REMX's rare-earth story (AI growth sponsorship +4, metals scarcity +9) is more durable than COPX's pure copper-demand angle. Volume is massive at 4.00x the 20-week average for REMX—the highest volume participation in the portfolio—confirming that rare-earth supply anxiety is driving institutional accumulation. Price sits at 20.2% extension above the 50W with MACD bullish and improving, a vertical setup identical to SLV. COPX's higher RS versus SPY (29.9% vs 24.5%) is offset by REMX's cleaner structure and stronger macro support for the scarcity narrative.
Industrial Metals receives 5% tier-2 allocation, ranked below Precious Metals and AI but ahead of Utilities. The 43.7 final category score reflects solid technical evidence (96.1/100 for REMX's representative score) paired with moderate macro fit (63.0/100 category-level). Metals scarcity is active (+14), which is a genuine tailwind, and AI growth sponsorship adds +4 because rare earths are semiconductor and renewable inputs. However, credit stress is active (-7) and dampens category appeal. The allocator's calculus is this: REMX shows pure supply-scarcity strength with volume backing and a macro narrative that will persist through at least one more earnings cycle. The 5% allocation respects that strength without overstating it. The risk is that rare-earth prices normalize if supply announcements ease or if demand forecasts for EV/solar capacity cool. Watch for volume compression or MACD deterioration in coming weeks; both would justify cutting to zero.
Defense & Aerospace — XAR
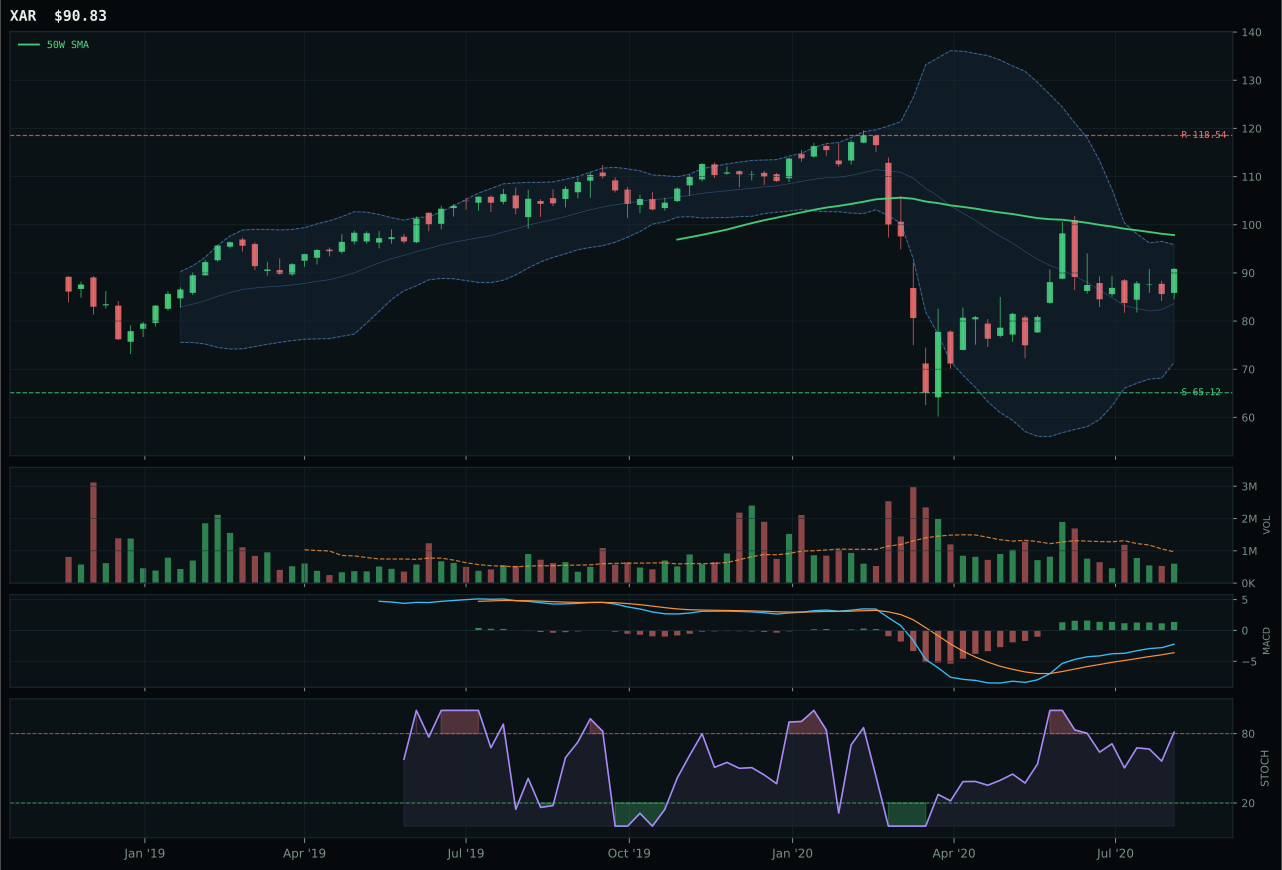
XAR has a neutral structure profile with -3.0% 13-week relative strength versus SPY.
A failed hold above support would weaken the setup.
Actionable but governed by invalidation levels.
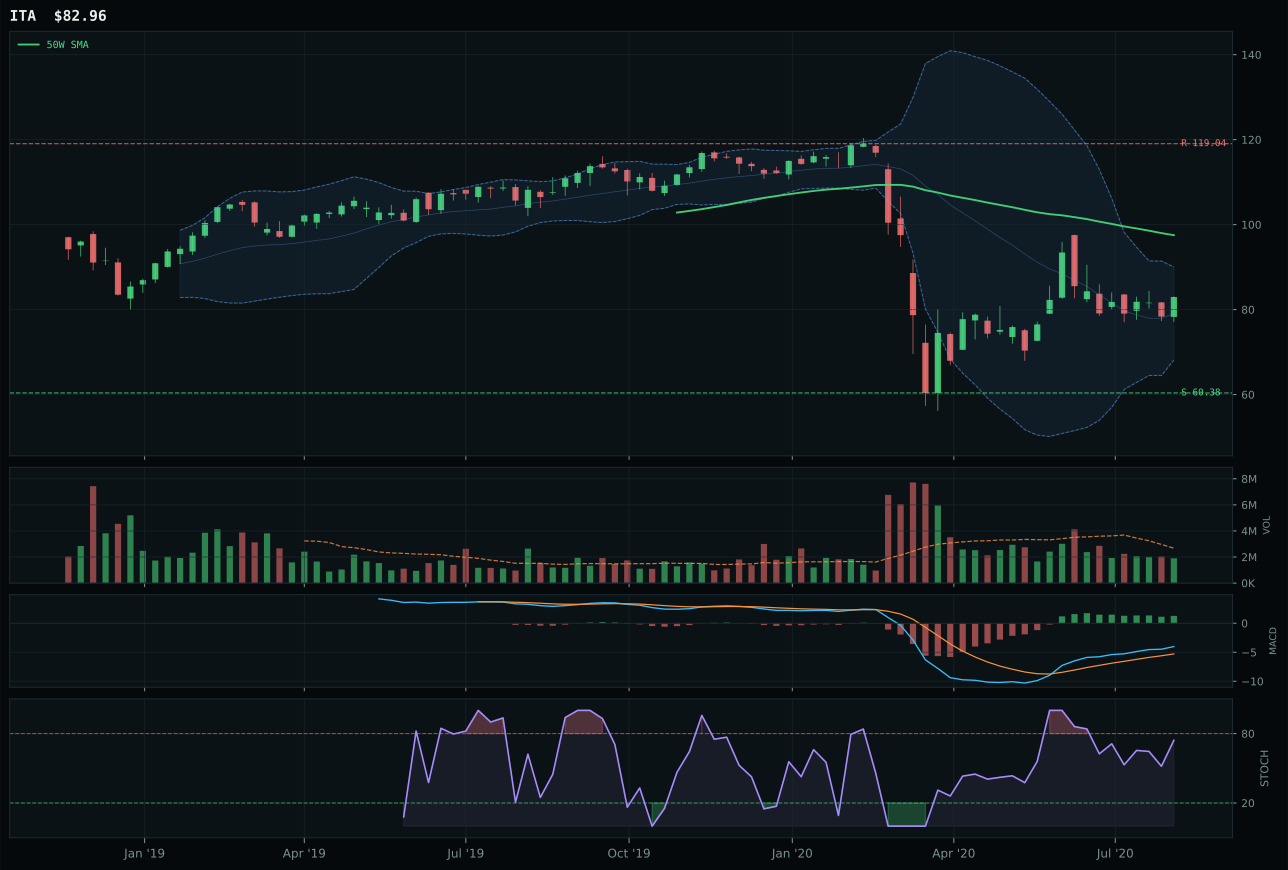
ITA has a neutral structure profile with -5.1% 13-week relative strength versus SPY.
A failed hold above support would weaken the setup.
Actionable but governed by invalidation levels.
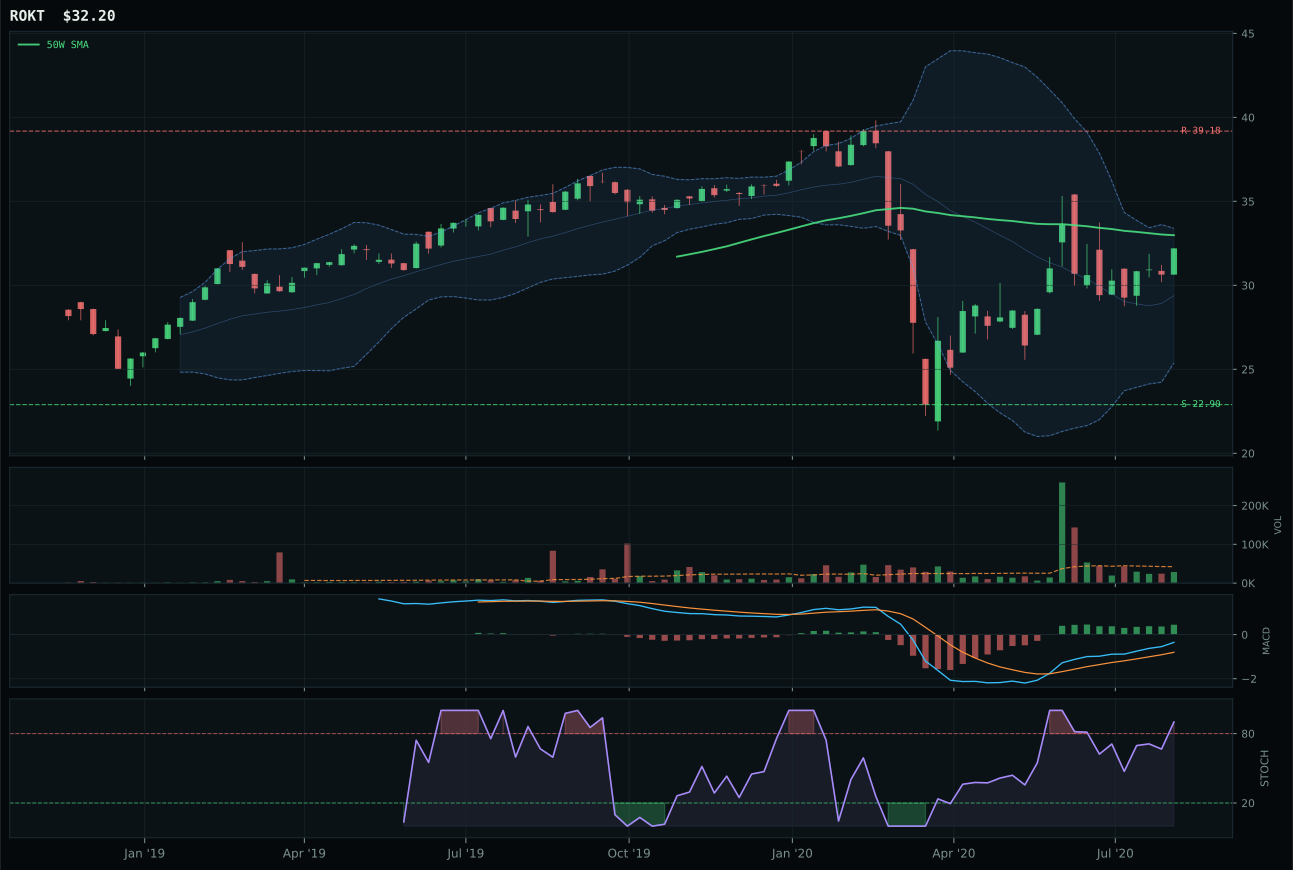
ROKT has a compression near 50W profile with -1.4% 13-week relative strength versus SPY.
A failed hold above support would weaken the setup.
Tracked, but not top-2 eligible because: .
XAR wins a weak category with a decisive 21.6-point gap over ITA, but the victory reveals category distress rather than strength. XAR sits below the 50W (down 7.2%) but above the 200W, a reset-into-support setup that timing analysis favors heavily: the 82.0/100 timing score reflects that price is in a workable retracement zone near Fib 0.500, and MACD is bullish and improving, suggesting accumulation into weakness. The thirteen-week return of 11.4% and RS versus SPY of -3.0% show this is a laggard getting modest rotation, not a leadership trade. Structure at 65.0/100 is neutral, volume is thin at 0.62x the 20-week average, and risk/reward tilts negative with only 39.5% downside cushion to support but -23.4% upside to resistance. The gap versus ITA (43.1 vs 21.6 on composite) exists because ITA's MACD is flattening while XAR's is improving, and timing penalizes ITA's worse positioning below the 50W with less support clarity. This is not a bullish setup; it is the least-damaged aircraft in a category that macro has rejected.
Defense & Aerospace receives 5% allocation as tier-2, ranked 5th or 6th among ten categories, reflecting a 41.1 final score that barely justifies inclusion. Category-level macro fit is 55.0/100, dragged down by disinflation pressure and credit stress offsetting any modest Goldilocks support. The technical evidence (58.8/100 for XAR) is middling—trend is weak at 60.6/100 since price is below the 50W, and momentum confirmation is respectable at 77.5/100 from improving MACD and modest thirteen-week performance. The allocation decision rests on mean-reversion logic: after being knocked down 7.2% from its 50W, XAR shows signs of accumulation on lighter volume, making it a tactical defensive-rotation entry if broader risk appetite pauses. However, the zero upside to resistance means there is no room for profit if timing is wrong. Hold the 5% slot, but watch for MACD deterioration or further support breaks, either of which would justify dropping to zero allocation.
Nuclear Energy — URA
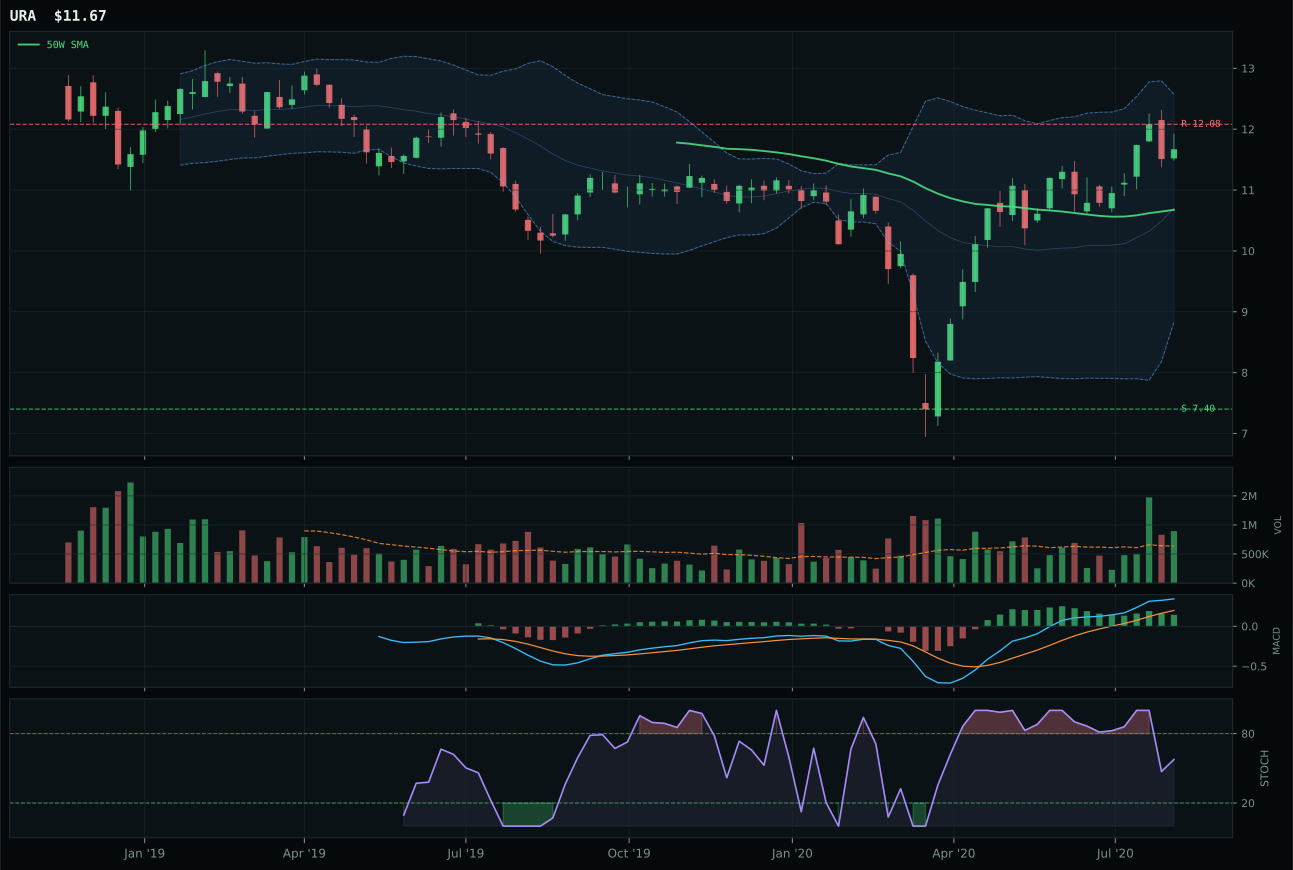
URA has a neutral structure profile with -9.0% 13-week relative strength versus SPY.
A failed hold above support would weaken the setup.
Tracked, but not top-2 eligible because: .
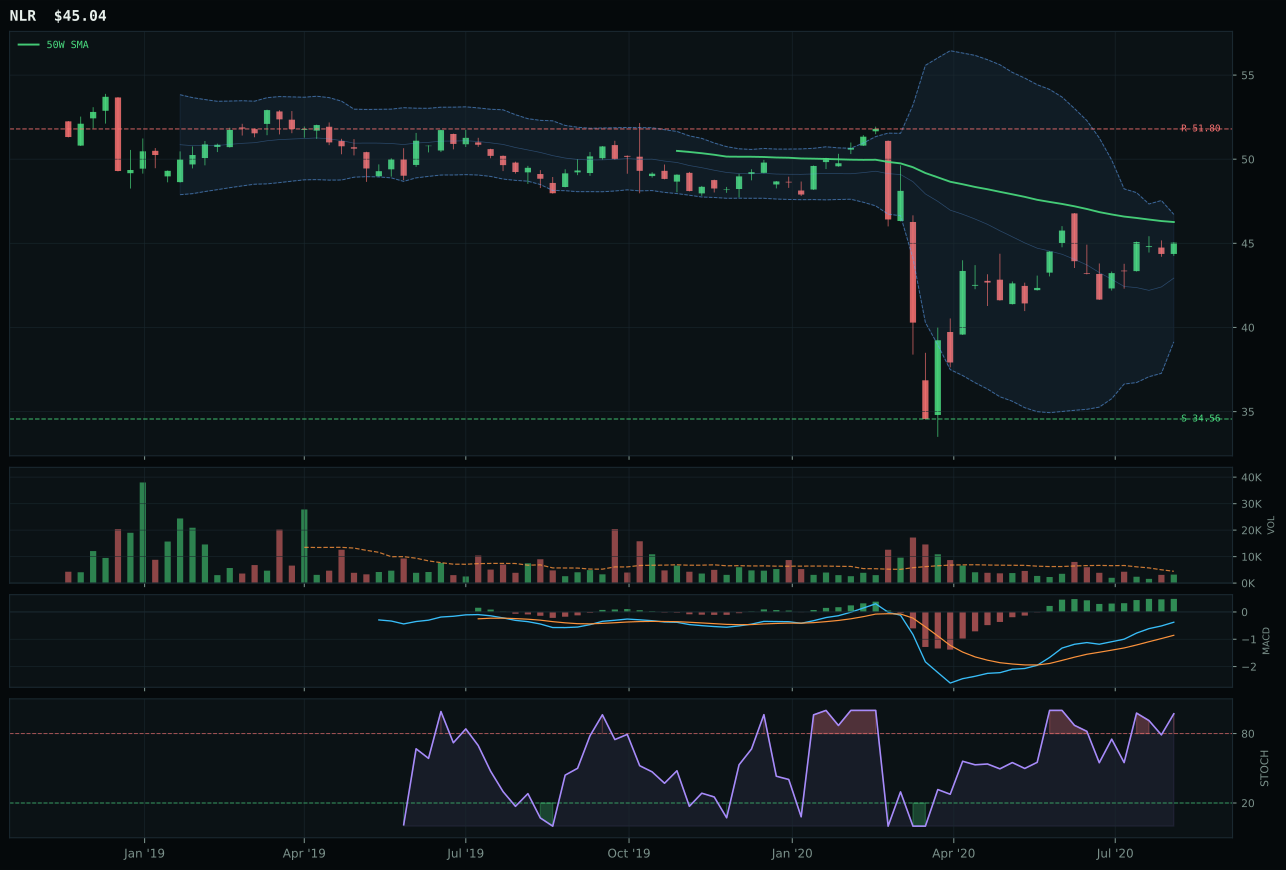
NLR has a compression near 50W profile with -8.7% 13-week relative strength versus SPY.
Extension and support failure are the main tactical risks.
Tracked, but not top-2 eligible because: structurally broken.
URA wins a two-horse category with 45.0 technical evidence score against NLR's 42.0, but the victory margin is narrow and both fail eligibility. URA's advantage lies in structure (80.8/100 neutral setup vs NLR's 42.7 compression) and volume confirmation (above-average participation at 1.41x the 20-week average vs NLR's thin participation). Price is 9.3% above the 50W but still below the 200W—a reset-into-accumulation setup—with MACD bullish and improving and stochastic RSI falling neutral at 0.58. The thirteen-week return of 5.4% is modest, RS versus SPY is -9.0% (a laggard), and category-relative strength is essentially zero. NLR shows worse structural damage: compression near the 50W suggests indecision, stochastic RSI is overbought rolling over (a reversal tell), and thin volume confirms conviction is absent. URA's only real edge is that above-average volume suggests some buyer interest, whereas NLR's thin volume signals institutions are waiting for a clearer setup.
Nuclear Energy receives 5% tier-2 allocation despite failing eligibility filters (eligible: False), a decision driven by opportunity-cost logic in an AltSeason regime. The 33.9 final category score is the lowest among allocated categories, and the category-level macro fit (50.0/100) is neutral—AI growth sponsorship adds +5 for data-center power demand, but no other tailwind supports the narrative. Credit stress subtracts -5, offsetting the AI bid. Allocators are holding the 5% slot as a tactical entry: URA's above-average volume and improving MACD suggest accumulation into the -9% SPY-relative weakness, a mean-reversion bet that will pay if growth equities consolidate and utilities bounce on defensive flows. However, this is the weakest conviction in the portfolio. If URA breaks below support at 7.40 or if MACD rolls over, the allocator should exit immediately. The 5% is a hedge, not a core position.
Agriculture & Livestock — MOO
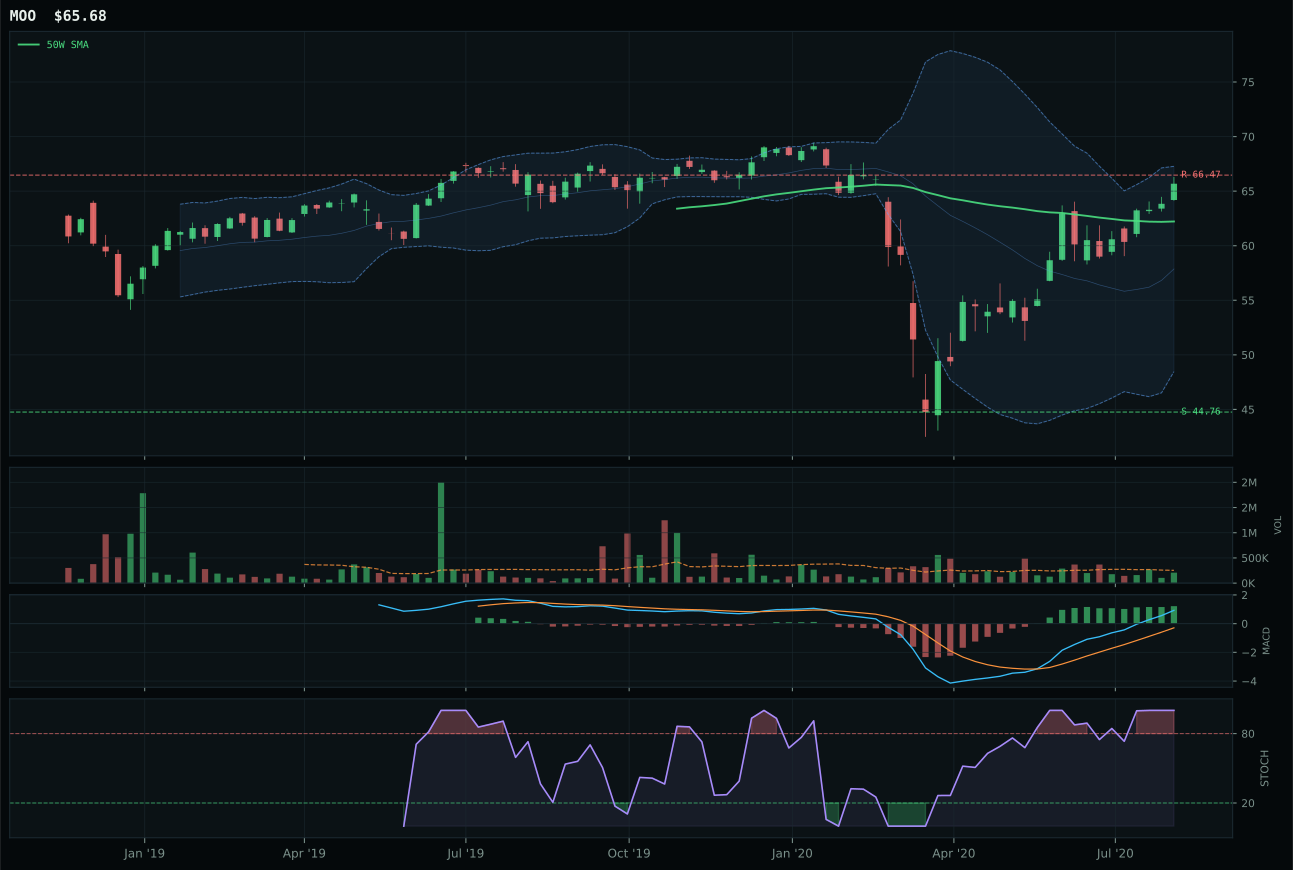
MOO has a neutral structure profile with 5.1% 13-week relative strength versus SPY.
A failed hold above support would weaken the setup.
Actionable but governed by invalidation levels.
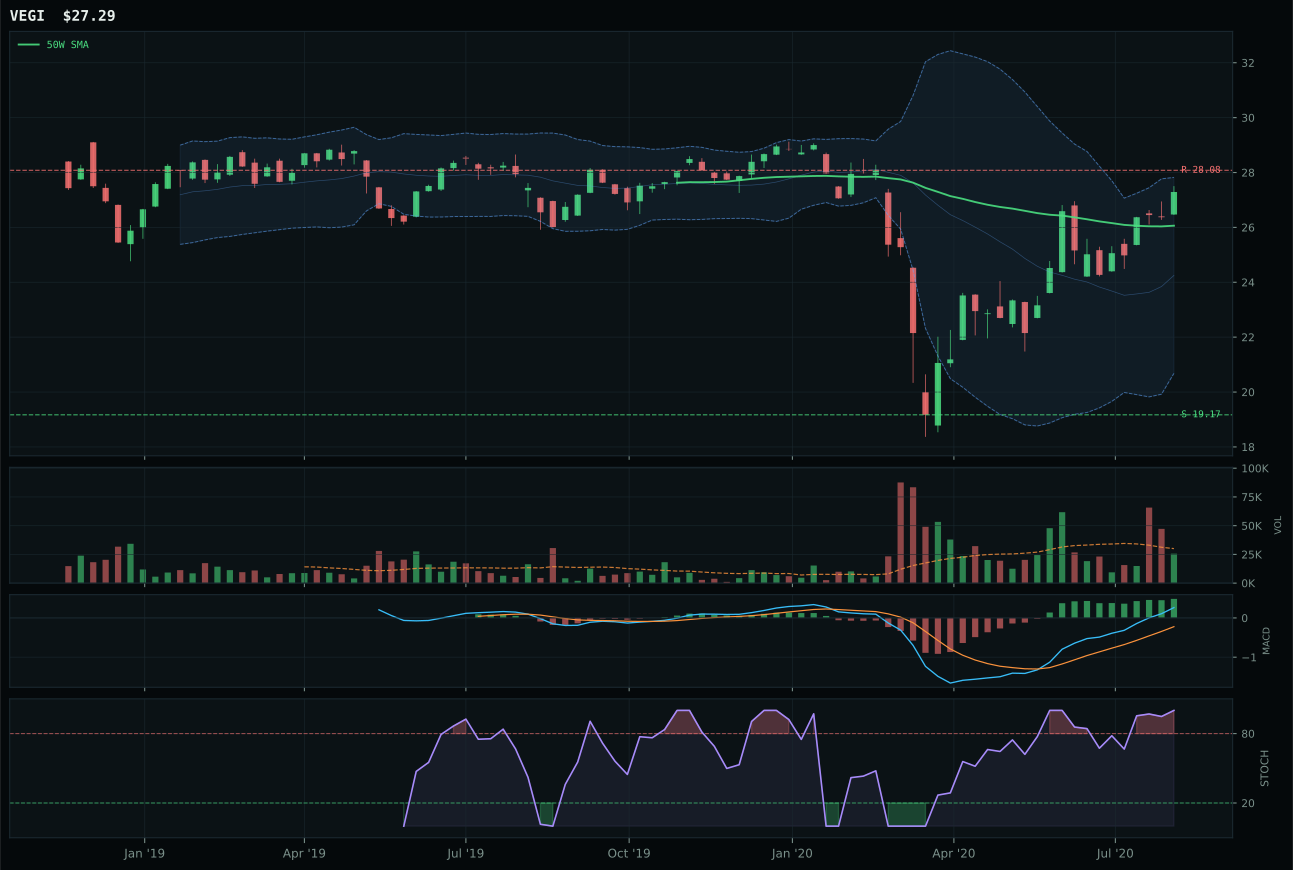
VEGI has a neutral structure profile with 2.5% 13-week relative strength versus SPY.
A failed hold above support would weaken the setup.
Tracked, but not top-2 eligible because: .
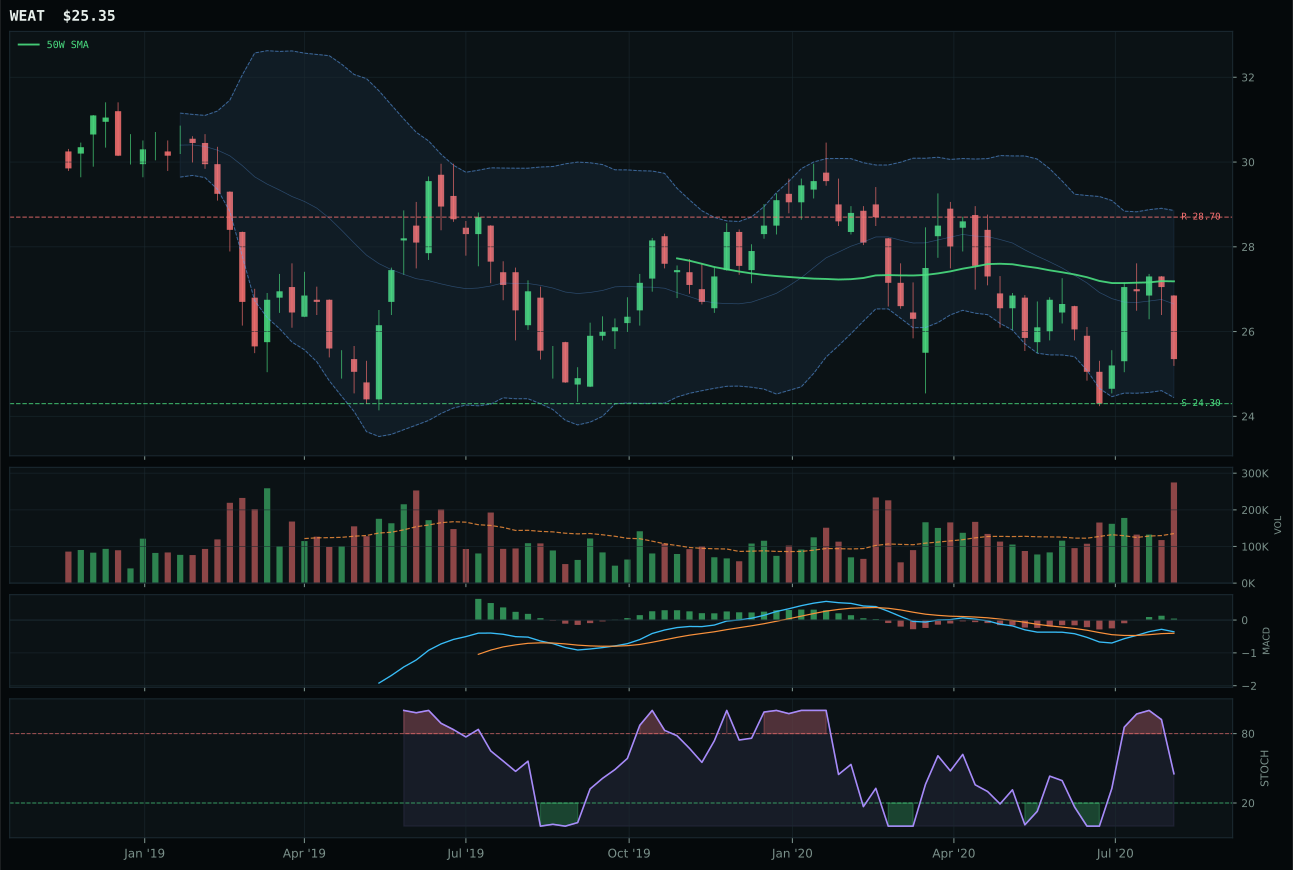
WEAT has a pullback into support profile with -20.0% 13-week relative strength versus SPY.
Extension and support failure are the main tactical risks.
Tracked, but not top-2 eligible because: structurally broken.
MOO dominates its category with an 84.3 composite score versus VEGI's 64.0, winning on pure technical merit: trend 100.0/100 (price above both 50W and 200W, 0.1% slope), structure 78.4/100 (clean neutral setup), timing 75.0/100 (only 5.6% above the 50W in upper retracement zone), and momentum confirmation 100.0/100 (19.5% thirteen-week return, MACD bullish and improving, 2.6% category-relative strength). Volume-price confirmation hits 81.0/100 with neutral participation at 0.82x the 20-week average, meaning buyers are neither panicking to enter nor exhausted from recent gains. VEGI loses because its structure is less clean at 73.1, category-relative strength is zero, and it does not show the same technical vigor. Yet neither ETF escapes a brutal macro headwind: disinflation pressure applies -8 to the entire 42.0/100 category macro fit, which alone explains why the category scores 14.5 and ranks below every allocated sleeve.
Agriculture & Livestock receives 0% allocation this week, ranked 9th or 10th and entirely excluded from the portfolio despite MOO's technical excellence. The 14.5 final category score reflects a fundamental macro mismatch: disinflation pressure is active and cuts -8 from category macro fit, and neither AI growth sponsorship nor monetary hedge bid offers support for agricultural producers. MOO's technical setup is pristine—genuinely one of the cleanest setups in the portfolio—but it is facing macro headwinds that overwhelm pattern quality. In an AltSeason regime with Goldilocks backdrop, allocators have shifted risk appetite to growth narratives (AI, metals scarcity, infrastructure capex) and away from commodity-adjacent equities. For this category to earn even a 5% tier-2 slot next week, either disinflation pressure would need to flip inactive or food security / supply-chain narratives would need to activate. Until then, MOO's technical correctness cannot overcome macro exclusion.
Traditional Energy — XLE
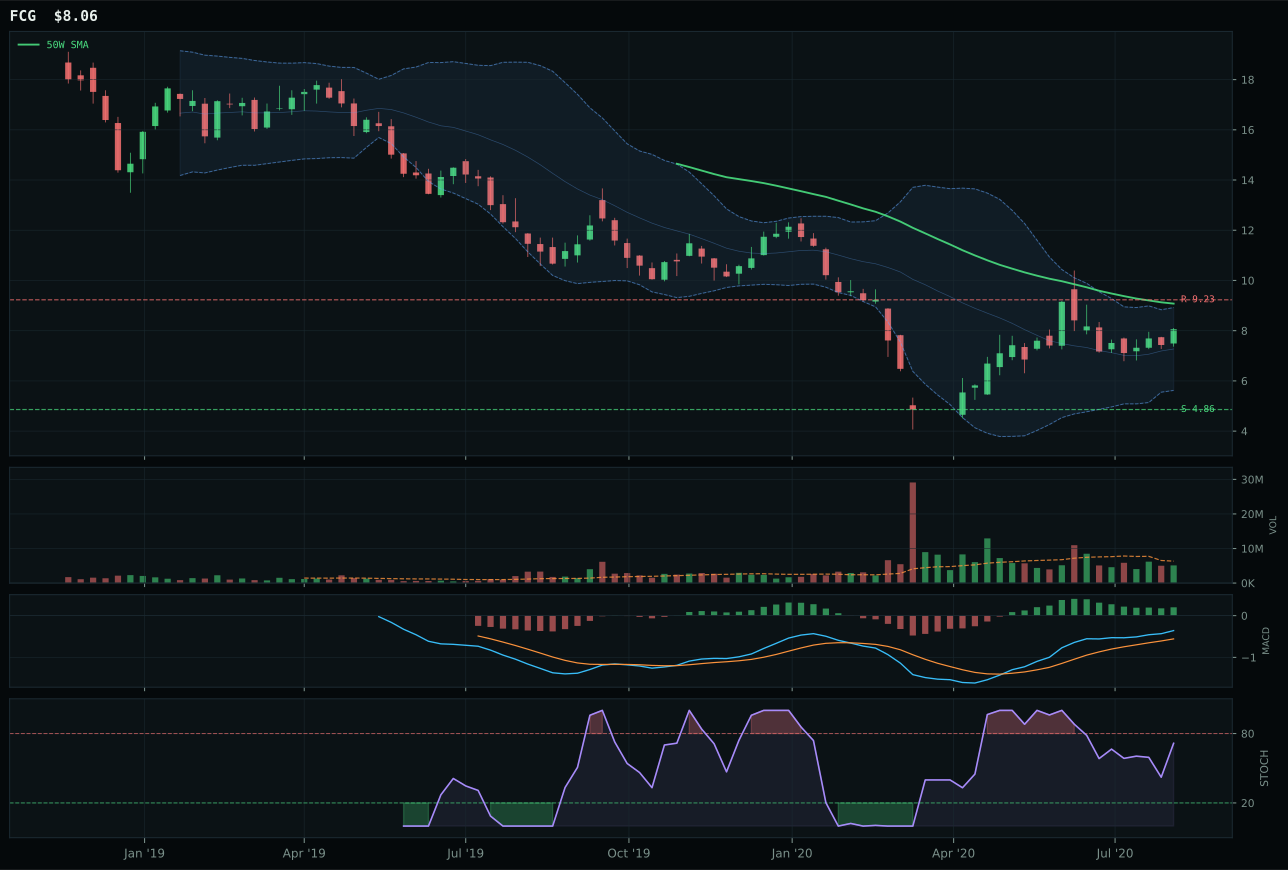
FCG has a neutral structure profile with -5.8% 13-week relative strength versus SPY.
Extension and support failure are the main tactical risks.
Tracked, but not top-2 eligible because: structurally broken.
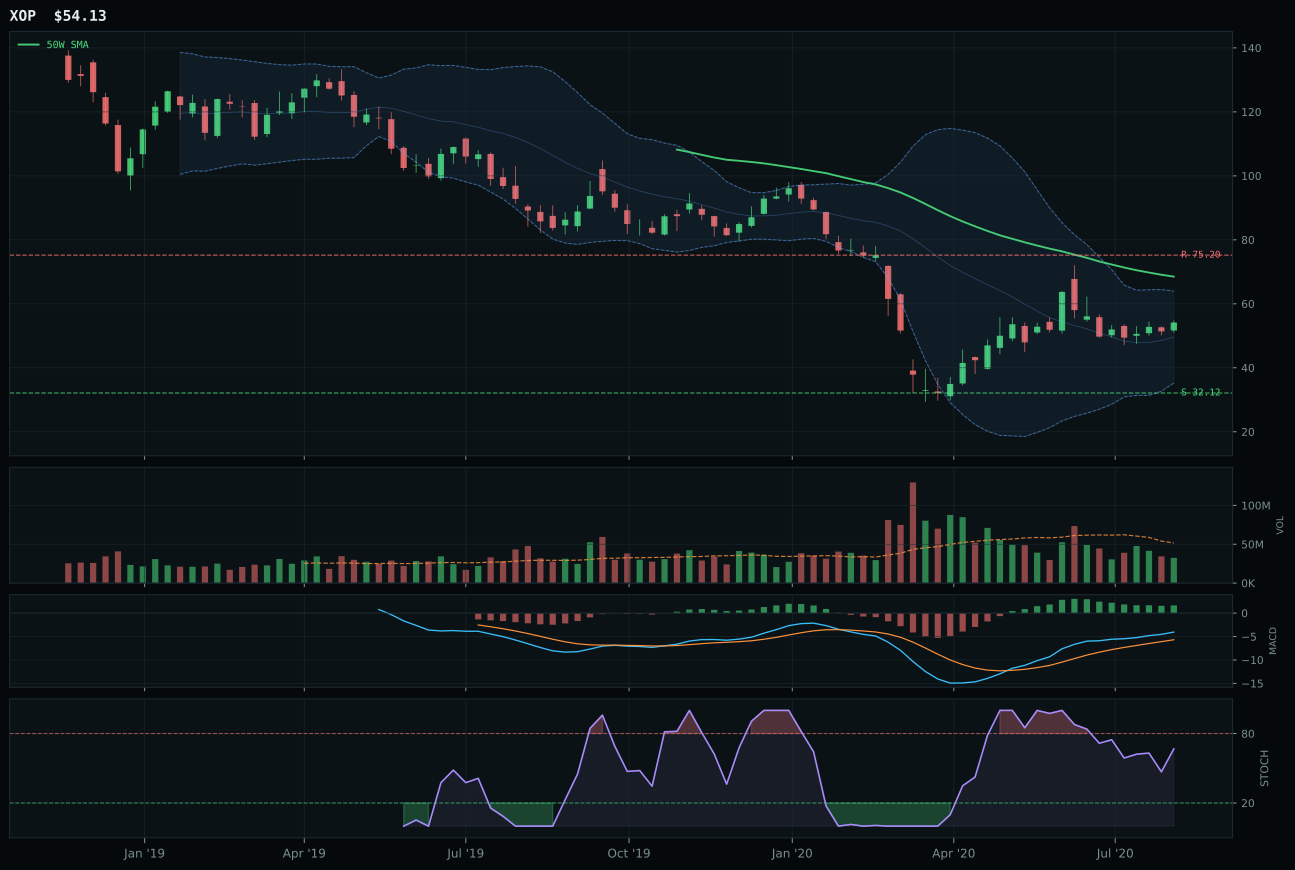
XOP has a neutral structure profile with -13.4% 13-week relative strength versus SPY.
Extension and support failure are the main tactical risks.
Tracked, but not top-2 eligible because: structurally broken.
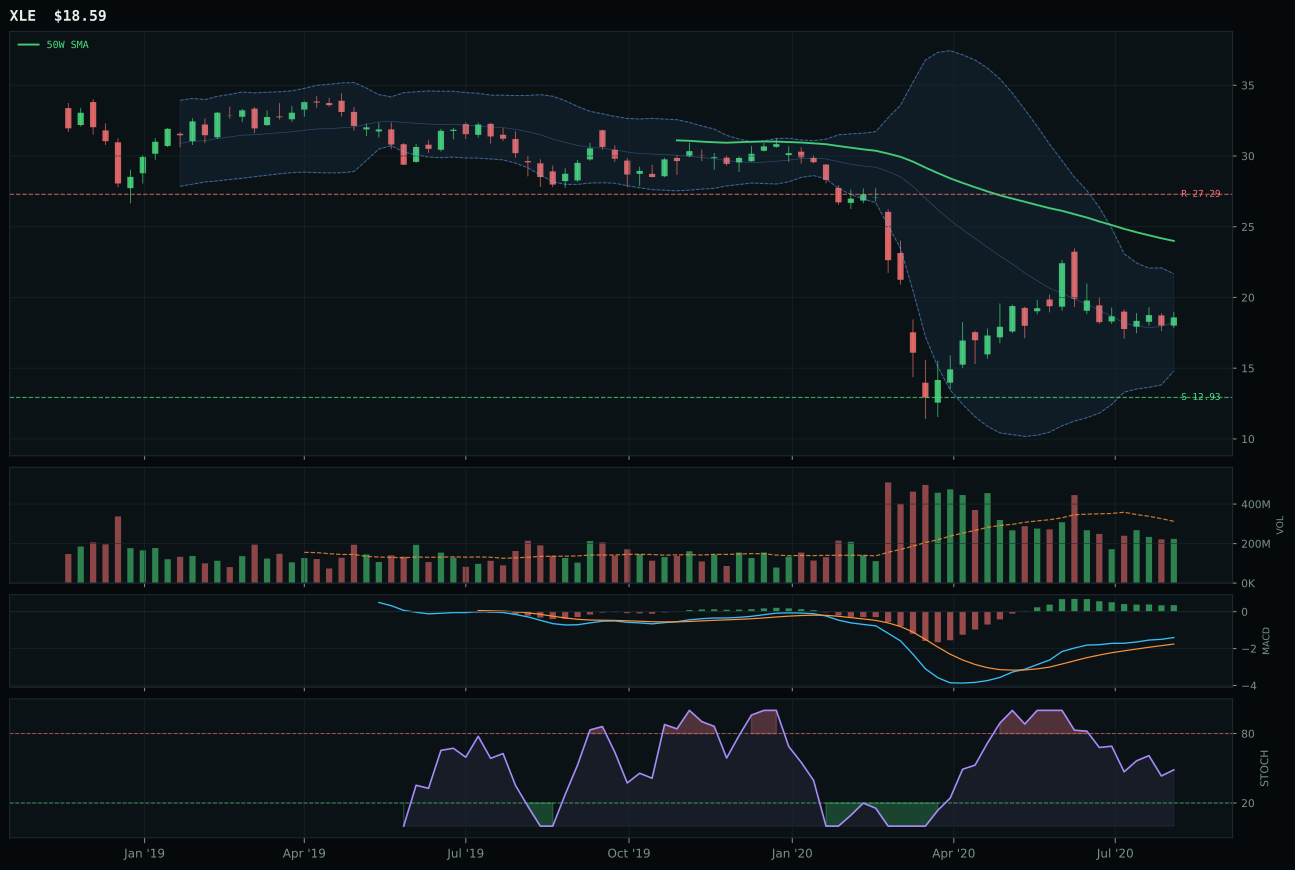
XLE has a neutral structure profile with -18.5% 13-week relative strength versus SPY.
Extension and support failure are the main tactical risks.
Tracked, but not top-2 eligible because: structurally broken.
XLE wins by default in a category that failed eligibility filters: composite score 0, trend 26.0/100 (price below both 50W and 200W), momentum confirmation 17.4/100 (thirteen-week return -4.1%, RS versus SPY -18.5%, MACD bullish but flattening). This is structural damage. Price sits 22.5% below the 50W in the deep retracement / value zone near Fib 0.618, and while the Fib-zone location is theoretically supportive, stochastic RSI is falling neutral at 0.49—not yet oversold, but deteriorating. XLE wins over FCG (41.6 reasoned ETF score vs XLE's 11.1) only because FCG's timing deteriorates further and support/resistance ratios are equally poor. Volume at 0.72x the 20-week average is thin, confirming that conviction is absent. The thirteen-week return of -4.1% while SPY gained 5%+ is the clearest sign that disinflation pressure (-10) and credit stress (-7) are driving structural exclusion, not tactical weakness.
Traditional Energy receives 0% allocation this week, entirely excluded from the portfolio after failing eligibility filters. The 0.0 final category score is not a math error; it is the system's verdict that no energy ETF meets minimum technical or macro criteria for inclusion. Disinflation pressure is active (-10), which directly penalizes extraction economics, and credit stress is active (-7), which compounds refinancing risk. Even in a Goldilocks regime, energy trades as a disinflation hedge and growth hedge, roles it cannot fulfill when both tailwinds are absent. XLE's technical decay—negative thirteen-week return, below both moving averages, stochastic falling—confirms that macro exclusion is appropriate. For energy to re-enter the allocation, either disinflation pressure would flip inactive (implying inflation expectations returning) or a new macro catalyst (geopolitical supply shock, demand surprise) would need to overwrite the current regime. Until then, the zero allocation is correct.