
2020-07-31
Informational purposes only. The content in this report, including allocations, analysis, and commentary, is provided solely for informational and educational purposes. It does not constitute financial advice, investment advice, trading advice, or any other type of advice. Past performance does not guarantee future results. Always conduct your own research and consult a qualified financial professional before making investment decisions.
Some tracked tickers were excluded due to missing live weekly price data: SGOV: Historical cache SGOV has only 9 usable weekly bars; URNM: Historical cache URNM has only 35 usable weekly bars
Weekly Allocation
| Ticker | Category | Weight | Role |
|---|---|---|---|
| FBTC | 50% | Overlay | |
| SLV | Precious Metals | 10% | Top-2 (10%) |
| CIBR | Technology | 10% | Top-2 (10%) |
| SMH | AI | 5% | Tier-2 (5%) |
| XLU | Utilities & Infrastructure | 5% | Tier-2 (5%) |
| XAR | Defense & Aerospace | 5% | Tier-2 (5%) |
| REMX | Industrial Metals | 5% | Tier-2 (5%) |
| URA | Nuclear Energy | 5% | Tier-2 (5%) |
| XLE | Traditional Energy | 5% | Tier-2 (5%) |
Trade Instructions — Monday Open
Sell the tranche from 2020-07-03 (completing its 4-week hold). Buy the new tranche. Instructions show net portfolio changes — same-asset positions cancel, weight changes show the delta.
| Action | Ticker | Instruction |
|---|---|---|
| SELL | IGV | Sell 67% of IGV position (reduce 7.50% → 2.50%) |
| SELL | SMH | Sell 30% of SMH position (reduce 12.50% → 8.75%) |
| SELL | GLD | Sell entire GLD position (2.50% of portfolio) |
| SELL | XAR | Sell 12% of XAR position (reduce 10.00% → 8.75%) |
| SELL | XLU | Sell 17% of XLU position (reduce 7.50% → 6.25%) |
| SELL | XLE | Sell 25% of XLE position (reduce 5.00% → 3.75%) |
| SELL | URA | Sell 17% of URA position (reduce 7.50% → 6.25%) |
| SELL | COPX | Sell 33% of COPX position (reduce 7.50% → 5.00%) |
| BUY | SLV | Buy SLV — 13.33% of freed cash (adds 2.50% to portfolio) |
| BUY | CIBR | Buy CIBR — 13.33% of freed cash (adds 2.50% to portfolio) |
| BUY | REMX | Buy REMX — 6.67% of freed cash (adds 1.25% to portfolio) |
| BUY | FBTC | Buy FBTC — 66.67% of freed cash (adds 12.50% to portfolio) |
Current Portfolio After Trade
Combined holdings across all 4 active tranches. Each tranche is 25% of the portfolio.
| Ticker | % of Portfolio | Weight Bar |
|---|---|---|
| SLV | 15.00% | |
| FBTC | 12.50% | |
| XAR | 8.75% | |
| SMH | 8.75% | |
| MOO | 7.50% | |
| CIBR | 7.50% | |
| XLU | 6.25% | |
| URA | 6.25% | |
| COPX | 5.00% | |
| XLK | 5.00% | |
| BOTZ | 5.00% | |
| XLE | 3.75% | |
| REMX | 3.75% | |
| IGV | 2.50% | |
| INDA | 2.50% |
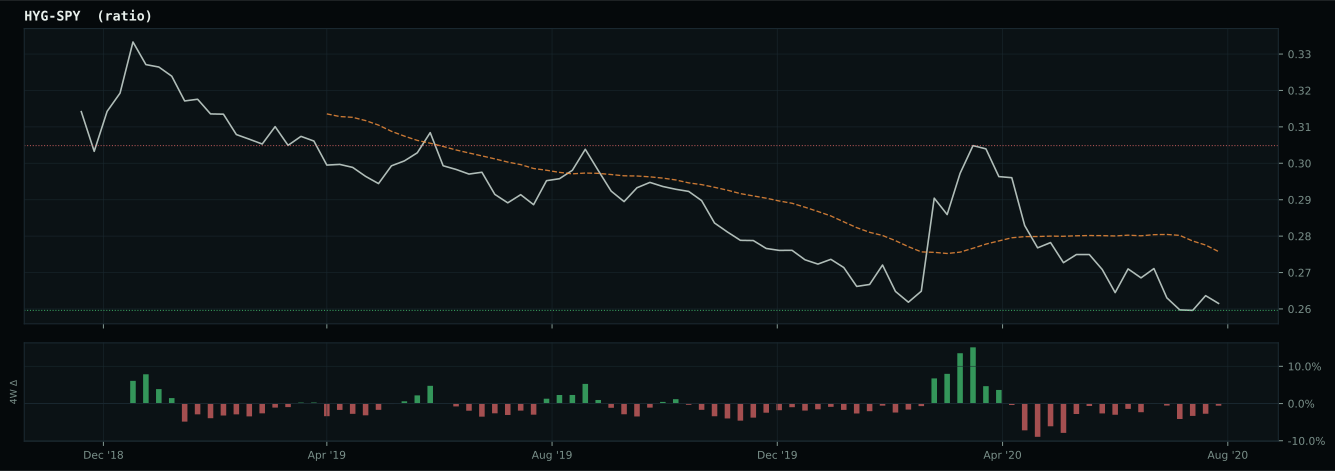
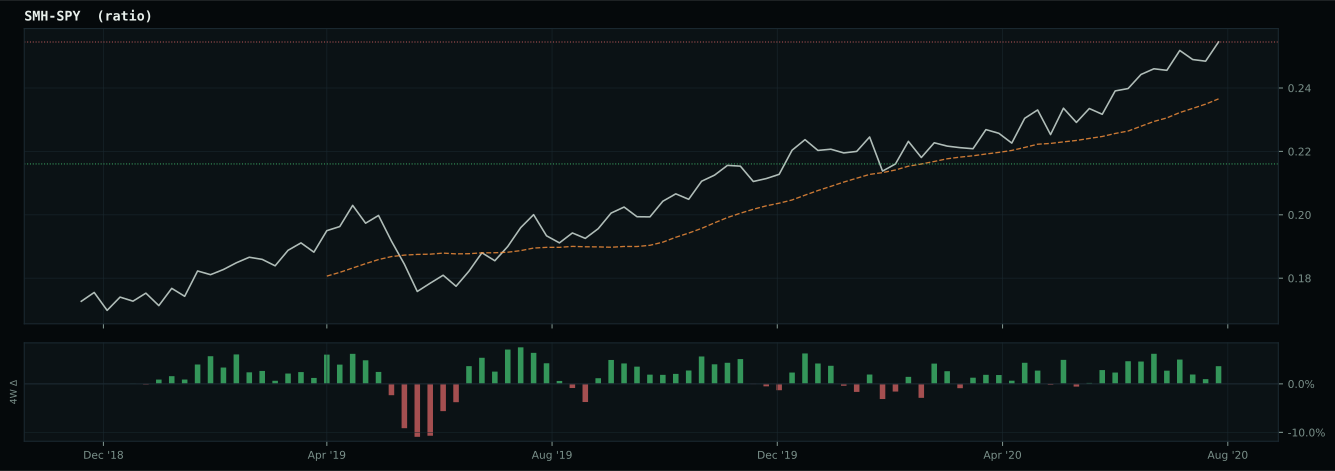
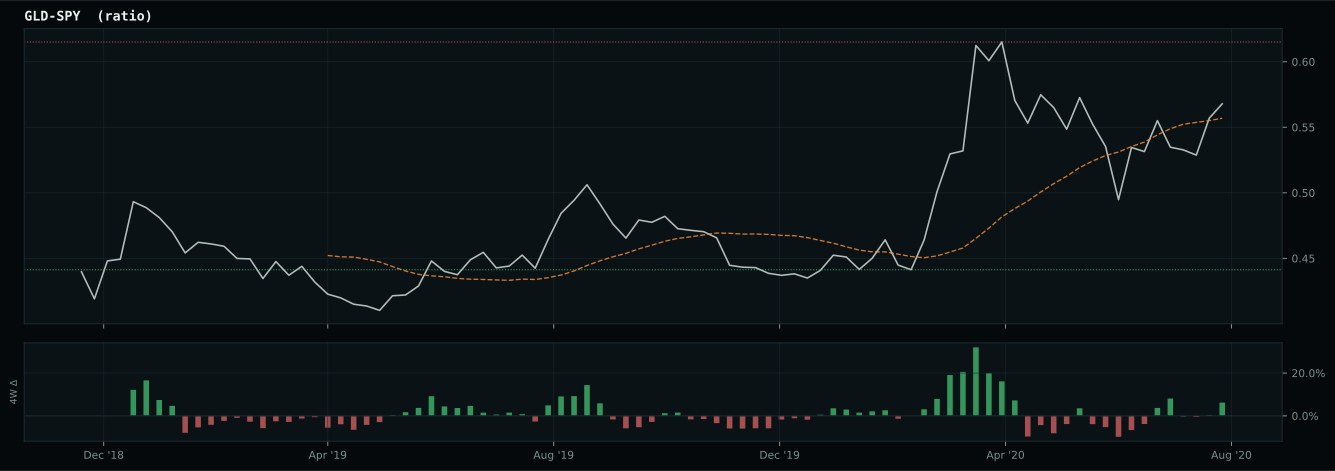
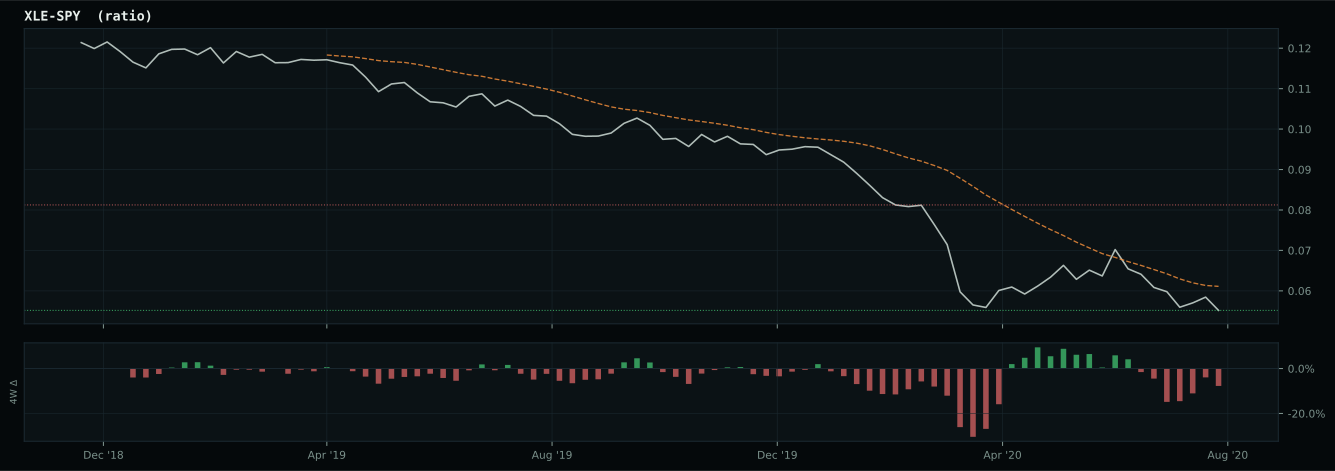
Macro Regime — Disinflation
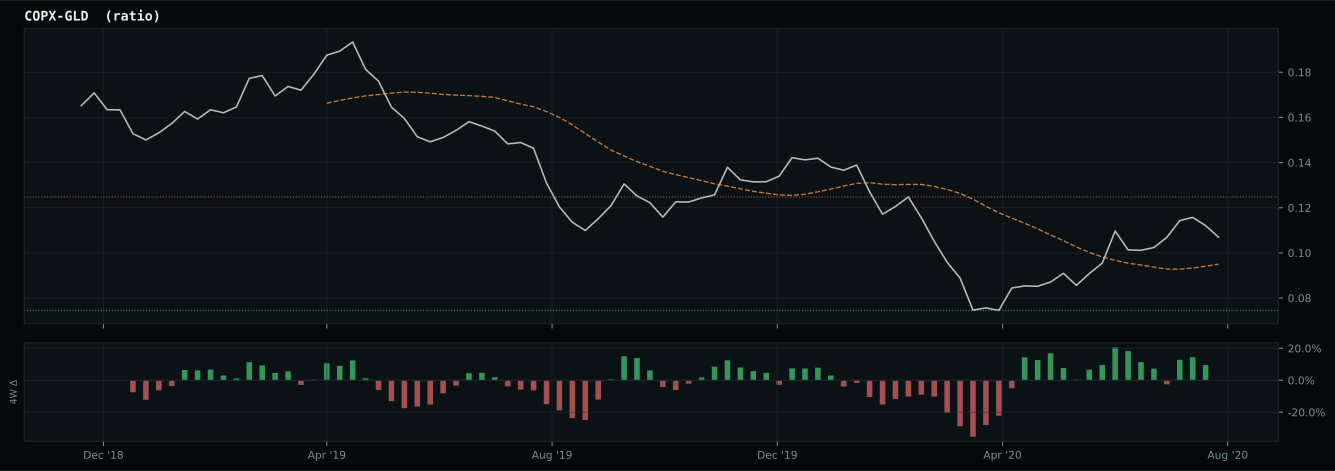
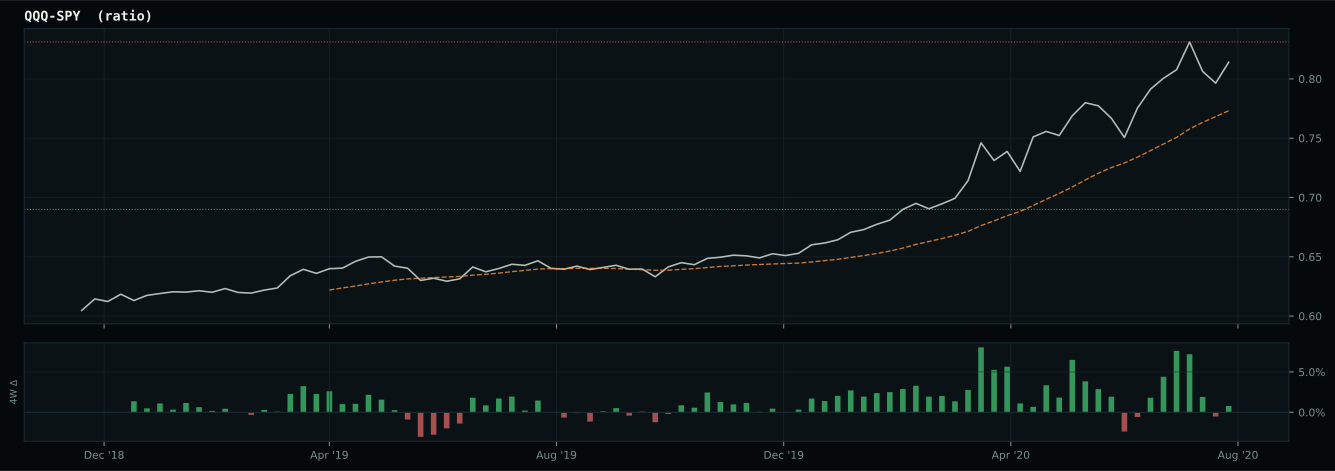
Macro Evidence Charts
Market-implied signals behind the macro regime scores. Each ratio compares two assets; the direction and slope of the ratio is what the macro engine reads.
Crypto Regime — TrendBTC
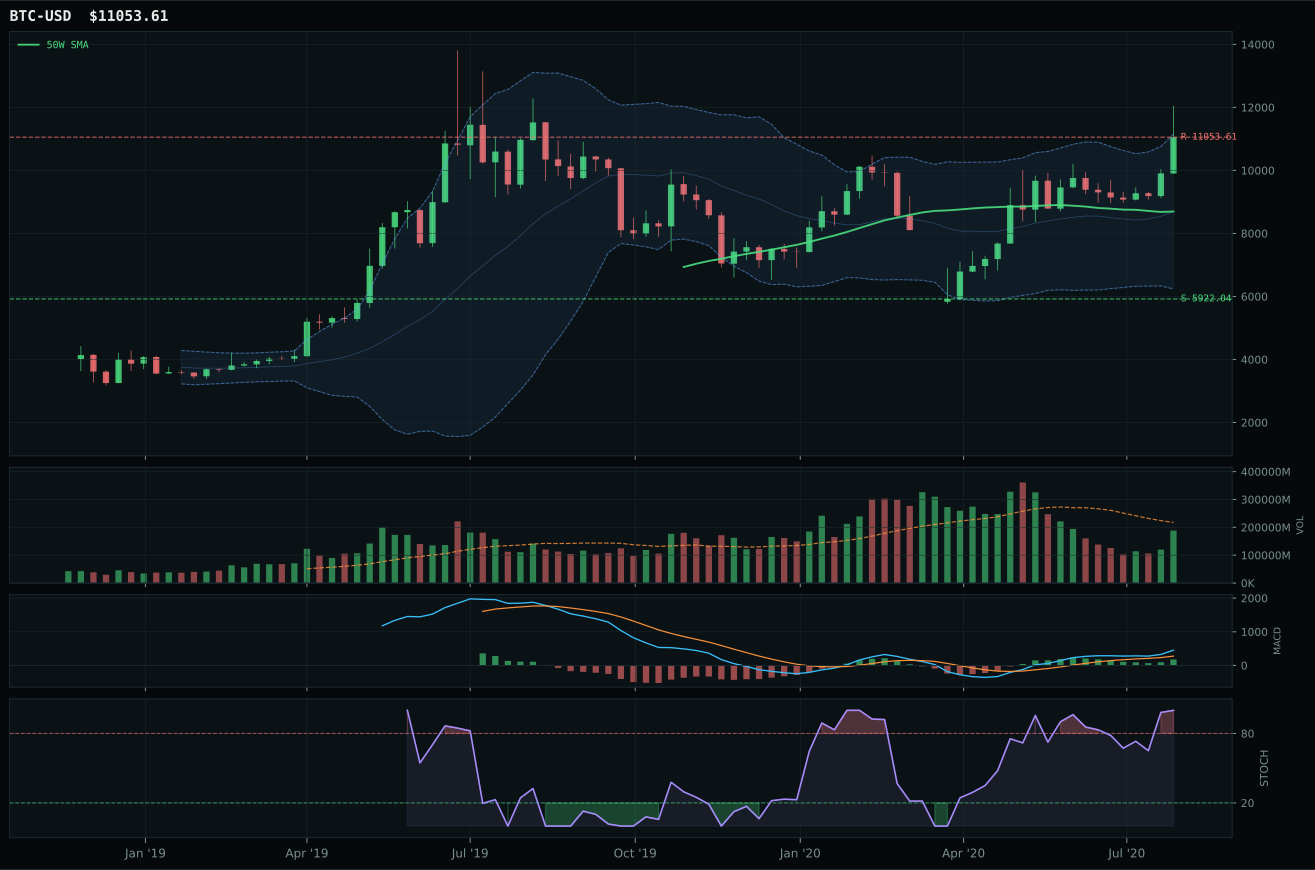
post-touch structure is too wide to count as a range; max/min close ratio is 1.84
TrendBTC confirmed: 2 consecutive closes above rising/flat 50W SMA
one or more available conditions failed

Category Rankings
| Rank | Category | Winner | Score | Alloc | 4W Ret | Peers (4W) |
|---|---|---|---|---|---|---|
| 1 | Precious Metals | SLV | 74.2 | 20% | +15.27% | GDX -0.9% · GLD -0.1% |
| 2 | Technology | CIBR | 65.7 | 20% | +0.89% | IGV +8.8% · XLK +10.5% |
| 3 | AI | SMH | 52.2 | 10% | +4.64% | BOTZ +6.2% · AIQ +7.9% |
| 4 | Utilities & Infrastructure | XLU | 47.5 | 10% | -2.98% | PAVE +8.7% · IGF +1.4% |
| 5 | Defense & Aerospace | XAR | 41.9 | 10% | +6.37% | ROKT +6.9% · ITA +7.9% |
| 6 | Industrial Metals | REMX | 34.6 | 10% | +2.56% | COPX +10.0% · PICK +5.6% |
| 7 | Nuclear Energy | URA | 31.5 | 10% | +8.77% | NLR +1.0% |
| 8 | Emerging Markets | INDA | 28.7 | 10% | +5.57% | IEMG +3.1% · ILF -2.8% |
| 9 | Agriculture & Livestock | MOO | 13.2 | 0% | +6.39% | VEGI +9.5% · WEAT +3.7% |
| 10 | Traditional Energy | XLE | — | 0% | +1.30% | FCG +2.9% · XOP +2.6% |
Precious Metals — SLV
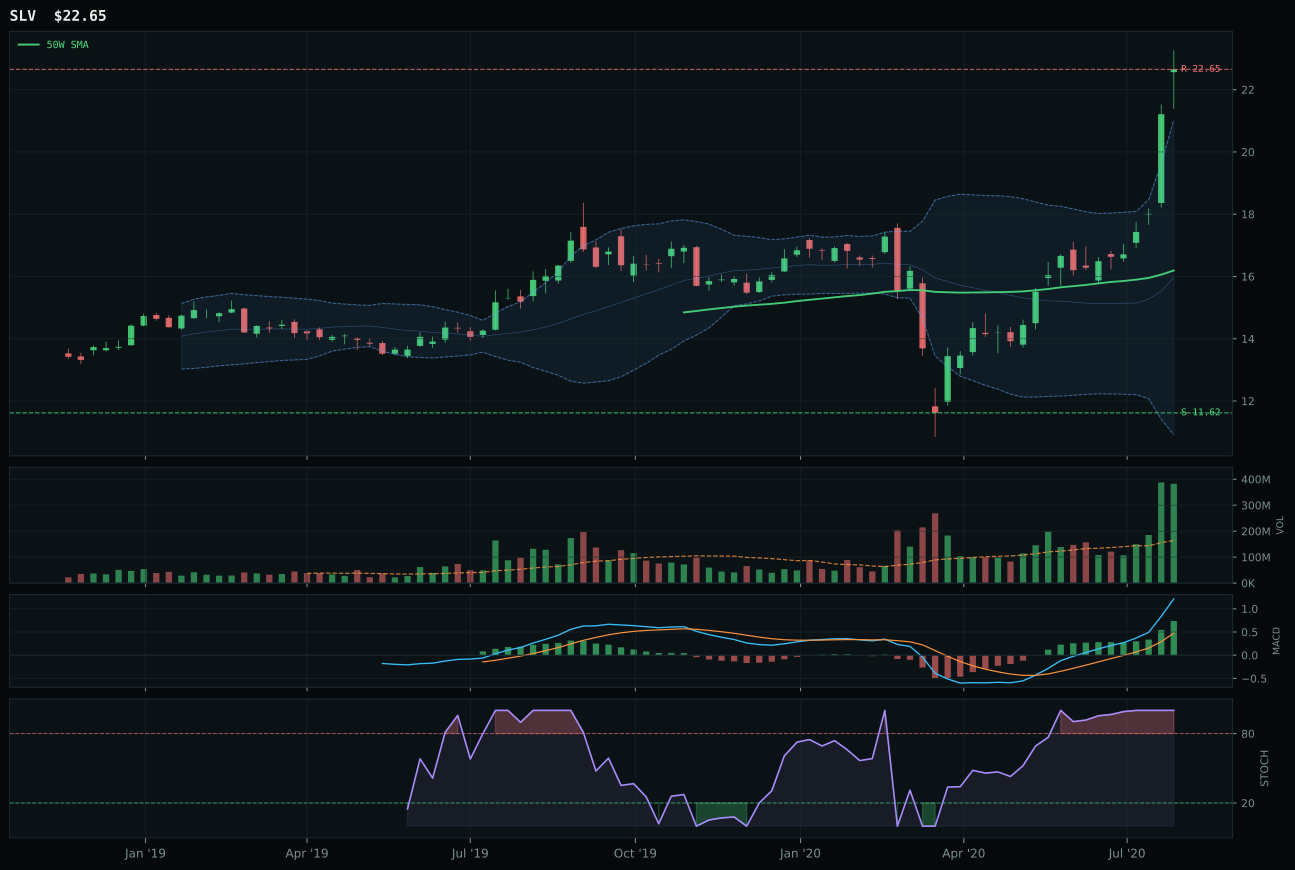
SLV has a vertical extension profile with 47.3% 13-week relative strength versus SPY.
A failed hold above support would weaken the setup.
Actionable but governed by invalidation levels.
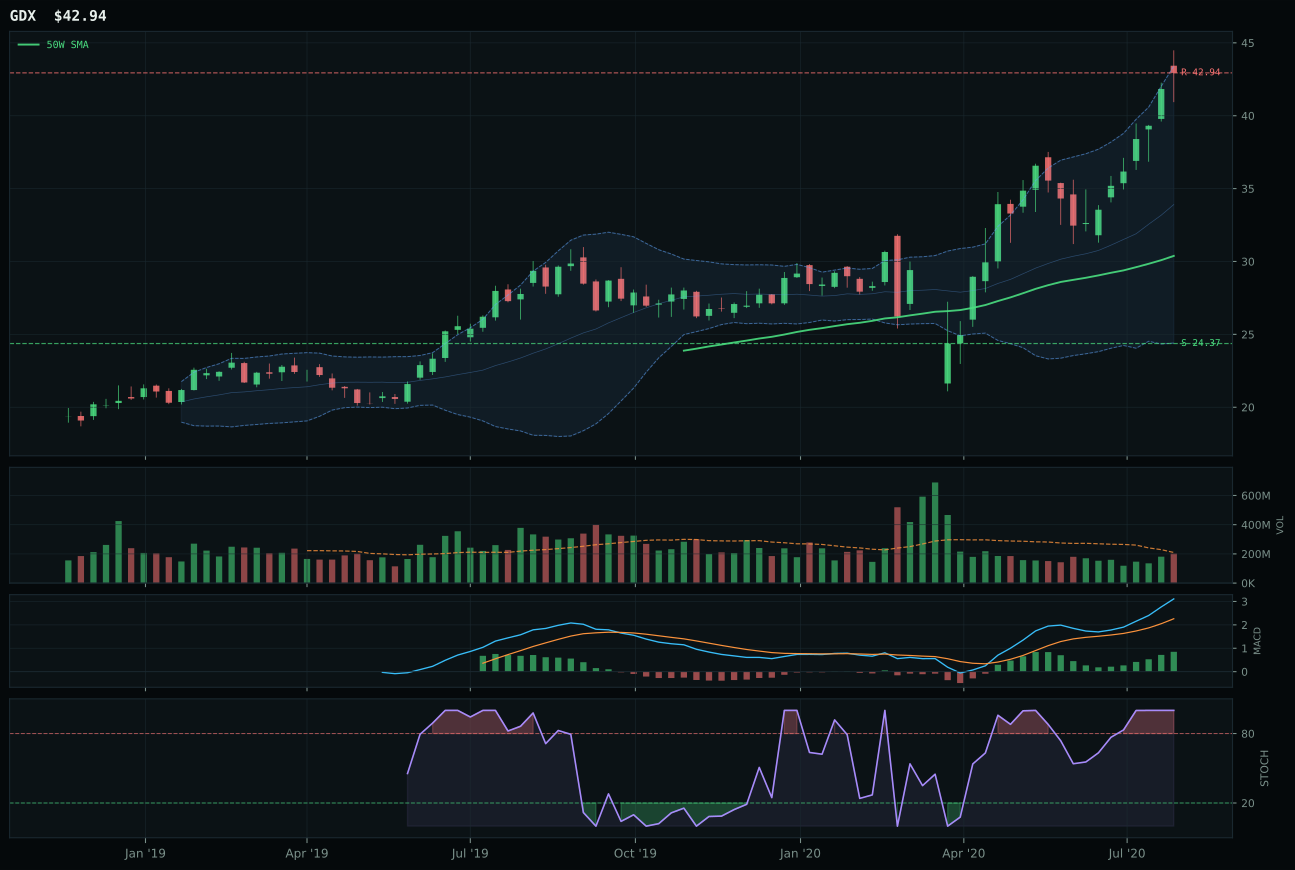
GDX has a vertical extension profile with 13.5% 13-week relative strength versus SPY.
A failed hold above support would weaken the setup.
Actionable but governed by invalidation levels.
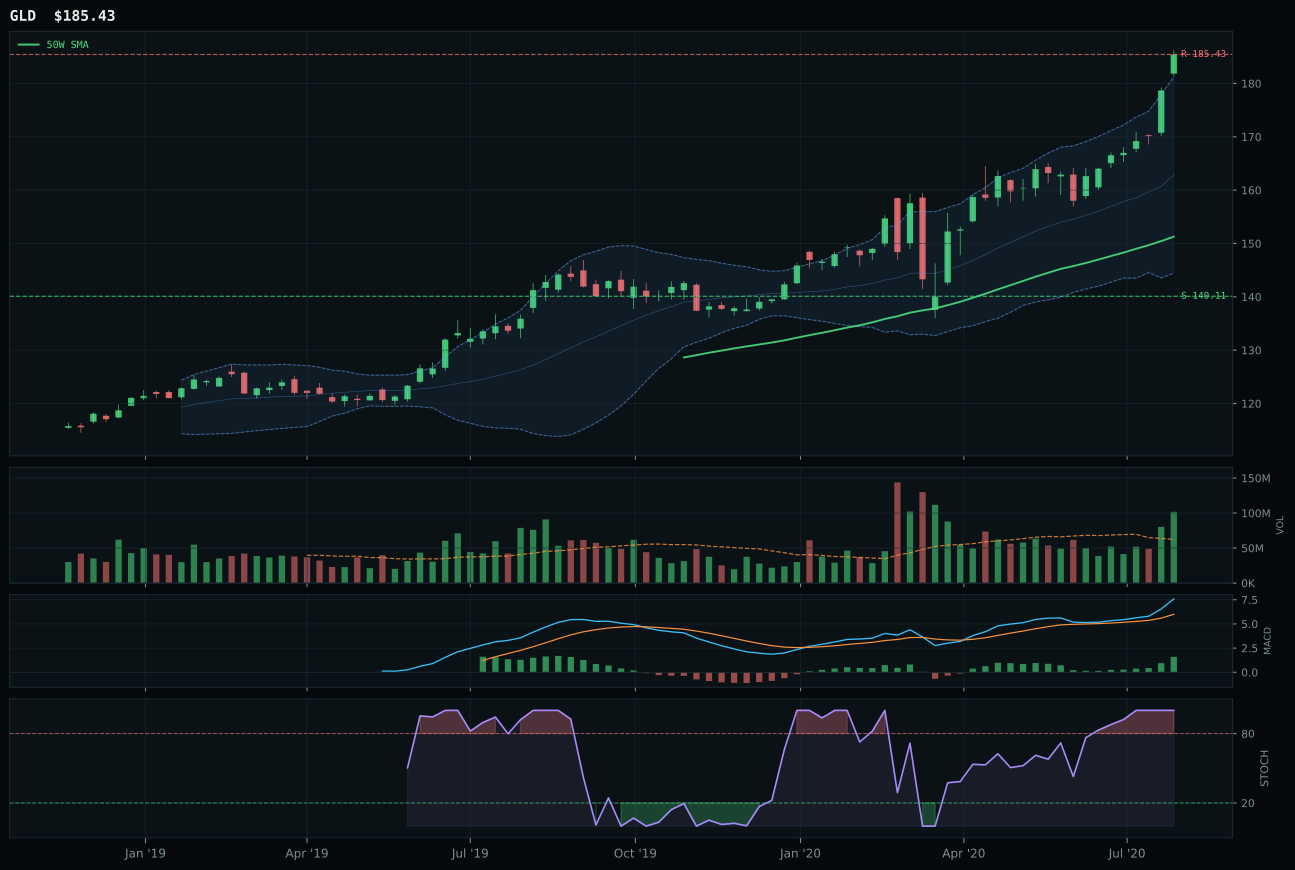
GLD has a vertical extension profile with 0.6% 13-week relative strength versus SPY.
A failed hold above support would weaken the setup.
Actionable but governed by invalidation levels.
SLV wins Precious Metals decisively and claims a top-2 overweight slot with a 10% allocation, driven by exceptional relative strength, perfect technical sponsorship, and a 33.7% category-relative strength advantage over GDX. The setup is a vertical extension at 39.9% above the 50W moving average, and here is where SLV differs fundamentally from similar extensions in Technology or AI: volume is 2.33x the 20W average, showing accumulation confirmation rather than mere momentum chase. MACD is bullish and improving—not flattening—and stochastic RSI overbought momentum is backed by a 62.7% 13-week return and 47.3% SPY-relative strength that suggests real capital is rotating into the trade. Against GDX, which offers only 13.5% SPY-relative strength and neutral volume participation, SLV's category dominance is absolute. The structure score of 89.3/100 reflects vertical purity and cleanliness of 91.7%, meaning there are no competing demand zones below; support sits at 11.62 and the 50W at 14.41. The 100.0 persistence and volume-price confirmation scores indicate this is not a one-week pop—the move has institutional backing.
Precious Metals earns the second-highest allocation at 10% as one of the two top-2 categories with a final score of 74.2, just 0.8 points behind Technology. The metals scarcity descriptor is active at +7, disinflation pressure is active at +6, and disinflation itself provides a +8 tailwind, creating a macro environment where hard assets and currency hedges are in favor. SLV's technical evidence of 100.0/100 is extraordinary—perfect trend, perfect momentum confirmation, perfect volume-price sponsorship—and while its macro/narrative fit of 52.0/100 is moderate due to some credit stress headwind, the 62% technical weighting dominates. The category's placement reflects a genuine risk-off tone embedded in a disinflation regime where central bank liquidity support is likely and real yields are negative. Metals are outperforming equities, and silver's hybrid monetary and industrial beta makes it the most leveraged play to both deflation hedging and any cyclical recovery. The 10% allocation is justified; to upgrade would require SLV to break above the 22.65 resistance and hold it with volume expansion.
Technology — CIBR
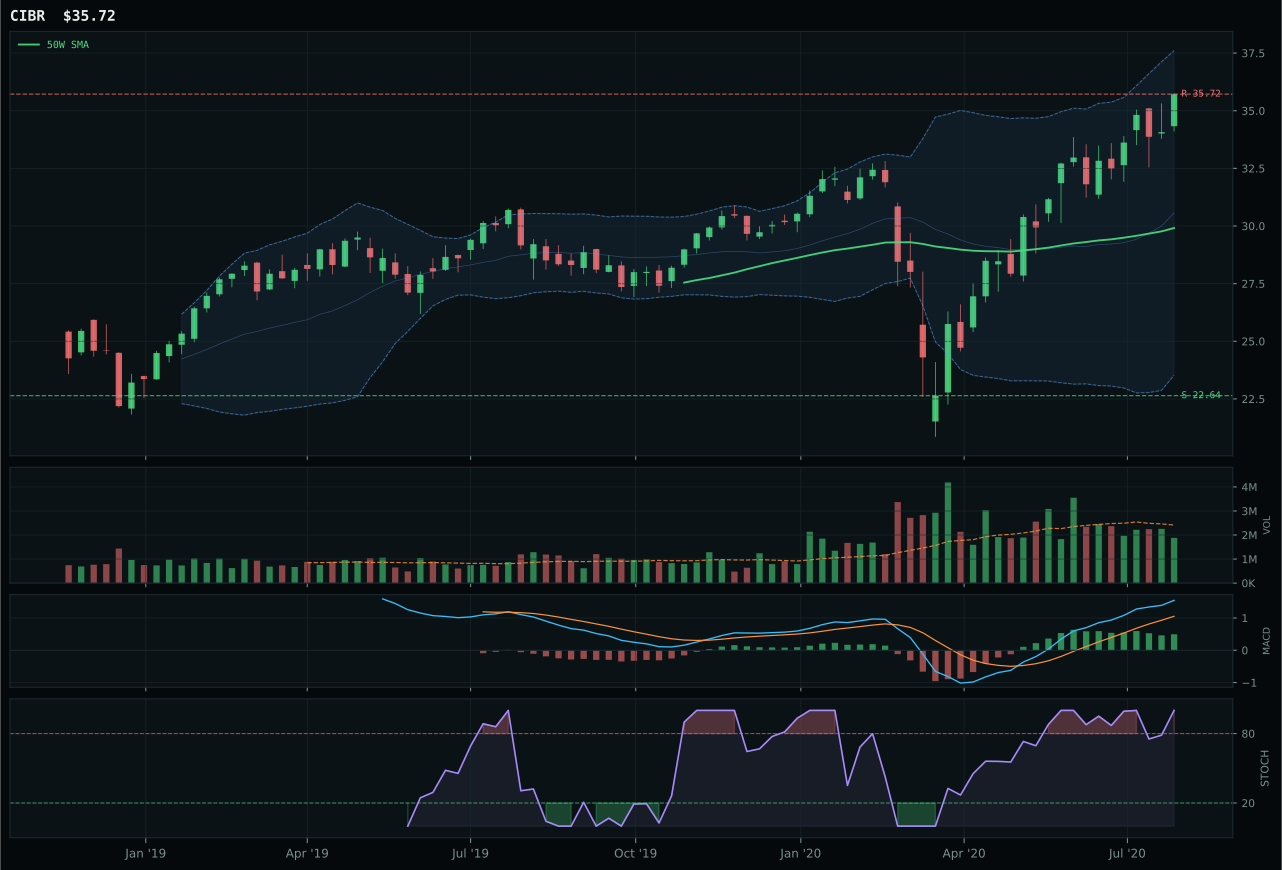
CIBR has a vertical extension profile with 12.4% 13-week relative strength versus SPY.
A failed hold above support would weaken the setup.
Actionable but governed by invalidation levels.
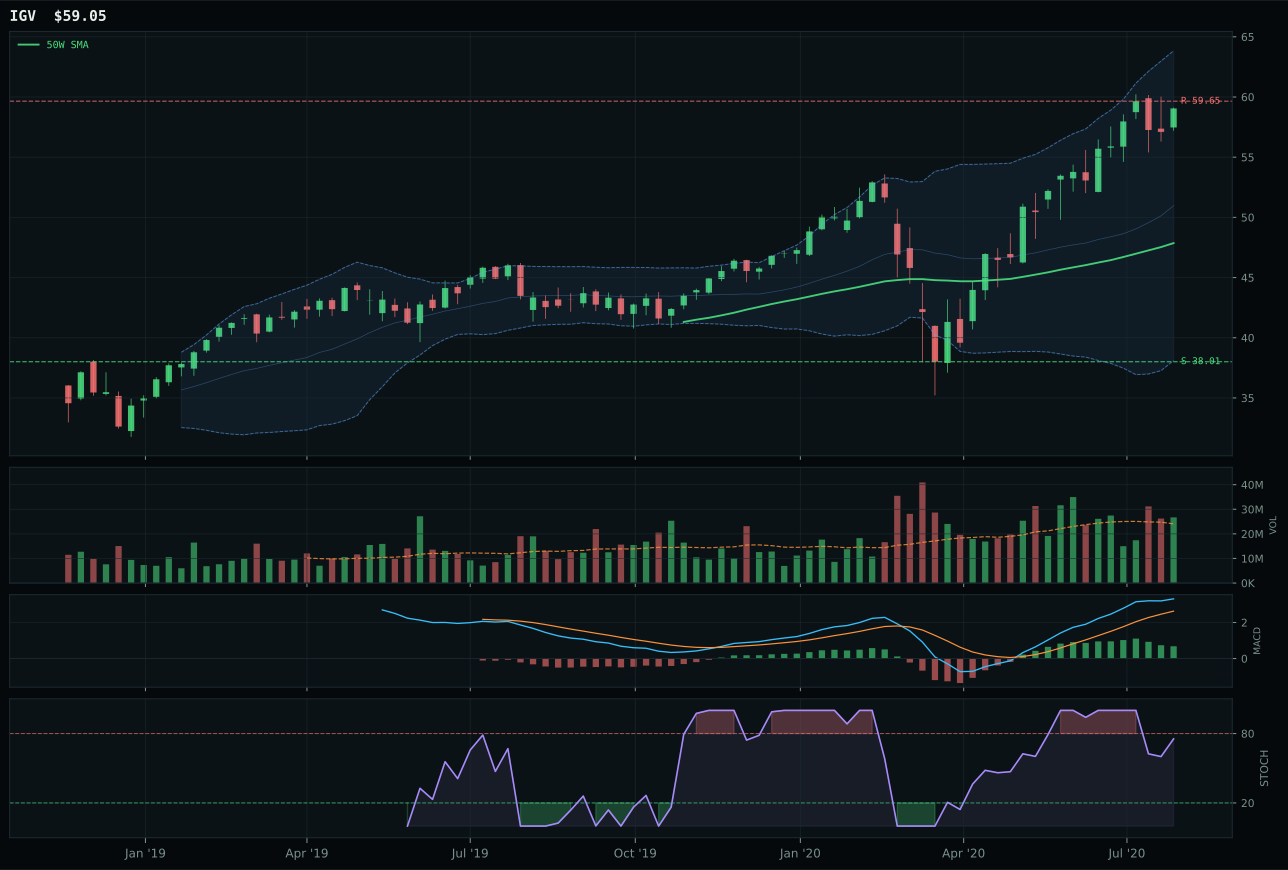
IGV has a vertical extension profile with 11.0% 13-week relative strength versus SPY.
A failed hold above support would weaken the setup.
Actionable but governed by invalidation levels.
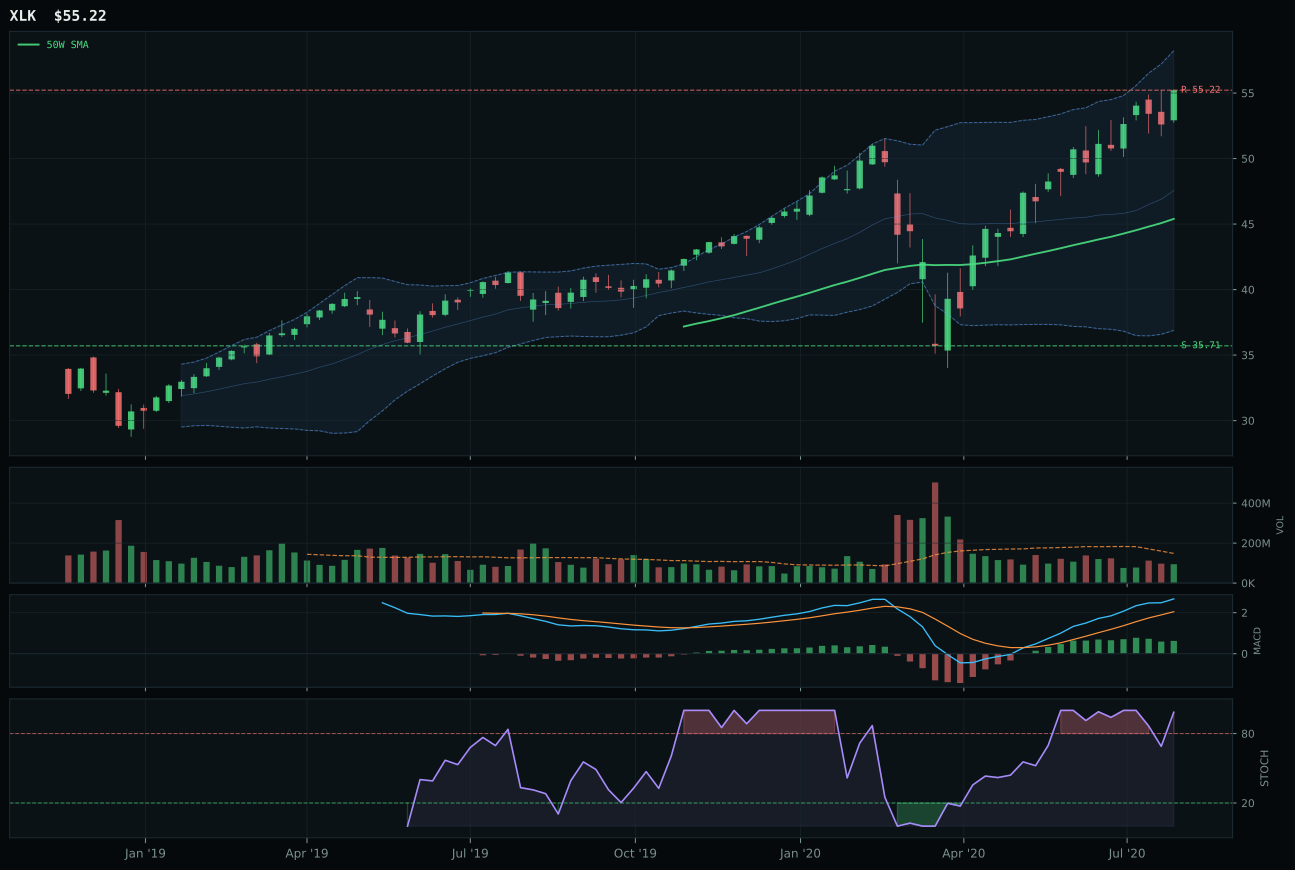
XLK has a vertical extension profile with 8.8% 13-week relative strength versus SPY.
A failed hold above support would weaken the setup.
Actionable but governed by invalidation levels.
CIBR wins the Technology category with a 1.4% relative strength advantage within its peer set, capturing cybersecurity's steadier positioning within the broader tech rally. The setup is a vertical extension at 19.4% above the 50W moving average, where MACD remains bullish but is beginning to flatten and stochastic RSI shows overbought momentum—a classic late-stage accumulation pattern that penalizes entry timing even as trend and momentum confirm the move is real. Against IGV's enterprise software exposure, CIBR's category-relative strength of 1.4% versus IGV's flat 0.0% proved decisive; IGV's flattening MACD and falling stochastic RSI suggest the institutional buying has peaked, while CIBR's neutral volume at 0.78x the 20W average indicates the move is still being held rather than aggressively distributed. The 13-week return of 27.9% and SPY-relative strength of 12.4% confirm CIBR is the preferred vehicle, though at 19.4% extension the upside reward to resistance is effectively zero and downside to support spans 57.8%.
Technology earns a 10% allocation as the second-highest-ranked category this week, benefiting from a final score of 65.7 that positions it just below Precious Metals. Risk appetite remains positive in the disinflation regime, and the AI growth sponsorship descriptor is active across the basket, supporting software and semiconductor infrastructure plays. However, the category's rank reflects a genuine tension: credit stress and liquidity stress are both active, creating headwinds that prevent Technology from claiming a top-2 slot despite clean trend structure and strong 13-week momentum. Disinflation itself helps this category, providing tailwinds for secular growth narratives, but the extended valuations and deteriorating volume-price confirmation in both CIBR and IGV suggest the market is pricing in perfection. To reclaim a higher position would require either a meaningful reset in price-to-50W distance or evidence that breadth inside the category is broadening rather than concentrating in the three names evaluated.
AI — SMH
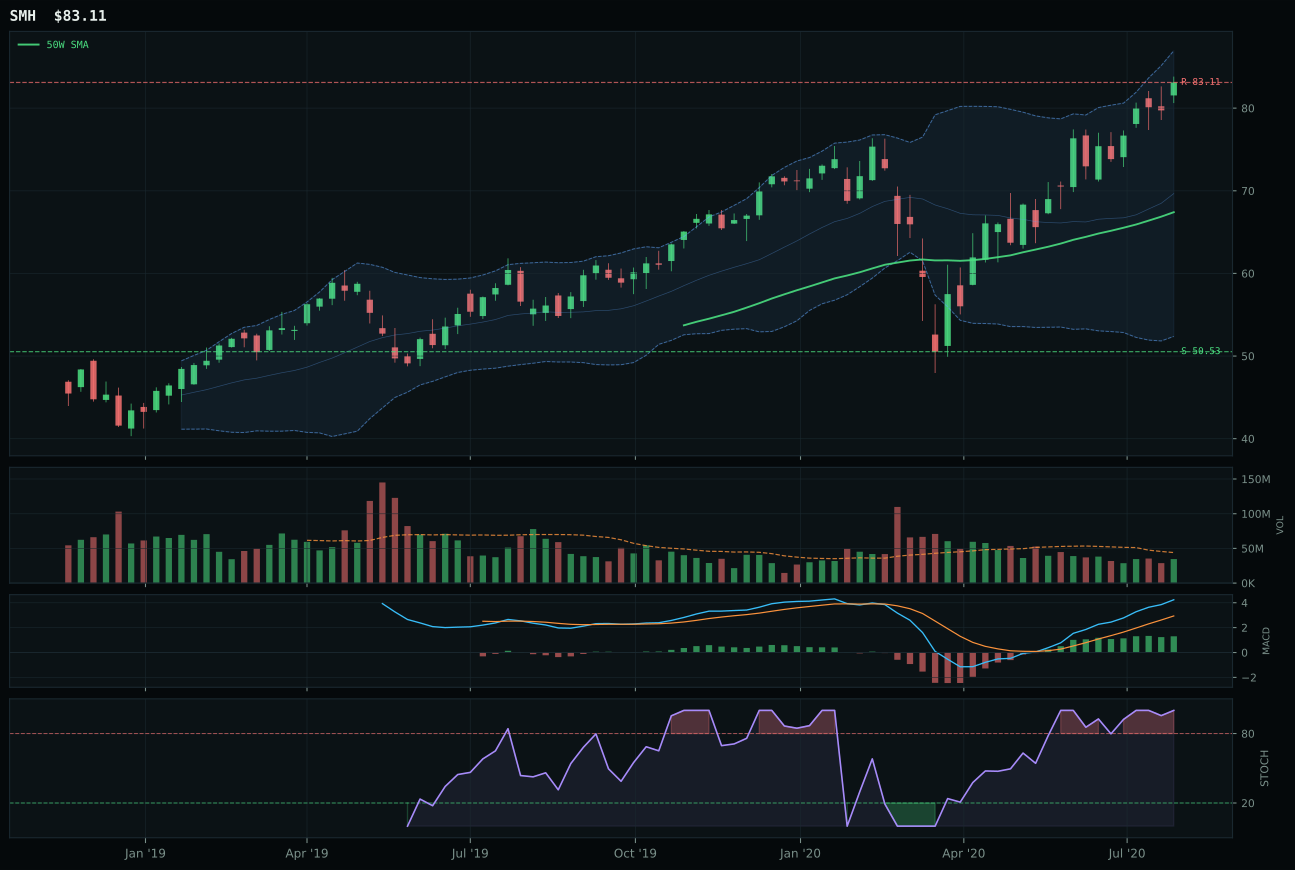
SMH has a vertical extension profile with 15.0% 13-week relative strength versus SPY.
A failed hold above support would weaken the setup.
Actionable but governed by invalidation levels.
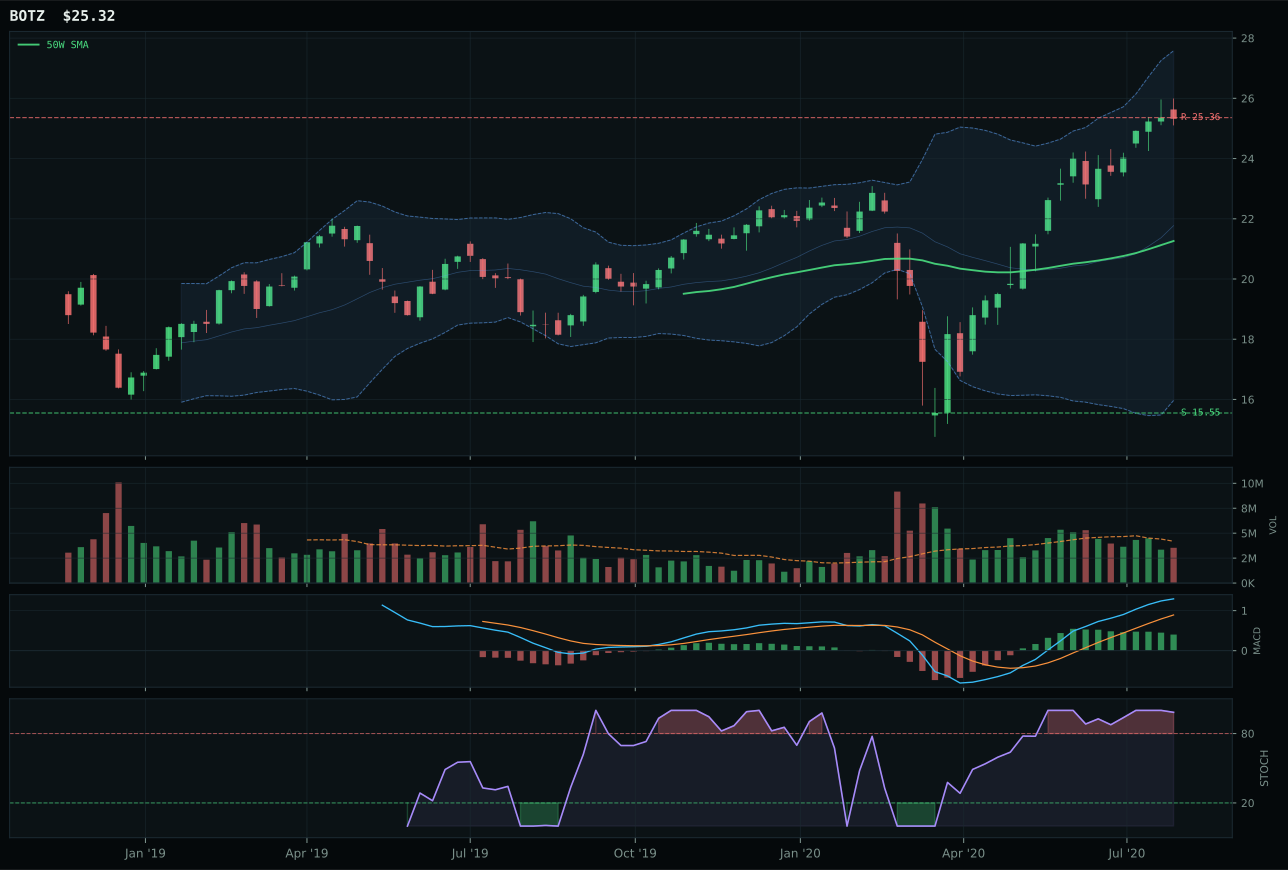
BOTZ has a vertical extension profile with 12.2% 13-week relative strength versus SPY.
A failed hold above support would weaken the setup.
Actionable but governed by invalidation levels.
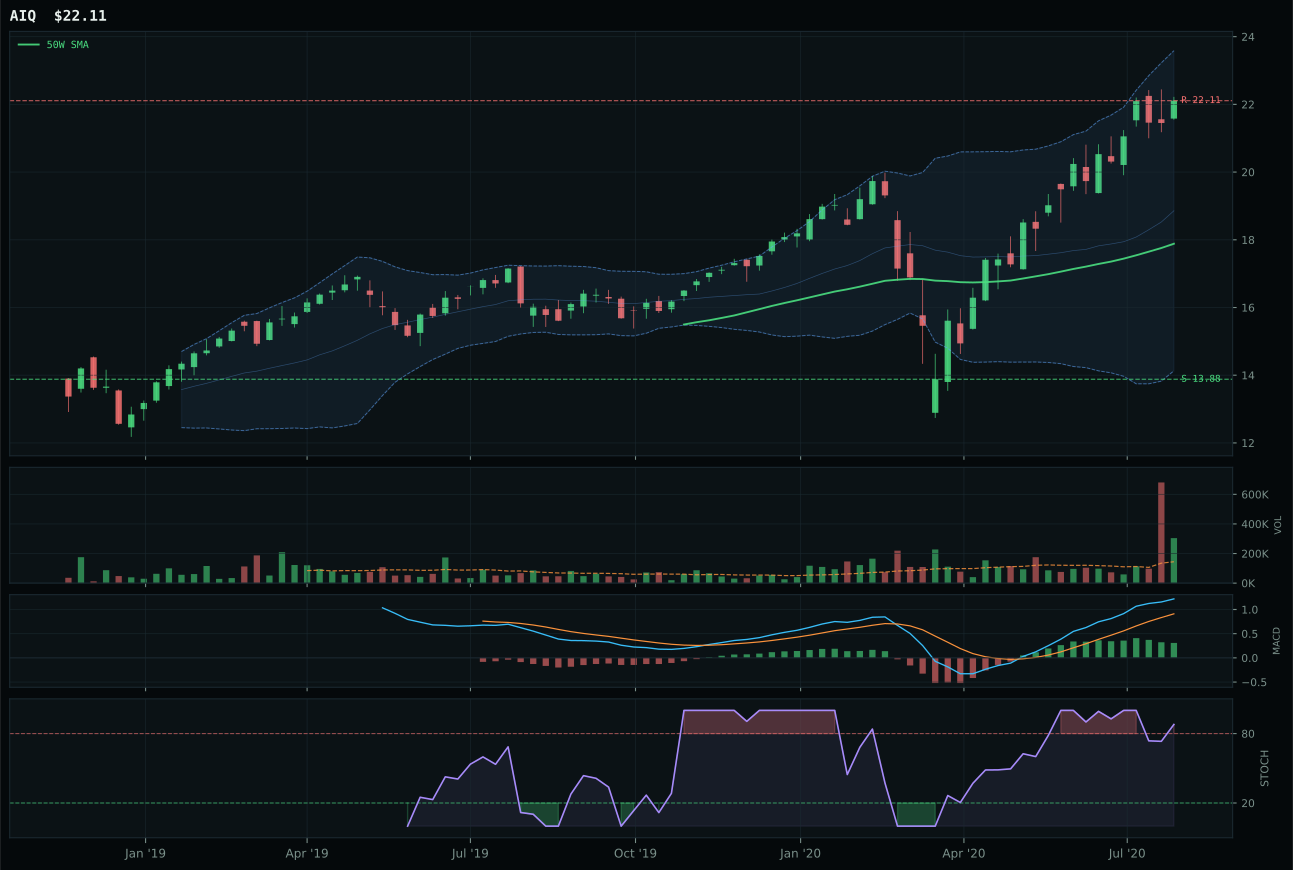
AIQ has a vertical extension profile with 12.5% 13-week relative strength versus SPY.
A failed hold above support would weaken the setup.
Tracked, but not top-2 eligible because: .
SMH wins the AI category on the strength of a 2.4% relative strength advantage over category peers, with MACD bullish and improving where BOTZ's MACD is merely bullish and flattening. The semiconductor leadership setup mirrors Technology's vertical extension architecture—price 23.3% above the 50W, stochastic RSI at overbought momentum, and risk/reward heavily skewed to downside at 64.5% with only 0% to resistance. What separates SMH from BOTZ is timing: SMH's 37.0 timing score versus BOTZ's 22.0 reflects price sitting in a cleaner momentum pocket, with MACD still in an improving phase rather than rolling over like BOTZ's overbought rolling-over stochastic. The 15.0% SPY relative strength and 30.4% 13-week return validate that compute and chip supply are the real drivers inside AI, not the robotics optionality that BOTZ represents. Volume at 0.79x the 20W average is neutral—neither confirming nor rejecting—which means the move is being sustained on momentum and mean-reversion buying rather than fresh accumulation.
AI receives 5% allocation as a tier-2 category with a final score of 52.2, well below the top-2 threshold despite strong technical evidence and the active AI growth sponsorship macro descriptor. The category's ranking reflects macro headwinds: liquidity stress is penalizing growth exposure with a -12 impact, and credit stress subtracts another -8, overwhelming the +14 boost from AI growth sponsorship. SMH's technical evidence of 75.0/100 would normally anchor a higher rank, but the macro/narrative fit of 58.0/100 reveals that even as semiconductor demand is real, the portfolio risk regime is tightening. The 5% slot acknowledges that AI compute leadership remains valid and SMH's improving MACD is superior to peers, but the position size reflects a genuine reluctance to chase extended valuations in a credit-stressed regime. To upgrade to top-2 would require either a clear macro pivot away from credit stress or a meaningful pullback in SMH that resets entry risk.
Utilities & Infrastructure — XLU
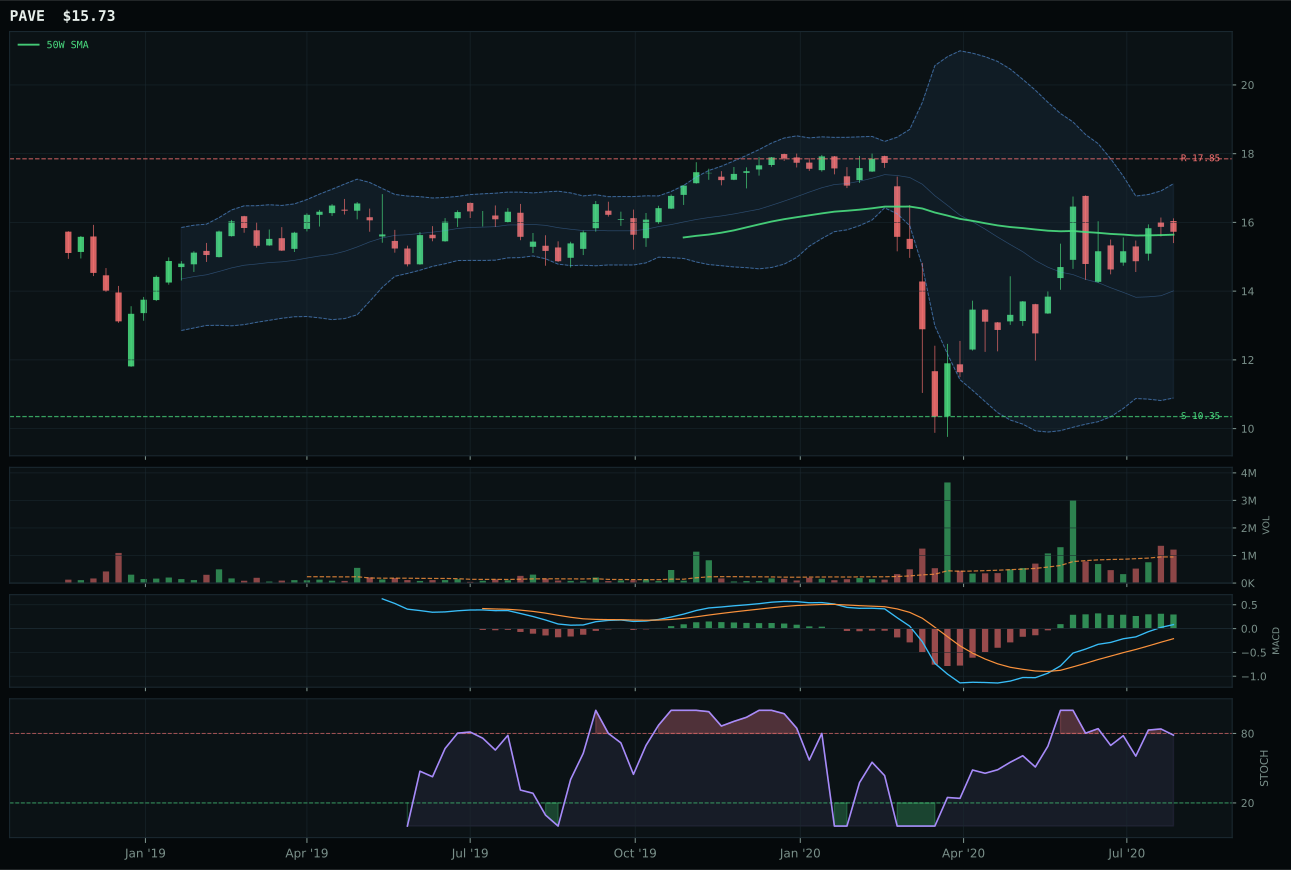
PAVE has a compression near 50W profile with 2.7% 13-week relative strength versus SPY.
A failed hold above support would weaken the setup.
Actionable but governed by invalidation levels.
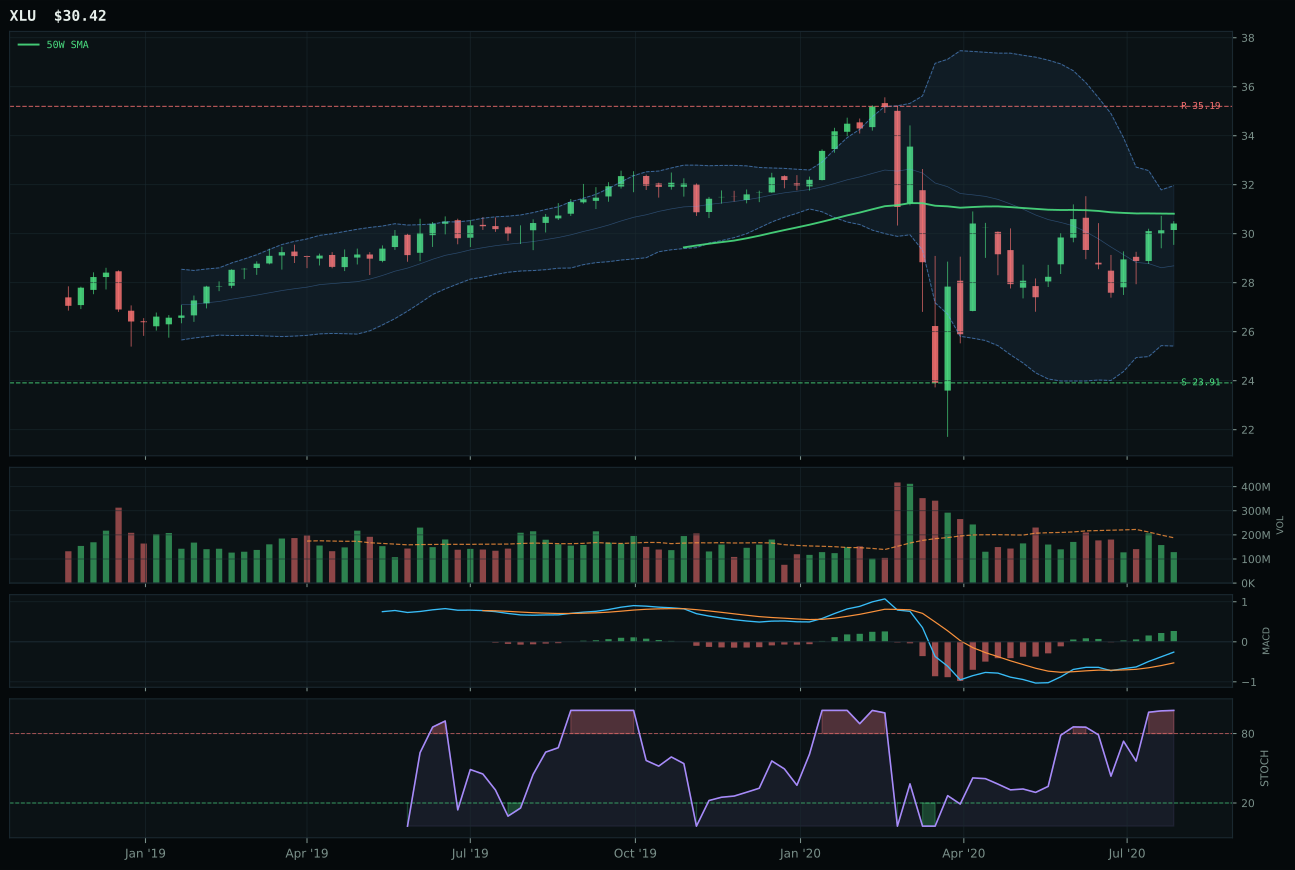
XLU has a compression near 50W profile with -6.6% 13-week relative strength versus SPY.
A failed hold above support would weaken the setup.
Actionable but governed by invalidation levels.
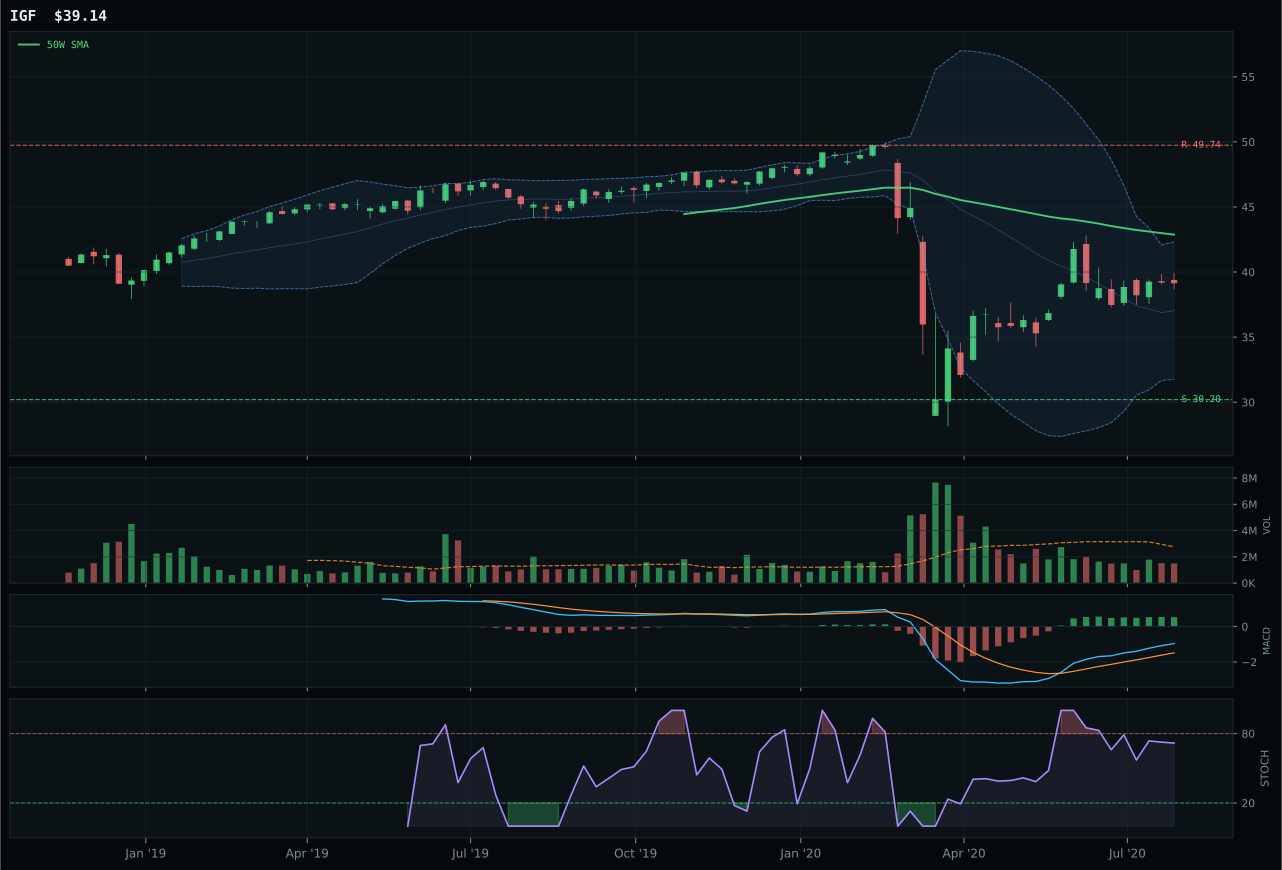
IGF has a neutral structure profile with -6.3% 13-week relative strength versus SPY.
Extension and support failure are the main tactical risks.
Tracked, but not top-2 eligible because: structurally broken.
XLU wins Utilities & Infrastructure despite being below the 50W by 1.3%, which seems contradictory until the technical setup is examined: this is a pullback-into-support structure, not a downtrend. Price is still above the 200W, MACD is bullish and improving, and stochastic RSI is overbought momentum—all consistent with a bounce-off-support pattern rather than breakdown. Against PAVE, which ranks higher in technical evidence at 98.3/100, XLU's winning edge comes from risk/reward: PAVE offers only 34.1 risk/reward versus XLU's 54.0 because PAVE is already extended from support and closer to resistance. The 100% timing score on XLU reflects the fact that price at -1.3% from the 50W is a clean entry point with high reward-to-risk; at this distance, every upside move to 35.19 resistance is likely, and downside to support at 23.91 has room. Volume at 0.68x the 20W average is thin, but that is typical for utilities; what matters is that MACD is improving and willing to push higher. The compression-near-50W setup suggests this is an accumulation point for defensive rotation.
Utilities & Infrastructure earns 5% as a tier-2 category with a final score of 47.5, well below the top-2 threshold despite a disinflation-positive macro setup. Disinflation helps this exposure at +7, disinflation pressure is active at +6, but risk appetite positive subtracts -2 (because defensive plays underperform when risk appetite is strong), creating a net macro fit of 62.0/100 that is respectable but not dominant. XLU's -6.6% SPY-relative strength reflects the fundamental tension: as long as risk appetite remains positive and technology continues to rally, utilities will lag. The 5% position is a structural hedge—recognizing that if credit stress intensifies or recession fears accelerate, XLU's 65.1% trend score and 100% timing score mean it will be the first to rotate higher. PAVE's superior technical evidence of 98.3/100 makes it the infrastructure optionality, but its weaker risk/reward kept XLU as the representative. For Utilities to upgrade, either MACD would need to inflect sharply higher across both XLU and PAVE, or credit stress would need to flip negative, signaling that bond yields are falling and defensive valuations are expanding.
Defense & Aerospace — XAR
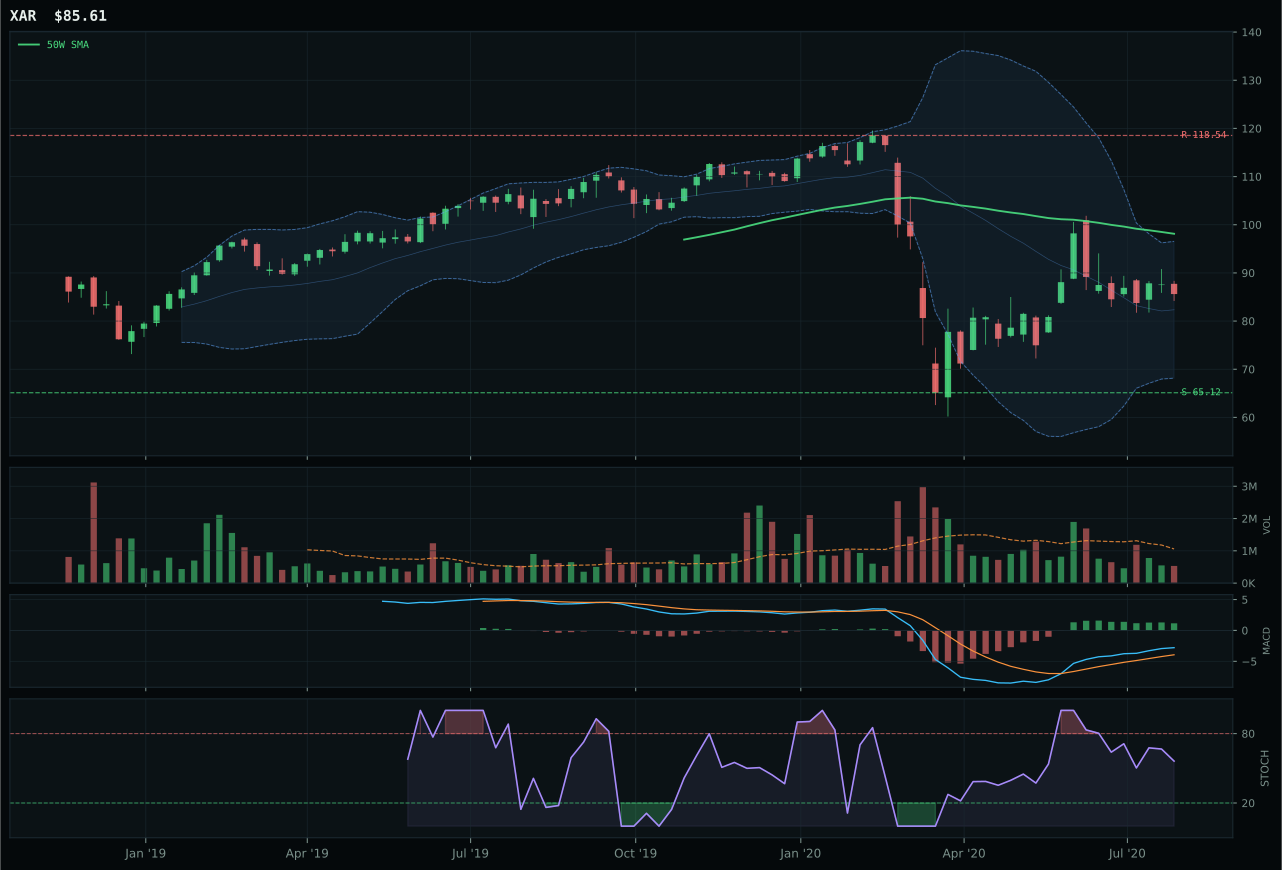
XAR has a neutral structure profile with -6.6% 13-week relative strength versus SPY.
A failed hold above support would weaken the setup.
Actionable but governed by invalidation levels.
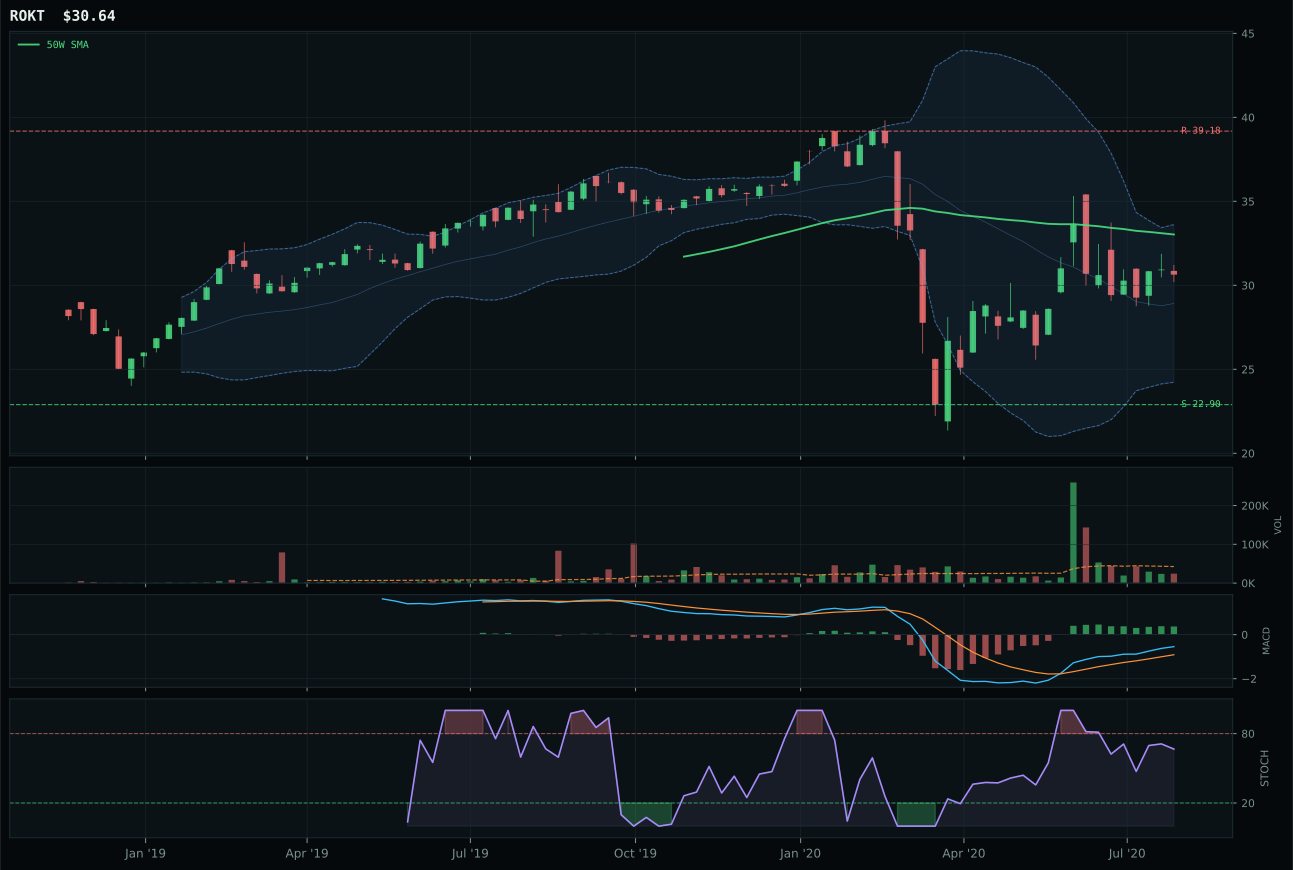
ROKT has a neutral structure profile with -6.4% 13-week relative strength versus SPY.
A failed hold above support would weaken the setup.
Tracked, but not top-2 eligible because: .
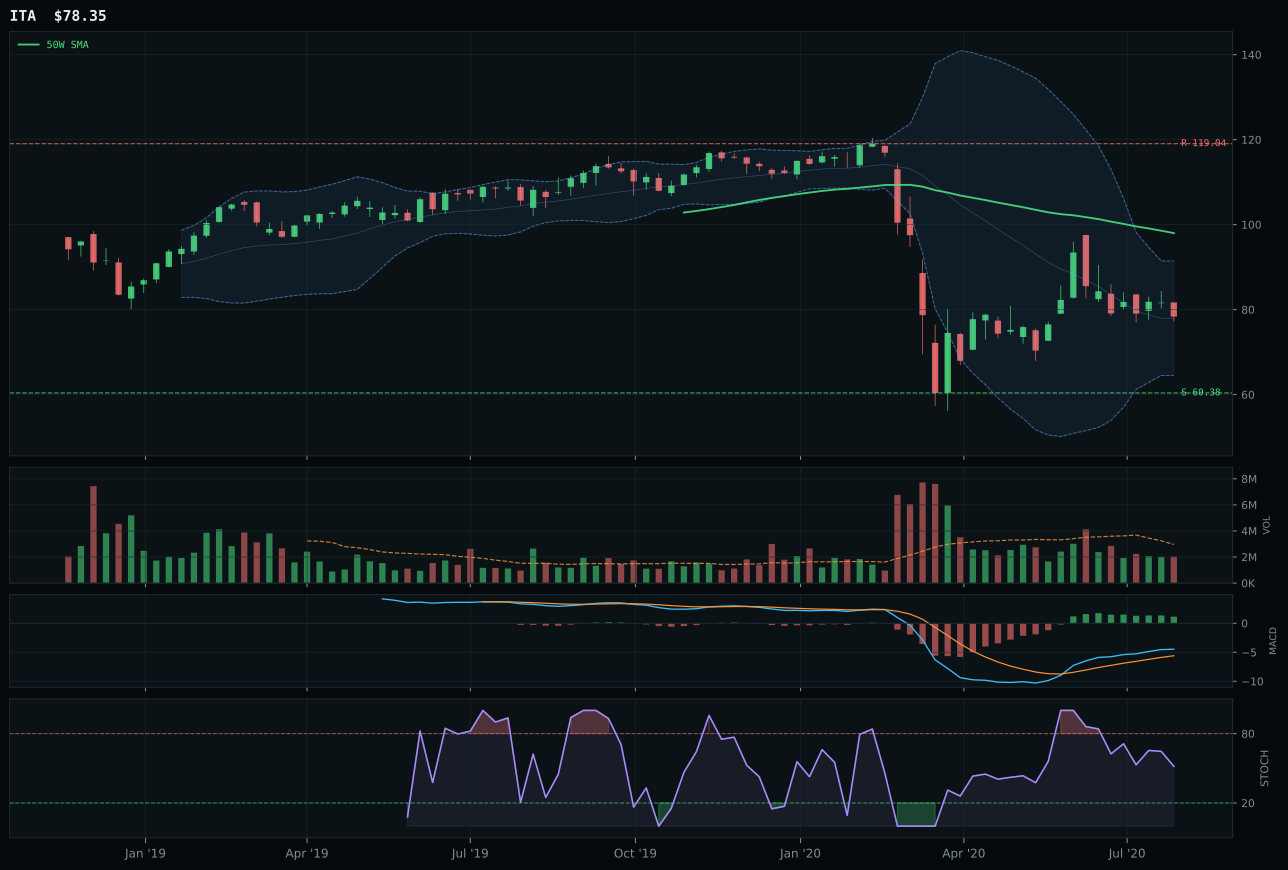
ITA has a neutral structure profile with -11.3% 13-week relative strength versus SPY.
A failed hold above support would weaken the setup.
Actionable but governed by invalidation levels.
XAR wins by default in a weak category: it is below the 50W by 12.8%, below the 200W, and sitting in the middle Fibonacci retracement zone where the setup depends entirely on support holding at 65.12 rather than any confirmed upside momentum. The 8.9% 13-week return and -6.6% SPY relative strength immediately signal this is not a momentum leadership story; instead, XAR's timing score of 58.0 reflects the fact that price is at a decision point where MACD is bullish but flattening and stochastic RSI is merely rising mid-zone. Against ROKT, XAR's edge is minimal—ROKT is even more oversold at -7.2% from the 50W—and the 18.2-point gap between them masks the reality that both setups lack conviction. Volume at 0.50x the 20W average is thin participation across the category, meaning no major institutions are actively accumulating; this is a liquidity desert where small allocations to signal long-term optionality carry less risk of execution slippage but also lack sponsorship. The neutral structure score of 61.8 is the category's clearest signal: there is support architecture, but no technical bias.
Defense & Aerospace earns 5% as a tier-2 category with a score of 41.9, ranking it in the middle of the allocation sleeve primarily because it is eligible and offers diversification rather than conviction. The category's macro fit is 51.0/100—neutral—because no specific descriptor profile supports or harms aerospace exposure in the current regime; credit stress is slightly positive at +2, while liquidity stress drags by -4. XAR's -6.6% relative strength to SPY and compressed trend structure reflect a sector that has been left behind in the disinflation-driven rally toward technology and metals. The 5% position is a placeholder hold rather than an accumulation point. For this category to earn a higher rank, price would need to definitively hold support at 65.12 and show volume participation rising toward the 1.0x 20W average level, signaling that value investors are rotating into defense amid some recognition of cycle extension risk.
Industrial Metals — REMX
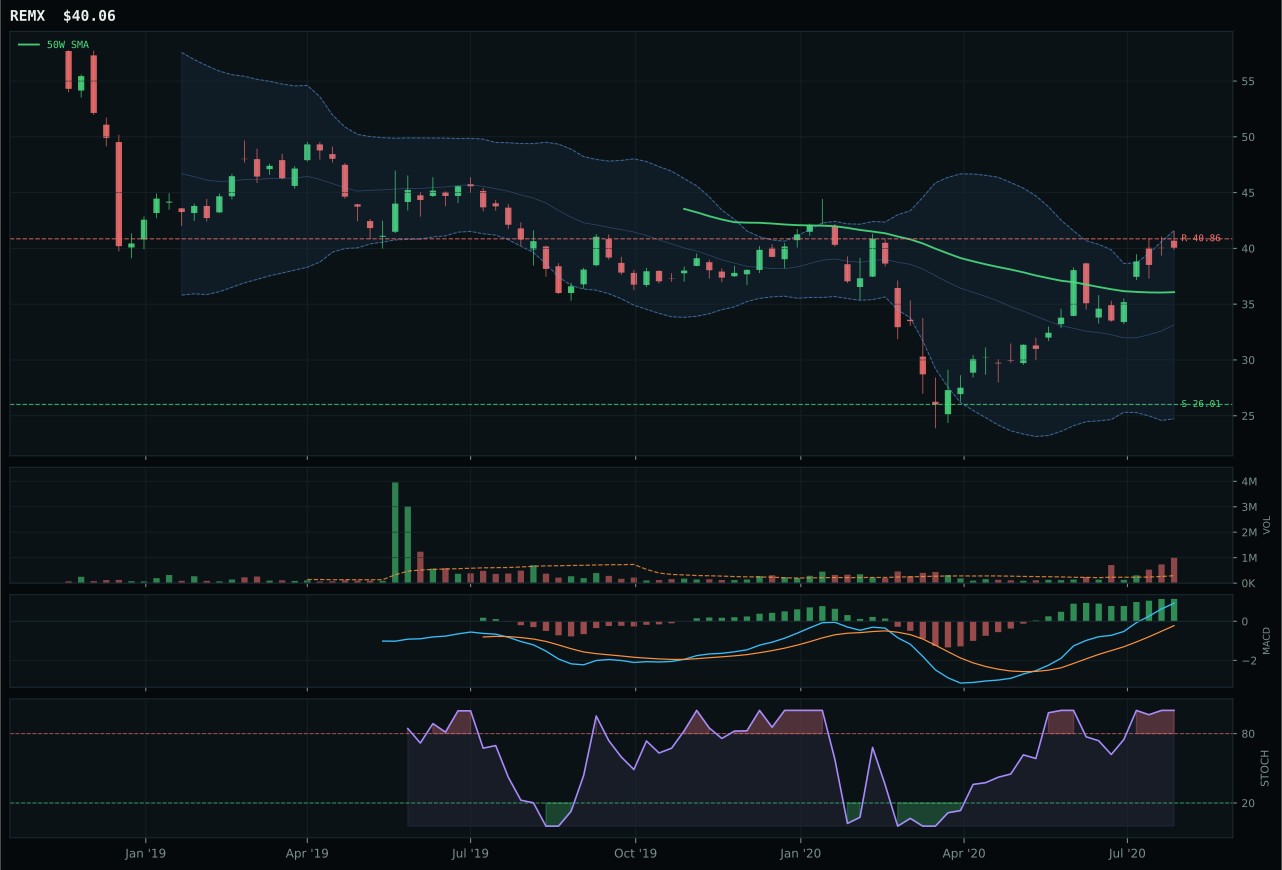
REMX has a neutral structure profile with 18.4% 13-week relative strength versus SPY.
A failed hold above support would weaken the setup.
Actionable but governed by invalidation levels.
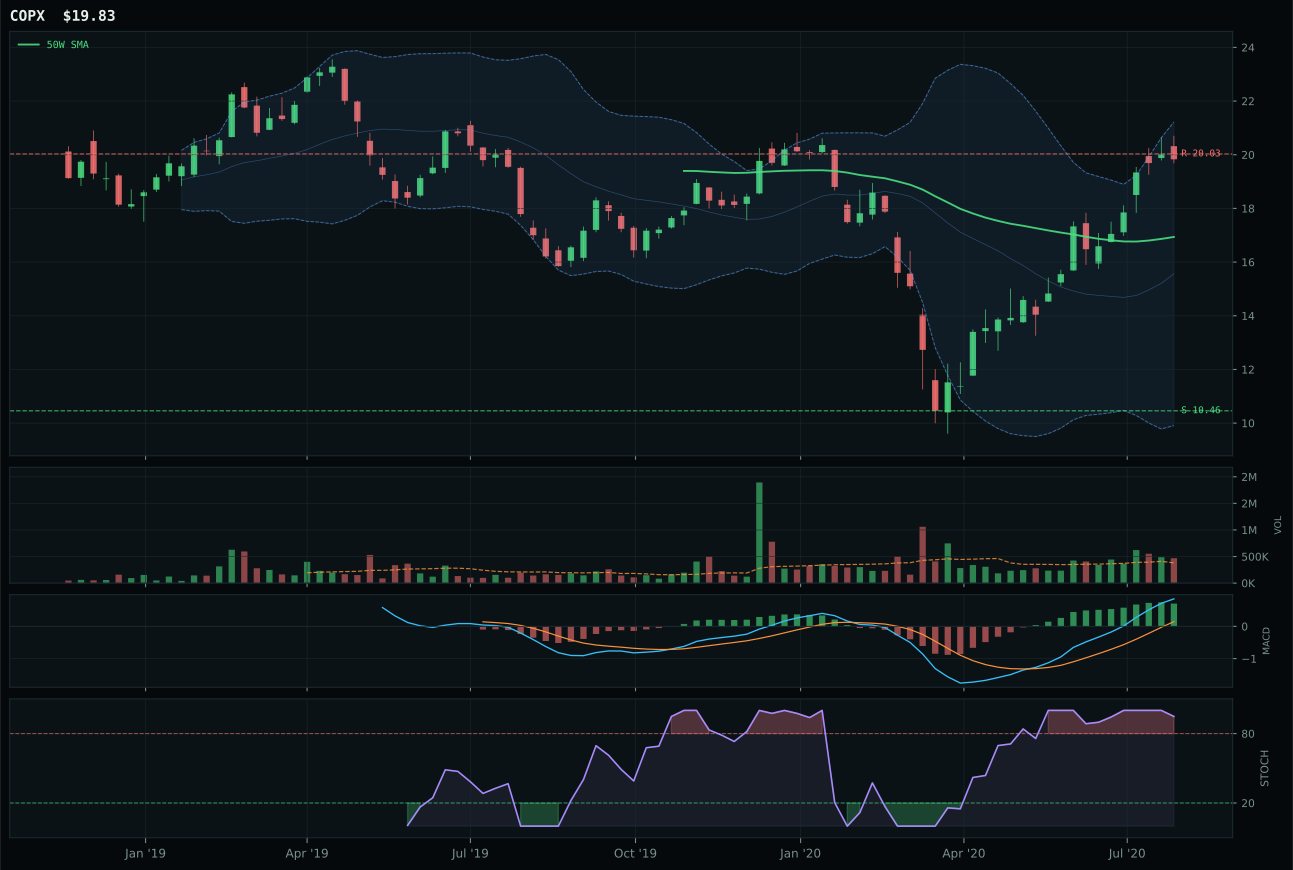
COPX has a vertical extension profile with 27.0% 13-week relative strength versus SPY.
A failed hold above support would weaken the setup.
Tracked, but not top-2 eligible because: .
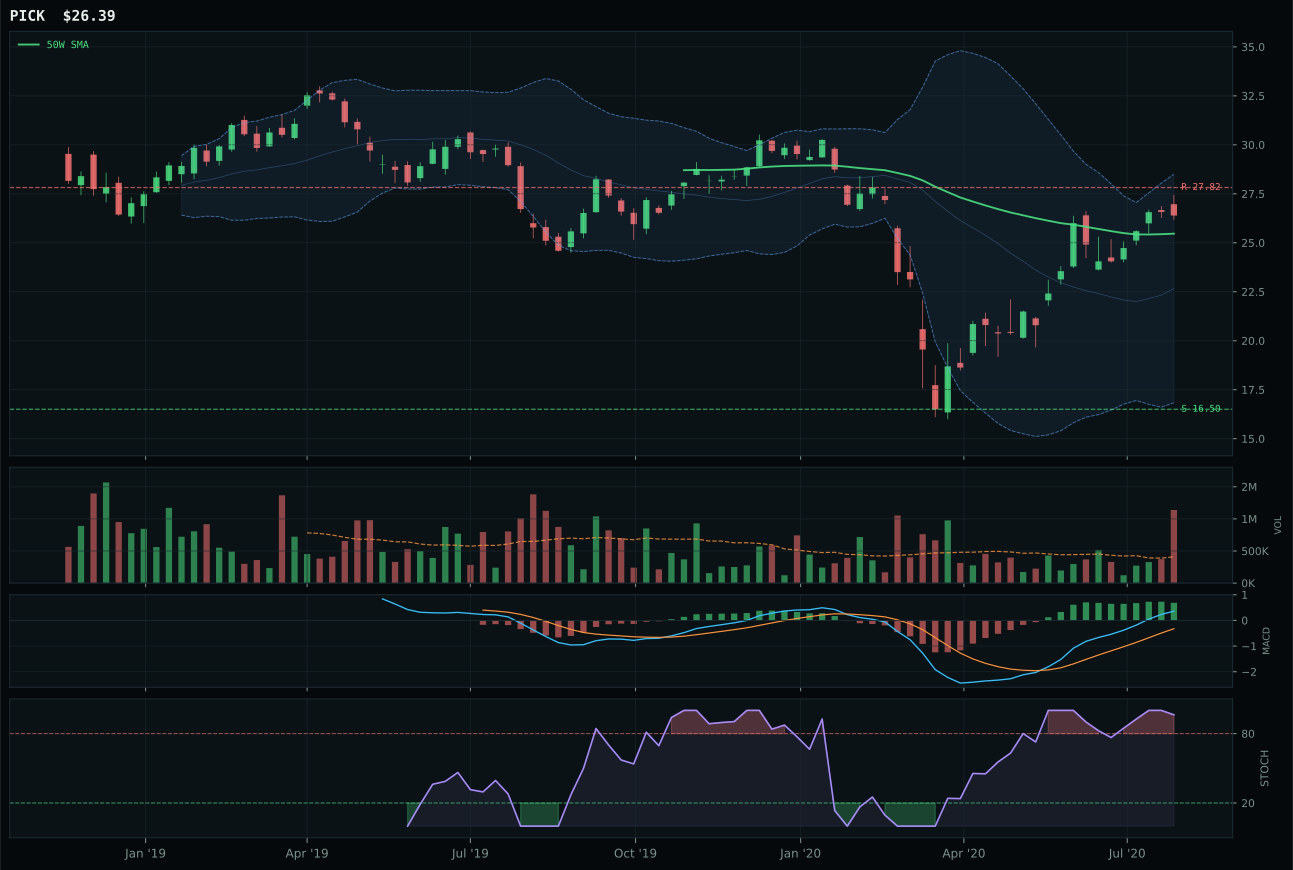
PICK has a neutral structure profile with 13.9% 13-week relative strength versus SPY.
A failed hold above support would weaken the setup.
Tracked, but not top-2 eligible because: .
REMX wins Industrial Metals with a dominant 28.3-point score gap over COPX, anchoring a 5% tier-2 allocation despite technical credentials that would ordinarily suggest higher rank. The setup is neutral structure, not vertical extension like COPX, and price is only 11.0% above the 50W rather than COPX's overextended 17.1%, meaning REMX has better entry geometry and timing at 67.0 versus COPX's 27.0. More critically, REMX's volume is 3.45x the 20W average—accumulation confirmation—whereas COPX shows only above-average participation and a stochastic RSI already rolling over. The 33.8% 13-week return and 18.4% SPY-relative strength validate REMX's rare-earth supply-chain positioning within the AI and semiconductor infrastructure buildout; this is not cyclical metals demand but structural scarcity. Against COPX's stretched copper play showing overbought rolling-over momentum, REMX's bullish and improving MACD with clean structure suggests the institutional accumulation phase is still active. The 100.0 momentum confirmation and 90.9 volume-price confirmation scores indicate this is real capital deployment, not retail chasing.
Industrial Metals receives 5% allocation as a tier-2 category with a final score of 34.6, ranking it materially below the top-2 threshold despite REMX's strong technical posture. The metals scarcity descriptor is active at +14, the highest in the portfolio, and AI growth sponsorship adds +4, but liquidity stress subtracts -8 and credit stress -7, creating a -3 net macro headwind that constrains the category's rank. REMX's technical evidence of 97.4/100 is nearly perfect, but the category-level macro fit of 49.0/100 reflects genuine tension: rare-earth demand from AI infrastructure is real, but the tight credit regime means supply-chain financing is constrained and Chinese export policies add geopolitical tail risk. The 5% position honors REMX's clean setup and institutional accumulation while refusing to overcommit in a credit-stressed environment. For Industrial Metals to earn a higher allocation, the credit stress descriptor would need to flip off, signaling either Fed easing or a meaningful expansion of working-capital financing availability.
Nuclear Energy — URA
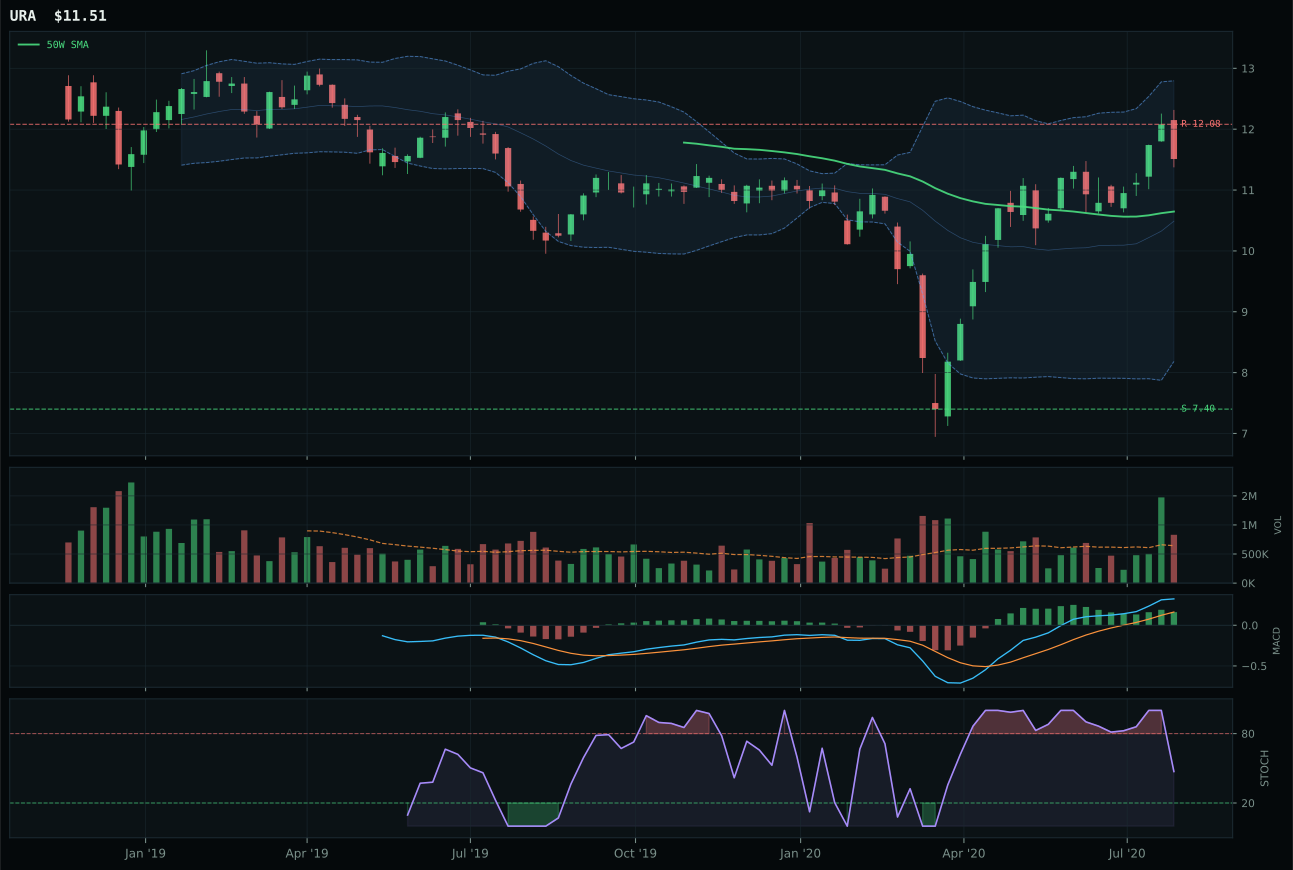
URA has a neutral structure profile with -7.3% 13-week relative strength versus SPY.
A failed hold above support would weaken the setup.
Tracked, but not top-2 eligible because: .
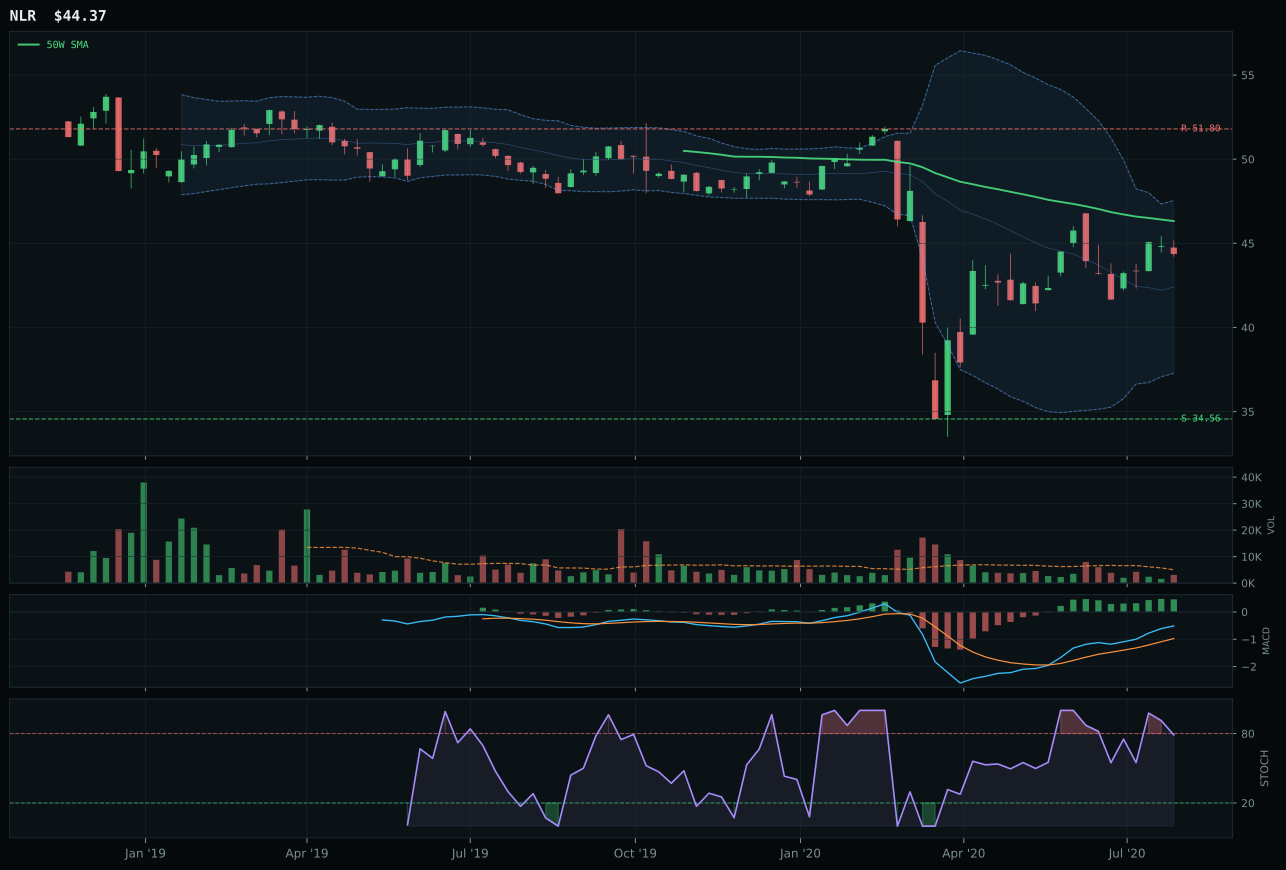
NLR has a neutral structure profile with -8.9% 13-week relative strength versus SPY.
Extension and support failure are the main tactical risks.
Tracked, but not top-2 eligible because: structurally broken.
URA wins Nuclear Energy with a 47.8-point score gap over NLR, capturing uranium supply upside as a cleaner thematic within energy. Price is only 8.1% above the 50W—much closer to entry than XLE's deep oversold—with a neutral structure setup where MACD is bullish and improving and stochastic RSI is falling/neutral, indicating the move has not yet overextended into overbought territory. The 8.2% 13-week return and -7.3% SPY-relative strength suggest this is a slow-grinding accumulation rather than a meme trade, and volume at 1.29x the 20W average shows above-average participation without extreme enthusiasm. Against NLR, which shows a structurally broken 39.8 structure score and thin volume participation, URA's cleaner architecture and higher volume confirmation signal that investors are selectively rotating into uranium as an AI-era electricity solution rather than capitulating across all energy. The 75.0 timing score reflects a genuine pullback opportunity with clean support at 7.40 and room to 12.08 resistance, creating asymmetric risk/reward in URA's favor.
Nuclear Energy receives 5% allocation as a tier-2 category with a final score of 31.5 and an eligible flag of False, meaning this is a borderline position held for optionality rather than conviction. The AI growth sponsorship descriptor is active at +5, providing a modest tailwind, but liquidity stress at -7 and credit stress at -5 create headwinds that prevent Nuclear from breaking into the higher tiers. URA's technical evidence of 45.0/100 is mid-range, and the category-level macro fit of 43.0/100 reflects genuine ambiguity: there is a longer-term secular case for uranium demand if AI energy requirements drive grid expansion, but the near-term credit regime is too tight to justify aggressive accumulation. The 5% allocation is a structural conviction position—betting that electricity infrastructure becomes a legitimate portfolio theme—not a tactical trade. For Nuclear to earn higher allocation, URA would need to convincingly break above the 12.08 resistance and sustain that move with volume expansion, signaling institutional adoption of the AI-electricity narrative.
Traditional Energy — XLE
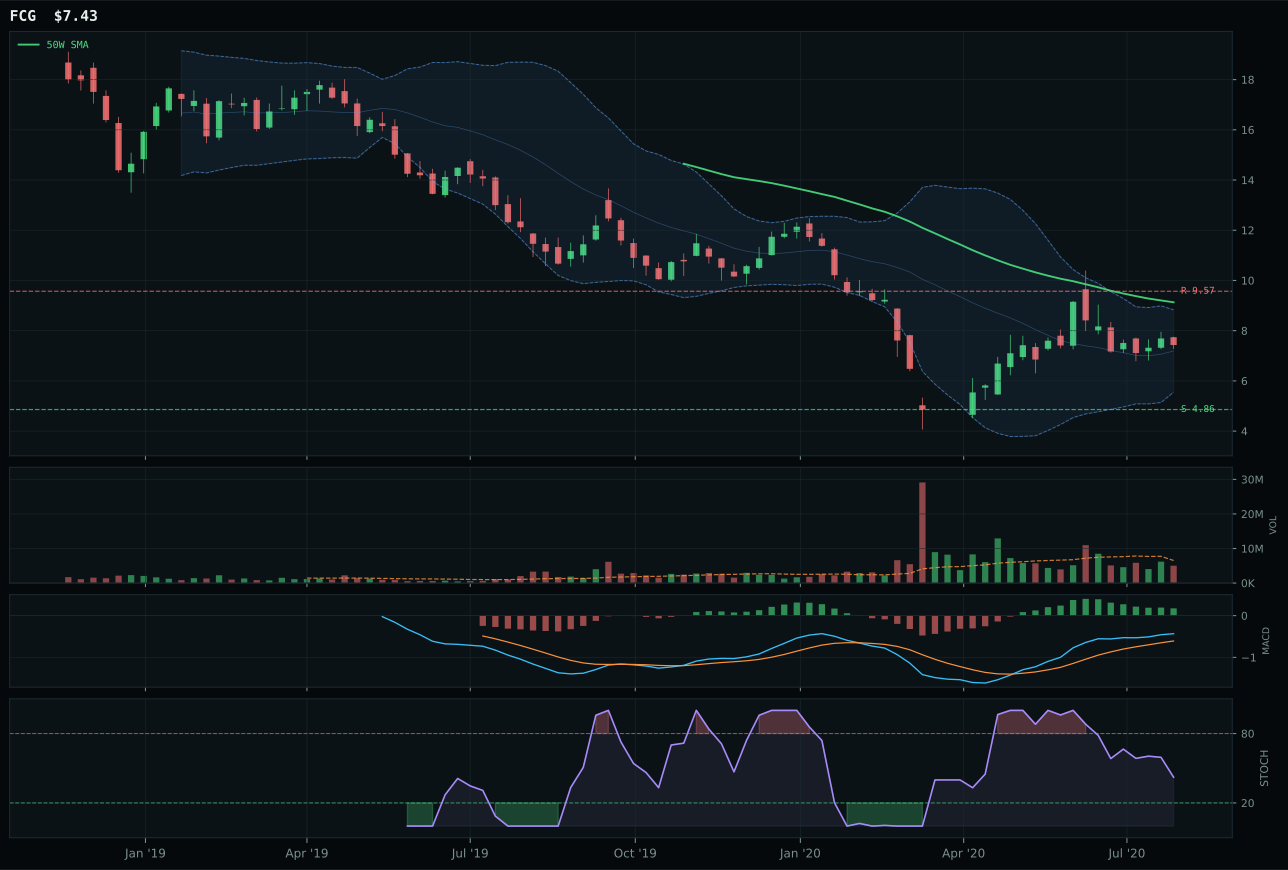
FCG has a neutral structure profile with -10.8% 13-week relative strength versus SPY.
Extension and support failure are the main tactical risks.
Tracked, but not top-2 eligible because: structurally broken.
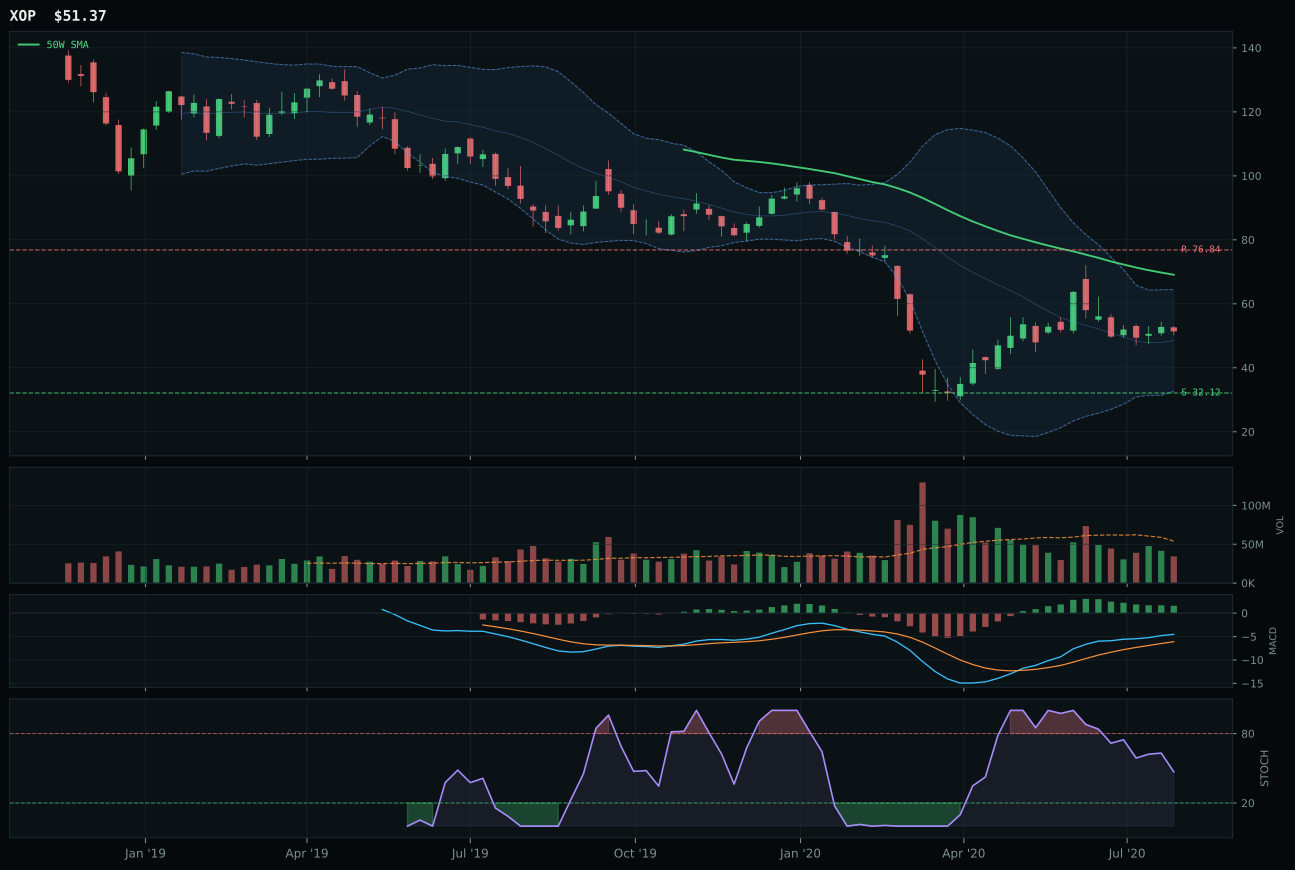
XOP has a neutral structure profile with -12.7% 13-week relative strength versus SPY.
Extension and support failure are the main tactical risks.
Tracked, but not top-2 eligible because: structurally broken.
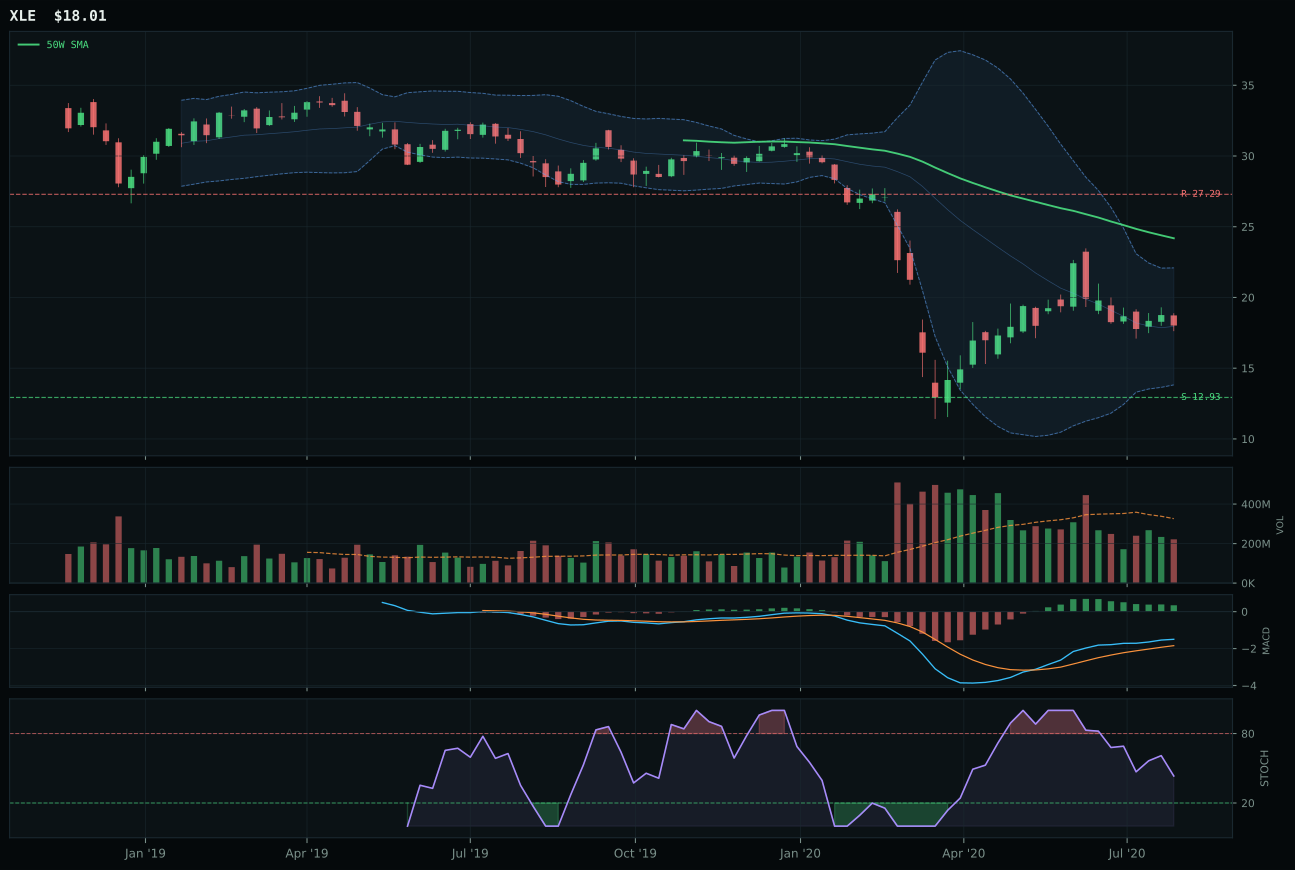
XLE has a neutral structure profile with -15.0% 13-week relative strength versus SPY.
Extension and support failure are the main tactical risks.
Tracked, but not top-2 eligible because: structurally broken.
XLE wins Traditional Energy by winning a category that received a final score of 0.0 and 5% allocation—meaning even the category winner is entirely excluded from the portfolio. XLE's claim to fame is that it is less broken than FCG and XOP: price is 25.5% below the 50W (deeply oversold), but the 26.0% trend score and thin volume at 0.68x the 20W average indicate this is capitulation rather than accumulation. MACD is bullish but flattening, stochastic RSI is falling/neutral at 0.43, and the setup sits in the deep Fibonacci retracement zone at 0.618—a value zone that would be attractive if credit stress were not so acutely suppressing energy demand. The 0.5% 13-week return and -15.0% SPY-relative strength over 13 weeks reveal the brutal truth: energy has been left for dead. Against COPX's stretched structure, XLE's oversold positioning offers marginally better timing, but neither position is worth owning in the current regime.
Traditional Energy earns exactly 5% allocation this week, making it one of two completely excluded categories, because its final score bottomed at 0.0 and the eligible flag is False. Disinflation pressure is active at -10, disinflation itself subtracts -10, credit stress contributes -7, and liquidity stress adds -7, creating a -34 total macro headwind that is insurmountable. Energy consumption is weakening in a disinflationary environment, gasoline prices are declining, and the entire complex is trapped in structurally lower demand assumptions. XLE's 26.0% trend score is the category's highest, yet it is fundamentally weak—price deeply underwater, volume absent, momentum rolling over. No descriptor is active in energy's favor: there is no inflation expectation, no AI growth tailwind, no monetary stimulus signal. For Traditional Energy to earn even a 5% position, the portfolio would need explicit evidence of demand recovery—higher gasoline consumption, airline traffic exceeding pre-pandemic levels, or a sharp reversal in disinflation expectations—none of which is present.
Emerging Markets — INDA
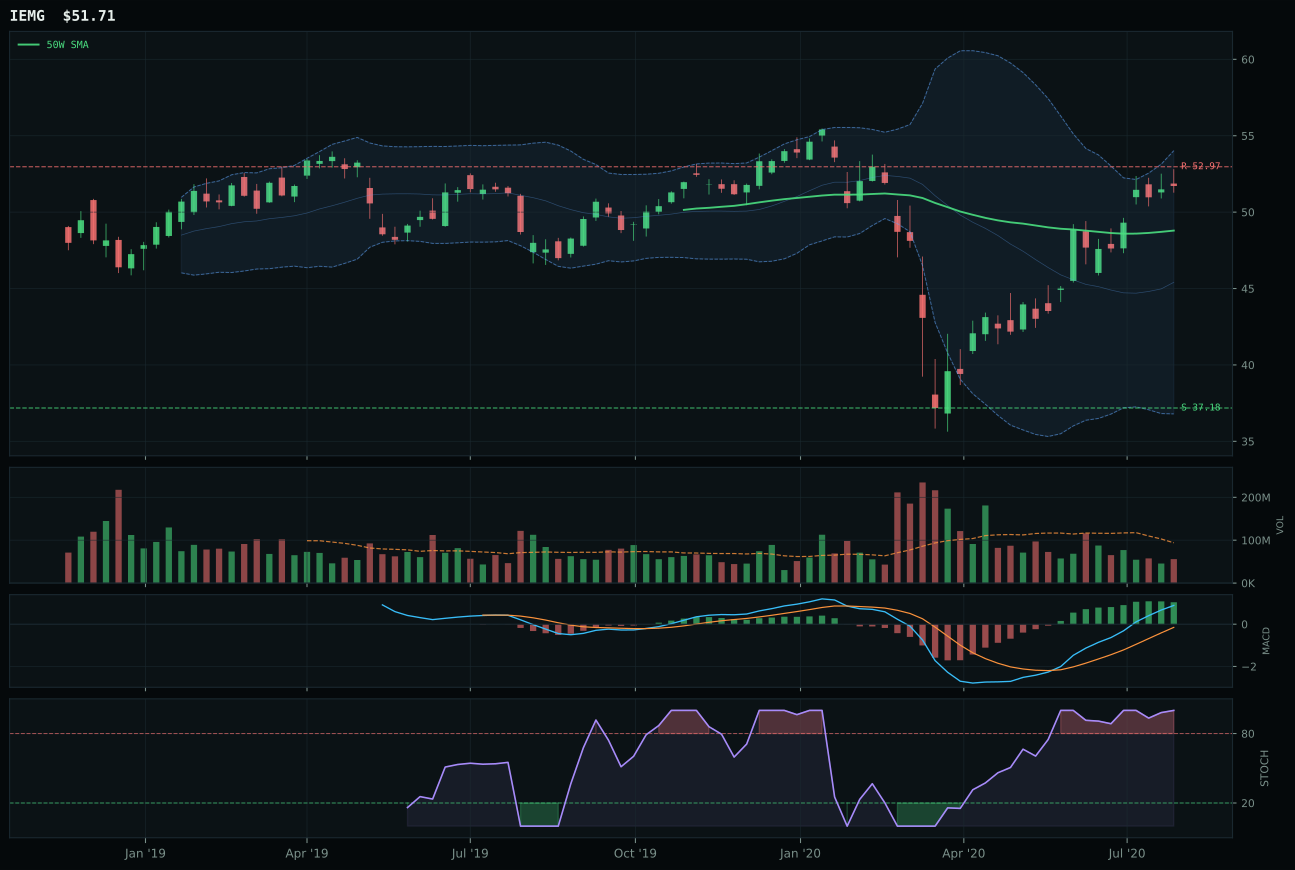
IEMG has a neutral structure profile with 7.1% 13-week relative strength versus SPY.
A failed hold above support would weaken the setup.
Actionable but governed by invalidation levels.
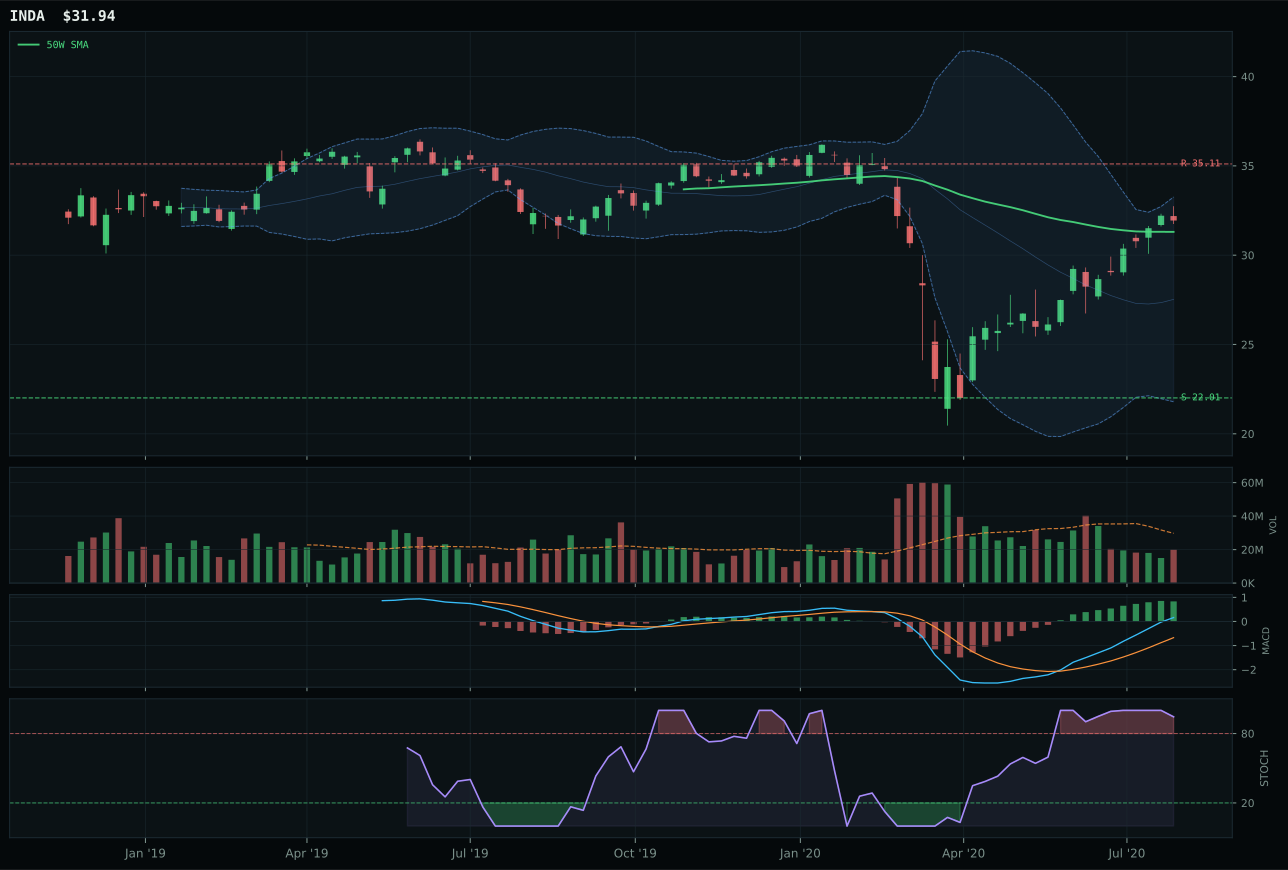
INDA has a compression near 50W profile with 6.4% 13-week relative strength versus SPY.
A failed hold above support would weaken the setup.
Actionable but governed by invalidation levels.
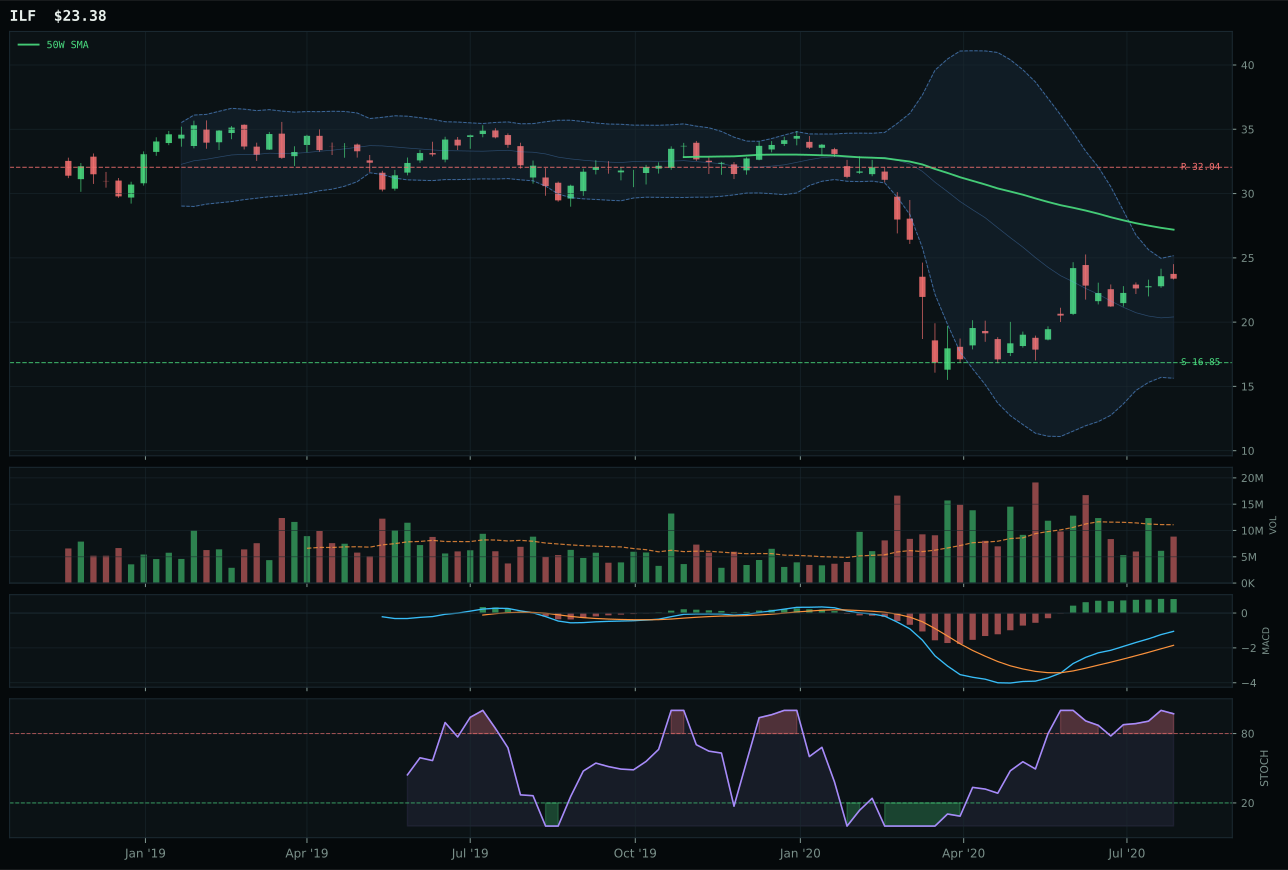
ILF has a neutral structure profile with 11.9% 13-week relative strength versus SPY.
Extension and support failure are the main tactical risks.
Tracked, but not top-2 eligible because: structurally broken.
INDA wins Emerging Markets with a technical score of 58.1/100, but the category received 0% allocation because its final score of 28.7 ranks it 9th or 10th among the 10 categories. The setup is compression near the 50W at only 2.0% distance, with MACD bullish and improving and stochastic RSI overbought rolling over—a pattern suggesting the initial thrust has exhausted and a retest is forming. The 21.8% 13-week return and 6.4% SPY-relative strength validate that India quality-growth exposure has outperformed, but the margin of victory over IEMG is merely 82 basis points in timing (82.0 versus 75.0), and IEMG's broader 100% trend score reflects stronger price above moving averages. Against both IEMG and ILF, INDA's advantage is that price is closer to entry and stochastic RSI is rolling over rather than still in overbought momentum, offering better timing for new capital. However, the category as a whole is captured in a compression pattern with thin volume at 0.67x the 20W average, suggesting institutional interest is fading.
Emerging Markets is entirely excluded at 0% allocation this week with a final score of 28.7 and an eligible flag of True, meaning the category is technically clean but macro-disqualified. Risk appetite is positive at +8, providing some tailwind, but credit stress subtracts -10, liquidity stress -10, and the net macro fit of 38.0/100 is materially lower than categories in the allocation. Emerging markets are acutely sensitive to U.S. credit conditions and dollar strength; in a disinflation regime with credit stress active, capital is rotating away from emerging risk and toward developed-market defensive plays or precious metals. INDA's 6.4% relative strength to SPY is meaningful, but it is being drowned out by a -10 credit stress headwind that affects all EM exposure. To earn even a 5% position would require the credit stress descriptor to flip off, a clear signal that emerging-market debt is being refinanced at better rates or that dollar weakness is emerging. Neither condition is present, making the complete exclusion appropriate.
Agriculture & Livestock — MOO
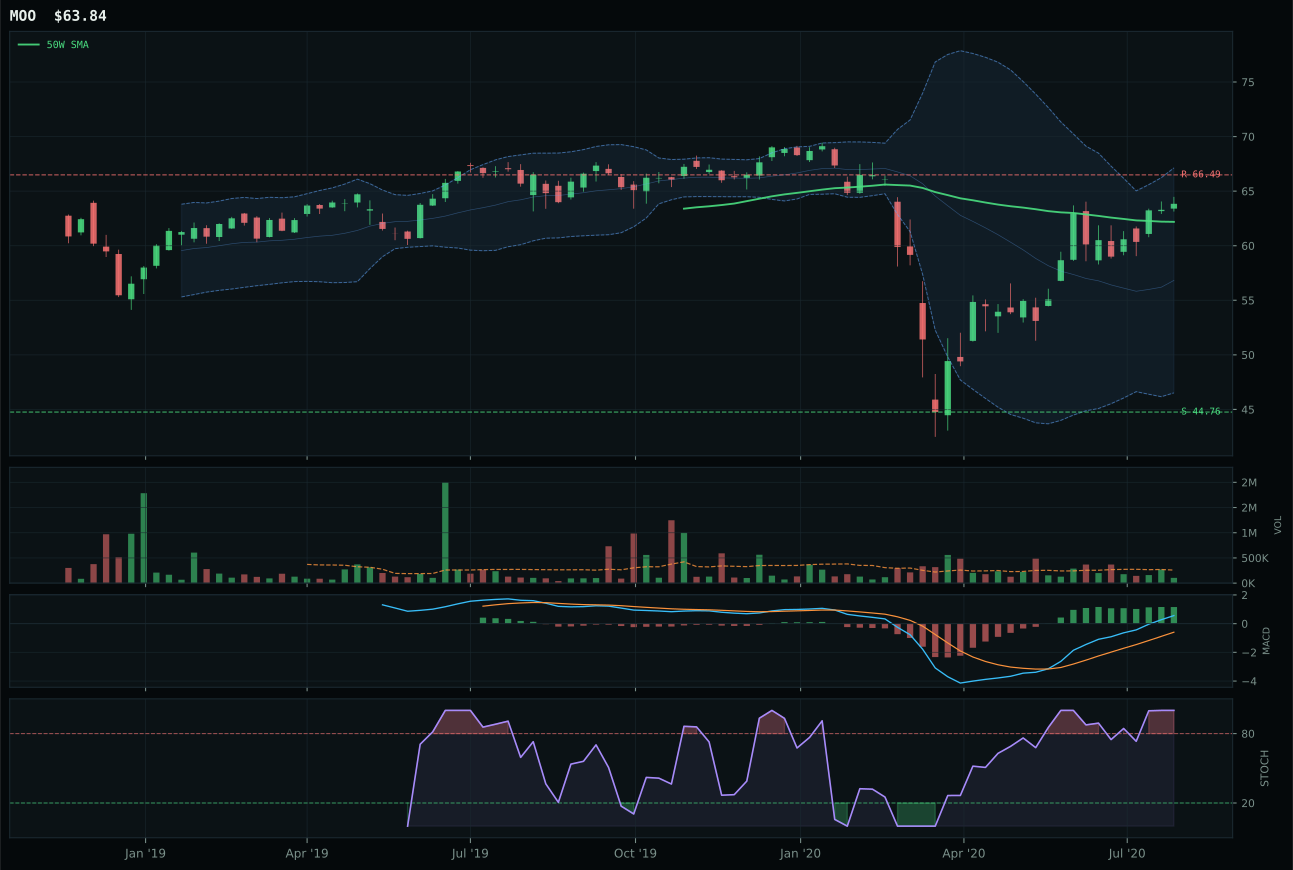
MOO has a compression near 50W profile with 3.0% 13-week relative strength versus SPY.
A failed hold above support would weaken the setup.
Actionable but governed by invalidation levels.
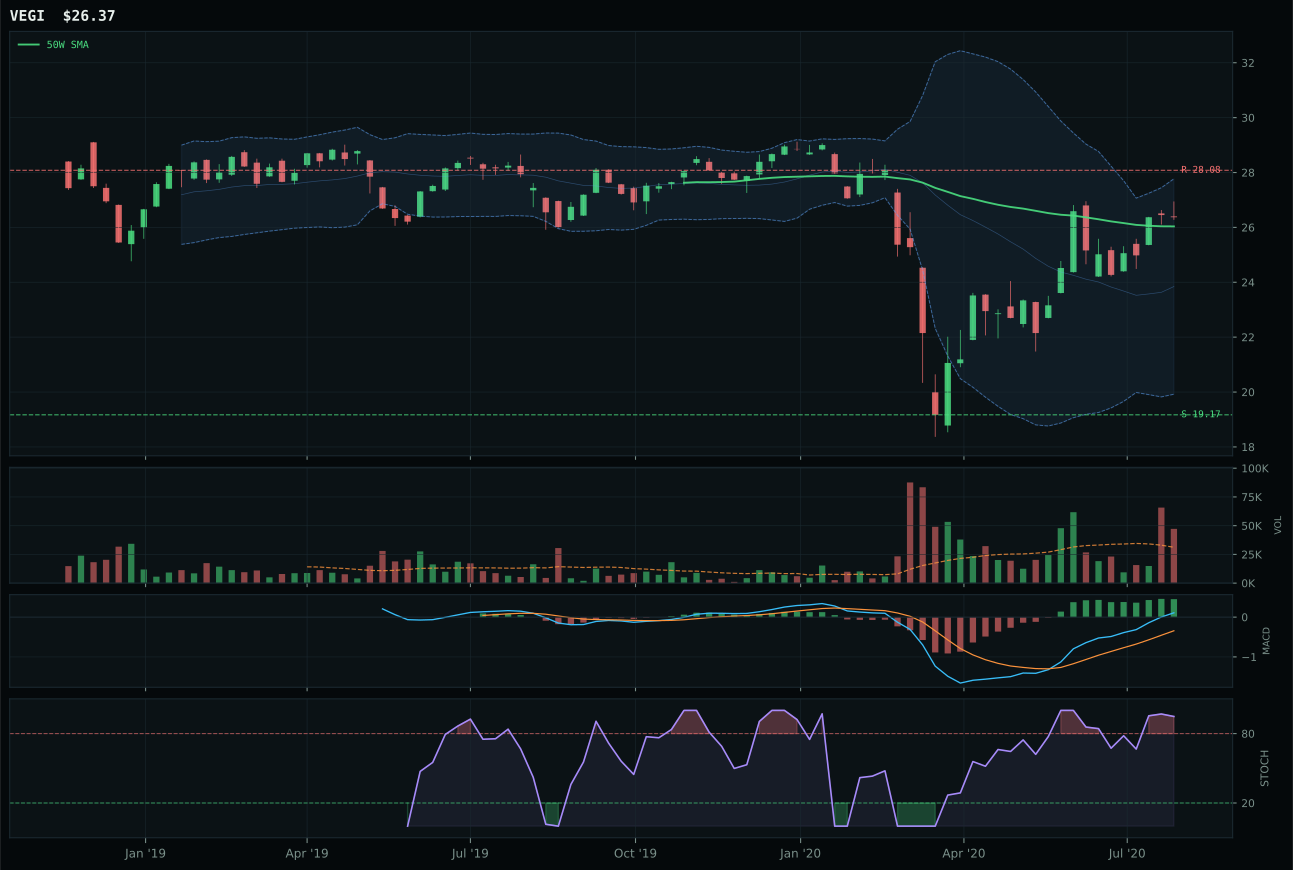
VEGI has a compression near 50W profile with 0.7% 13-week relative strength versus SPY.
A failed hold above support would weaken the setup.
Tracked, but not top-2 eligible because: .
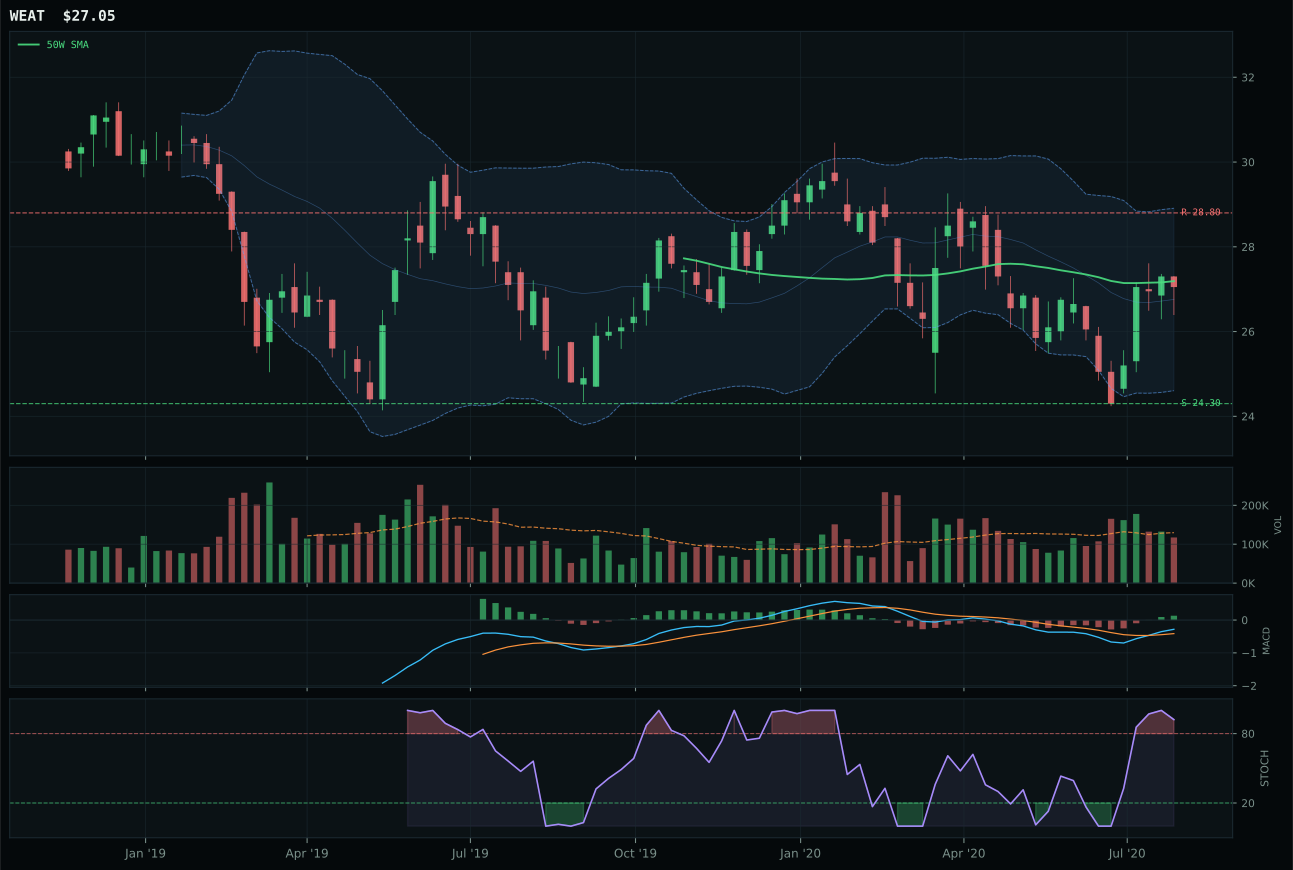
WEAT has a compression near 50W profile with -13.6% 13-week relative strength versus SPY.
Extension and support failure are the main tactical risks.
Tracked, but not top-2 eligible because: structurally broken.
MOO wins a category with a 32.1-point score gap over VEGI, yet this victory masks a critical structural weakness: Agriculture earned exactly 0% allocation this week, meaning the entire category is excluded regardless of which ETF ranks first. MOO's technical credentials look strong on the surface—94.5% trend score, 100% timing score, 91.7% momentum confirmation, and 18.4% 13-week return—but the setup is compression near the 50W at only 2.7% distance, with MACD bullish and improving and stochastic RSI overbought. The problem is not the technicals; it is that volume is thin participation at 0.40x the 20W average and risk/reward offers only -4.0% to resistance against 42.6% downside to support. MOO's category-relative strength of 2.3% over the median indicates it is the marginally least weak name in a category where disinflation pressure is actively negative and the entire complex is compressed near resistance with no accumulation underneath. VEGI's 0.0% category-relative strength and distribution pressure volume confirm that agricultural commodities are caught between weak demand and deflationary pricing.
Agriculture & Livestock is entirely excluded at 0% allocation this week after ranking 9th or 10th among the 10 categories with a final score of only 13.2. The category-level macro fit of 32.0/100 explains why: disinflation pressure is active at -8, liquidity stress at -4, and disinflation itself subtracts -6, creating a -18 total headwind that no technical strength can overcome. MOO's impressive trend and timing scores are rendered irrelevant by a regime in which deflating food and commodity prices are a feature, not a bug, of the disinflationary environment. The absence of any descriptor tailwind—no metals scarcity, no AI growth, no risk appetite boost—leaves agricultural exposure without a structural reason to be owned. To earn even a 5% tier-2 position would require either a sharp shift toward risk appetite or explicit evidence that food-inflation hedging demand is emerging, neither of which is present in the current macro regime.