
2020-07-24
Informational purposes only. The content in this report, including allocations, analysis, and commentary, is provided solely for informational and educational purposes. It does not constitute financial advice, investment advice, trading advice, or any other type of advice. Past performance does not guarantee future results. Always conduct your own research and consult a qualified financial professional before making investment decisions.
Some tracked tickers were excluded due to missing live weekly price data: SGOV: Historical cache SGOV has only 8 usable weekly bars; URNM: Historical cache URNM has only 34 usable weekly bars
Weekly Allocation
| Ticker | Category | Weight | Role |
|---|---|---|---|
| SLV | Precious Metals | 20% | Top-2 (20%) |
| CIBR | Technology | 20% | Top-2 (20%) |
| SMH | AI | 10% | Tier-2 (10%) |
| MOO | Agriculture & Livestock | 10% | Tier-2 (10%) |
| XAR | Defense & Aerospace | 10% | Tier-2 (10%) |
| XLE | Traditional Energy | 10% | Tier-2 (10%) |
| REMX | Industrial Metals | 10% | Tier-2 (10%) |
| XLU | Utilities & Infrastructure | 10% | Tier-2 (10%) |
Trade Instructions — Monday Open
Sell the tranche from 2020-06-26 (completing its 4-week hold). Buy the new tranche. Instructions show net portfolio changes — same-asset positions cancel, weight changes show the delta.
| Action | Ticker | Instruction |
|---|---|---|
| SELL | GLD | Sell 67% of GLD position (reduce 7.50% → 2.50%) |
| SELL | IGV | Sell 40% of IGV position (reduce 12.50% → 7.50%) |
| SELL | PAVE | Sell entire PAVE position (2.50% of portfolio) |
| SELL | ITA | Sell entire ITA position (2.50% of portfolio) |
| SELL | URA | Sell 25% of URA position (reduce 10.00% → 7.50%) |
| SELL | COPX | Sell 25% of COPX position (reduce 10.00% → 7.50%) |
| BUY | XAR | Buy XAR — 12.50% of freed cash (adds 2.50% to portfolio) |
| BUY | XLU | Buy XLU — 12.50% of freed cash (adds 2.50% to portfolio) |
| BUY | SLV | Buy SLV — 25.00% of freed cash (adds 5.00% to portfolio) |
| BUY | MOO | Buy MOO — 12.50% of freed cash (adds 2.50% to portfolio) |
| BUY | CIBR | Buy CIBR — 25.00% of freed cash (adds 5.00% to portfolio) |
| BUY | REMX | Buy REMX — 12.50% of freed cash (adds 2.50% to portfolio) |
Current Portfolio After Trade
Combined holdings across all 4 active tranches. Each tranche is 25% of the portfolio.
| Ticker | % of Portfolio | Weight Bar |
|---|---|---|
| SMH | 12.50% | |
| SLV | 12.50% | |
| XAR | 10.00% | |
| URA | 7.50% | |
| COPX | 7.50% | |
| XLU | 7.50% | |
| MOO | 7.50% | |
| IGV | 7.50% | |
| XLE | 5.00% | |
| XLK | 5.00% | |
| BOTZ | 5.00% | |
| CIBR | 5.00% | |
| GLD | 2.50% | |
| INDA | 2.50% | |
| REMX | 2.50% |
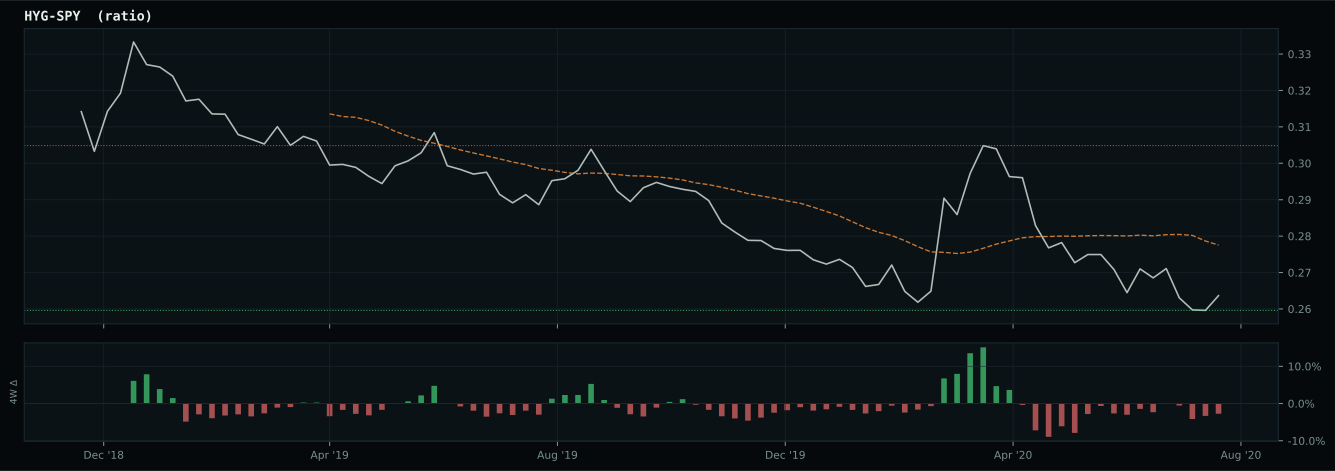
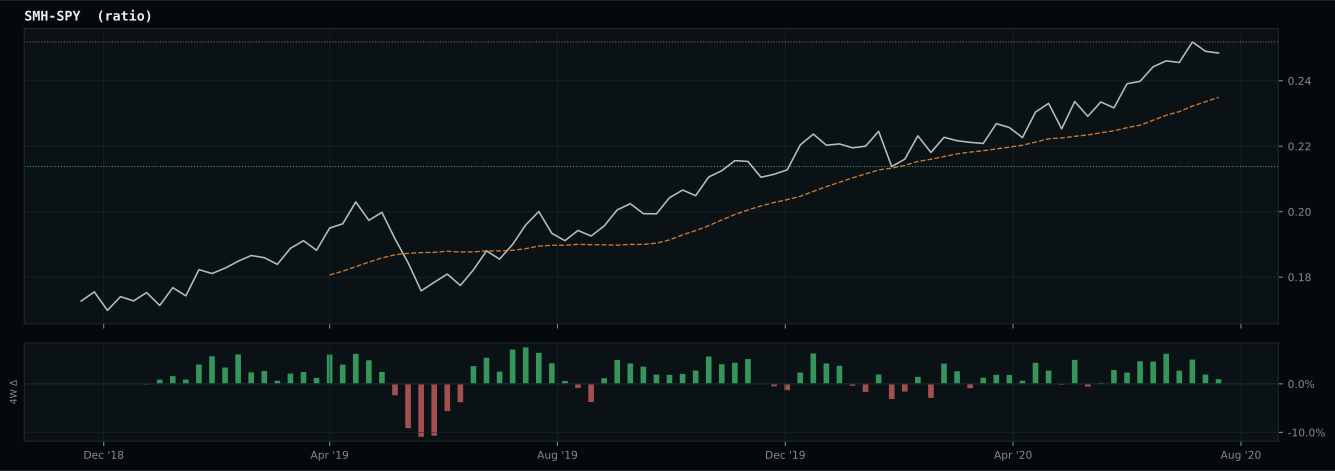
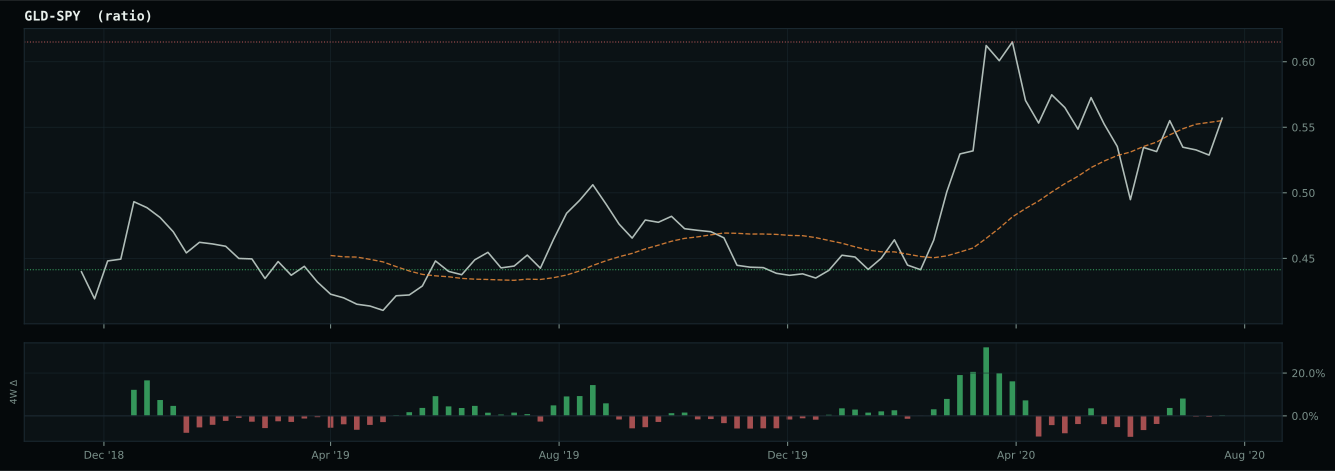
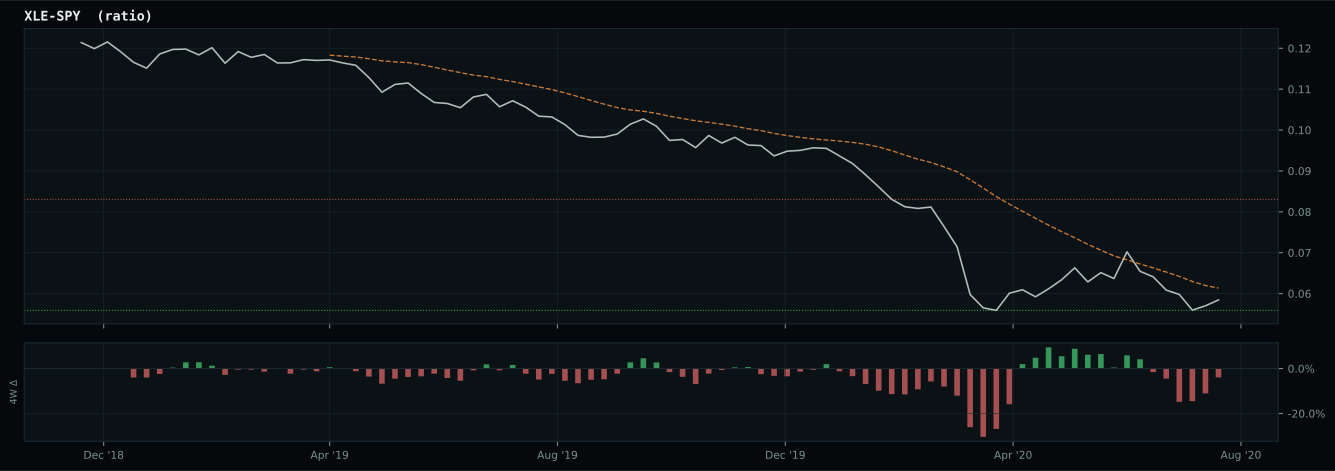
Macro Regime — Late-Cycle Reflation
Macro Evidence Charts
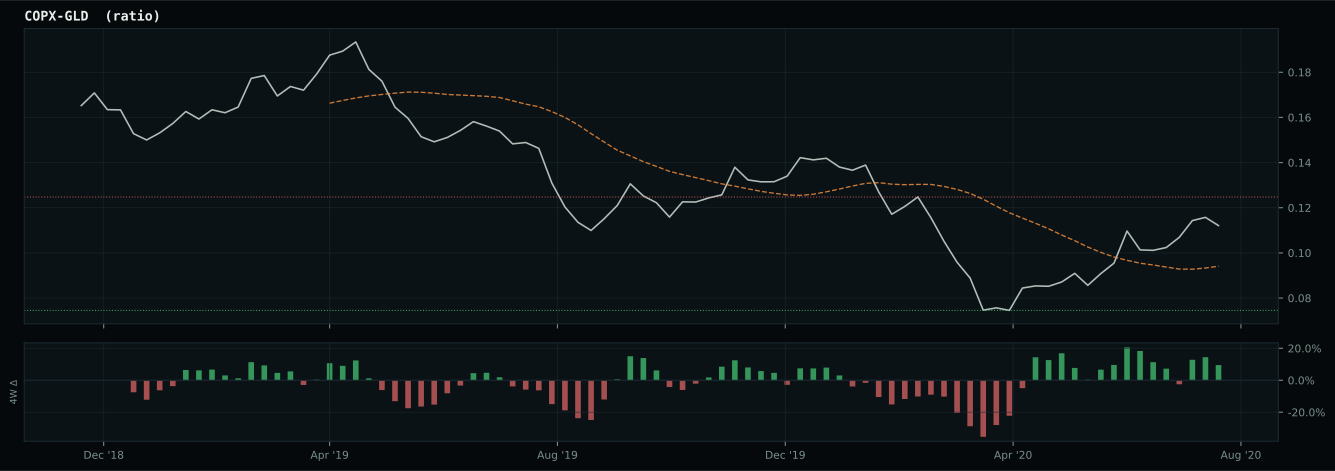
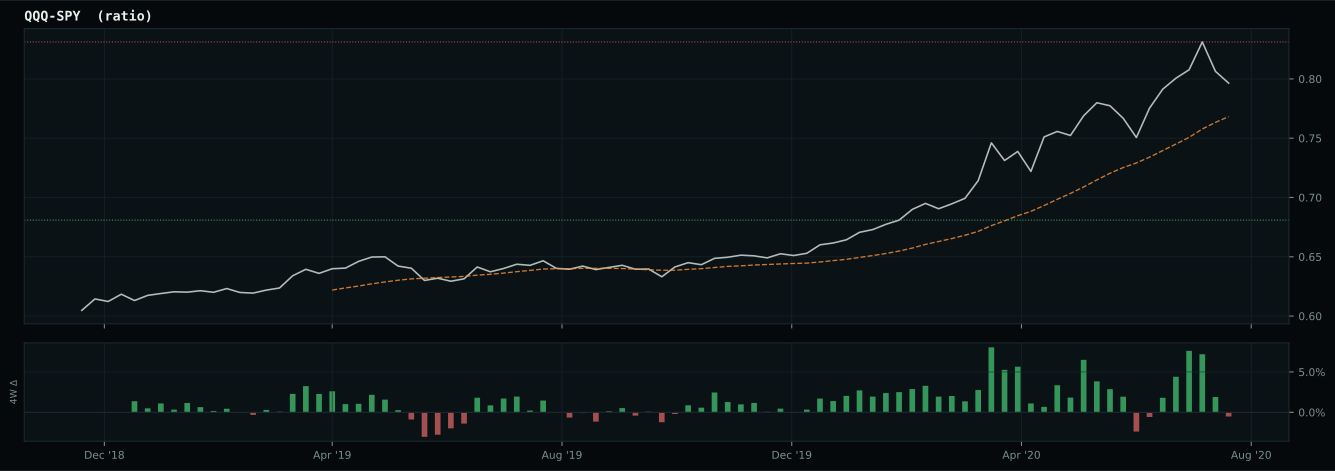
Market-implied signals behind the macro regime scores. Each ratio compares two assets; the direction and slope of the ratio is what the macro engine reads.
Crypto Regime — NoCrypto
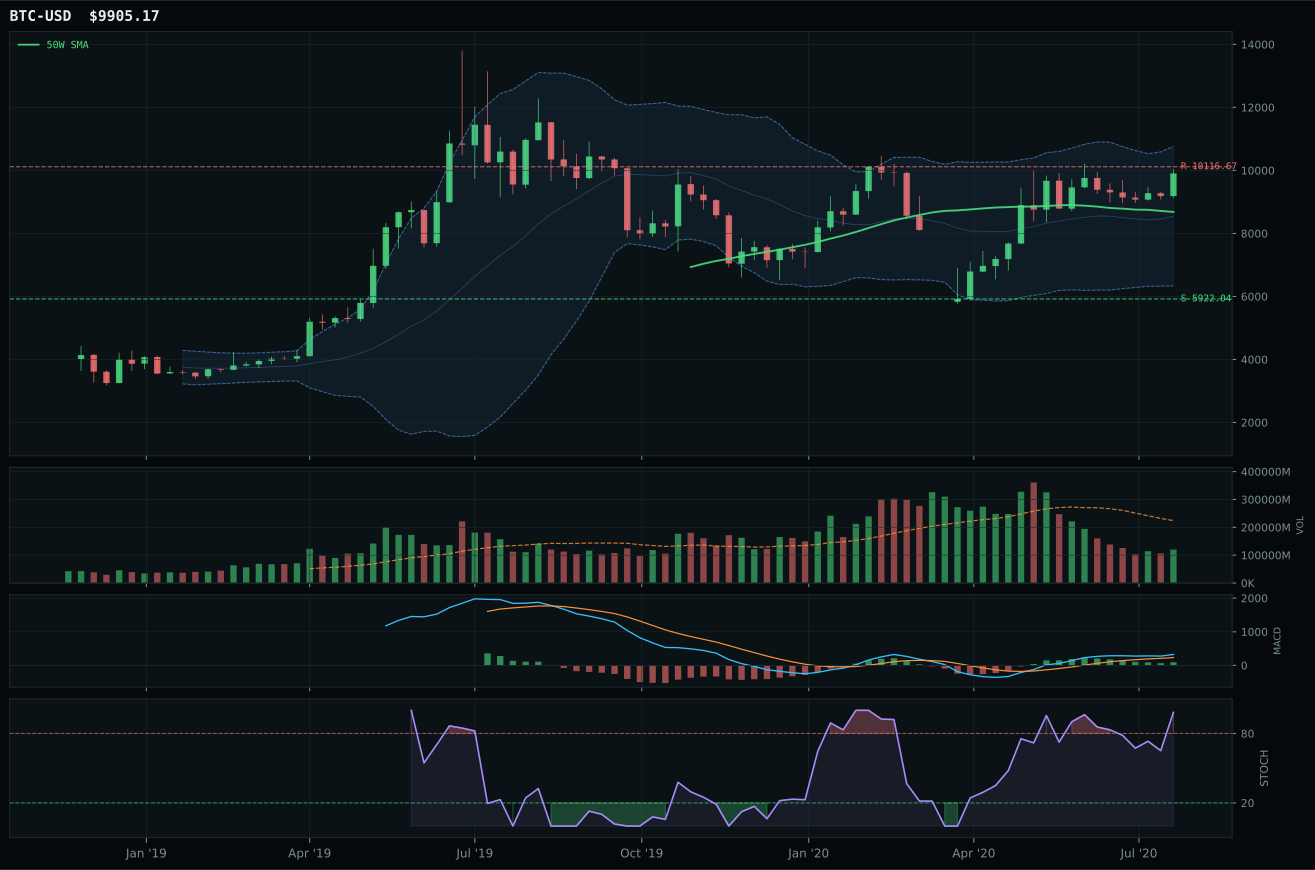
post-touch structure is too wide to count as a range; max/min close ratio is 1.81
TrendBTC not confirmed
one or more available conditions failed

Category Rankings
| Rank | Category | Winner | Score | Alloc | 4W Ret | Peers (4W) |
|---|---|---|---|---|---|---|
| 1 | Precious Metals | SLV | 59.2 | 20% | +11.17% | GDX -4.3% · GLD +0.6% |
| 2 | Technology | CIBR | 56.4 | 20% | +3.87% | IGV +6.2% · XLK +13.0% |
| 3 | AI | SMH | 54.3 | 10% | +5.97% | BOTZ +6.1% · AIQ +7.6% |
| 4 | Agriculture & Livestock | MOO | 46.4 | 10% | +7.16% | WEAT -1.1% · VEGI +8.0% |
| 5 | Defense & Aerospace | XAR | 43.5 | 10% | +2.69% | ITA +1.0% · ROKT +4.3% |
| 6 | Traditional Energy | XLE | 40.7 | 10% | -3.23% | FCG -1.6% · XOP -0.9% |
| 7 | Industrial Metals | REMX | 39.5 | 10% | +1.82% | COPX +5.6% · PICK +3.3% |
| 8 | Utilities & Infrastructure | XLU | 39.0 | 10% | -1.18% | PAVE +6.4% · IGF +2.2% |
| 9 | Nuclear Energy | URA | 38.0 | 0% | -2.55% | NLR -0.5% |
| 10 | Emerging Markets | INDA | 29.3 | 0% | +4.57% | IEMG +3.5% · ILF -5.0% |
Precious Metals — SLV
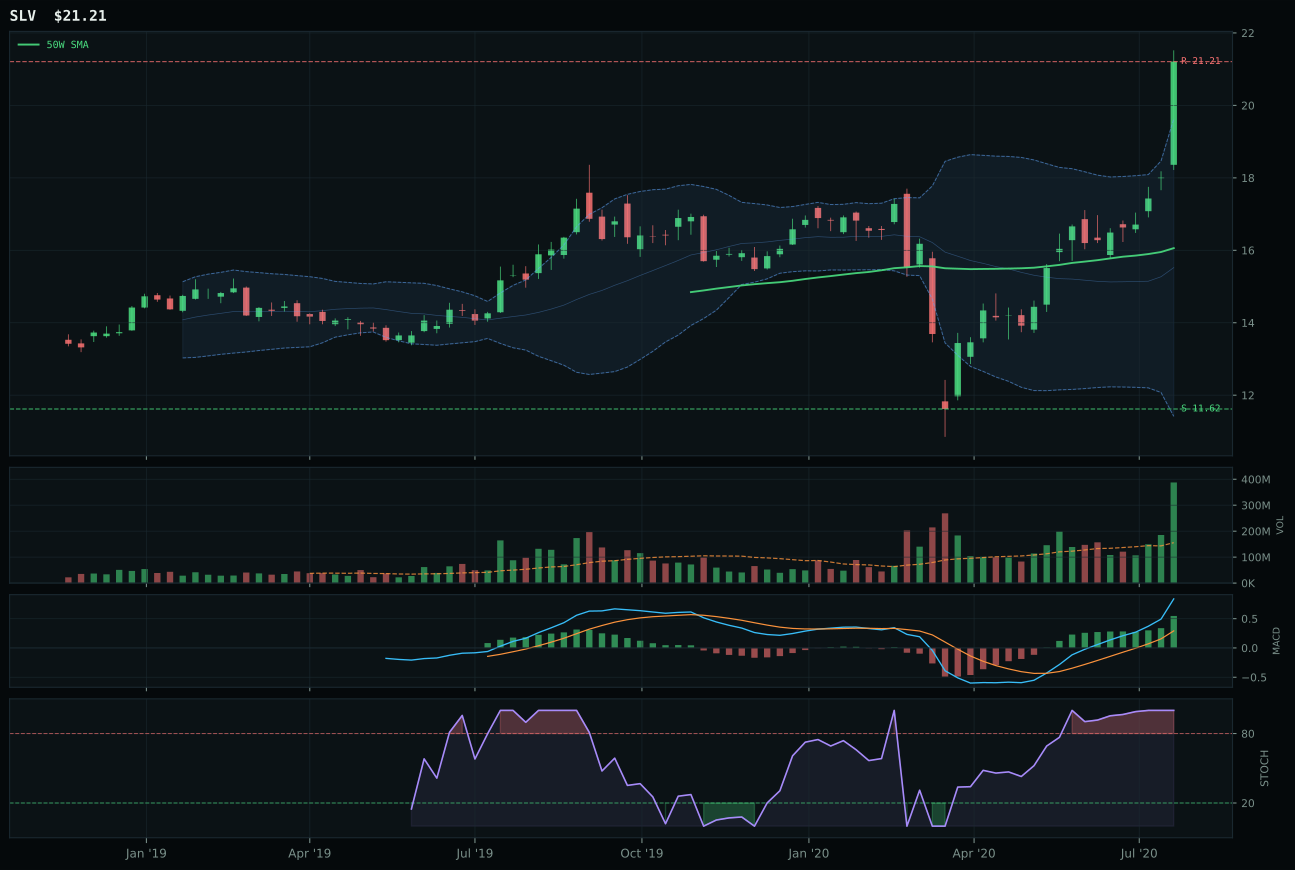
SLV has a vertical extension profile with 35.9% 13-week relative strength versus SPY.
A failed hold above support would weaken the setup.
Actionable but governed by invalidation levels.
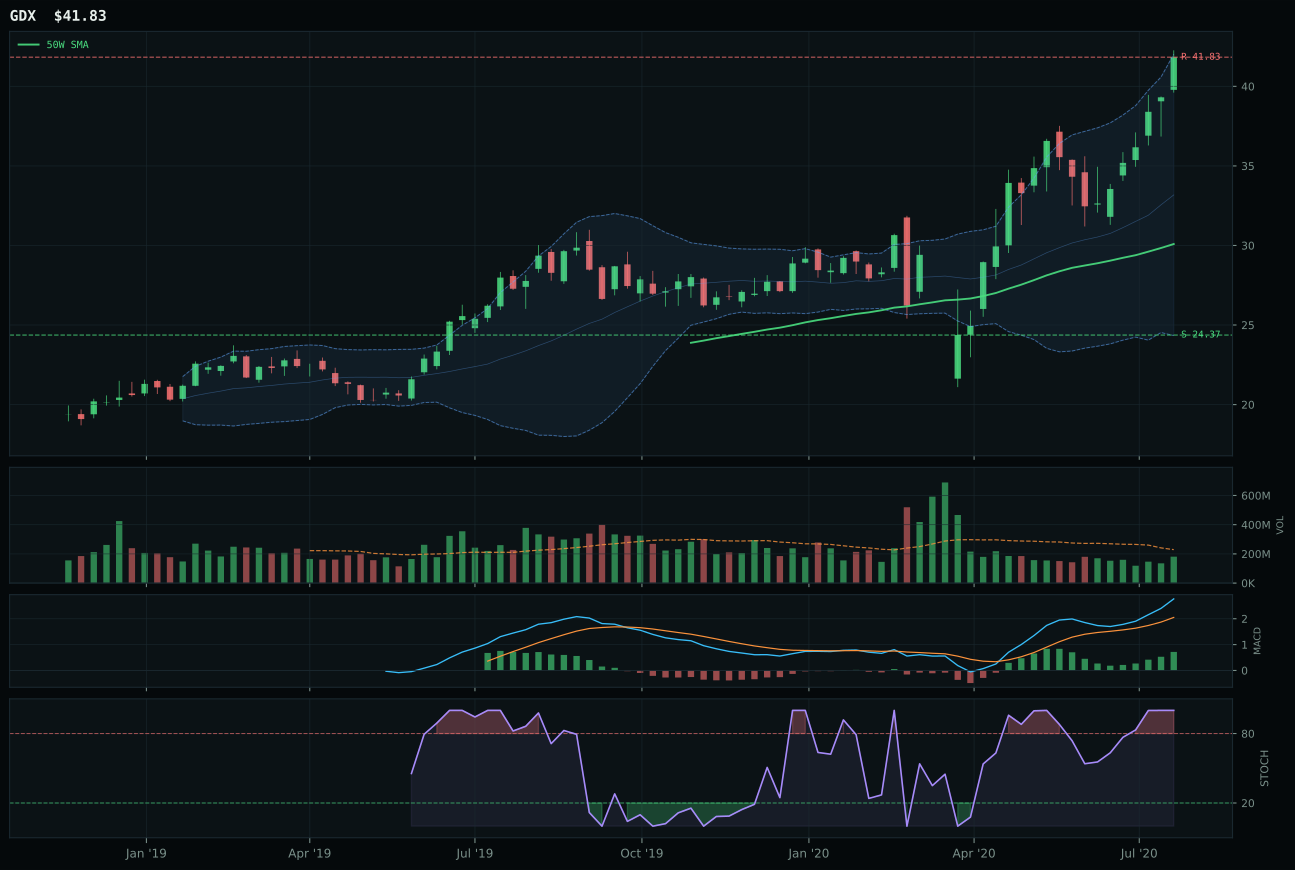
GDX has a vertical extension profile with 9.9% 13-week relative strength versus SPY.
A failed hold above support would weaken the setup.
Actionable but governed by invalidation levels.
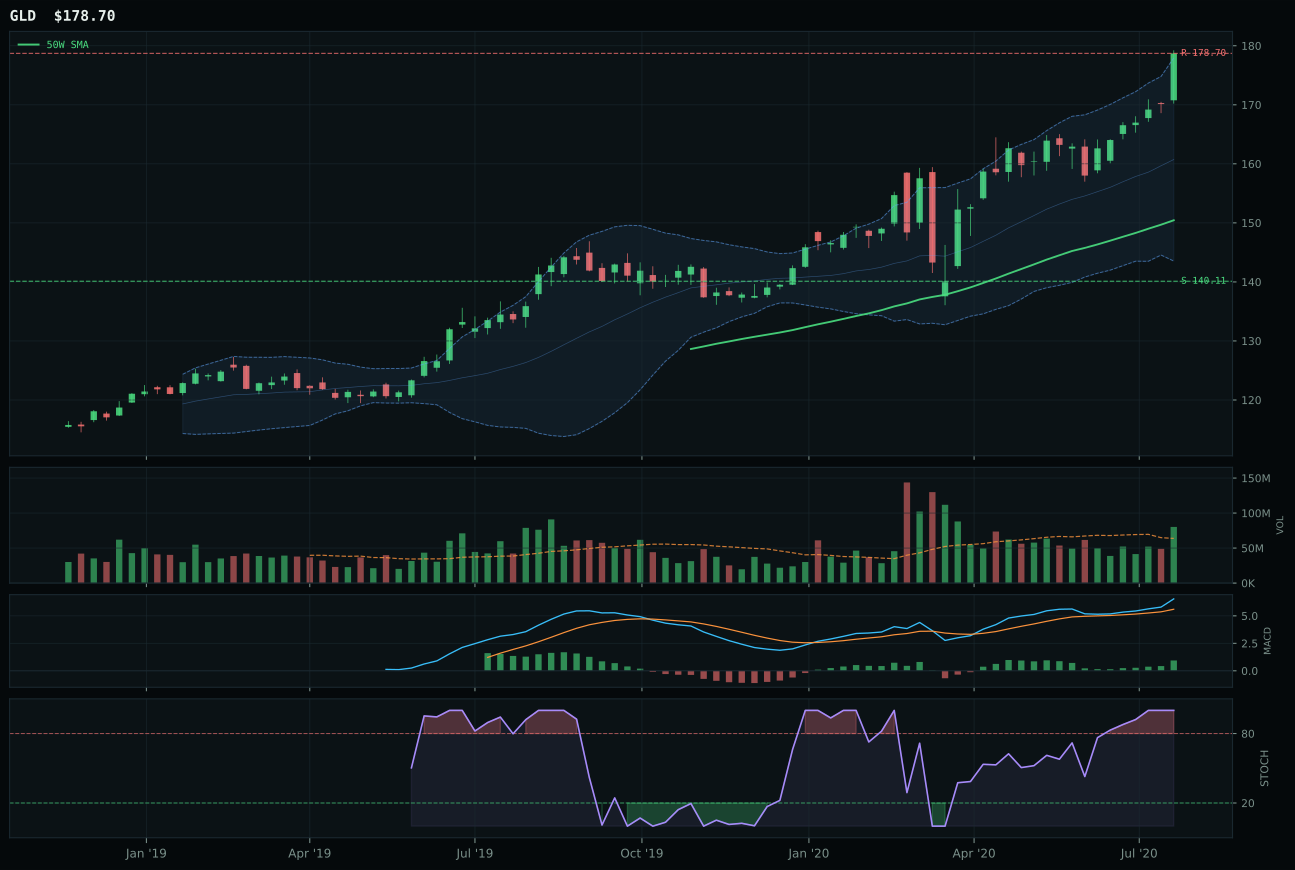
GLD has a vertical extension profile with -3.5% 13-week relative strength versus SPY.
A failed hold above support would weaken the setup.
Actionable but governed by invalidation levels.
SLV routed GDX and GLD to claim the top-2 precious-metals slot by delivering the exact setup late-cycle reflation demands: extended upside with structural cleanness and volume confirmation. SLV sits 32.1% above the 50W with a near-perfect 89.4/100 structure score, its 91.7 cleanliness rating reflecting zero ambiguity in the trend. Crucially, SLV is the only precious-metal representative with accumulation-level volume at 2.49x the 20-week average—this is not a retail cascade but institutional deployment into a monetary-hedge theme. Its 49.3% thirteen-week return dwarfs GDX's 23.3%, and 35.9% SPY-relative strength dominates GDX's 9.9% by a 3.5:1 margin. GDX loses on structure (75.6 vs 89.4), risk-reward (38.2 vs 43.7), and category-relative strength (0.0% vs 26.0%), all symptomatic of its identity as a leveraged miner play; it captures upside but sacrifices the defensive monetary-proxy quality that GLD and SLV each embody. Both leaders sit at resistance (SLV $21.21, GDX $41.83), meaning upside risk is binary, but SLV's volume sponsorship provides a firmer foundation for hold-through breakout.
Precious Metals earned the second 20% allocation slot because it ranks second overall at 59.2 and delivers the highest macro fit at 46.0/100 within a regime where inflation pressure and liquidity stress coexist. Metals scarcity is not explicitly coded in the descriptor set, yet the market is pricing it, and SLV's performance confirms institutional capital recognizes silver's hybrid monetary-and-industrial beta. The category sits at resistance, both price-wise and narratively: extend further and SLV risks becoming a pure inflation-expectations play, vulnerable to any Fed messaging tilt toward tightening. Conversely, any close below $16.62 support (−17.7% downside) would signal a break in the inflation narrative and warrant a trim to 10%. The 20% weight acknowledges that precious metals are one of two legs of the portfolio actually being accumulated on volume; the other is technology. This pair—CIBR and SLV—represents true conviction capital, not tactical rotations.
Technology — CIBR
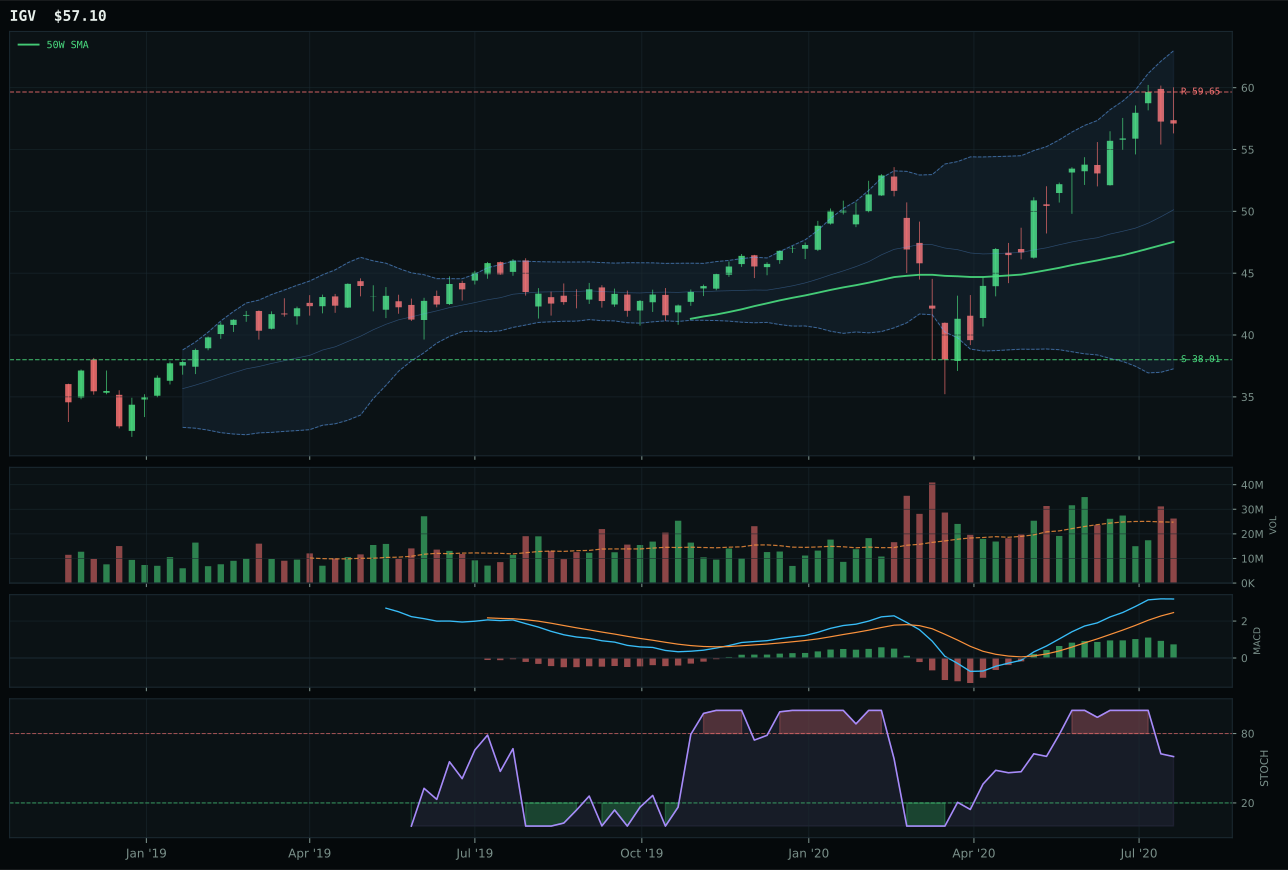
IGV has a vertical extension profile with 9.5% 13-week relative strength versus SPY.
A failed hold above support would weaken the setup.
Actionable but governed by invalidation levels.
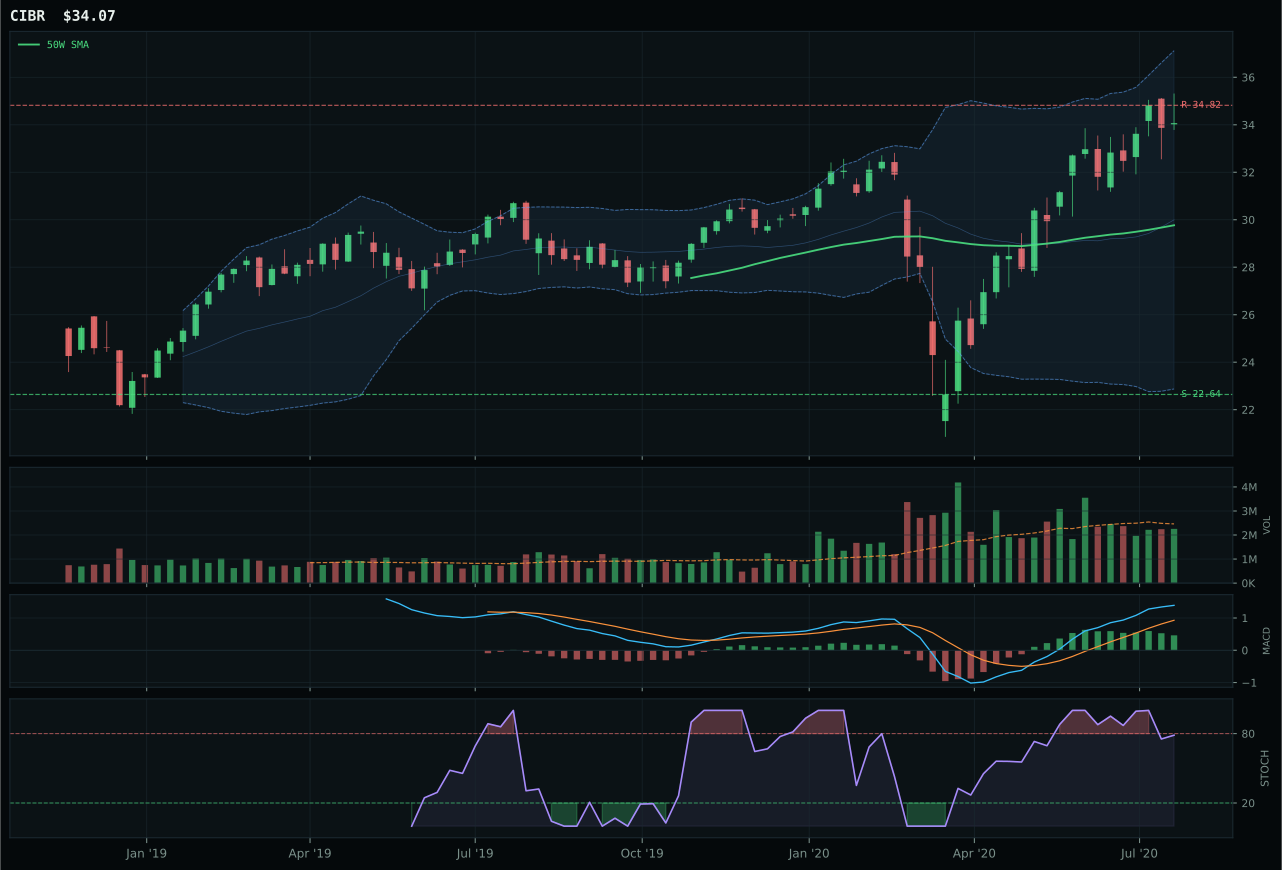
CIBR has a neutral structure profile with 6.3% 13-week relative strength versus SPY.
A failed hold above support would weaken the setup.
Actionable but governed by invalidation levels.
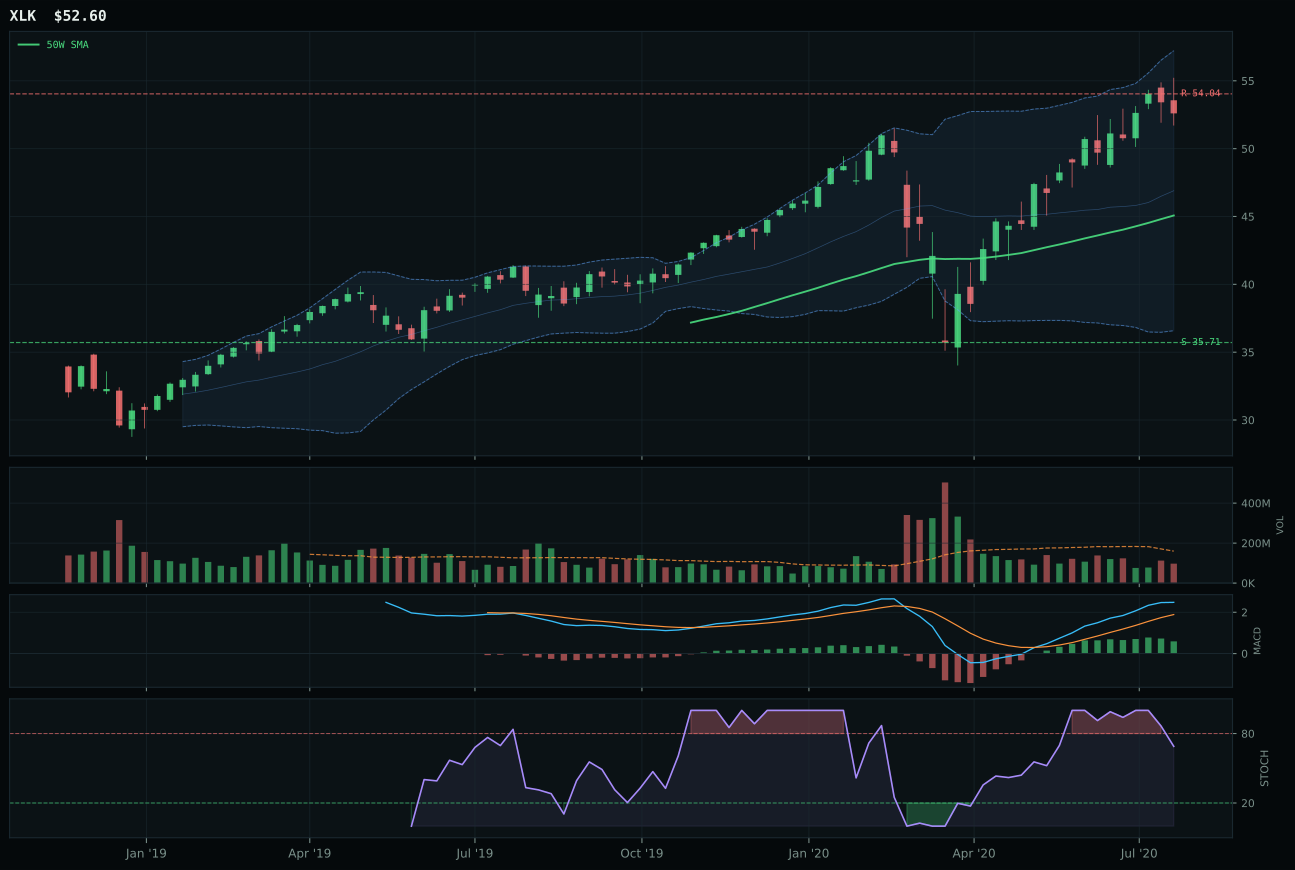
XLK has a vertical extension profile with 5.3% 13-week relative strength versus SPY.
A failed hold above support would weaken the setup.
Actionable but governed by invalidation levels.
CIBR edged past IGV and XLK by maintaining composure at a critical inflection point. Price sits 14.5% above the 50-week moving average—extended enough to matter, but not so far that every new entry is underwater. Its 13-week return of 19.7% pairs with a trend score of 100/100 and a structure rating of 74.8/100, indicating clean upside without the vertical urgency that plagues both runners-up. IGV, which outperformed on 13-week momentum at 22.9% and SPY-relative strength at 9.5%, suffered a critical timing penalty: it sits 20.1% above the 50W, crowding the overbought zone where mean reversion becomes a tangible risk. MACD remains bullish but flattening across the category, and volume is neutral across the board—meaning the cohort is buying, but no dramatic accumulation is occurring. CIBR's 6.3% SPY-relative return and flat category-relative strength signal a more balanced leadership profile, one that rewards the patient buyer over the late chaser.
Technology earned its 20% slot as one of the two highest-scoring categories this week because momentum and trend confluence outweighed timing risk in a late-cycle reflation regime. Category score of 56.4 reflects macro fit of 44.0/100, penalized by active liquidity stress (−10) and credit stress (−7) but bolstered by risk-appetite support (+9) and AI-growth sponsorship (+6). Capital is rotating into tech names that deliver earnings leverage in reflationary environments, and the setup is neither explosive nor fragile—simply the strongest available path forward. CIBR's 100/100 trend combined with sub-15% extension leaves room for both continuation and pullback absorption, a risk-reward asymmetry that justifies the weight against emerging-market fragility and energy-sector weakness.
AI — SMH
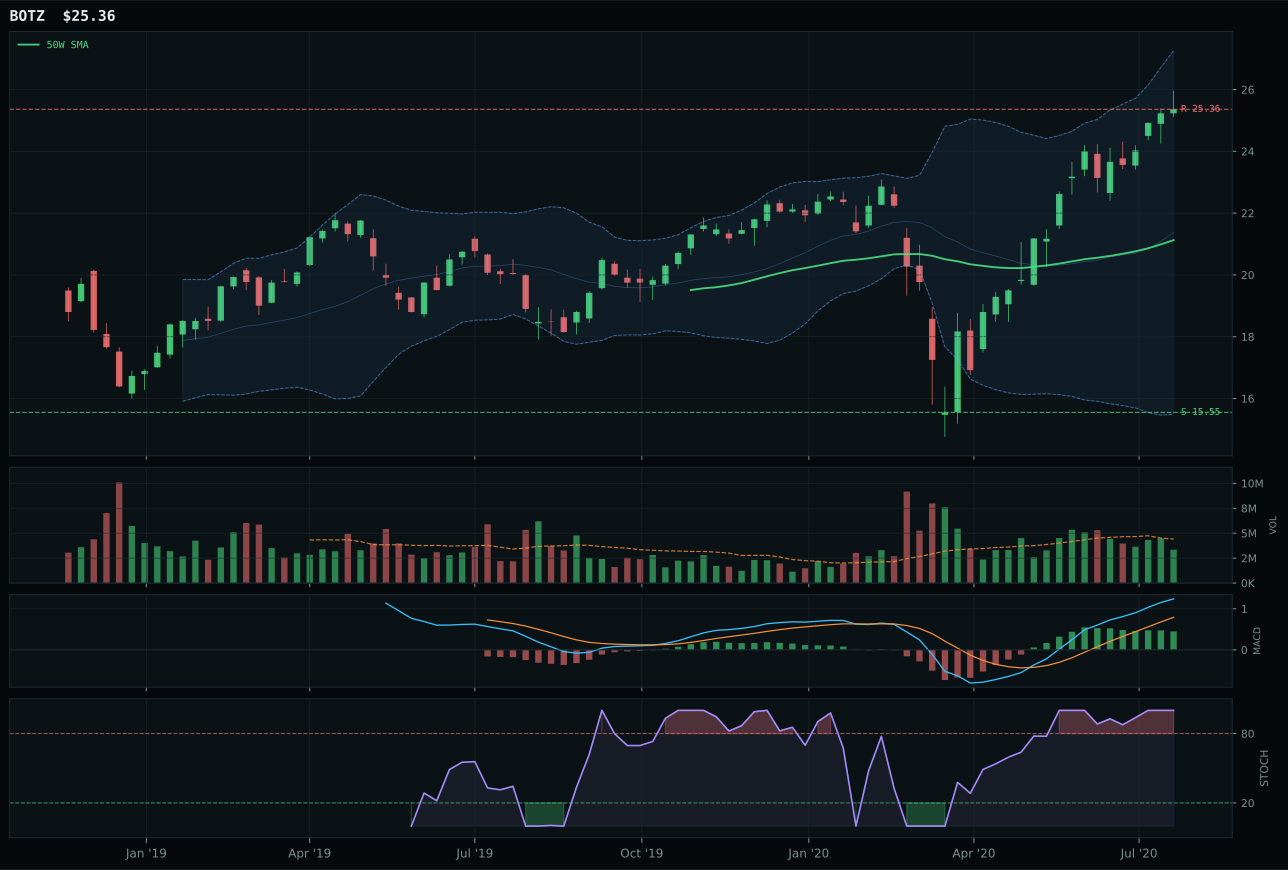
BOTZ has a vertical extension profile with 16.7% 13-week relative strength versus SPY.
A failed hold above support would weaken the setup.
Actionable but governed by invalidation levels.
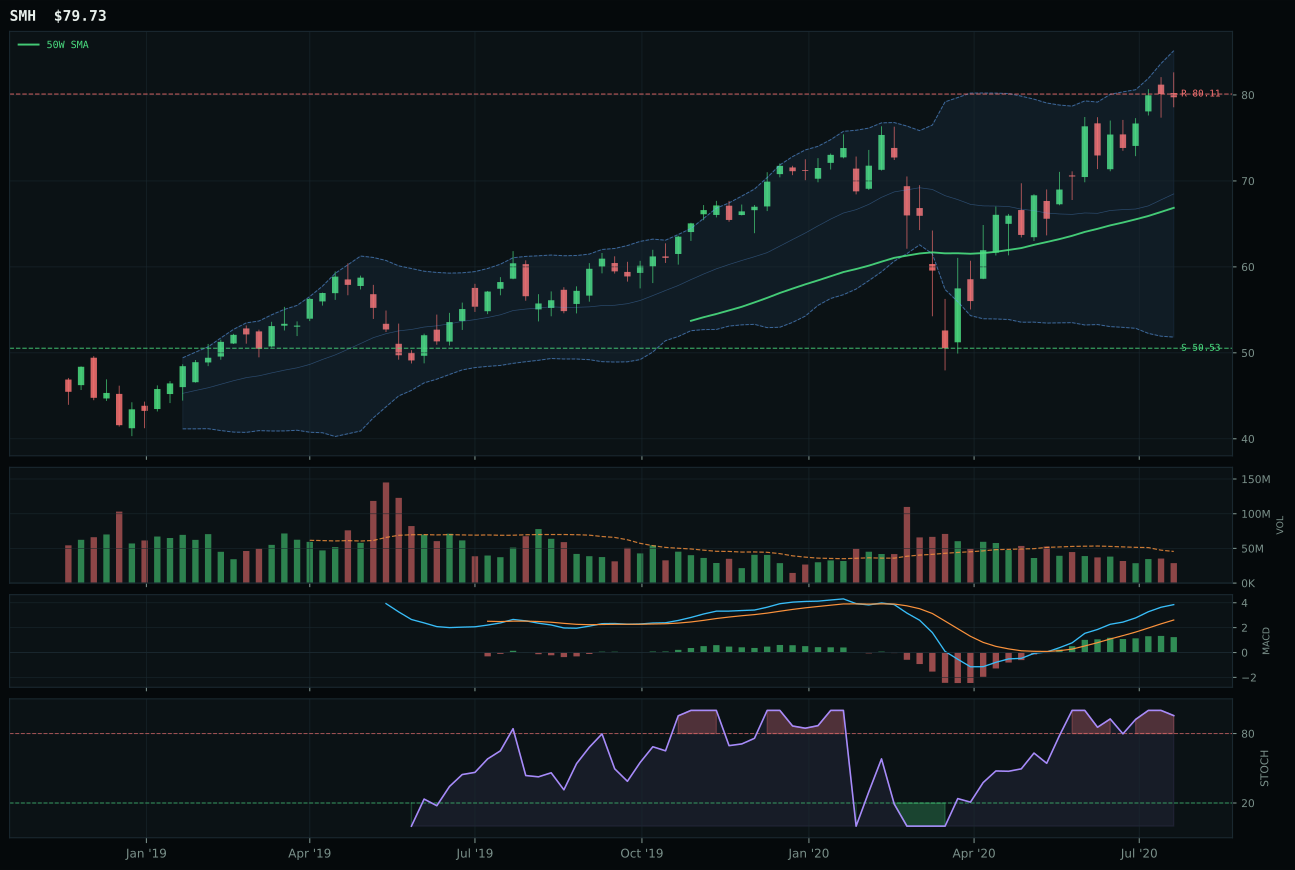
SMH has a vertical extension profile with 7.5% 13-week relative strength versus SPY.
A failed hold above support would weaken the setup.
Actionable but governed by invalidation levels.
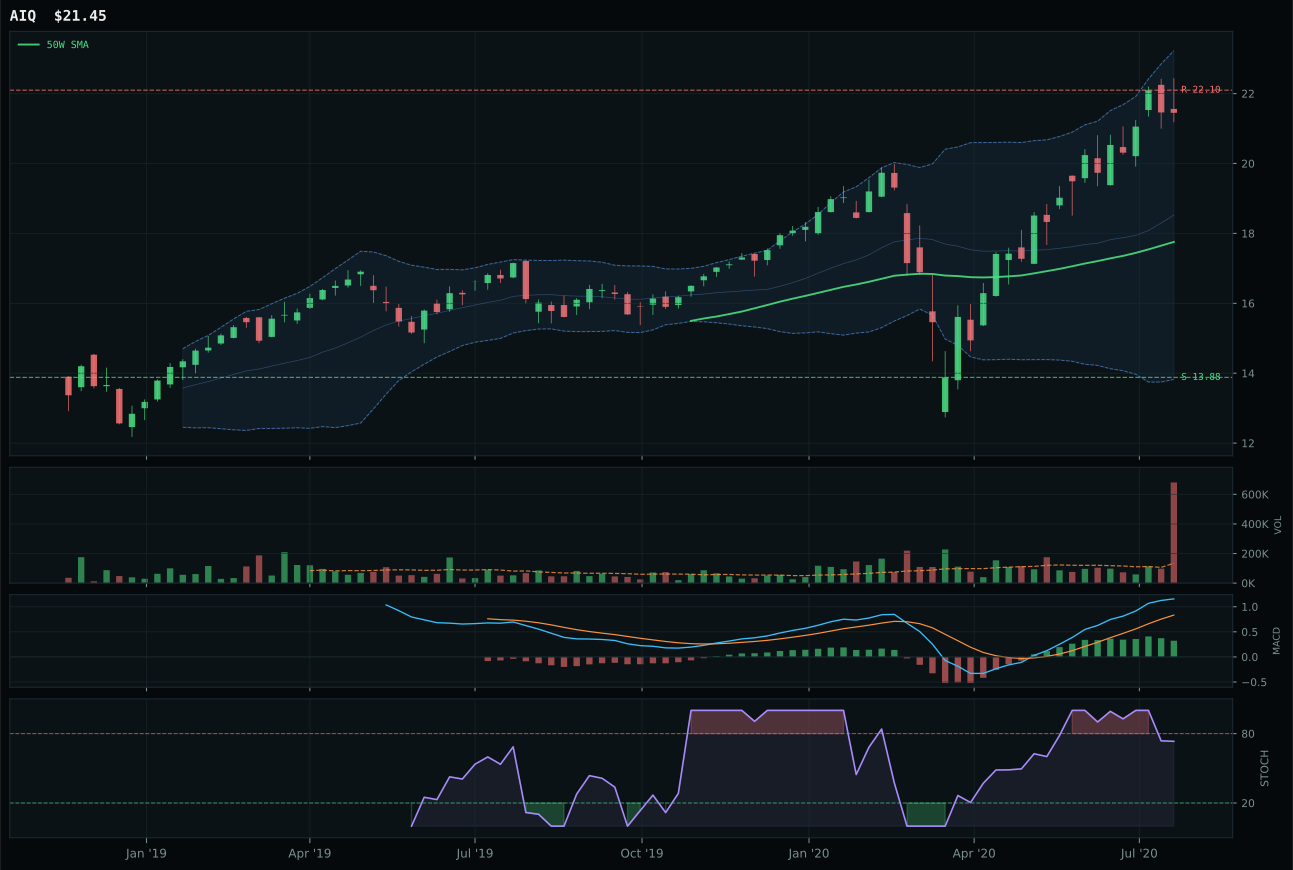
AIQ has a vertical extension profile with 9.7% 13-week relative strength versus SPY.
A failed hold above support would weaken the setup.
Tracked, but not top-2 eligible because: .
SMH won the AI category by 0.5 points over BOTZ, but the margin masks a crucial technical difference: MACD confirmation. While both trades sport perfect 100/100 momentum scores and sit at near-52-week highs, SMH's MACD is bullish and improving versus BOTZ's bullish but flattening profile. That one metric prevented BOTZ from fully capitalizing on its superior 13-week return of 30.1% and 16.7% SPY-relative strength. SMH's 20.9% thirteen-week return and thinner 7.5% relative strength actually signal a more sustainable advance because fewer traders are chasing on relative value grounds. Volume participation across both is thin (SMH at 0.63x, BOTZ at 1.0x average), which means the moves have been price-driven rather than accumulated. SMH's timing score of 37/100 versus BOTZ's 32/100 reflects its 19.2% extension above the 50W—painful for entry but still negotiable against a flattening oscillator that hasn't yet rolled over.
AI landed at 10% allocation despite a 54.3 category score—third among the seven eligible categories—because late-cycle reflation and positive risk appetite support the theme, but execution risk is mounting visibly. Category-level macro fit scores 54.0/100, with AI-growth sponsorship adding +14 points and risk appetite adding +10, yet liquidity stress (−12) and credit stress (−8) create headwinds that prevent this from ranking top-2. Both SMH and BOTZ are extended vertically with overbought stochastic RSI readings of 0.96, and timing penalties of 32–37/100 reveal that buyers are paying up for an idea rather than entering a coiled setup. The allocation holds because semiconductor demand from data centers and manufacturing remains macro-supported, but a single momentum failure—MACD rollover or support breach at the 50W—would justify an immediate trim to 5% or exit.
Agriculture & Livestock — MOO
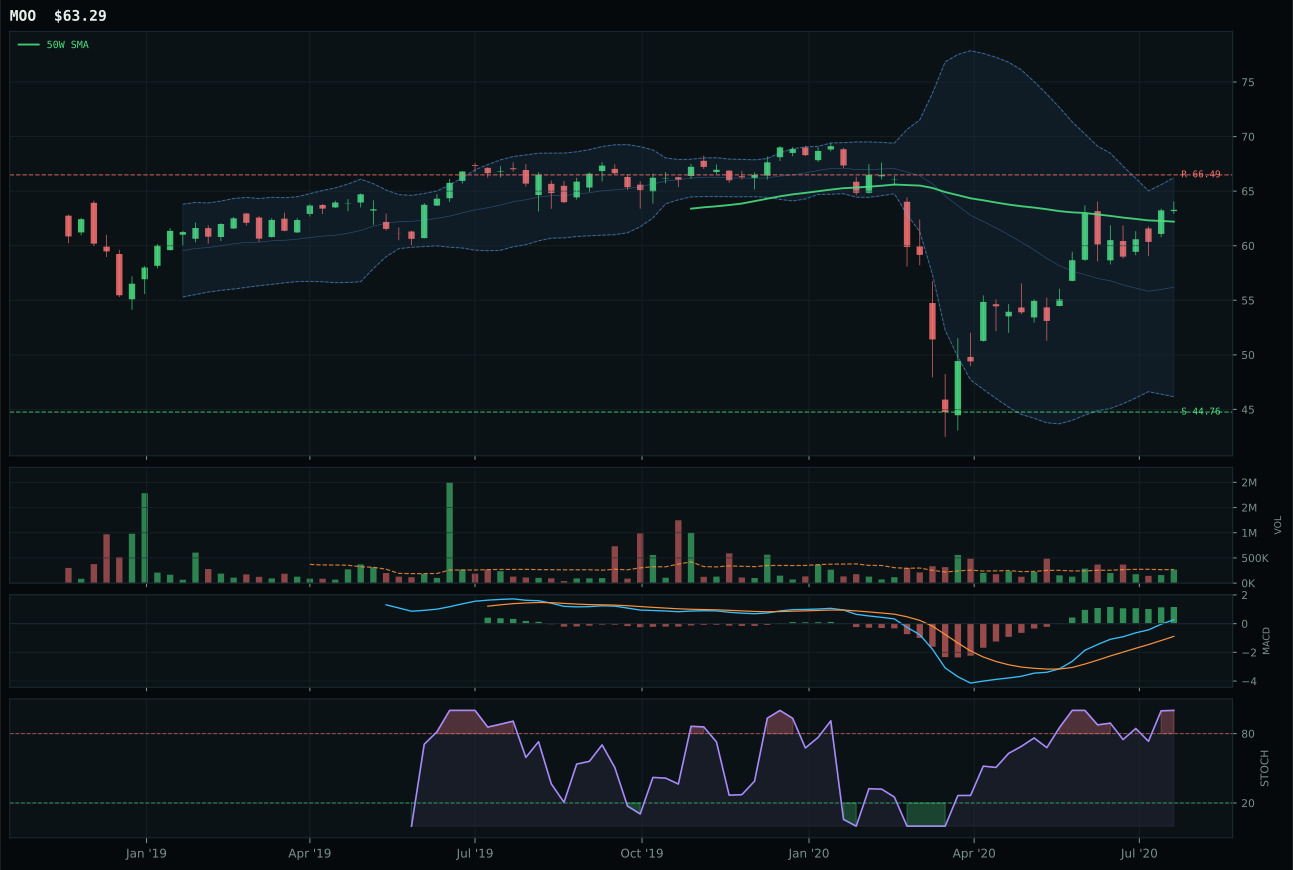
MOO has a compression near 50W profile with 3.9% 13-week relative strength versus SPY.
A failed hold above support would weaken the setup.
Actionable but governed by invalidation levels.
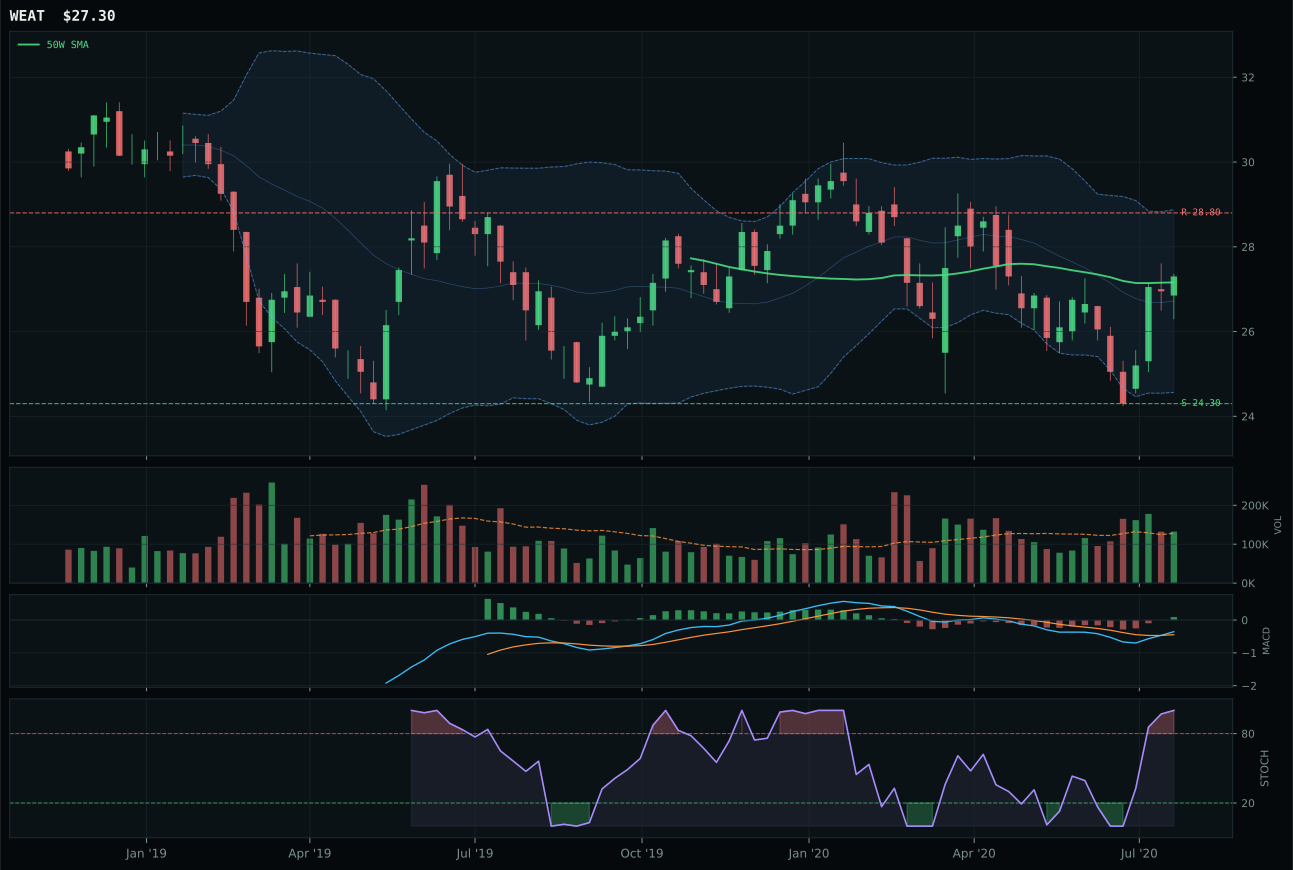
WEAT has a compression near 50W profile with -13.4% 13-week relative strength versus SPY.
A failed hold above support would weaken the setup.
Tracked, but not top-2 eligible because: .
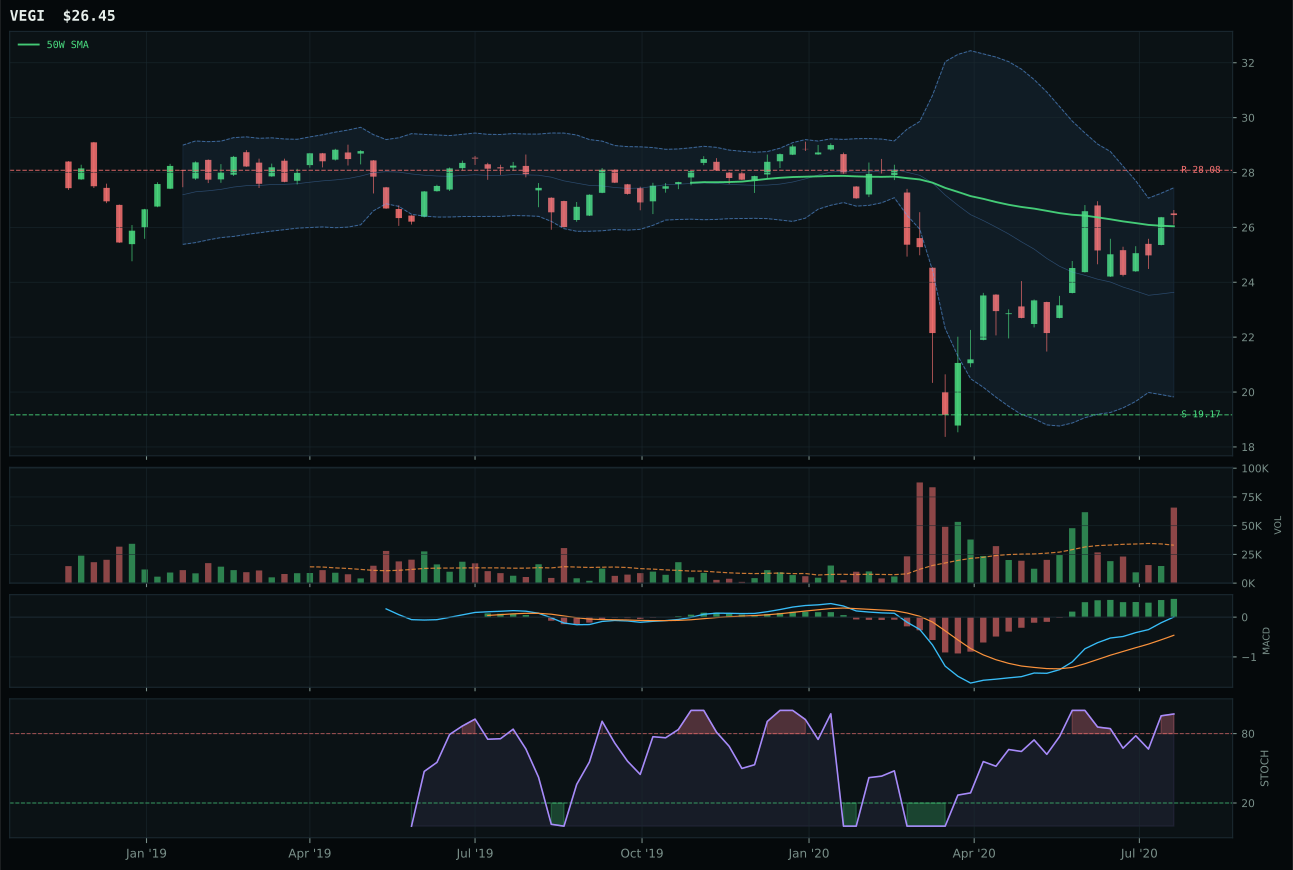
VEGI has a compression near 50W profile with 2.3% 13-week relative strength versus SPY.
A failed hold above support would weaken the setup.
Tracked, but not top-2 eligible because: .
MOO crushed WEAT by 41.1 points by combining near-perfect timing (100/100) with macro sponsorship that WEAT could not match. MOO trades just 1.7% above the 50W, sitting squarely in the compression zone where both supply-shortage and inflation-pressure narratives converge. Its timing score of 100/100 versus WEAT's equivalent ranking masks a critical difference in structure: MOO scores 75.5 on cleanliness and compression metrics, while WEAT manages only 71.1. More damning, WEAT's 13-week return flatlined at 0%, with −13.4% SPY-relative strength, signaling that agribusiness as a sector is lifting while wheat futures specifically are failing to participate. MOO's 17.3% thirteen-week performance with 3.9% SPY-relative return shows balanced leadership; MACD is bullish and improving across both, and stochastic RSI is overbought at 1.00 for each, but volume sponsorship matters: MOO trades at 1.00x average volume (neutral but stable), while WEAT's neutral volume paired with zero momentum suggests it lacks conviction from smart money.
Agriculture & Livestock landed 10% despite a category score of 46.4—sixth of ten—because supply shortage (+13) and inflation pressure (+10) active simultaneously in a late-cycle reflation regime create asymmetric payoff. Category macro fit hits 85.0/100, the second-highest after precious metals, powered by real-asset sponsorship (+8) and the regime tailwind (+8). MOO's technical evidence scores 90.2/100, an outlier strength driven by perfect timing and momentum confirmation, yet the category score falls to 46.4 because of broader volatility in peers and thin participation (0.47x average) across the basket. The allocation holds because food inflation is a carrier of broader reflation themes, but execution is narrow: MOO must maintain compression near the 50W and defend it against any credit-stress shock that would force fund redemptions. Any close below $44.76 support (−41.4% downside) would justify a 5% trim, as the macro narrative assumes orderly reflationary pressure, not deflationary liquidation.
Defense & Aerospace — XAR
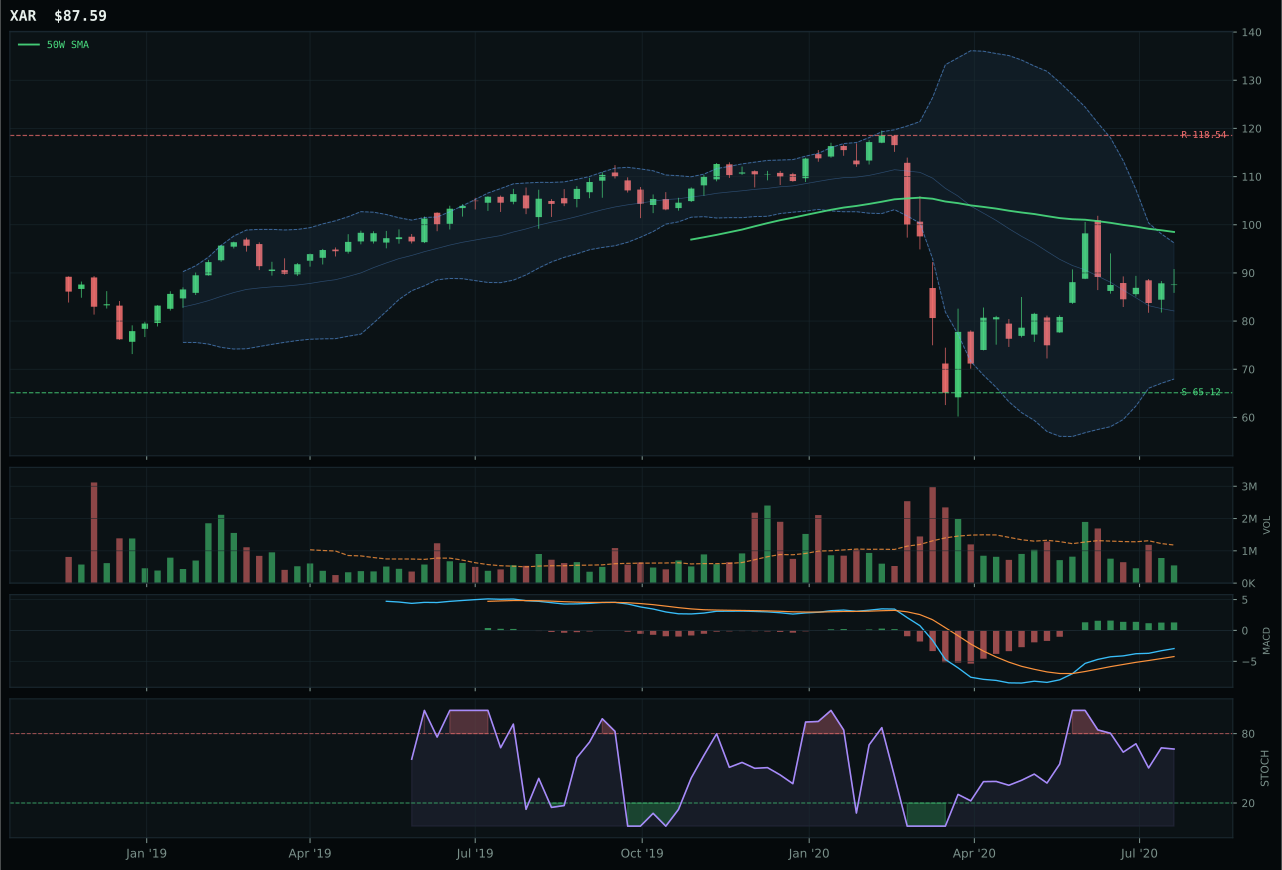
XAR has a neutral structure profile with 1.4% 13-week relative strength versus SPY.
A failed hold above support would weaken the setup.
Actionable but governed by invalidation levels.
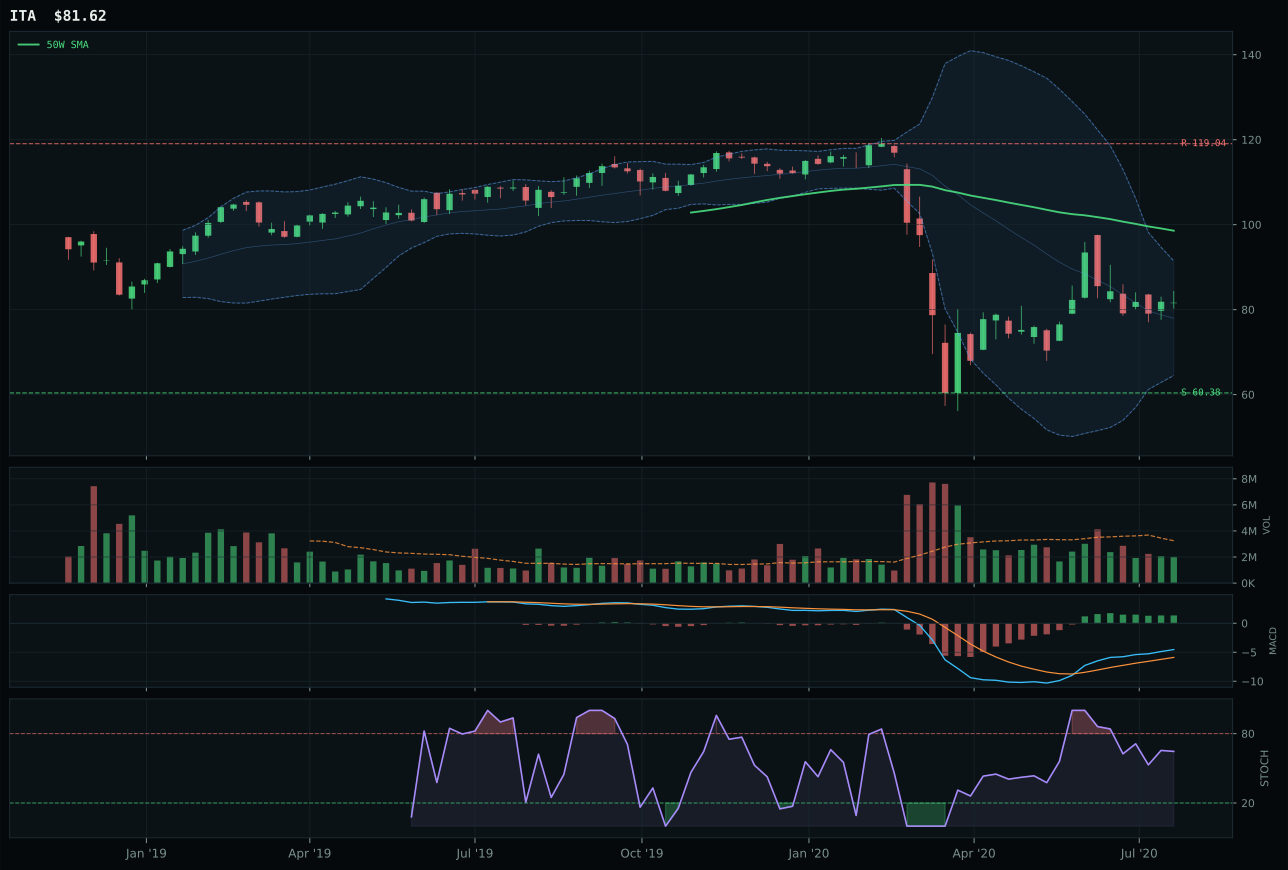
ITA has a neutral structure profile with -3.6% 13-week relative strength versus SPY.
A failed hold above support would weaken the setup.
Actionable but governed by invalidation levels.
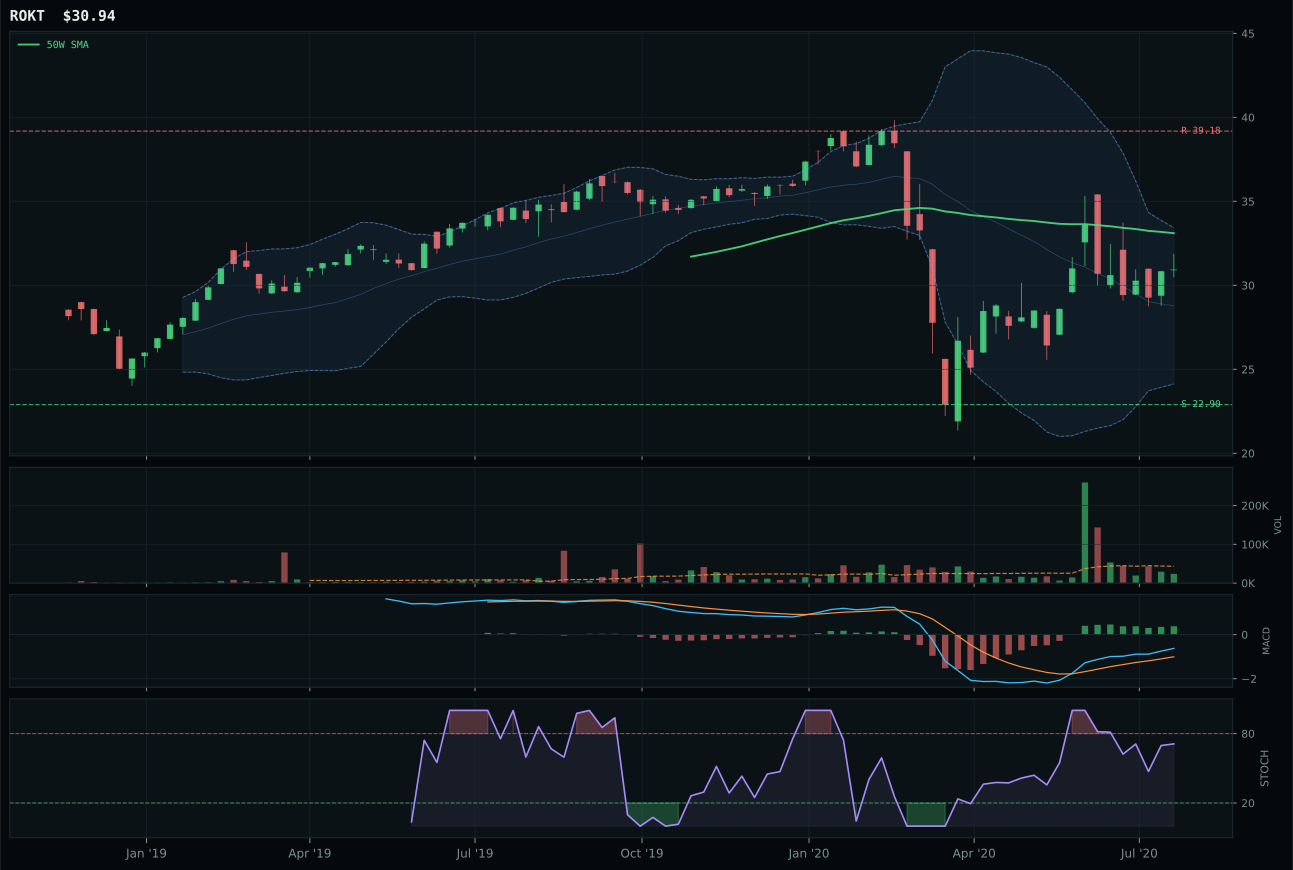
ROKT has a neutral structure profile with -1.3% 13-week relative strength versus SPY.
A failed hold above support would weaken the setup.
Tracked, but not top-2 eligible because: .
XAR won by 19.4 points over ITA despite sitting below the 50-week moving average, a position that typically punishes categories seeking capital. The win hinges on relative strength: XAR trades 2.6% above the category median versus ITA's −2.3% lag, and carries a 1.4% SPY-relative return that, while modest, beats ITA's −3.6% headwind. Both sit in neutral structure and share identical MACD (bullish but flattening) and stochastic RSI (falling/neutral at 0.67) readings, making the spread a pure measure of breadth and persistence. XAR's 14.8% thirteen-week return trounces ITA's 9.8%, and its cleaner Fibonacci placement—middle retracement zone rather than a deeper pocket—suggests less capitulation preceded this bounce. Volume is thin across the category at 0.47x average, meaning support for any recovery will depend on specialist accumulation rather than retail enthusiasm. ITA's structural weakness (64.1 vs 64.3 on cleanliness) combined with category-relative underperformance sealed its runner-up status.
Defense & Aerospace holds 10% allocation despite a category score of 43.5—eighth of ten—because late-cycle reflation provides macro tailwinds (+6) and geopolitical risk appetite supports defense spending. Category macro fit registers 57.0/100, helped by the regime itself and credit-stress containment (+2), but the 3/2/1 weighted basket starts at only 53.8/100 before penalty testing. XAR's modest trend score of 63/100 and neutral momentum (78/100) reflect neither leadership nor breakdown; instead, the position offers a tactical fence against inflation and a hedge on policy spending. The 10% weight is defensive, appropriate for a category that would require a sharp 15–20% breach below the 200W support ($65.12) to warrant exit, and equally would need to recapture the 50W ($100.99) plus 5% upside to justify upgrading to 15%. This is a hold-and-monitor slot, not a conviction long.
Traditional Energy — XLE
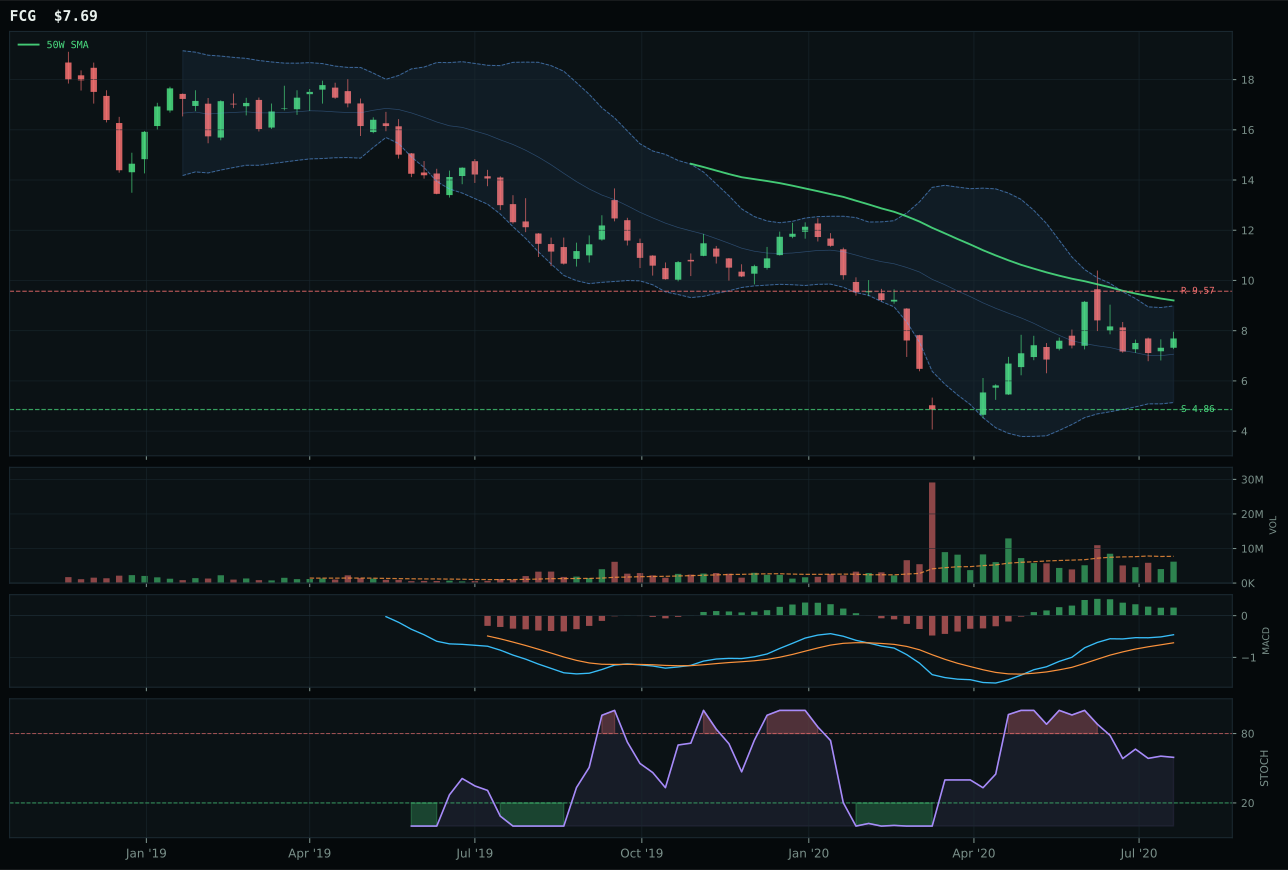
FCG has a neutral structure profile with 1.6% 13-week relative strength versus SPY.
Extension and support failure are the main tactical risks.
Tracked, but not top-2 eligible because: structurally broken.
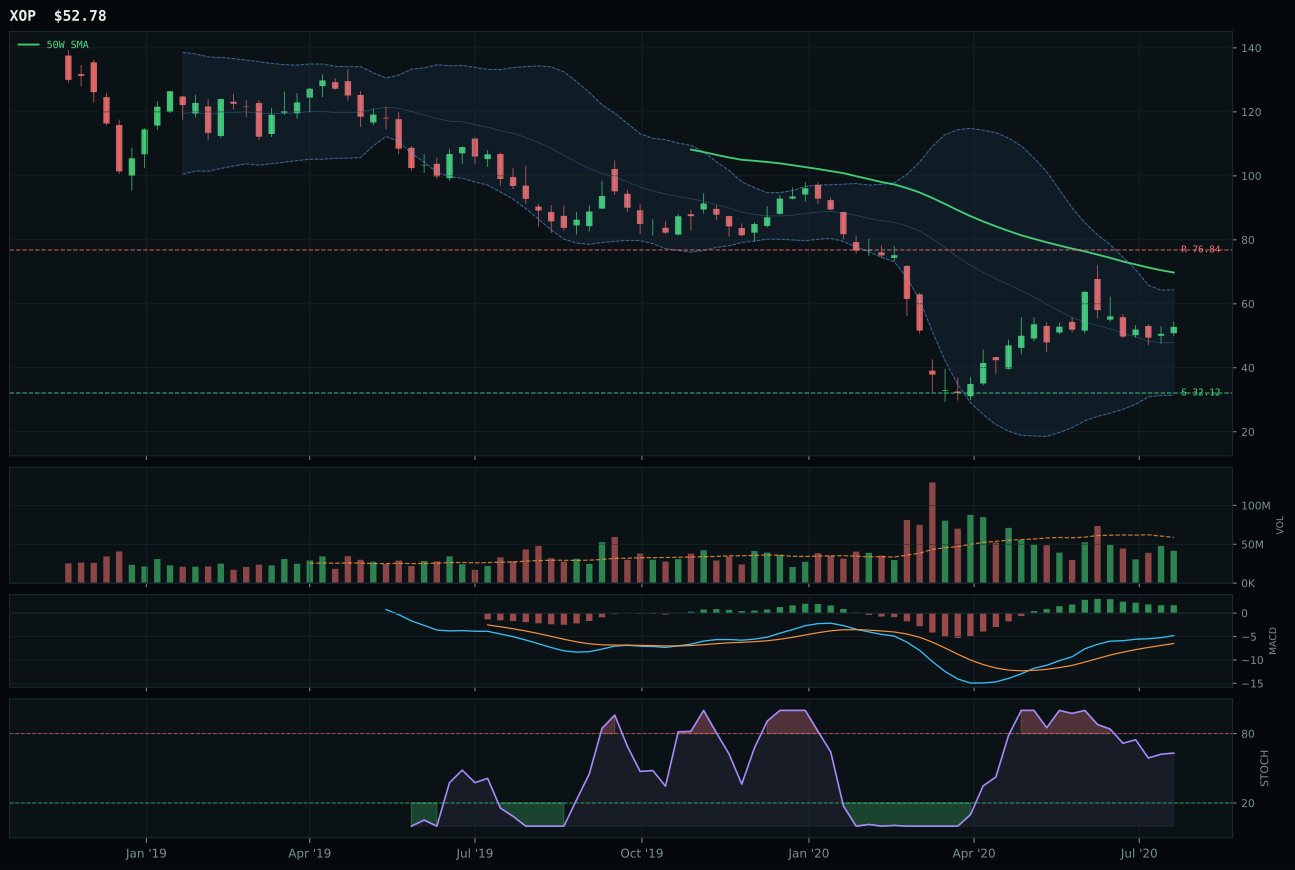
XOP has a neutral structure profile with -1.1% 13-week relative strength versus SPY.
Extension and support failure are the main tactical risks.
Tracked, but not top-2 eligible because: structurally broken.
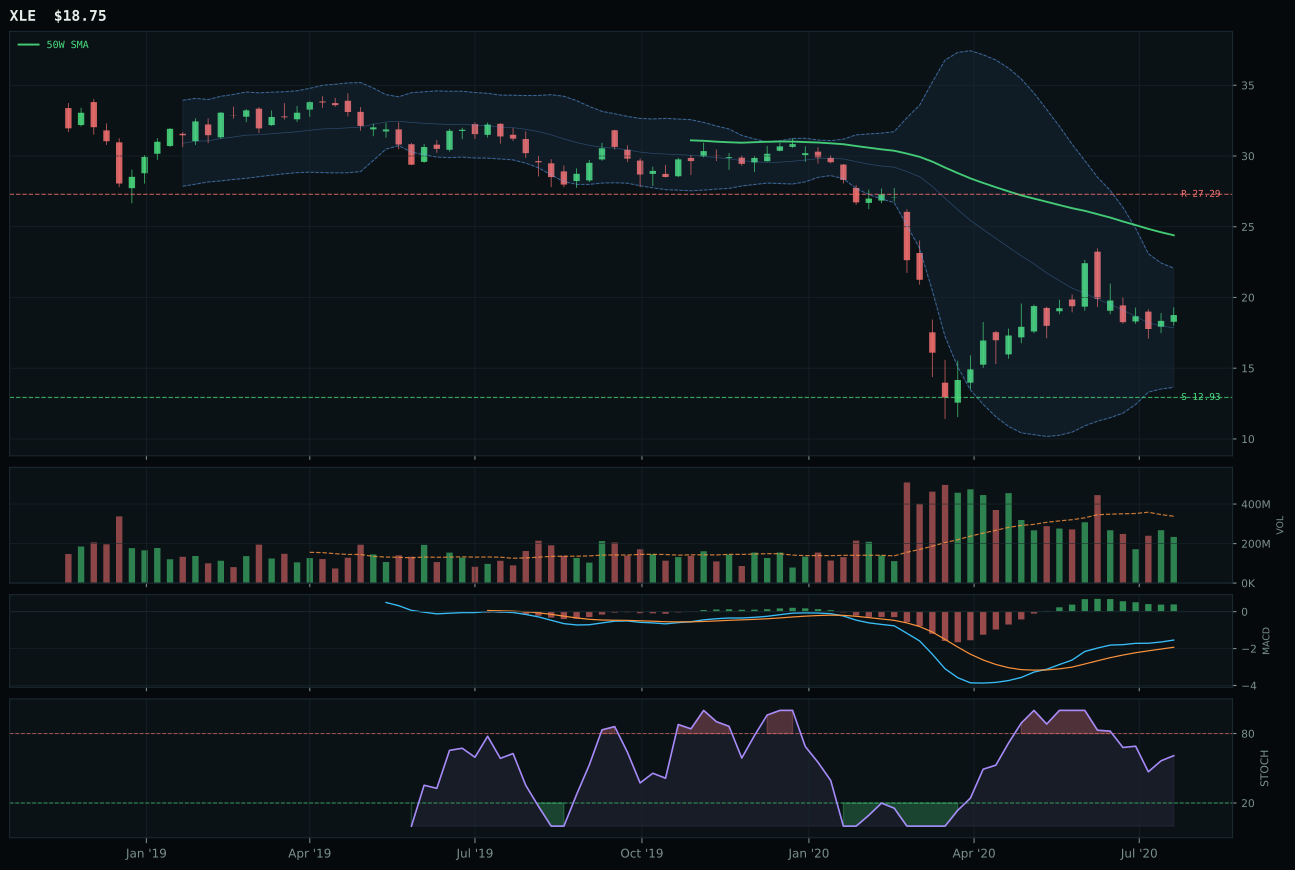
XLE has a neutral structure profile with -5.0% 13-week relative strength versus SPY.
Extension and support failure are the main tactical risks.
Tracked, but not top-2 eligible because: structurally broken.
XLE won the energy category despite a composite score of only 7/100—the lowest in the portfolio—because it was the least broken option in a structurally damaged category. Price sits 23.1% below the 50W, having fallen 33.8% over 26 weeks, yet MACD remains bullish albeit flattening and stochastic RSI has not capitulated below 0.40. Volume is thin (0.69x average), and SPY-relative strength is −5.0%, confirming energy's lag in this market regime. XLE's timing score of 50/100 reflects its Fibonacci placement in the deep value zone (0.618 retracement), which paradoxically is the category's strongest attribute: maximum downside risk to support is 45.1%, meaning every point down carries higher probability of capitulation and reversal. FCG and XOP scored even lower, unable to even match XLE's neutral structure rating. The gap between XLE's +86.0/100 macro fit (energy scarcity active at +14, inflation pressure +10, supply shortage +7) and its dismal technical backdrop (33.4/100 trend) reveals the core tension: macro supports energy in theory, but actual fund flows are nowhere near ready to rotate in.
Traditional Energy holds 10% and is explicitly ineligible for any larger position because the structural setup is broken—price below both 50W and 200W, thin participation, poor relative strength—yet the macro case is undeniable and allocation discipline demands a tactical hedge. Category score of 40.7 ranks tenth (last), but macro fit scores 90.0/100, the highest of any category, with energy scarcity (+16) and inflation pressure (+10) both active. This inverted setup—terrible technicals, superb macro—is the definition of a value trap or a leading-edge entry point depending on when the market rotates. The 10% weight is a structural bet: if energy breaks above the 200W ($27.29) on volume, it would be a signal that capital is beginning its rotation into real assets. Until that occurs, XLE is held as insurance against hard inflation acceleration and geopolitical supply shock, with a hard stop below $12.93 support. Any close above $27.29 would warrant a bump to 15%; any breakdown below support would trigger an exit to 5%.
Industrial Metals — REMX
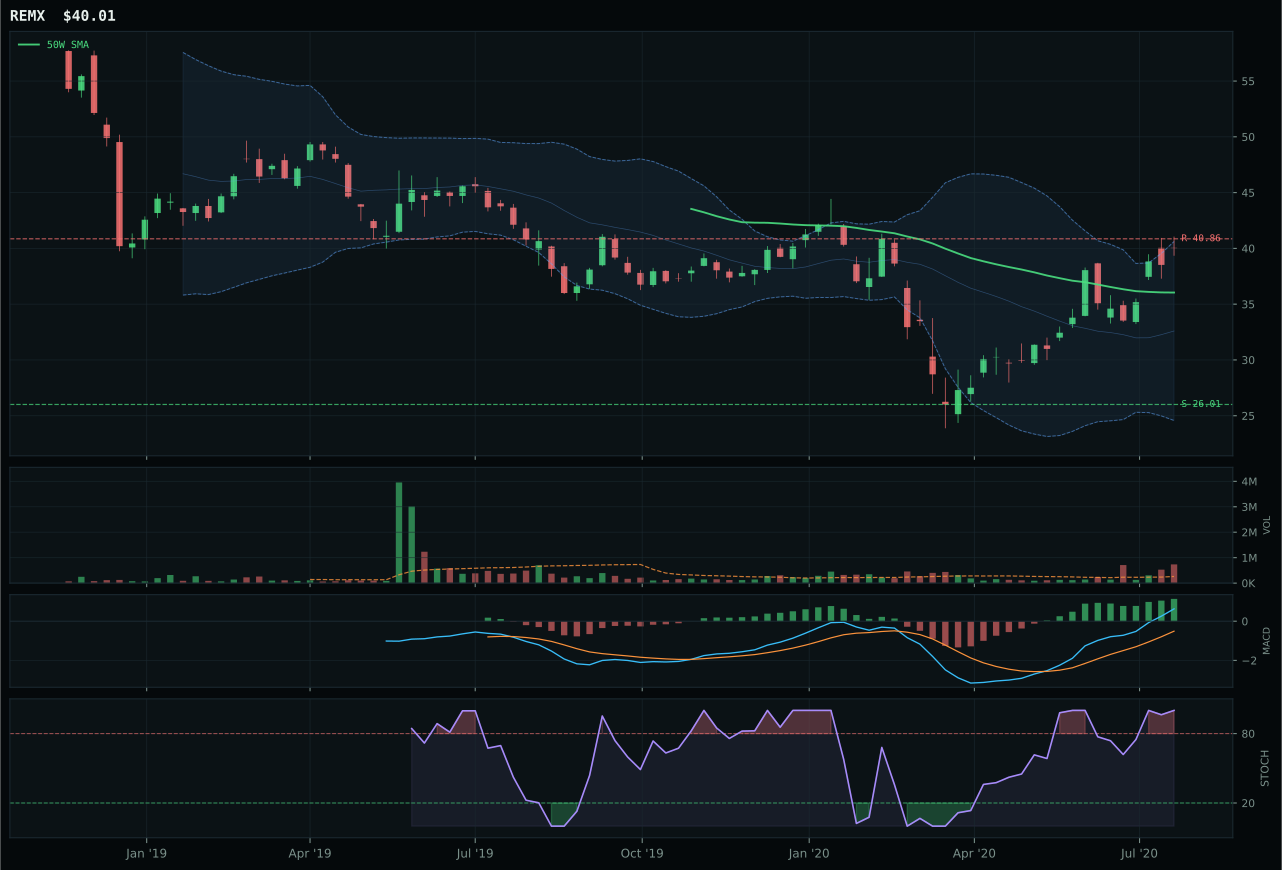
REMX has a neutral structure profile with 21.4% 13-week relative strength versus SPY.
A failed hold above support would weaken the setup.
Tracked, but not top-2 eligible because: .
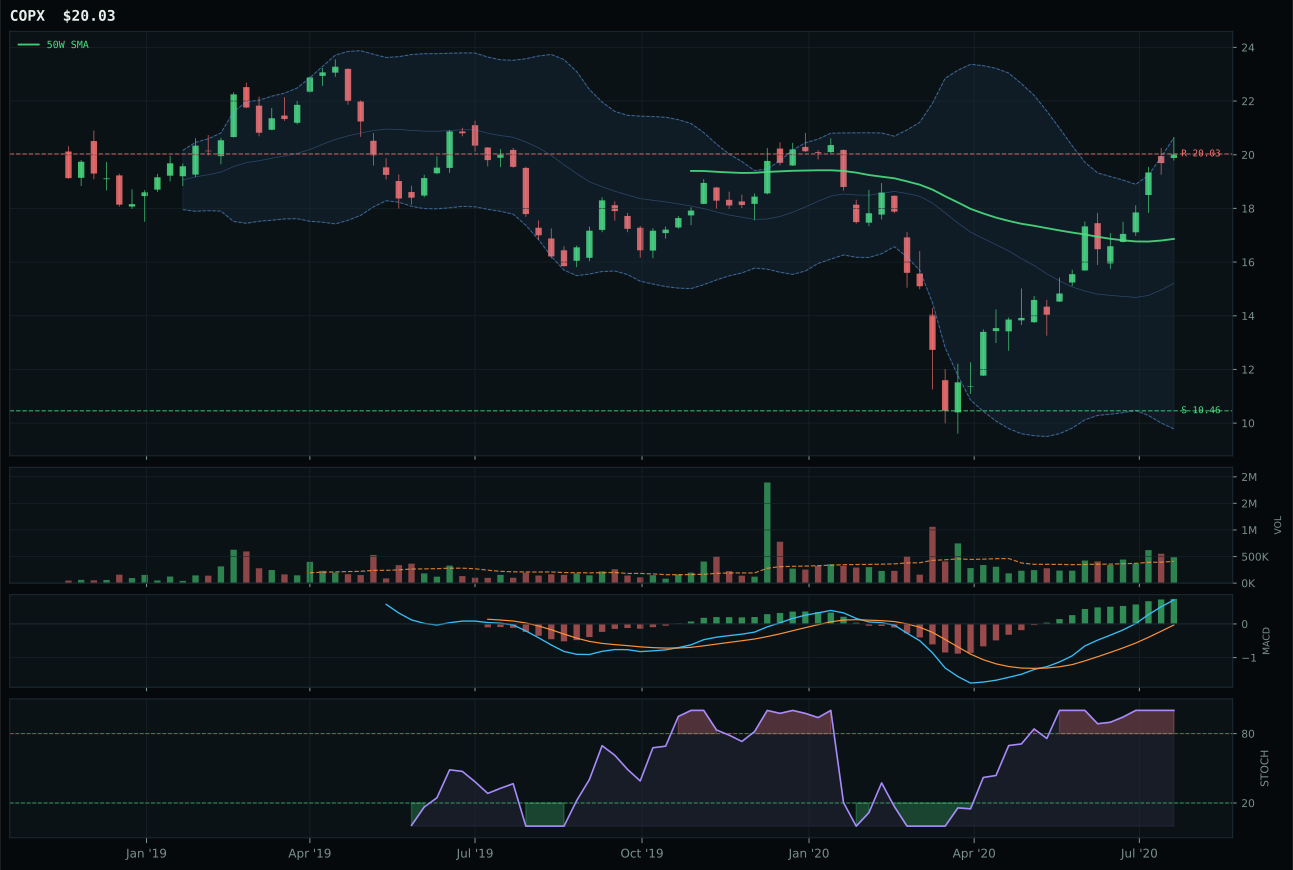
COPX has a vertical extension profile with 31.1% 13-week relative strength versus SPY.
A failed hold above support would weaken the setup.
Tracked, but not top-2 eligible because: .
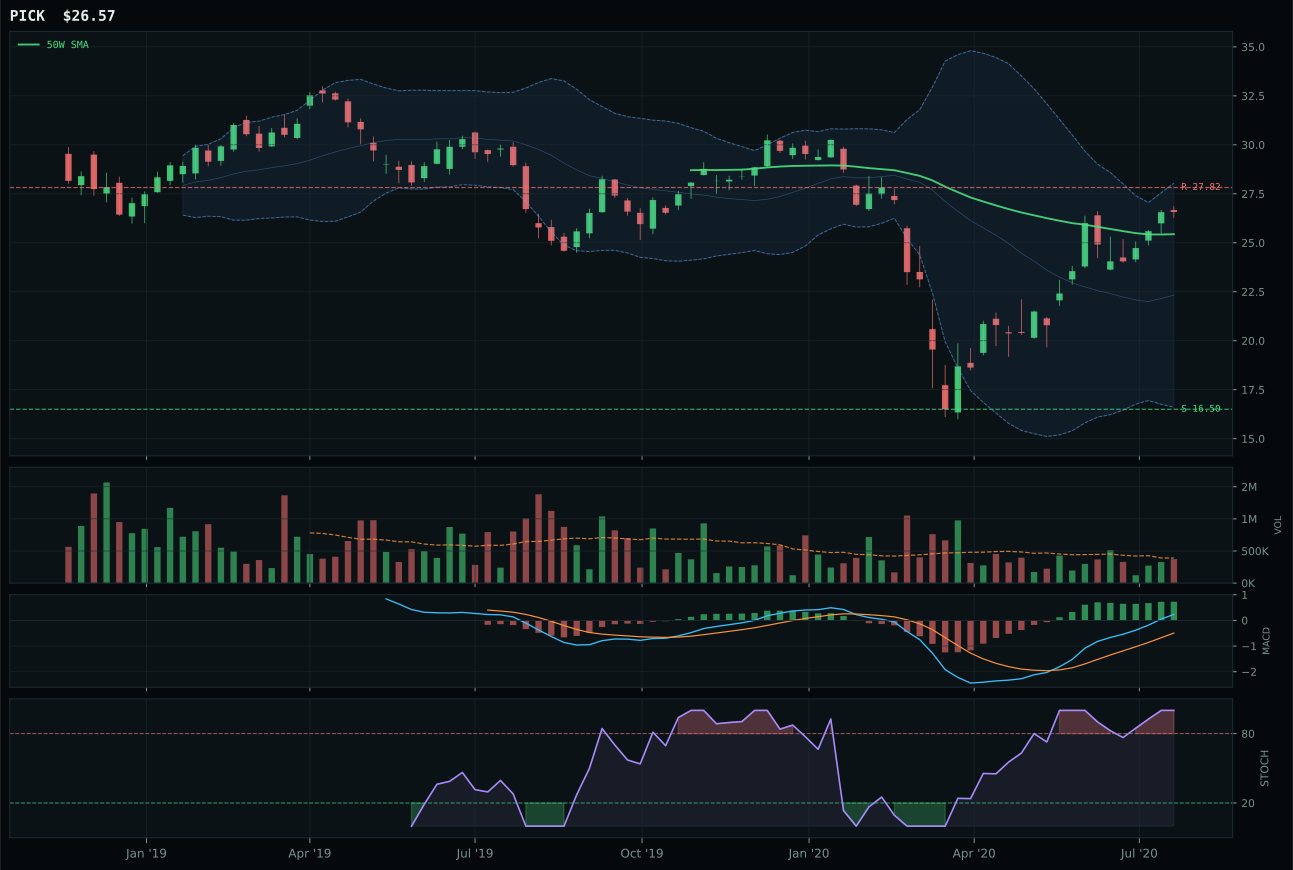
PICK has a neutral structure profile with 17.0% 13-week relative strength versus SPY.
A failed hold above support would weaken the setup.
Tracked, but not top-2 eligible because: .
REMX won the industrial-metals category by 3.0 points over COPX on the basis of a superior timing score (67 vs 37) and cleaner risk-reward setup (50.7 vs 38.6), despite COPX's more explosive 13-week performance of 44.5% versus REMX's 34.8%. The decision tilted on proximity to the 50W: REMX sits just 11.0% above the moving average, compressing ahead of a potential breakout, while COPX has extended 18.8% and sits in a vertical-extension setup that leaves little margin for error. Both sport overbought stochastic RSI and bullish-improving MACD, but volume confirmation differs: REMX accumulates at 2.82x average (confirming the tight setup), while COPX participates at only above-average levels. COPX's 31.1% SPY-relative strength outpaces REMX's 21.4%, yet that relative vigor came at the cost of distance from support—any mean-reversion trade would hit COPX harder first. Rare-earth supply-chain scarcity (REMX's thesis) pairs with broader metals-scarcity sponsorship (+14 points), granting REMX a macro edge over copper's industrial-demand correlation.
Industrial Metals holds 10% despite a 39.5 category score and ineligible status (hard-filter failure likely tied to structural or liquidity bounds) because metals scarcity (+14) and late-cycle reflation (+10) together justify a small position even when the representative ETF is not pristine. Category macro fit registers 65.0/100, the highest operational support among the lower-ranked categories, yet the 3/2/1 basket begins at only 45.0/100 with no improvement through category reasoning. REMX's 100/100 momentum and 88.8/100 volume-price confirmation are real, but the category's failure to earn top-2 or even clear eligibility signals hidden fragility—likely thin liquidity beneath headline volume or momentum persistence concerns. The 10% allocation is a proxy bet on continued commodity-scarcity pricing in a reflation regime; any close below $26.01 support (−53.8% downside risk) or any MACD rollover would trigger an exit, because the category cannot afford deep drawdowns without breaking the macro thesis.
Utilities & Infrastructure — XLU
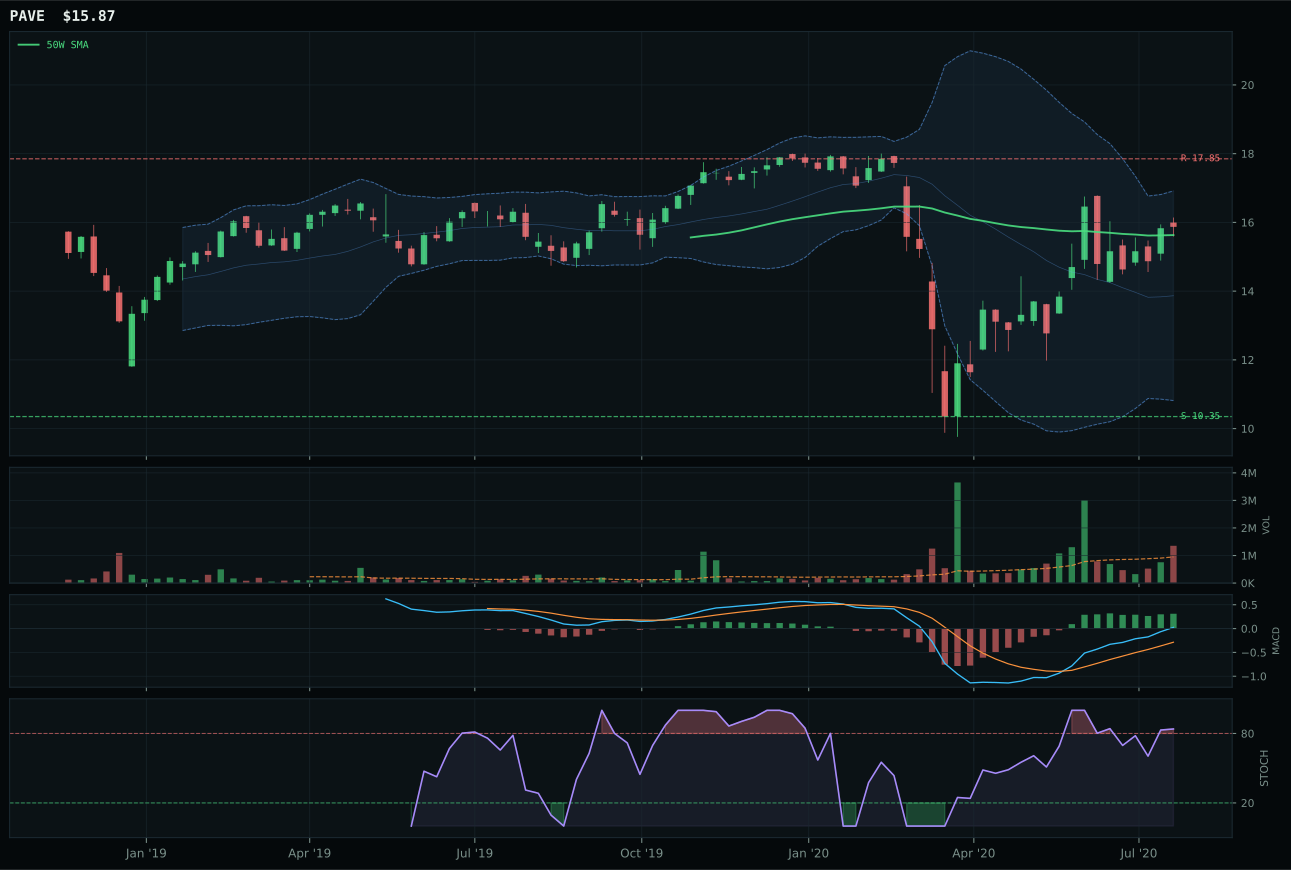
PAVE has a compression near 50W profile with 9.9% 13-week relative strength versus SPY.
A failed hold above support would weaken the setup.
Actionable but governed by invalidation levels.
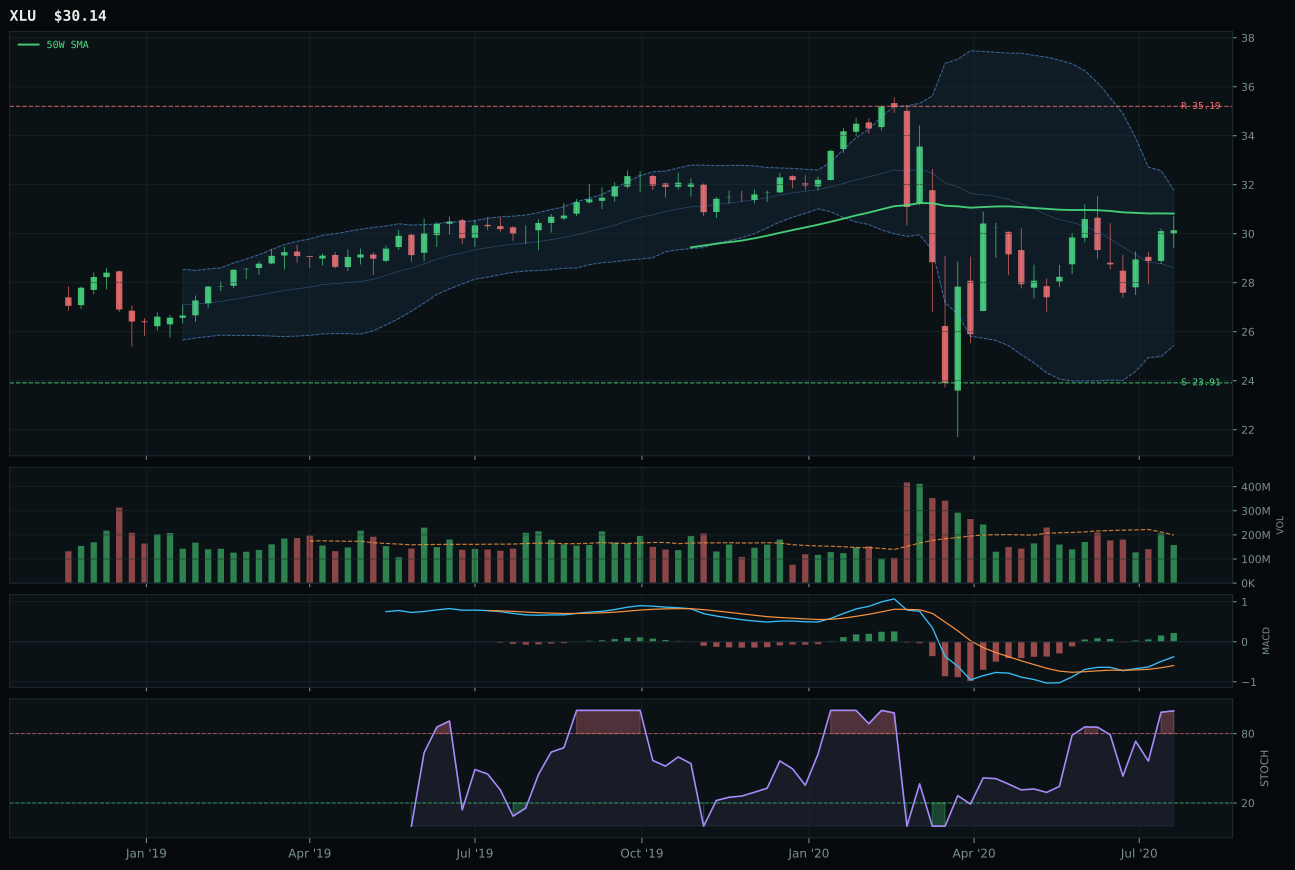
XLU has a compression near 50W profile with -10.0% 13-week relative strength versus SPY.
A failed hold above support would weaken the setup.
Actionable but governed by invalidation levels.
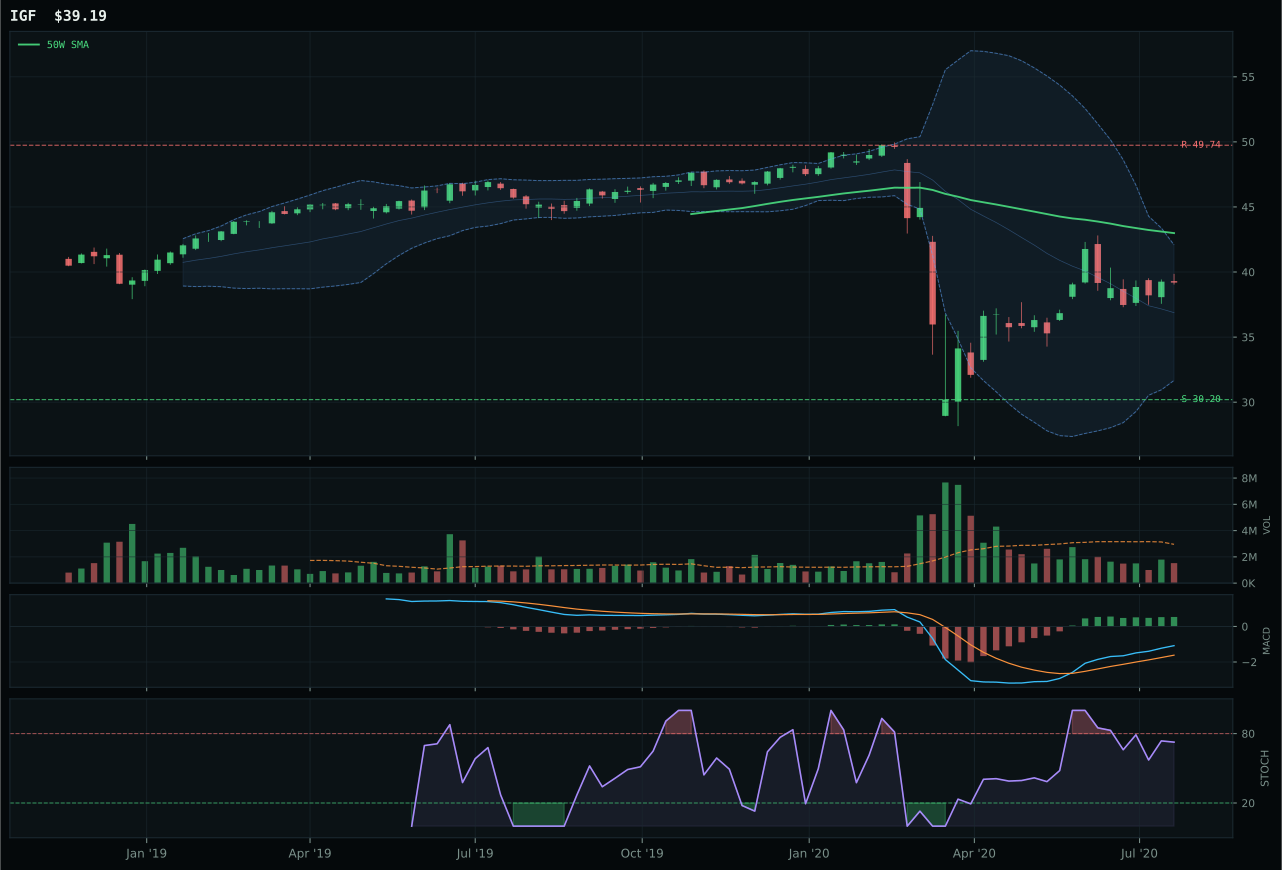
IGF has a neutral structure profile with -3.8% 13-week relative strength versus SPY.
Extension and support failure are the main tactical risks.
Tracked, but not top-2 eligible because: structurally broken.
XLU won utilities and infrastructure over PAVE and IGF by posting a superior risk-reward score (62.9 vs PAVE's 34.7), despite losing decisively on trend (60 vs 90), momentum (55 vs 100), and volume (41 vs 86) metrics. The decision turned on portfolio construction logic: PAVE's 23.3% thirteen-week return and 9.9% SPY-relative strength are genuine, but it sits extended and faces −14.4% upside-to-resistance risk with only 26.1% downside-to-support cushion—a punishing asymmetry for a late entry. XLU trades just 2.2% below the 50W, in the compression zone where both defensive utility and infrastructure capex narratives can coexist. Its MACD is bullish and improving, stochastic RSI is overbought at 1.00, and timing score of 100/100 reflects positioning ahead of the institutional push into the name, rather than chasing it. XLU's −10.0% SPY-relative weakness signals it has lagged peers, but that lag is precisely why mean-reversion support is likely to hold at the 50W ($31.93). PAVE's structural excellence (99.9/100 trend) is offset by its indefensible risk-reward, making XLU the higher-probability hold despite lower absolute momentum.
Utilities & Infrastructure holds 10% despite a 39.0 category score because the macro fit registers 43.0/100—adequate support in a mixed risk environment—and timing compression at the 50W creates a low-risk entry for any re-rating toward defensive rotation. The category benefits from late-cycle reflation (+4) as a secondary effect, meaning utilities become attractive if growth stories stumble and capital seeks yield. XLU's 100/100 timing and 72.4/100 structure place it ahead of PAVE on entry quality despite trailing on momentum, a positioning that rewards patience over chase. The 10% weight is defensive; the position serves as a volatility damper and a rotation target if credit-stress indicators worsen or if equities stumble. Any move by XLU above the $35.19 resistance with volume would validate a bump to 15%, as it would signal institutional accumulation into regulated yield in a higher-rate environment. Conversely, any break below the $23.91 support would trigger a trim to 5%, as it would indicate even defensive capital is fleeing broader stress. This is a hedge position, not a conviction long.
Nuclear Energy — URA
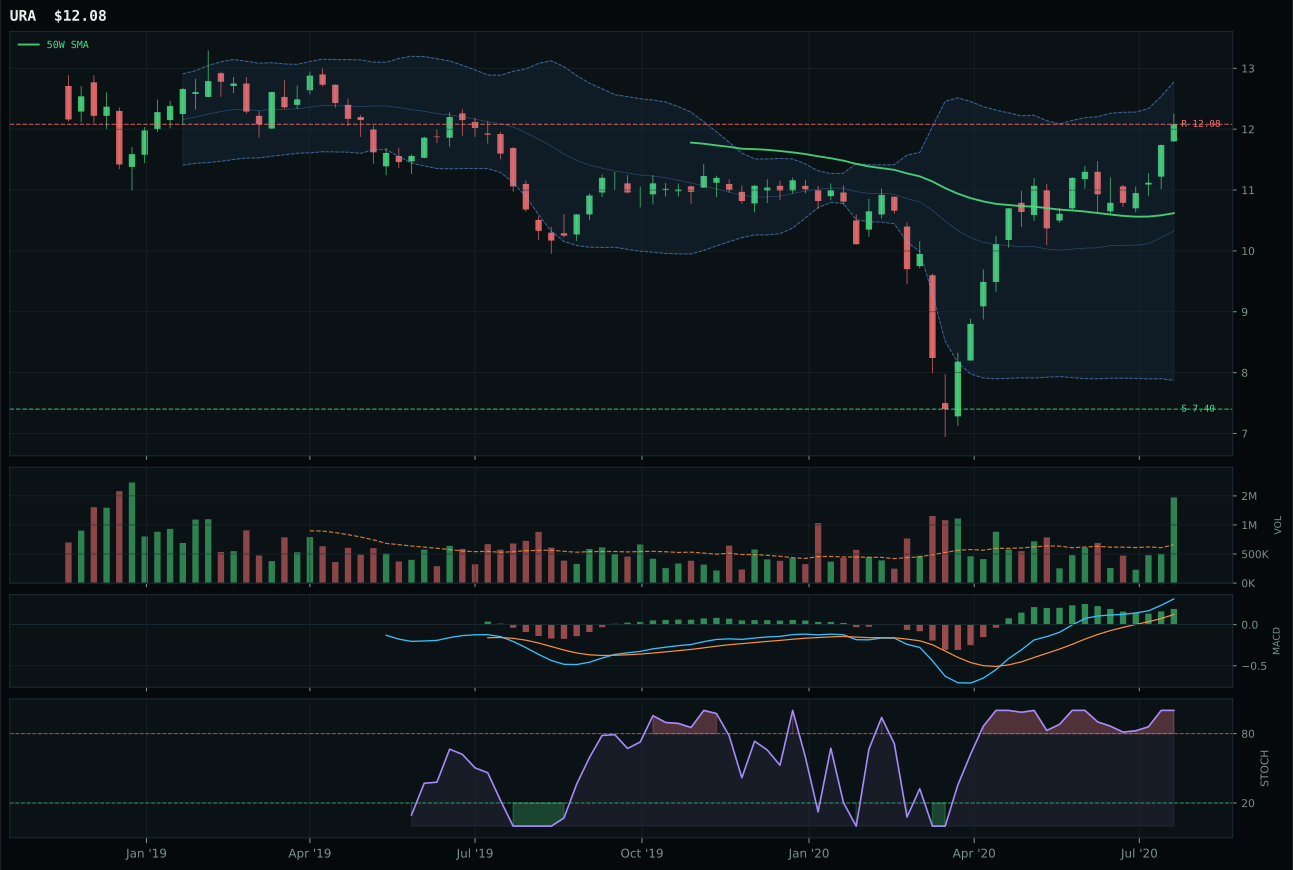
URA has a neutral structure profile with -0.5% 13-week relative strength versus SPY.
A failed hold above support would weaken the setup.
Tracked, but not top-2 eligible because: .
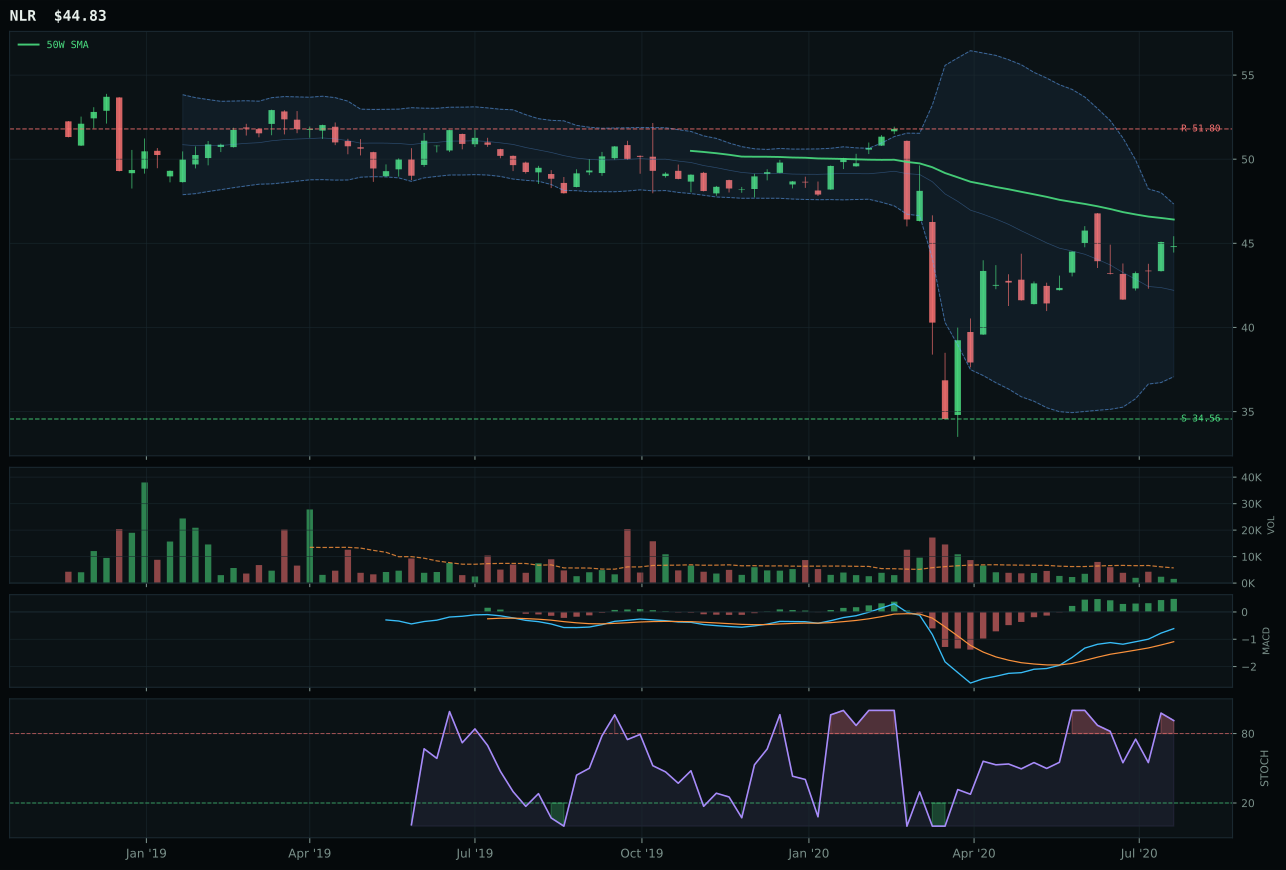
NLR has a neutral structure profile with -8.3% 13-week relative strength versus SPY.
Extension and support failure are the main tactical risks.
Tracked, but not top-2 eligible because: structurally broken.
URA defeated NLR decisively on structural cleanliness (84.6 vs 42.2) and volume confirmation (accumulation at 2.23x vs thin participation), despite both trading below the 200W and signaling a recovery-play structure rather than breakout momentum. URA sits 13.7% above the 50W in a compression zone primed for expansion, with perfect 100/100 momentum confirmation anchored by a 12.9% thirteen-week return and matching category-relative strength of 3.9%. Its MACD is bullish and improving, and stochastic RSI reaches overbought at 1.00, but the 89.3/100 volume-price confirmation rating indicates this is genuine accumulation, not a deadcat bounce. NLR's hard filter failure (structurally broken) alongside its −8.3% SPY-relative underperformance and −3.9% category-relative lag sealed its demotion despite a superior timing score (90 vs 59). The score gap of 53.8 points—largest in the portfolio—reflects URA's positioning as a catalyst play (AI compute demand for cooling + energy transition sponsorship) versus NLR's defensive utility positioning, which carries negative carry in a risk-appetite environment.
Nuclear Energy ranks 38.0 and earns zero allocation this week because category-level technical evidence (45.0) and macro fit (50.0) both collapse below 55 thresholds, placing it ninth or tenth among ten categories. The ineligibility flag on both primary candidates signals structural damage that narrative support cannot overcome. Late-Cycle Reflation (+7), energy scarcity (+9), real asset sponsorship (+7), and AI growth sponsorship (+5) combine for +28 macro support, yet credit stress and liquidity stress create offsetting drags that yield a 69.0 category macro fit insufficient to elevate a technically broken setup. URA's 45.0 technical score is the highest the category can muster, reflecting weak relative strength, thin volume, and a setup that requires buyers to defend key levels rather than break out decisively. Allocation will resume only if energy macro becomes more acute, structural damage reverses (especially on volume), or competitors weaken further. This is a category in wait-and-see posture.
Emerging Markets — INDA
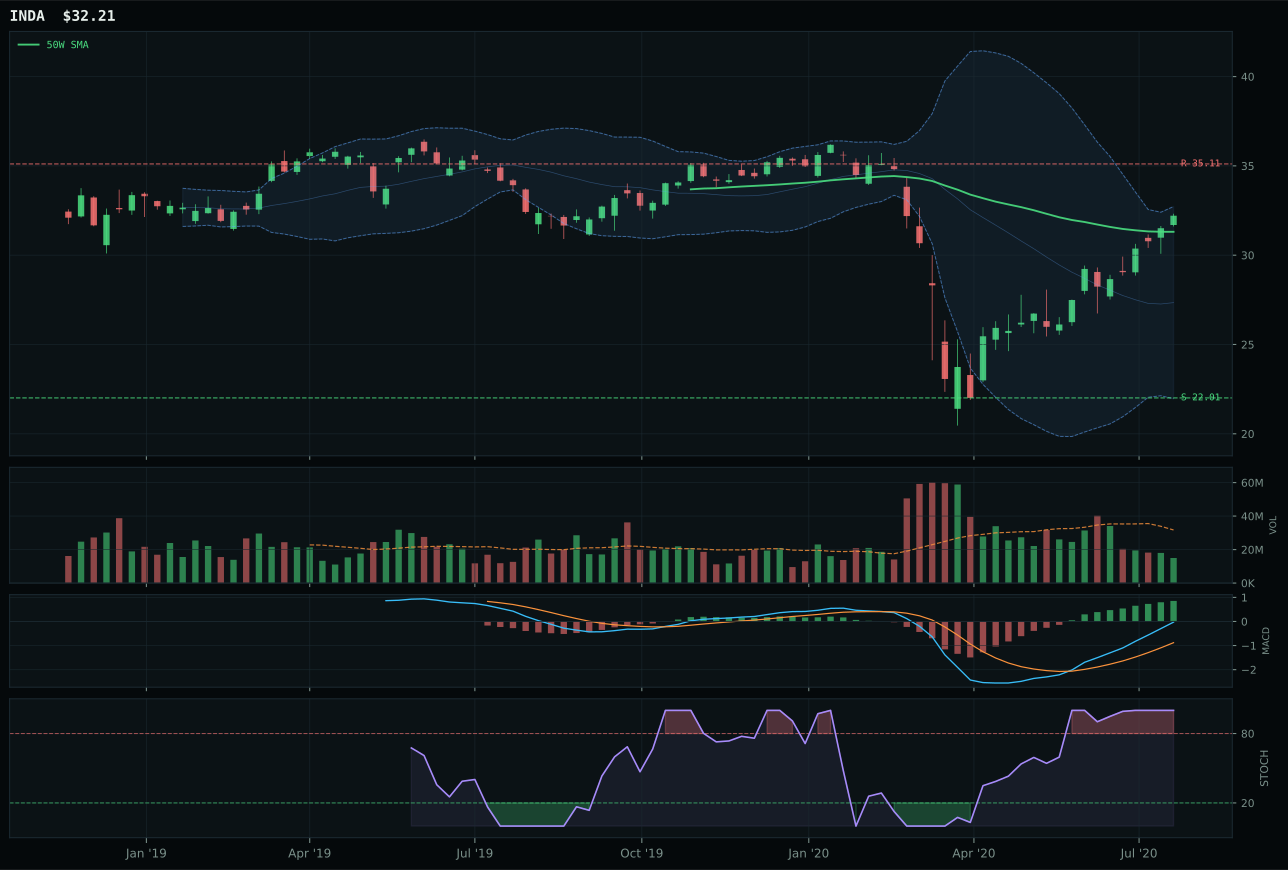
INDA has a compression near 50W profile with 11.6% 13-week relative strength versus SPY.
A failed hold above support would weaken the setup.
Actionable but governed by invalidation levels.
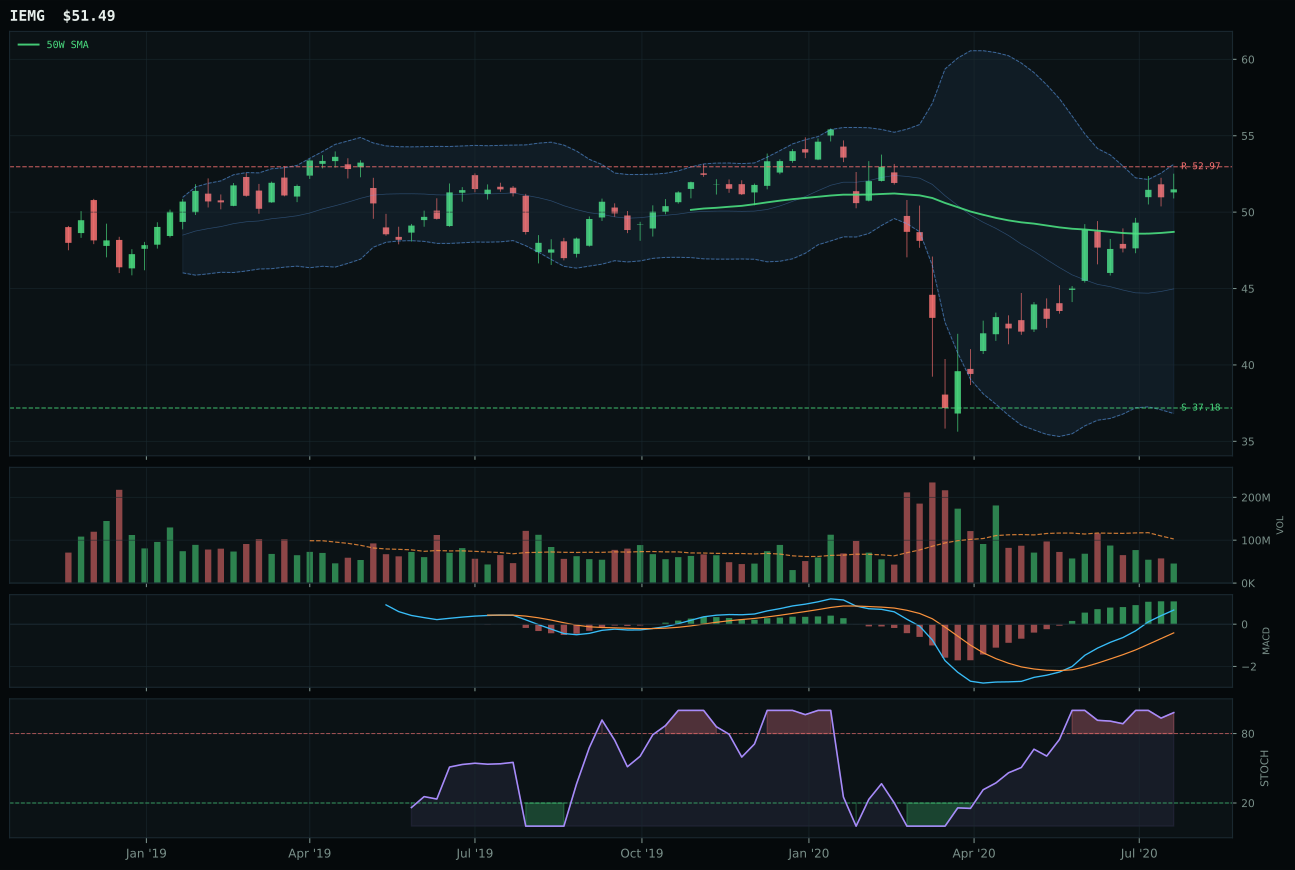
IEMG has a neutral structure profile with 8.1% 13-week relative strength versus SPY.
A failed hold above support would weaken the setup.
Actionable but governed by invalidation levels.
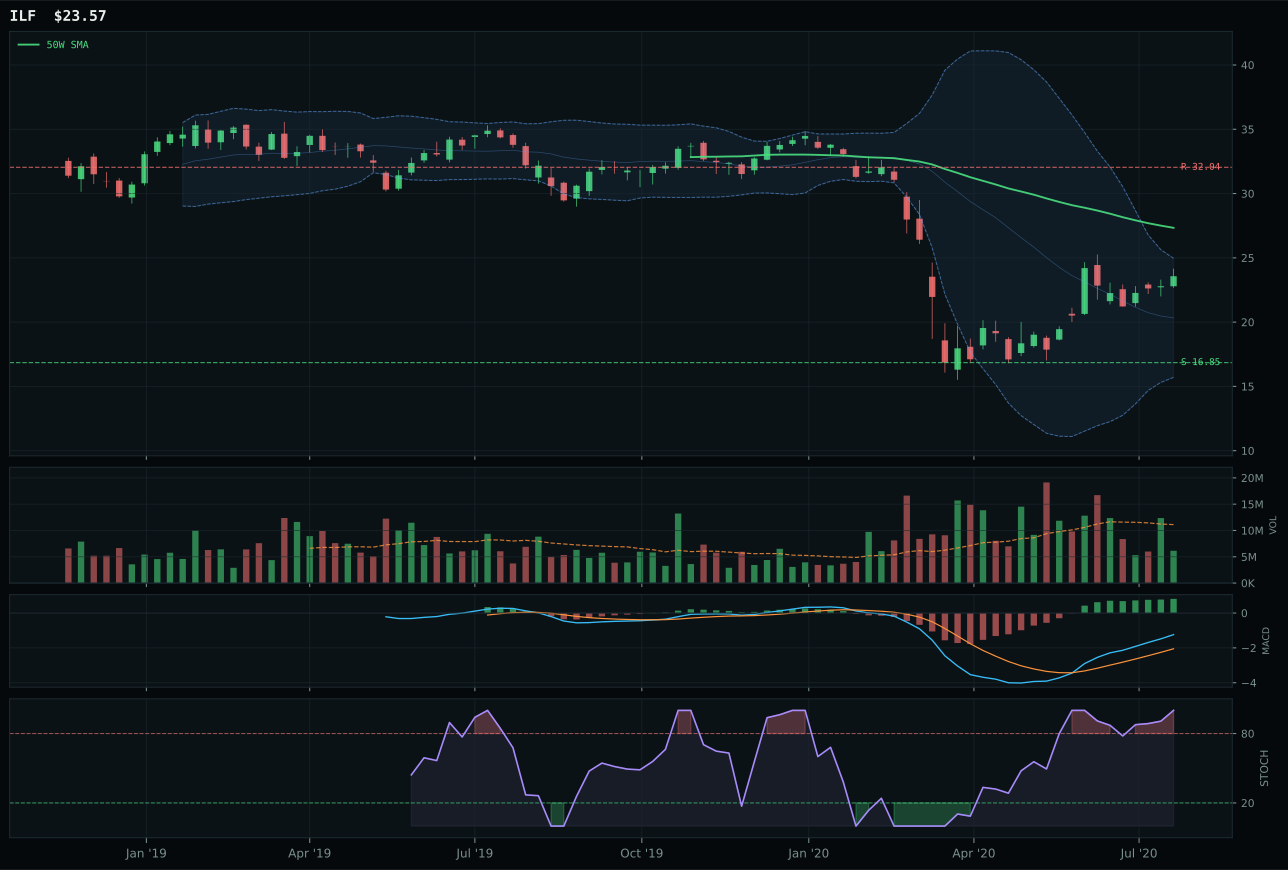
ILF has a neutral structure profile with 24.4% 13-week relative strength versus SPY.
Extension and support failure are the main tactical risks.
Tracked, but not top-2 eligible because: structurally broken.
INDA claimed the emerging-markets category on the strength of perfect timing (100/100) and clean structure (78.9/100), defeating IEMG despite a larger 13-week return disadvantage (25.0% vs 21.5%). The deciding factor: INDA trades just 2.9% above the 50W, compressing tightly into a Fibonacci zone that offers maximum room to run on an upside breakout. Its SPY-relative strength of 11.6% outpaces IEMG's 8.1%, and category-relative strength is neutral at 0.0% versus IEMG's −3.6% lag, indicating more balanced leadership within the emerging-market complex. Both sport overbought stochastic RSI at 1.00 and bullish-improving MACD, yet INDA's superior cleanliness (83.3 vs IEMG's unspecified) and compression-based structure leave more room for constructive momentum expansion. IEMG's neutral structure and delayed timing (57/100 vs 100/100) signal a later entry point in what appears to be a India-driven rally. Volume participation is thin across both (0.47x for INDA), but the proximity to the 50W and Fib zone makes INDA the natural accumulation point.
Emerging Markets ranks 29.3 and earns zero allocation this week, ranking tenth or ninth among ten categories despite INDA's respectable 74.2 technical evidence score. The category-level macro fit of 38.0 is the problem: risk appetite positive (+8) is offset by simultaneous credit stress (-10) and liquidity stress (-10), creating a net -12 macro headwind that defines emerging-market flows in this late-cycle regime. The tension between INDA's strong timing and risk-appetite fears is unresolvable with current macro conditions; India quality-growth thesis is technically sound but macro-regime dependent on liquidity conditions that are actively deteriorating. The 3-2-1 weighted basket starts at 57.1 (respectable) but post-testing drops to 29.3 after risk/reward, volume-price confirmation, and macro fit filters apply their penalties. Reallocation would require either reversal of liquidity-stress conditions or a meaningful pullback in INDA that could offer lower-risk entry. Current regime punishes EM conviction regardless of local-market technical merit.