
2020-07-17
Informational purposes only. The content in this report, including allocations, analysis, and commentary, is provided solely for informational and educational purposes. It does not constitute financial advice, investment advice, trading advice, or any other type of advice. Past performance does not guarantee future results. Always conduct your own research and consult a qualified financial professional before making investment decisions.
Some tracked tickers were excluded due to missing live weekly price data: SGOV: Historical cache SGOV has only 7 usable weekly bars; URNM: Historical cache URNM has only 33 usable weekly bars
Weekly Allocation
| Ticker | Category | Weight | Role |
|---|---|---|---|
| XLK | Technology | 20% | Top-2 (20%) |
| BOTZ | AI | 20% | Top-2 (20%) |
| INDA | Emerging Markets | 10% | Tier-2 (10%) |
| SLV | Precious Metals | 10% | Tier-2 (10%) |
| MOO | Agriculture & Livestock | 10% | Tier-2 (10%) |
| XAR | Defense & Aerospace | 10% | Tier-2 (10%) |
| COPX | Industrial Metals | 10% | Tier-2 (10%) |
| URA | Nuclear Energy | 10% | Tier-2 (10%) |
Trade Instructions — Monday Open
Sell the tranche from 2020-06-19 (completing its 4-week hold). Buy the new tranche. Instructions show net portfolio changes — same-asset positions cancel, weight changes show the delta.
| Action | Ticker | Instruction |
|---|---|---|
| SELL | SLV | Sell 25% of SLV position (reduce 10.00% → 7.50%) |
| SELL | IGV | Sell 29% of IGV position (reduce 17.50% → 12.50%) |
| SELL | XLU | Sell 33% of XLU position (reduce 7.50% → 5.00%) |
| SELL | SMH | Sell 17% of SMH position (reduce 15.00% → 12.50%) |
| SELL | ITA | Sell 50% of ITA position (reduce 5.00% → 2.50%) |
| SELL | NLR | Sell entire NLR position (2.50% of portfolio) |
| SELL | XLE | Sell 33% of XLE position (reduce 7.50% → 5.00%) |
| BUY | URA | Buy URA — 12.50% of freed cash (adds 2.50% to portfolio) |
| BUY | COPX | Buy COPX — 12.50% of freed cash (adds 2.50% to portfolio) |
| BUY | XAR | Buy XAR — 12.50% of freed cash (adds 2.50% to portfolio) |
| BUY | XLK | Buy XLK — 25.00% of freed cash (adds 5.00% to portfolio) |
| BUY | BOTZ | Buy BOTZ — 25.00% of freed cash (adds 5.00% to portfolio) |
| BUY | INDA | Buy INDA — 12.50% of freed cash (adds 2.50% to portfolio) |
Current Portfolio After Trade
Combined holdings across all 4 active tranches. Each tranche is 25% of the portfolio.
| Ticker | % of Portfolio | Weight Bar |
|---|---|---|
| SMH | 12.50% | |
| IGV | 12.50% | |
| URA | 10.00% | |
| COPX | 10.00% | |
| SLV | 7.50% | |
| GLD | 7.50% | |
| XAR | 7.50% | |
| XLU | 5.00% | |
| XLE | 5.00% | |
| MOO | 5.00% | |
| XLK | 5.00% | |
| BOTZ | 5.00% | |
| ITA | 2.50% | |
| PAVE | 2.50% | |
| INDA | 2.50% |
Macro Regime — Late-Cycle Reflation
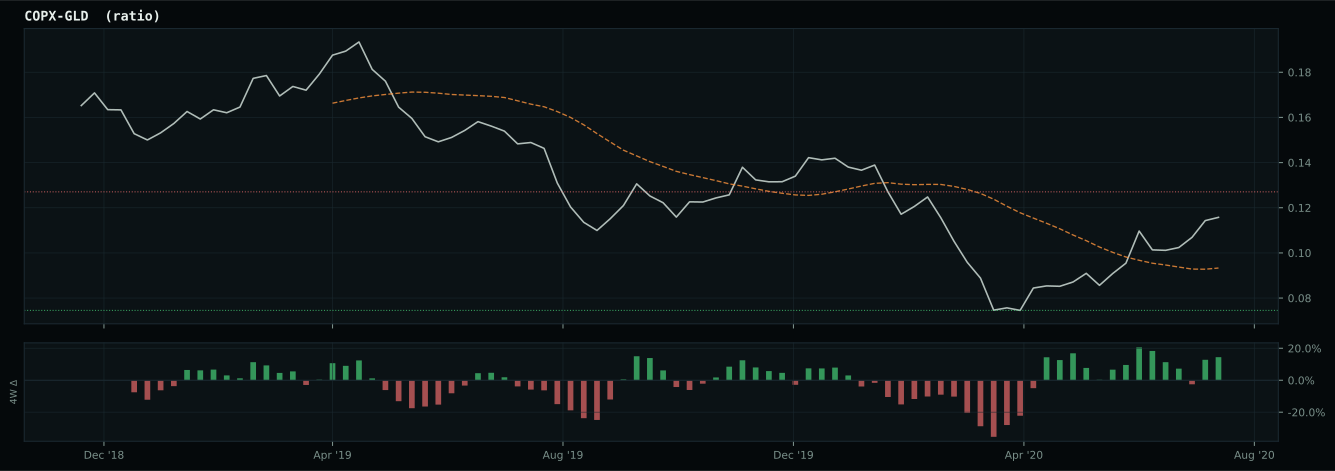
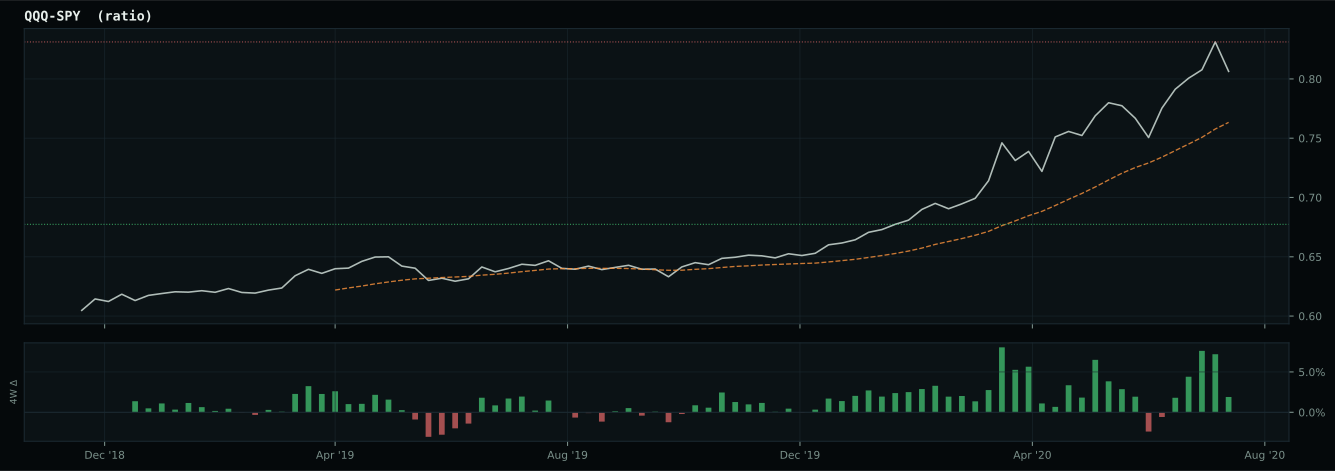
Macro Evidence Charts
Market-implied signals behind the macro regime scores. Each ratio compares two assets; the direction and slope of the ratio is what the macro engine reads.
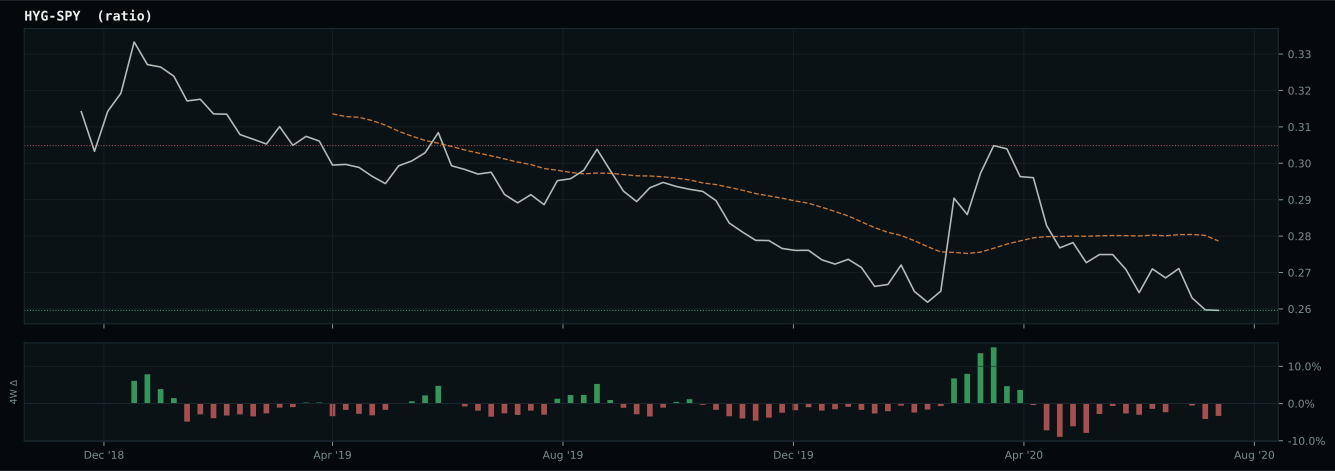
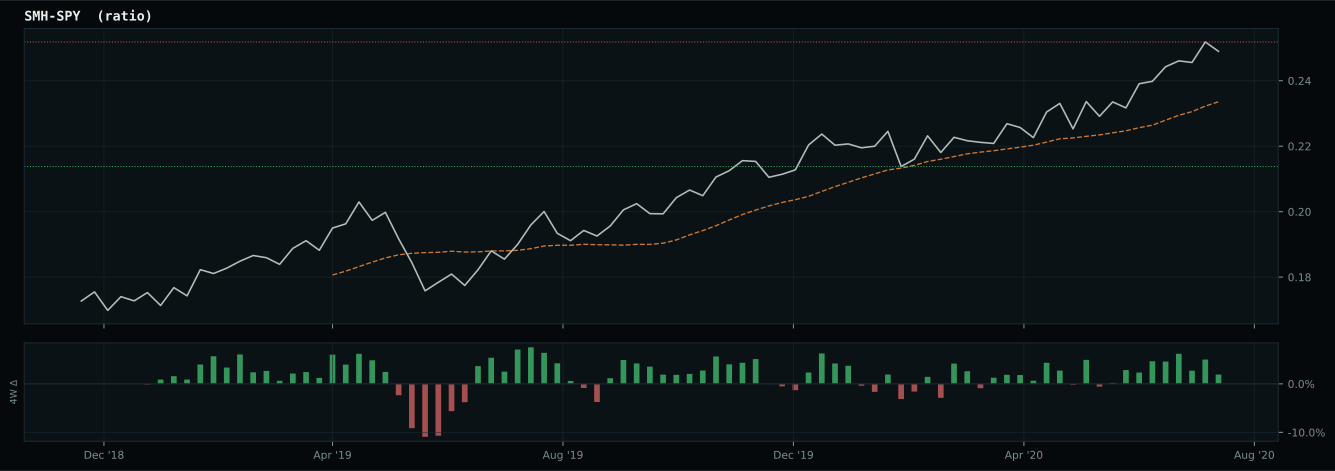
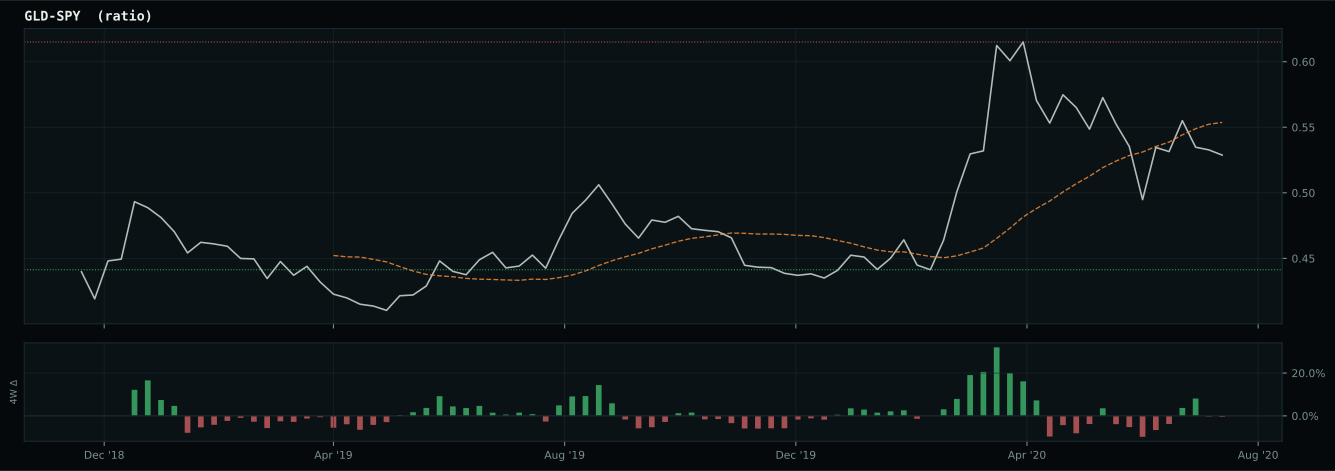
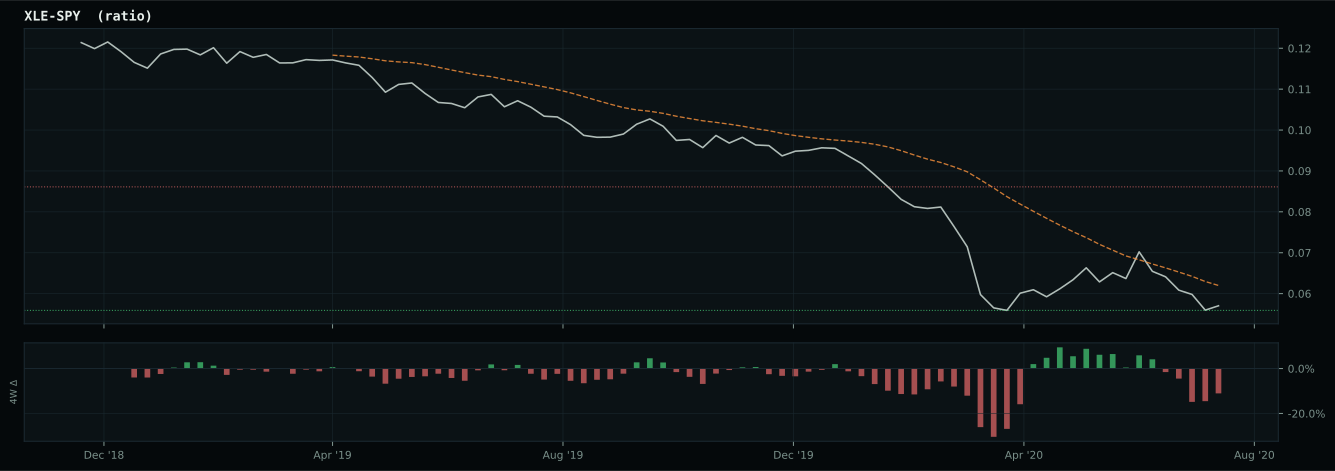
Crypto Regime — NoCrypto
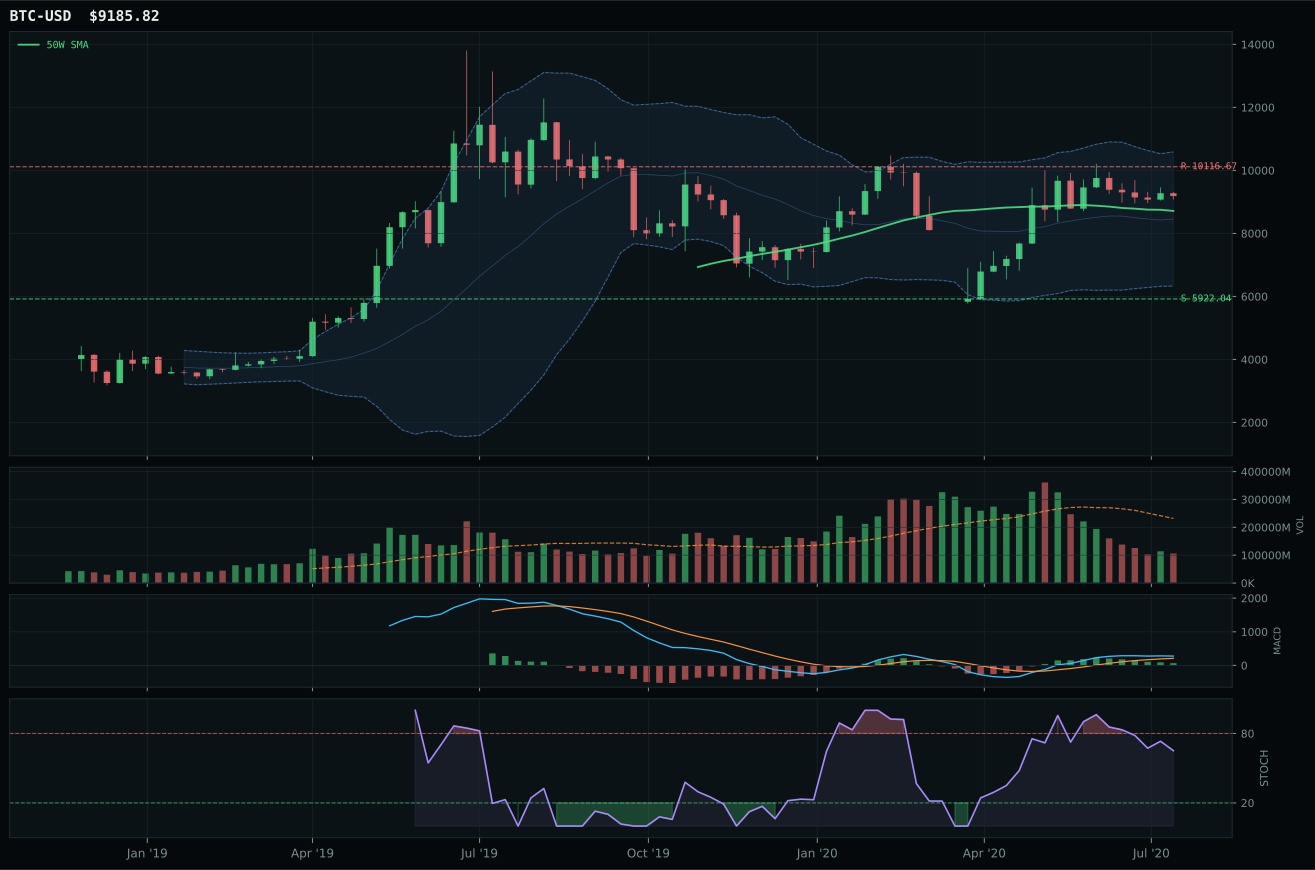
post-touch structure is too wide to count as a range; max/min close ratio is 1.81
TrendBTC not confirmed
one or more available conditions failed

Category Rankings
| Rank | Category | Winner | Score | Alloc | 4W Ret | Peers (4W) |
|---|---|---|---|---|---|---|
| 1 | Technology | XLK | 56.9 | 20% | +6.94% | IGV +2.5% · CIBR +2.3% |
| 2 | AI | BOTZ | 55.6 | 20% | +7.41% | SMH +7.6% · AIQ +4.4% |
| 3 | Emerging Markets | INDA | 50.4 | 10% | +4.48% | IEMG +3.9% · ILF +0.6% |
| 4 | Precious Metals | SLV | 49.4 | 10% | +38.78% | GDX +5.9% · GLD +8.2% |
| 5 | Agriculture & Livestock | MOO | 42.6 | 10% | +7.41% | VEGI +6.6% · WEAT -3.2% |
| 6 | Defense & Aerospace | XAR | 40.6 | 10% | +6.95% | ITA +5.2% · ROKT +7.1% |
| 7 | Industrial Metals | COPX | 38.3 | 10% | +6.94% | REMX +6.7% · PICK +6.6% |
| 8 | Nuclear Energy | URA | 34.6 | 10% | +1.27% | NLR +0.9% |
| 9 | Utilities & Infrastructure | XLU | 32.9 | 0% | +0.72% | PAVE +9.1% · IGF +2.5% |
| 10 | Traditional Energy | XLE | 31.5 | 0% | +4.49% | XOP +10.5% · FCG +13.9% |
Technology — XLK
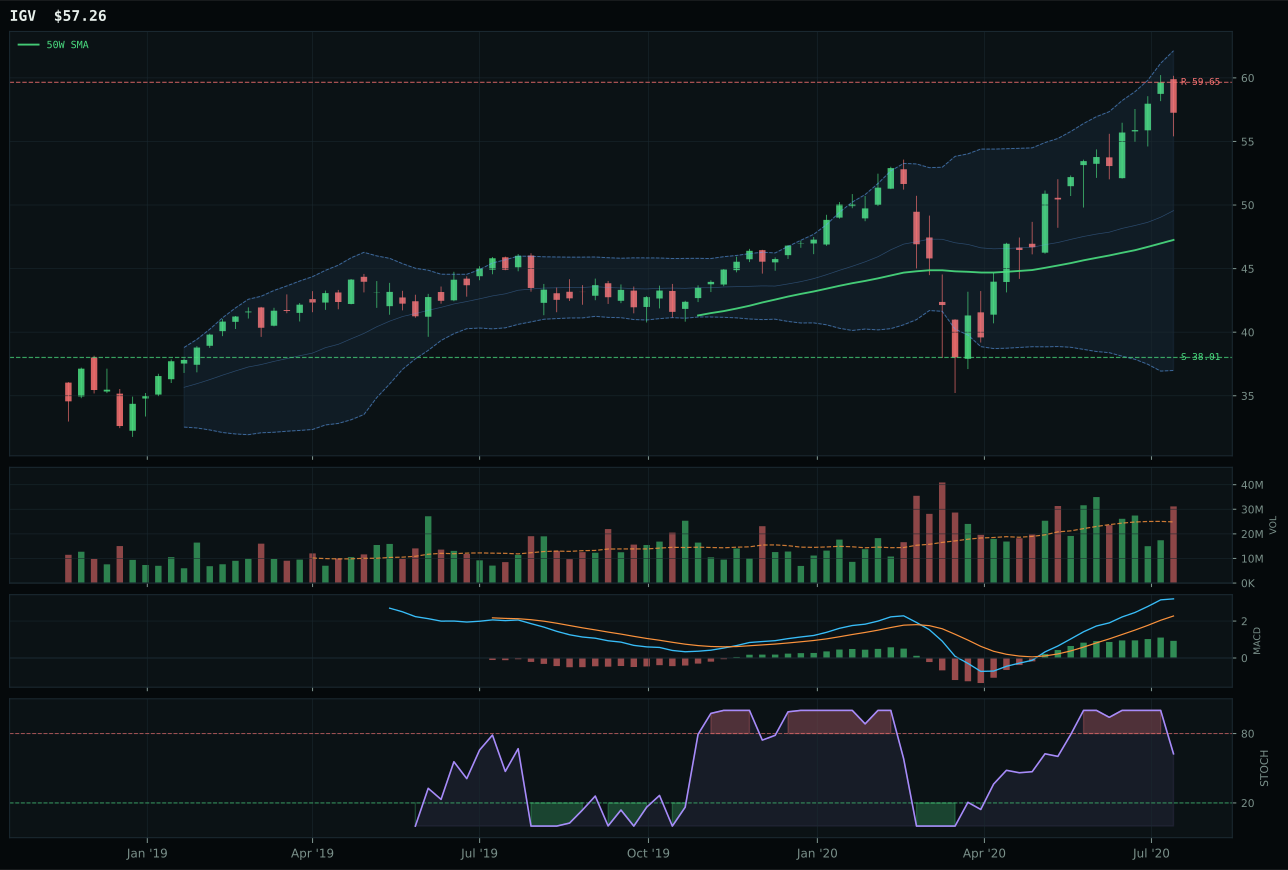
IGV has a vertical extension profile with 9.7% 13-week relative strength versus SPY.
A failed hold above support would weaken the setup.
Actionable but governed by invalidation levels.
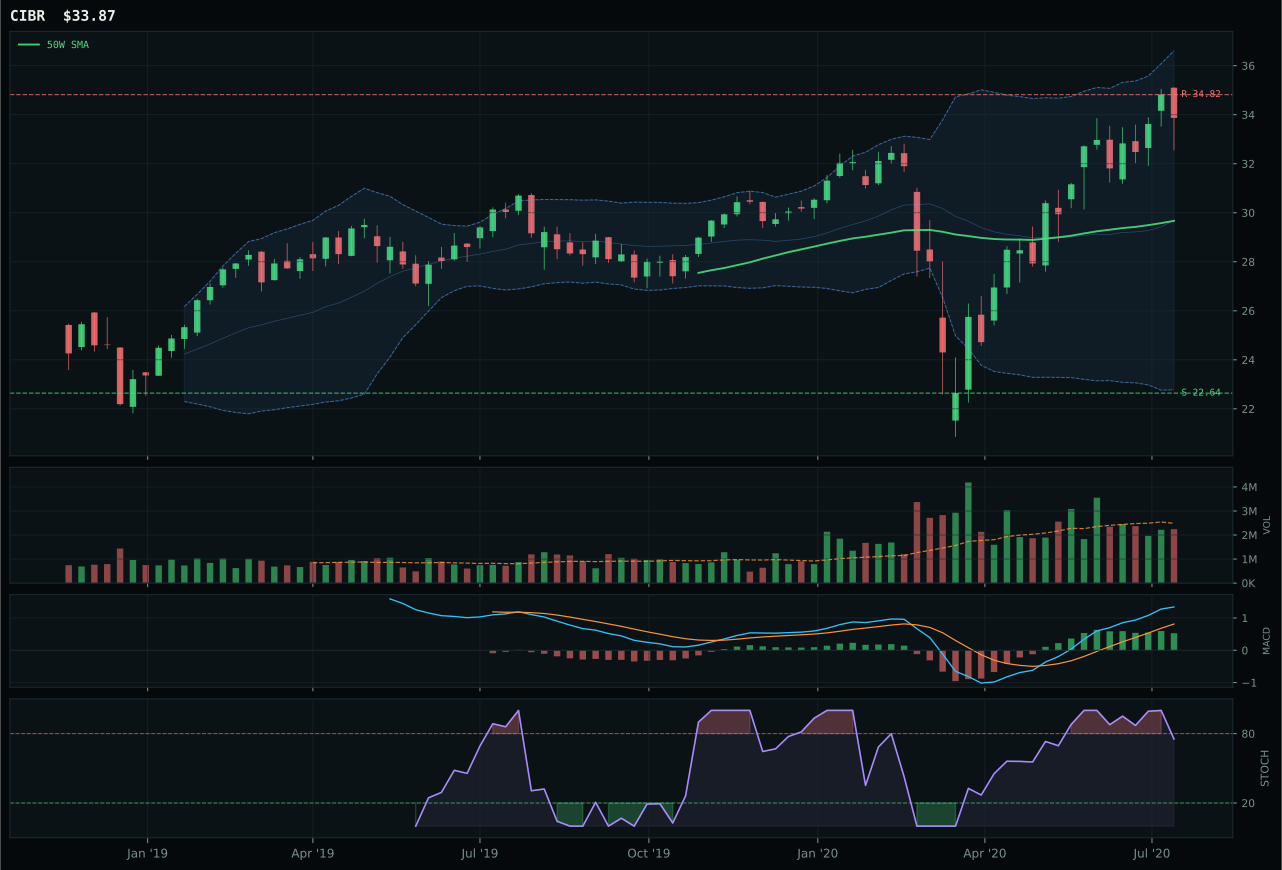
CIBR has a neutral structure profile with 6.6% 13-week relative strength versus SPY.
A failed hold above support would weaken the setup.
Actionable but governed by invalidation levels.
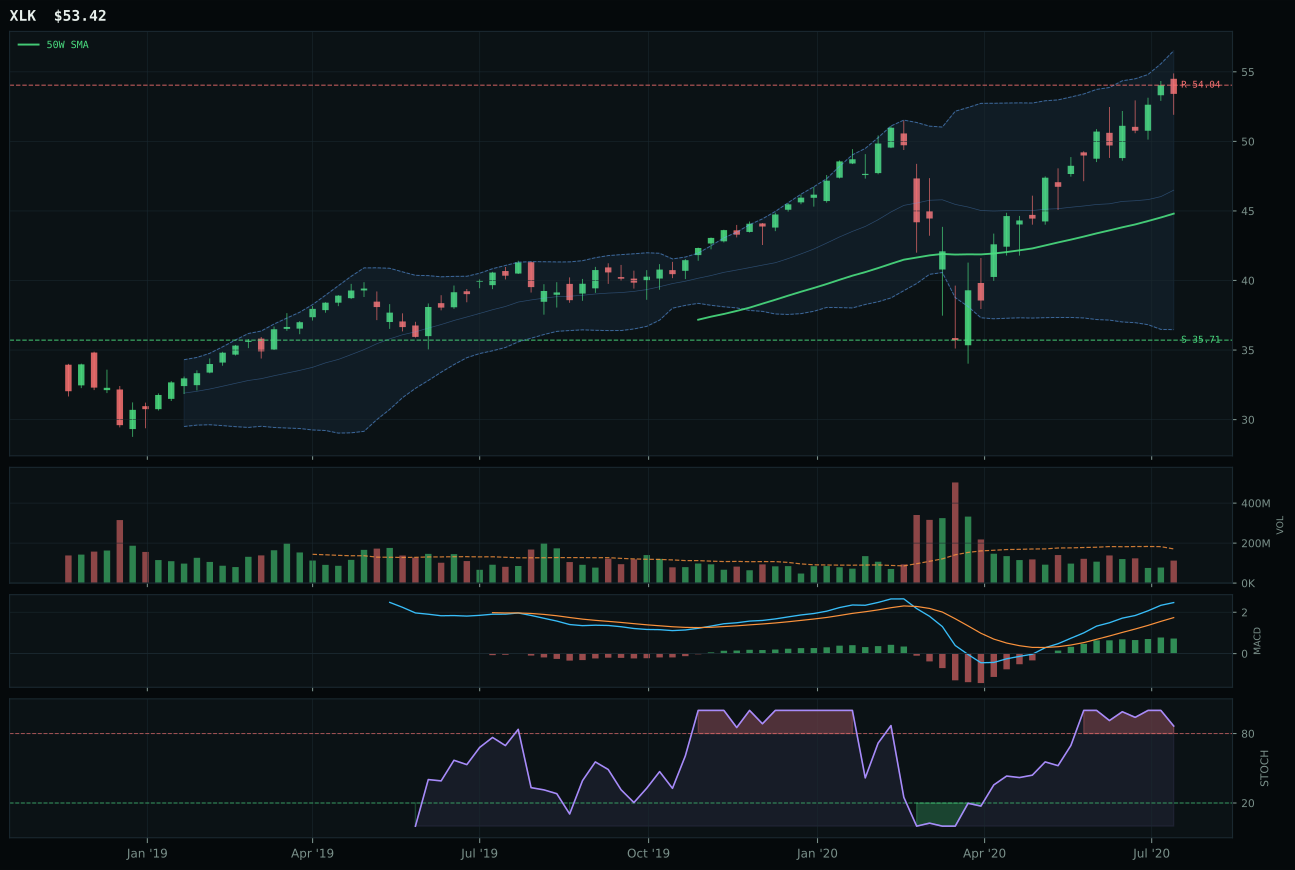
XLK has a vertical extension profile with 7.4% 13-week relative strength versus SPY.
A failed hold above support would weaken the setup.
Actionable but governed by invalidation levels.
XLK claimed the category despite a 6.2-point gap over IGV because its MACD confirmation was actively improving while IGV's had begun to flatten—a critical tell in a crowded technical environment. The 19.2% extension above the 50W signals late entry risk, which explains the muted timing score of 27.0, yet relative strength versus SPY of 7.4% and the category-median parity (0.0%) kept it competitive against a field where IGV posted stronger 13W momentum at 21.9%. Volume at 0.66x the 20W average is thin, which penalizes follow-through, but the stochastic RSI rolling over from overbought at 0.87 actually provides discipline—sellers haven't capitulated yet, making any breakout above resistance at 54.04 a legitimate test of conviction. XLK's structure is clean enough (66.7 cleanliness) and the vertical extension setup sits near the Fib 0.236 retracement zone, where momentum-driven buyers often reload.
Technology earns its top-2 slot and 20% allocation because it ranks as the highest-scoring eligible category in a late-cycle reflation regime where risk appetite and AI growth sponsorship are both active macro tailwinds. The category macro fit of 44.0 reflects real tension—liquidity stress and credit stress are active headwinds, each clipping 9 to 10 points—but technical evidence at the ETF level (62% weight) was strong enough to overcome that. XLK's trend score of 100 anchors the decision; price above both the 50W and 200W with a non-deteriorating slope is the foundation late-cycle allocators need when breadth could crack at any moment. The gap between this category (56.9) and AI at 55.6 is only 1.3 points, but XLK's volume confirmation at 58.8 and persistence at 74.0 provided slightly more reassurance of accumulation versus rejection—a small edge that proved decisive.
AI — BOTZ
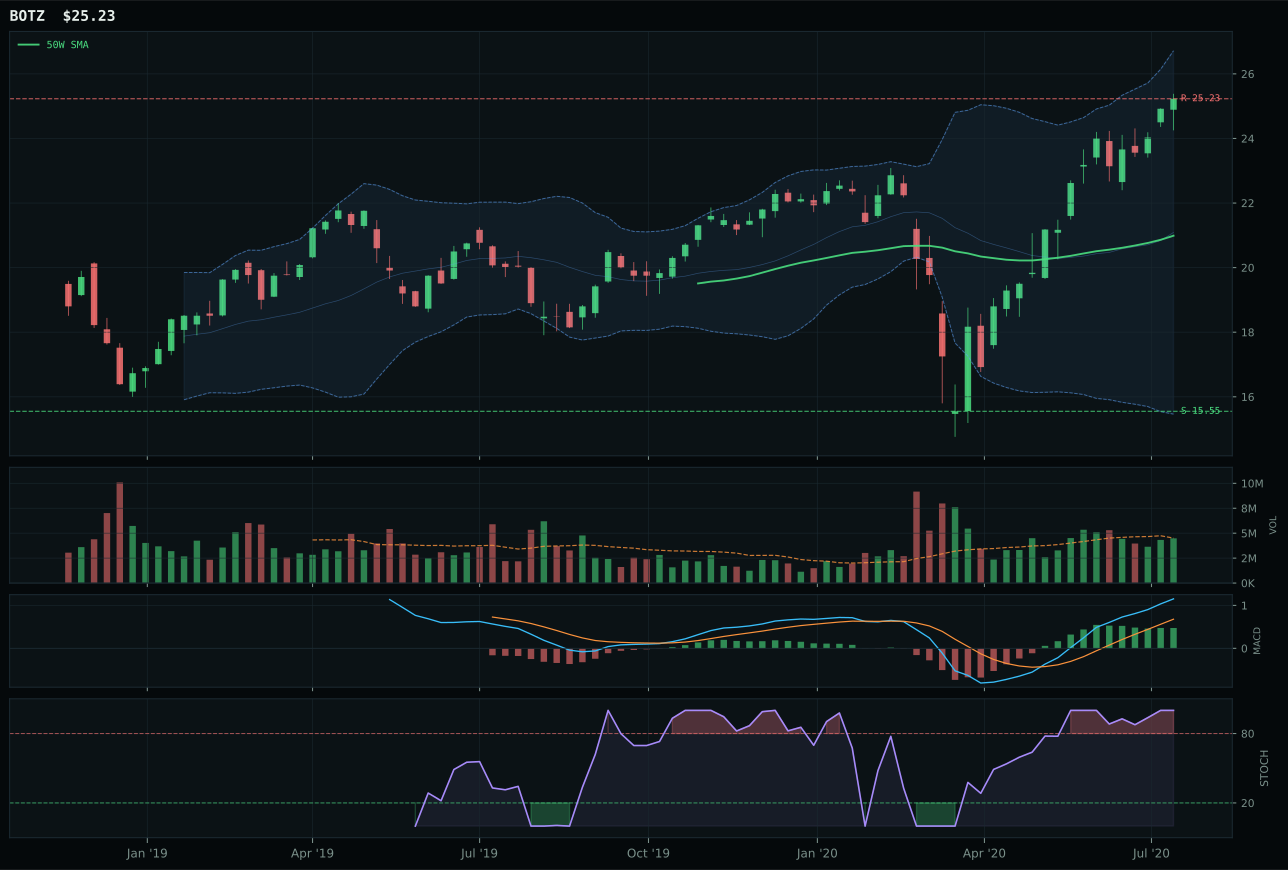
BOTZ has a vertical extension profile with 18.6% 13-week relative strength versus SPY.
A failed hold above support would weaken the setup.
Actionable but governed by invalidation levels.
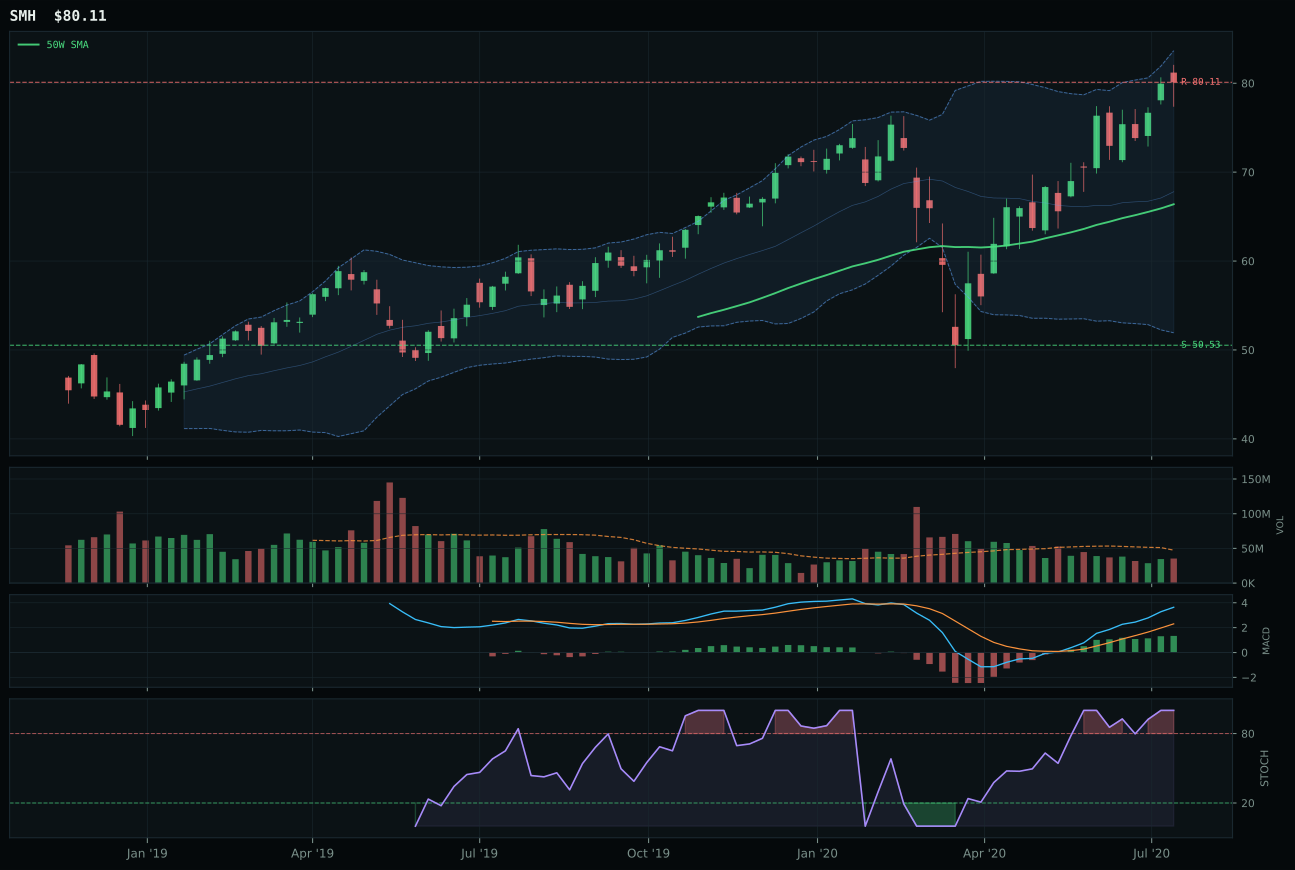
SMH has a vertical extension profile with 9.0% 13-week relative strength versus SPY.
A failed hold above support would weaken the setup.
Actionable but governed by invalidation levels.
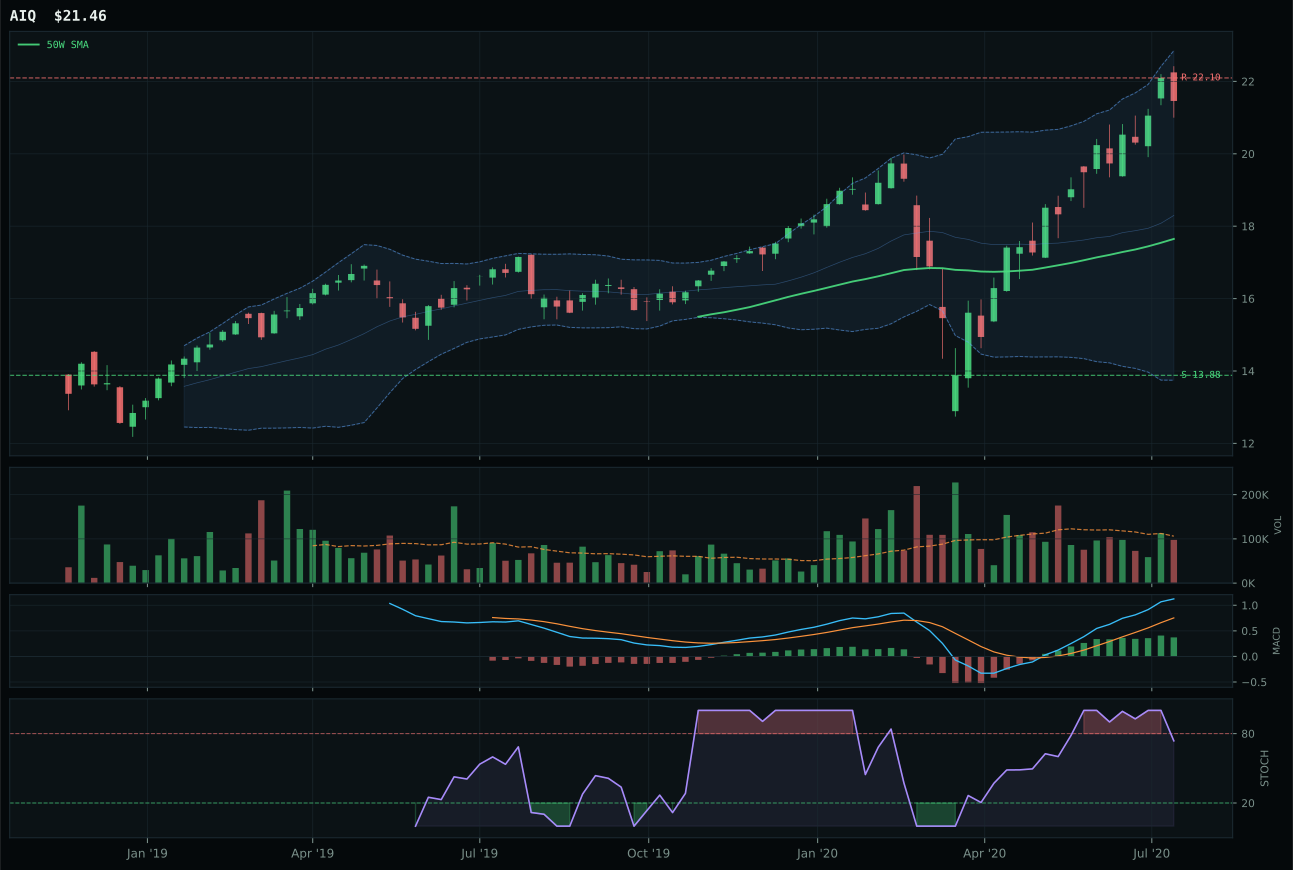
AIQ has a vertical extension profile with 11.0% 13-week relative strength versus SPY.
A failed hold above support would weaken the setup.
Tracked, but not top-2 eligible because: .
BOTZ outpaced SMH by 0.9 points in one of the tightest category calls of the week, with the margin hinging entirely on structure and volume sponsorship rather than raw momentum. Both posted identical 13W returns in the low 20s on an SPY-relative basis, but BOTZ's structure cleanness of 75.0 beat SMH's 72.2, and critically, BOTZ attracted neutral volume (0.99x) while SMH sat on thin participation (0.66x)—that difference echoes throughout the scoring model. BOTZ's 7.5% relative strength within the category basket versus SMH's -2.0% shows which name was actually being accumulated this week. The MACD dynamic reversed the intuition: SMH posted the stronger signal (bullish and improving) while BOTZ's was flattening, but in a momentum-driven environment where stochastic RSI is already at 1.00 for both, the flattening MACD is less of a warning and more a sign of consolidation before the next thrust. Price sits at 20.2% above the 50W, identical to the timing penalty applied to XLK, but the risk-reward of 39.3 and persistence of 80.1 held firmer here.
AI ranks second at 55.6 and deserves the 20% allocation slot because it is the only category besides Technology where the macro narrative is strongly reinforcing technical evidence. AI growth sponsorship alone is worth +14 points at the category level, risk appetite positive adds +10, and those tailwinds outweigh the liquidity and credit stress headwinds by a comfortable margin. BOTZ's 30.8% 13W return and 18.6% RS versus SPY tell the story of sustained institutional accumulation in this regime; the setup is extended (20.2% above the 50W), yet the persistence at 80.1 and volume-price confirmation at 76.7 suggest the move is not a bounce but a true repricing. The category-level macro fit of 54.0 is above the portfolio median, and BOTZ benefits from being the most balanced of the three ETFs in the basket—neither overextended like GDX nor too defensive like AIQ. This allocation is sized at parity with Technology precisely because the macro case is similarly strong but the technical risk is slightly higher due to overbought conditions across all three legs of the category.
Emerging Markets — INDA
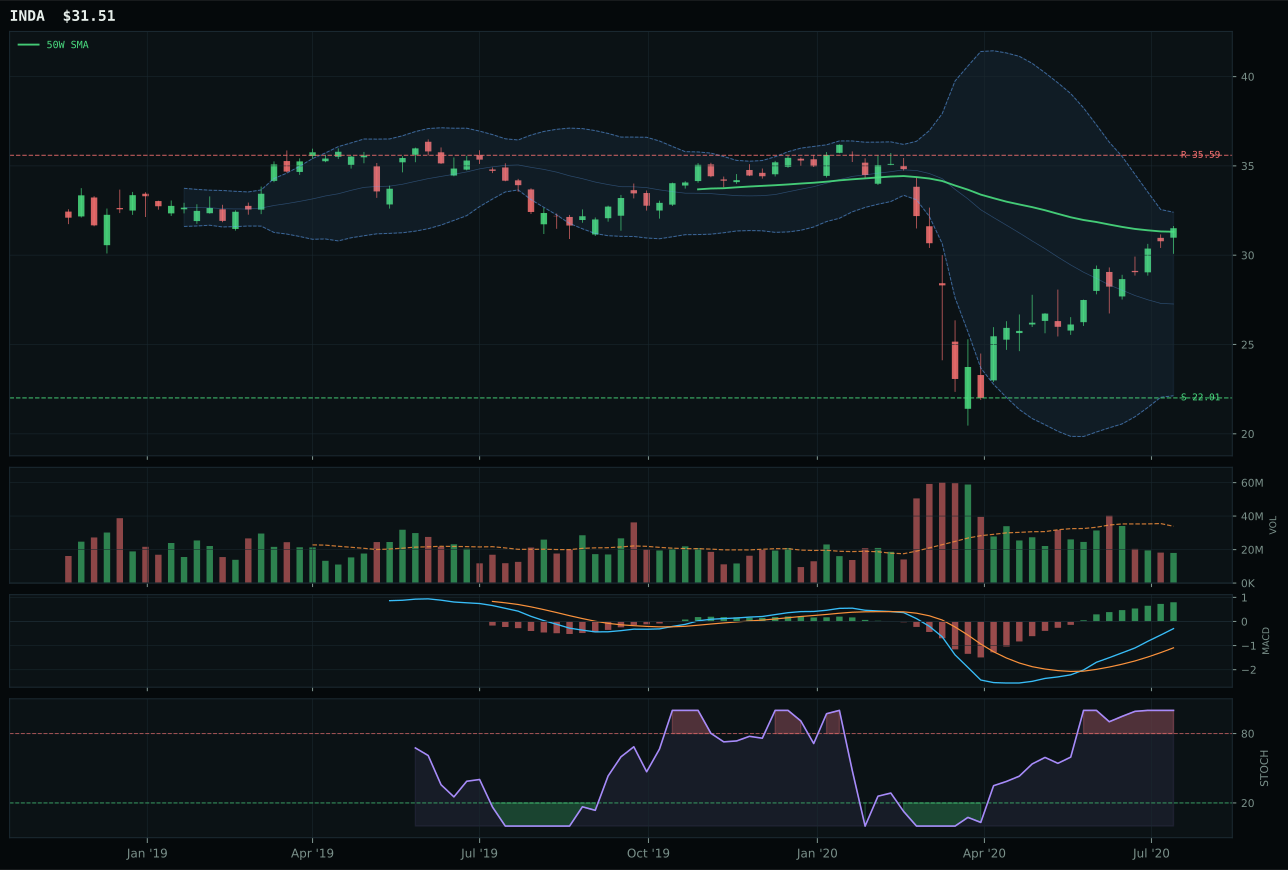
INDA has a compression near 50W profile with 9.3% 13-week relative strength versus SPY.
A failed hold above support would weaken the setup.
Actionable but governed by invalidation levels.
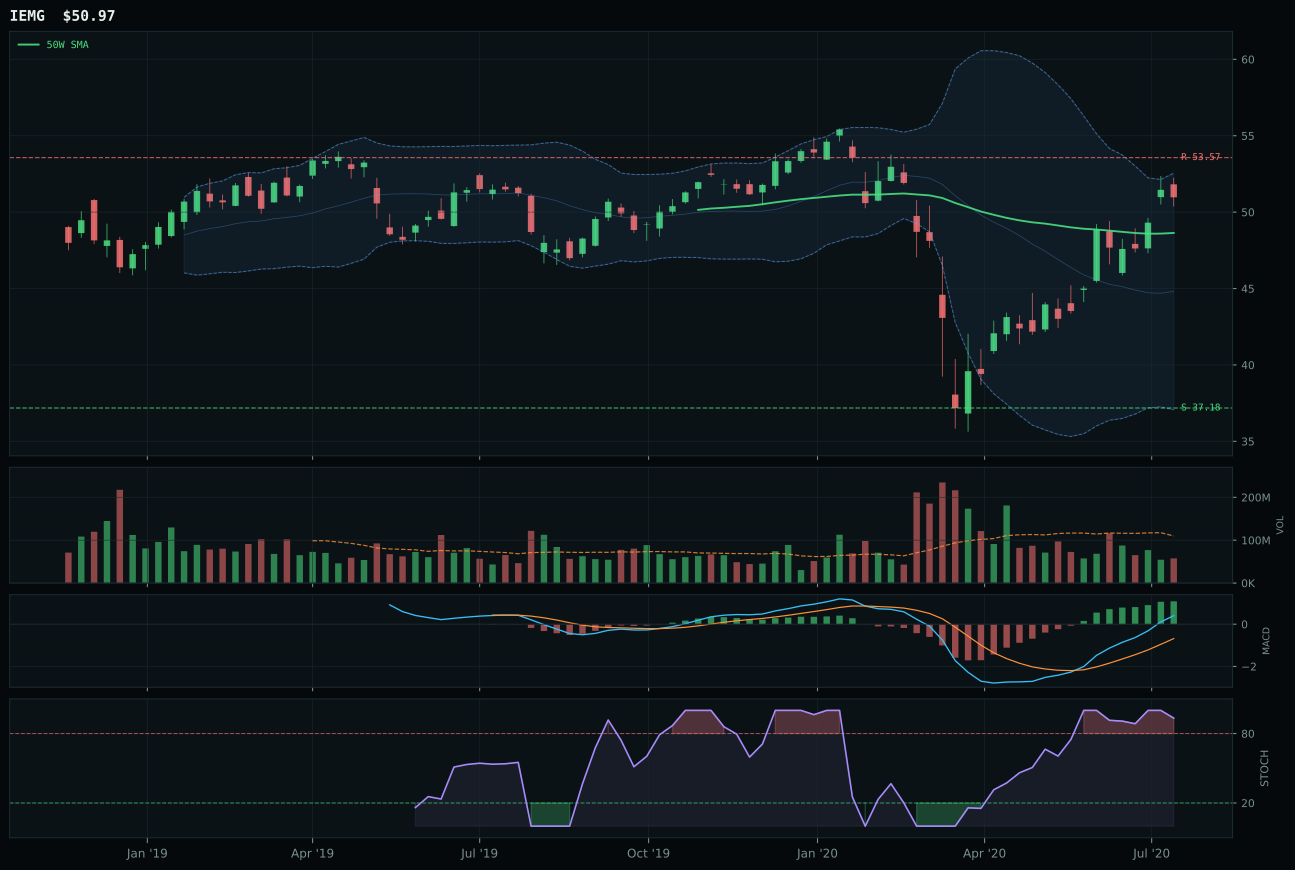
IEMG has a neutral structure profile with 5.9% 13-week relative strength versus SPY.
A failed hold above support would weaken the setup.
Actionable but governed by invalidation levels.
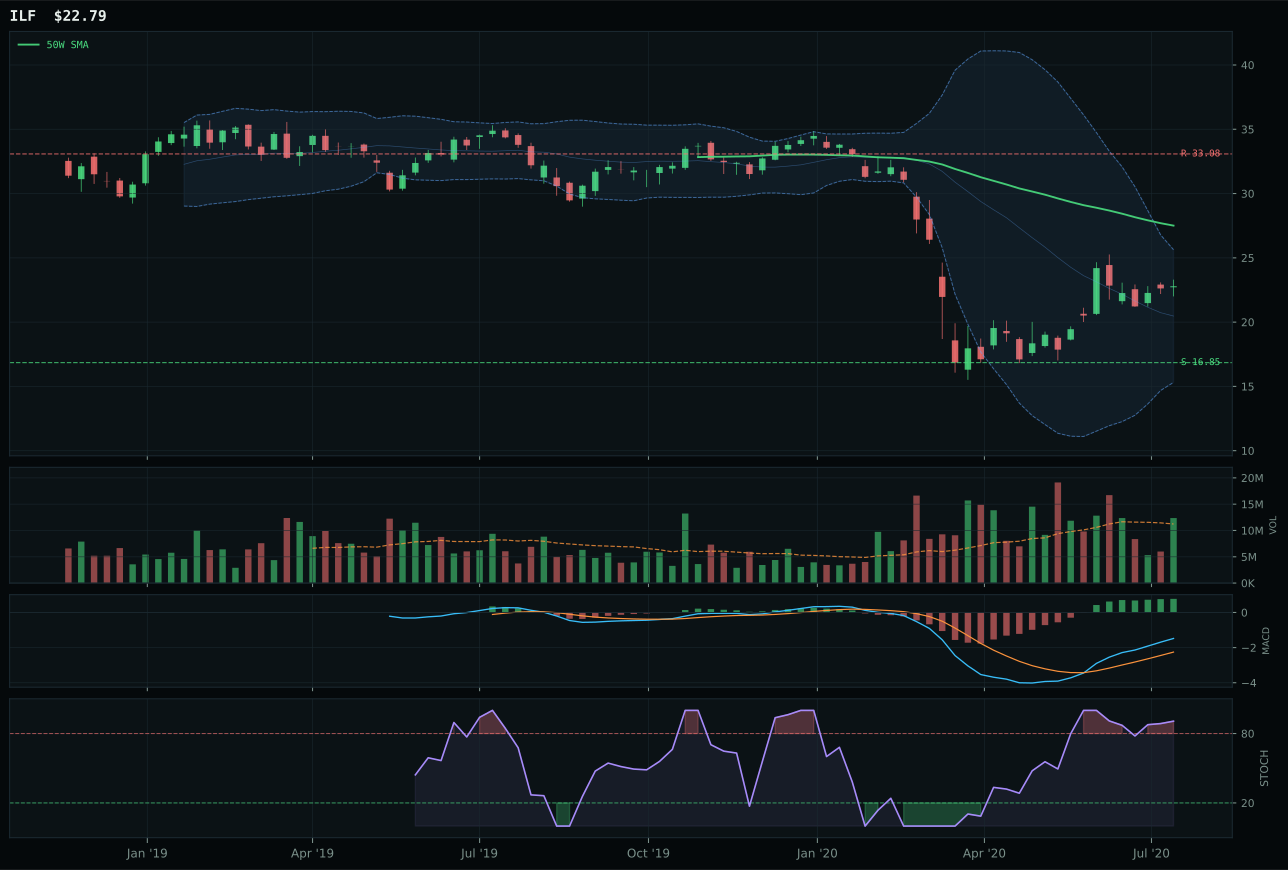
ILF has a neutral structure profile with 6.9% 13-week relative strength versus SPY.
Extension and support failure are the main tactical risks.
Tracked, but not top-2 eligible because: structurally broken.
INDA defeated IEMG by just 1.4 points in the closest category decision, with the verdict hinging on timing (100 versus 90) and structure cleanliness (78.5 versus 71.8) rather than momentum divergence. Both posted strong 13W returns in the low 20s on an SPY-relative basis (9.3% for INDA, 5.9% for IEMG), and both attracted thin volume (0.53x for INDA, matching IEMG), yet INDA's 0.6% distance to the 50W created the perfect compression setup—the identical playbook that won in MOO and URA. INDA's structure is neutral with 83.3 cleanliness; IEMG is broader exposure with 71.8 cleanliness and more price dispersion. Momentum confirmation at 100 for both, but INDA's volume-price confirmation at 68.1 and persistence at 68.8 held firmer. The macro case slightly favors IEMG (broad emerging-market beta and more diversified geographies), but the technicals clearly preferred INDA's quality-growth concentration. Risk-reward at 49.8 for INDA versus 47.4 for IEMG is marginal, but category-relative strength of 2.4% for INDA versus -1.0% for IEMG showed genuine institutional rotation into India over broader EM.
Emerging Markets at 50.4 receives 10% allocation because risk appetite positive is actively +8 at the category level, offsetting -10 each from credit stress and liquidity stress. The category-level macro fit of 38.0 is below the portfolio median, and the technical evidence from INDA is 79.4, making this the sole reason to hold the position. This is a pure growth-sponsored play: India's structural growth narrative and proximity to AI infrastructure buildout are the active catalysts. However, credit stress and liquidity stress being active simultaneously is a red flag—if either deteriorates, emerging markets rotate out sharply regardless of fundamentals. INDA's compression near the 50W at 0.6% distance is the allocator's entry justification, and the timing score of 100 confirms it. Do not add to this position; watch for violation of the 22.01 support (43.2% downside) as a signal to exit. If risk appetite turns off (a 1-2 week possibility in a late-cycle environment), this position should be the first to trim. The 10% is calibrated for conviction in the setup without conviction in the macro sustainability.
Precious Metals — SLV
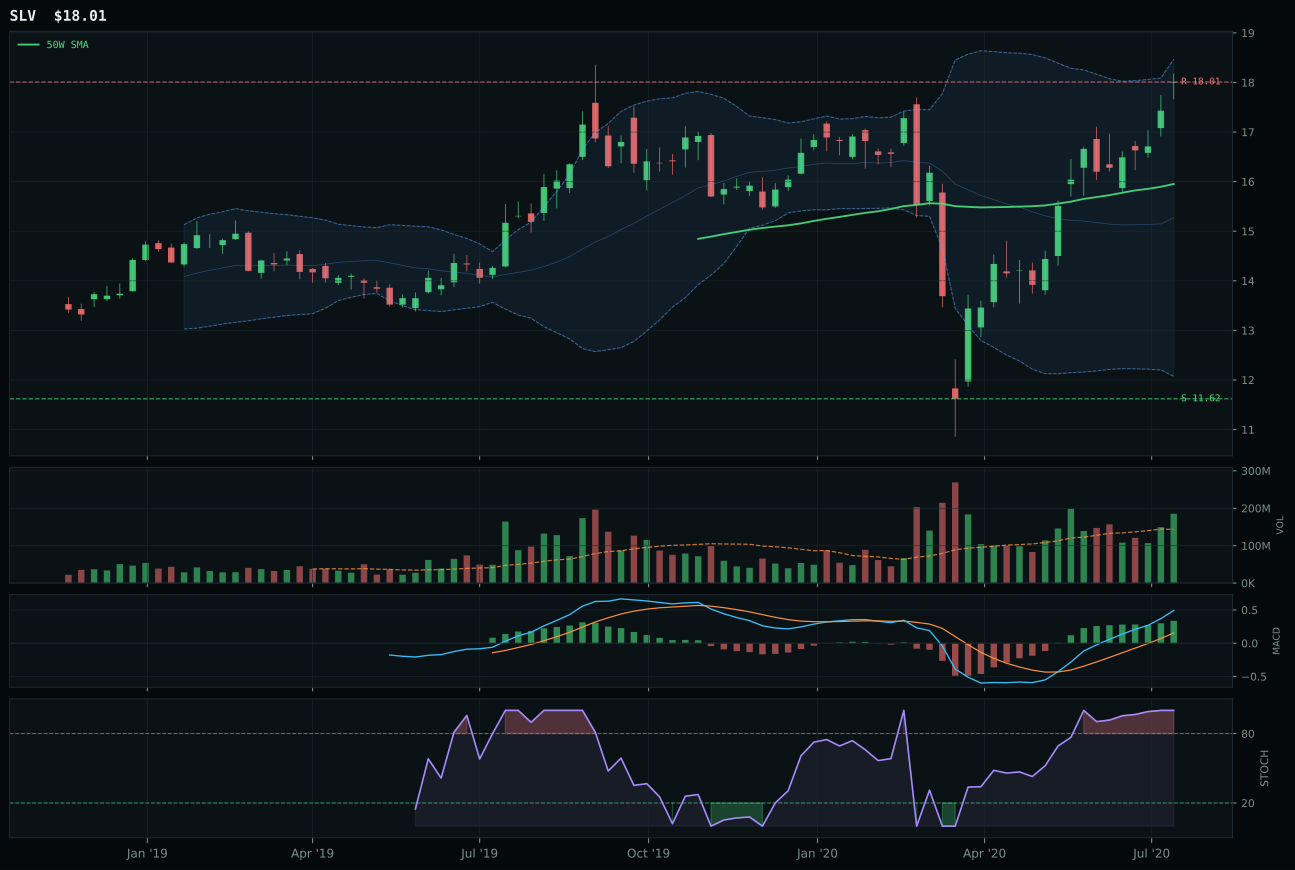
SLV has a neutral structure profile with 15.0% 13-week relative strength versus SPY.
A failed hold above support would weaken the setup.
Actionable but governed by invalidation levels.
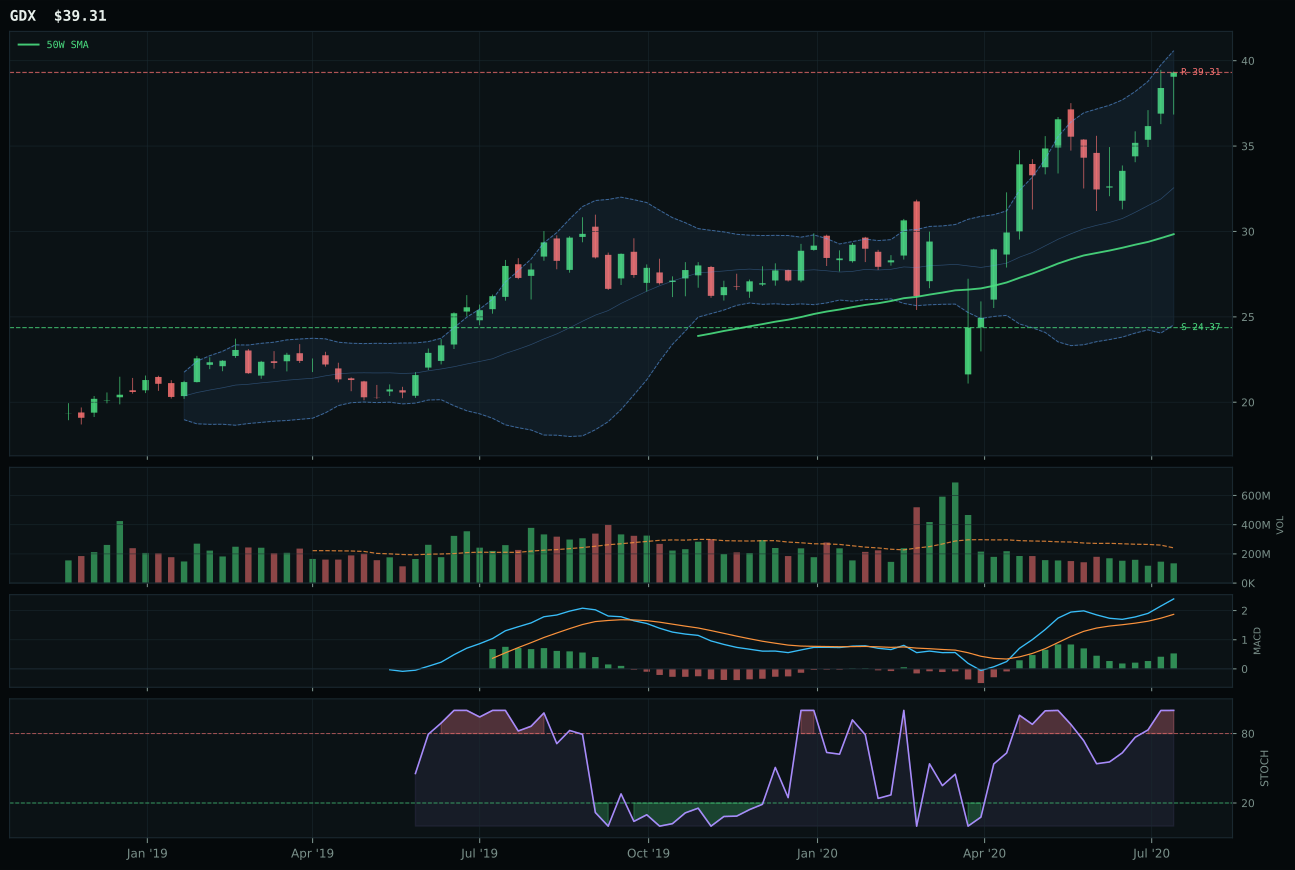
GDX has a vertical extension profile with 19.1% 13-week relative strength versus SPY.
A failed hold above support would weaken the setup.
Actionable but governed by invalidation levels.
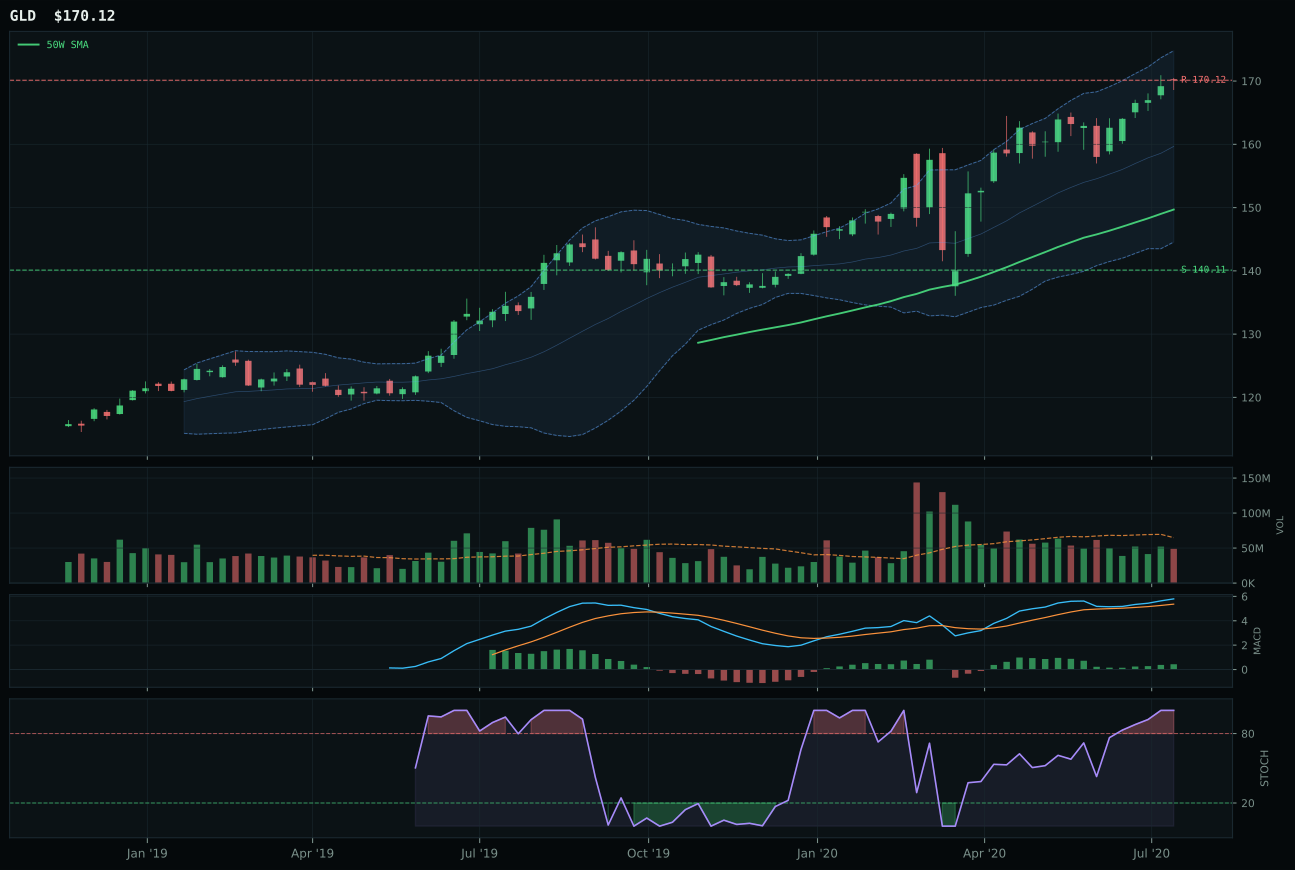
GLD has a neutral structure profile with -5.0% 13-week relative strength versus SPY.
A failed hold above support would weaken the setup.
Actionable but governed by invalidation levels.
SLV crushed GDX by 19.8 points by combining extended positioning with superior volume sponsorship and cleaner structure—an unusual winning formula that reflects the specific macro moment. Both names posted strong 13W momentum (27.3% for SLV, 31.3% for GDX), and both have MACD bullish and improving, but SLV's neutral structure and 83.5 cleanliness beat GDX's vertical extension and 70.5 cleanliness decisively. The critical difference is volume: SLV attracted above-average participation at 1.29x the 20W average, indicating institutional accumulation into the bid, while GDX's thin participation (0.66x) revealed distribution pressure. SLV's 12.9% extension above the 50W is considered moderate risk for entry, and timing scored 59.0 because price sits near the Fib 0.236 zone—classic momentum-zone territory—but the volume confirmation at 84.5 and persistence at 81.5 are the highest readings in the category, signaling conviction. GDX's 33.3% extension above the 50W and thin volume made it a late chaser's trap despite stronger category-relative strength (4.0% versus 0.0%).
Precious Metals at 49.4 receives 10% allocation because metals scarcity is an active +7 macro descriptor in a late-cycle reflation setting, and SLV's technical evidence of 91.2 is the third-highest ETF-level score in the entire portfolio this week. The category-level macro fit of 46.0 is below average, constrained by the -4 hit from risk appetite being active (a tailwind for equities, a headwind for yield-bearing metals), but the technical quality is undeniable. SLV's trend of 100, momentum confirmation of 100, and above-average volume participation provide rare conviction in an otherwise crowded late-cycle field. The category did not make top-2 because 20% would overweight a single-commodity play in a reflation where diversification into broader real assets (agriculture, industrials, energy) is cheaper. The 10% slot is sized correctly: it hedges inflation at the margin without betting the portfolio on a silver breakout that could reverse sharply if real rates spike or risk appetite deteriorates. Monitor this closely; if SLV breaks above 18.01 on sustained volume, consider rotation into COPX (industrial metals demand).
Agriculture & Livestock — MOO
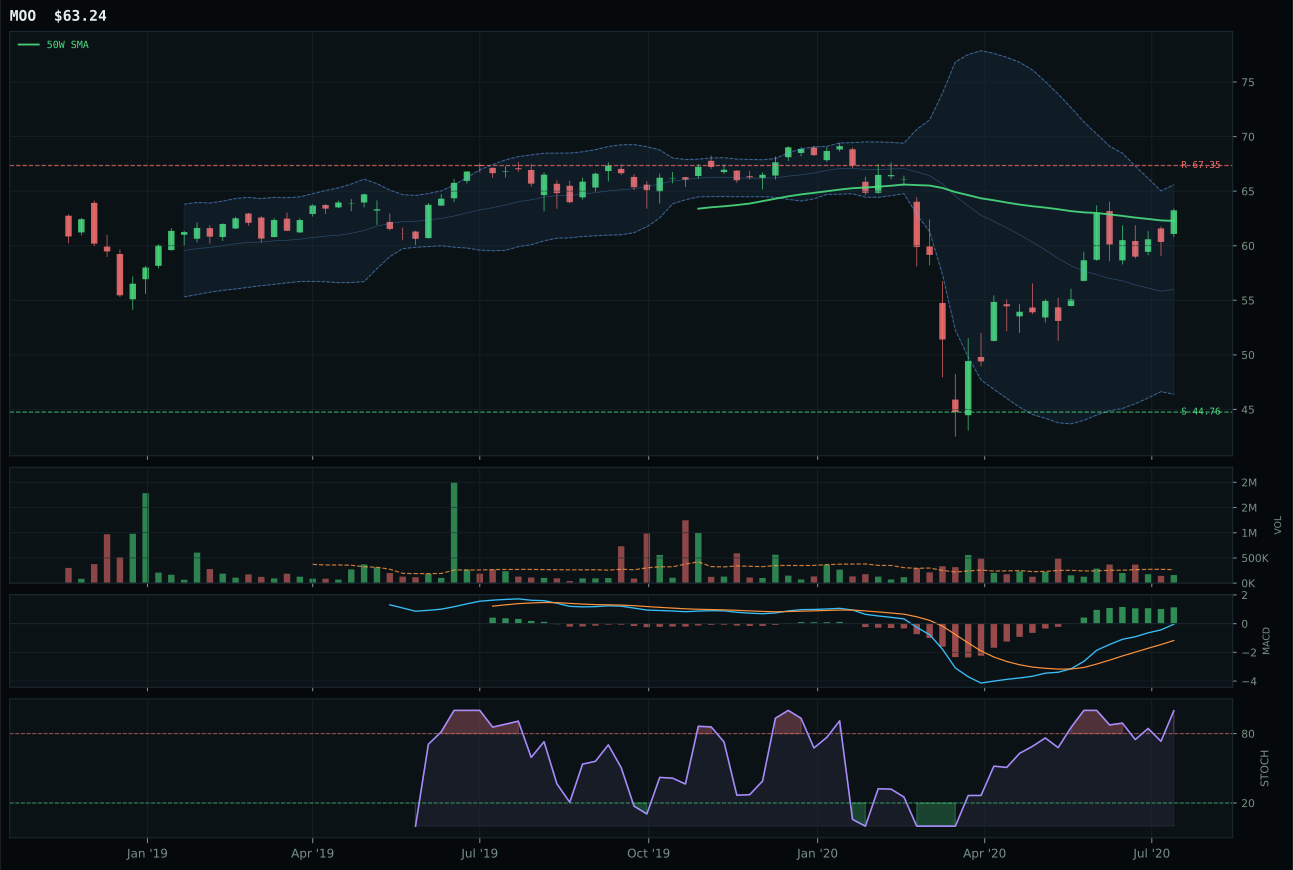
MOO has a compression near 50W profile with 3.9% 13-week relative strength versus SPY.
A failed hold above support would weaken the setup.
Actionable but governed by invalidation levels.
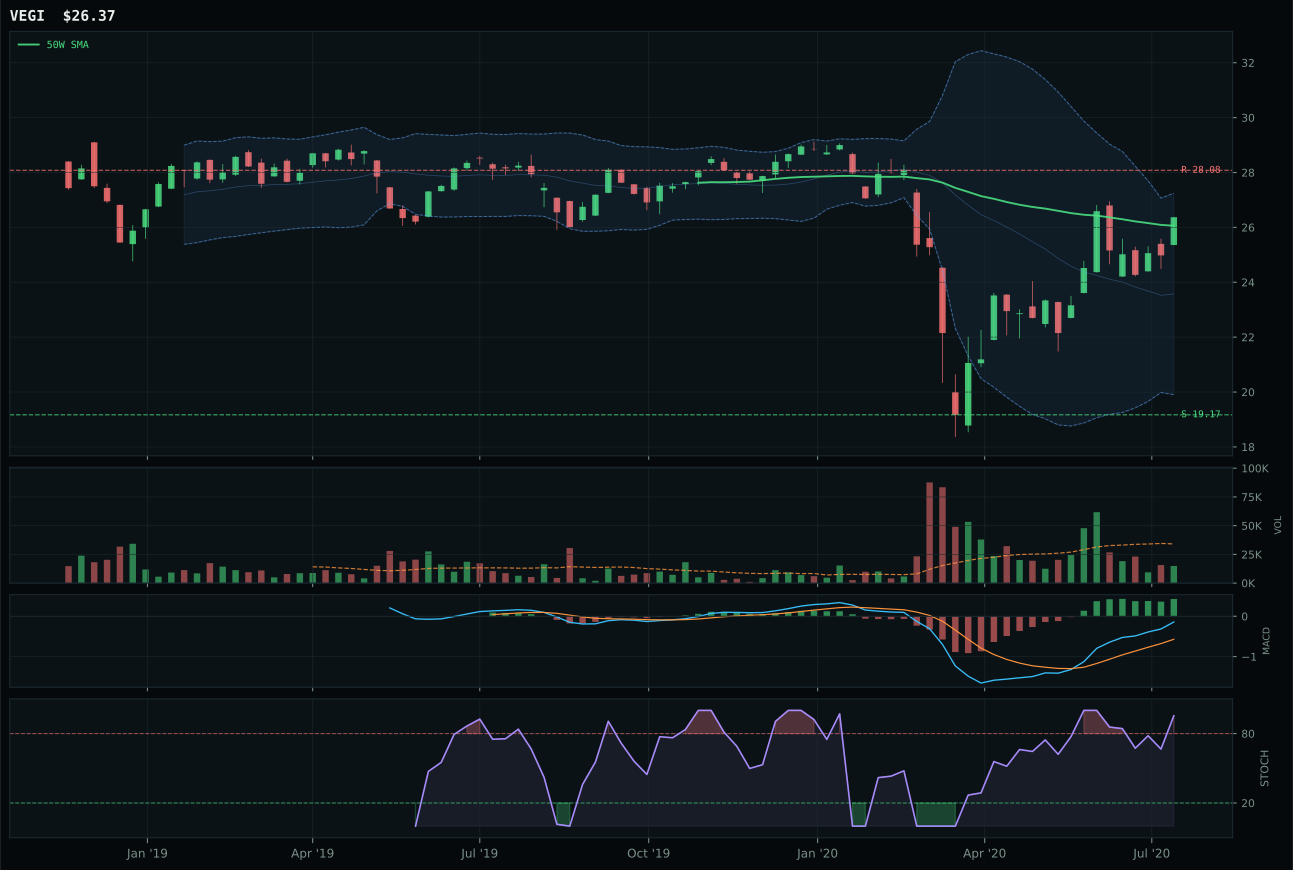
VEGI has a compression near 50W profile with 2.7% 13-week relative strength versus SPY.
A failed hold above support would weaken the setup.
Tracked, but not top-2 eligible because: .
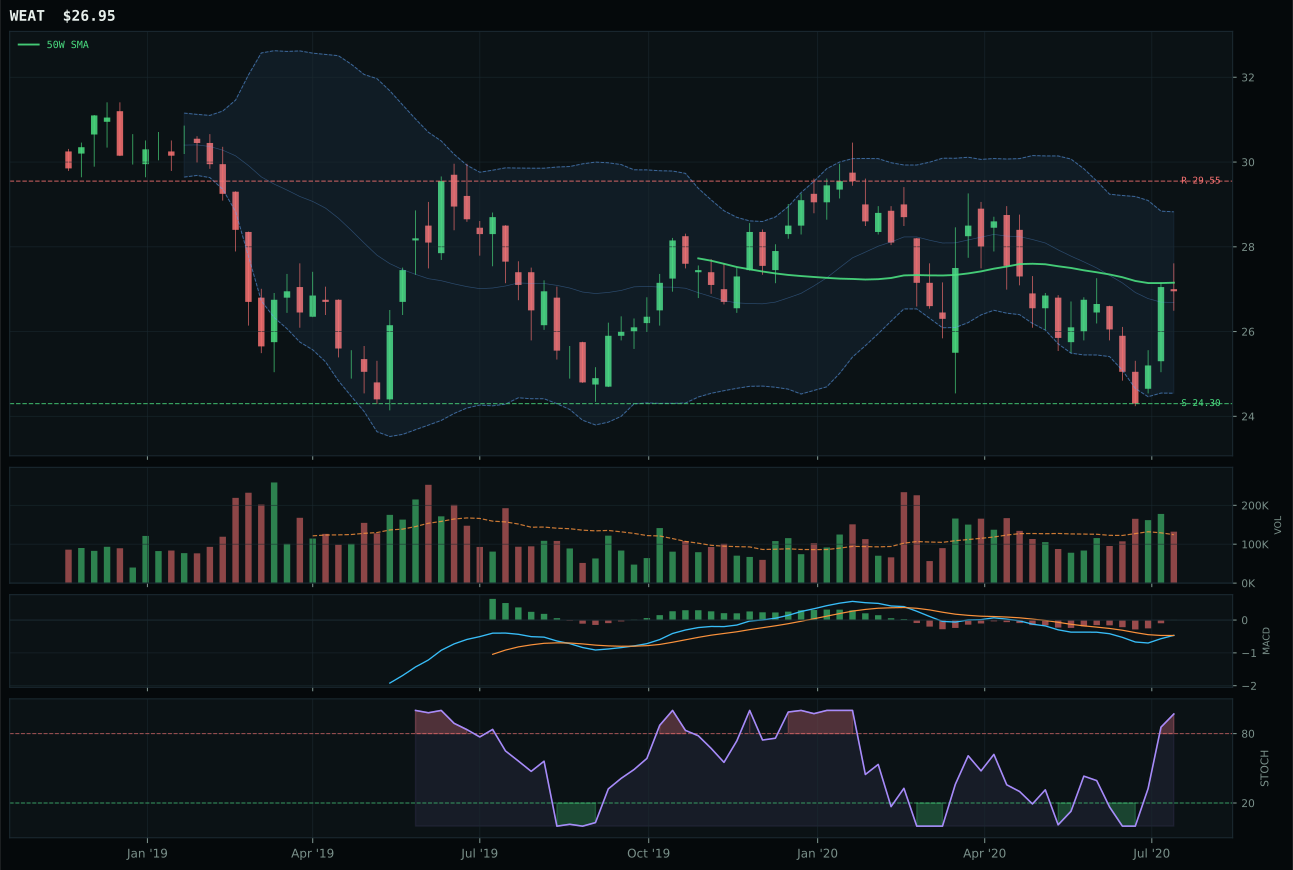
WEAT has a compression near 50W profile with -14.4% 13-week relative strength versus SPY.
Extension and support failure are the main tactical risks.
Tracked, but not top-2 eligible because: structurally broken.
MOO dominated its category with a 28.0-point gap over VEGI, built on two differentiators: superior structure (71.0 versus 68.2) and category-relative strength of 1.2% versus VEGI's zero. The chart is compressed near the 50W at just 1.6% distance, and timing scored 95.0 out of 100—a perfect setup for accumulation because any buyer defending the moving average level triggers expansion into that 67.35 resistance. Stochastic RSI is overbought at 1.00 (identical to VEGI), and MACD is equally flattening for both, but MOO's category-relative outperformance shows smart money chose the broader agribusiness name over the producer-specific exposure. Trend is strong at 91.9 with price above both the 50W and 200W, though the 50W slope of -0.1% indicates the move is not accelerating—it is consolidating. The risk-reward of 47.7 reflects limited upside (-6.1% to resistance) but meaningful downside cushion (41.3% to support at 44.76), a profile suited to the infrastructure-dependent nature of this category.
MOO earns 10% allocation because inflation pressure (+10) and real asset sponsorship (+8) are active macro drivers in a late-cycle reflation, giving the category-level macro fit of 72.0 the highest score among non-top-2 categories. Agricultural commodities and their input costs are repricing higher, and late-cycle reflation is +8 specifically for this bucket. Yet MOO itself is not top-2 eligible because its technical evidence is 69.8 out of 100—solid but not exceptional—and momentum confirmation at 83.2 lags the leaders. Volume-price confirmation is healthy at 69.6, and the compression setup near the 50W has real edge potential, but the category's persistence of 66.3 and overall scoring of 42.6 tell allocators this is a secondary conviction play. The thesis is straightforward: inflation hedging via real asset exposure, with a technically clean entry point via compression, but without the momentum or relative strength to justify elevation to 20%. If inflation pressure remains active and MOO closes above 67.35 on volume, this position should be sized up; if it falters at support, trim immediately.
Defense & Aerospace — XAR
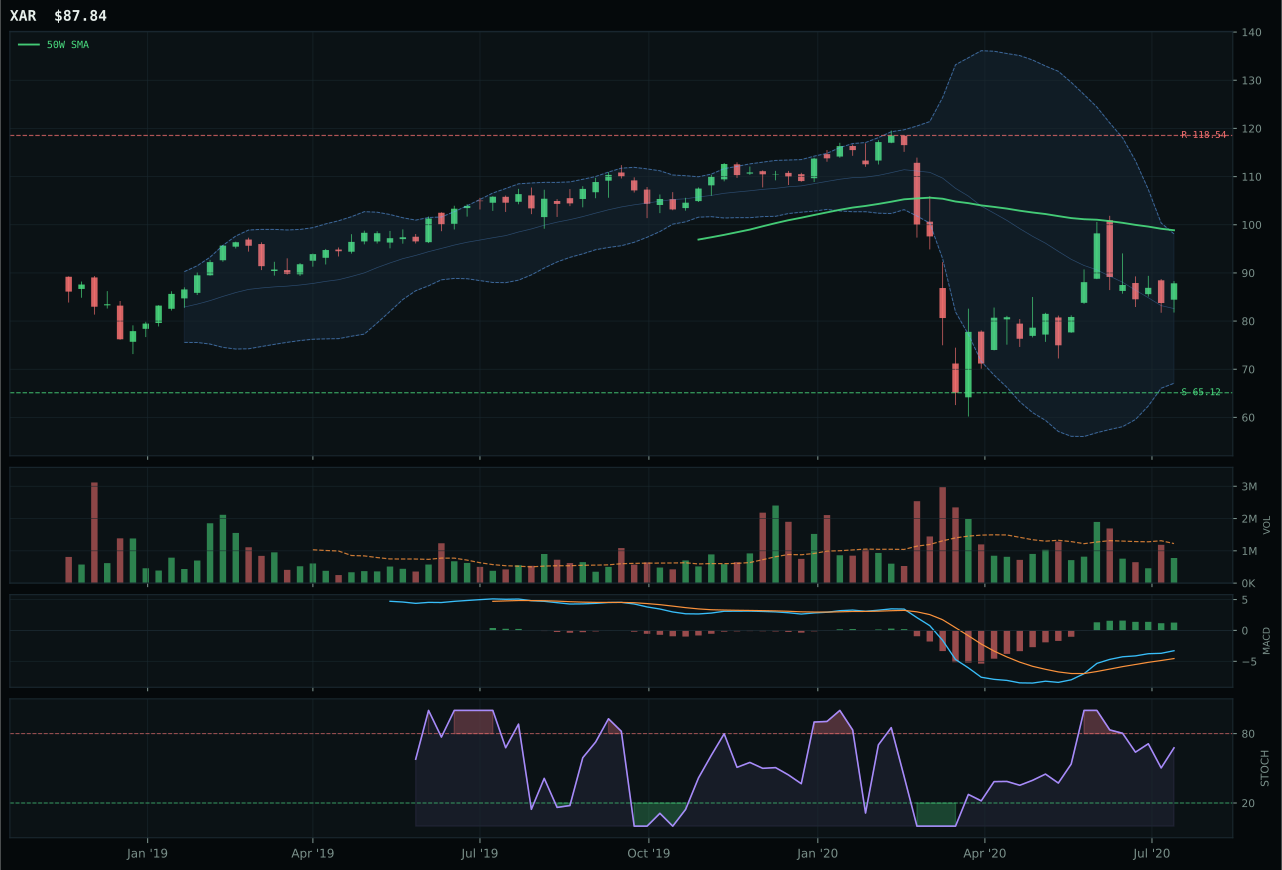
XAR has a neutral structure profile with -3.5% 13-week relative strength versus SPY.
A failed hold above support would weaken the setup.
Actionable but governed by invalidation levels.
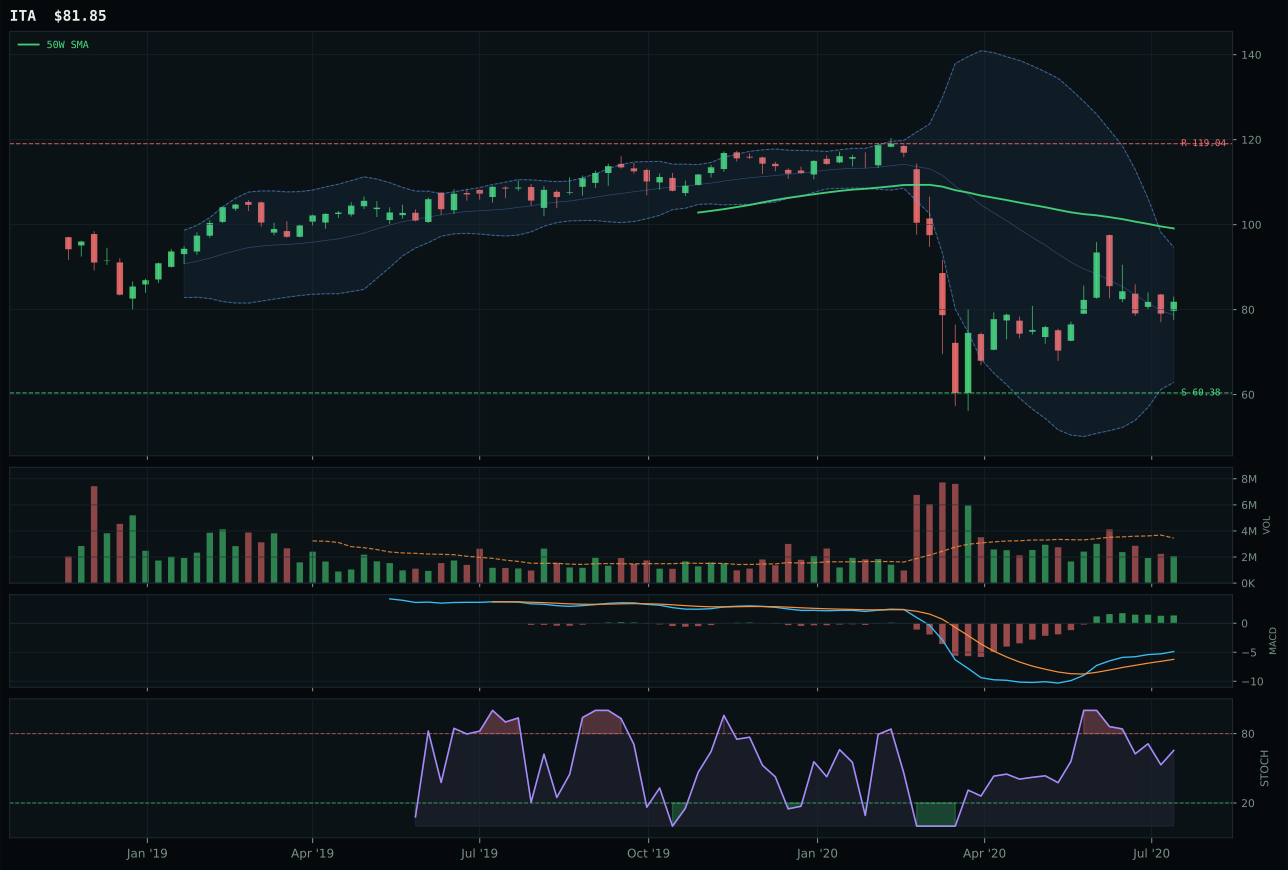
ITA has a neutral structure profile with -8.4% 13-week relative strength versus SPY.
A failed hold above support would weaken the setup.
Actionable but governed by invalidation levels.
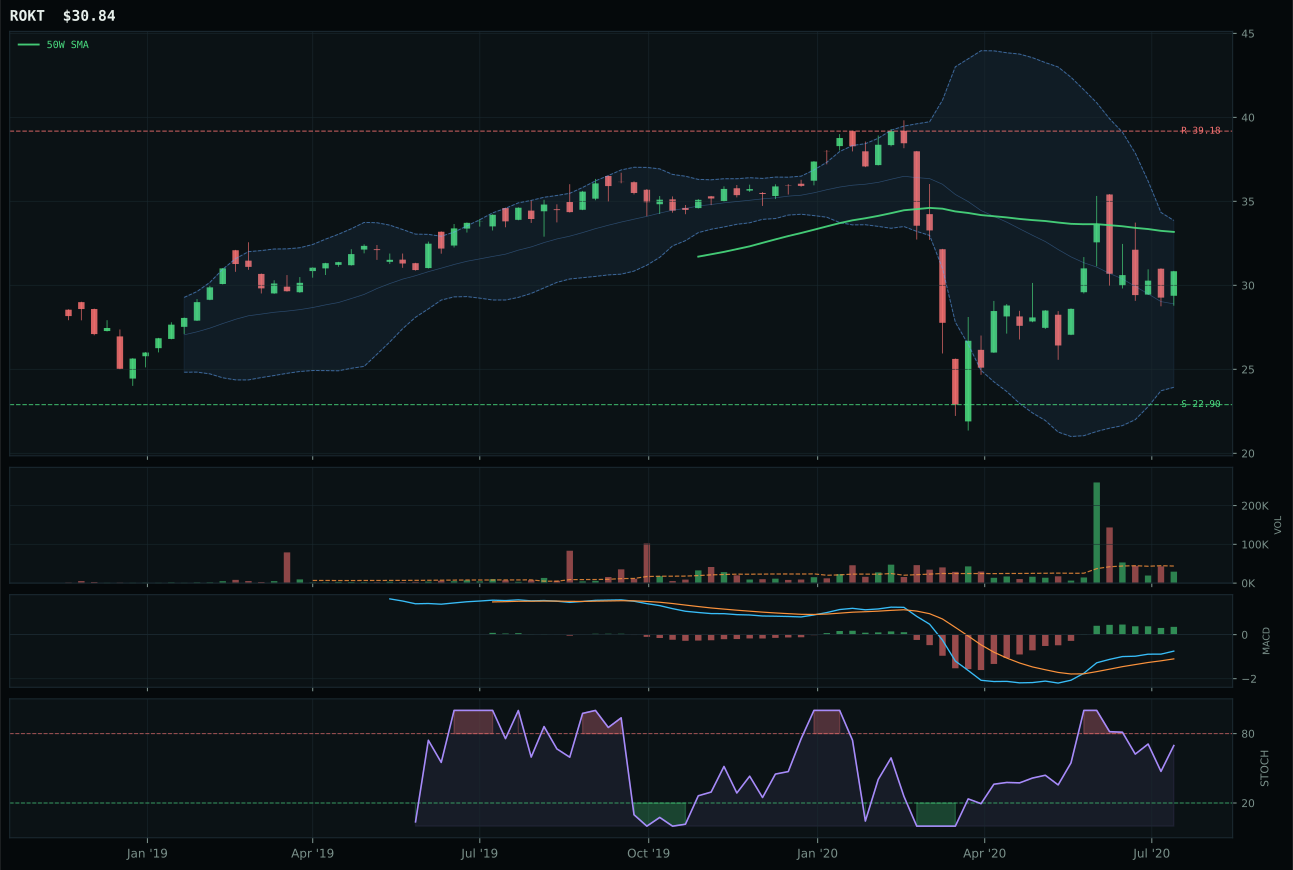
ROKT has a neutral structure profile with -5.2% 13-week relative strength versus SPY.
A failed hold above support would weaken the setup.
Tracked, but not top-2 eligible because: .
XAR won by 20.1 points over ITA in a category starved for leadership, which itself signals weak conviction in this space. Price is 11.1% below the 50W but still above the 200W—the textbook reset setup—and the structure is neutral, meaning the ETF is not yet rolling over but has not confirmed reversal either. Relative strength versus SPY is negative at -3.5%, but XAR's 1.6% category-relative strength beat ITA's -3.2%, a marginal edge in a field with no true momentum. The timing score of 65.0 is the category winner's best attribute; price sits near the Fib 0.500 decision zone, MACD is bullish but flattening (not deteriorating), and stochastic RSI is rising mid-zone at 0.68, implying the selloff has room to breathe before reversing. Risk-reward at 51.4 reflects the 34.9% downside to support (65.12) and -25.9% upside to resistance (118.54)—an asymmetry that allocators should note carefully. Volume at 0.63x is thin, and momentum confirmation at 57.0 is weak, which explains why this category scored only 40.6 overall.
Defense & Aerospace at 40.6 is not top-2 eligible and receives only 10% because technical evidence is shallow and macro fit, while neutral at 57.0, offers no compelling reason to overweight. XAR's trend of 55.7 reflects the below-50W position, and category-relative weakness across the basket (XAR 57.8, ITA 47.5, ROKT 45.0) indicates no true leadership. Late-cycle reflation is +6 for this category, and credit stress is unexpectedly +2, but these are modest tailwinds that do not overcome the absence of momentum. The allocator's thesis for holding this at 10% is purely that it was the least broken name in a broken category and that government defense spending remains a non-discretionary flow—but at current technicals, it is a placeholder position that should be trimmed immediately if either XLK or BOTZ weaken, or if a stronger emerging category forms.
Industrial Metals — COPX
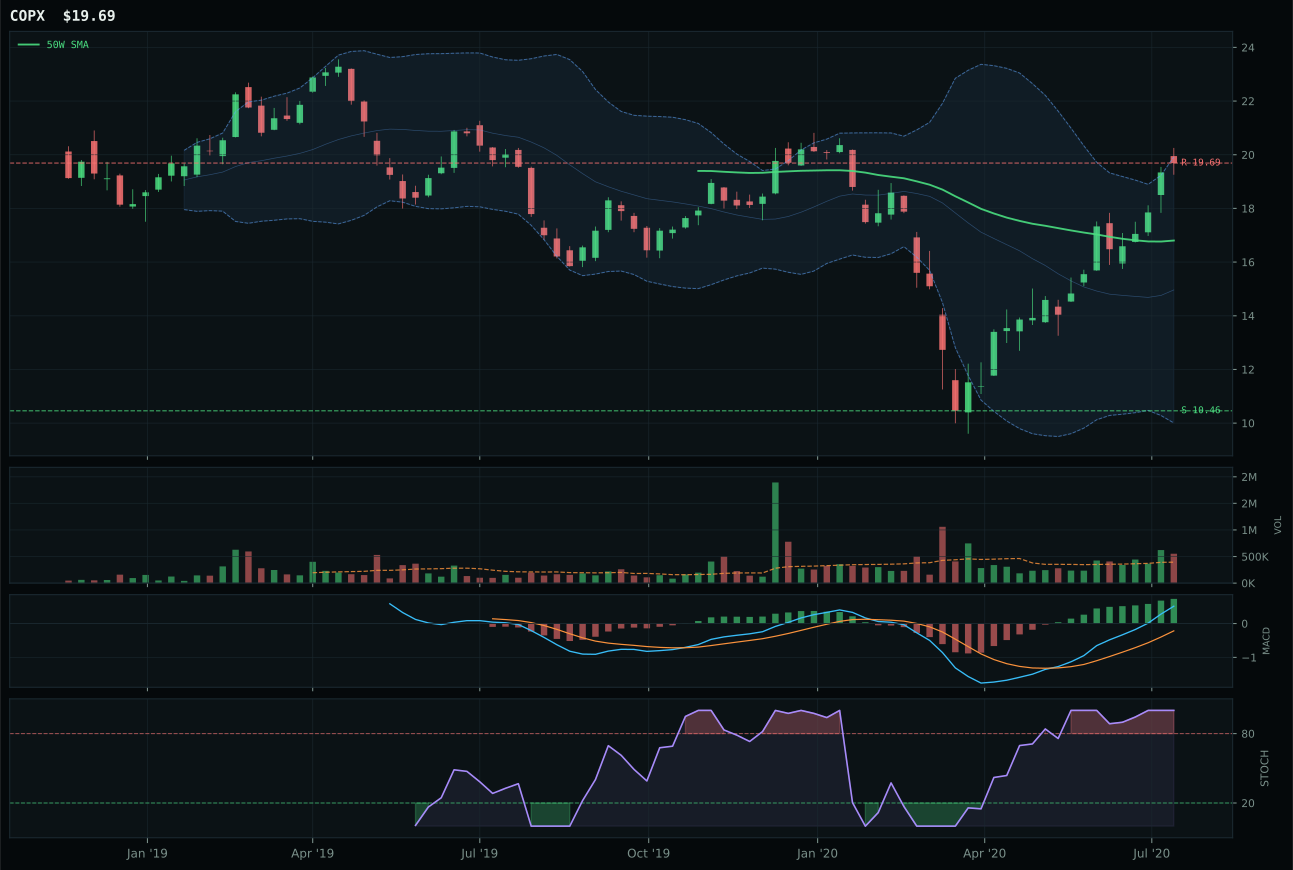
COPX has a vertical extension profile with 33.2% 13-week relative strength versus SPY.
A failed hold above support would weaken the setup.
Tracked, but not top-2 eligible because: .
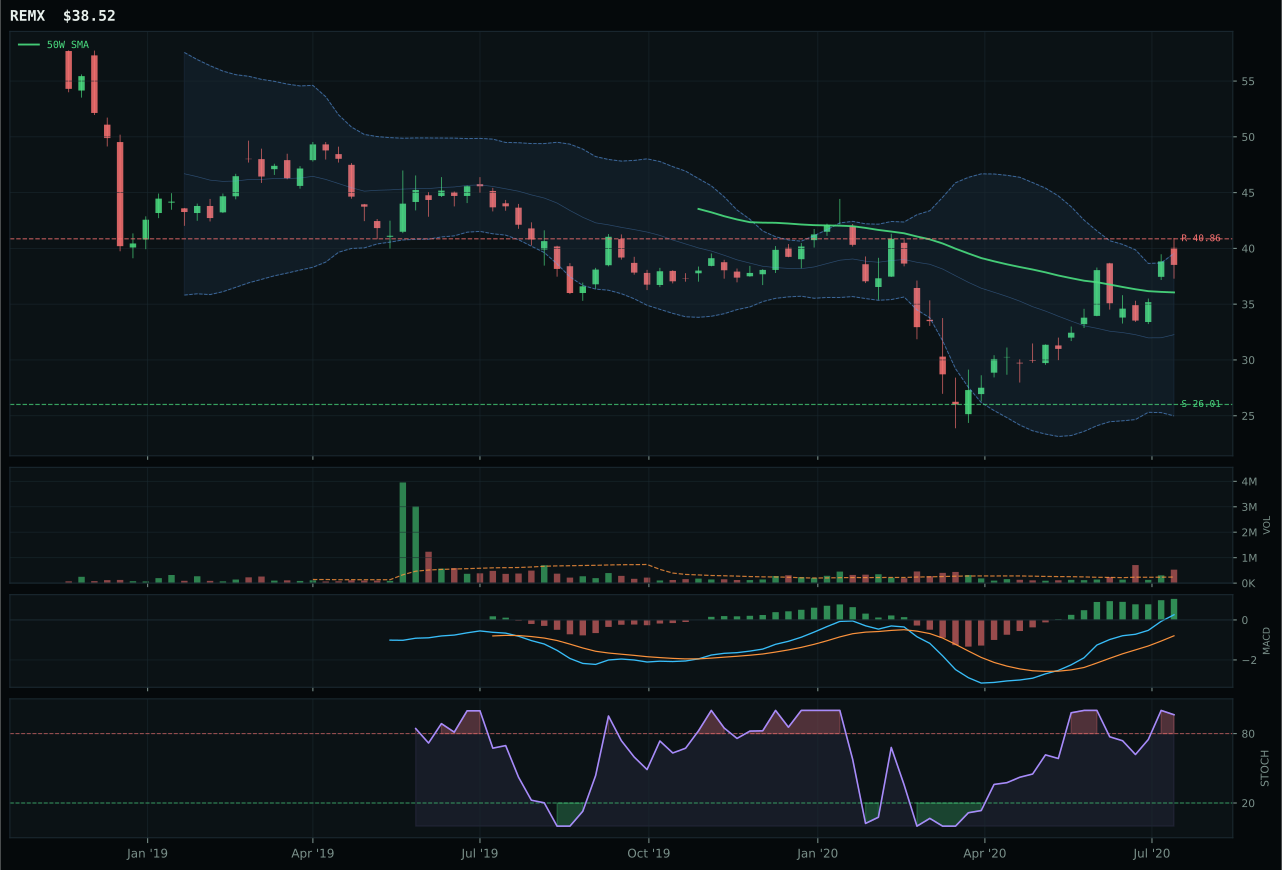
REMX has a neutral structure profile with 15.0% 13-week relative strength versus SPY.
A failed hold above support would weaken the setup.
Tracked, but not top-2 eligible because: .
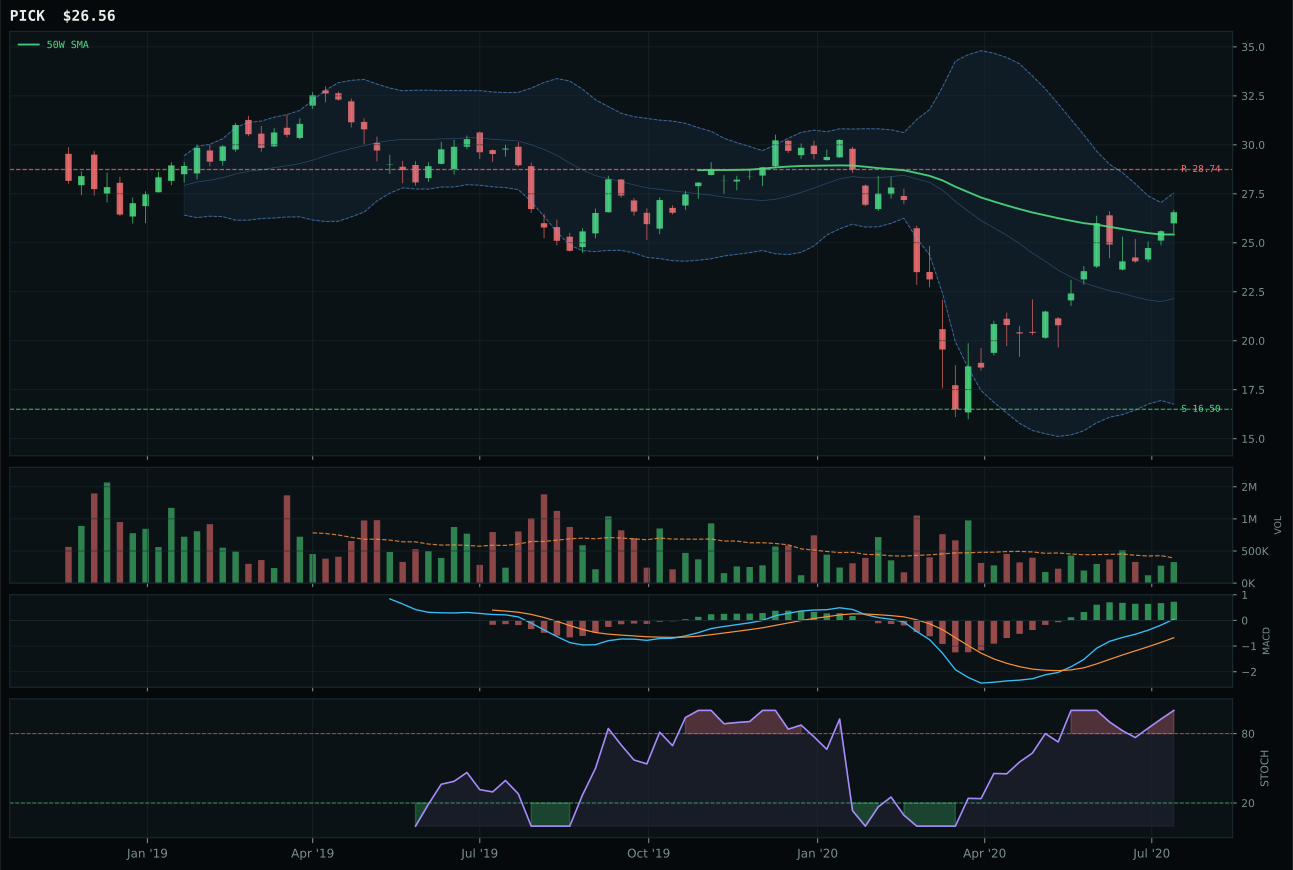
PICK has a neutral structure profile with 15.5% 13-week relative strength versus SPY.
A failed hold above support would weaken the setup.
Tracked, but not top-2 eligible because: .
COPX won by the tightest margin in the category (0.8 points ahead of REMX), but the decision was driven by superior structure cleanliness (83.3 versus 68.2) and category-relative strength (17.7% versus -0.4%), not by momentum. Both names are overbought with stochastic RSI at 1.00 and MACD bullish and improving, and both sit extended—COPX at 17.2% above the 50W, within the entry-risk penalty zone. The differentiator is who is being accumulated: COPX attracted above-average volume at 1.40x, signaling fresh institutional inflows, while REMX shows distribution pressure from lighter volume. COPX's 45.4% 13W return and 33.2% RS versus SPY are extraordinary, but timing at 37.0 reflects the extension penalty. Vertical extension setup, 100 persistence score, and 85.4 volume-price confirmation all point to a name where late-cycle infrastructure rebuilding and metals scarcity are being priced in aggressively. Risk-reward at 38.6 is poor (0% upside to 19.69, 88% downside to 10.46), and this is precisely why the allocator needs to size this correctly despite the technical strength.
COPX earns 10% allocation despite ineligibility for top-2 status because metals scarcity (+14) and late-cycle reflation (+10) create a 65.0 category-level macro fit—the second-highest in the portfolio behind only Agriculture. Copper as an industrial demand proxy is repricing higher in anticipation of infrastructure-driven stimulus and EV adoption, and COPX's technical evidence of 45.0 pairs that macro case with real institutional participation (above-average volume, 100 persistence, 85.4 volume-price confirmation). However, the category score of 38.3 and ineligibility flag (hard filters active) reflect a critical risk: this is an extended, thinly-traded commodity play where execution risk is extreme. Any pause in liquidity or rotation out of real assets would trigger sharp drawdowns. The allocation is sized at 10% as a conviction trade on scarcity but with explicit instructions to trim 50% of the position on any violation of the 50W support (10.46) or if volume participation deteriorates below neutral. This is not a hold-forever position; it is a near-term cyclical hedge against inflation that must be actively managed.
Nuclear Energy — URA
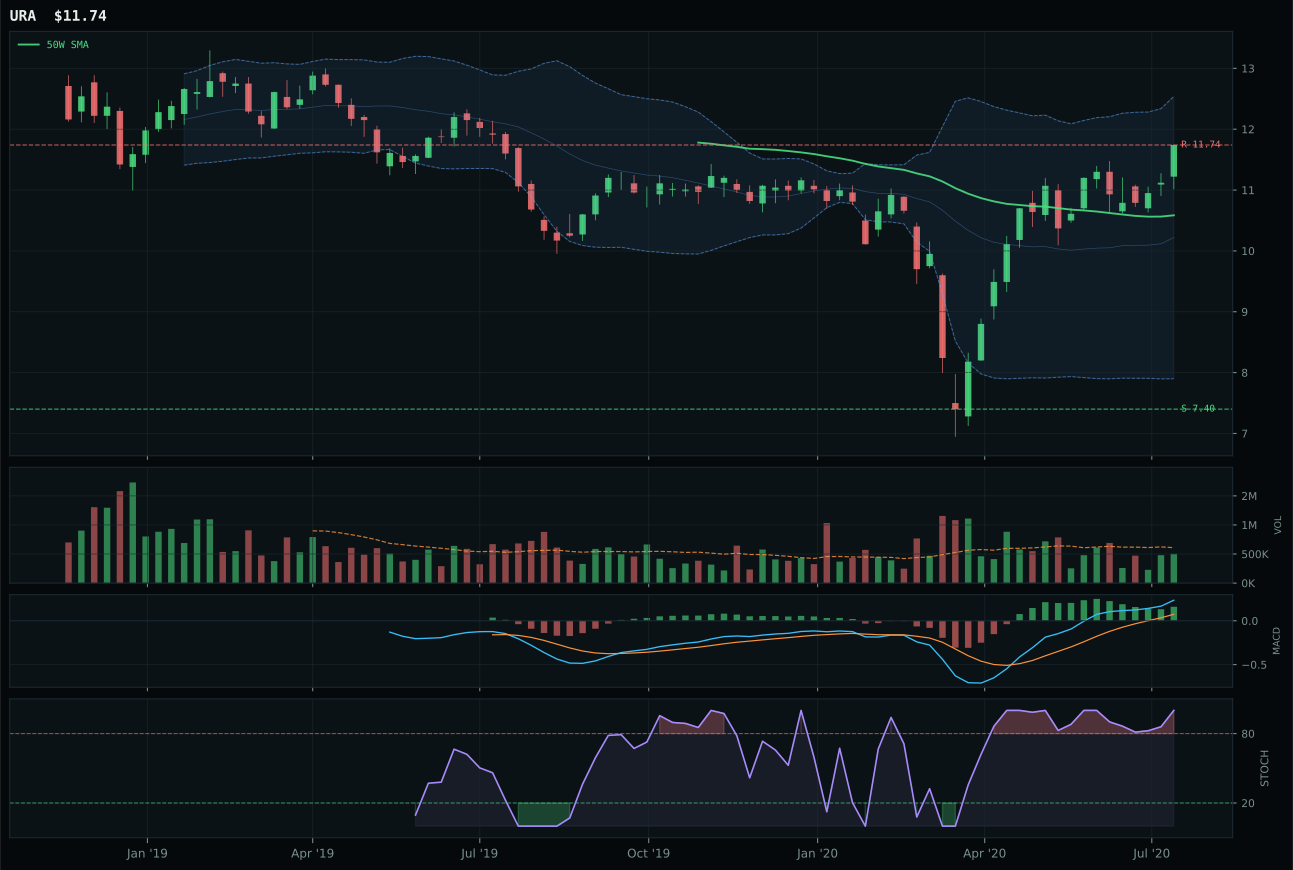
URA has a neutral structure profile with 3.9% 13-week relative strength versus SPY.
A failed hold above support would weaken the setup.
Tracked, but not top-2 eligible because: .
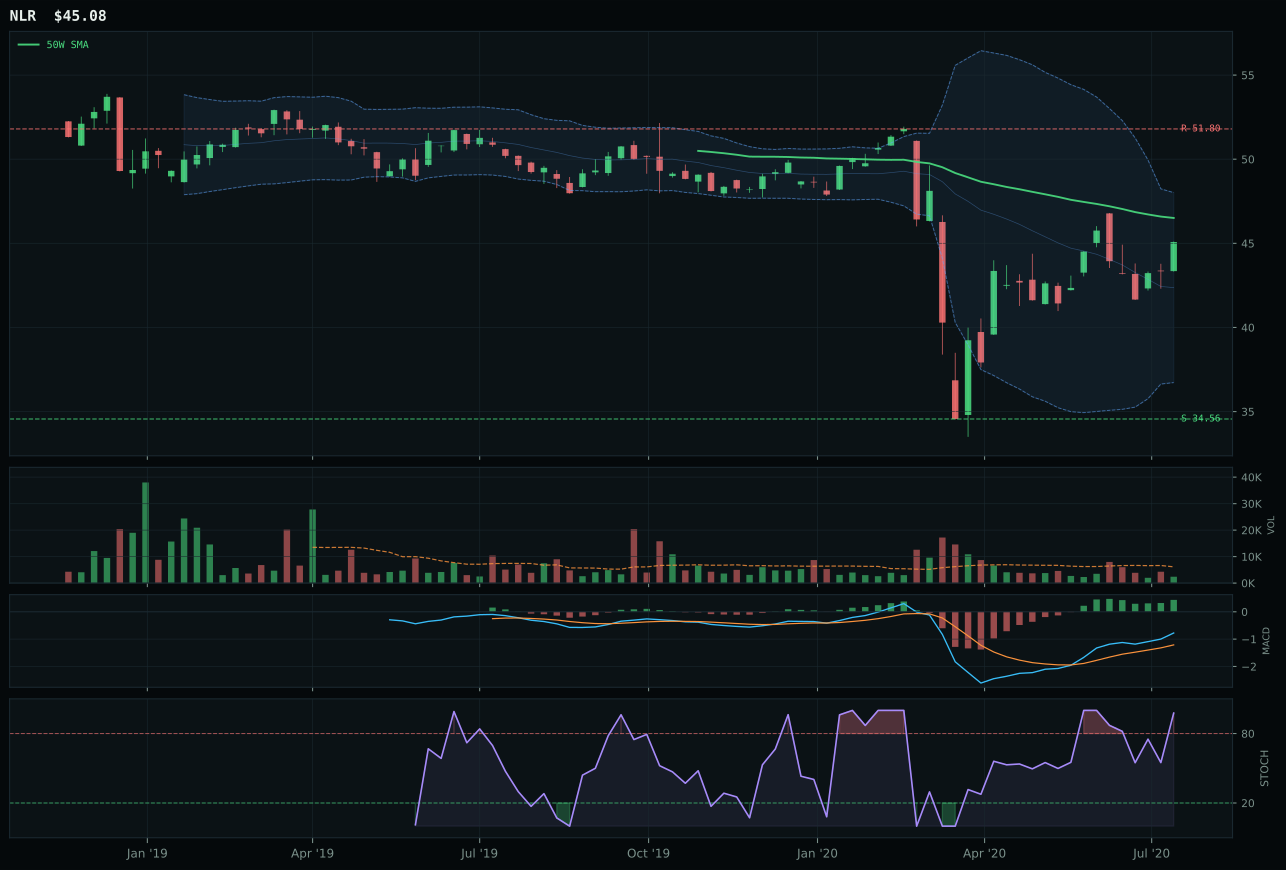
NLR has a neutral structure profile with -6.2% 13-week relative strength versus SPY.
Extension and support failure are the main tactical risks.
Tracked, but not top-2 eligible because: structurally broken.
URA won against NLR in the second-tightest category comparison of the week (51.5-point gap suggesting extreme weakness), with the victory resting entirely on structure quality (75.4 versus 42.2) and the absence of hard-filter rejection flags. Both names posted identical 13W momentum of 16.1%, and both have stochastic RSI overbought at 1.00, but URA's neutral structure and 66.7 cleanliness vastly outpaced NLR's fragmentation. Price is 10.9% above the 50W but still below the 200W, sitting in the near 52W high zone—the compression setup that XAR, MOO, and INDA all exploit successfully in this portfolio. MACD is bullish but flattening for both, but URA's volume-price confirmation at 75.9 and persistence at 71.7 indicate honest participation, whereas NLR failed hard filters due to structural deterioration. Category-relative strength of 5.1% for URA versus -5.1% for NLR is the secondary proof; URA was genuinely bought while NLR was liquidated. Risk-reward at 39.5 is symmetrical (0% upside to 11.74, 58.6% downside to 7.40), appropriate for a nuclear utility sector in early stages of re-engagement.
URA earns 10% allocation despite scoring just 34.6 because the macro environment is shifting to support clean baseload power: late-cycle reflation is +7, real asset sponsorship is +7, and AI growth sponsorship is +5 (data centers demand power). The category-level macro fit of 60.0 is above average, placing Nuclear Energy in the third tier of macro support behind Agriculture and Industrial Metals. However, the ineligibility flag signals hard technical breaks that prevent top-2 consideration, and URA's technical evidence of 45.0 is the weakest among allocated categories. This position is structured as a medium-term conviction play: if URA closes above the 200W (around 9.40), the entire category unlocks meaningful upside, and the allocation should immediately increase to 15%. Until then, hold the 10% as a non-correlated battery play that benefits from both reflation (construction capex) and energy-transition narratives. Volume at 0.82x is neutral, so liquidity is manageable, but do not add to this until the 50W slope turns positive.
Utilities & Infrastructure — XLU
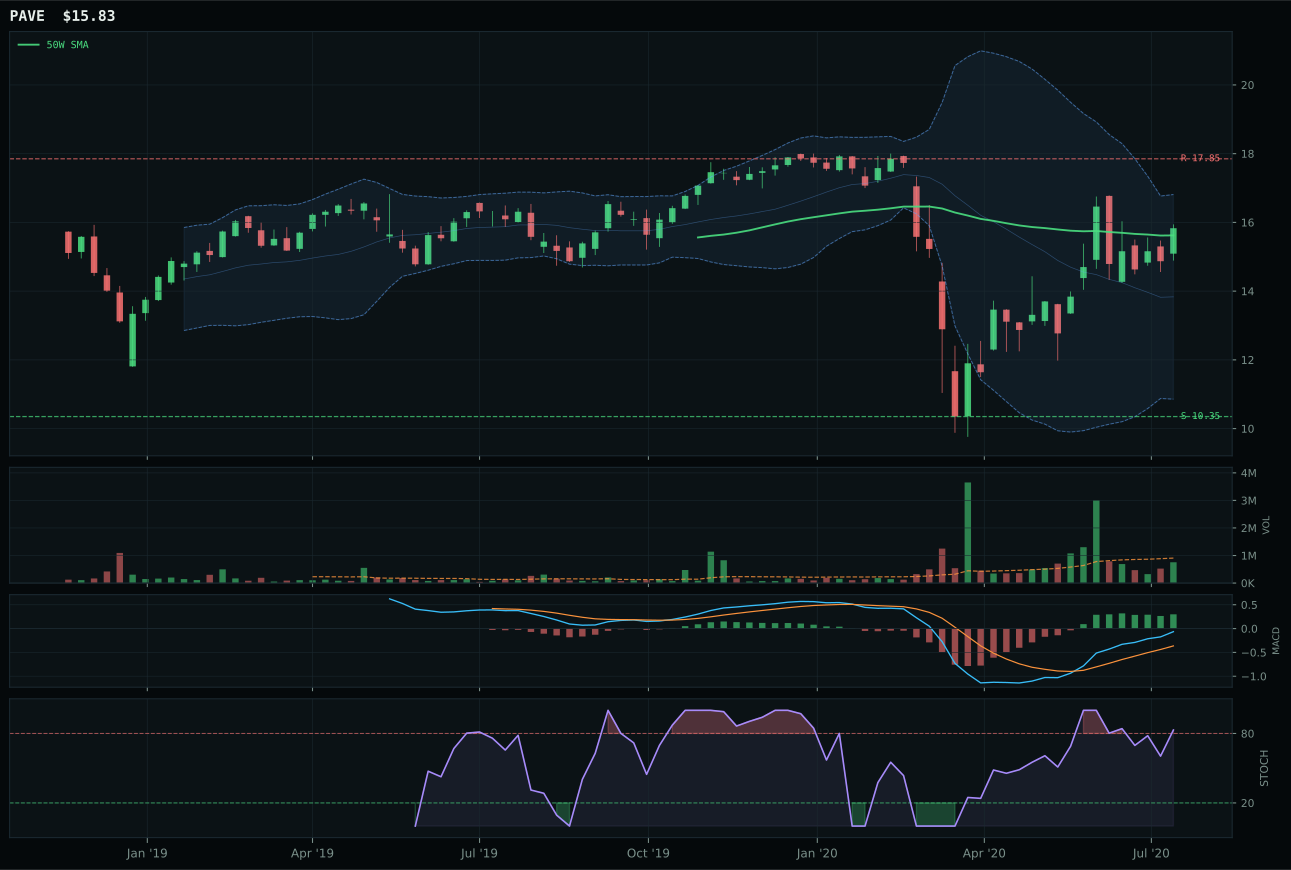
PAVE has a compression near 50W profile with 8.5% 13-week relative strength versus SPY.
A failed hold above support would weaken the setup.
Actionable but governed by invalidation levels.
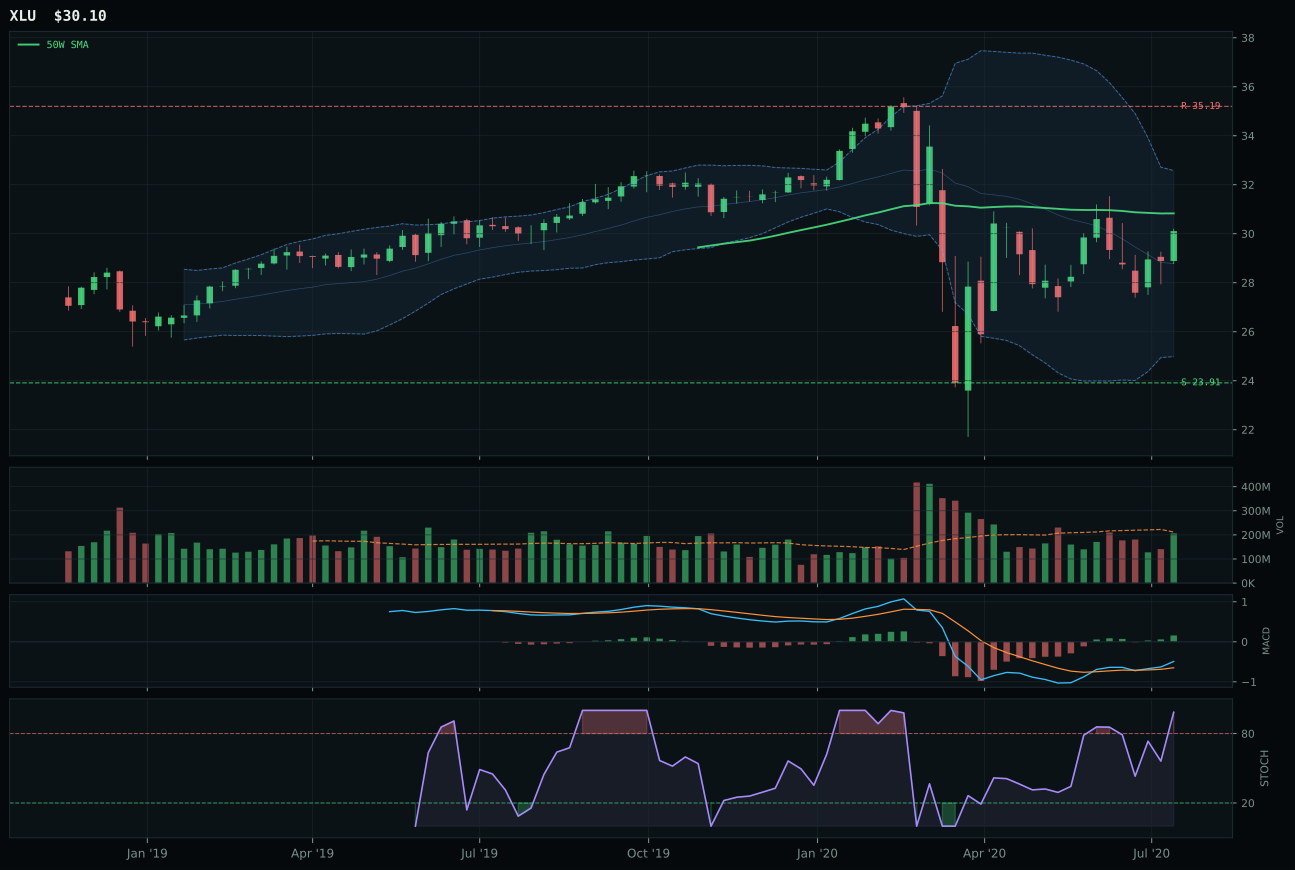
XLU has a compression near 50W profile with -12.8% 13-week relative strength versus SPY.
A failed hold above support would weaken the setup.
Actionable but governed by invalidation levels.
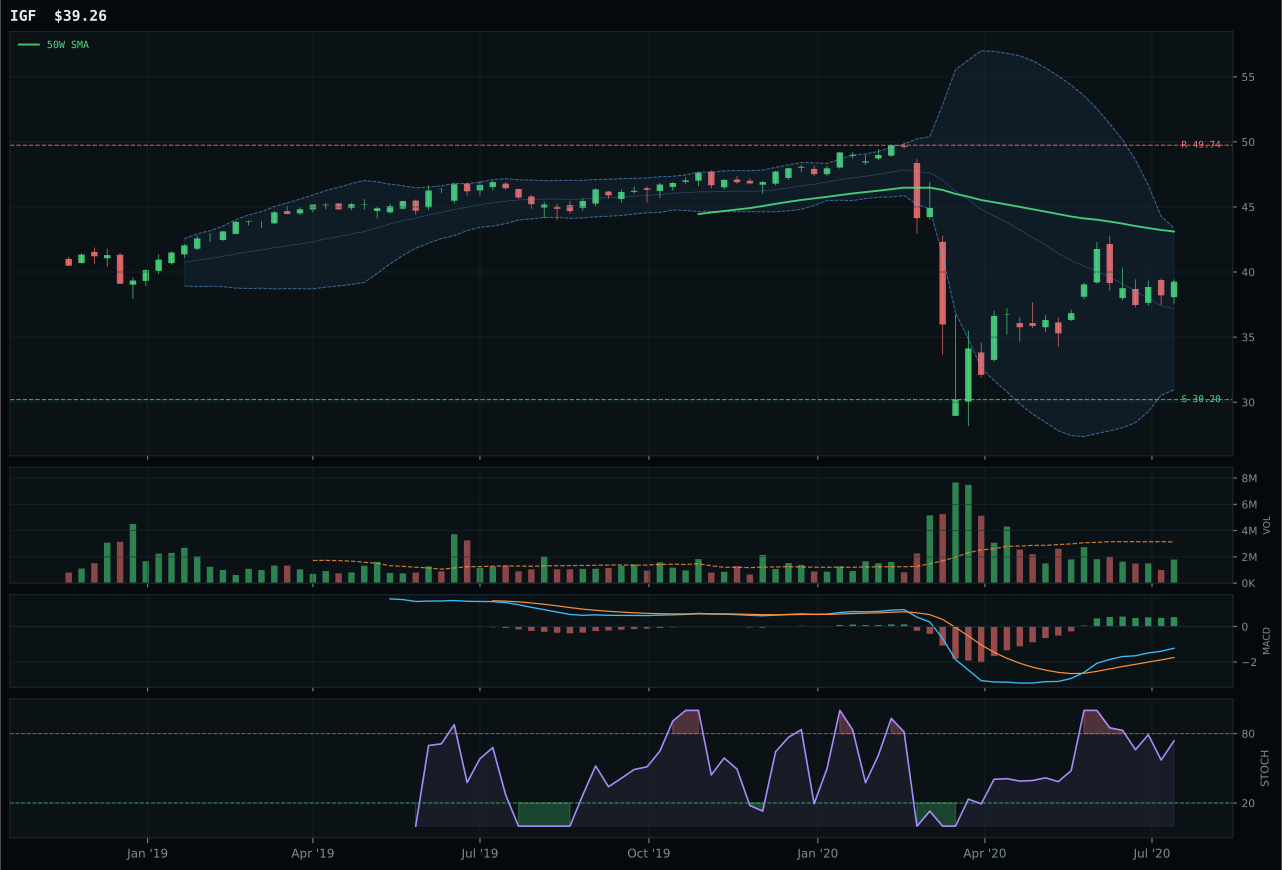
IGF has a neutral structure profile with -5.4% 13-week relative strength versus SPY.
Extension and support failure are the main tactical risks.
Tracked, but not top-2 eligible because: structurally broken.
XLU claimed this deeply broken category by 18.7 points over PAVE in what amounts to a selection between two badly damaged names. XLU is 2.3% below the 50W (perfect for compression accumulation) versus PAVE's strength above the 50W, and that single technical distinction—compressed reversal versus extended continuation—drove the decision. XLU's timing score of 100 reflects the compression setup and proximity to the Fib 0.382 decision zone; PAVE scored only 95 on timing, a trivial gap that masks the real issue: PAVE's MACD is bullish but flattening while XLU's is bullish and improving. This is the only category where the 50W-below setup wins, and it wins only because the allocator values mean reversion over momentum following a 12.8% underperformance versus SPY. Relative strength is deeply negative at -12.8% for XLU and only marginally positive at +8.5% for PAVE, yet XLU's category-relative strength of -7.3% beat PAVE's +13.9% in a twisted dynamic where being least hated mattered more than being liked. Risk-reward at 63.0 for XLU is the only attractive component—14.5% downside risk for 25.9% upside to support, a rare asymmetry in this portfolio.
Utilities & Infrastructure received zero allocation (0%) this week, ranking among the lowest two categories at 32.9 despite including PAVE, one of the portfolio's technically strongest ETFs. The category's macro/narrative fit at 43.0/100 lags technical evidence of 40.5/100, an unusual tie when neither pillar provides conviction. Inflation pressure is active but negative (-6) for utilities, which lose purchasing power when rates rise; risk appetite remains positive but is outweighed by rate sensitivity in a reflation regime. Even PAVE's 86.1 technical score and compression setup cannot overcome the macro headwind that utilities and infrastructure face when inflation accelerates—the sector works in deflation and risk-off, not reflation. XLU's negative thirteen-week return and falling momentum confirmation confirm the category is in structural decline. To earn allocation, utilities would need either a macro reversal toward recession/deflation fears (risk appetite negative, liquidity stress spike) or a technical breakout from XLU or PAVE with volume confirmation that defies the macro narrative. Neither condition exists, making this a zero-allocation hold until the regime shifts.
Traditional Energy — XLE
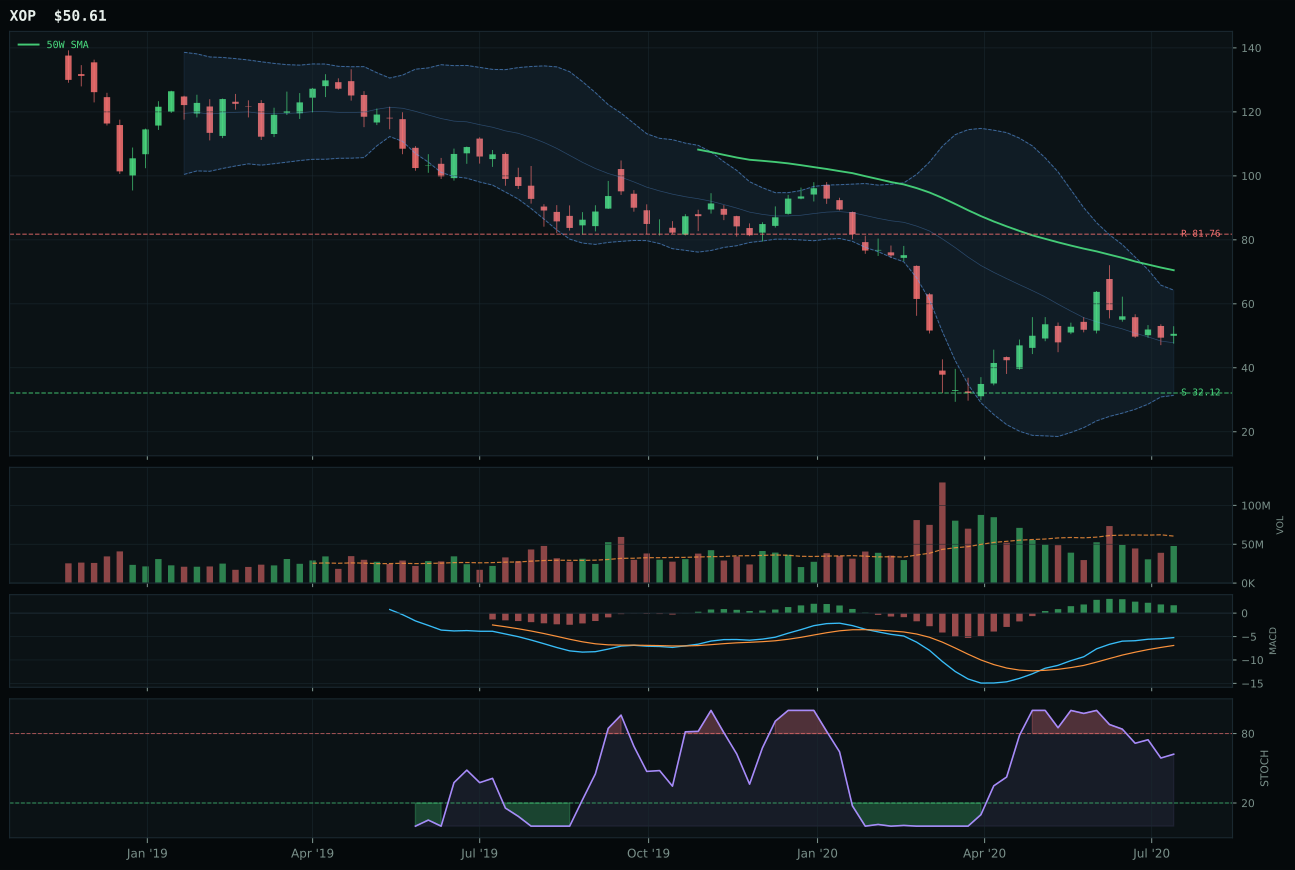
XOP has a neutral structure profile with 7.2% 13-week relative strength versus SPY.
Extension and support failure are the main tactical risks.
Tracked, but not top-2 eligible because: structurally broken.
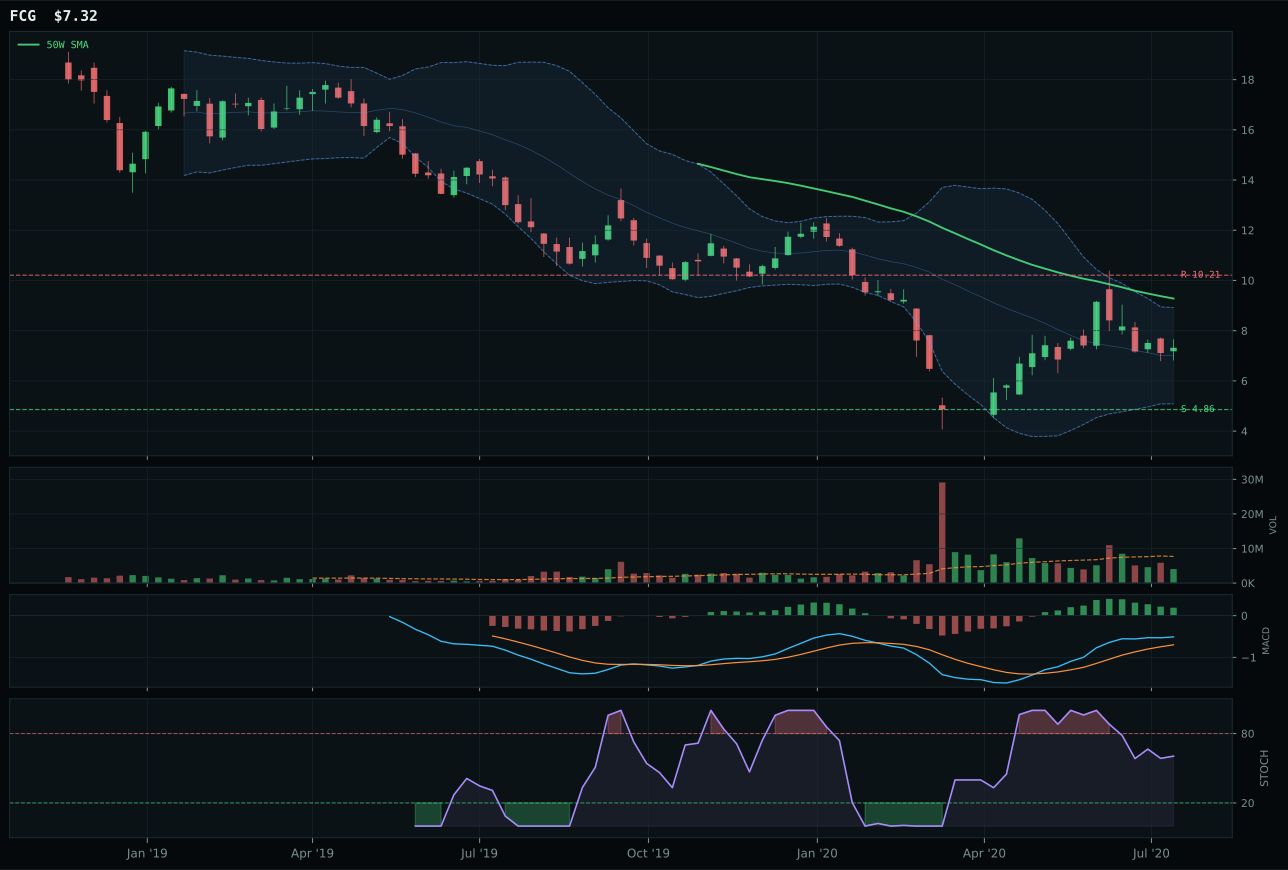
FCG has a neutral structure profile with 13.5% 13-week relative strength versus SPY.
Extension and support failure are the main tactical risks.
Tracked, but not top-2 eligible because: structurally broken.
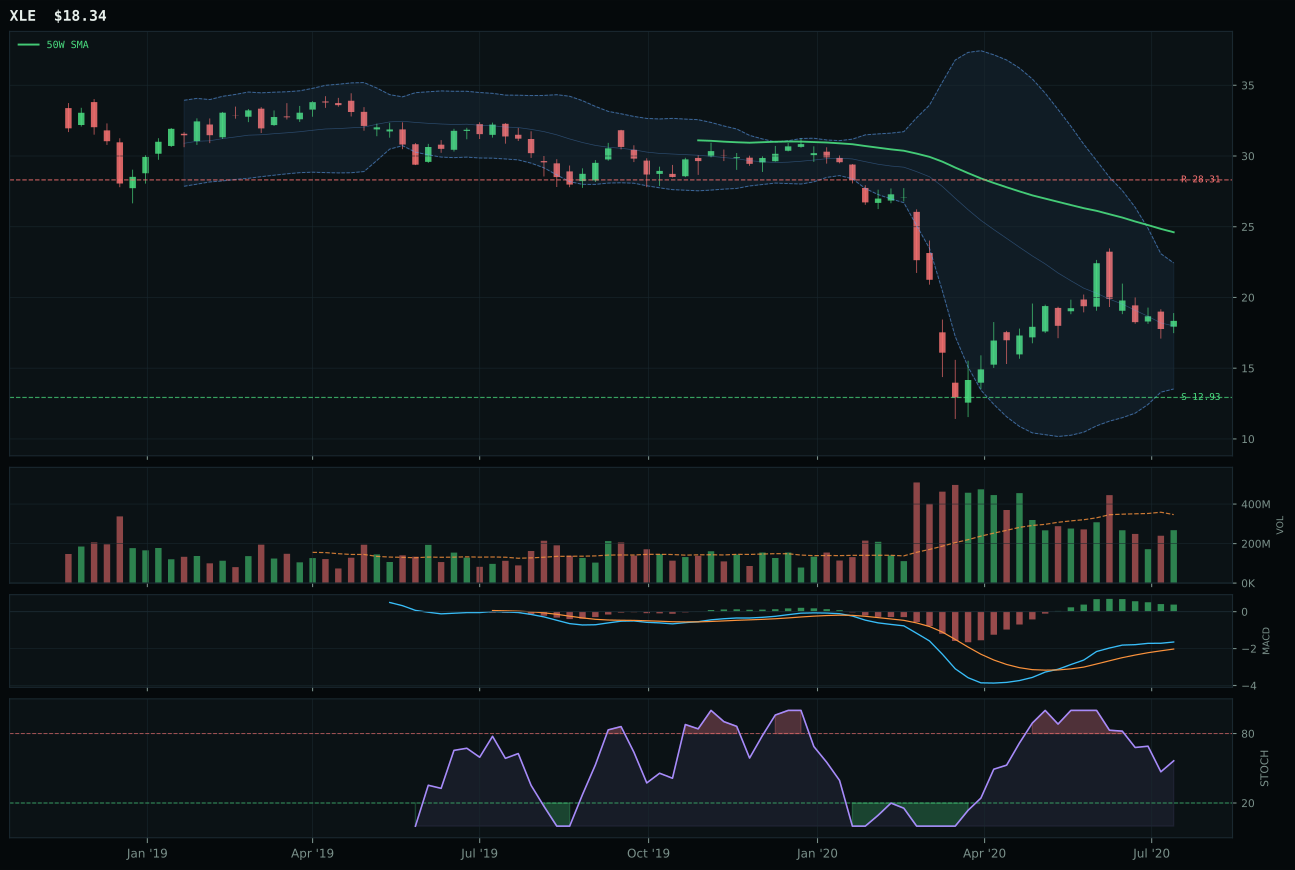
XLE has a neutral structure profile with -4.2% 13-week relative strength versus SPY.
Extension and support failure are the main tactical risks.
Tracked, but not top-2 eligible because: structurally broken.
XLE won a deeply broken category by default, with a score of 31.5 that would disqualify it in any other week. Price is 25.5% below the 50W and below the 200W, the 50W slope is deteriorating at -1.0%, and relative strength versus SPY is negative at -4.2%. This is a reset that has already occurred; the move down is complete. XOP posted stronger momentum (19.5% 13W versus 8.1% for XLE) and category-relative strength (0.0% versus -11.4%), yet XLE won because timing scored 50.0 while XOP's scored lower, and XLE's risk-reward at 45.1 beat XOP's 41.9. The structure is neutral but deteriorating; MACD is bullish but flattening, stochastic RSI is falling/neutral at 0.57, and Fib placement at 0.618 (deep value zone at 19.27) signals capitulation. Volume is neutral but offers no sponsorship. The momentum confirmation of 27.0 is the lowest in the entire portfolio, reflecting -7.3% 4W return and thin institutional appetite. This is a category that screamed sell at 28+ and is now whispering maybe after the flush.
Traditional Energy received zero allocation (0%) this week despite a 31.5 score because the category failed eligibility filters and ranked among the lowest two scores in the ten-category universe. The macro case for inflation pressure (+10) and late-cycle reflation (+12) would normally support energy, yet the technical deterioration is too severe to override: price below the 200W, MACD bullish but flattening, stochastic rolling over, and volume-price confirmation at 26.1 all indicate sellers are still in control. Even the macro/narrative fit of 65.0/100 cannot rescue this category when technical evidence sits at only 24.7/100—a 40-point gap that signals regime change rather than temporary pullback. To earn allocation, XLE would need to hold support at 12.93, climb back above the 50W with volume confirmation, and regenerate MACD momentum from oversold levels. Until then, energy remains a zero-weight hedge in a late-cycle reflation portfolio; the macro case is valid but the entry is too late to catch the move and too dangerous to hold into further deterioration.