
2020-07-10
Informational purposes only. The content in this report, including allocations, analysis, and commentary, is provided solely for informational and educational purposes. It does not constitute financial advice, investment advice, trading advice, or any other type of advice. Past performance does not guarantee future results. Always conduct your own research and consult a qualified financial professional before making investment decisions.
Some tracked tickers were excluded due to missing live weekly price data: SGOV: Historical cache SGOV has only 6 usable weekly bars; URNM: Historical cache URNM has only 32 usable weekly bars
Weekly Allocation
| Ticker | Category | Weight | Role |
|---|---|---|---|
| SLV | Precious Metals | 20% | Top-2 (20%) |
| SMH | AI | 20% | Top-2 (20%) |
| IGV | Technology | 10% | Tier-2 (10%) |
| XLU | Utilities & Infrastructure | 10% | Tier-2 (10%) |
| XAR | Defense & Aerospace | 10% | Tier-2 (10%) |
| MOO | Agriculture & Livestock | 10% | Tier-2 (10%) |
| COPX | Industrial Metals | 10% | Tier-2 (10%) |
| URA | Nuclear Energy | 10% | Tier-2 (10%) |
Trade Instructions — Monday Open
Sell the tranche from 2020-06-12 (completing its 4-week hold). Buy the new tranche. Instructions show net portfolio changes — same-asset positions cancel, weight changes show the delta.
| Action | Ticker | Instruction |
|---|---|---|
| SELL | XLK | Sell entire XLK position (5.00% of portfolio) |
| SELL | ITA | Sell 33% of ITA position (reduce 7.50% → 5.00%) |
| SELL | PAVE | Sell 50% of PAVE position (reduce 5.00% → 2.50%) |
| SELL | FCG | Sell entire FCG position (2.50% of portfolio) |
| BUY | SLV | Buy SLV — 20.00% of freed cash (adds 2.50% to portfolio) |
| BUY | IGV | Buy IGV — 20.00% of freed cash (adds 2.50% to portfolio) |
| BUY | XLU | Buy XLU — 20.00% of freed cash (adds 2.50% to portfolio) |
| BUY | COPX | Buy COPX — 20.00% of freed cash (adds 2.50% to portfolio) |
| BUY | XAR | Buy XAR — 20.00% of freed cash (adds 2.50% to portfolio) |
Current Portfolio After Trade
Combined holdings across all 4 active tranches. Each tranche is 25% of the portfolio.
| Ticker | % of Portfolio | Weight Bar |
|---|---|---|
| IGV | 17.50% | |
| SMH | 15.00% | |
| SLV | 10.00% | |
| URA | 7.50% | |
| XLU | 7.50% | |
| XLE | 7.50% | |
| GLD | 7.50% | |
| COPX | 7.50% | |
| ITA | 5.00% | |
| MOO | 5.00% | |
| XAR | 5.00% | |
| PAVE | 2.50% | |
| NLR | 2.50% |
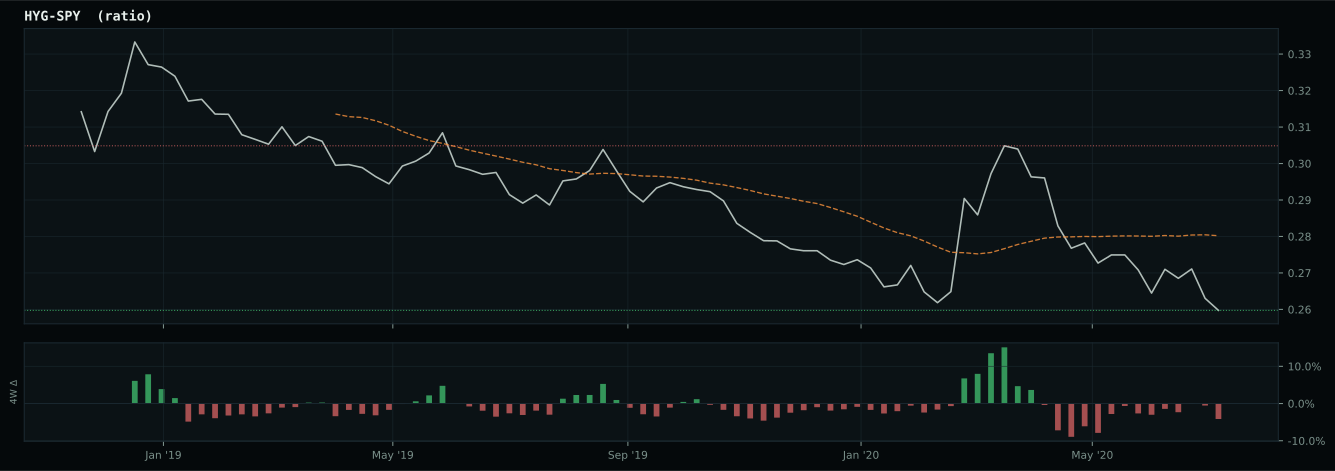
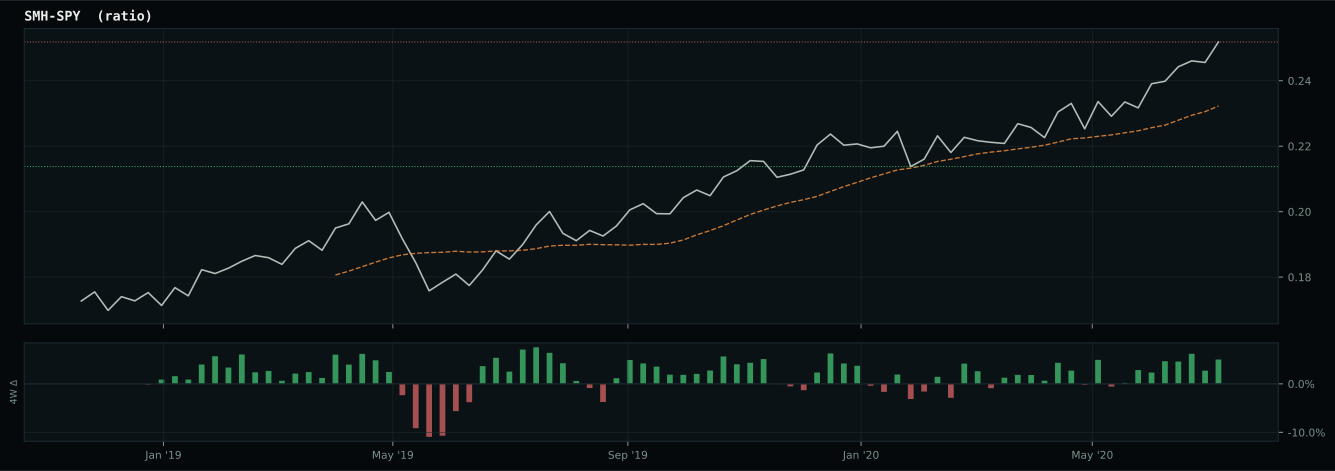
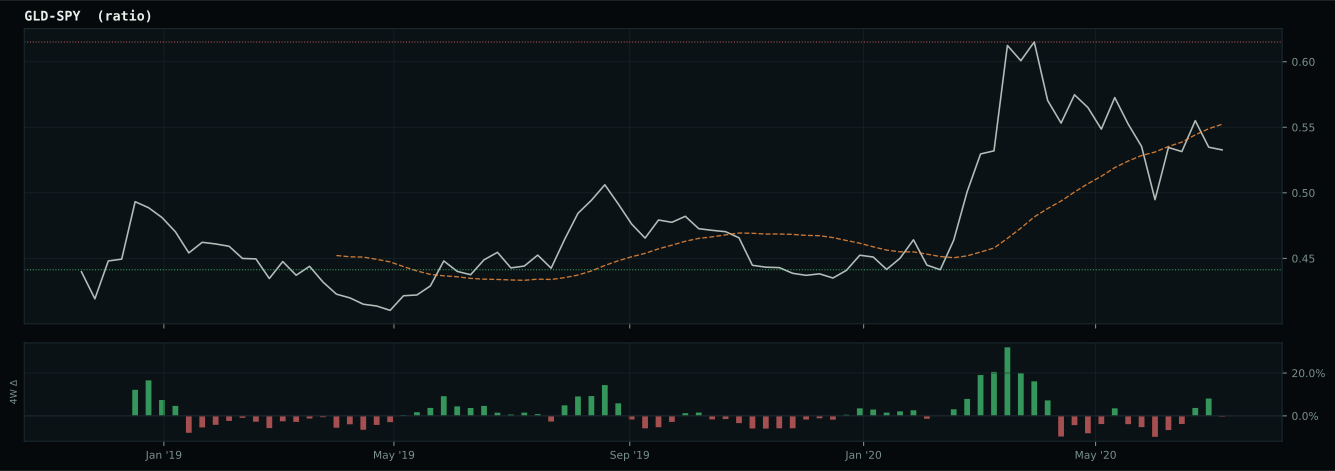
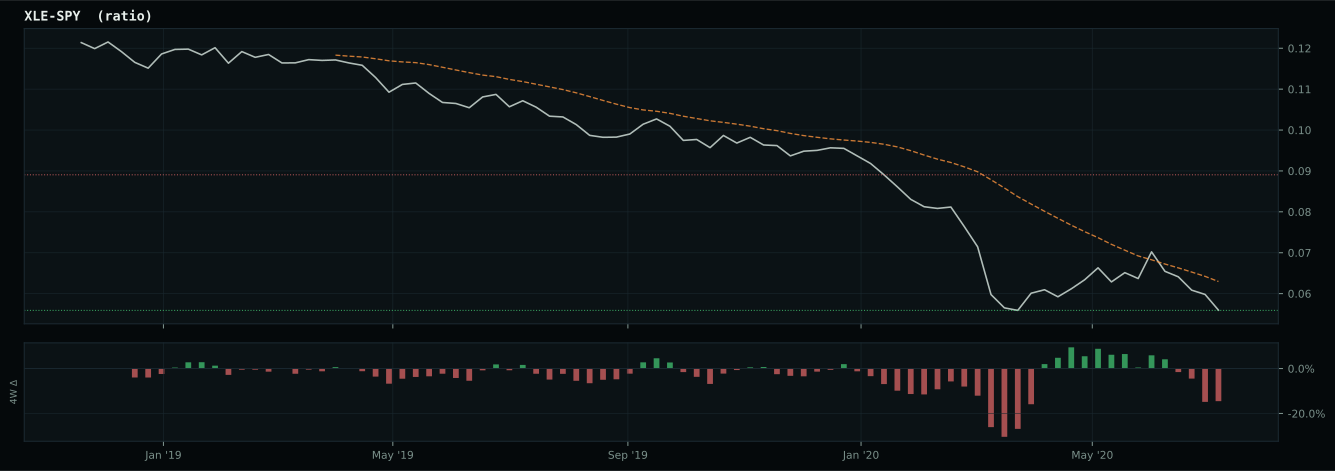
Macro Regime — Risk-Off Deterioration
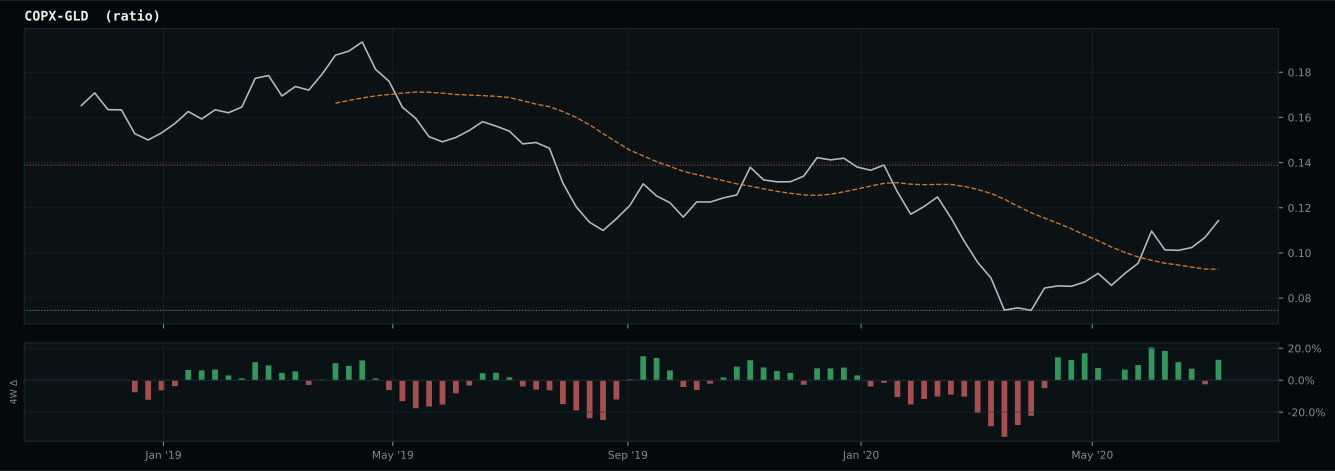
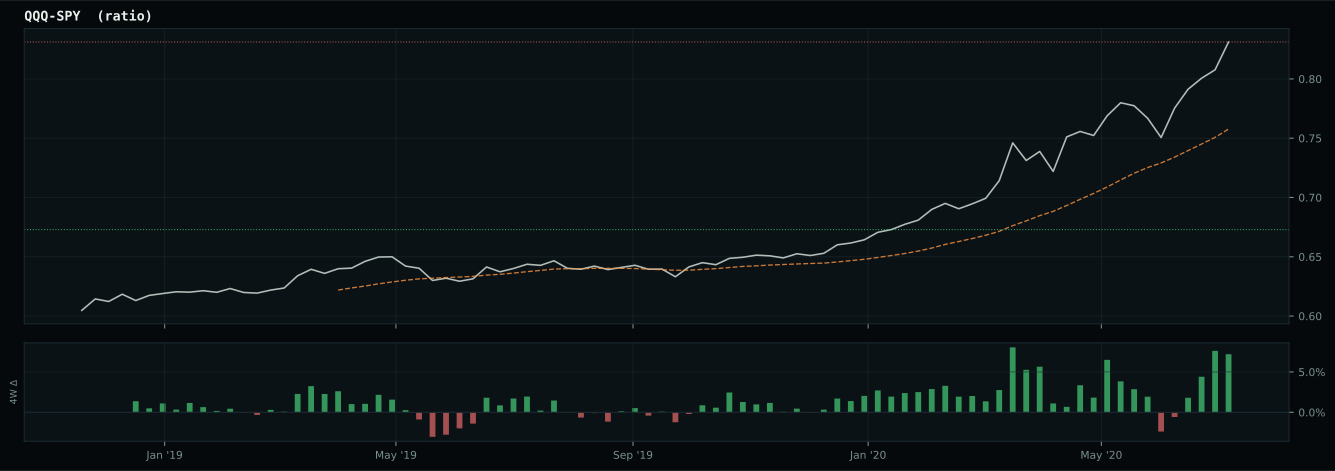
inflation-sensitive ratios are firm but broad commodity participation is weak
Macro Evidence Charts
Market-implied signals behind the macro regime scores. Each ratio compares two assets; the direction and slope of the ratio is what the macro engine reads.
Crypto Regime — NoCrypto
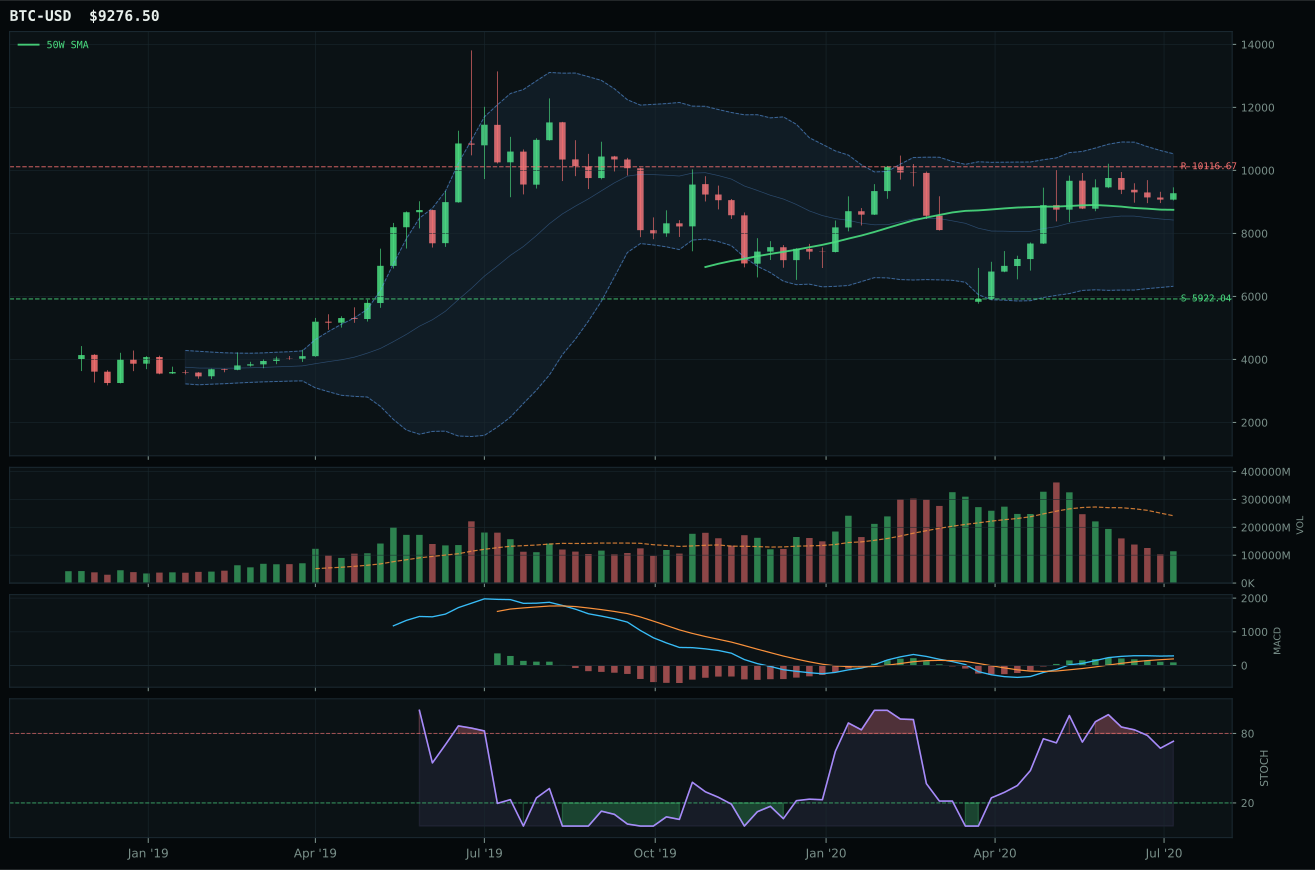
post-touch structure is too wide to count as a range; max/min close ratio is 1.81
TrendBTC not confirmed
one or more available conditions failed

Category Rankings
| Rank | Category | Winner | Score | Alloc | 4W Ret | Peers (4W) |
|---|---|---|---|---|---|---|
| 1 | Precious Metals | SLV | 59.5 | 20% | +47.80% | GDX +10.7% · GLD +12.3% |
| 2 | AI | SMH | 51.8 | 20% | +4.72% | BOTZ +5.5% · AIQ +1.7% |
| 3 | Technology | IGV | 44.9 | 10% | -1.22% | CIBR +0.9% · XLK +4.6% |
| 4 | Utilities & Infrastructure | XLU | 42.0 | 10% | +6.79% | PAVE +12.6% · IGF +5.2% |
| 5 | Defense & Aerospace | XAR | 38.5 | 10% | +7.73% | ITA +4.4% · ROKT +10.0% |
| 6 | Agriculture & Livestock | MOO | 32.9 | 10% | +7.83% | WEAT -6.1% · VEGI +8.4% |
| 7 | Industrial Metals | COPX | 32.3 | 10% | +5.56% | REMX +7.4% · PICK +6.6% |
| 8 | Nuclear Energy | URA | 29.8 | 10% | +4.55% | NLR +3.6% |
| 9 | Traditional Energy | XLE | 22.7 | 0% | +4.43% | FCG +13.2% · XOP +9.0% |
| 10 | Emerging Markets | IEMG | 14.3 | 0% | +1.43% | INDA +6.4% · ILF +1.6% |
Precious Metals — SLV
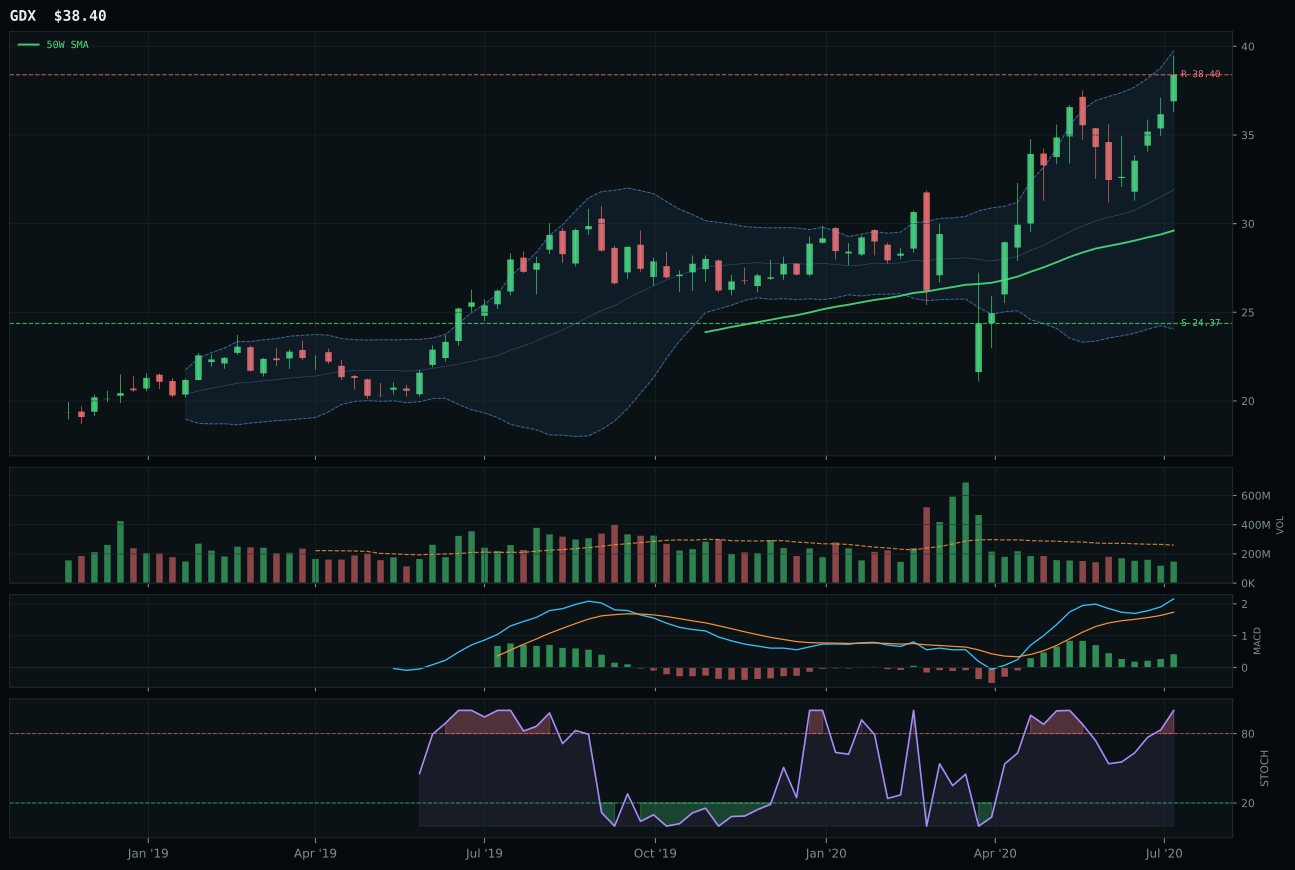
GDX has a vertical extension profile with 18.5% 13-week relative strength versus SPY.
A failed hold above support would weaken the setup.
Actionable but governed by invalidation levels.
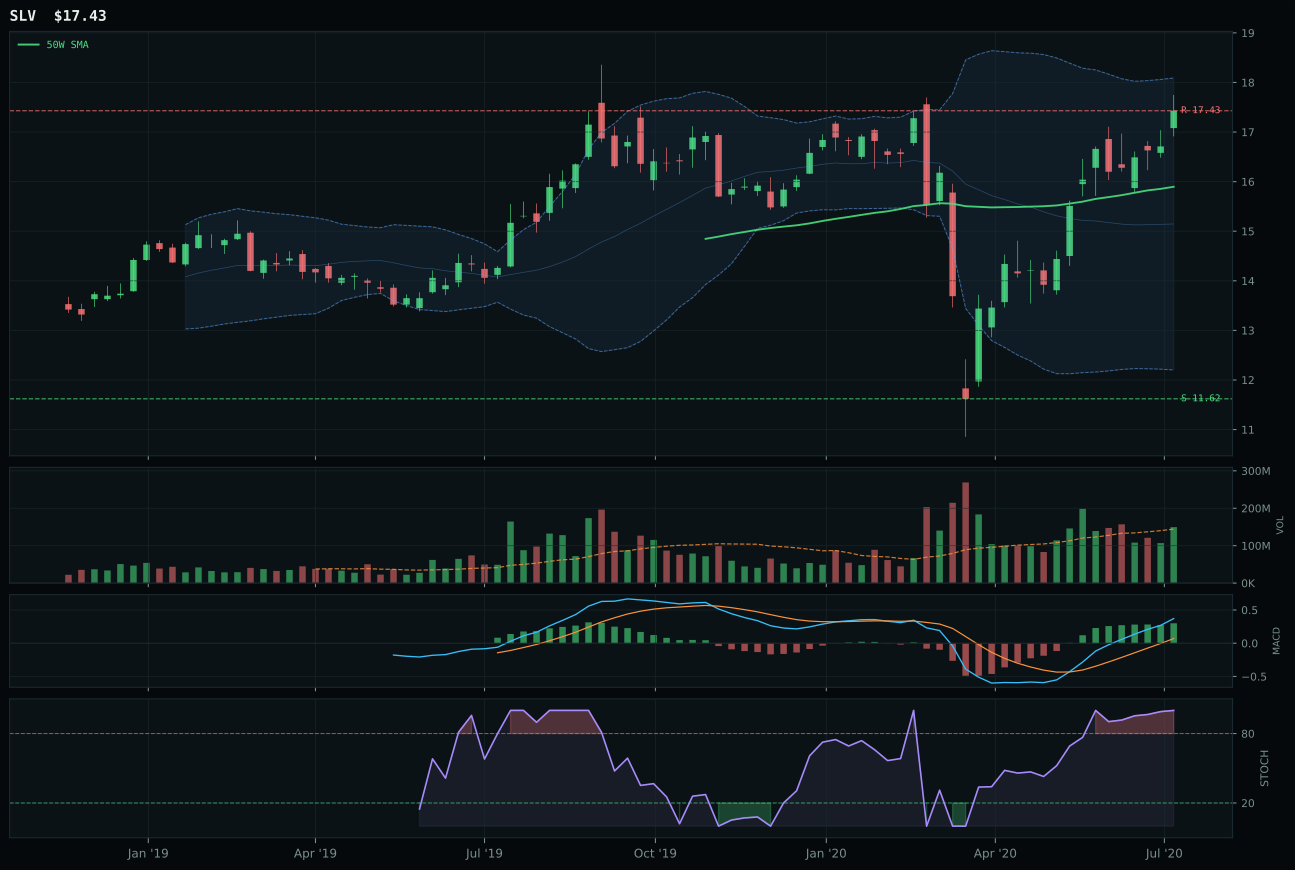
SLV has a neutral structure profile with 7.4% 13-week relative strength versus SPY.
A failed hold above support would weaken the setup.
Actionable but governed by invalidation levels.
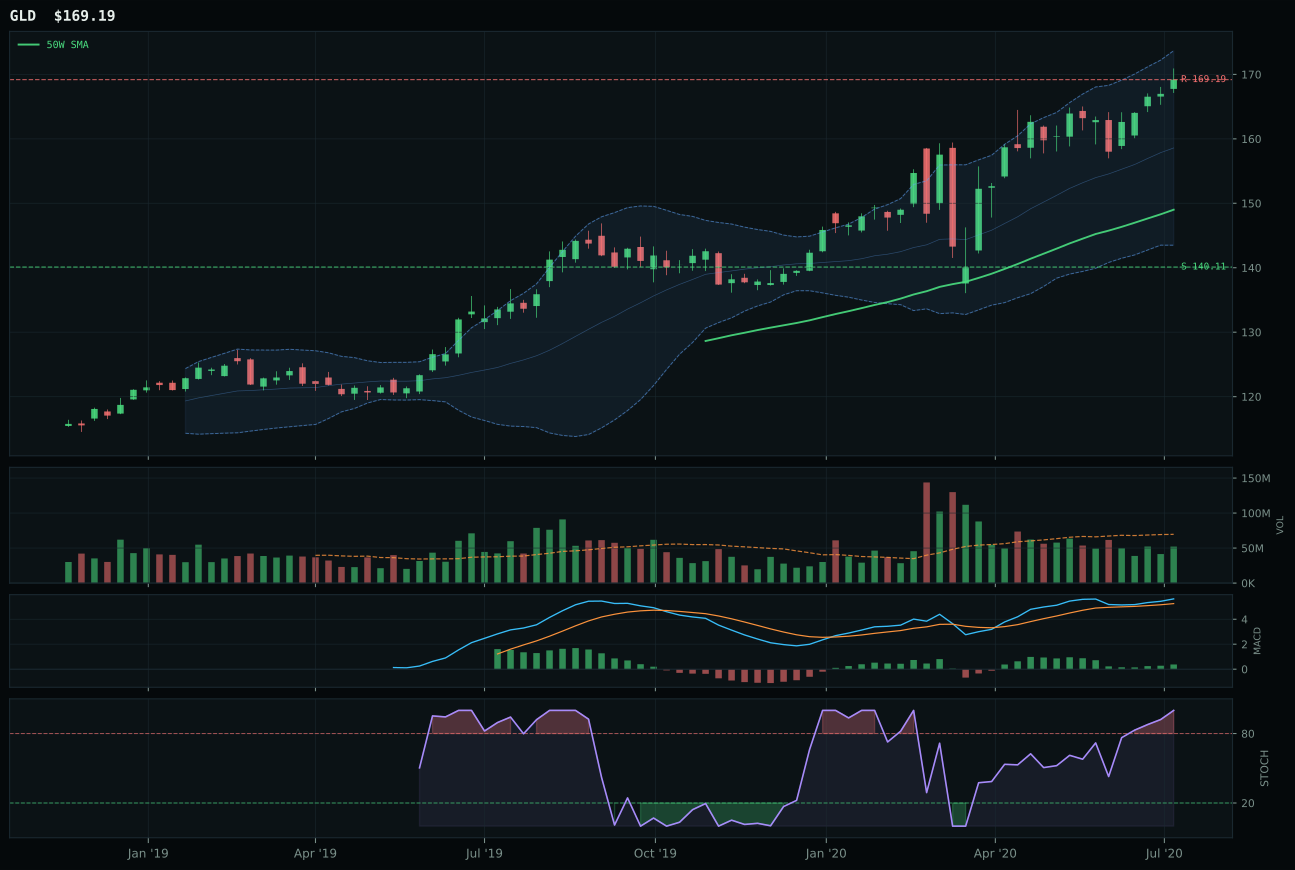
GLD has a neutral structure profile with -7.5% 13-week relative strength versus SPY.
A failed hold above support would weaken the setup.
Actionable but governed by invalidation levels.
SLV dominated precious metals with an 85.2/100 technical score and superior timing versus GDX, the second-ranked ETF at 58.4 technical and 38.0 macro fit. GDX's 32.6% thirteen-week return demolished SLV's 21.5%, but GDX sits 31.3% extended above the 50-week moving average—a vertical extension that compressed timing from 75 down to 37 points. SLV trades only 9.6% above the 50-week average with cleaner structure (80.5 versus 70.0), better risk-reward (47.9 versus 23.4), and superior volume-price confirmation (78.4 versus 72 for GDX). Both carry bullish, improving MACD and overbought stochastics in upper-retracement zones, but SLV's neutral volume participation (1.04x) beats GDX's thin participation at every margin of accumulation. The 22.1-point category score separation reflects how badly GDX's extension compressed its scoring despite superior absolute returns.
Precious metals earned the second 20% allocation because the category score of 59.5 places it among the portfolio's top two opportunities, driven by genuine risk-off macro support and the critical combination of trend + momentum + timing discipline. Risk-off deterioration adds +8 points at the category level, a direct tailwind from rising uncertainty and credit stress (+2 active). Metals scarcity (+7) and inflation pressure (+5) provide secondary sponsorship that distinguishes this category from growth-dependent exposures. SLV's 100/100 trend score and 100/100 momentum confirmation prove the setup is not a fading rip—thirteen-week return of 21.5%, four-week return of 7.1%, and MACD bullish-and-improving confirm sustained accumulation. Drawdown risk exists at 50% to support, and SLV carries zero upside to resistance, but the portfolio's bias toward risk-off protection during deteriorating regimes makes this the correct top-2 pairing with SMH. SLV loses allocation only if risk appetite reactivates while liquidity stress deactivates; the setup is otherwise self-sustaining through its macro descriptors.
AI — SMH
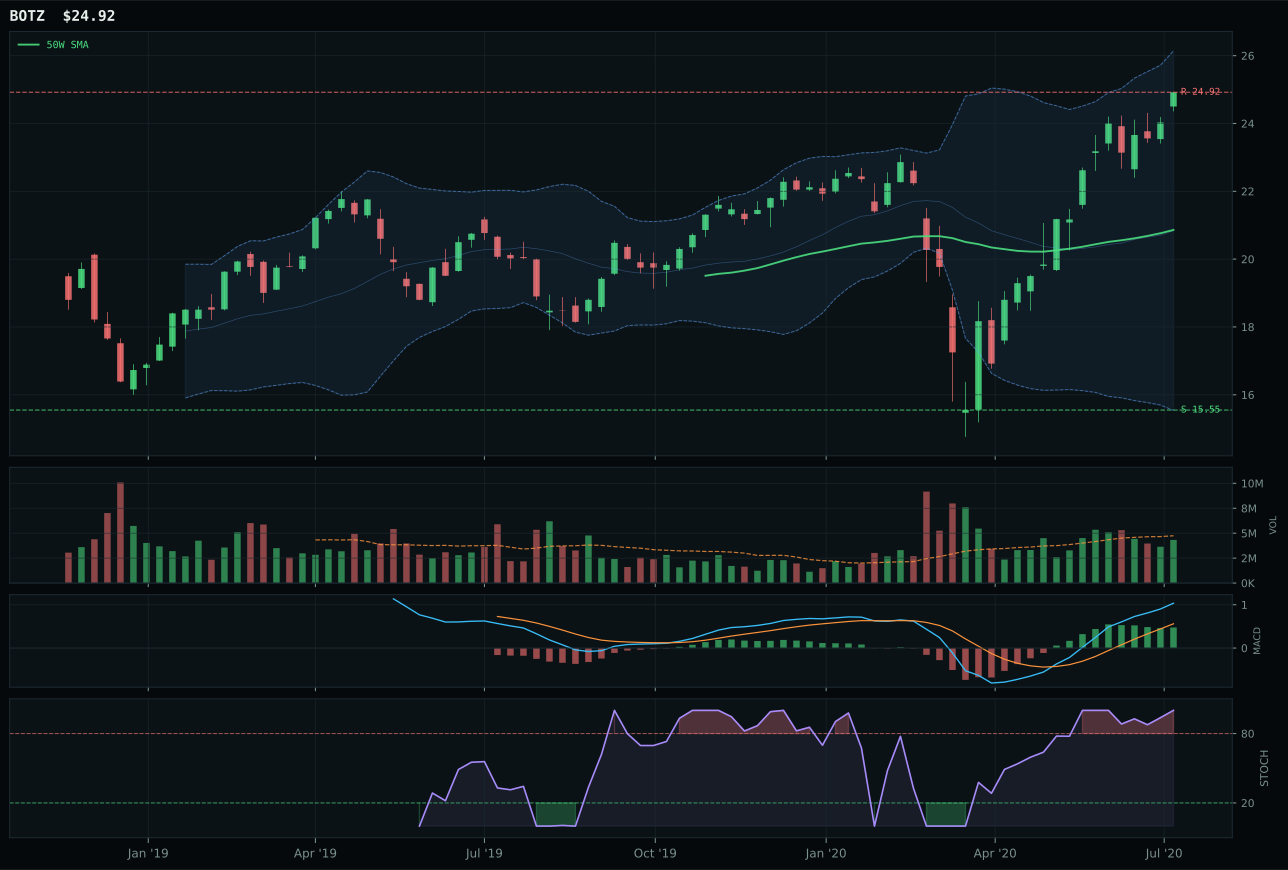
BOTZ has a vertical extension profile with 18.4% 13-week relative strength versus SPY.
A failed hold above support would weaken the setup.
Actionable but governed by invalidation levels.
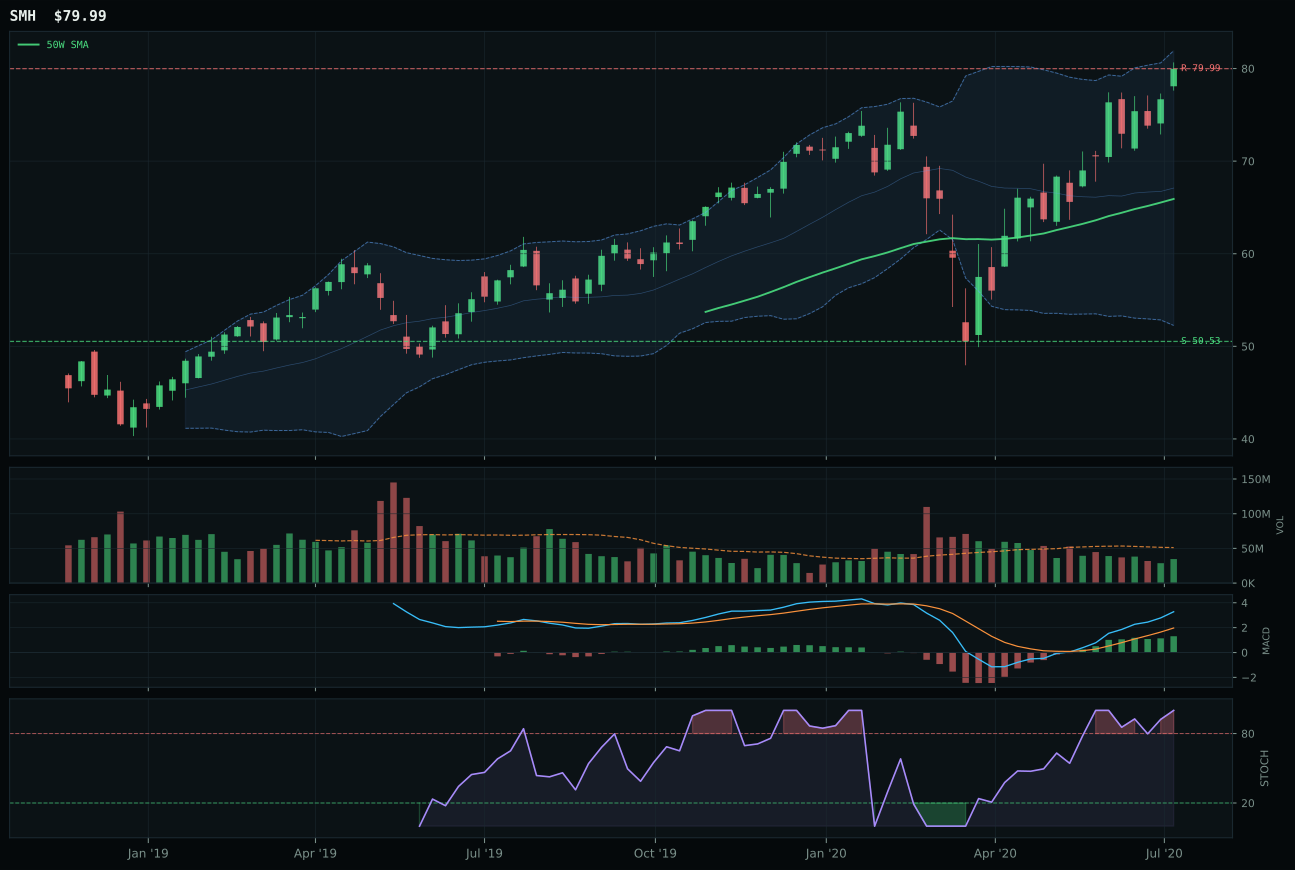
SMH has a vertical extension profile with 15.0% 13-week relative strength versus SPY.
A failed hold above support would weaken the setup.
Actionable but governed by invalidation levels.
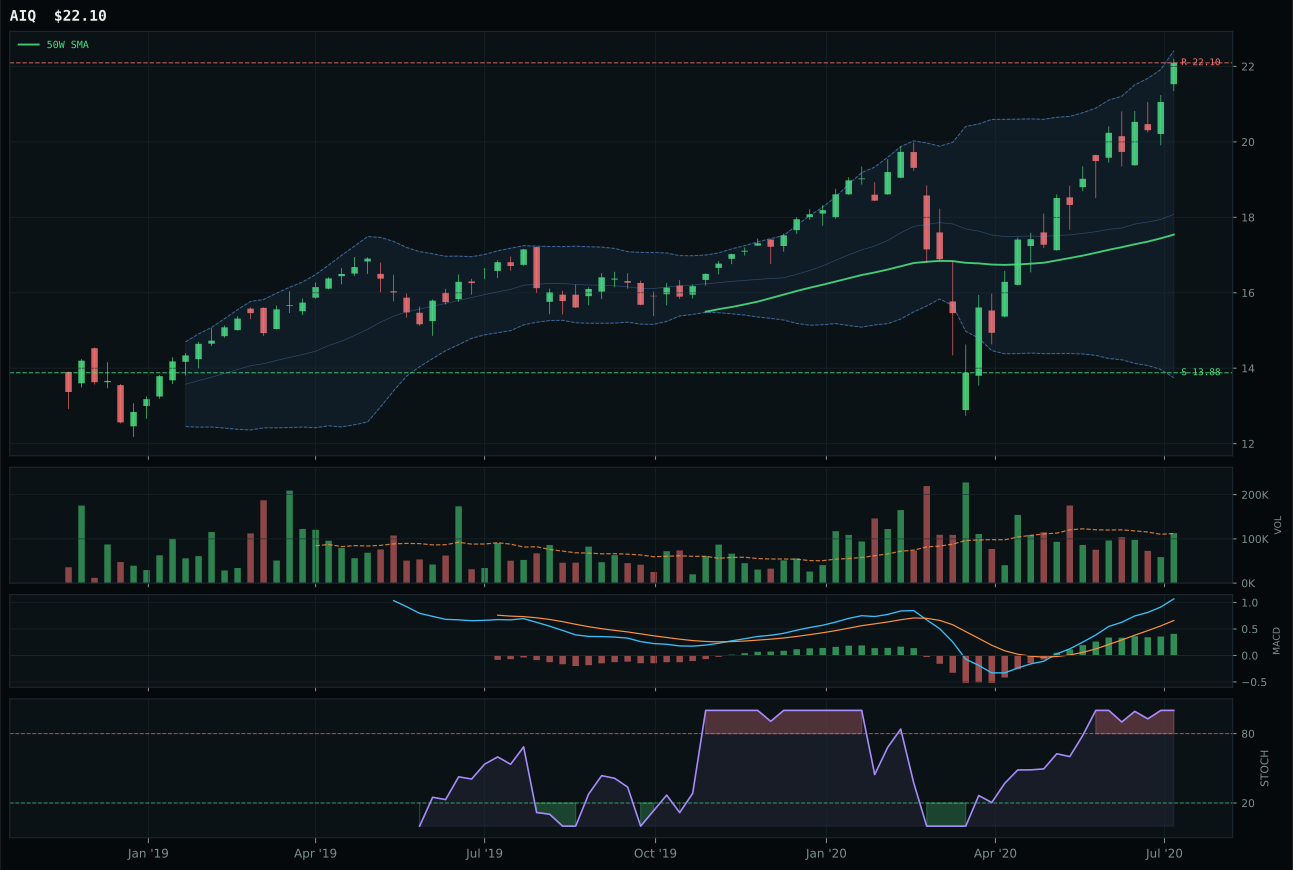
AIQ has a vertical extension profile with 21.5% 13-week relative strength versus SPY.
A failed hold above support would weaken the setup.
Tracked, but not top-2 eligible because: .
SMH won the AI category with a 58.0/100 macro fit score and cleaner timing confirmation than BOTZ, despite trailing on absolute thirteen-week return. BOTZ posted 32.6% thirteen-week gain versus SMH's 29.1%, but BOTZ's MACD is bullish but flattening—a momentum divergence that weakened its timing score to 32 versus SMH's 37. Semiconductor compute infrastructure attracted AI growth sponsorship scoring +14 at the ETF level, the highest in the basket, and BOTZ's mechanical robotics exposure carried only +5. Both sit extended 21-31% above their 50-week averages in overbought territory, but SMH's improving MACD (versus flattening) and neutral volume participation proved superior to BOTZ's deteriorating MACD with neutral volume. The 3.7-point category score gap reflects cleaner momentum trajectory, not better returns.
SMH secured the 20% top-2 allocation because AI ranked second among all ten categories at 51.8 points, driven by legitimate macro sponsorship that outweighs timing risk. The AI growth sponsorship descriptor adds +14 to category-level macro fit while risk-off deterioration detracts only -10, creating a net +4 macro tailwind that separates this exposure from weaker categories. SMH's persistence score of 70.5 confirms the move isn't a daytrading bounce—volume-price sponsorship at 65.2 proves institutional participation despite thin 0.68x volume. The risk exists: price sits near 52-week highs with zero upside to resistance and 58.3% downside to support. However, the portfolio's dual objective of harvesting AI momentum while managing drawdown risk makes SMH's +15% SPY outperformance worth the extended entry, particularly when the macro regime explicitly activates AI growth as a live descriptor. This position loses allocation priority only if BOTZ's MACD inflects higher or liquidity stress tightens further.
Technology — IGV
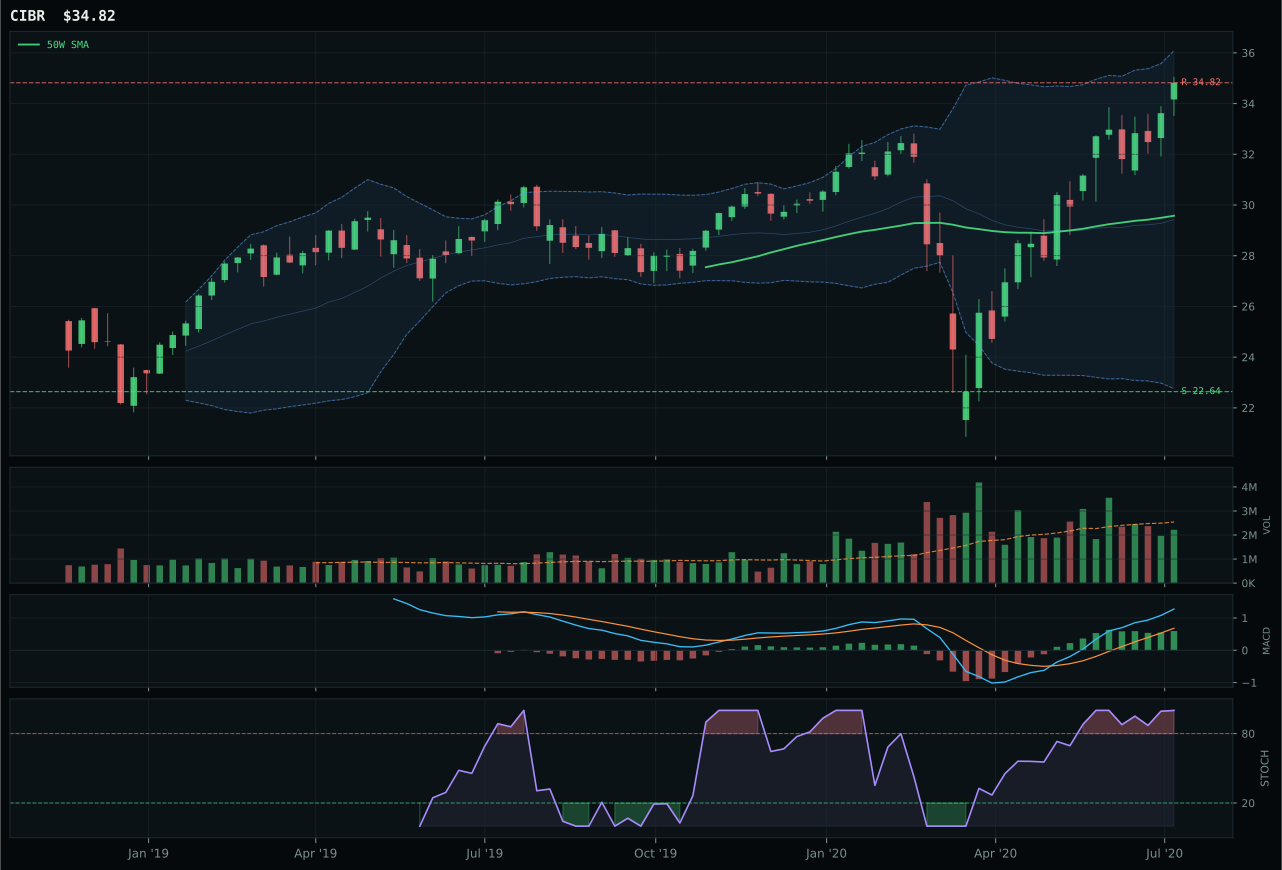
CIBR has a vertical extension profile with 15.0% 13-week relative strength versus SPY.
A failed hold above support would weaken the setup.
Actionable but governed by invalidation levels.
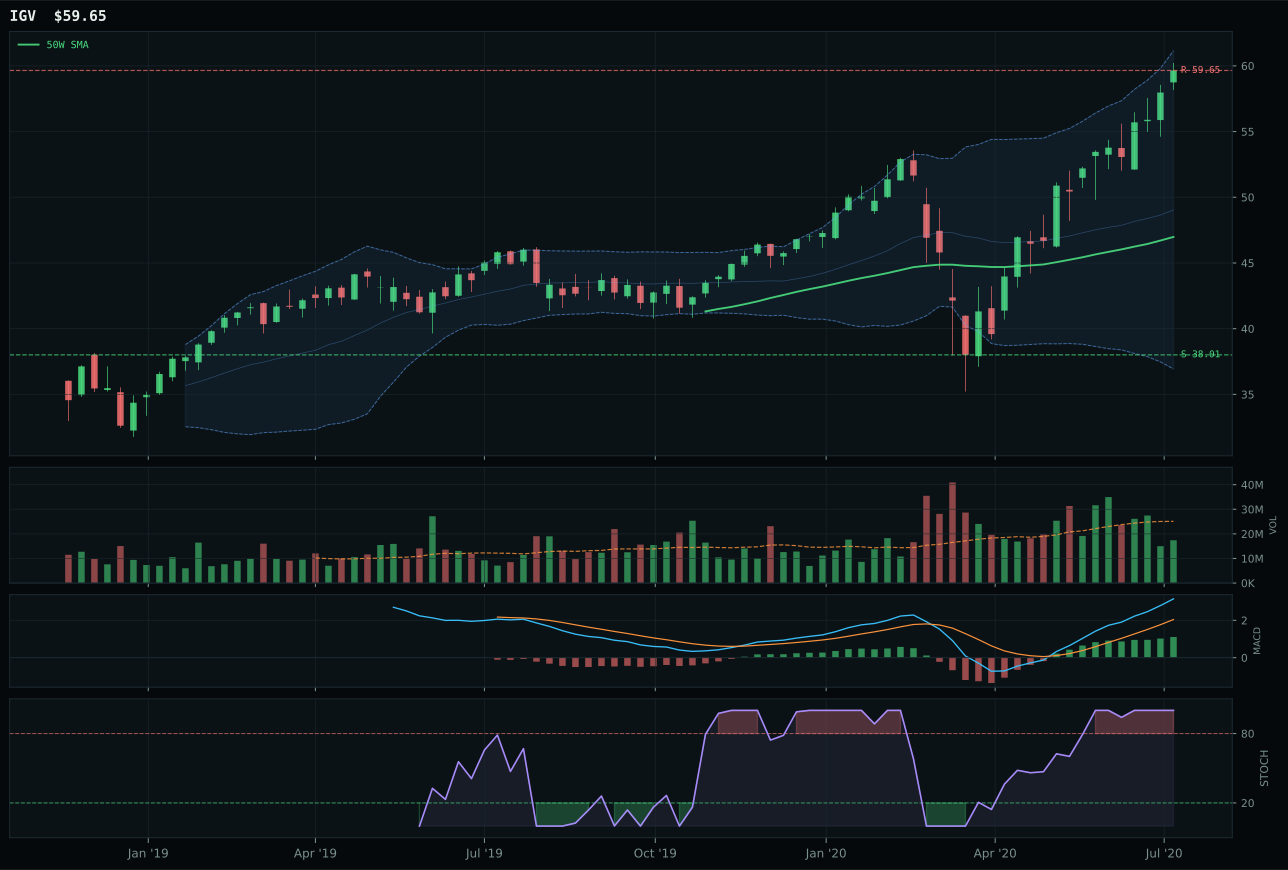
IGV has a vertical extension profile with 21.5% 13-week relative strength versus SPY.
A failed hold above support would weaken the setup.
Actionable but governed by invalidation levels.
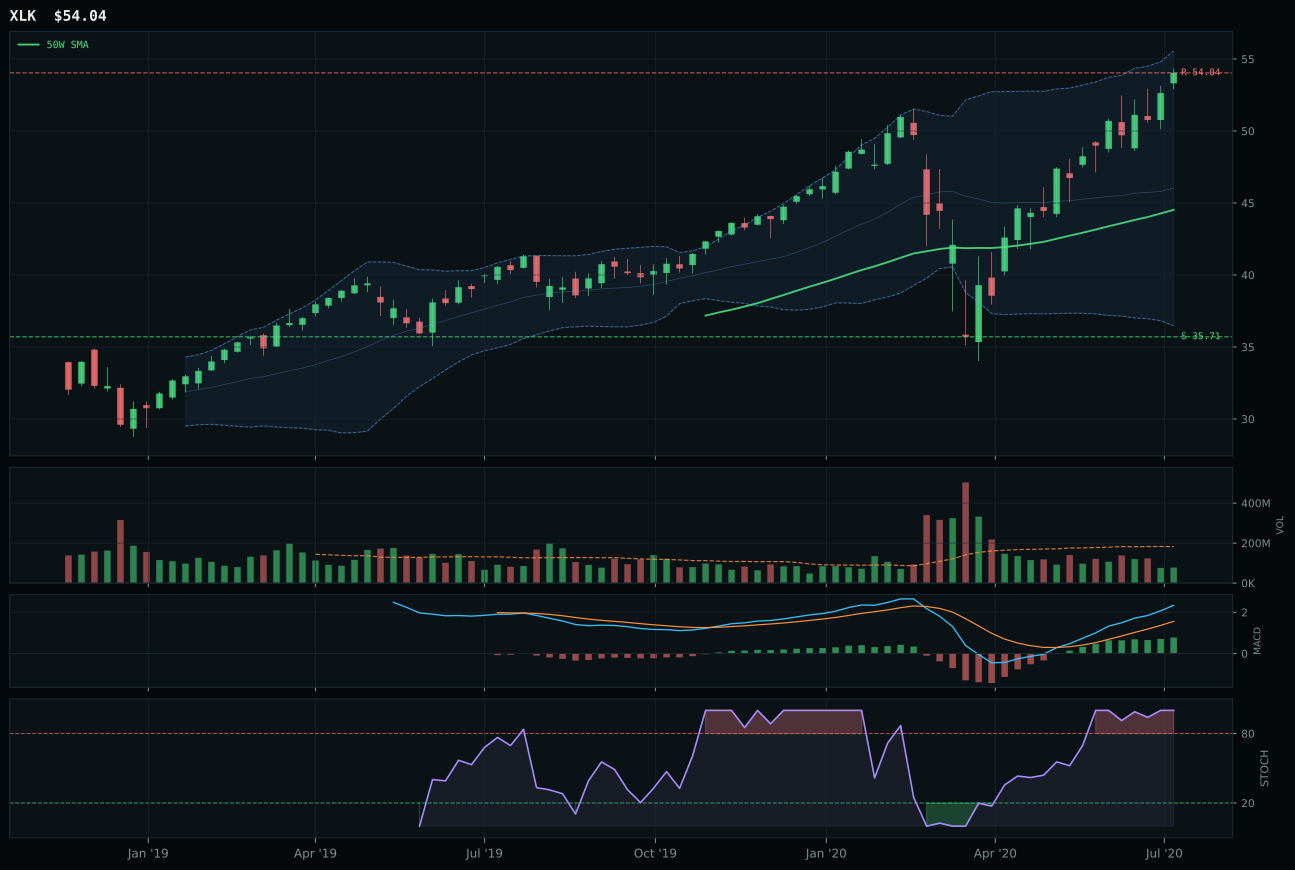
XLK has a vertical extension profile with 12.7% 13-week relative strength versus SPY.
A failed hold above support would weaken the setup.
Actionable but governed by invalidation levels.
IGV captured the category by combining superior relative strength within its peer set with cleaner structural confirmation than CIBR. The 6.4% category-relative strength advantage and 21.5% SPY outperformance signaled that enterprise software was attracting fresh capital despite the extended 27% stretch above the 50-week moving average. CIBR's cybersecurity positioning carried only 0% category-relative strength and 15% SPY outperformance, rendering it a weaker expression of technology rotation. Both charts sit in near-52-week-high extension with bullish MACD and overbought stochastics, but IGV's volume-price confirmation scored 70.8 versus CIBR's 74, masking the critical difference: cleanliness favored IGV at 75 versus 72.3. The structure gap of 3.2 points on cleanliness is the technical fingerprint of accumulation quality.
Technology earned a 10% sleeve despite a 44.9 category score because the macro regime punishes extended valuations and the setup lacks the confirmation needed for top-2 ranking. Risk-off deterioration and active liquidity stress weigh -18 points at the category level, while AI growth sponsorship adds only +6, creating a net drag that pushes the entire category below the threshold for larger allocation. IGV's 35.6% thirteen-week return and 100/100 momentum score are genuine, but they arrived in an environment where every new buyer is late to the entry, with resistance sitting only 0% above current price and support 56.9% below. The portfolio holds this position because the alternative—abandoning software entirely—violates the systematic architecture during a period when risk appetite remains statistically active despite headline deterioration. If liquidity stress deactivates or the 50-week moving average slope inflects positive, IGV moves into consideration for elevation.
Utilities & Infrastructure — XLU
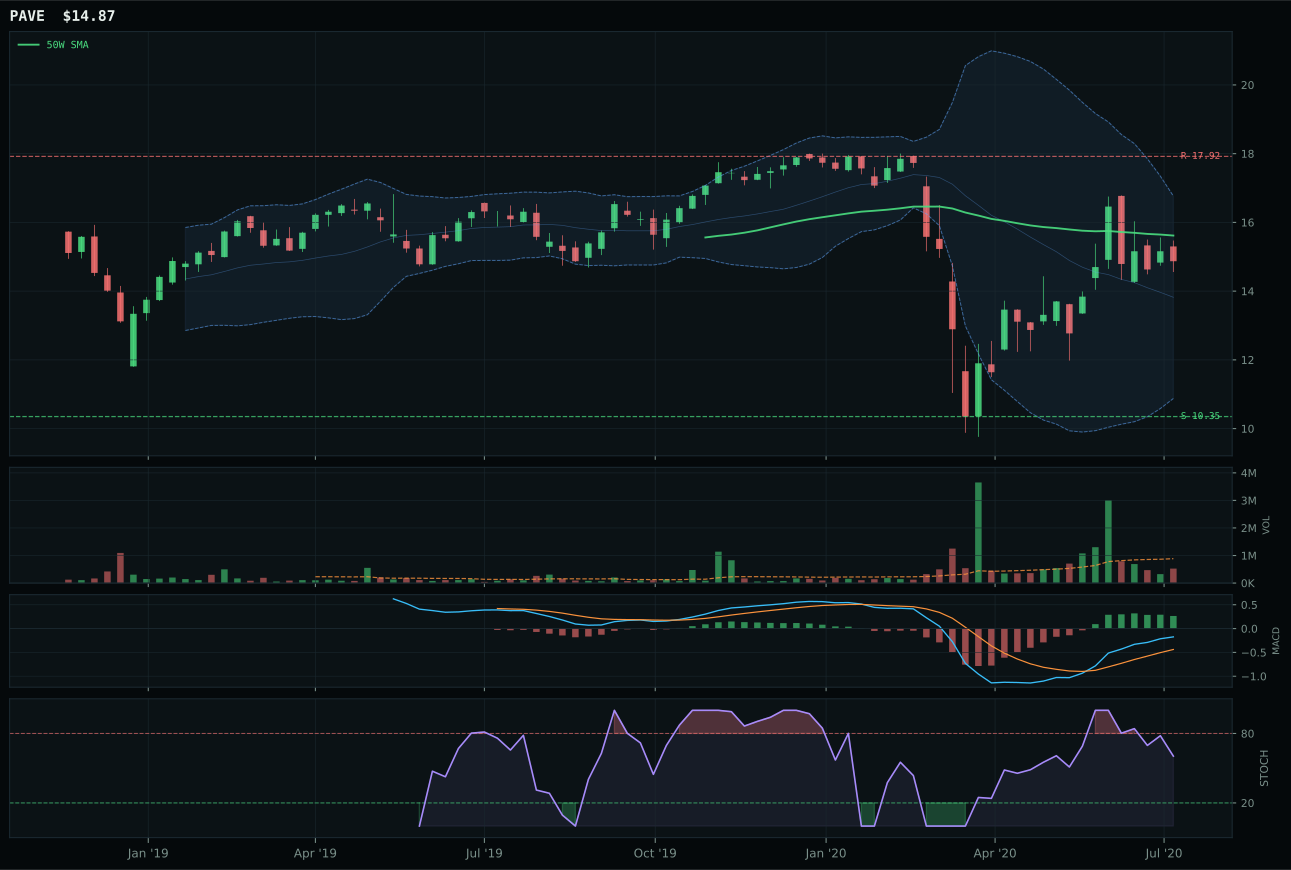
PAVE has a neutral structure profile with -3.7% 13-week relative strength versus SPY.
A failed hold above support would weaken the setup.
Actionable but governed by invalidation levels.
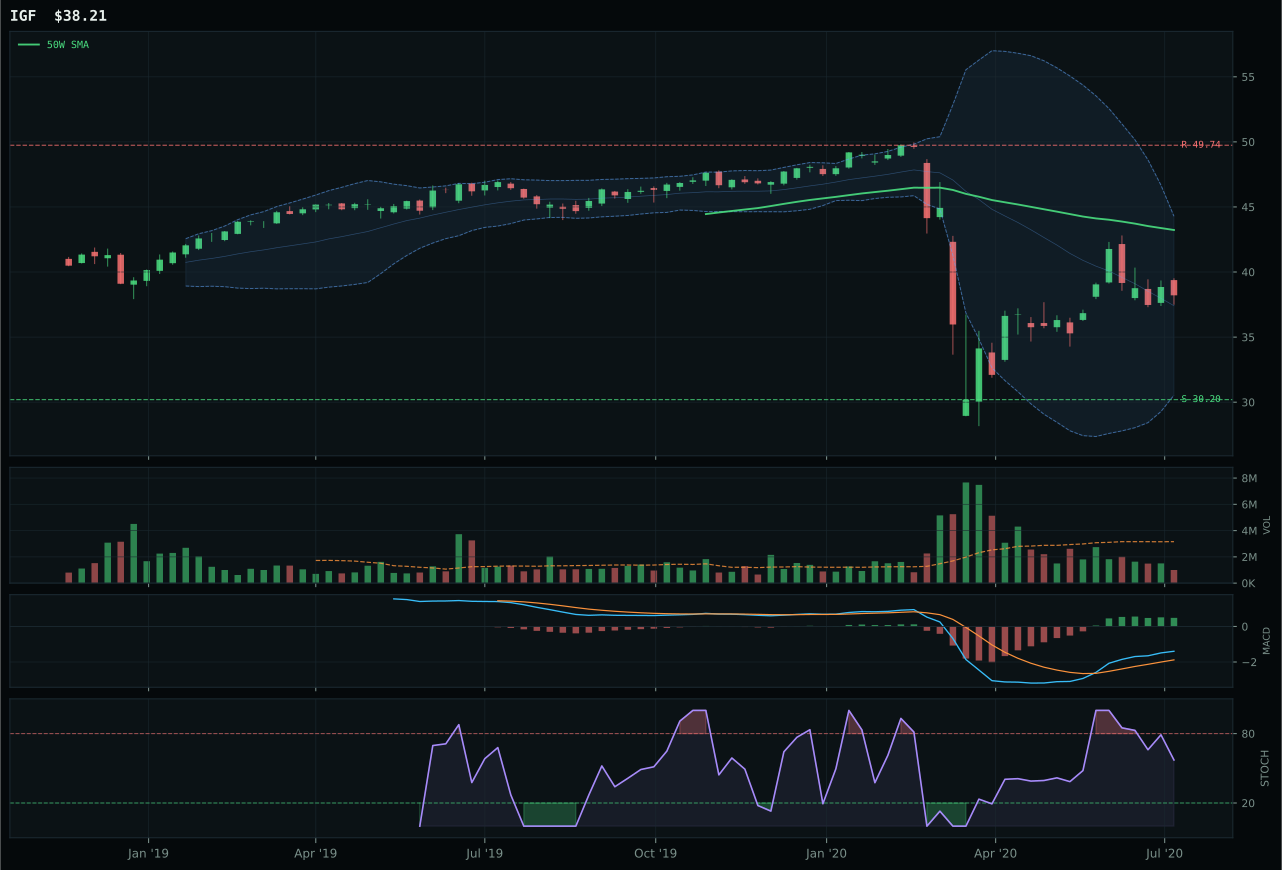
IGF has a neutral structure profile with -9.8% 13-week relative strength versus SPY.
A failed hold above support would weaken the setup.
Actionable but governed by invalidation levels.
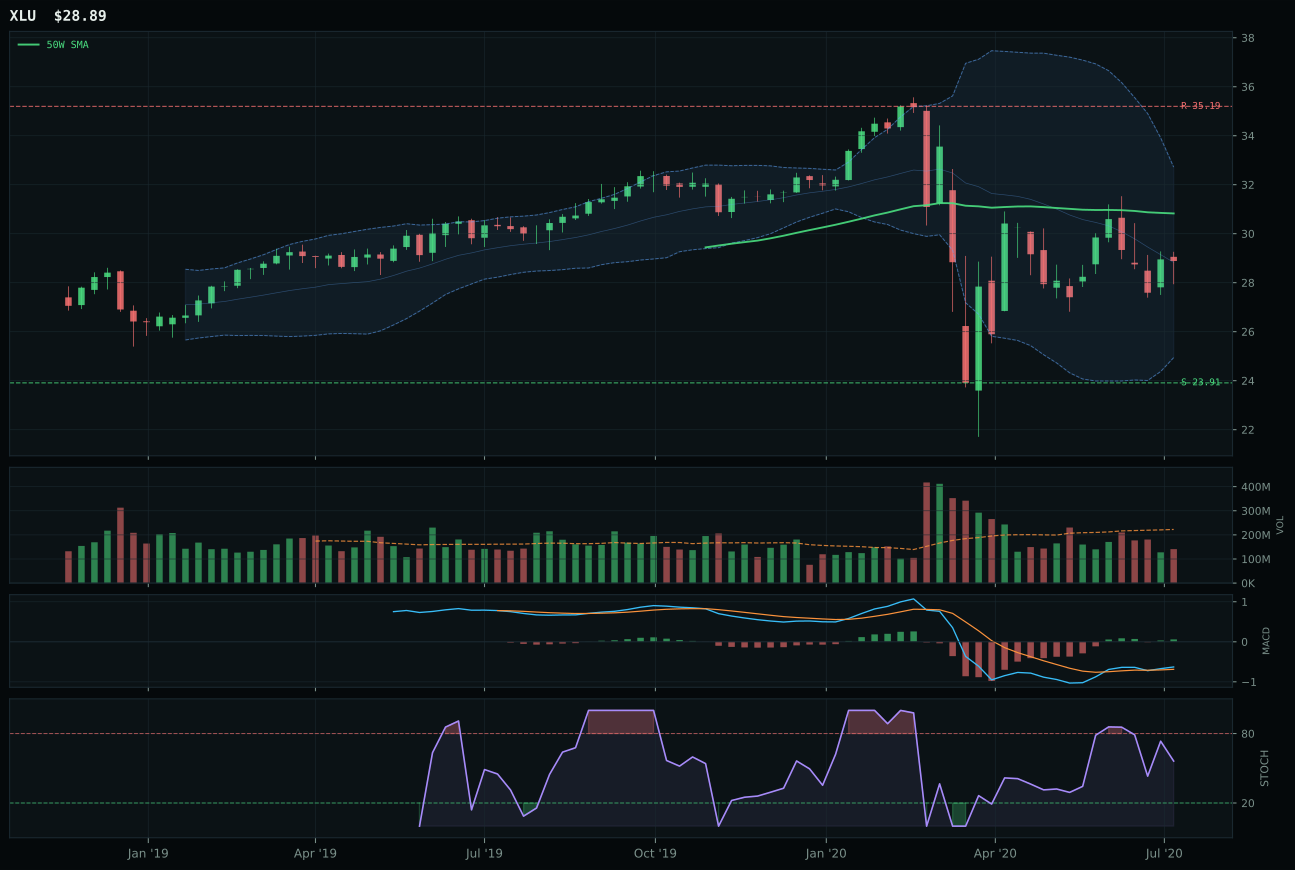
XLU has a neutral structure profile with -19.2% 13-week relative strength versus SPY.
A failed hold above support would weaken the setup.
Actionable but governed by invalidation levels.
XLU won utilities by eliminating downside risk through superior risk-reward (68.5 versus PAVE's 37.0), despite trailing on absolute return and carrying zero momentum confirmation. PAVE scored 55.4 technical evidence versus XLU's 16.8, but PAVE's 13W return of 10.5% and -3.7% SPY relative strength mask deteriorating four-week momentum (-1.5%) and weak category-relative strength. XLU sits -6.3% from the 50-week moving average in middle-retracement territory (Fib 0.500) with 68.5% risk-reward ratio offering 20.8% downside to support against 17.9% upside to resistance. PAVE's upper-retracement placement created tighter downside (10.3% to support) and tighter upside (5.6% to resistance). XLU's -5.0% thirteen-week return and -19.2% SPY underperformance signal utilities are losing leadership, but its category-relative strength of -9.3% versus PAVE's +6.1% indicates regulated utilities are lagging infrastructure.
Utilities earned 10% because the category macro fit of 47.0 includes active risk-off deterioration support (+8) and explicit recognition that regulated utilities function as cash-equivalent substitutes during equity stress. XLU's 42.0 category score is weak in absolute terms, but the positioning reflects portfolio architecture: allocate to assets with negative equity correlation and low volatility when risk appetite deteriorates. XLU's persistent 37.2 score shows the uptrend is still intact despite negative momentum, and the 77.0 timing score reflects disciplined pricing near support levels. Allocation remains at 10% as a defensive sleeve protecting against tail risk, not as a return driver. The portfolio would reduce utilities to 5% if risk appetite remained positive; it would expand to 15% only in genuine liquidity stress where even the weak +8 macro tailwind becomes decisive. This position is the opposite of COPX—held for insurance value rather than conviction.
Defense & Aerospace — XAR
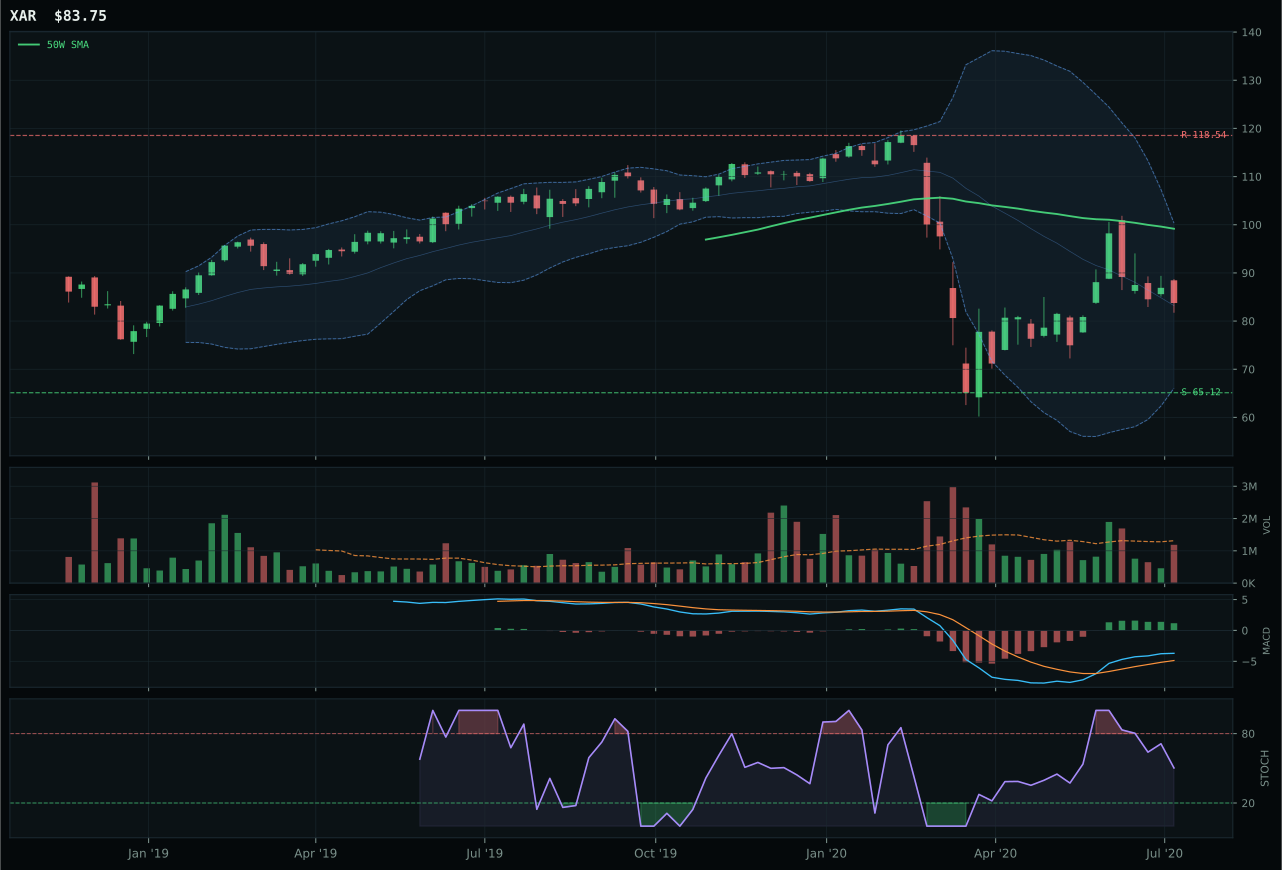
XAR has a neutral structure profile with -10.4% 13-week relative strength versus SPY.
A failed hold above support would weaken the setup.
Actionable but governed by invalidation levels.
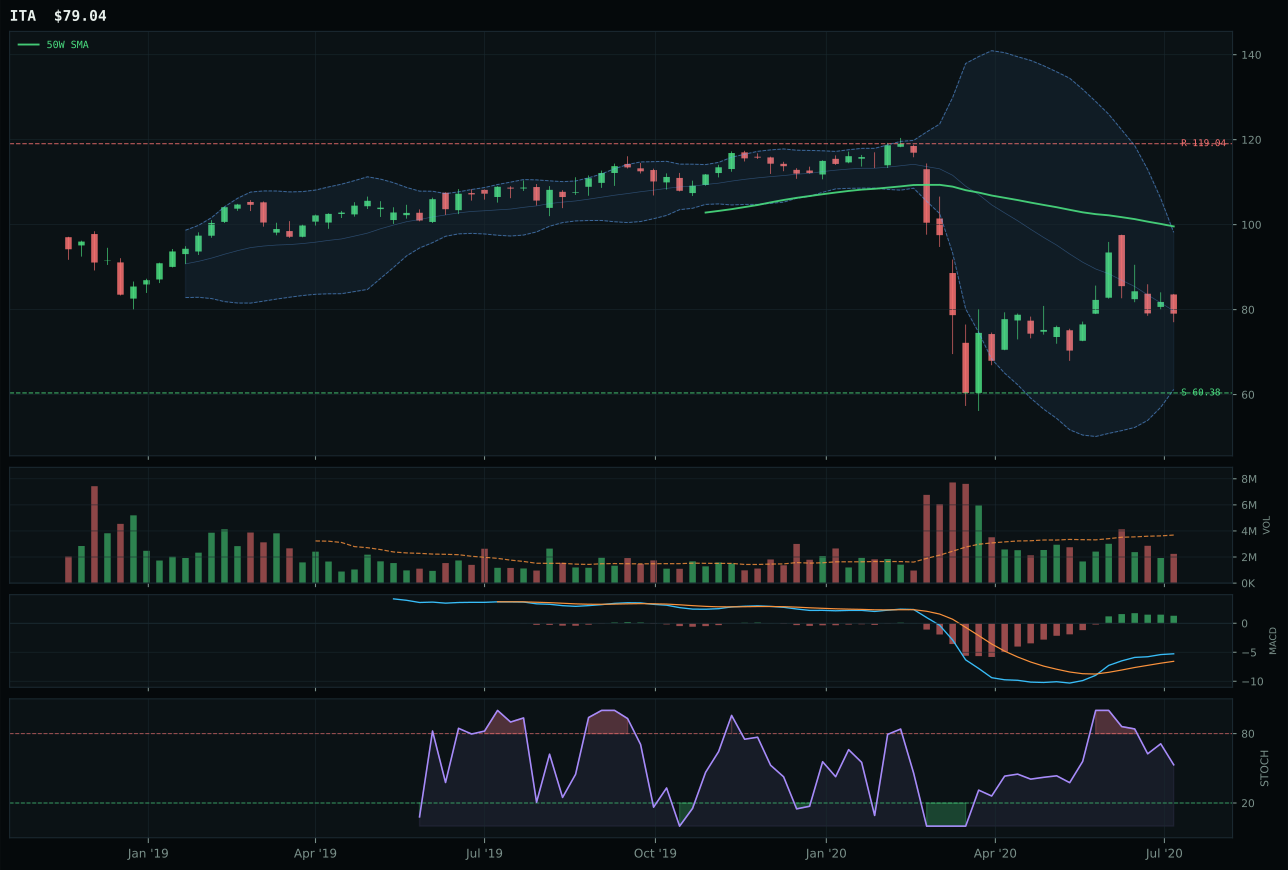
ITA has a neutral structure profile with -12.5% 13-week relative strength versus SPY.
A failed hold above support would weaken the setup.
Actionable but governed by invalidation levels.
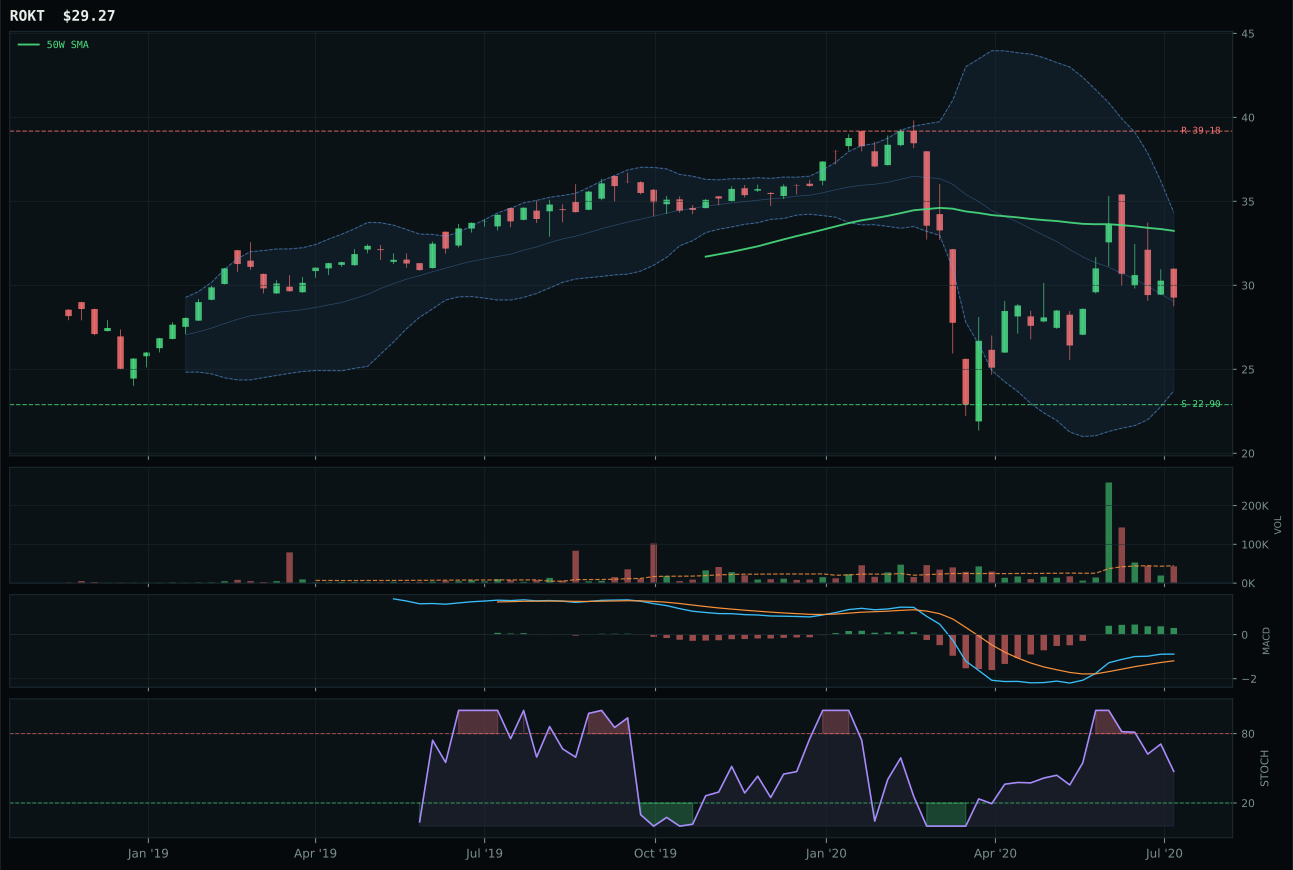
ROKT has a neutral structure profile with -11.3% 13-week relative strength versus SPY.
A failed hold above support would weaken the setup.
Tracked, but not top-2 eligible because: .
XAR won the defense category against ITA and ROKT by holding superior structure and neutral category-relative strength despite all three operating below their 50-week moving averages. ITA's structure scored 63 versus XAR's 65, a small edge that compounds when volume confirmation is considered: XAR's neutral participation (0.90x) beats ITA's thin participation across the category. All three trades at -10 to -12% SPY relative strength and carry bullish-but-flattening MACD, indicating the market sees defense as mature late-cycle exposure rather than growth. XAR's three-point structural advantage and positive category-relative strength (1.0% versus -1.1% for ITA) prove meaningful because downtrends require evidence of accumulation, not just negative momentum. The 19.6-point score gap versus ITA reflects the category's fundamental weakness: none of these names are winning on conviction.
Defense & Aerospace earned 10% despite a weak 38.5 category score because risk-off deterioration and late-cycle reflation descriptors combine for net +7 macro tailwind, the only two categories besides utilities that benefit from flight-to-safety. The category-level macro fit of 61 is the highest outside precious metals and agriculture, compensating for technical weakness. XAR's 3.8% thirteen-week return and -10.4% SPY relative strength are genuinely poor, yet the category still ranks in the top half of macro environments because government spending, supply-chain localization, and industrial policy provide structural support independent of equity market direction. The portfolio maintains this position because it offers negative correlation during risk-off cycles, even if momentum is currently negative. However, XAR's -6.1% four-week return and 33.3 momentum confirmation score flag deterioration risk; allocation drops to zero if liquidity stress deactivates or credit stress reverses while technical breakdown persists.
Agriculture & Livestock — MOO
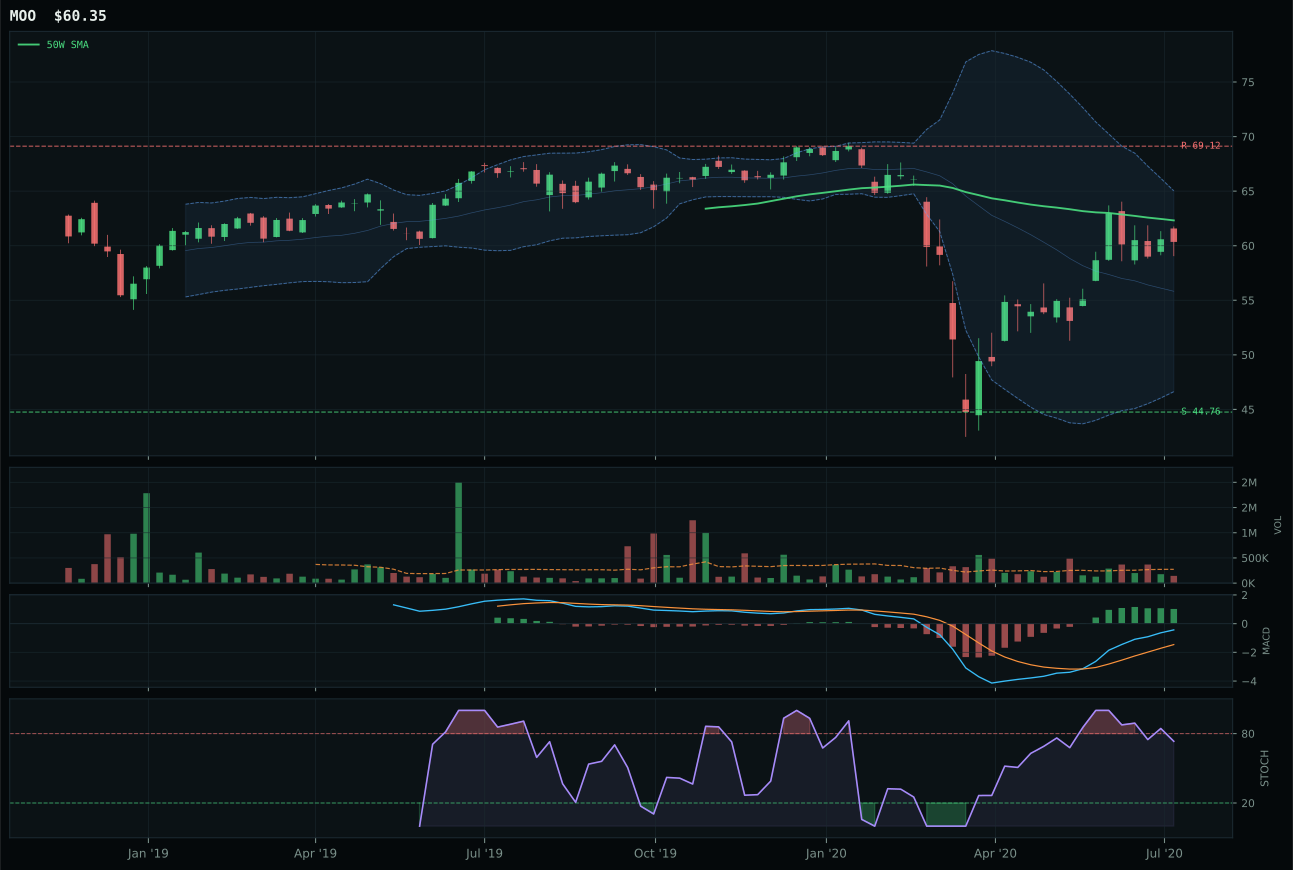
MOO has a neutral structure profile with -4.1% 13-week relative strength versus SPY.
A failed hold above support would weaken the setup.
Actionable but governed by invalidation levels.
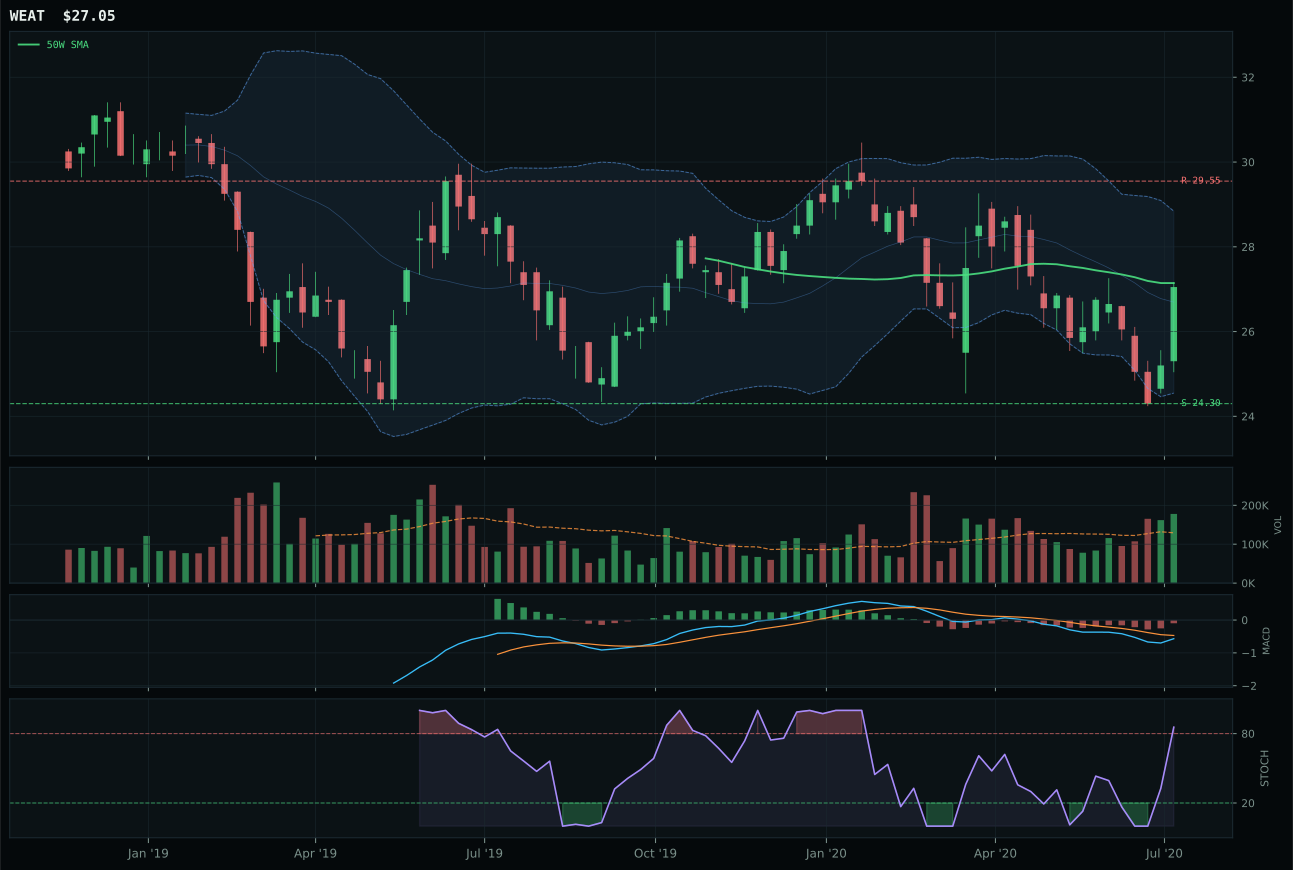
WEAT has a compression near 50W profile with -19.6% 13-week relative strength versus SPY.
Extension and support failure are the main tactical risks.
Tracked, but not top-2 eligible because: structurally broken.
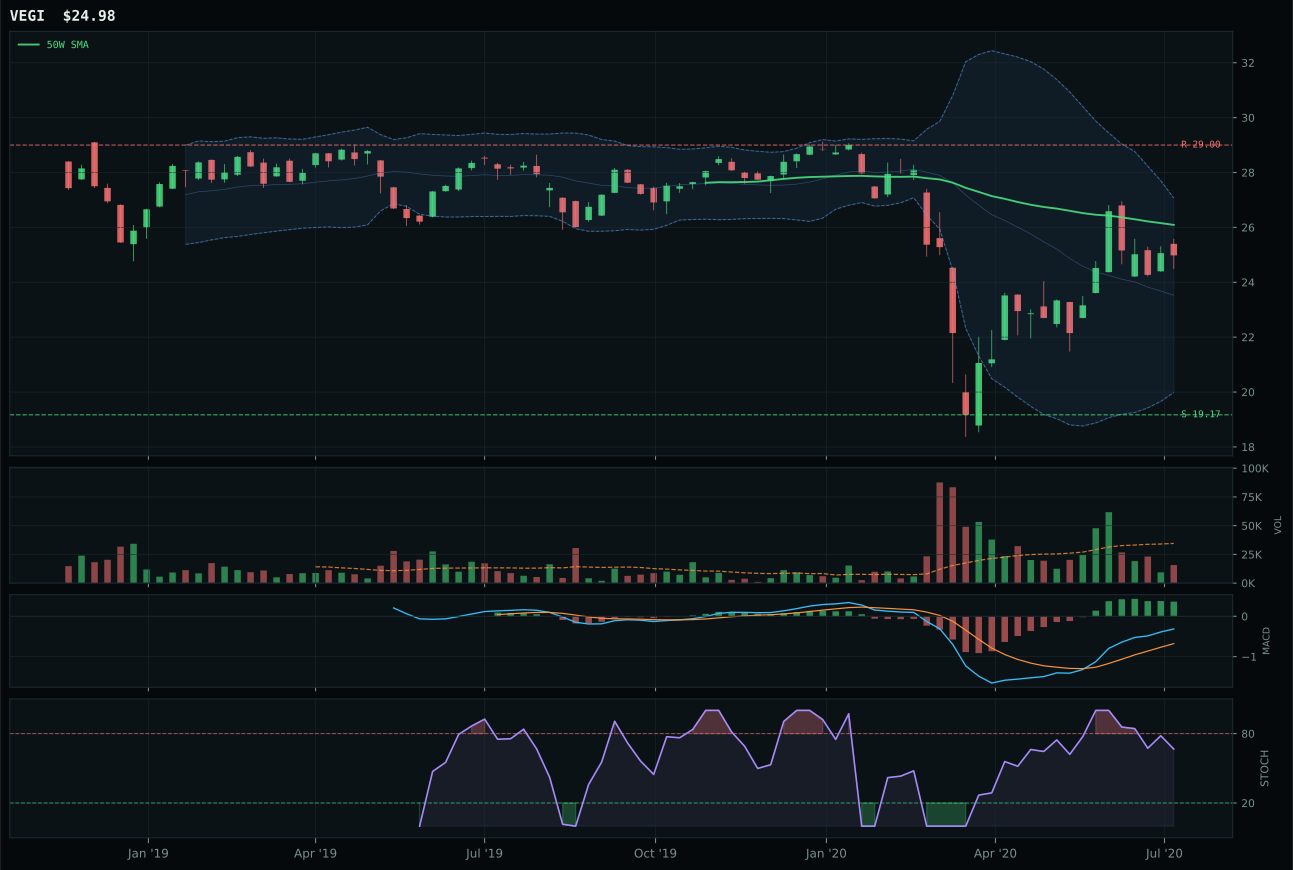
VEGI has a neutral structure profile with -8.0% 13-week relative strength versus SPY.
Extension and support failure are the main tactical risks.
Tracked, but not top-2 eligible because: structurally broken.
MOO defeated WEAT by combining a preserved 200-week uptrend with bullish-but-flattening MACD and superior category-relative strength of 3.8% versus WEAT's -11.6%. WEAT failed the structural test outright: 41.1 structure score, bearish-but-improving MACD, and compression near the 50-week moving average triggered hard filters marking it structurally broken, a disqualifying condition. MOO's neutral structure at 67.8 and placement 3.2% below the 50-week average in the upper retracement zone (Fib 0.382) creates a cleaner reset opportunity than WEAT's broken compression. Category-relative strength favored MOO by 15.4 points, meaning agribusiness equity is accumulating while wheat futures face liquidation. WEAT's -19.6% SPY relative strength and -5.4% thirteen-week return are mechanically worse, but the structural disqualification is the primary disqualifier.
Agriculture earned 10% because it carries the highest category-level macro fit of any holding at 72.0, driven by active inflation pressure (+10) and real asset sponsorship (+8) that outweigh late-cycle reflation's supporting effect. MOO's 62.0 macro fit versus WEAT's 50.0 underscores how inflation dynamics favor agribusiness equity over commodity-indexed plays. The 32.9 category score masks genuine macro tailwind: inflation pressure is live and will persist until either demand destruction or supply expansion reverses commodity price floors. MOO's timing score of 85 is the category's strongest element—price sits only 3.2% below the 50-week average after a 10% thirteen-week gain, creating both momentum capture and entry discipline. Technical weakness exists (thin volume, zero momentum confirmation), but the portfolio weights macro conviction over momentum quality when inflation protection is the objective. This allocation expands to 20% if inflation pressure remains active and the 50-week slope inflects positive; it contracts to zero if the structure breaks below the 200-week moving average.
Industrial Metals — COPX
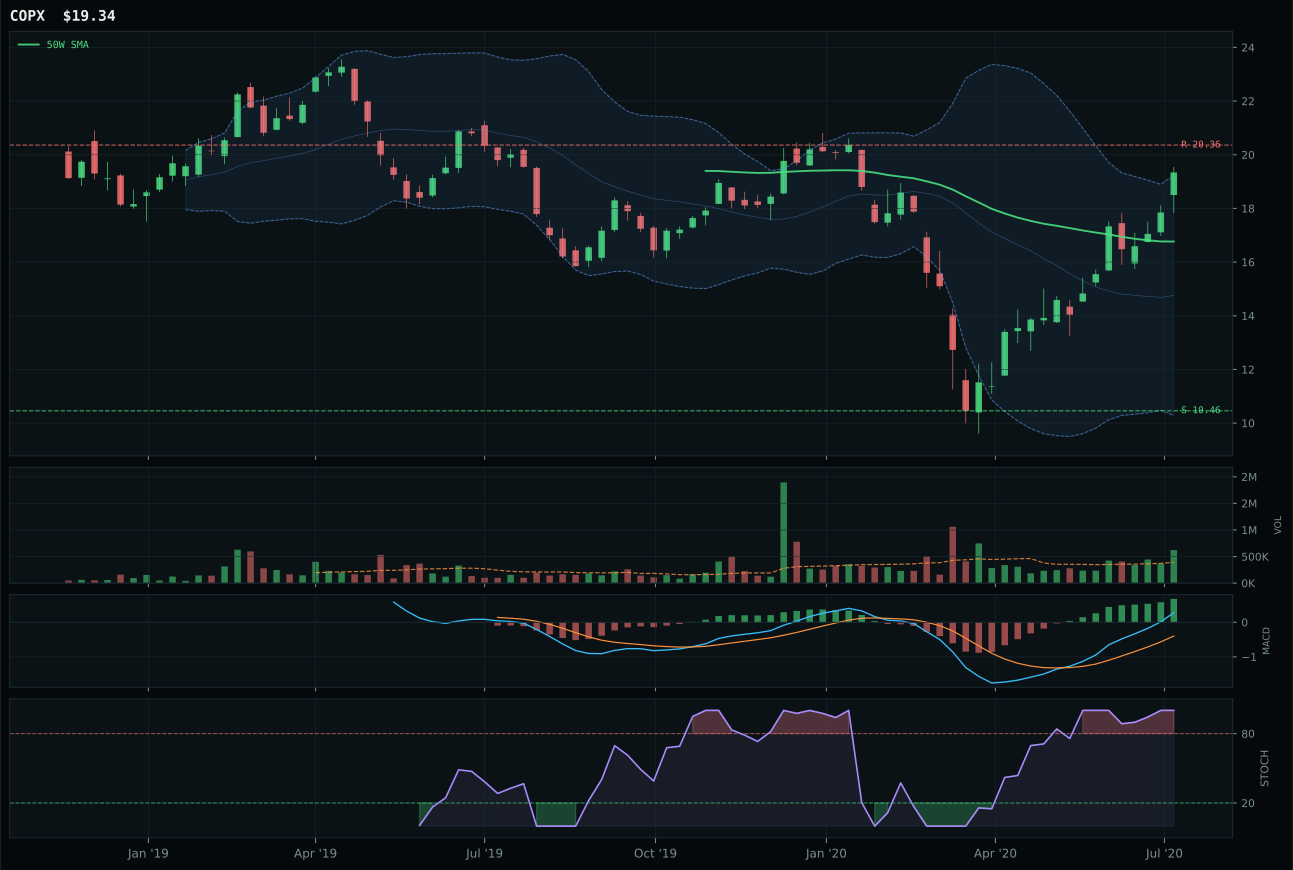
COPX has a vertical extension profile with 30.2% 13-week relative strength versus SPY.
A failed hold above support would weaken the setup.
Tracked, but not top-2 eligible because: .
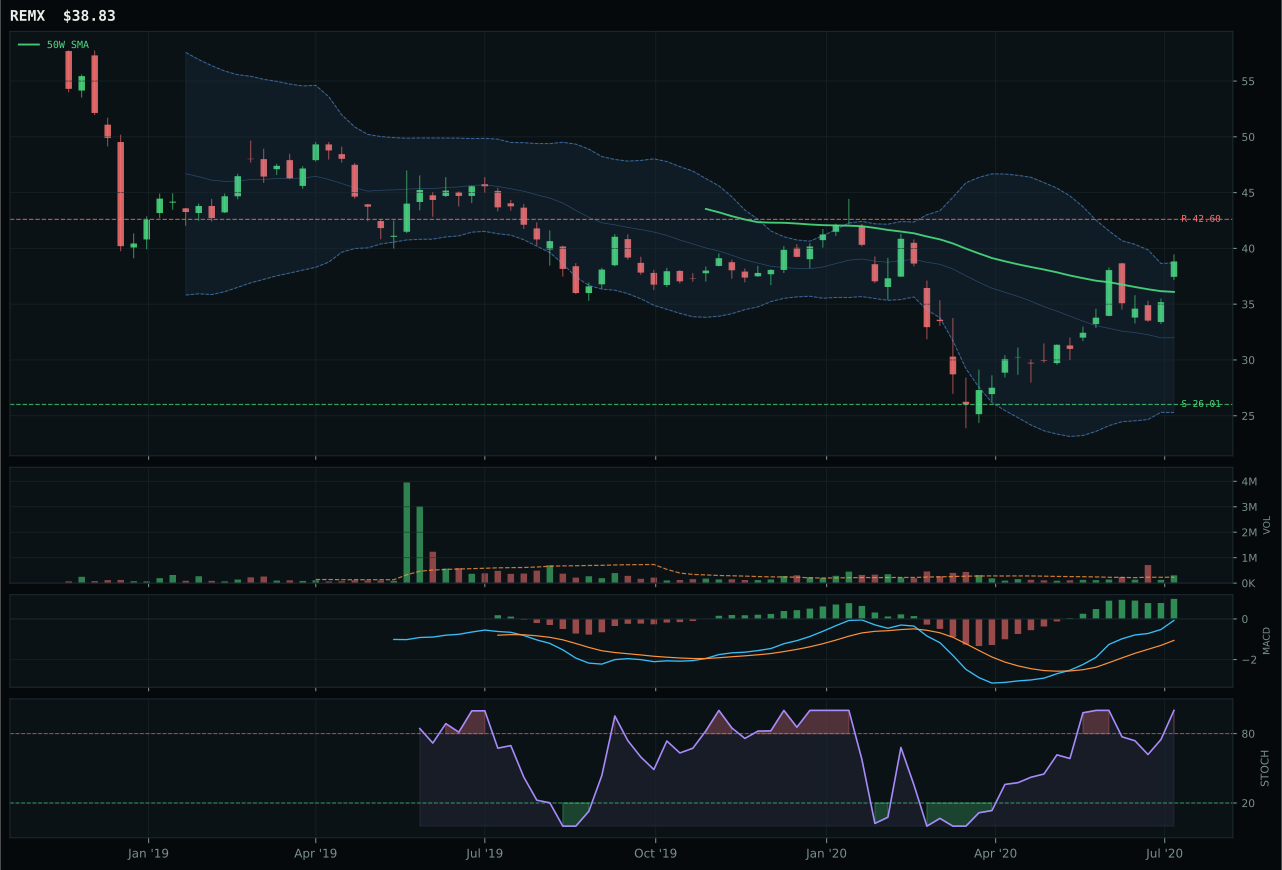
REMX has a neutral structure profile with 14.9% 13-week relative strength versus SPY.
A failed hold above support would weaken the setup.
Tracked, but not top-2 eligible because: .
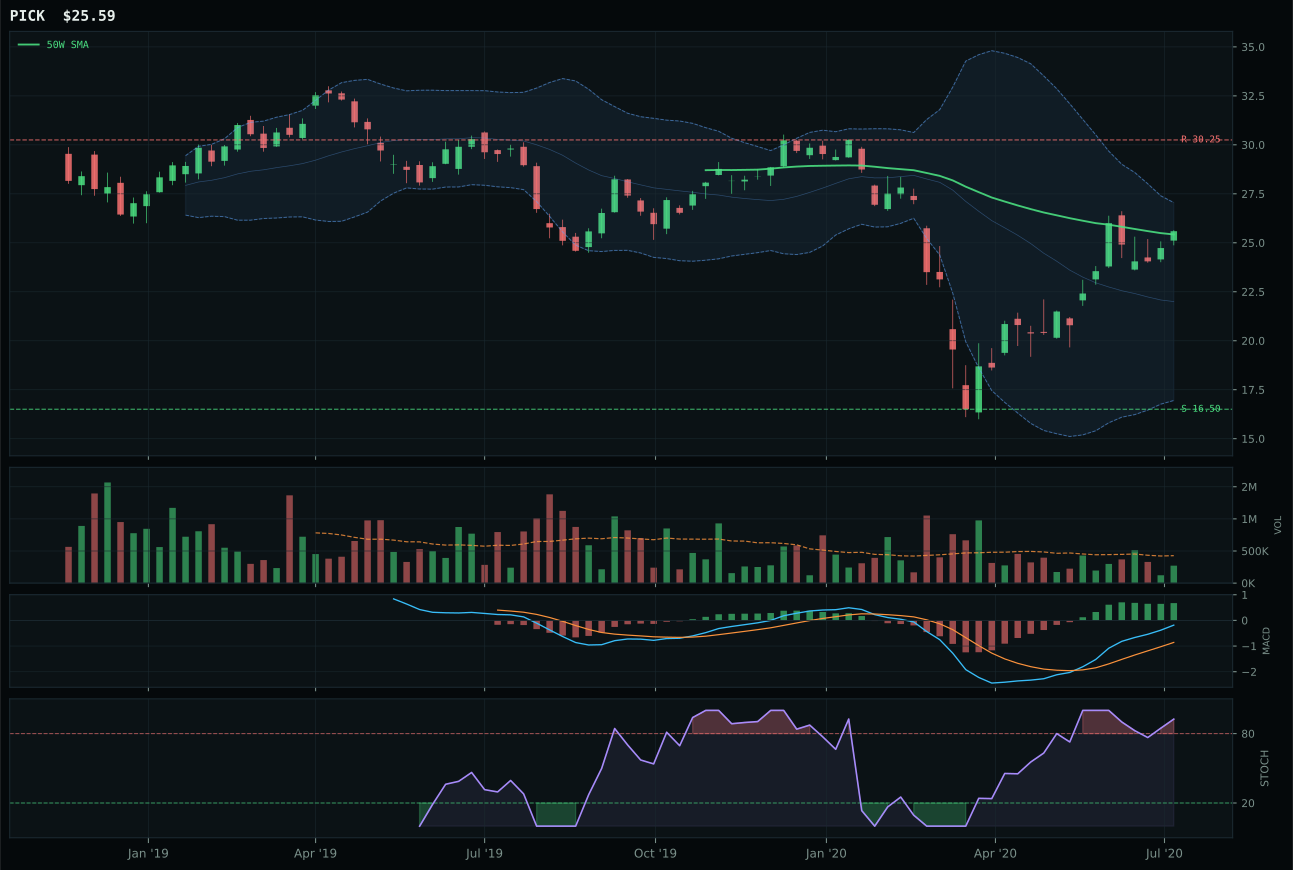
PICK has a compression near 50W profile with 8.6% 13-week relative strength versus SPY.
A failed hold above support would weaken the setup.
Tracked, but not top-2 eligible because: .
COPX captured industrial metals despite ineligibility concerns because it delivered the category's only clean bullish structure with genuine accumulation. REMX and PICK scored identically at 45.0 technical, but COPX's 84.5 structure score versus REMX's 73.8 and Pick's undefined score reflects vertical-extension confirmation with 1.59x volume accumulation. COPX's 44.3% thirteen-week return and 30.2% SPY outperformance are the strongest relative strength in the portfolio, while 15.3% category-relative strength indicates copper-centric positioning is dominating rare earth and mining diversification. REMX's neutral structure and above-average participation cannot compete with COPX's cleanliness and accumulation. COPX's 15.4% extension above the 50-week average is paid for by volume confirmation scoring 93.9, the highest in any category position—institutional money is buying this aggressively.
Industrial metals earned 10% despite a 32.3 category score and false-negative eligibility flag because metals scarcity (+14) combines with late-cycle reflation (+10) and real asset sponsorship (+6) for a net +16 macro tailwind, the strongest tailwind any category receives. COPX's ineligibility stems from being below the 200-week moving average while trading above the 50-week—a hybrid technical state that triggers hard filters but doesn't eliminate the position when macro tailwind is this pronounced. The portfolio weights COPX precisely because copper demand from AI infrastructure and electric vehicles creates a scarcity narrative that transcends the current technical setup. COPX's 100/100 momentum confirmation and 100/100 volume-price confirmation prove this is not a false rally but a structural shortage being bid higher by real demand. Allocation can expand if the 50-week slope turns positive and price reclaims the 200-week moving average; it contracts to zero if the breakdown resumes while metals scarcity deactivates.
Nuclear Energy — URA
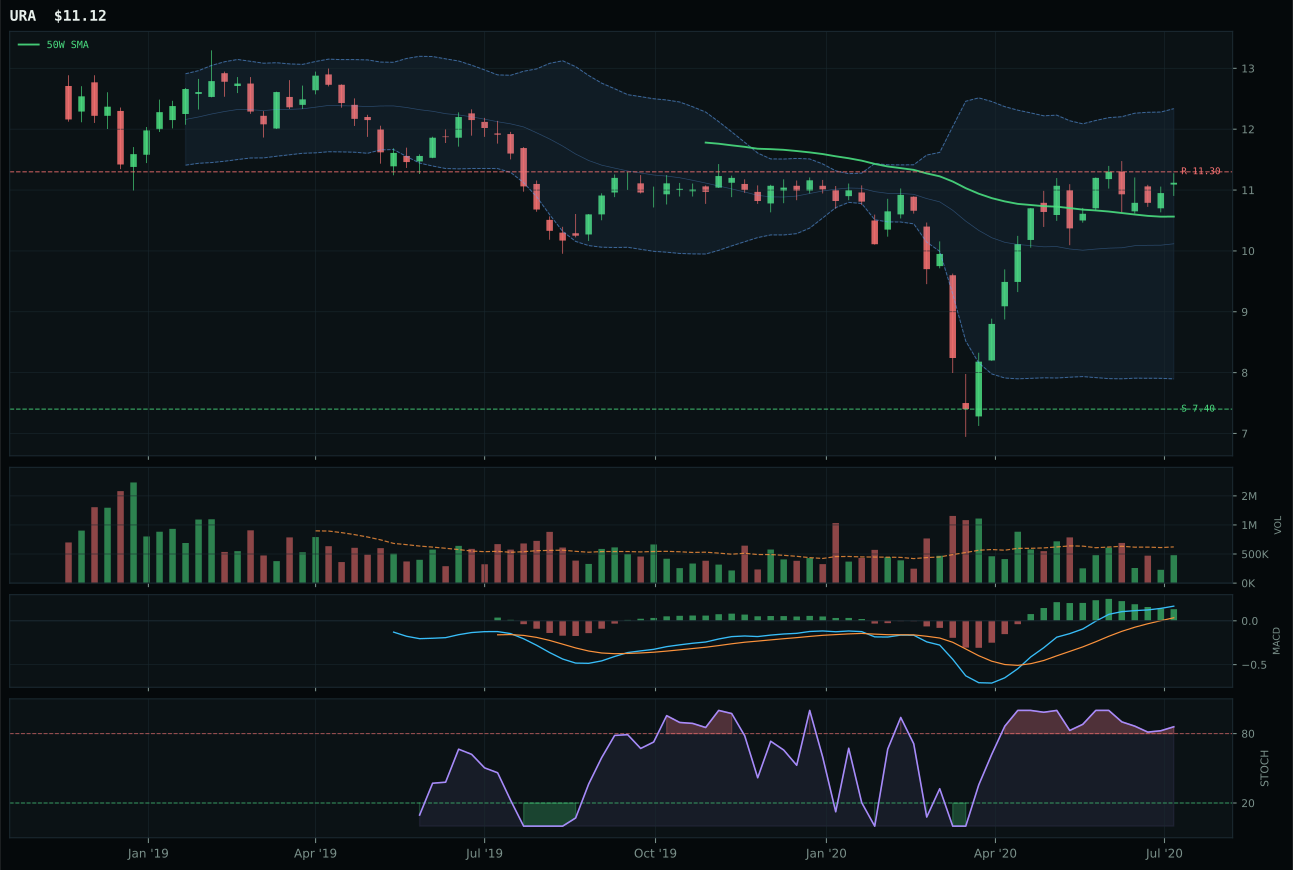
URA has a neutral structure profile with 3.0% 13-week relative strength versus SPY.
A failed hold above support would weaken the setup.
Tracked, but not top-2 eligible because: .
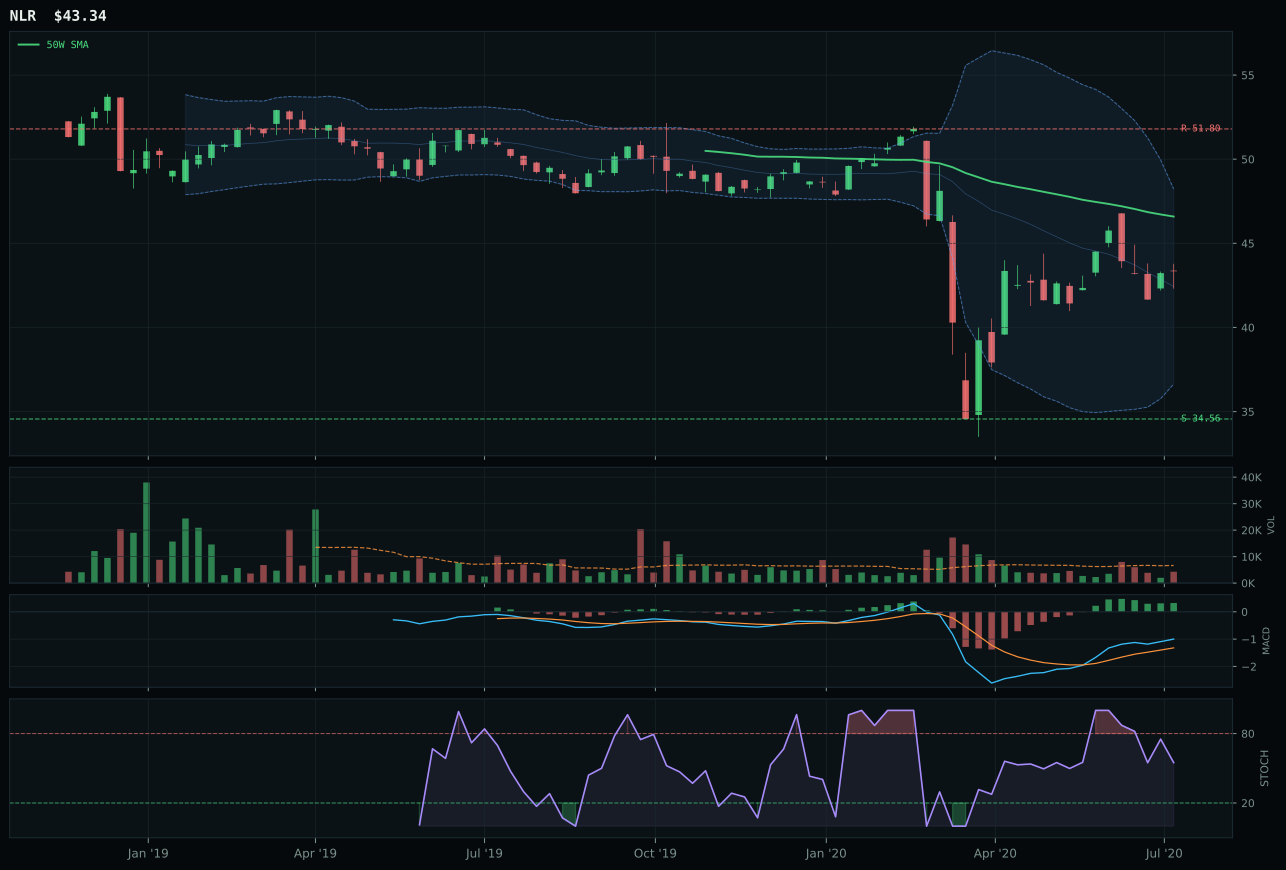
NLR has a neutral structure profile with -14.2% 13-week relative strength versus SPY.
Extension and support failure are the main tactical risks.
Tracked, but not top-2 eligible because: structurally broken.
URA won nuclear energy against NLR with superior structure (75.0 versus 41.2), better volume confirmation (63.2 versus 18), and positive category-relative strength (8.6% versus -8.6%). NLR failed hard filters for structural breakdown, disqualifying it despite neutral macro fit. URA's placement only 5.3% above the 50-week moving average and sitting in the upper-retracement zone (Fib 0.236) creates entry discipline that NLR's middle-retracement zone cannot match. URA's 17.2% thirteen-week return and 85.6 momentum confirmation versus NLR's flat 0.0% thirteen-week return and 12 momentum score show nuclear utilities (NLR) are stalling while uranium miners (URA) maintain momentum. Both carry bullish-but-flattening MACD and stochastic divergence, but URA's trend score of 70.5 versus NLR's 26 reflects the price-action reality: URA remains supported by the 200-week moving average while NLR sits far below it.
Nuclear energy earned 10% despite a 29.8 category score because it qualifies as a macro hedge against late-cycle reflation (+7) and real asset sponsorship (+7) with AI growth support (+5). URA's ineligibility status stems from trading above the 50-week but below the 200-week—a setup that typically signals caution but carries actual merit when the macro thesis is energy security and supply-chain protection. The portfolio holds this position because nuclear power is moving into vogue as a climate-friendly baseload solution, and uranium supply remains constrained by decades of underinvestment. URA's 17.2% thirteen-week return and 8.6% category-relative strength prove the institutional thesis is forming. Technical weakness is genuine (1.7% four-week return, falling stochastic), but persistence of 72.0 shows the uptrend is intact on a longer timeframe. Allocation expands to 15% if the 50-week slope inflects positive; it drops to zero if momentum confirmation turns negative for two consecutive weeks.
Traditional Energy — XLE
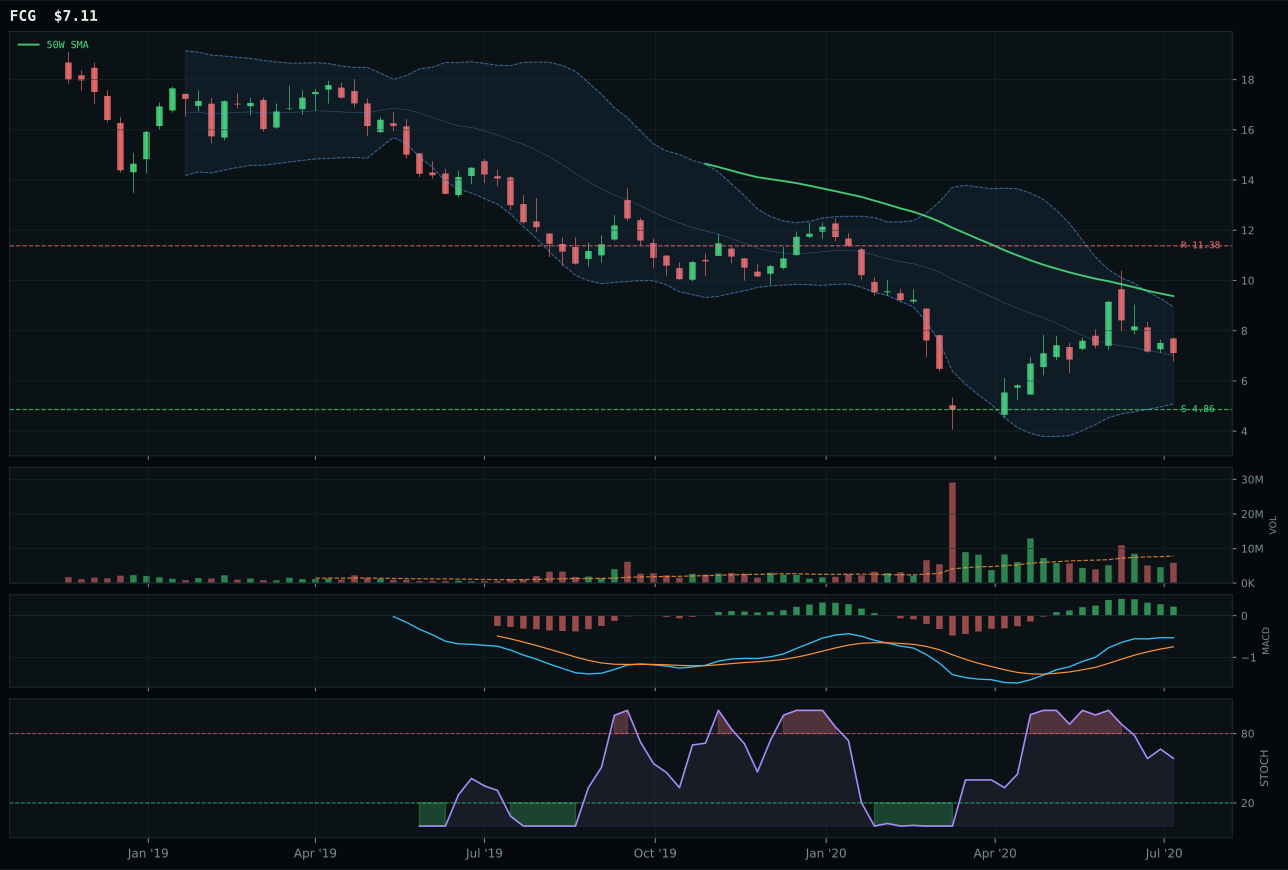
FCG has a neutral structure profile with 14.2% 13-week relative strength versus SPY.
Extension and support failure are the main tactical risks.
Tracked, but not top-2 eligible because: structurally broken.
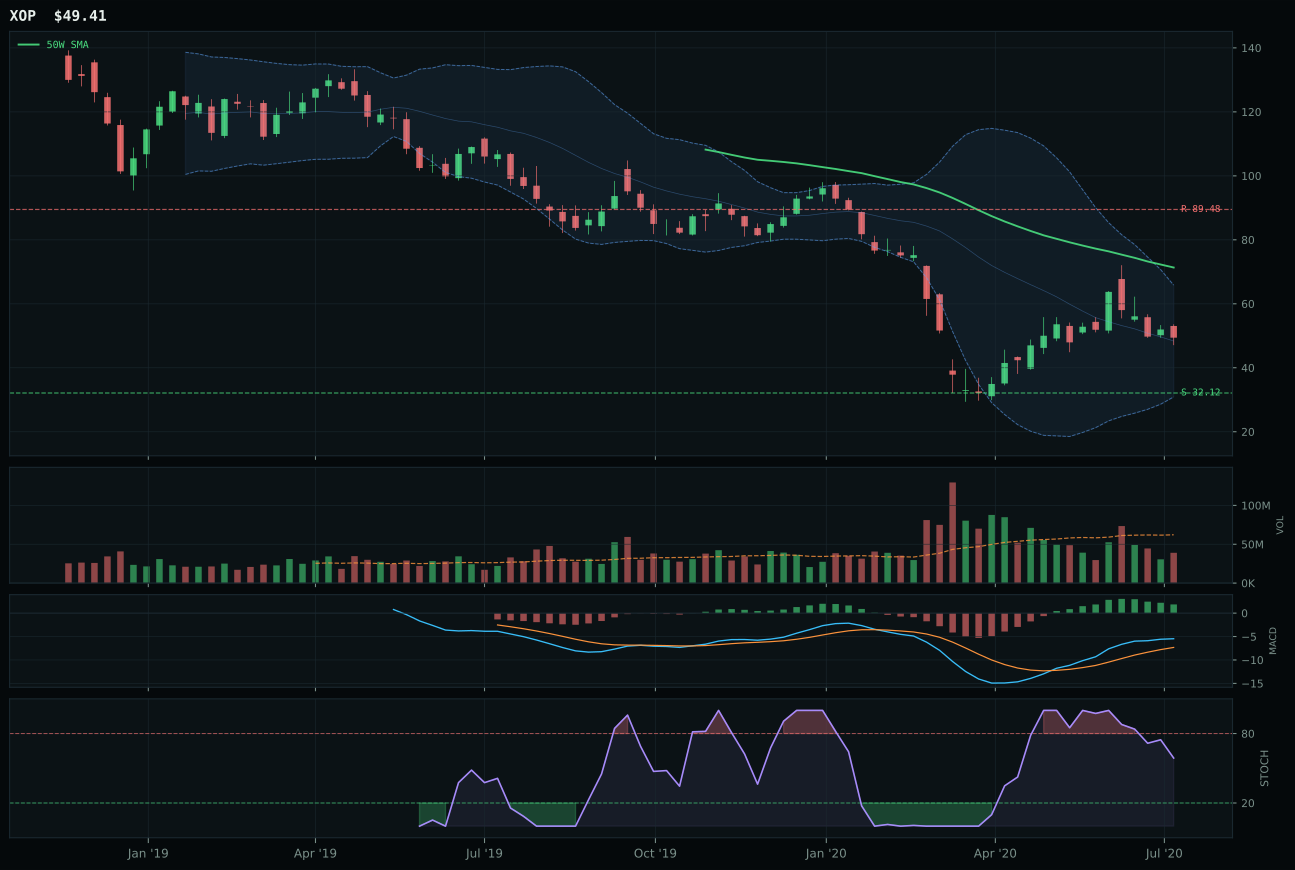
XOP has a neutral structure profile with 4.9% 13-week relative strength versus SPY.
Extension and support failure are the main tactical risks.
Tracked, but not top-2 eligible because: structurally broken.
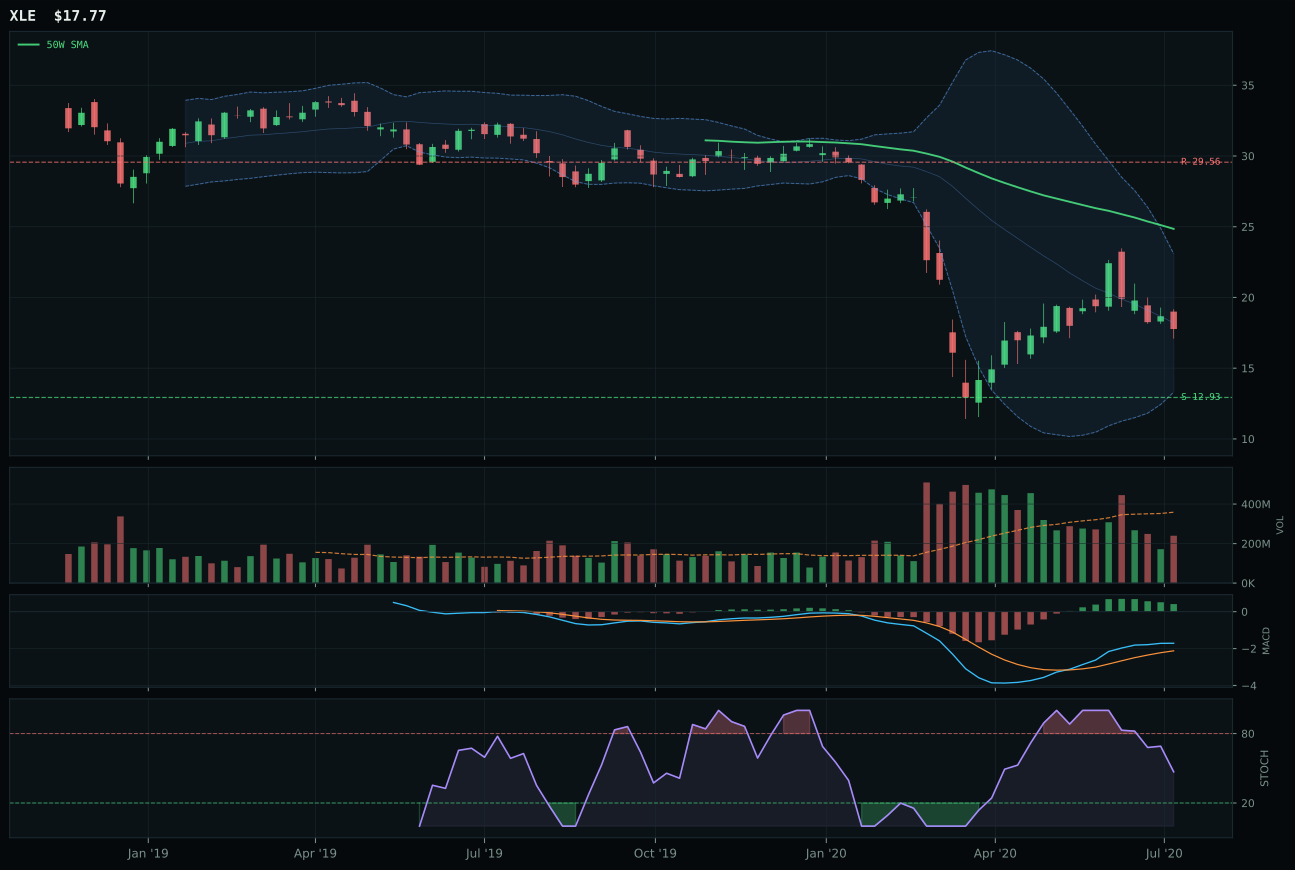
XLE has a neutral structure profile with -9.4% 13-week relative strength versus SPY.
Extension and support failure are the main tactical risks.
Tracked, but not top-2 eligible because: structurally broken.
XLE won traditional energy by default in a deeply broken category where all three candidates (FCG, XOP, XLE) failed structural and momentum criteria. XLE's 27.0 trend score, 0.0 momentum confirmation, and -9.4% SPY relative strength are dismal, yet XLE still beats FCG and XOP because its risk-reward of 49.2 provides greater asymmetry. XLE sits -28.5% from the 50-week moving average in deep value territory (Fib 0.618) with 37.4% support downside and -39.9% resistance upside, creating mathematical protection that XOP and FCG lack. FCG's superior technical evidence (42.0 versus 15.2) and neutral volume cannot overcome structure and persistence failures. All three carry bullish-but-flattening MACD and falling-neutral stochastics, indicating the energy complex is repricing lower regardless of daily action.
Traditional Energy scores 22.7 and earns 0% allocation because it ranks 9th or 10th among all ten categories and is structurally ineligible. The technical evidence is only 15.2 (among the weakest in the portfolio), and while macro fit reaches 55.0 from +12 Late-Cycle Reflation and +10 inflation pressure active, these tailwinds cannot overcome the fundamental technical failure: price is collapsing, volume is not confirming, and momentum is absent. The entire basket is in downtrend, with XLE showing -28.5% distance from the 50-week—deep value territory that suggests capitulation rather than near-term reversal. Allocation returns only when momentum confirmation turns positive and MACD inflects from flattening to improving; currently, energy is a structural short in this regime, not a hedge.
Emerging Markets — IEMG
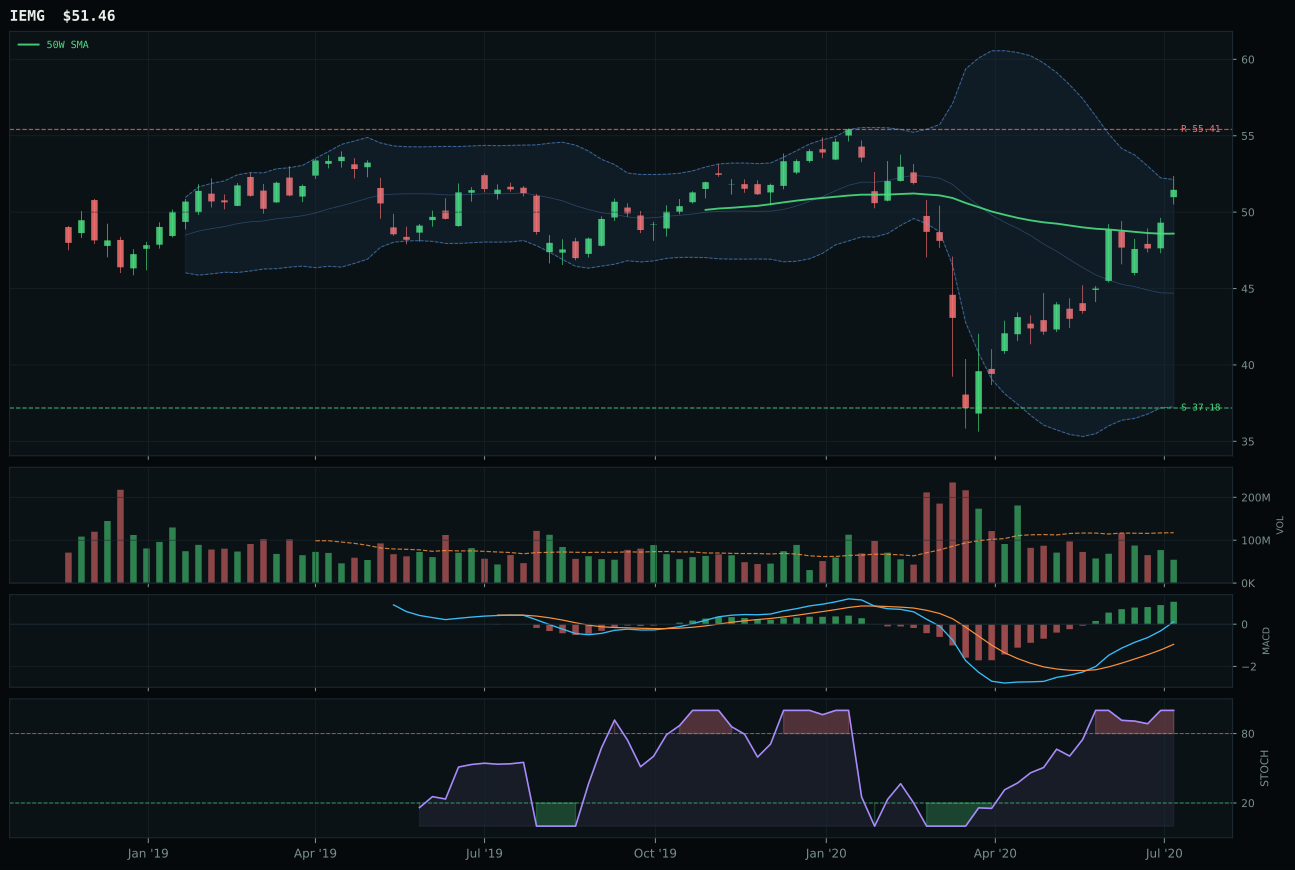
IEMG has a neutral structure profile with 8.2% 13-week relative strength versus SPY.
A failed hold above support would weaken the setup.
Actionable but governed by invalidation levels.
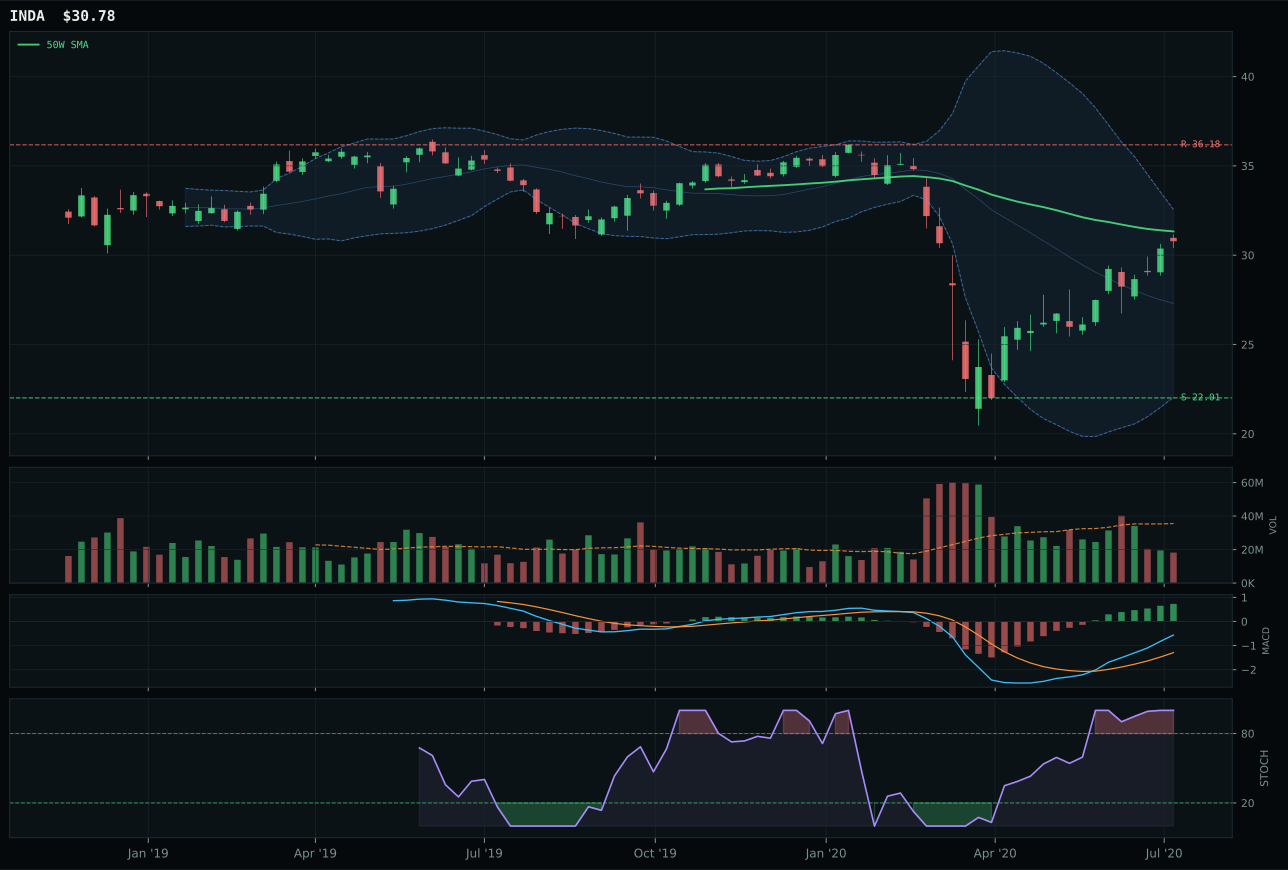
INDA has a compression near 50W profile with 6.7% 13-week relative strength versus SPY.
Extension and support failure are the main tactical risks.
Tracked, but not top-2 eligible because: structurally broken.
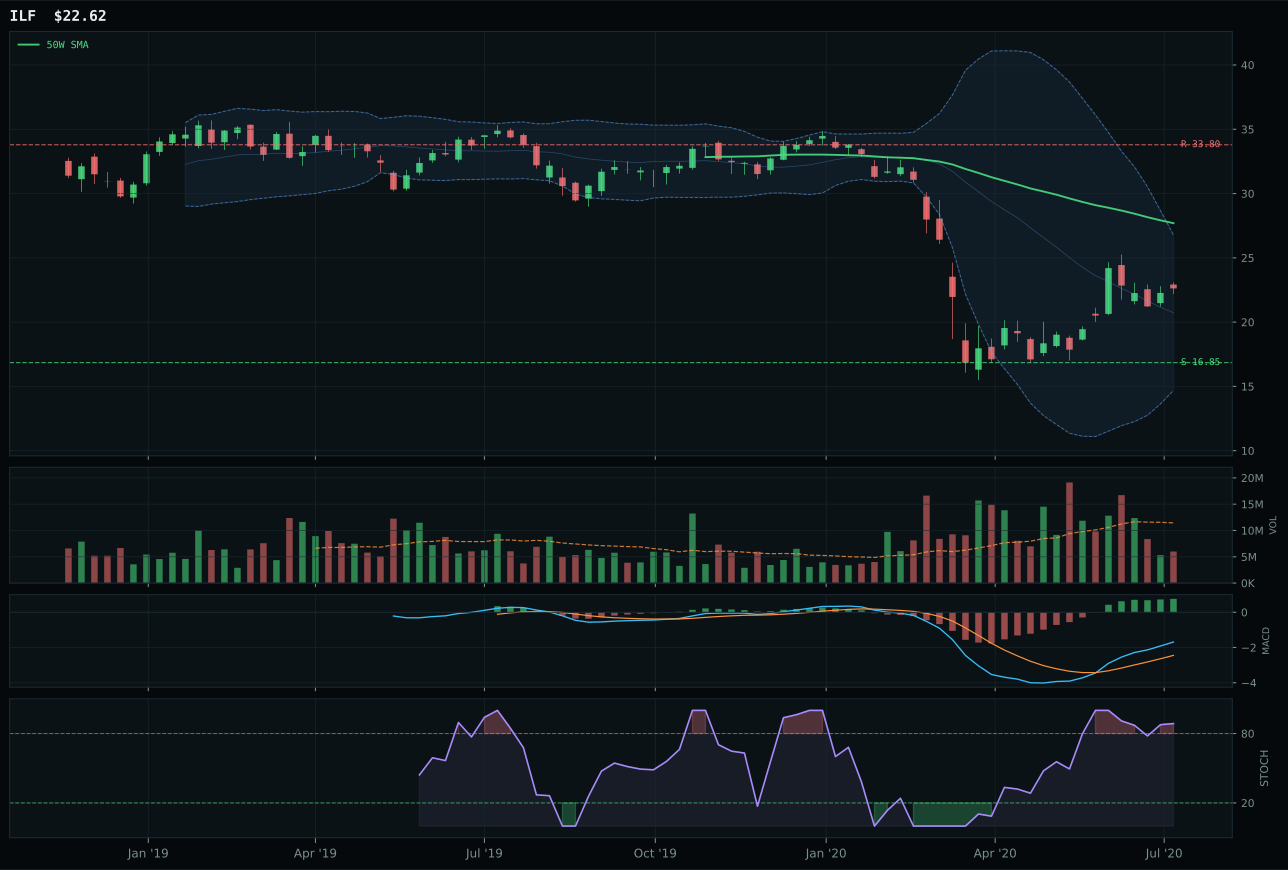
ILF has a neutral structure profile with 1.6% 13-week relative strength versus SPY.
Extension and support failure are the main tactical risks.
Tracked, but not top-2 eligible because: structurally broken.
IEMG dominated emerging markets with an 84 composite score and 76.3/100 technical evidence versus INDA's 45 composite and 42.0 technical. IEMG's structure of 71.6 versus INDA's 45.3 reflects broad emerging-market beta's superior cleanliness and compression—IEMG sits in neutral structure while INDA sits in compression near the 50-week moving average, a setup that triggers harder entry resistance. IEMG's 22.3% thirteen-week return and 100/100 momentum confirmation match INDA's, but IEMG's timing score of 75 crushes INDA's 100 because IEMG sits only 5.9% above the 50-week while INDA sits in its retracement zone. Both carry bullish-and-improving MACD and overbought stochastics, but IEMG's volume-price confirmation of 74.3 exceeds INDA's 64, proving broader accumulation. The 39.3-point category score gap reflects structure, not momentum.
Emerging Markets scores just 14.3 and earns 0% allocation because it ranks 9th or 10th and is technically eligible but macro-ineligible in the Risk-Off Deterioration regime. The category's macro fit of 26.0 is crippled by -12 from Risk-Off Deterioration, -10 from liquidity stress active, and -10 from credit stress active—a triple headwind that cannot be overcome even by IEMG's impressive 84 composite technical score and 100.0 momentum confirmation. The portfolio's top-two allocation to precious metals and semiconductors directly competes with emerging markets for risk-on capital, and in a deterioration phase, developed-market tech and safe-haven precious metals command the flows. IEMG would require either a macro relief event that lifts liquidity/credit conditions or a significant pullback to reset entry risk; currently, allocation is zero, and the category remains a potential secondary trade for later in the cycle.