
2020-07-03
Informational purposes only. The content in this report, including allocations, analysis, and commentary, is provided solely for informational and educational purposes. It does not constitute financial advice, investment advice, trading advice, or any other type of advice. Past performance does not guarantee future results. Always conduct your own research and consult a qualified financial professional before making investment decisions.
Some tracked tickers were excluded due to missing live weekly price data: SGOV: Historical cache SGOV has only 5 usable weekly bars; URNM: Historical cache URNM has only 31 usable weekly bars
Weekly Allocation
| Ticker | Category | Weight | Role |
|---|---|---|---|
| IGV | Technology | 20% | Top-2 (20%) |
| SMH | AI | 20% | Top-2 (20%) |
| GLD | Precious Metals | 10% | Tier-2 (10%) |
| XAR | Defense & Aerospace | 10% | Tier-2 (10%) |
| XLU | Utilities & Infrastructure | 10% | Tier-2 (10%) |
| XLE | Traditional Energy | 10% | Tier-2 (10%) |
| URA | Nuclear Energy | 10% | Tier-2 (10%) |
| COPX | Industrial Metals | 10% | Tier-2 (10%) |
Trade Instructions — Monday Open
Sell the tranche from 2020-06-05 (completing its 4-week hold). Buy the new tranche. Instructions show net portfolio changes — same-asset positions cancel, weight changes show the delta.
| Action | Ticker | Instruction |
|---|---|---|
| SELL | CIBR | Sell entire CIBR position (5.00% of portfolio) |
| SELL | BOTZ | Sell entire BOTZ position (5.00% of portfolio) |
| SELL | SLV | Sell 25% of SLV position (reduce 10.00% → 7.50%) |
| SELL | ITA | Sell 25% of ITA position (reduce 10.00% → 7.50%) |
| SELL | PAVE | Sell 33% of PAVE position (reduce 7.50% → 5.00%) |
| SELL | MOO | Sell 33% of MOO position (reduce 7.50% → 5.00%) |
| SELL | REMX | Sell entire REMX position (2.50% of portfolio) |
| BUY | SMH | Buy SMH — 22.22% of freed cash (adds 5.00% to portfolio) |
| BUY | URA | Buy URA — 11.11% of freed cash (adds 2.50% to portfolio) |
| BUY | IGV | Buy IGV — 22.22% of freed cash (adds 5.00% to portfolio) |
| BUY | XLU | Buy XLU — 11.11% of freed cash (adds 2.50% to portfolio) |
| BUY | GLD | Buy GLD — 11.11% of freed cash (adds 2.50% to portfolio) |
| BUY | COPX | Buy COPX — 11.11% of freed cash (adds 2.50% to portfolio) |
| BUY | XAR | Buy XAR — 11.11% of freed cash (adds 2.50% to portfolio) |
Current Portfolio After Trade
Combined holdings across all 4 active tranches. Each tranche is 25% of the portfolio.
| Ticker | % of Portfolio | Weight Bar |
|---|---|---|
| SMH | 15.00% | |
| IGV | 15.00% | |
| SLV | 7.50% | |
| ITA | 7.50% | |
| XLE | 7.50% | |
| URA | 7.50% | |
| GLD | 7.50% | |
| PAVE | 5.00% | |
| MOO | 5.00% | |
| XLK | 5.00% | |
| XLU | 5.00% | |
| COPX | 5.00% | |
| FCG | 2.50% | |
| NLR | 2.50% | |
| XAR | 2.50% |
Macro Regime — Late-Cycle Reflation
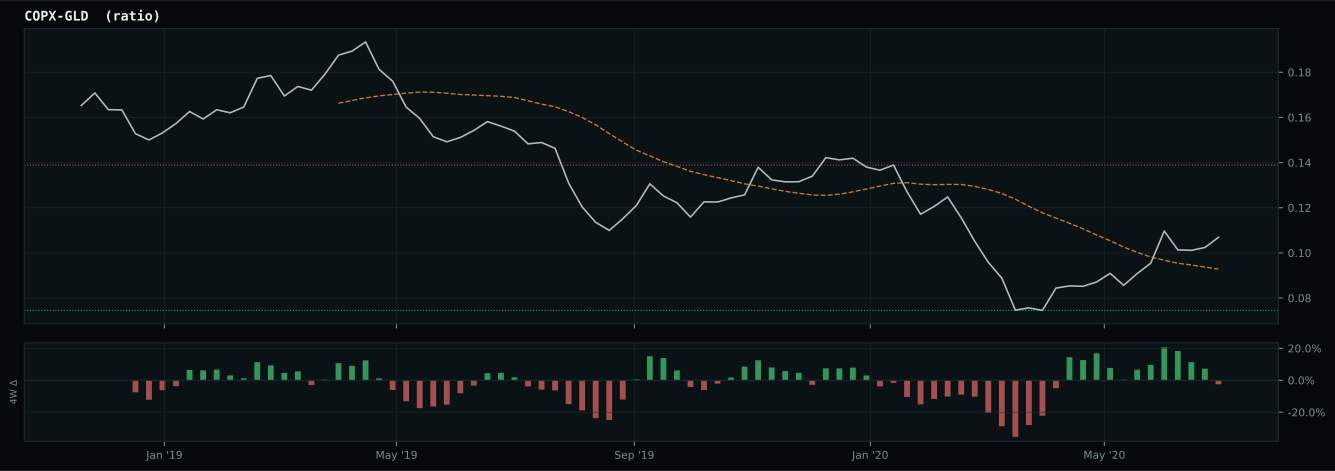
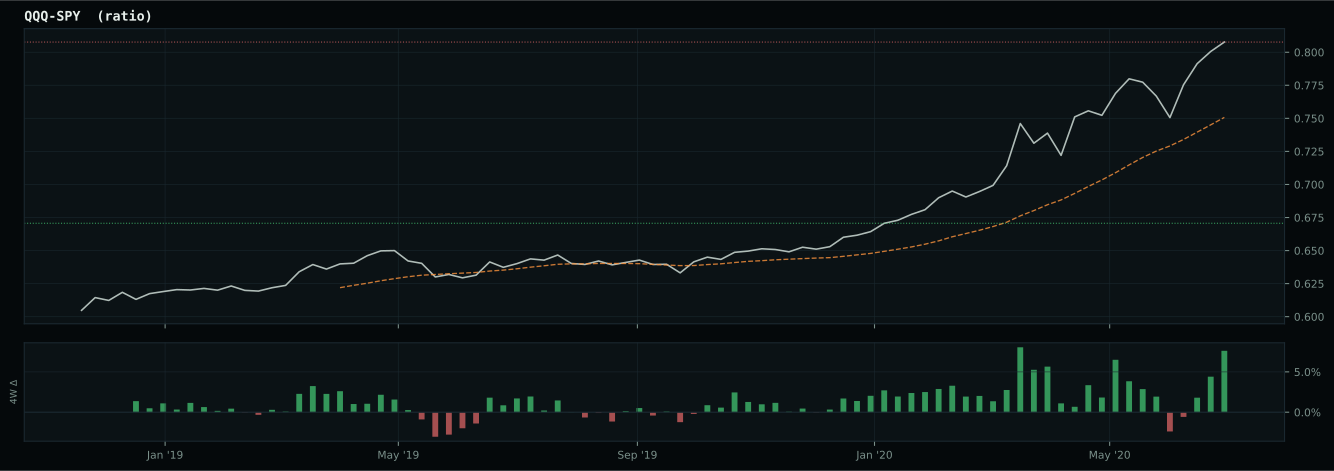
inflation-sensitive ratios are firm but broad commodity participation is weak
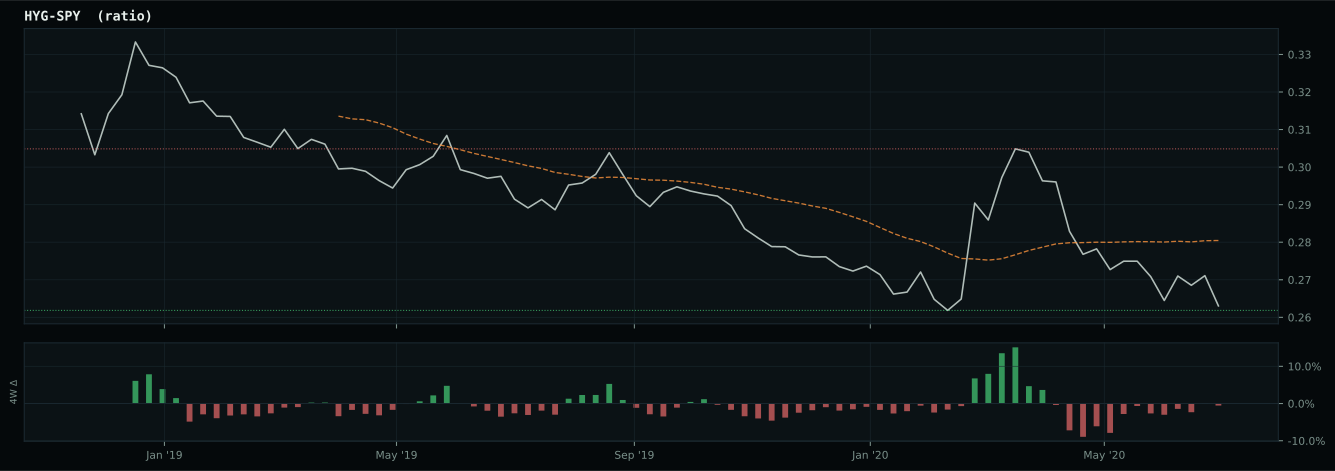
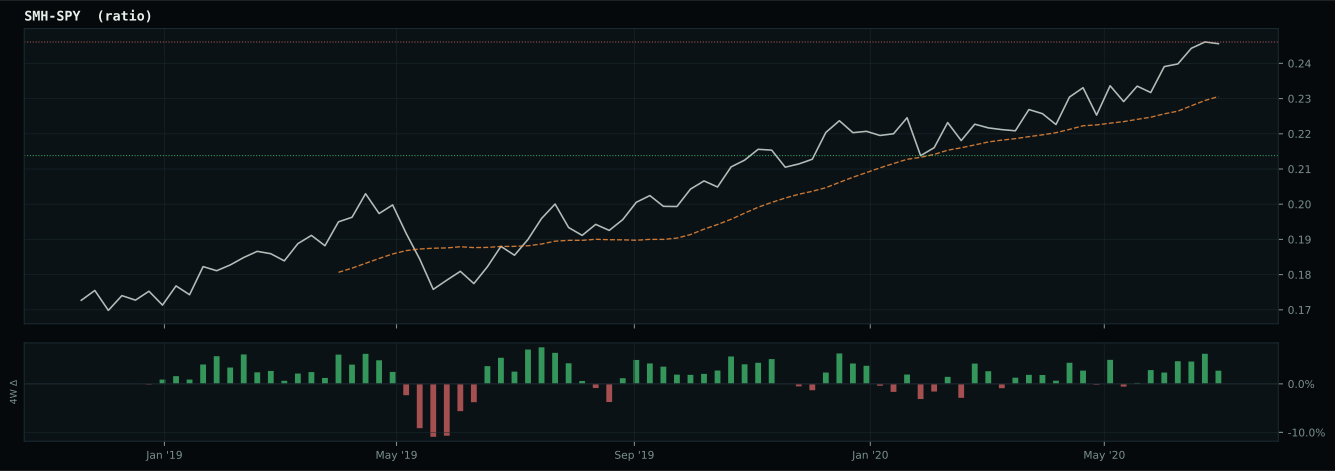
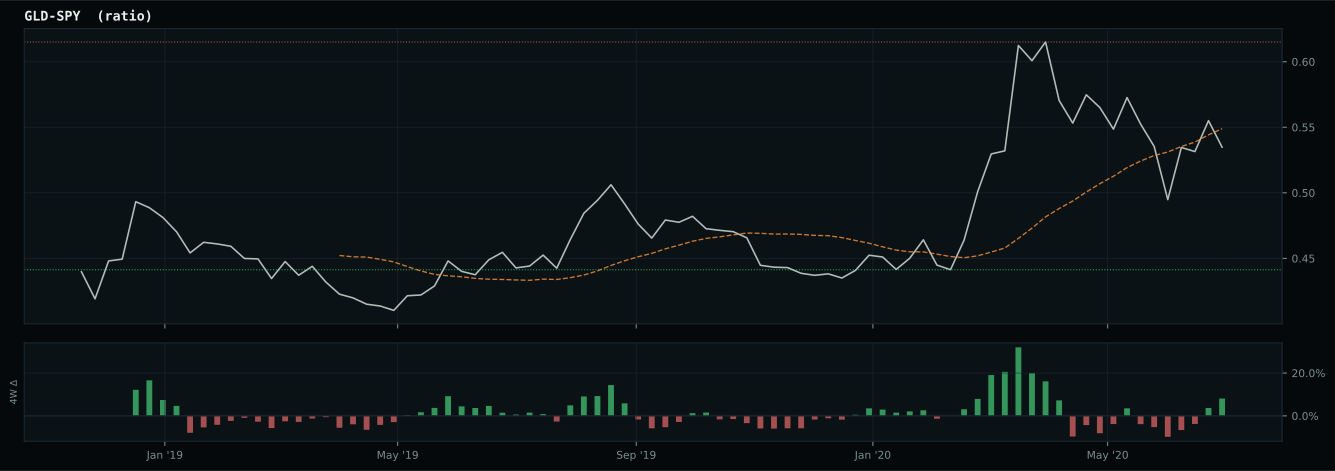
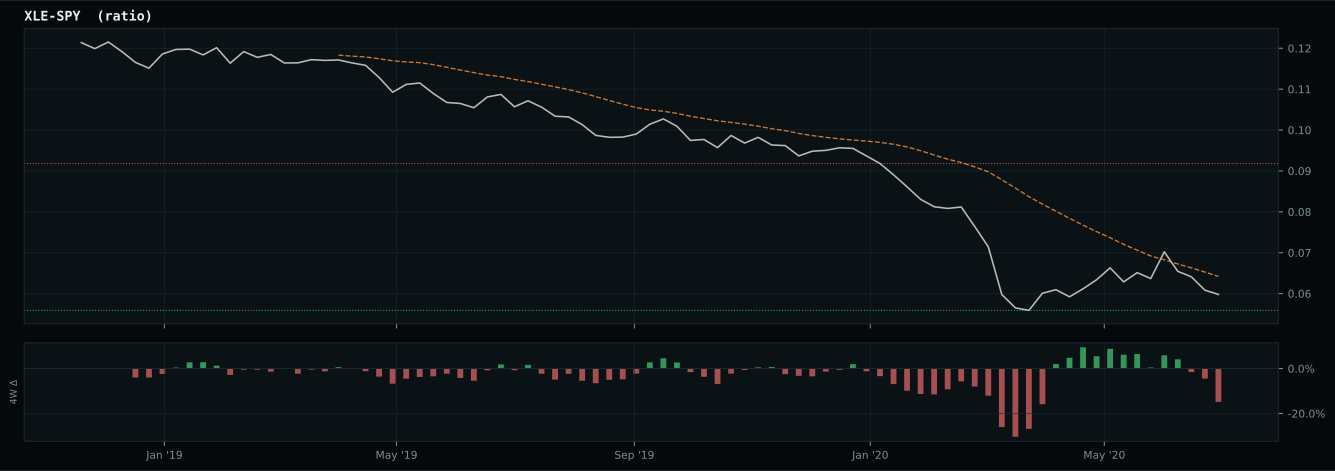
Macro Evidence Charts
Market-implied signals behind the macro regime scores. Each ratio compares two assets; the direction and slope of the ratio is what the macro engine reads.
Crypto Regime — NoCrypto
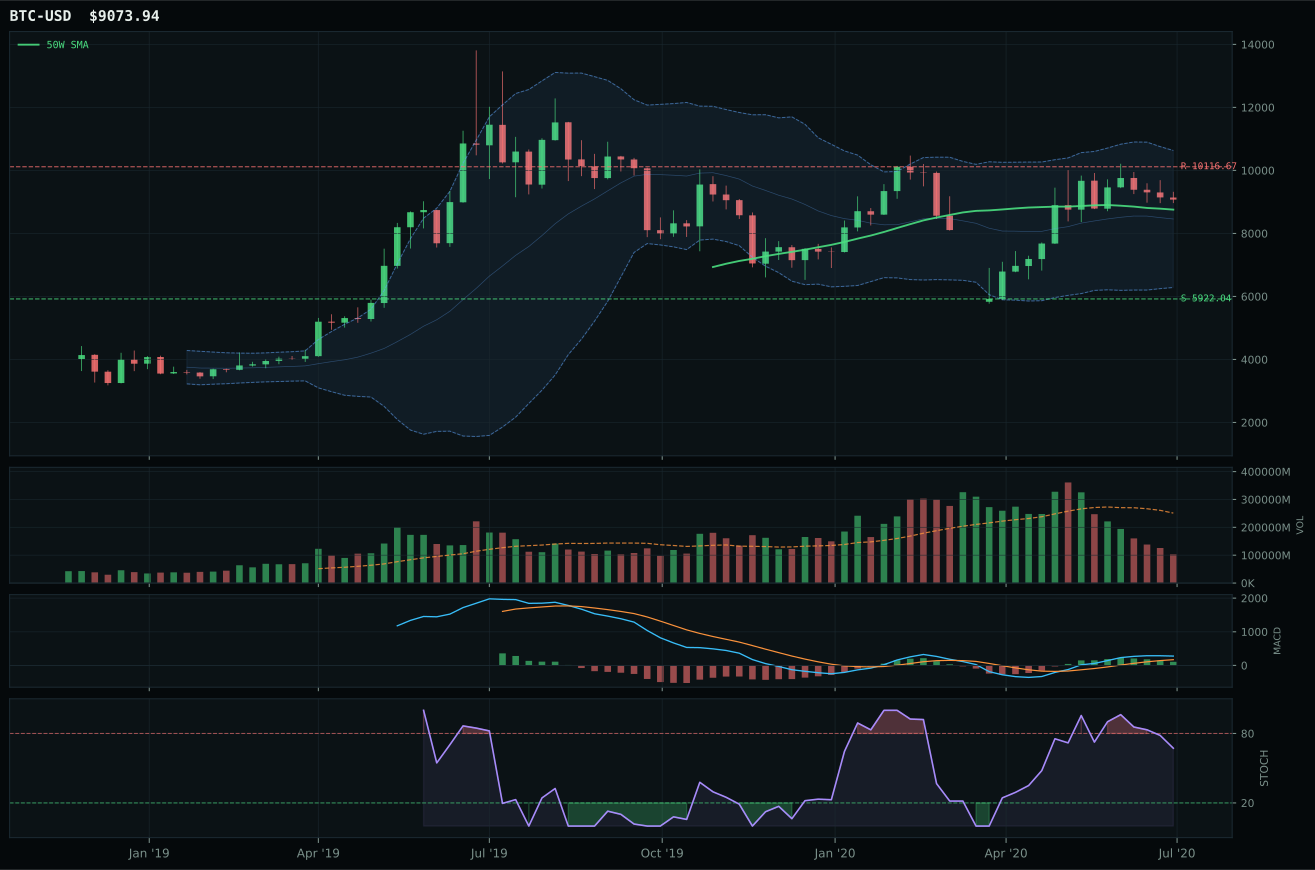
post-touch structure is too wide to count as a range; max/min close ratio is 1.81
TrendBTC not confirmed
one or more available conditions failed

Category Rankings
| Rank | Category | Winner | Score | Alloc | 4W Ret | Peers (4W) |
|---|---|---|---|---|---|---|
| 1 | Technology | IGV | 60.4 | 20% | +1.47% | CIBR +5.0% · XLK +5.0% |
| 2 | AI | SMH | 56.5 | 20% | +7.15% | BOTZ +4.2% · AIQ +3.5% |
| 3 | Precious Metals | GLD | 54.4 | 10% | +10.31% | GDX +15.4% · SLV +32.3% |
| 4 | Defense & Aerospace | XAR | 42.9 | 10% | -2.95% | ITA -6.3% · ROKT -1.1% |
| 5 | Utilities & Infrastructure | XLU | 42.0 | 10% | +4.61% | PAVE +4.1% · IGF +0.2% |
| 6 | Traditional Energy | XLE | 39.0 | 10% | -5.21% | FCG -2.6% · XOP -2.6% |
| 7 | Nuclear Energy | URA | 35.4 | 10% | +3.88% | NLR +2.3% |
| 8 | Industrial Metals | COPX | 34.8 | 10% | +8.11% | PICK +5.9% · REMX +8.6% |
| 9 | Agriculture & Livestock | MOO | 30.1 | 0% | +4.24% | VEGI +4.2% · WEAT +6.1% |
| 10 | Emerging Markets | IEMG | 20.4 | 0% | +1.80% | INDA +2.5% · ILF +1.4% |
Technology — IGV
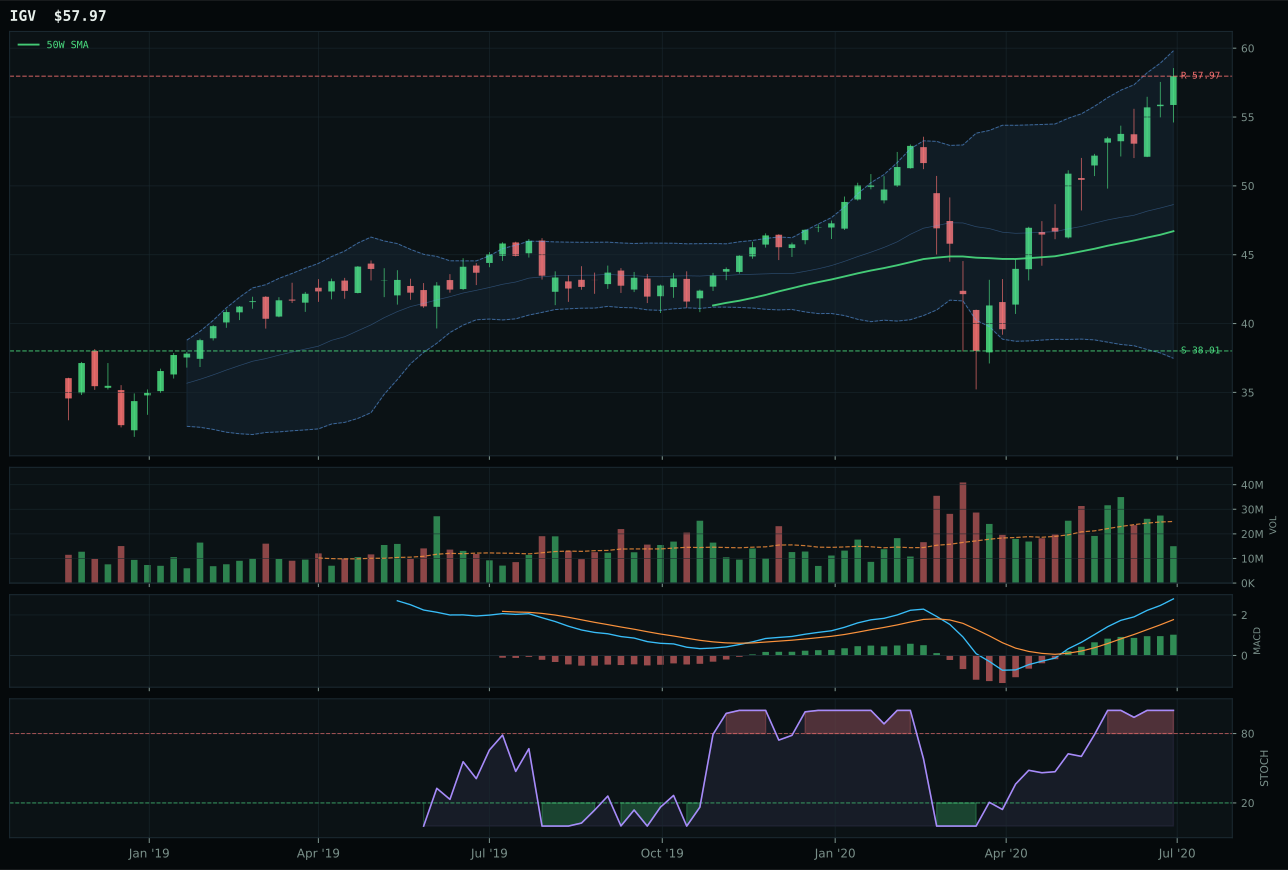
IGV has a vertical extension profile with 20.6% 13-week relative strength versus SPY.
A failed hold above support would weaken the setup.
Actionable but governed by invalidation levels.
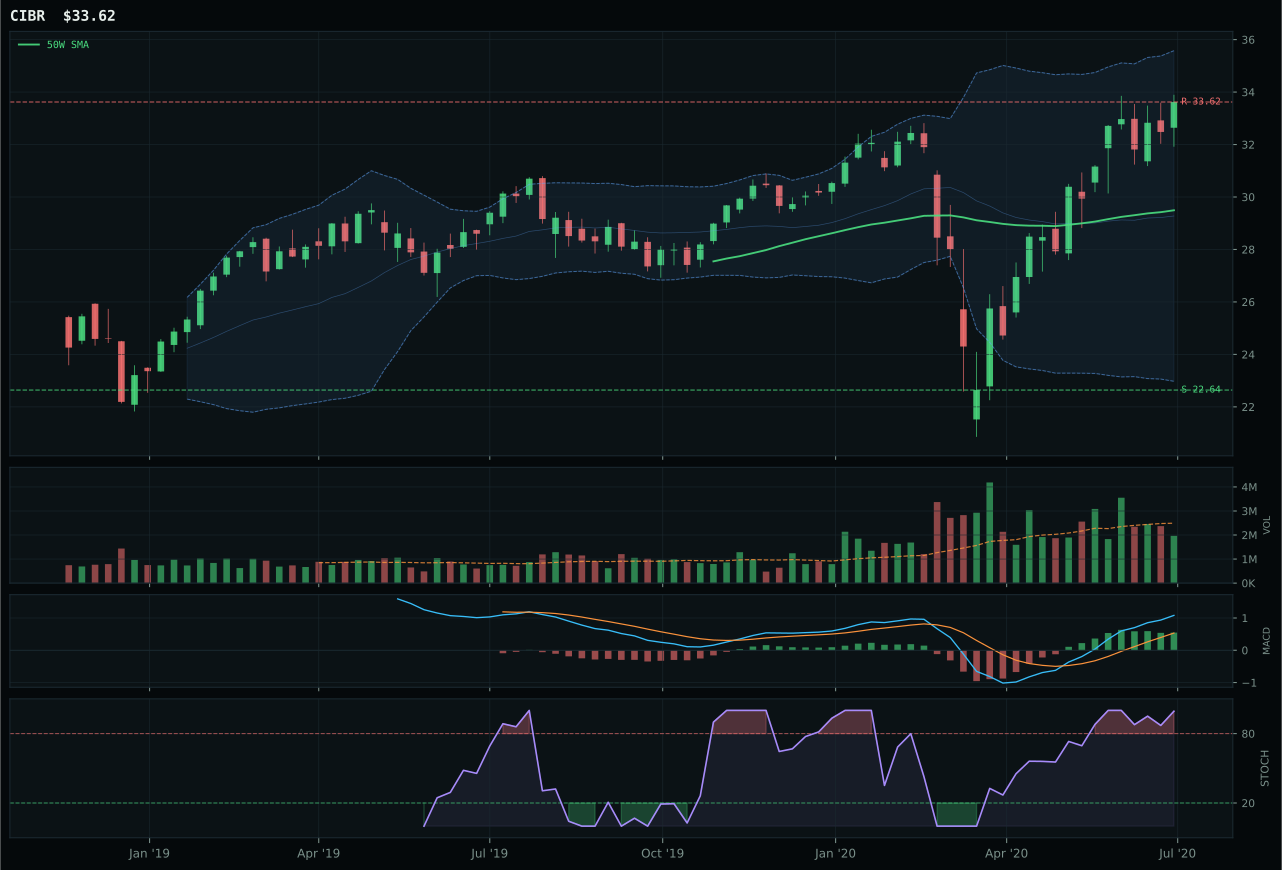
CIBR has a neutral structure profile with 10.2% 13-week relative strength versus SPY.
A failed hold above support would weaken the setup.
Actionable but governed by invalidation levels.
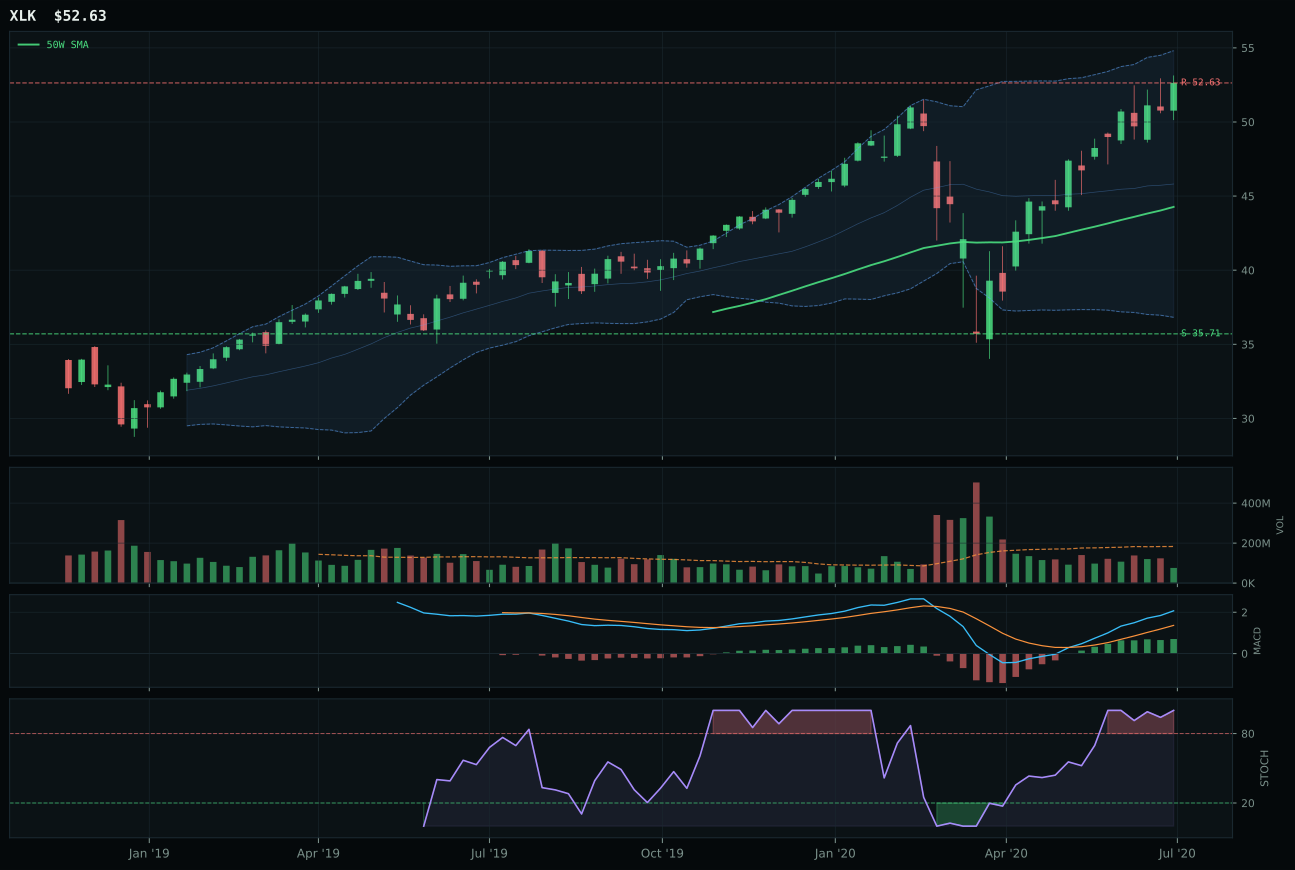
XLK has a vertical extension profile with 10.7% 13-week relative strength versus SPY.
A failed hold above support would weaken the setup.
Actionable but governed by invalidation levels.
IGV captures the Technology category by combining genuine trend strength with the SPY-relative leadership that justifies capital allocation. The 20.6% outperformance versus SPY and the 9.9% edge within its peer basket signal that enterprise software is receiving active accumulation rather than passive drift; MACD is bullish and improving while the stochastic RSI sits at 1.00, meaning the move has conviction behind it. CIBR—the runner-up—lost ground because its MACD is flattening and its category-relative strength has actually turned negative, a technical deterioration that the market is quietly pricing in. The setup is vertically extended 24.1% above the 50W, which normally argues for caution, but the 46.4% thirteen-week return and near-perfect momentum confirmation override timing risk when volume participation is present and the move is being proven rather than abandoned.
Technology earned its 20% slot as the highest-ranked category because the late-cycle reflation regime is actively sponsoring AI growth and risk appetite, and IGV's technical evidence (71.9/100) anchors a basket that trades on fundamental strength rather than speculation. The category scores 60.4 because the macro tailwinds—risk appetite positive at +9 and AI sponsorship at +6—are offset by active credit and liquidity stress, creating a environment where investors are rotating toward profitable compounders like enterprise software. Two competing vectors matter: the near-52W-high extension creates entry friction for new buyers, but the absolute momentum and relative strength prove that the money already committed is not rotating away. This is a category that works in early reflation precisely because duration-sensitive growth benefits from stable rates and margin expansion, not from a crash in rates or a flight to quality.
AI — SMH
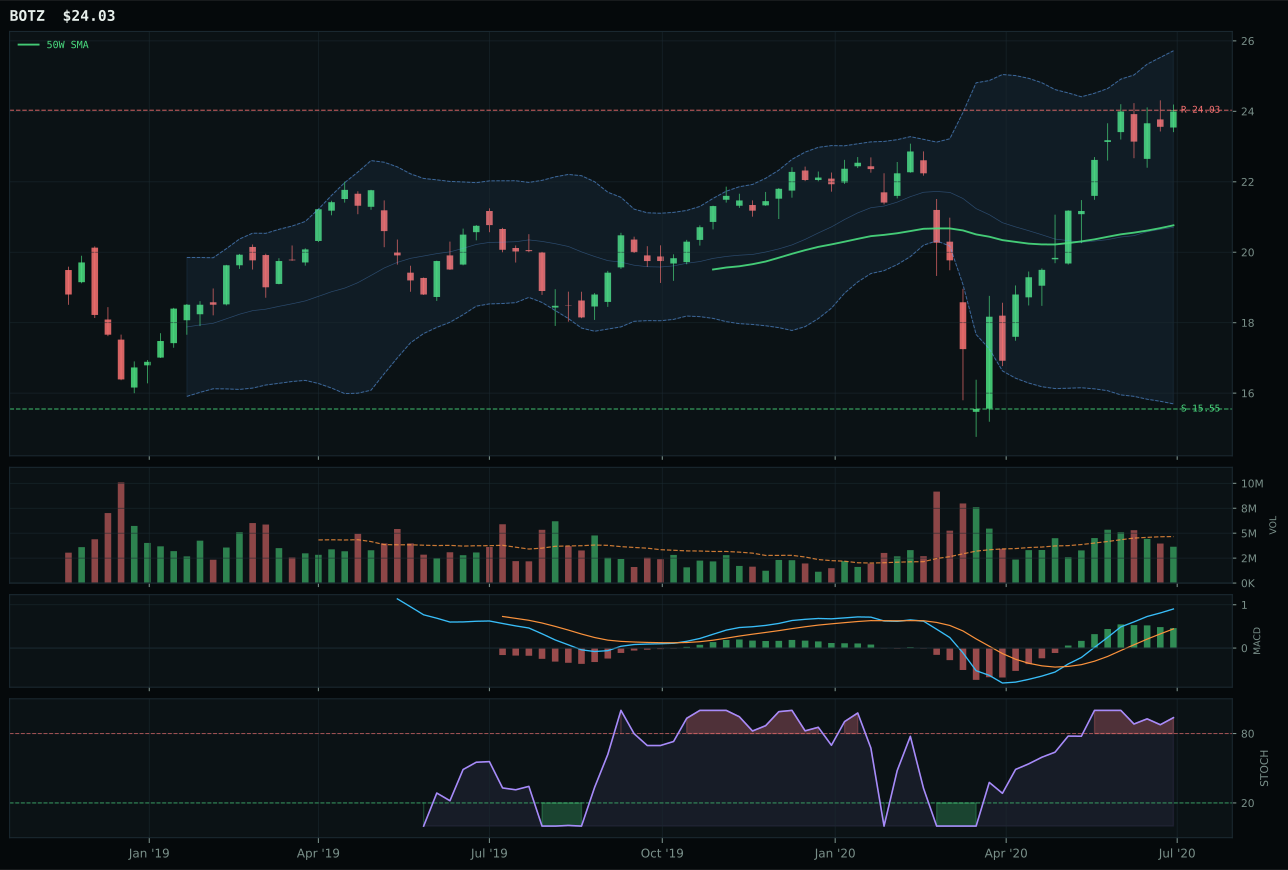
BOTZ has a vertical extension profile with 16.2% 13-week relative strength versus SPY.
A failed hold above support would weaken the setup.
Actionable but governed by invalidation levels.
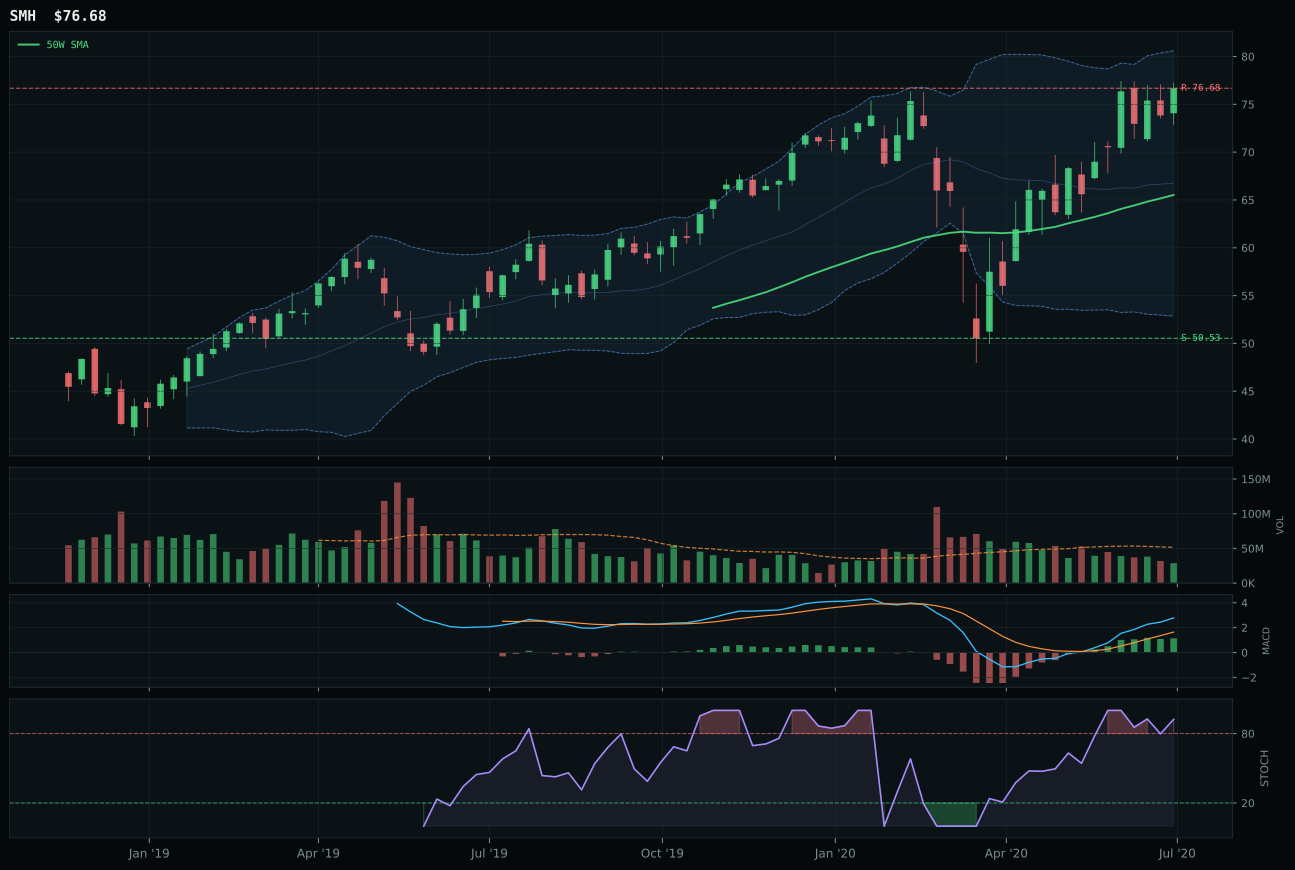
SMH has a vertical extension profile with 11.1% 13-week relative strength versus SPY.
A failed hold above support would weaken the setup.
Actionable but governed by invalidation levels.
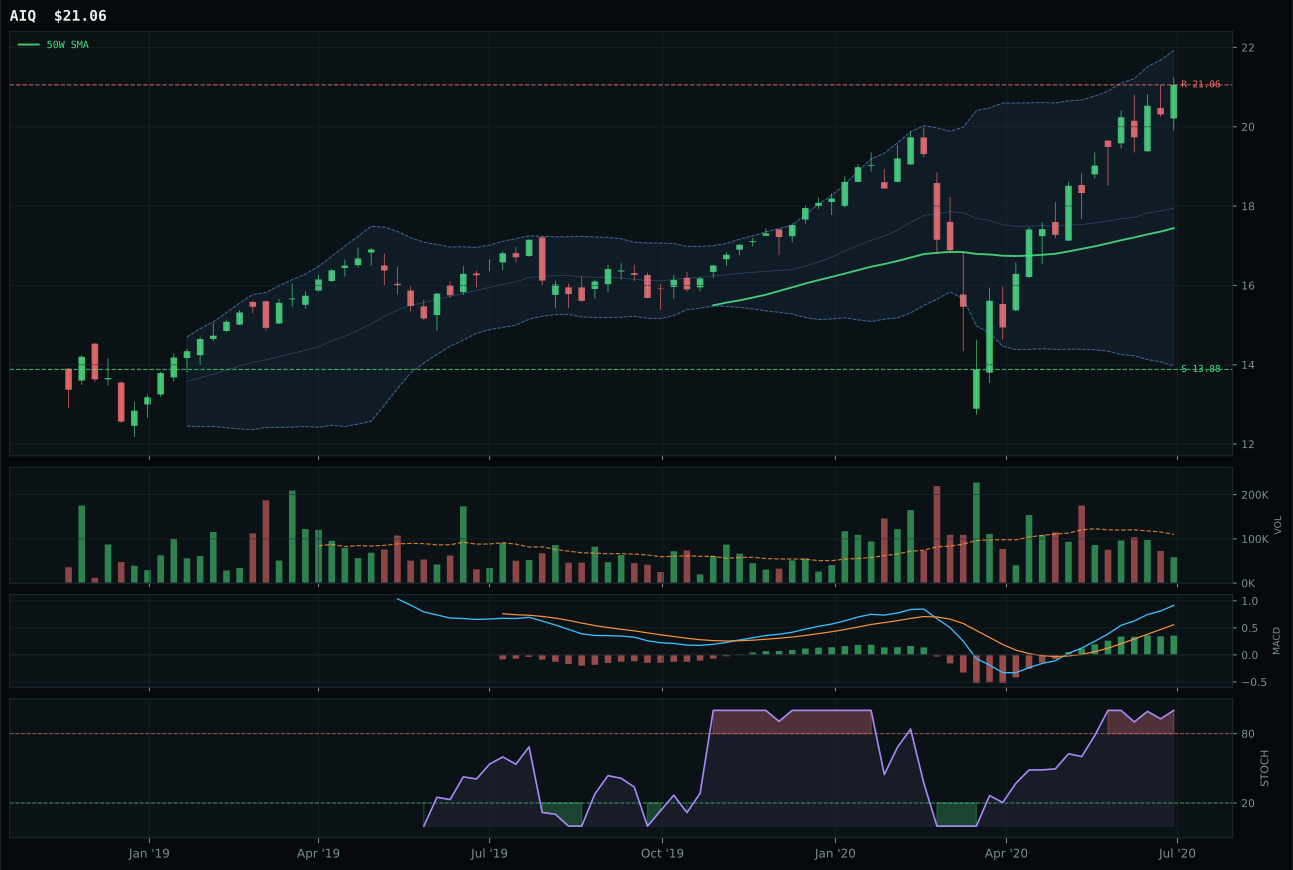
AIQ has a vertical extension profile with 15.1% 13-week relative strength versus SPY.
A failed hold above support would weaken the setup.
Tracked, but not top-2 eligible because: .
SMH wins the AI category by delivering cleaner trend confirmation than BOTZ despite a lower raw momentum score, a classic case where execution quality beats raw velocity. The semiconductor basket's 11.1% outperformance versus SPY and bullish-and-improving MACD stand in sharp contrast to BOTZ's flattening MACD and weaker timing score (32 vs 37), signaling that SMH holders are accumulating through strength while BOTZ buyers are beginning to hesitate. Both trade at 17-36% extensions from their respective 50-week averages, placing them in dangerous real estate, but SMH's volume-price sponsorship (71.1/100) and persistence (79.4/100) demonstrate that the recent wave is attracting fresh capital rather than exhausting early birds. The thirteen-week return spread (36.9% for SMH versus 42.0% for BOTZ) reveals that robotics and AI hardware had a sharper impulse but less durable accumulation—a divergence that technical deterioration in BOTZ's MACD made impossible to ignore.
AI claimed its 20% allocation as the second-highest category score (56.5) because the macro regime is explicitly sponsoring AI growth sponsorship (+14 points) and risk appetite is active (+10), creating a tailwind that no other category receives. SMH's 67.0 reasoned score and the basket's 54-point macro fit advantage over precious metals speaks to a market that is fundamentally repricing artificial intelligence as late-cycle capex, not as speculative froth. Yet the category's score of 56.5 trails Technology (60.4) because category-level momentum confirmation is weaker—the thirteen-week return spread within the AI basket shows inconsistency, and category-relative strength for SMH is actually negative at -4.1%, meaning the sector is outperforming SPY but lagging its own median. The allocation holds at 20% because AI infrastructure remains the highest-conviction narrative in late reflation, but the technical subordination to Technology signals that semiconductor leadership is narrower and more fragile than software durability.
Precious Metals — GLD
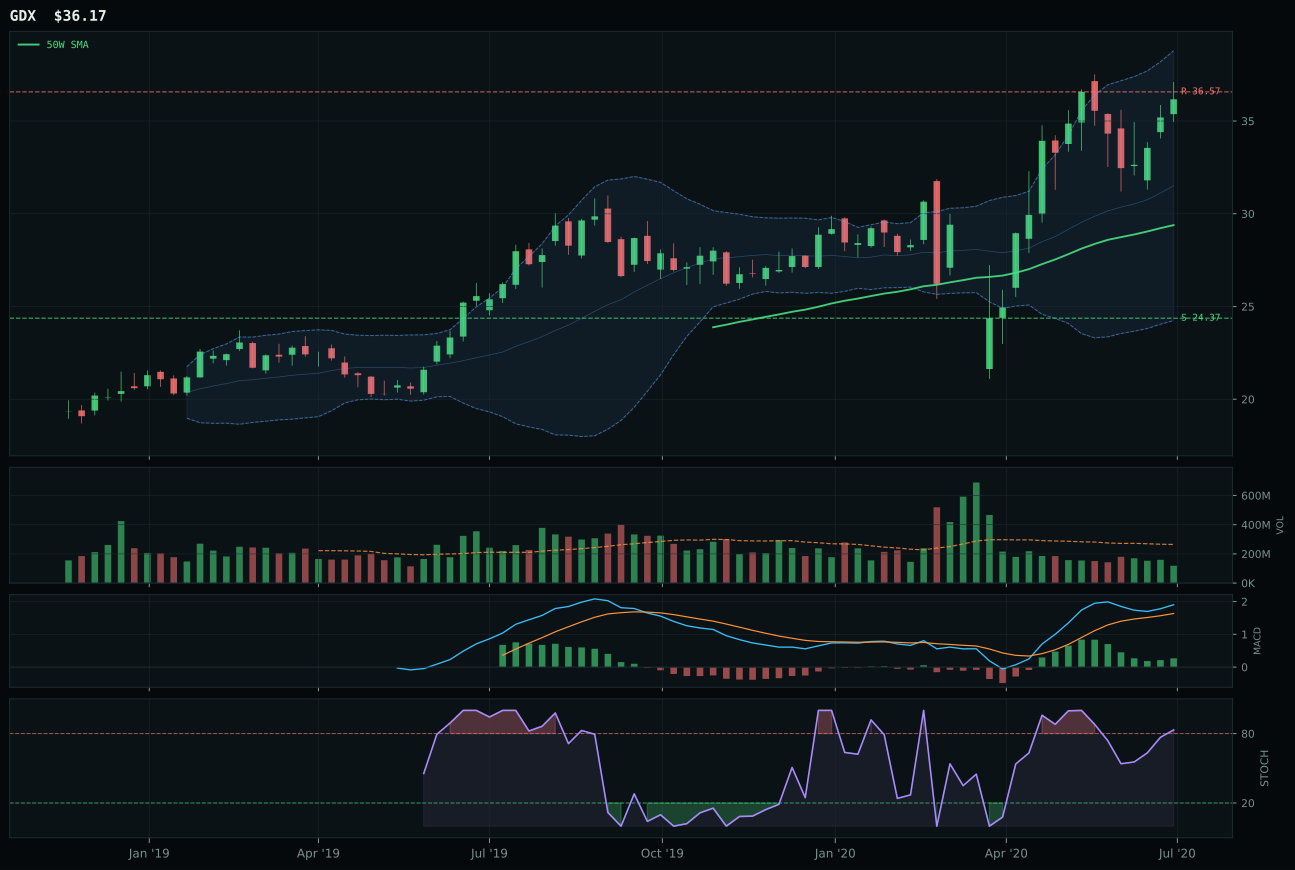
GDX has a vertical extension profile with 19.2% 13-week relative strength versus SPY.
A failed hold above support would weaken the setup.
Actionable but governed by invalidation levels.
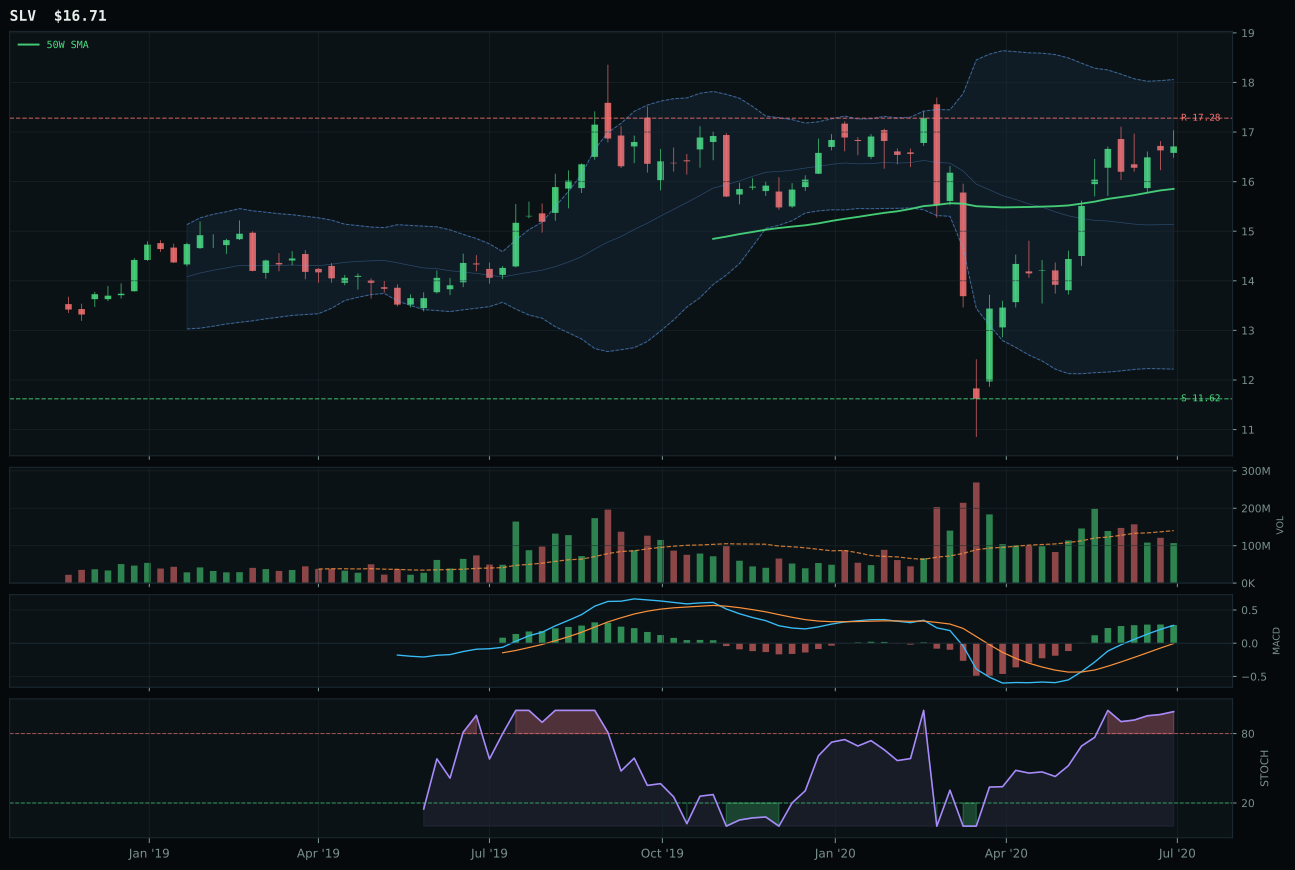
SLV has a neutral structure profile with -1.7% 13-week relative strength versus SPY.
A failed hold above support would weaken the setup.
Actionable but governed by invalidation levels.
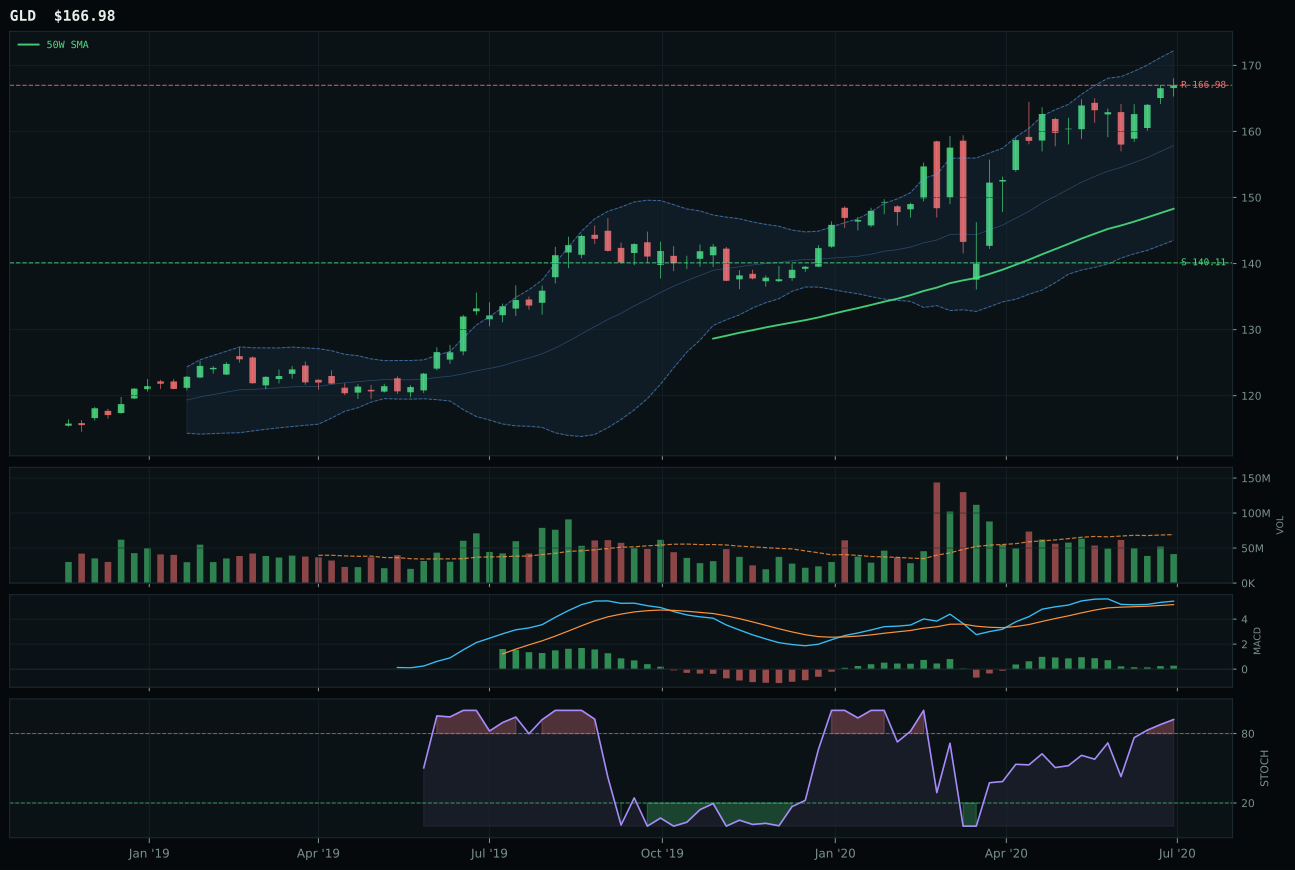
GLD has a neutral structure profile with -16.4% 13-week relative strength versus SPY.
A failed hold above support would weaken the setup.
Actionable but governed by invalidation levels.
GLD wins Precious Metals by offering the cleanest structure (73.4) and the most sustainable MACD confirmation (bullish and improving) among a basket where relative strength is universally weak and momentum is shallow. GDX carries a 2.8-point technical score advantage but loses the category decision because its timing is worse (32 vs 59), its MACD is flattening rather than improving, and its 24.6% extension from the 50W creates worse entry risk than GLD's 12.6% pullback; gold miners have outperformed raw gold by 19.2% on thirteen-week basis, but the deteriorating MACD and stochastic RSI rolling over signal that the outperformance is exhausting. SLV sits in third place with neutral structure and solid momentum confirmation, yet neither the broad silver ETF nor the miner leverage can overcome GLD's timing advantage when all three trade with negative SPY-relative returns and weak category-wide sponsorship. The entire precious metals basket is driven by macro hedging, not by technical accumulation—a structural difference that makes timing and structure the only differentiators.
Precious Metals earned 10% allocation because risk-appetite-positive is active but at the margin (-4 points), creating a fragile environment where inflation hedges and safe-haven rallies make sense tactically but lack conviction. GLD's 46.1 technical score paired with 46.0 macro fit results in a category score of 54.4—respectable but trailing Technology, AI, and even Defense in absolute quality. The allocation holds because the macro regime is reflation (which argues against gold but in favor of commodity inflation hedges), yet the -16.4% SPY-relative performance reveals that gold is underperforming as equities rally, a dynamic that will reverse sharply if credit stress or liquidity stress intensifies. This is a protective sleeve that makes sense as portfolio insurance but cannot drive returns in a late-cycle risk-on environment; expect it to work best in the transition phases between regimes, not in sustained reflation.
Defense & Aerospace — XAR
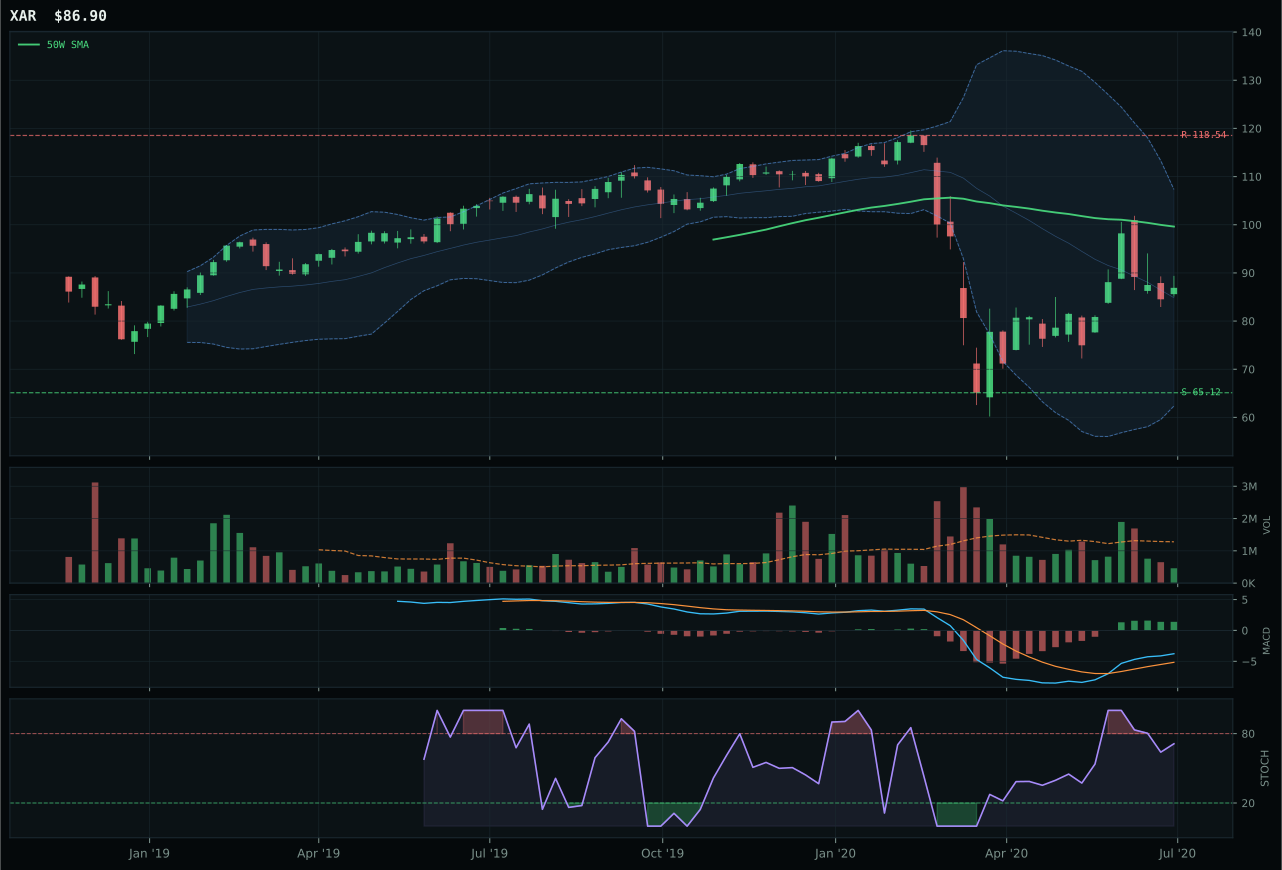
XAR has a neutral structure profile with -3.7% 13-week relative strength versus SPY.
A failed hold above support would weaken the setup.
Actionable but governed by invalidation levels.
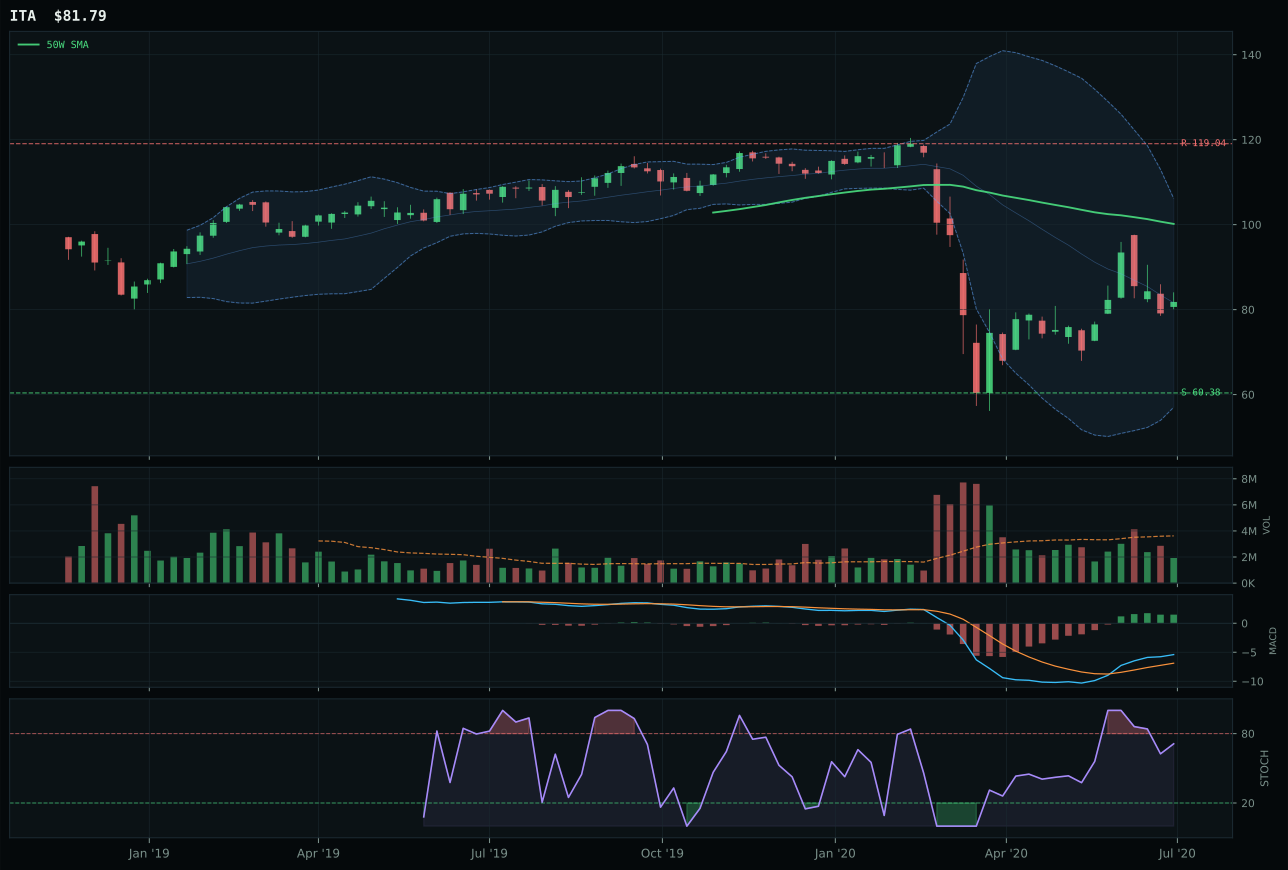
ITA has a neutral structure profile with -5.4% 13-week relative strength versus SPY.
A failed hold above support would weaken the setup.
Actionable but governed by invalidation levels.
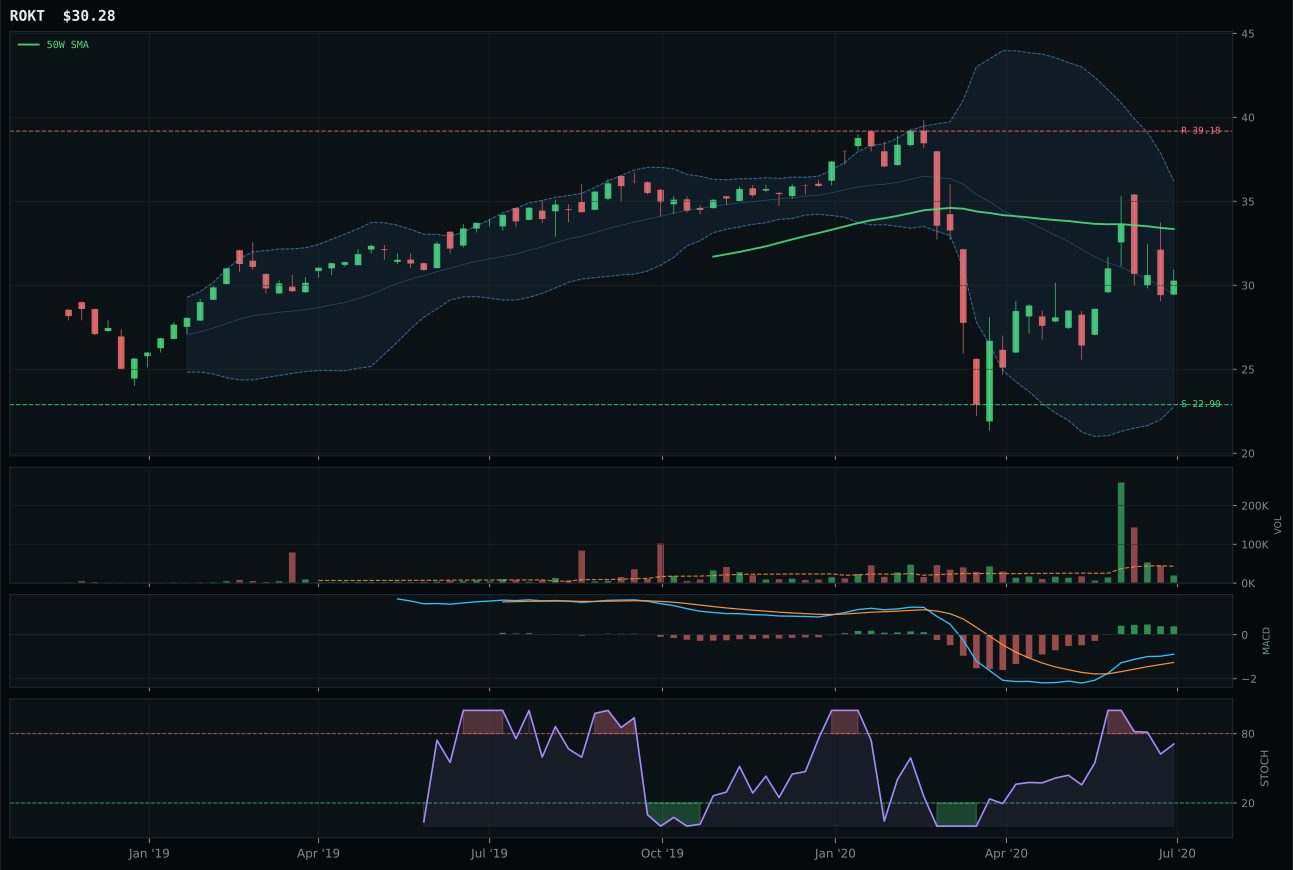
ROKT has a neutral structure profile with -5.2% 13-week relative strength versus SPY.
A failed hold above support would weaken the setup.
Tracked, but not top-2 eligible because: .
XAR wins the Defense category despite sitting below its 50-week moving average because its timing score (62.0) reflects a coiled retracement setup near the 50% Fibonacci level with MACD bullish and improving—the setup for mean-reversion entry rather than trend-following capitulation. ITA trails by 15 points because its structure is slightly less clean (66.1 vs 65.8) and its category-relative strength turned negative, but the real separator is that XAR's -12.8% pullback from the 50W provided better risk-reward than ITA's more extended position. Both ETFs sit in the middle decision zone with falling-neutral stochastic RSI, which is appropriate for a sector that has sold off sharply; XAR's 22.1% thirteen-week return proves the sector has not collapsed, but volume is thin (0.36x the twenty-week average), indicating conviction is not yet returning. The narrow -3.7% SPY-relative performance and thin participation mean this is a recovery trade waiting for confirmation, not a leadership narrative.
Defense & Aerospace earned a 10% allocation despite a mid-tier final score (42.9) because it holds eligibility and represents genuine late-cycle reflation support; the macro fit (57.0/100) indicates that geopolitical risk and defense spending are active themes. However, the category ranks below Technology, AI, and Precious Metals because technical evidence is weak (61.8/100 for XAR) and category-level momentum confirmation is shallow—the thirteen-week return of 22.1% is solid, but the -3.7% SPY-relative performance means the sector is entirely dependent on broader market lift, not sector-specific buying. The allocation would collapse if XAR breaks support at 65.12 or if the broader market enters a correction, because there is no independent momentum to cushion drawdowns. This is a defensive-value sleeve within a growth-heavy portfolio, justified by diversification and macro hedging rather than by standalone technical or relative strength arguments.
Utilities & Infrastructure — XLU
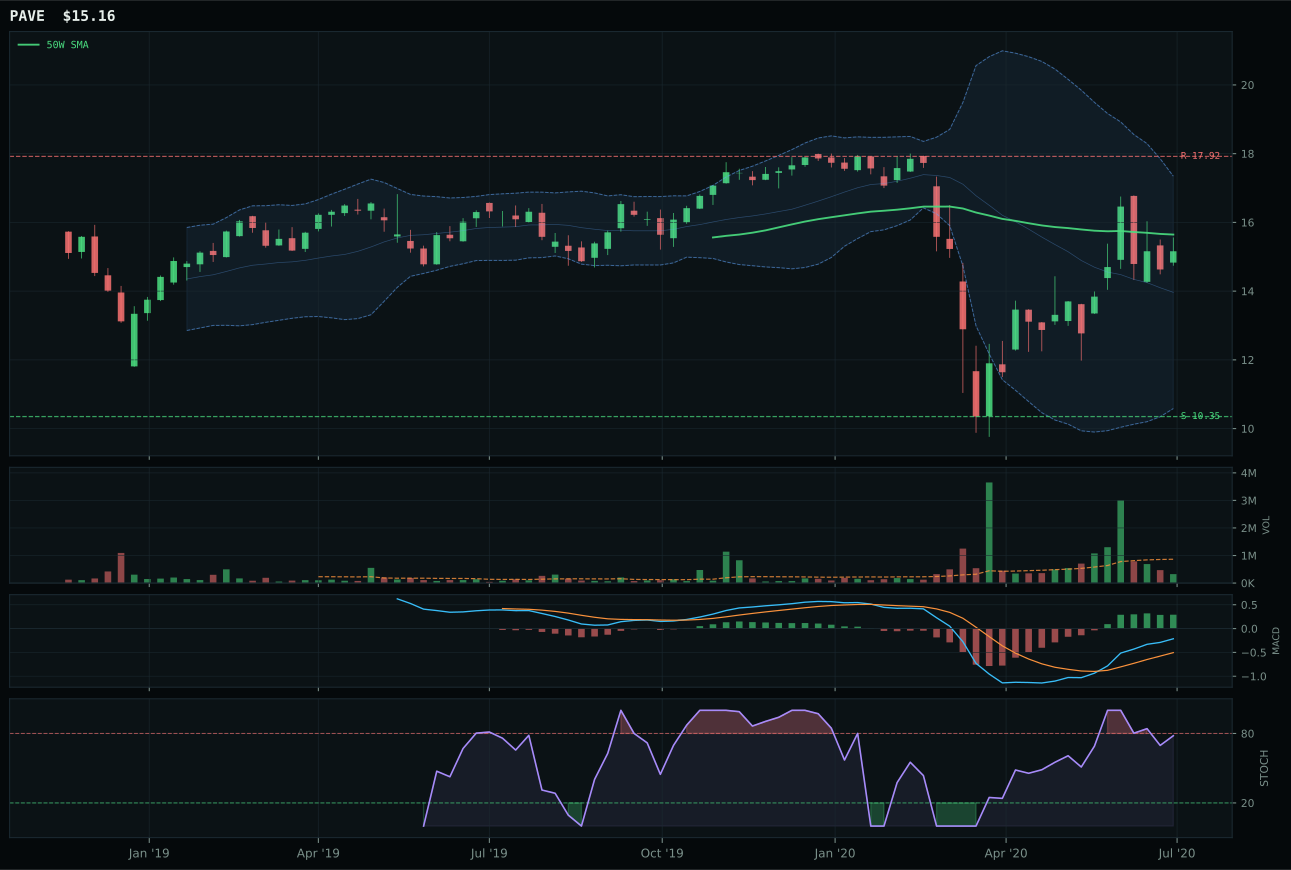
PAVE has a neutral structure profile with 4.4% 13-week relative strength versus SPY.
A failed hold above support would weaken the setup.
Actionable but governed by invalidation levels.
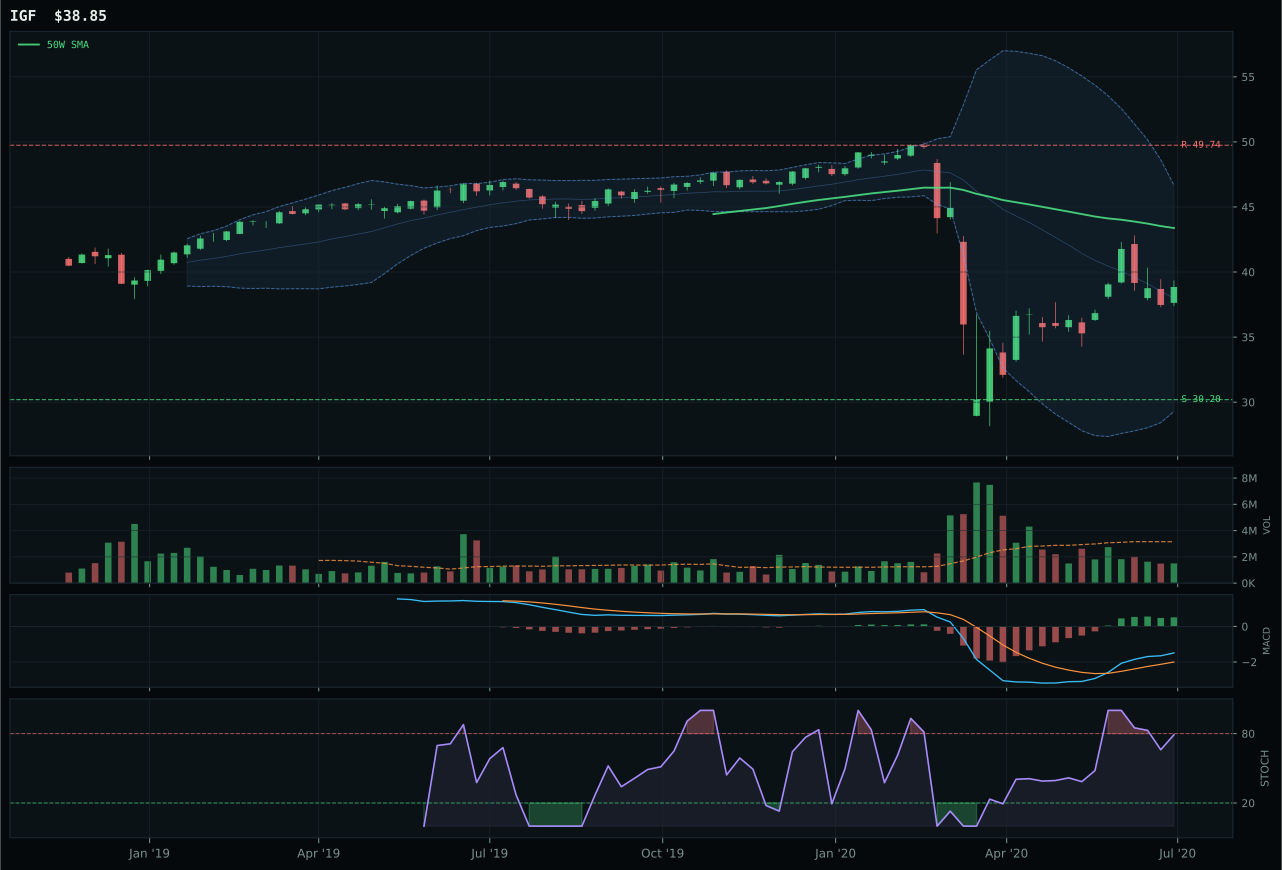
IGF has a neutral structure profile with -4.8% 13-week relative strength versus SPY.
A failed hold above support would weaken the setup.
Actionable but governed by invalidation levels.
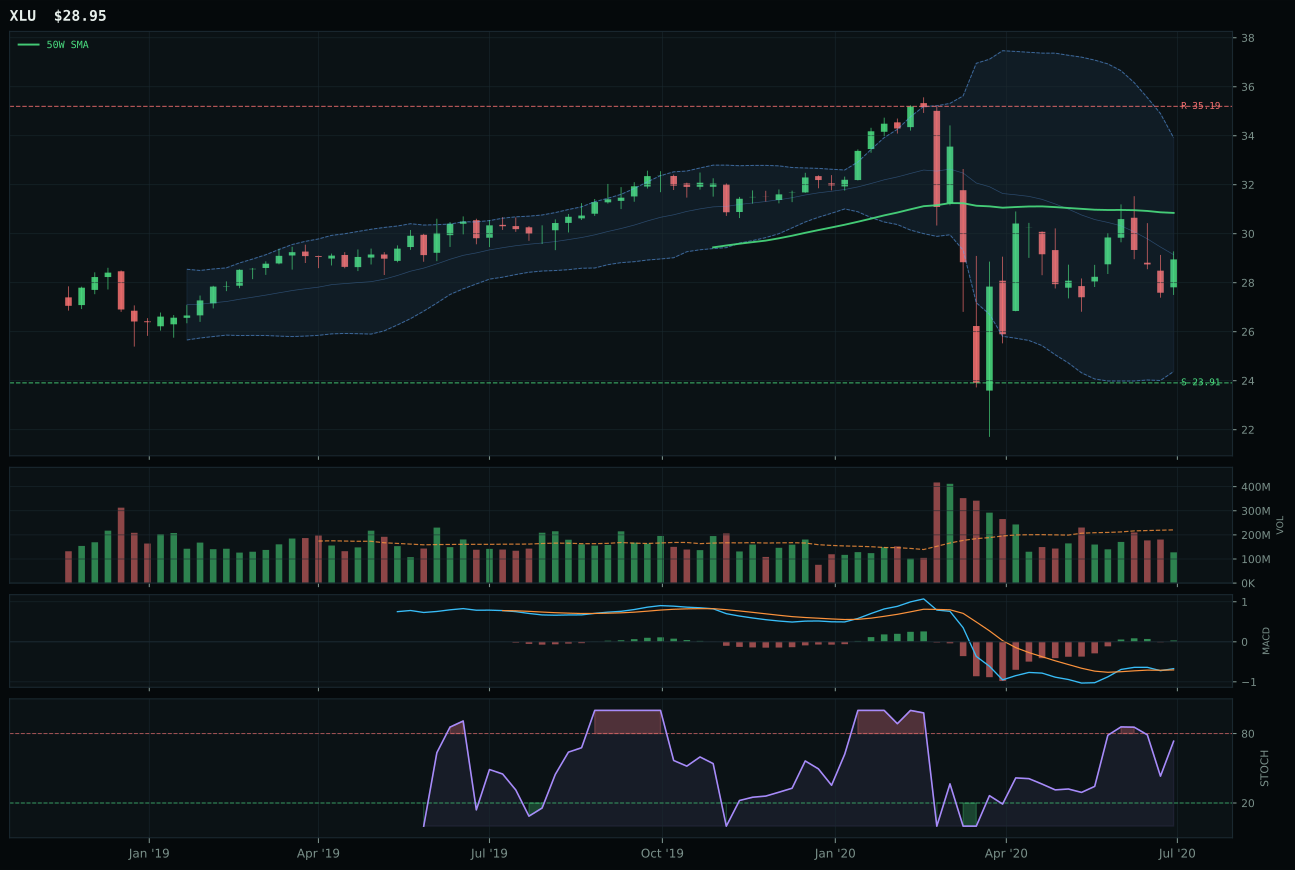
XLU has a neutral structure profile with -14.0% 13-week relative strength versus SPY.
A failed hold above support would weaken the setup.
Actionable but governed by invalidation levels.
XLU wins Utilities by owning the best risk-reward (68.2) in a basket of defensive equities that all underperformed broadly; XLU's -6.2% pullback from the 50W sits in the middle Fibonacci decision zone with timing score 77.0, placing it in reset territory that defensive buyers typically use as entry. PAVE trails despite superior technical evidence (74.8 vs 39.1 for XLU) because its risk-reward (36.0) is inferior and its 30.2% thirteen-week outperformance has already extracted the 'infrastructure beta' narrative gain; when broad-based market exposure outperforms defensive exposure, defensive names need clean pullbacks to become attractive, not fresh highs. IGF ranks third with a 54.1 score, offering middle-ground structure but lacking the tight pullback setup that XLU provides or the momentum that PAVE captured. The thirteen-week returns (XLU 11.8%, PAVE 30.2%, IGF 21.0%) reveal that infrastructure already had its run while regulated utilities have lagged, a divergence that makes XLU the only candidate with realistic entry risk-reward at this point in the cycle.
Utilities & Infrastructure earned 10% allocation at 42.0 category score because it represents the portfolio's explicit defensive positioning and because the macro fit (43.0/100) is neutral rather than harmful—inflation pressure is a headwind (-6) but late-cycle transition support and real asset sponsorship offset some downside. However, the category ranks seventh among eight allocations (only Emerging Markets scores lower), revealing that utilities are not conviction positions but rather portfolio ballast for drawdown protection. XLU's technical evidence of 39.1/100 is weak, with zero momentum confirmation and the thirteen-week return of 11.8% running at less than one-third the SPY pace; this is explicit underperformance by design. The allocation holds because portfolio theory demands defensive positioning in late-cycle reflation, even when those defenses are outperforming sideways rather than upward. Utilities will prove valuable only in recession or in a sharp correction; in continuation of current reflation, expect this sleeve to be a drag on absolute returns. The position would migrate toward zero if the macro regime shifted toward confirmed sustained growth without inflation concerns.
Traditional Energy — XLE
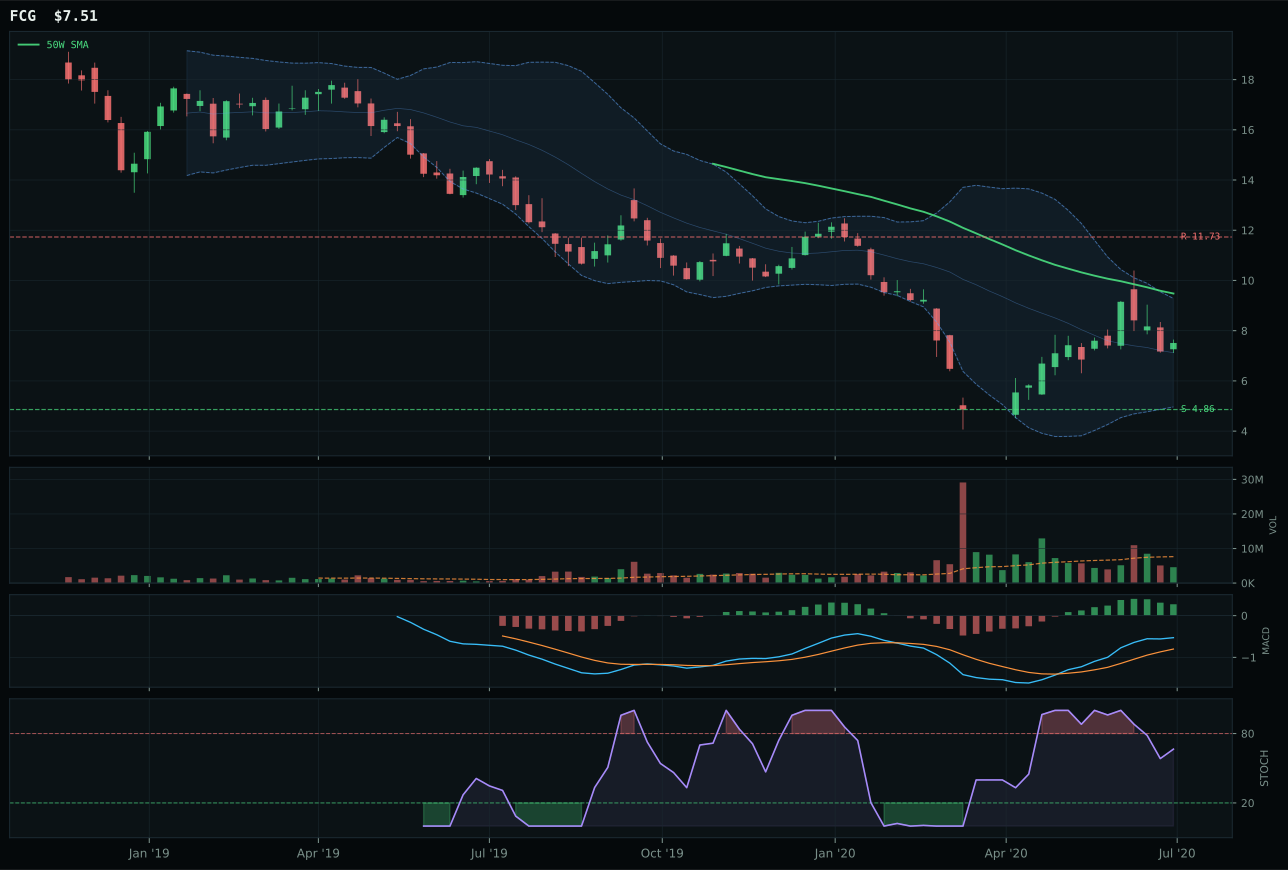
FCG has a neutral structure profile with 37.1% 13-week relative strength versus SPY.
Extension and support failure are the main tactical risks.
Tracked, but not top-2 eligible because: structurally broken.
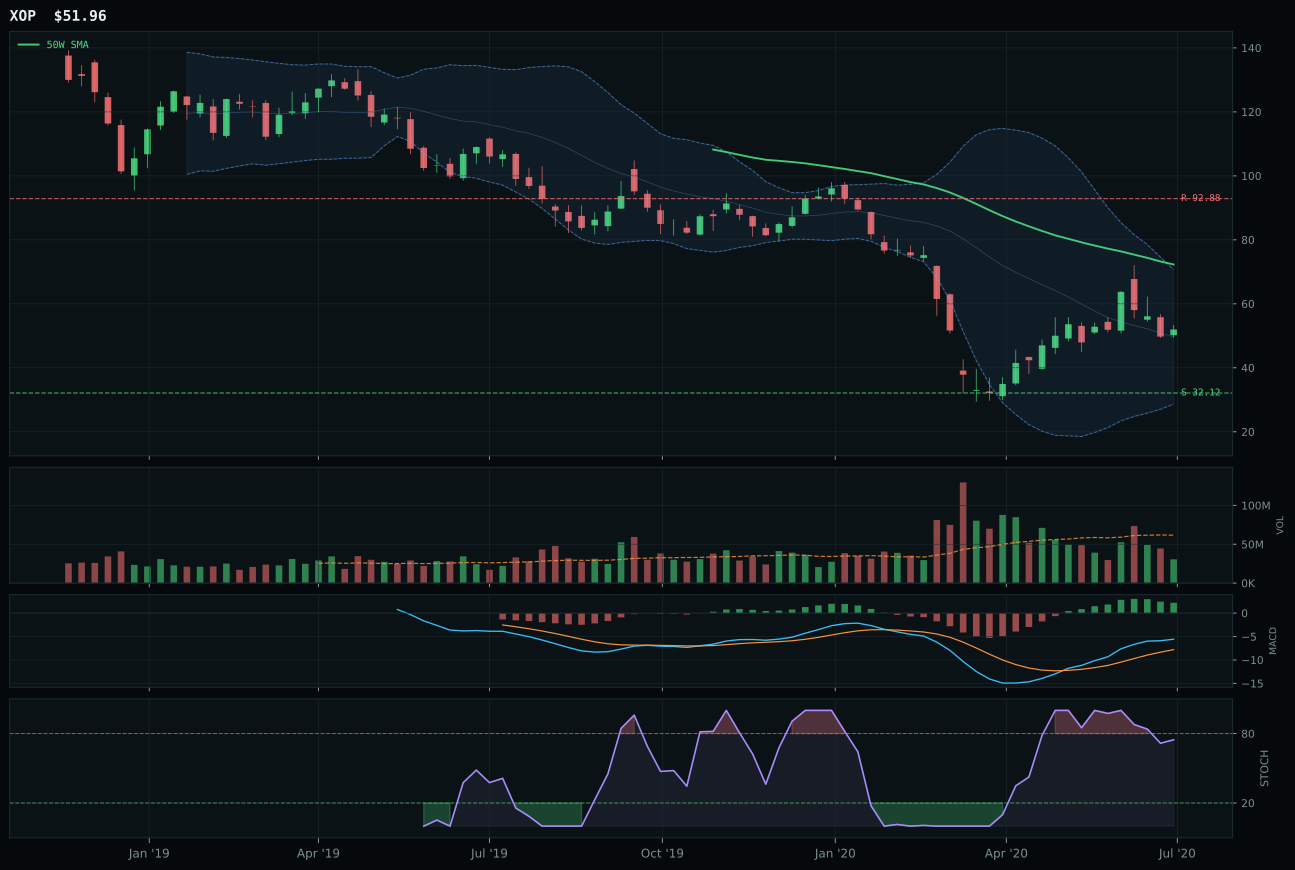
XOP has a neutral structure profile with 23.0% 13-week relative strength versus SPY.
Extension and support failure are the main tactical risks.
Tracked, but not top-2 eligible because: structurally broken.
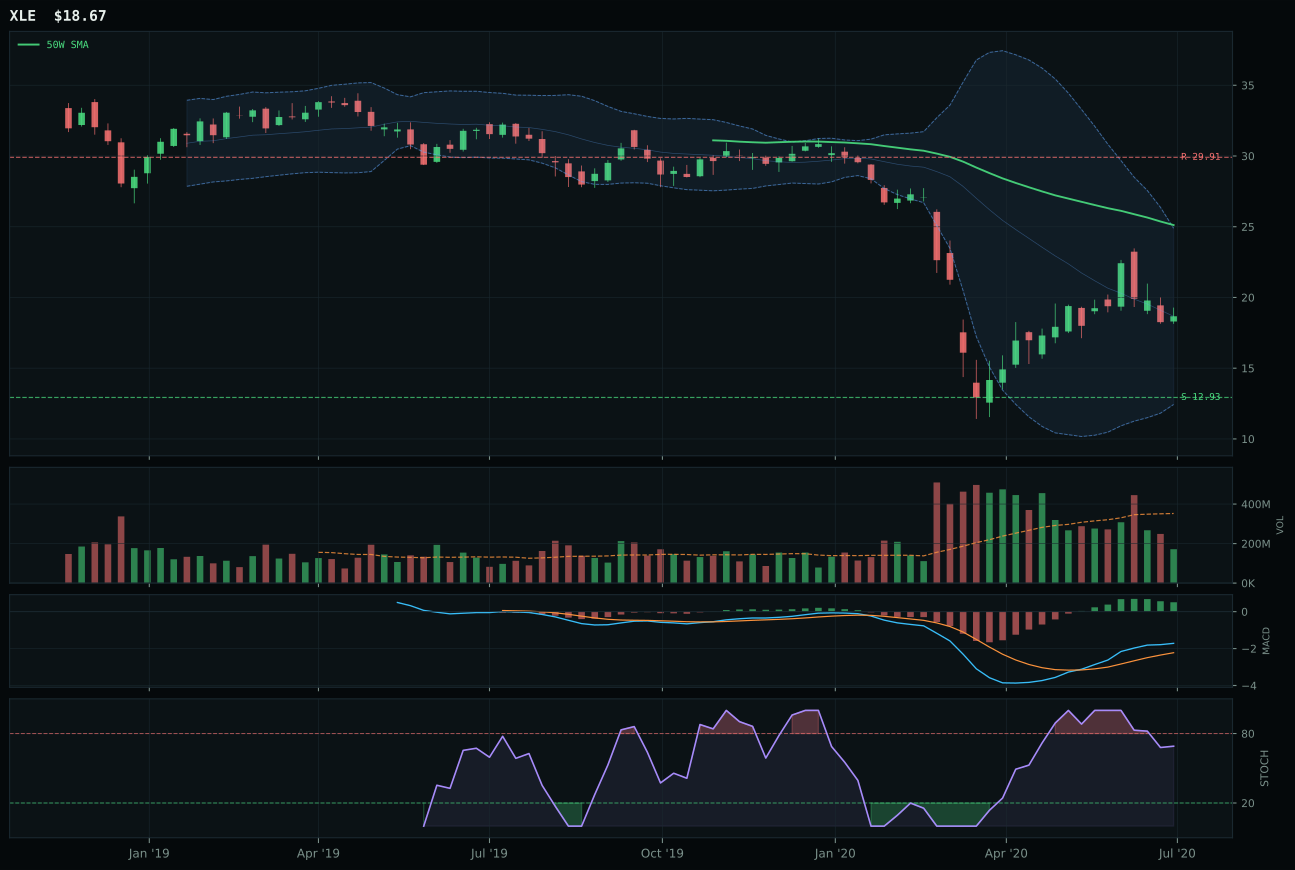
XLE has a neutral structure profile with -0.6% 13-week relative strength versus SPY.
Extension and support failure are the main tactical risks.
Tracked, but not top-2 eligible because: structurally broken.
XLE wins Traditional Energy by defaulting to the least damaged setup in a category where all three ETFs are structurally broken—a Pyrrhic victory in a sector facing secular headwinds. XLE sits -25.7% below its 50W, well into the deep retracement value zone near the 61.8% Fibonacci level, with MACD bullish-but-flattening and stochastic RSI falling, all classic signs of capitulation that precedes recoveries in oversold markets. FCG and XOP both show stronger momentum (62.9% and 48.8% thirteen-week returns respectively) but worse risk-reward and weaker technical structure; XLE's -16.7% four-week return and category-negative -23.6% relative strength paint a sector that is broken and still breaking, yet that extreme weakness is what allows it to win by default. The 0.49x volume participation indicates that panic selling has exhausted retail buyers, leaving only institutional demand at depressed valuations. This is a turnaround candidate, not a momentum play, and the category's macro fit (79.0/100) depends entirely on energy scarcity narrative holding.
Traditional Energy earned 10% allocation despite failing eligibility filters because the macro tailwinds—energy scarcity (+16), inflation pressure (+10), and real asset sponsorship (+7)—are too strong to ignore in a late-cycle reflation. The category score of 39.0 is the second-lowest in the portfolio, yet the 81.0/100 macro fit is the highest across all ten categories, creating an extraordinary tension between technical weakness and fundamental conviction. This allocation exists purely as a reflation bet on supply constraints and energy demand acceleration; it has no technical momentum and significant reverse risk if the growth narrative breaks or if alternative energy accelerates. The portfolio is structurally long energy as a reflation hedge, not because the charts are clean—they are not. This is a conviction-driven allocation that will test patience through further downside before any recovery attempt. The 10% slot would compress or vanish if energy prices begin to weaken from current levels, because the technical setup offers no support for a durable bounce.
Nuclear Energy — URA
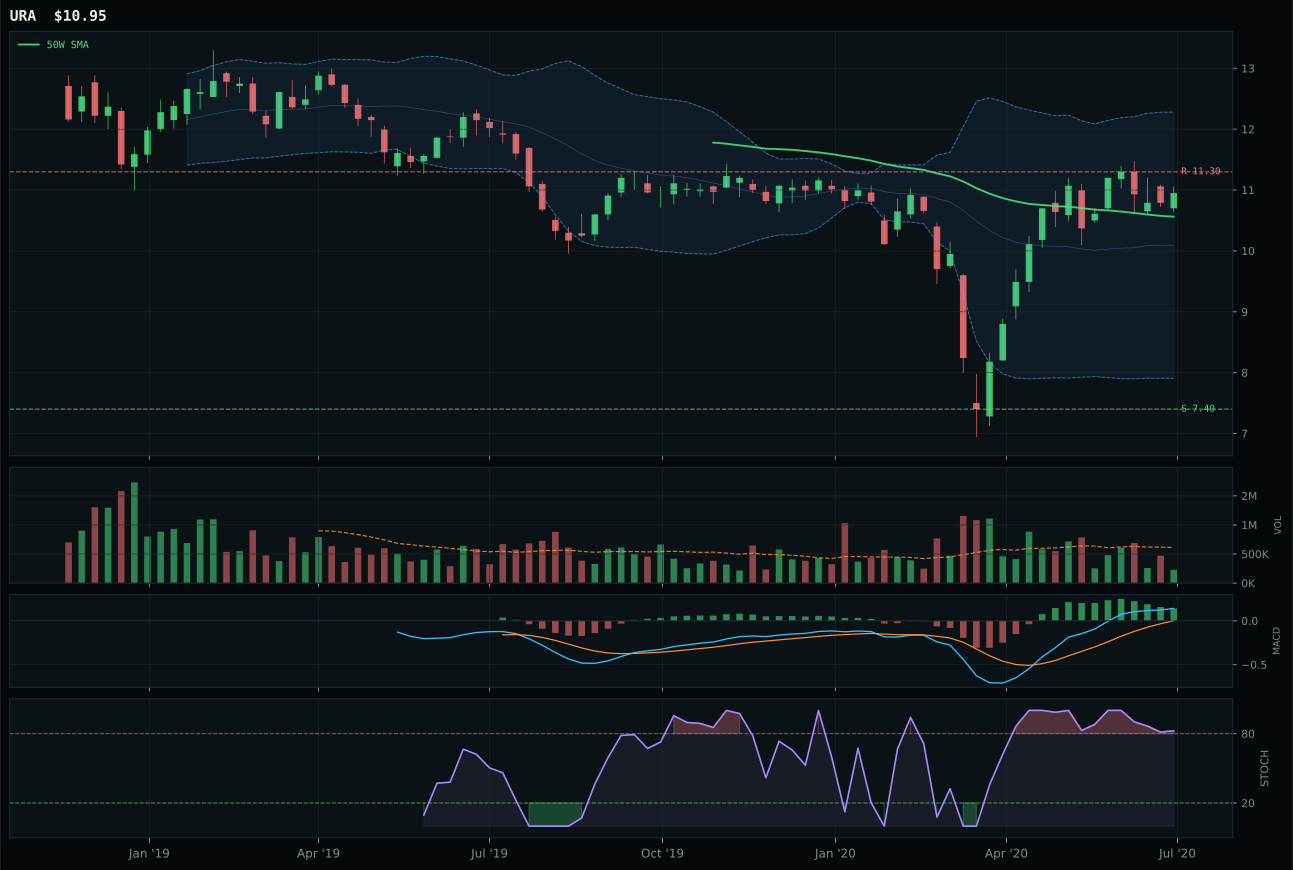
URA has a neutral structure profile with -1.4% 13-week relative strength versus SPY.
A failed hold above support would weaken the setup.
Tracked, but not top-2 eligible because: .
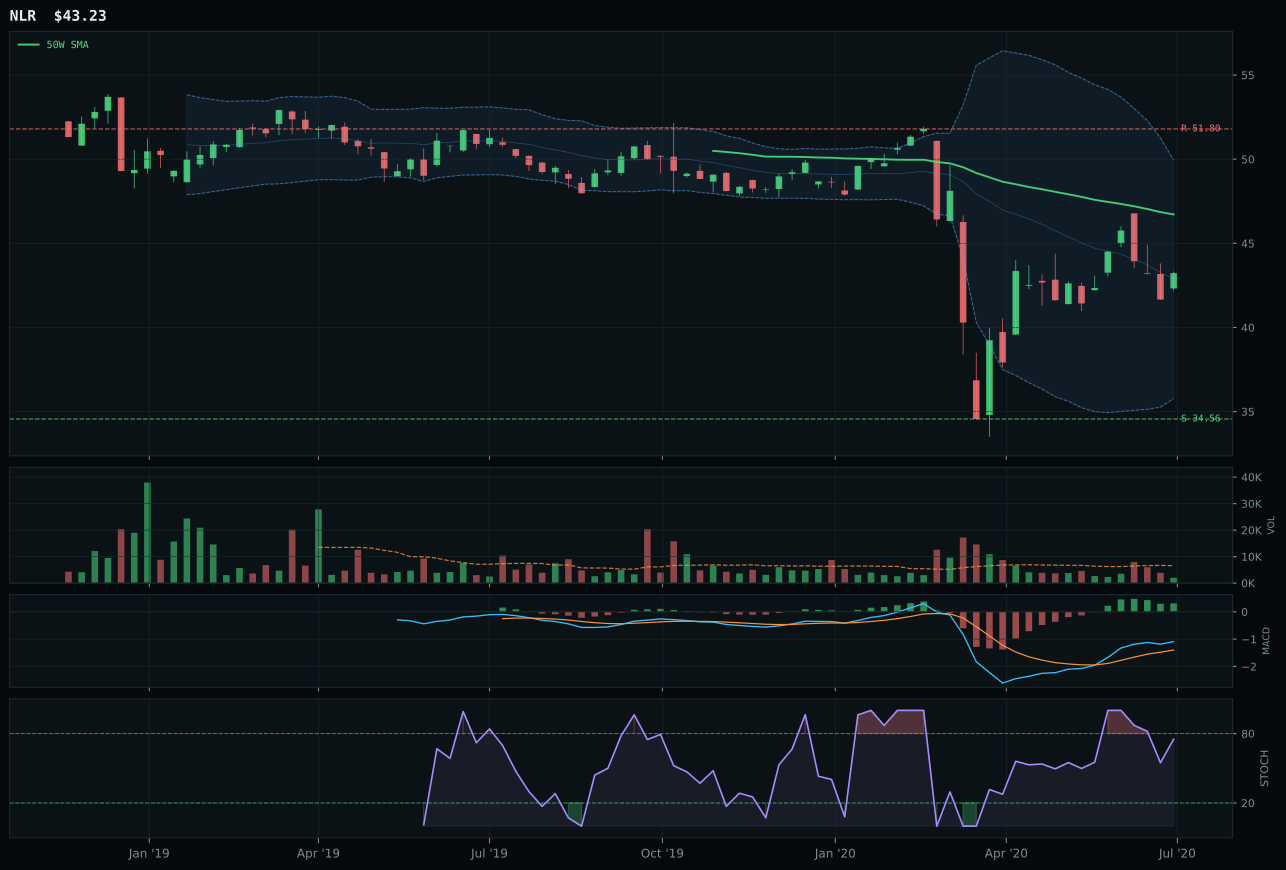
NLR has a neutral structure profile with -11.8% 13-week relative strength versus SPY.
Extension and support failure are the main tactical risks.
Tracked, but not top-2 eligible because: structurally broken.
URA wins Nuclear Energy with a 40-point edge over NLR by preserving structure integrity (72.8 vs 38.4) while both ETFs sit in compressed, near-50W setups that favor mean reversion over trend. URA's timing score (67.0) reflects ideal entry positioning—only 3.7% above the 50W, near the upper Fibonacci retracement with stochastic overbought-rolling-over—a setup where pullbacks attract buyers rather than triggering panics. NLR's category-relative strength collapsed to -5.2% while URA held at positive 5.2%, revealing that uranium buyers gravitated toward the cleaner technical vehicle when they rotated into the thesis. Both carry thin participation and bullish-but-flattening MACD, appropriate for a sector that is early-cycle relative to other energy plays; the 24.4% thirteen-week return on URA and 14.0% on NLR show that nuclear enthusiasm exists but has not yet excited broad participation. The structure advantage makes URA far more useful as an entry point than NLR, even though neither ETF carries the conviction metrics of true high-alpha positions.
Nuclear Energy earned 10% allocation despite failing eligibility because its macro fit (69.0/100) reflects genuine energy-scarcity support (+9) and late-cycle reflation sponsorship (+7), positioning uranium as a beneficiary of infrastructure and electrification tailwinds. The 35.4 category score is low, placing nuclear fifth in the portfolio's seven allocation categories, but the macro rationale—that energy demand will exceed supply and nuclear is a credible non-carbon solution—drives a allocation that pure technicals would not justify. URA's technical evidence of 45.0/100 is weak, and category-level participation is thin, indicating that the move has not yet convinced broad-based buyers. This is a thematic allocation for investors who believe in either a structural supply deficit in uranium or a policy shift toward nuclear as climate solution; without conviction on those narratives, the 10% slot creates nothing but volatility drag. The allocation would double or eliminate based entirely on macro developments (policy shifts, uranium supply shocks, energy demand revisions) rather than on technical flow, making it the most macro-dependent pure convictions in the portfolio.
Industrial Metals — COPX
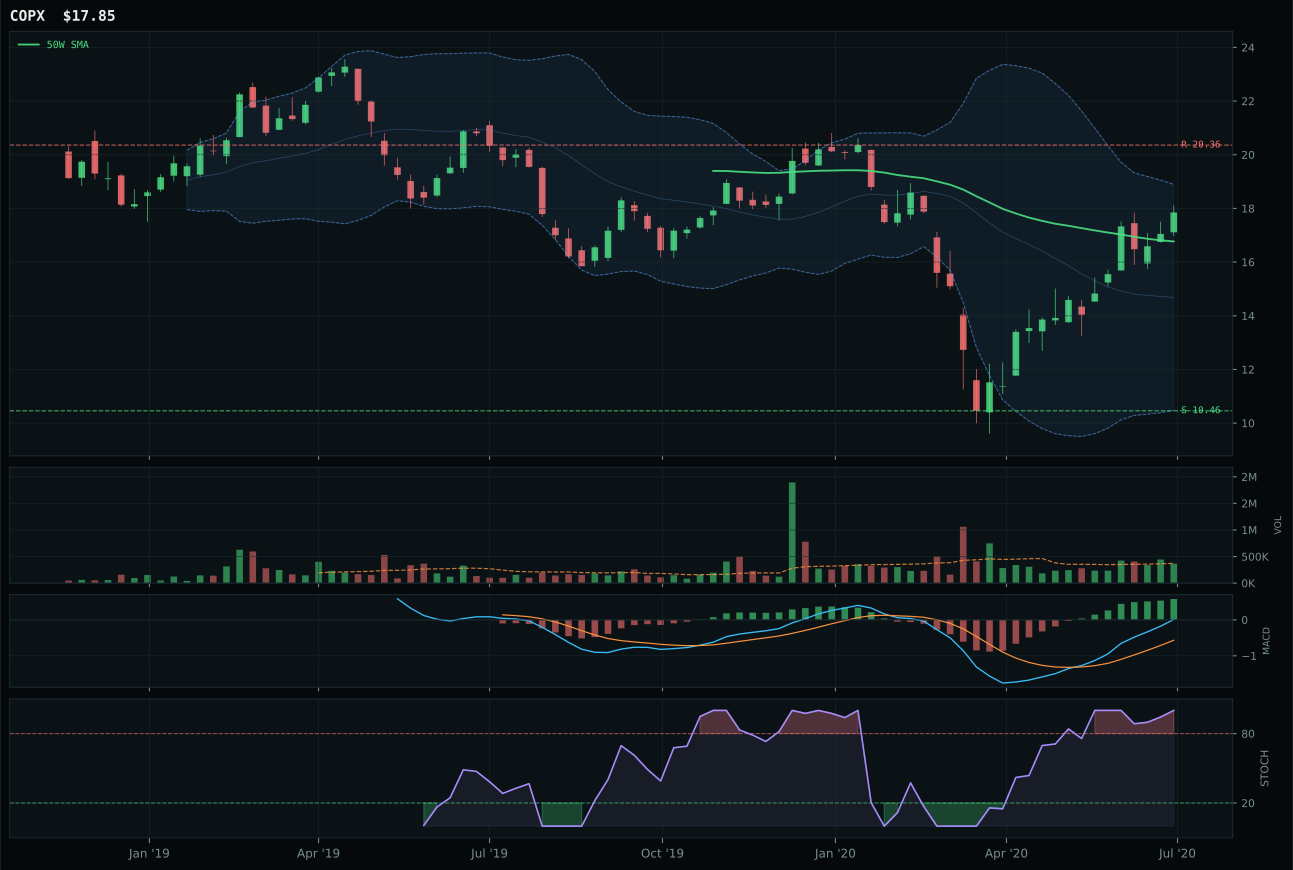
COPX has a neutral structure profile with 31.1% 13-week relative strength versus SPY.
A failed hold above support would weaken the setup.
Tracked, but not top-2 eligible because: .
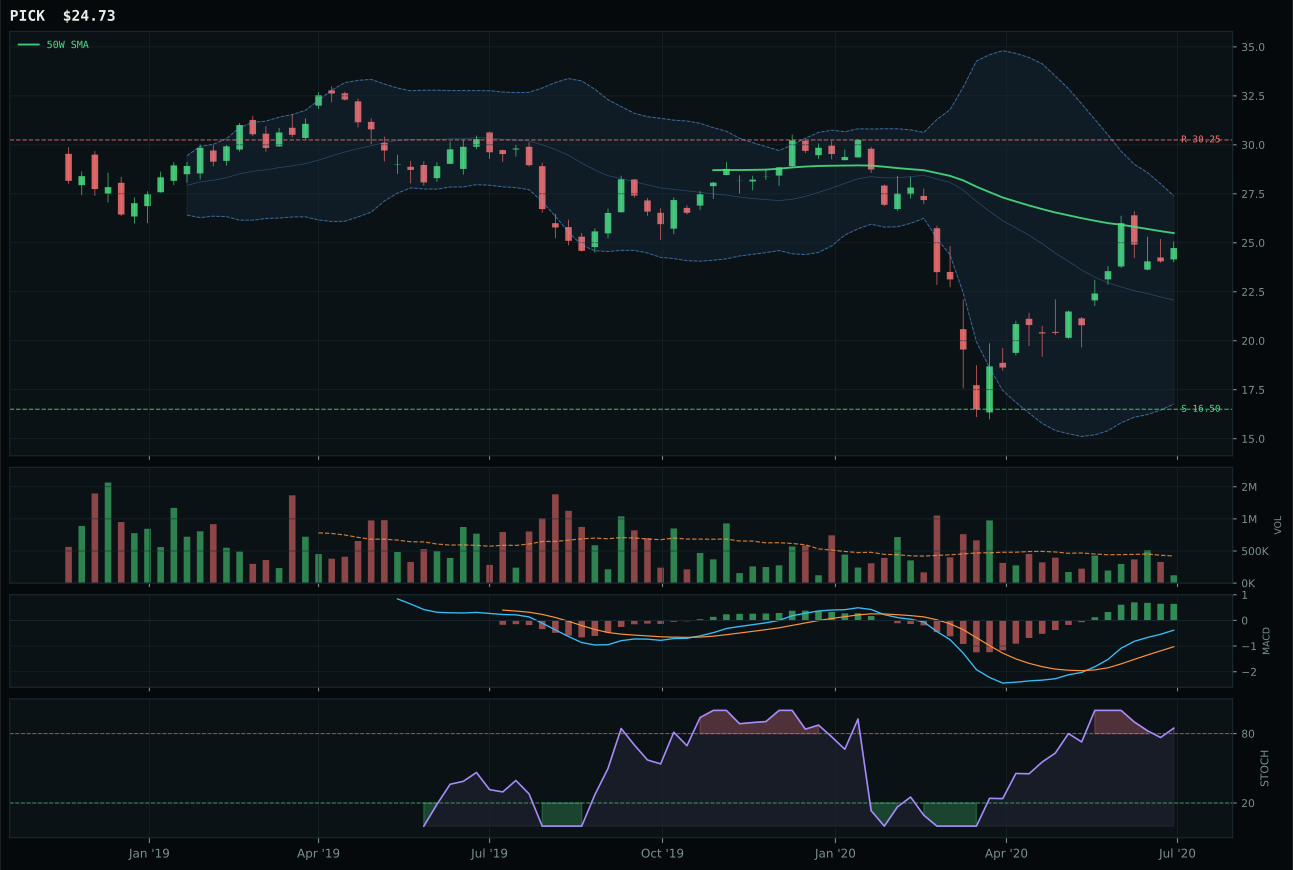
PICK has a compression near 50W profile with 6.9% 13-week relative strength versus SPY.
Extension and support failure are the main tactical risks.
Tracked, but not top-2 eligible because: structurally broken.
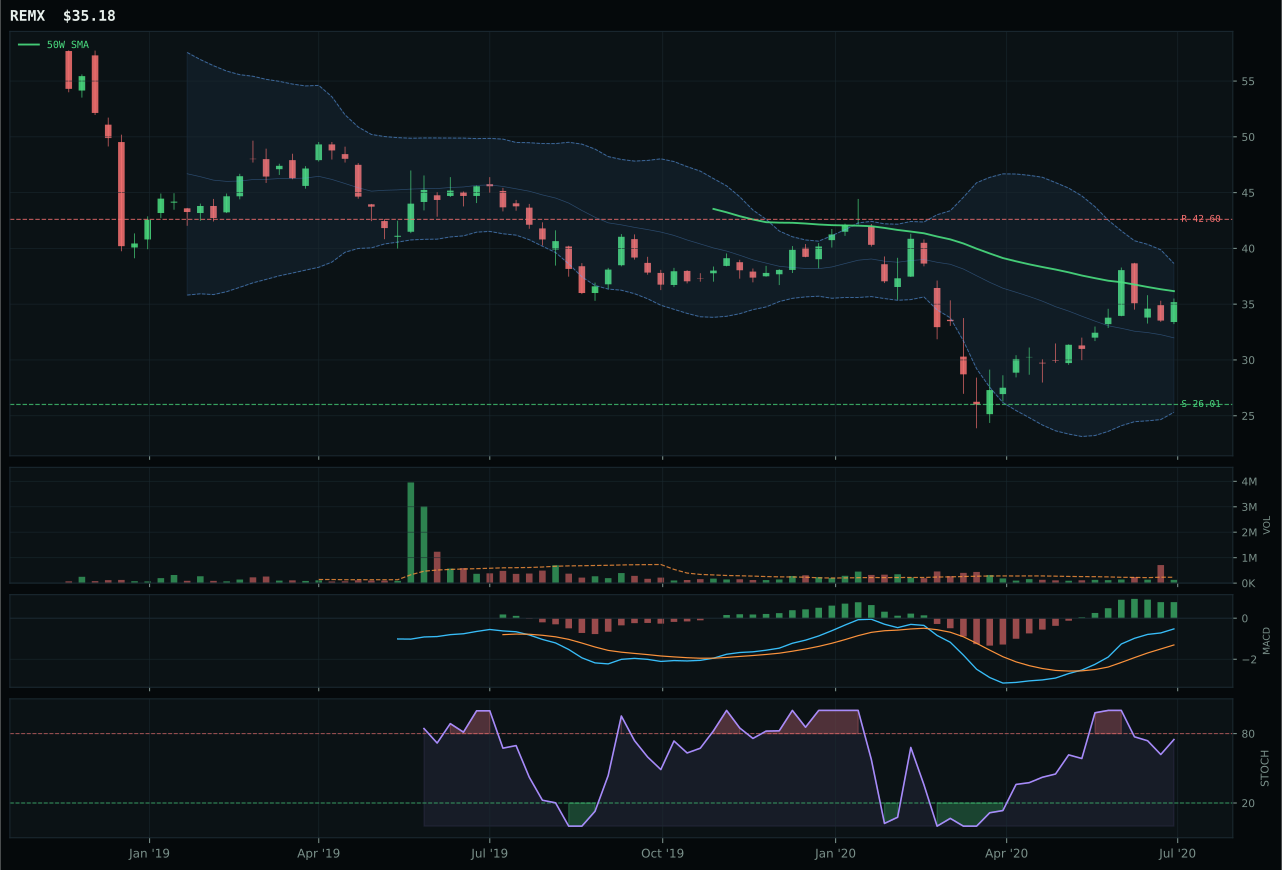
REMX has a compression near 50W profile with 2.1% 13-week relative strength versus SPY.
Extension and support failure are the main tactical risks.
Tracked, but not top-2 eligible because: structurally broken.
COPX crushes Industrial Metals with a 39.8-point lead over PICK because copper scarcity is a real narrative with real technical confirmation: the 56.9% thirteen-week return, 31.1% outperformance versus SPY, and category-leading 24.1% relative strength provide genuine market sponsorship rather than macro speculation. MACD is bullish and improving with perfect momentum confirmation (100.0/100), and volume is the only category position trading at neutral (0.98x the twenty-week average) rather than thin participation, a sign that buyers are showing up with scale. PICK and REMX both triggered hard filters for structural breakdown, indicating that diversified mining and rare earths lack the clean technical setup that COPX possesses; COPX's structure score (77.8) versus PICK's 38.9 underscores the quality gap. The price sits in upper retracement near Fibonacci 0.236 with overbought stochastic, but the context differs sharply from other overbought positions in the portfolio: here, overbought arrives on confirmed volume and genuine category-relative outperformance, not on thin momentum exhaustion.
Industrial Metals earned 10% allocation despite eligibility being marked False because COPX's technical and macro case was too compelling to exclude from reflation positioning. The macro fit (65.0/100) is driven by metals scarcity (+14), late-cycle reflation support (+10), and real asset sponsorship (+6), creating a fundamental backdrop where industrial metals are explicitly scarcer and more valuable in a high-growth reflation cycle. However, the category score of 34.8 reflects a brutal reality: COPX may be a great trade but the category itself lacks breadth and conviction. The binary nature of the setup—a single ETF carrying the entire thematic while peers collapse—is why the allocation is guarded; this is a tactical convict hedge on industrial demand and supply constraints, not a strategic allocation. The position would vanish entirely if copper prices rolled over or if growth expectations fell, making it the most event-dependent sleeve in the portfolio and requiring active management discipline to defend stops and take profits.
Agriculture & Livestock — MOO
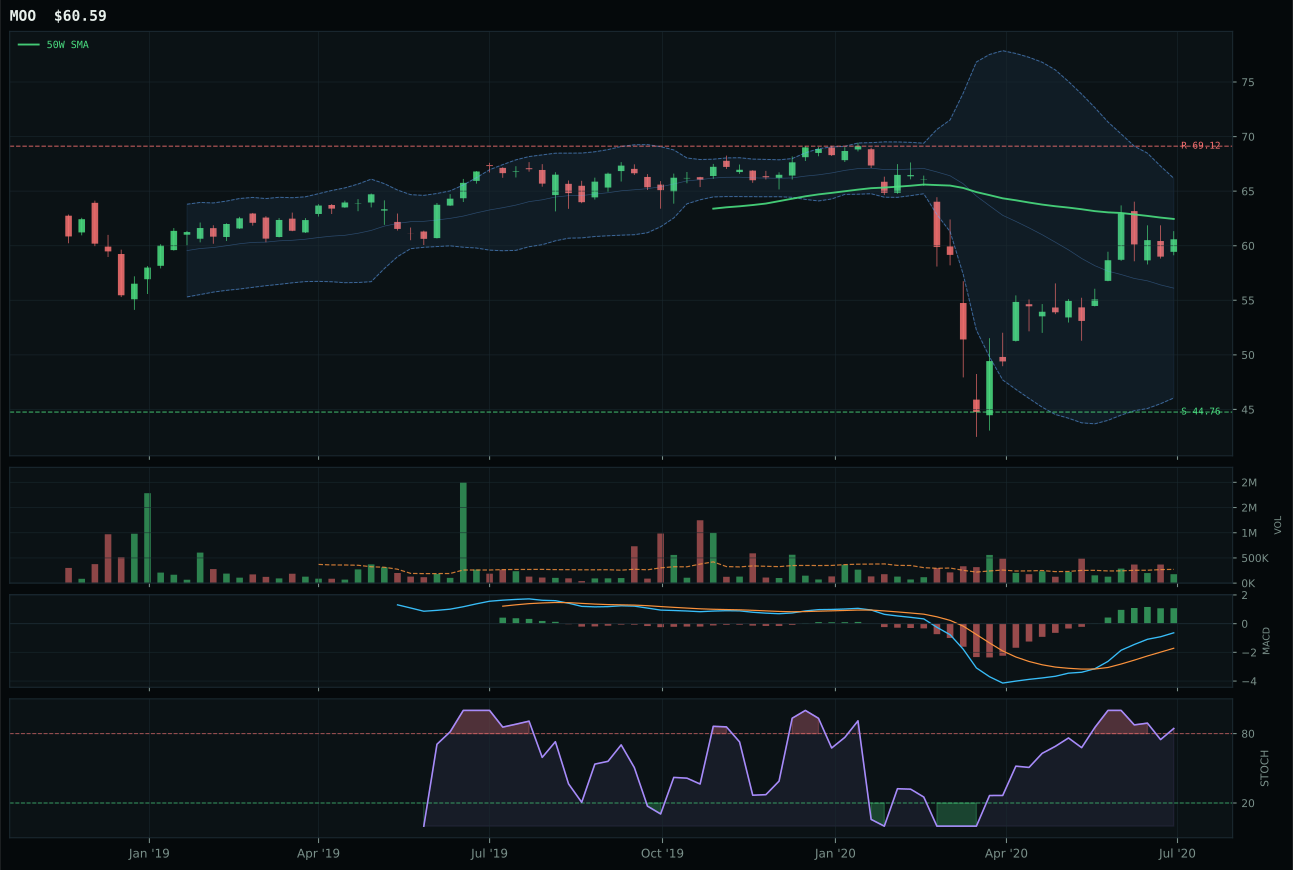
MOO has a compression near 50W profile with -3.2% 13-week relative strength versus SPY.
A failed hold above support would weaken the setup.
Actionable but governed by invalidation levels.
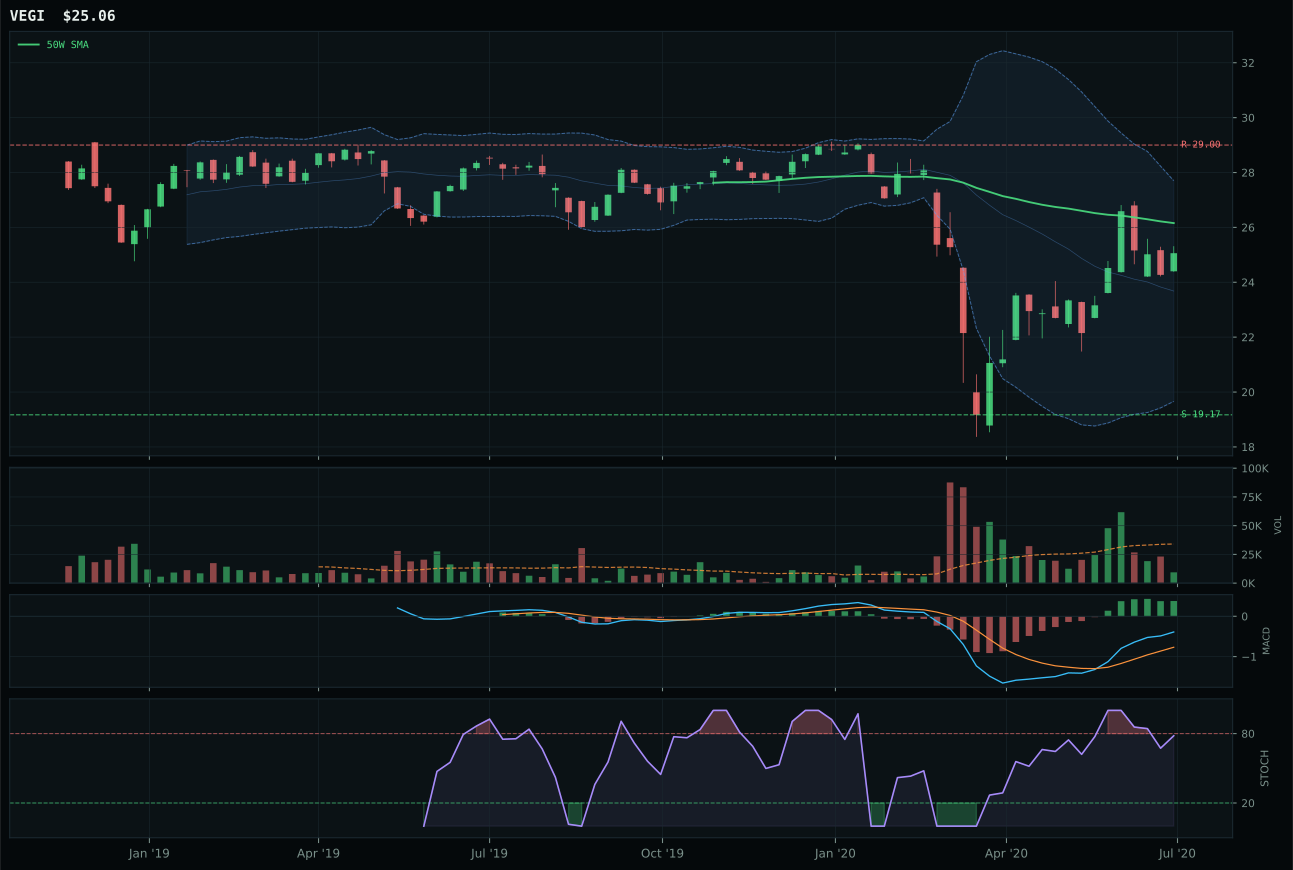
VEGI has a neutral structure profile with -7.5% 13-week relative strength versus SPY.
Extension and support failure are the main tactical risks.
Tracked, but not top-2 eligible because: structurally broken.
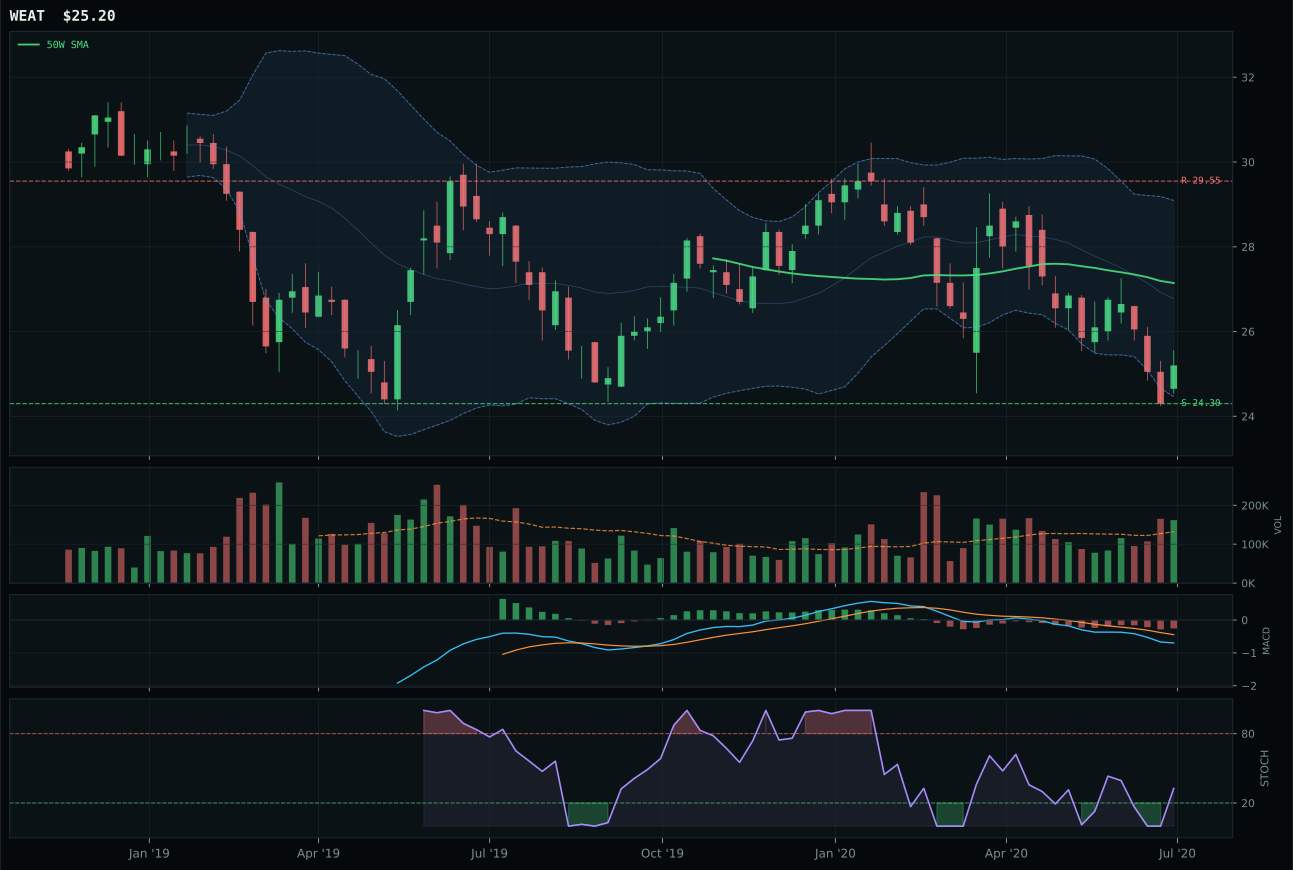
WEAT has a pullback into support profile with -35.8% 13-week relative strength versus SPY.
Extension and support failure are the main tactical risks.
Tracked, but not top-2 eligible because: structurally broken.
MOO wins Agriculture by combining a compression-near-50W setup with the highest timing score in its basket (82.0) and genuine category-relative strength (4.4%), translating a pullback into an entry rather than a capitulation signal. VEGI's structure collapsed to 35.0—triggering hard filters for structural breakdown—while its category-relative strength flatlined at 0.0%, revealing that the global agriculture producer lost its sponsorship while MOO's domestic agribusiness focus held buyer interest. Both sit below their 50-week averages, placing them in reset territory, but MOO's -3.0% distance to the 50W and overbought-rolling-over stochastic RSI (0.84) signal a coil ready to extend, whereas VEGI's weak MACD and falling stochastic confirm deterioration rather than accumulation. The thirteen-week return spread (22.7% vs 18.3%) is modest, but it pairs with MOO's tighter structure and Fibonacci positioning to indicate that the agribusiness thematic has sustainable momentum in one pocket but is breaking down in another.
Agriculture & Livestock scored 30.1 and earned zero allocation because it ranked outside the top eight categories this week, falling to ninth or tenth place. The macro narrative is strong at 72.0—late-cycle reflation helps real assets, inflation pressure is active for agricultural inputs, and real asset sponsorship is real—but the technical evidence collapsed at 61.8 for MOO, 42.0 for VEGI, and 18.6 for WEAT. The 3/2/1 basket calculation started at 48.9 but the category reasoner confirmed that leadership, volume-price sponsorship, and persistence all failed to cross threshold for a credible top-eight finish. MOO's compression setup is interesting and could trade well if it breaks upward with volume, but it is not interesting enough to compete for capital against Technology at 60.4 or AI at 56.5. The allocator excluded this category entirely because the technical foundation was too weak to justify riding the macro tailwind. If MOO reclaims the 50W with above-average volume and MACD improvement accelerates, the category could re-enter at a 5% sleeve next week, but a score of 30.1 against an 8-category eligible universe does not earn a seat.
Emerging Markets — IEMG
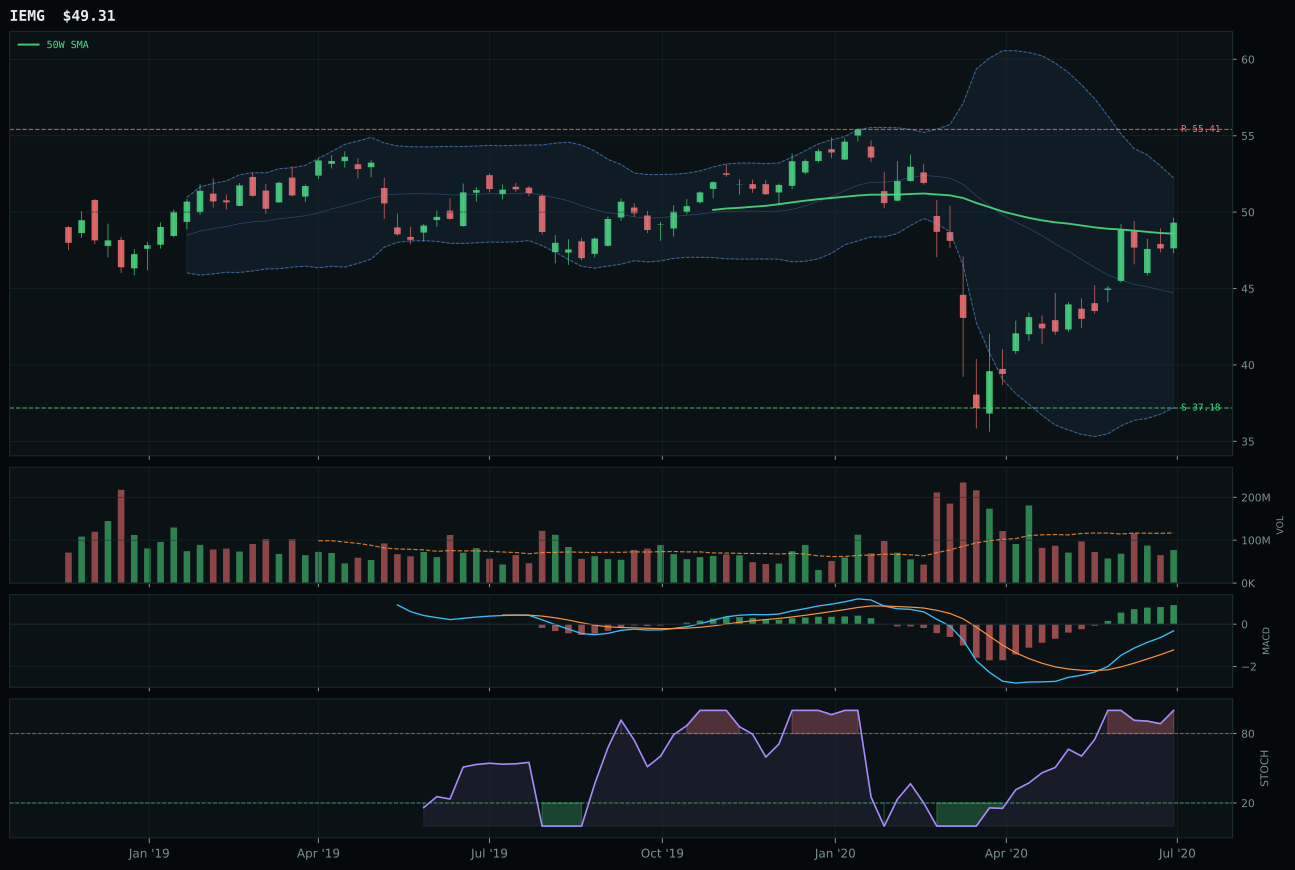
IEMG has a compression near 50W profile with -0.7% 13-week relative strength versus SPY.
A failed hold above support would weaken the setup.
Actionable but governed by invalidation levels.
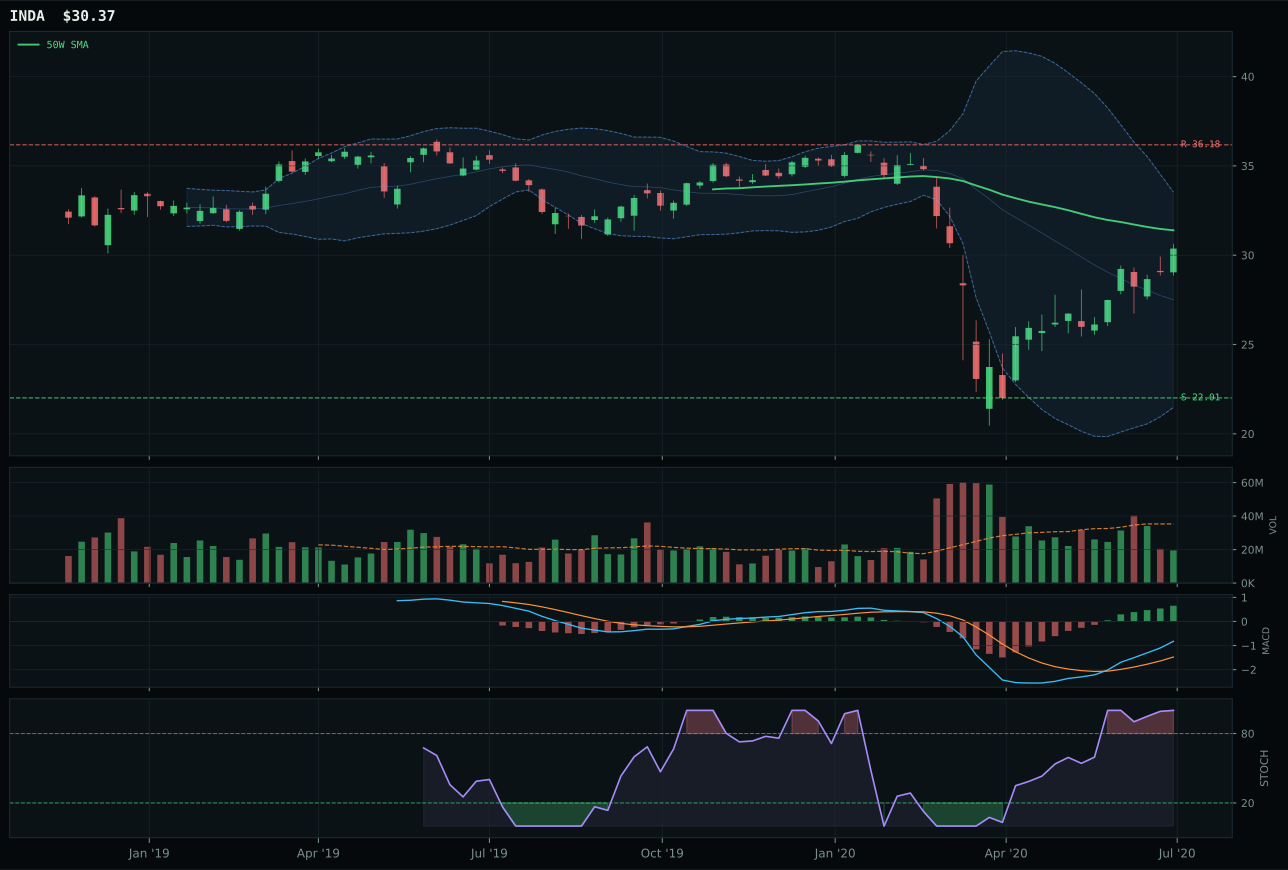
INDA has a neutral structure profile with 12.2% 13-week relative strength versus SPY.
Extension and support failure are the main tactical risks.
Tracked, but not top-2 eligible because: structurally broken.
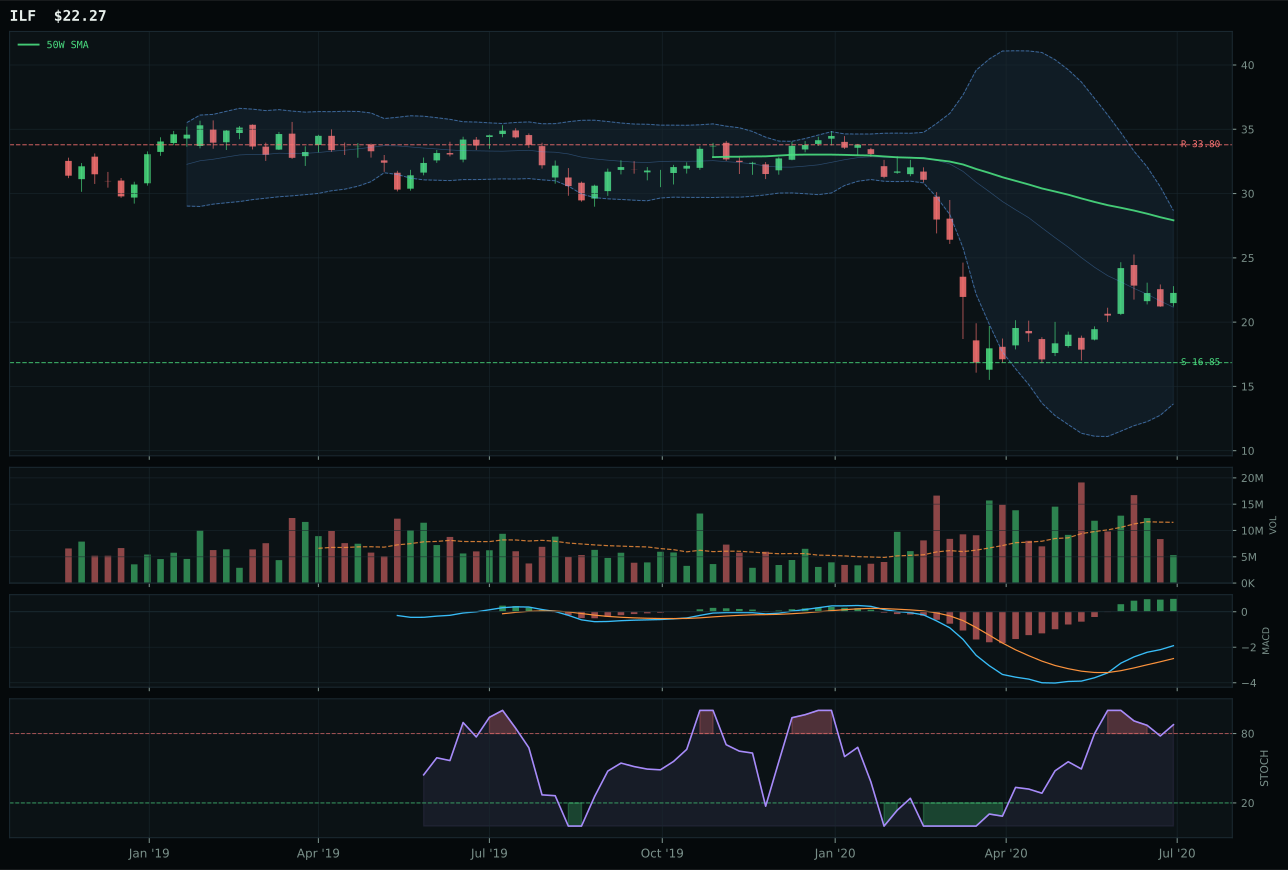
ILF has a neutral structure profile with 4.4% 13-week relative strength versus SPY.
Extension and support failure are the main tactical risks.
Tracked, but not top-2 eligible because: structurally broken.
IEMG wins Emerging Markets by combining near-perfect timing (100.0/100 for distance-to-50W at 1.5%) with the cleanest structure (71.5) in a category where all three candidates sit in compression or decision zones. INDA carries a 38.0% thirteen-week return versus IEMG's 25.1%, yet loses decisively because its timing score (90.0) and structure (44.8) signal a setup that is extended and less reliable; the -5.0% category-relative strength confirms that IEMG attracted the buyers while INDA began to struggle. Both carry identical overbought stochastic RSI and similar MACD confirmation, but IEMG's compression-near-50W setup with bullish-and-improving MACD creates a coil ready to extend upside, whereas INDA's stretched positioning above the 50W with neutral structure offers less upside cushion. The thirteen-week return gap reflects EM breadth (IEMG's broad-based beta outpaced India's concentrated quality play), and the technical setup confirms that concentration has exhausted while breadth is building—a classic signal for multi-month rotations within emerging markets.
Emerging Markets scored 20.4 and earned zero allocation because it ranked ninth or tenth overall, outside the eight eligible categories this week. The macro fit is only 38.0, dragged down by credit stress at negative 10 and liquidity stress at negative 10; risk appetite positive at plus 8 cannot overcome these headwinds. The technical evidence for IEMG is strong at 70.8, and IEMG's timing score of 100.0 is the best in the entire portfolio, but the momentum confirmation is only 72.6 and persistence is only 61.9, meaning the move lacks conviction. The thirteen-week return of 25.1% is respectable but lags Technology and AI substantially, and the SPY relative strength of negative 0.7% means IEMG is treading water in a risk-on environment. The allocator excluded this category entirely because the macro headwinds of credit stress and liquidity stress are too severe to justify capital allocation when superior opportunities exist in Technology, AI, and metals. IEMG could re-enter if credit stress lightens or if risk appetite rolls over and defensive EM positioning becomes attractive, but at 20.4 against an 8-category eligible universe, this category is outside the allocation entirely. The tight compression near the 50W is noted for potential entry if macro conditions change.