
2020-06-26
Informational purposes only. The content in this report, including allocations, analysis, and commentary, is provided solely for informational and educational purposes. It does not constitute financial advice, investment advice, trading advice, or any other type of advice. Past performance does not guarantee future results. Always conduct your own research and consult a qualified financial professional before making investment decisions.
Some tracked tickers were excluded due to missing live weekly price data: SGOV: Historical cache SGOV has only 4 usable weekly bars; URNM: Historical cache URNM has only 30 usable weekly bars
Weekly Allocation
| Ticker | Category | Weight | Role |
|---|---|---|---|
| GLD | Precious Metals | 20% | Top-2 (20%) |
| IGV | Technology | 20% | Top-2 (20%) |
| SMH | AI | 10% | Tier-2 (10%) |
| XLE | Traditional Energy | 10% | Tier-2 (10%) |
| PAVE | Utilities & Infrastructure | 10% | Tier-2 (10%) |
| ITA | Defense & Aerospace | 10% | Tier-2 (10%) |
| URA | Nuclear Energy | 10% | Tier-2 (10%) |
| COPX | Industrial Metals | 10% | Tier-2 (10%) |
Trade Instructions — Monday Open
Sell the tranche from 2020-05-29 (completing its 4-week hold). Buy the new tranche. Instructions show net portfolio changes — same-asset positions cancel, weight changes show the delta.
| Action | Ticker | Instruction |
|---|---|---|
| SELL | CIBR | Sell 50% of CIBR position (reduce 10.00% → 5.00%) |
| SELL | SLV | Sell 33% of SLV position (reduce 15.00% → 10.00%) |
| SELL | BOTZ | Sell 33% of BOTZ position (reduce 7.50% → 5.00%) |
| SELL | IGF | Sell entire IGF position (2.50% of portfolio) |
| SELL | IEMG | Sell entire IEMG position (2.50% of portfolio) |
| SELL | XAR | Sell entire XAR position (2.50% of portfolio) |
| BUY | ITA | Buy ITA — 12.50% of freed cash (adds 2.50% to portfolio) |
| BUY | PAVE | Buy PAVE — 12.50% of freed cash (adds 2.50% to portfolio) |
| BUY | SMH | Buy SMH — 12.50% of freed cash (adds 2.50% to portfolio) |
| BUY | IGV | Buy IGV — 25.00% of freed cash (adds 5.00% to portfolio) |
| BUY | GLD | Buy GLD — 25.00% of freed cash (adds 5.00% to portfolio) |
| BUY | COPX | Buy COPX — 12.50% of freed cash (adds 2.50% to portfolio) |
Current Portfolio After Trade
Combined holdings across all 4 active tranches. Each tranche is 25% of the portfolio.
| Ticker | % of Portfolio | Weight Bar |
|---|---|---|
| SLV | 10.00% | |
| ITA | 10.00% | |
| SMH | 10.00% | |
| IGV | 10.00% | |
| XLE | 7.50% | |
| PAVE | 7.50% | |
| MOO | 7.50% | |
| BOTZ | 5.00% | |
| CIBR | 5.00% | |
| URA | 5.00% | |
| XLK | 5.00% | |
| GLD | 5.00% | |
| REMX | 2.50% | |
| FCG | 2.50% | |
| XLU | 2.50% | |
| NLR | 2.50% | |
| COPX | 2.50% |
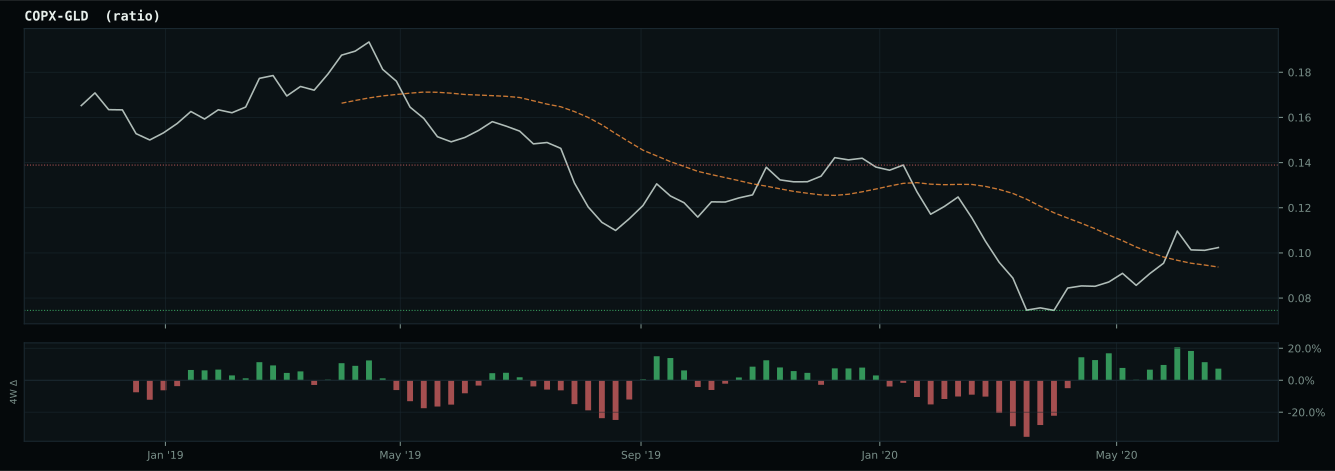
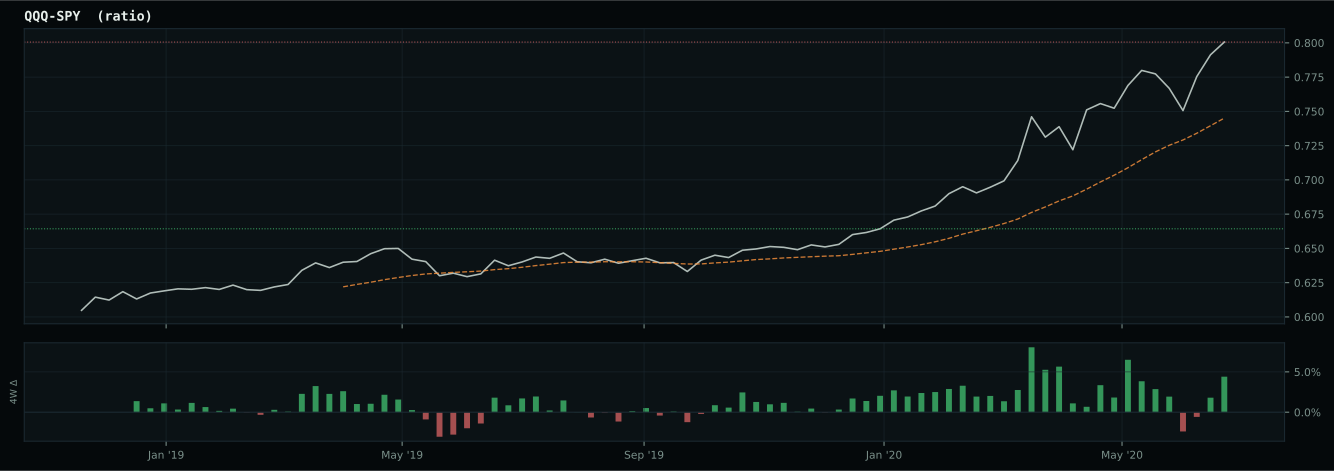
Macro Regime — Late-Cycle Reflation
inflation-sensitive ratios are firm but broad commodity participation is weak
Macro Evidence Charts
Market-implied signals behind the macro regime scores. Each ratio compares two assets; the direction and slope of the ratio is what the macro engine reads.
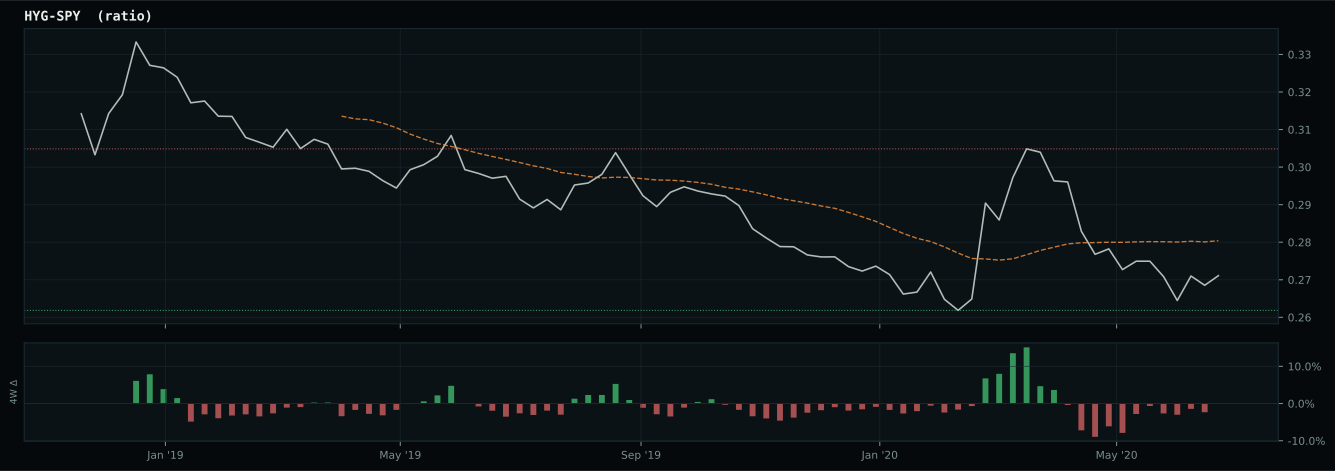
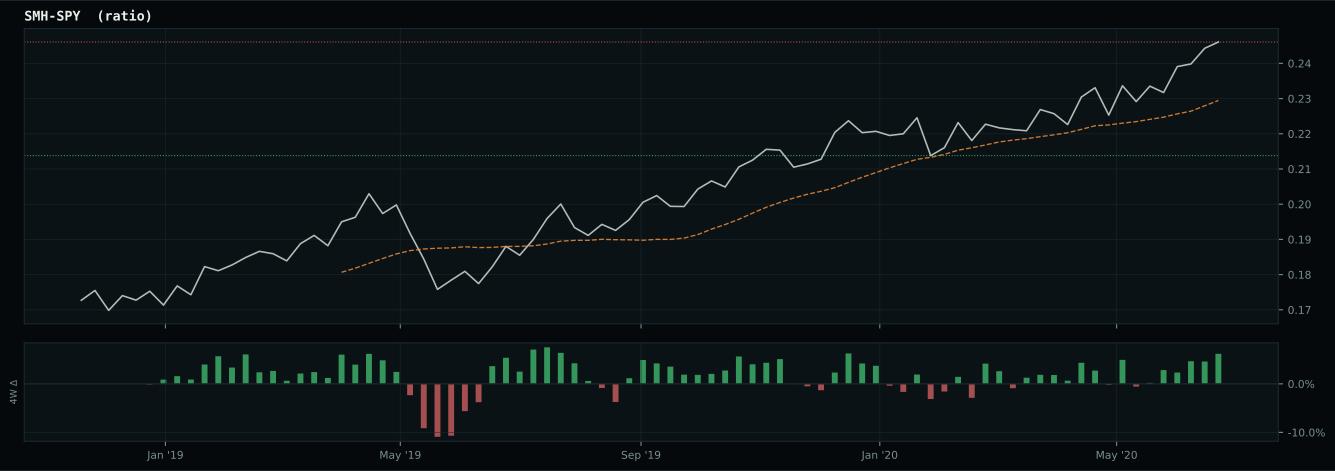
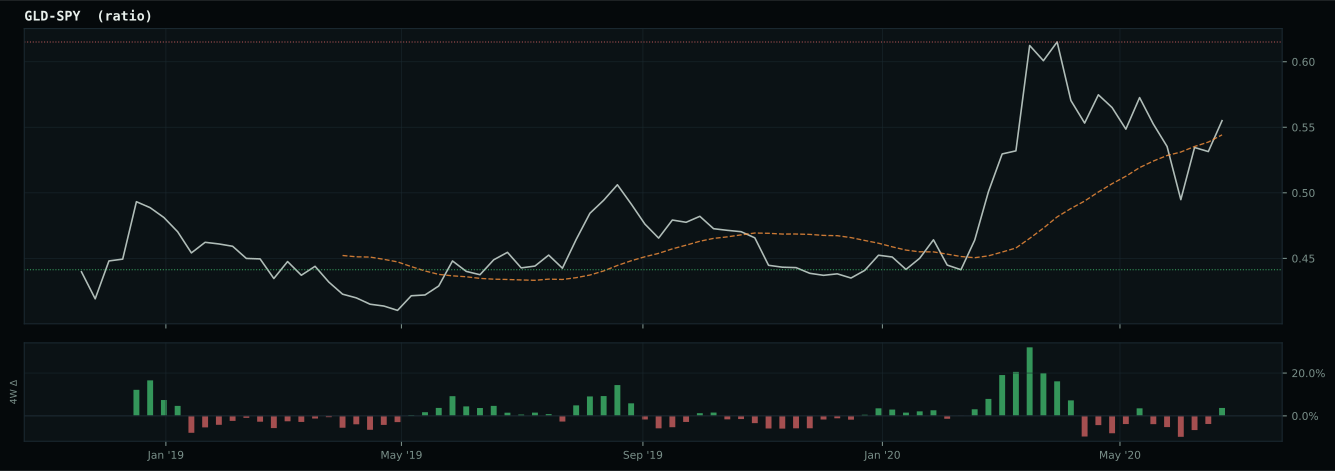
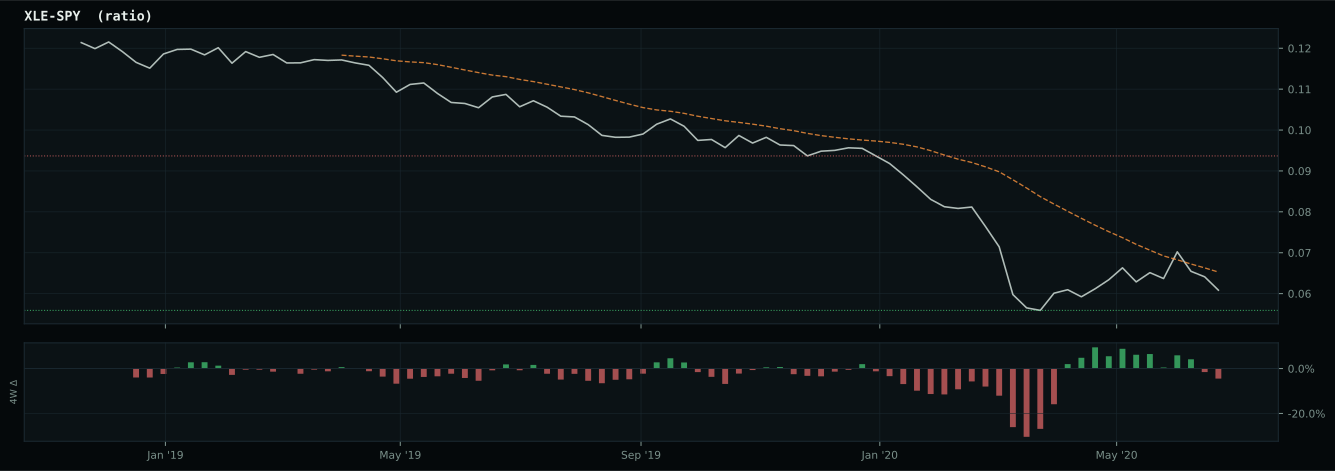
Crypto Regime — NoCrypto
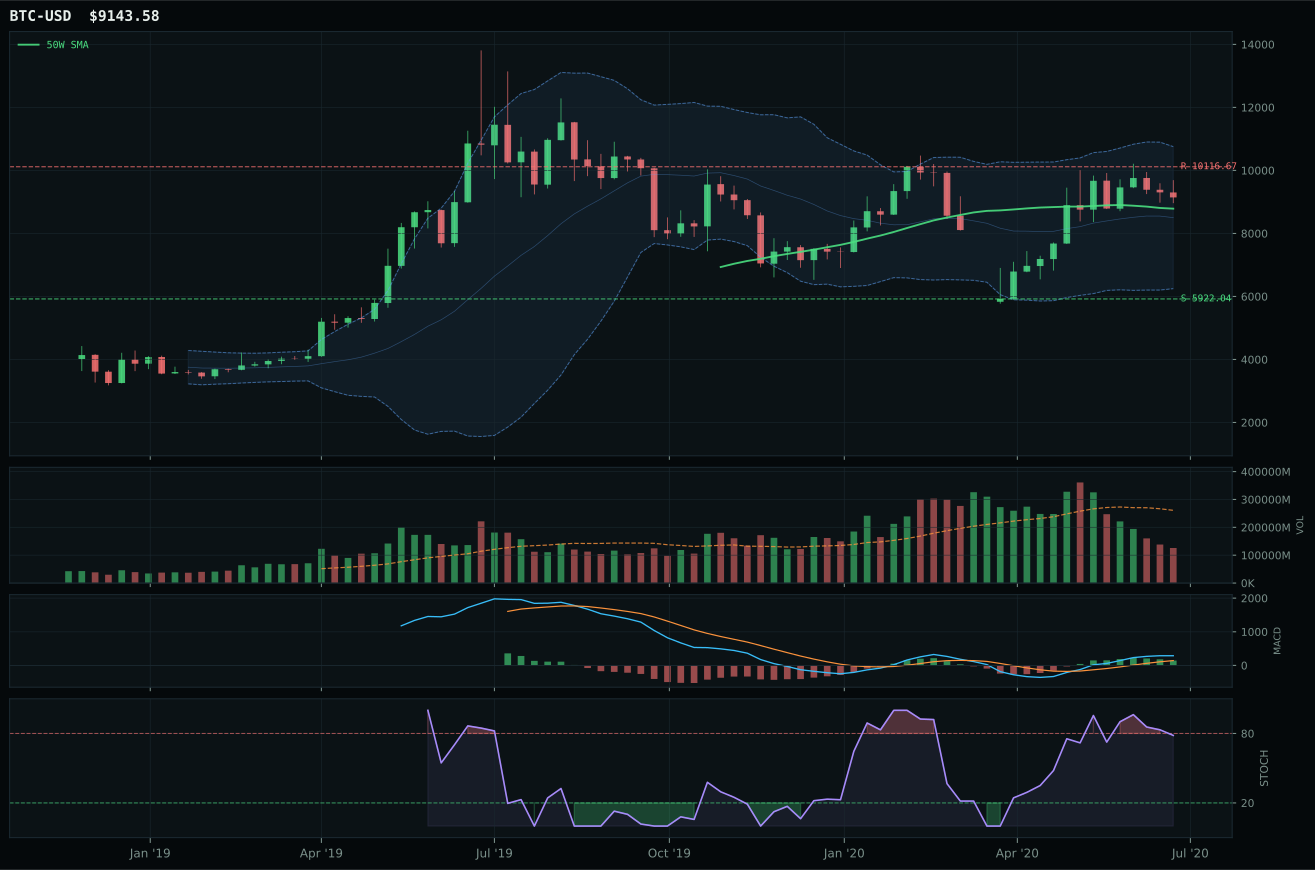
post-touch structure is too wide to count as a range; max/min close ratio is 1.81
TrendBTC not confirmed
one or more available conditions failed

Category Rankings
| Rank | Category | Winner | Score | Alloc | 4W Ret | Peers (4W) |
|---|---|---|---|---|---|---|
| 1 | Precious Metals | GLD | 60.5 | 20% | +9.18% | GDX +22.8% · SLV +36.1% |
| 2 | Technology | IGV | 59.2 | 20% | +2.85% | XLK +4.2% · CIBR +5.2% |
| 3 | AI | SMH | 53.3 | 10% | +10.09% | BOTZ +8.9% · AIQ +6.8% |
| 4 | Traditional Energy | XLE | 41.3 | 10% | +2.35% | FCG +6.6% · XOP +4.9% |
| 5 | Utilities & Infrastructure | PAVE | 40.5 | 10% | +8.16% | IGF +4.7% · XLU +8.4% |
| 6 | Defense & Aerospace | ITA | 39.4 | 10% | +1.31% | XAR +2.5% · ROKT +4.8% |
| 7 | Nuclear Energy | URA | 37.0 | 10% | +13.55% | NLR +5.7% |
| 8 | Industrial Metals | COPX | 35.1 | 10% | +18.76% | PICK +11.7% · REMX +21.8% |
| 9 | Agriculture & Livestock | MOO | 29.4 | 0% | +6.66% | VEGI +8.2% · WEAT +10.8% |
| 10 | Emerging Markets | IEMG | 5.1 | 0% | +8.90% | INDA +10.8% · ILF +10.6% |
Precious Metals — GLD
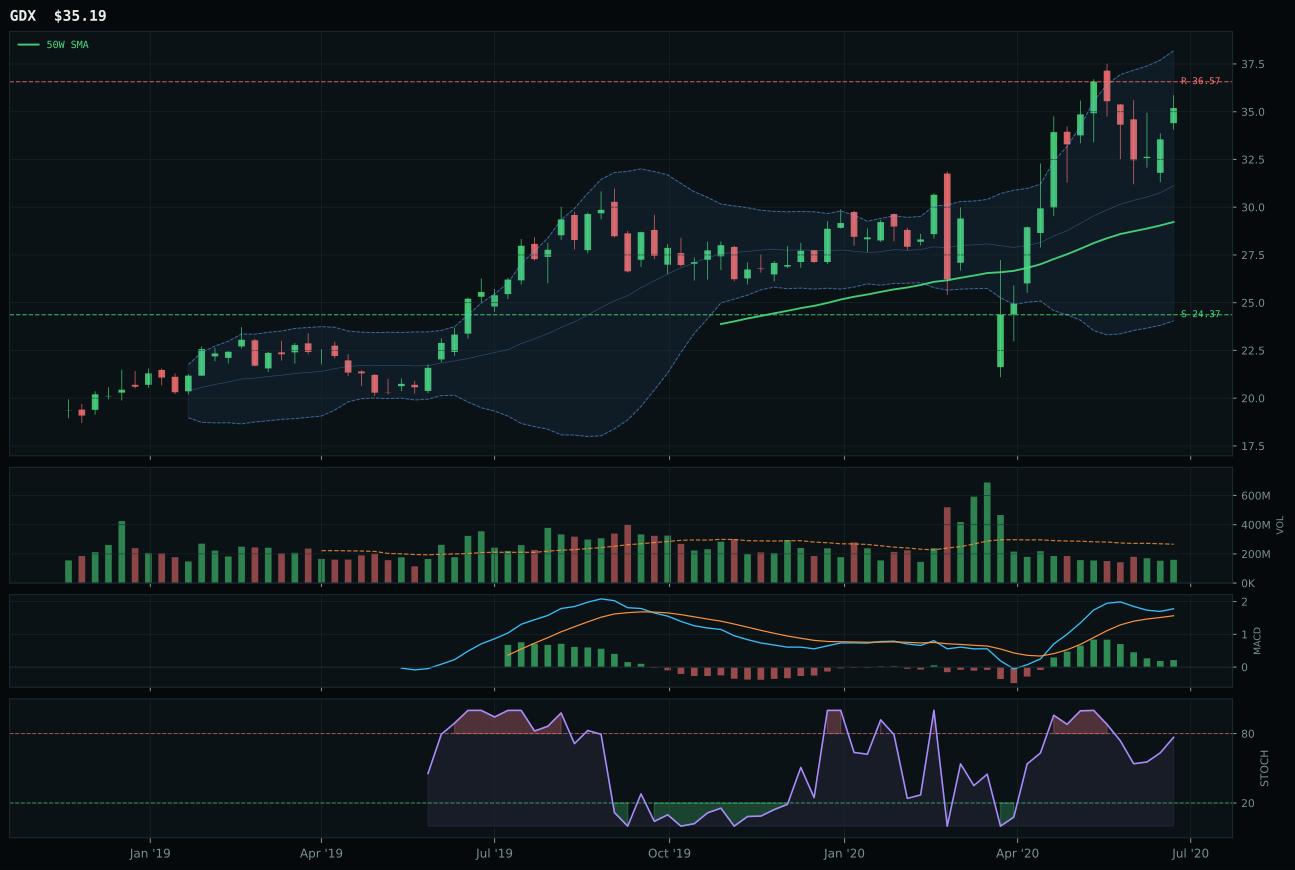
GDX has a vertical extension profile with 26.0% 13-week relative strength versus SPY.
A failed hold above support would weaken the setup.
Actionable but governed by invalidation levels.
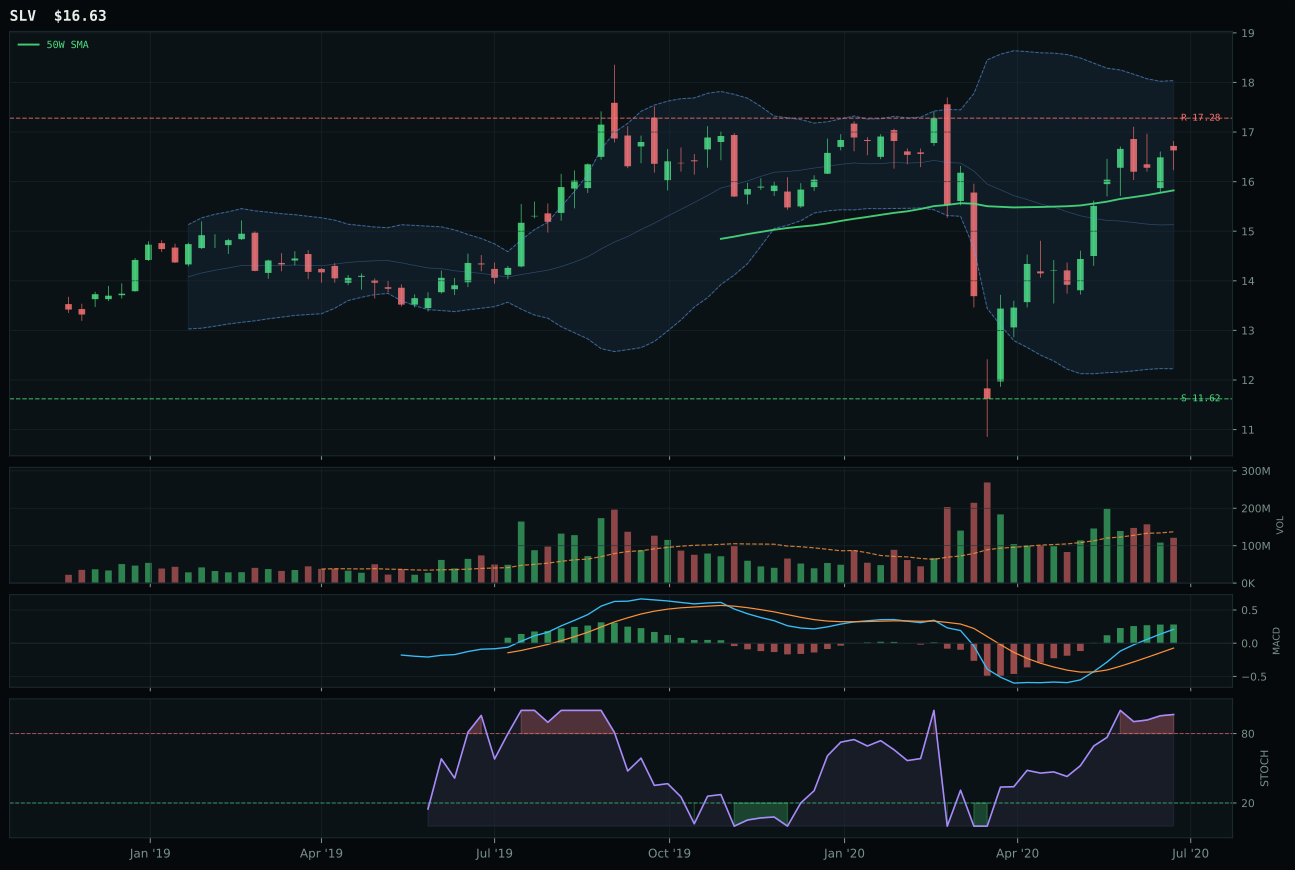
SLV has a neutral structure profile with 5.3% 13-week relative strength versus SPY.
A failed hold above support would weaken the setup.
Actionable but governed by invalidation levels.
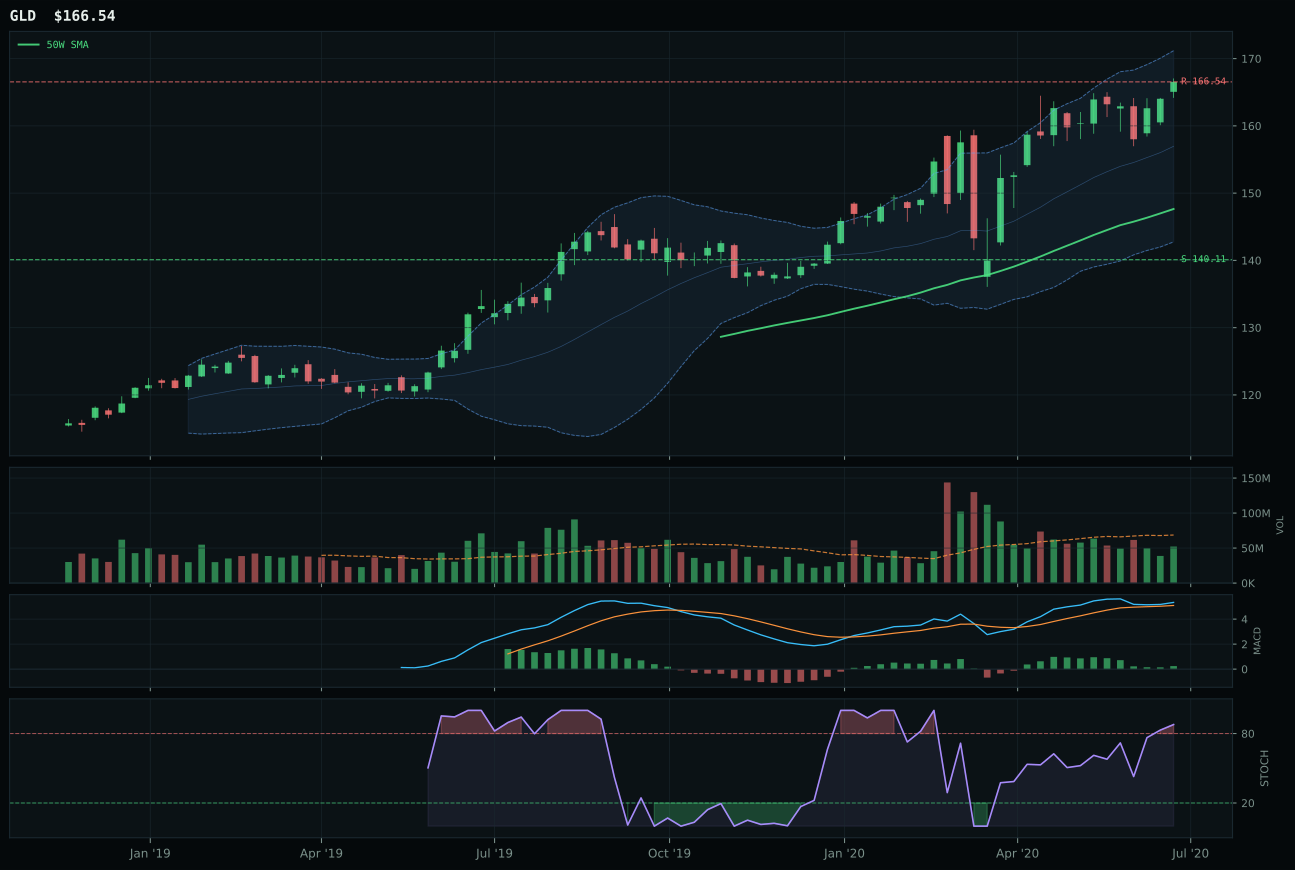
GLD has a neutral structure profile with -9.0% 13-week relative strength versus SPY.
A failed hold above support would weaken the setup.
Actionable but governed by invalidation levels.
GLD secured the Precious Metals top-2 allocation slot by offering the safest defensive expression of monetary-hedge demand across a category where structural quality deteriorated dramatically at higher leverage levels. Price sits 12.8% above the 50-week moving average with 82.5 trend evidence and neutral structure, positioning gold as the core defensive hedge; GDX's vertical extension setup (21.9% above 50W), despite stellar 26.0% relative strength versus SPY, carried 30.8 risk/reward versus GLD's 44.6, signaling that gold miners had already consumed risk capital. GLD's MACD bullish-but-flattening and stochastic overbought momentum read as extended conviction rather than fresh accumulation, yet the 14.3% negative category-relative strength—meaning GLD underperforms versus SLV and GDX—paradoxically reinforces selection: the allocator chose the least-crowded defensive expression, not the hottest one. This is how experienced capital defends during late-cycle uncertainty without chasing the trades that have already paid off.
Precious Metals joined Technology as a 20% allocation because defensive rotation (+7) and the monetary-hedge narrative combined to deliver 60.5 category score in an environment where credit stress and liquidity stress remain material tail risks. GLD's 49.8 technical evidence score was genuinely weak—momentum confirmation barely exceeded 30/100, indicating minimal new accumulation—yet macro fit of 52.0 and category-level macro fit of 53.0 confirmed that this allocation is structural protection, not a tactical trade. The portfolio allocated 20% to precious metals despite GDX's superior technical evidence (75.7) and SLV's stronger momentum (92/100) because GLD offers the cleanest downside insurance; when credit or liquidity stress ignites, gold typically outperforms mining stocks and silver as nervous capital retreats to pure monetary hedges. This allocation would shrink if GLD breaks below 50-week support or if stochastic RSI rolls over below 0.50, both of which would signal that defensive demand had reversed; neither condition is currently true, validating the full 20% weight.
Technology — IGV
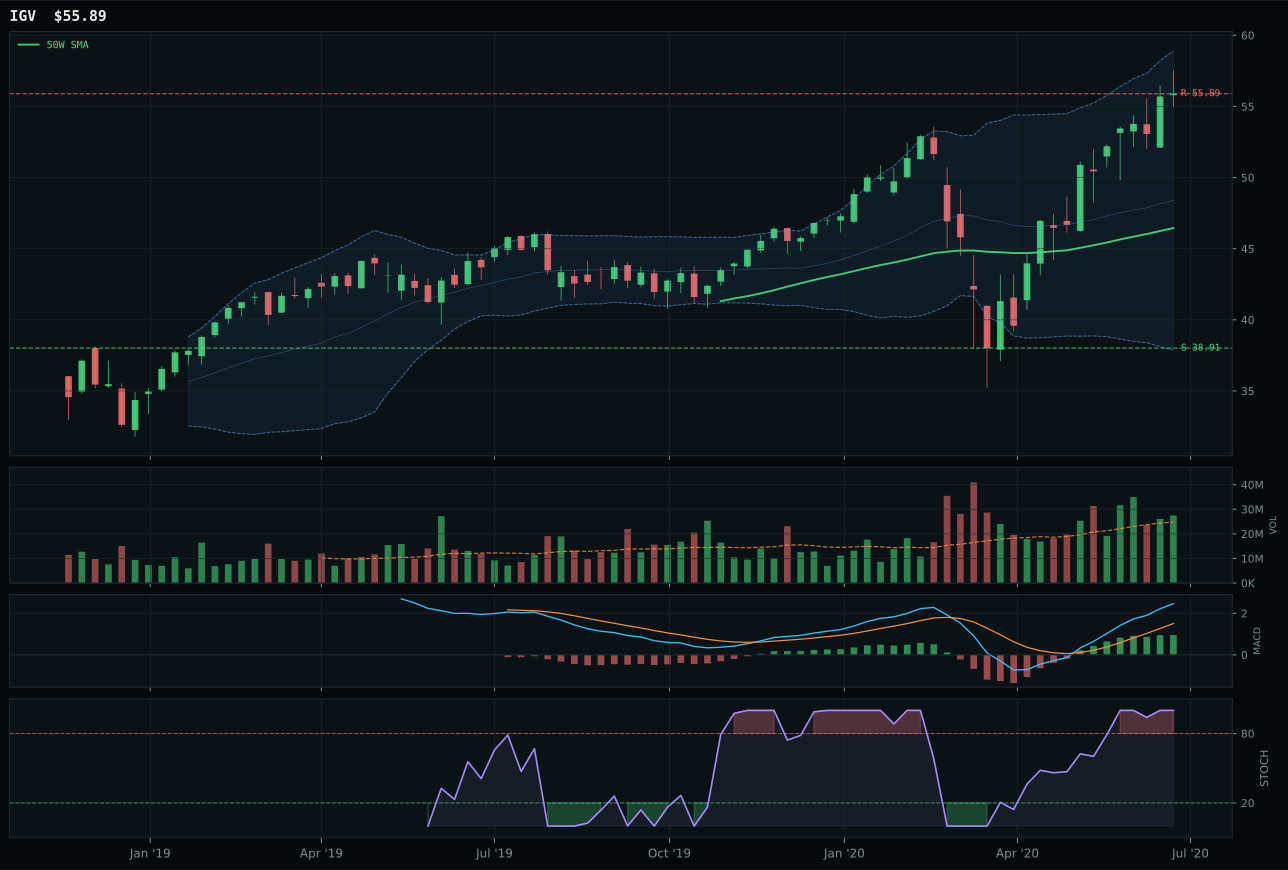
IGV has a vertical extension profile with 16.9% 13-week relative strength versus SPY.
A failed hold above support would weaken the setup.
Actionable but governed by invalidation levels.
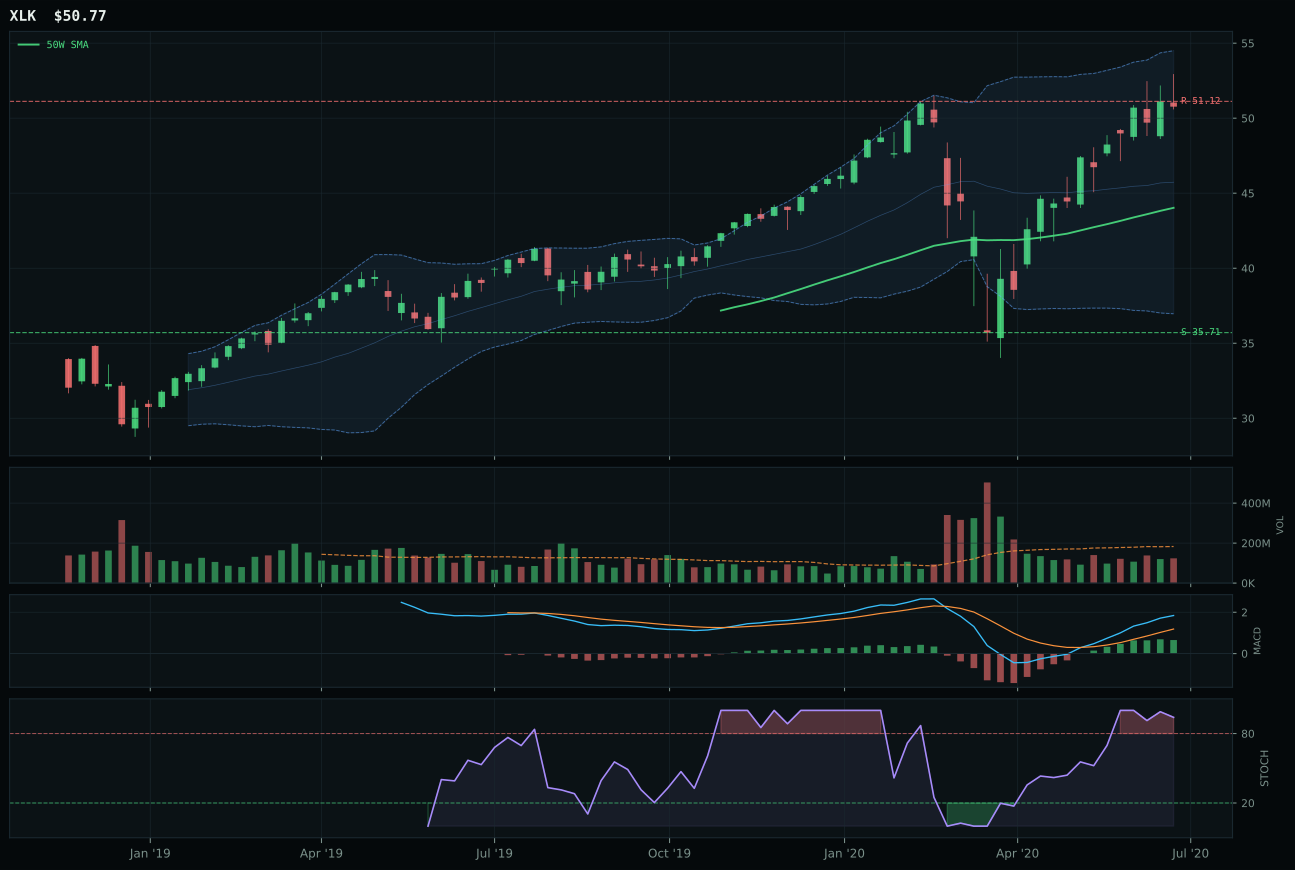
XLK has a vertical extension profile with 10.8% 13-week relative strength versus SPY.
A failed hold above support would weaken the setup.
Actionable but governed by invalidation levels.
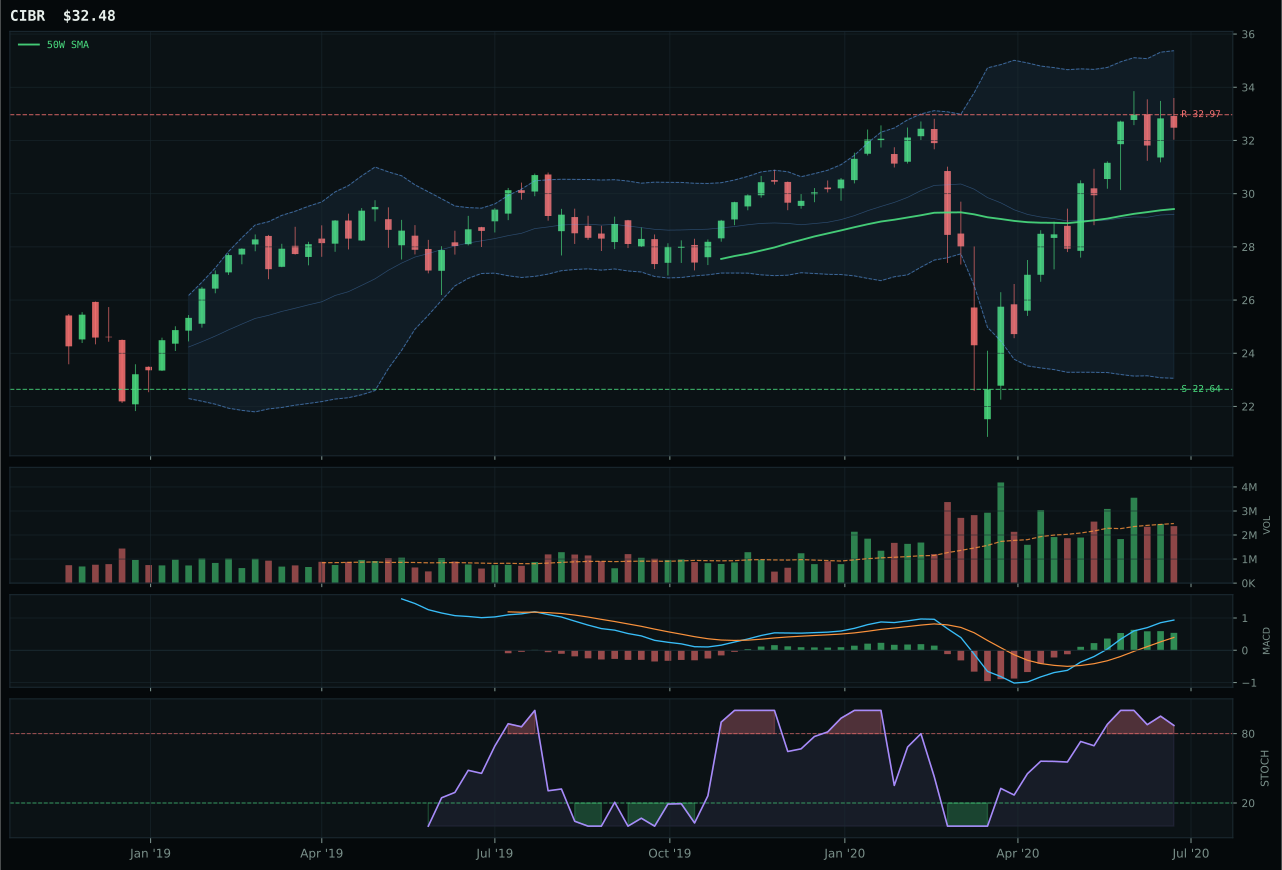
CIBR has a neutral structure profile with 7.7% 13-week relative strength versus SPY.
A failed hold above support would weaken the setup.
Actionable but governed by invalidation levels.
IGV captured the Technology category by combining vertical extension momentum with above-average volume sponsorship that XLK could not match. Enterprise software's 35.3% thirteen-week return and 16.9% relative strength versus SPY reflect sustained buyer accumulation, not momentum exhaustion, despite sitting 20.3% above the 50-week moving average. XLK's 10.8% category-relative strength and deteriorating stochastic RSI—rolling over into overbought—signaled fading conviction behind broad profitable tech; its volume dried to thin participation, a critical difference when both ETFs occupy vertical extension setups. The timing score gap (37 versus 35) may appear modest, but it reflects IGV's ability to hold MACD bullish-and-improving momentum while XLK's stochastic peaked and reversed, suggesting XLK's buyers exhausted themselves first.
Technology earned its 20% allocation slot as one of the portfolio's two highest-ranked categories because risk appetite sponsorship and AI growth momentum offset structural extension risk in a Late-Cycle Reflation regime. The 59.2 final score relied on 100/100 trend evidence—both contenders sitting above their 50W and 200W—combined with exceptional momentum confirmation (100/100 composite) that justified the stretched entry despite 47.1% downside risk to support. Category-level macro fit checked in at 44.0/100, dragged lower by active liquidity stress and credit stress descriptors, but the technical ETF evidence weight (62% of final score) overwhelmed macro headwinds; risk appetite positive and AI growth sponsorship both active provided sufficient narrative cover. This category will remain vulnerable to liquidity shocks or widening credit spreads, but the breadth and persistence of the move argues that sellers have not yet reclaimed control.
AI — SMH
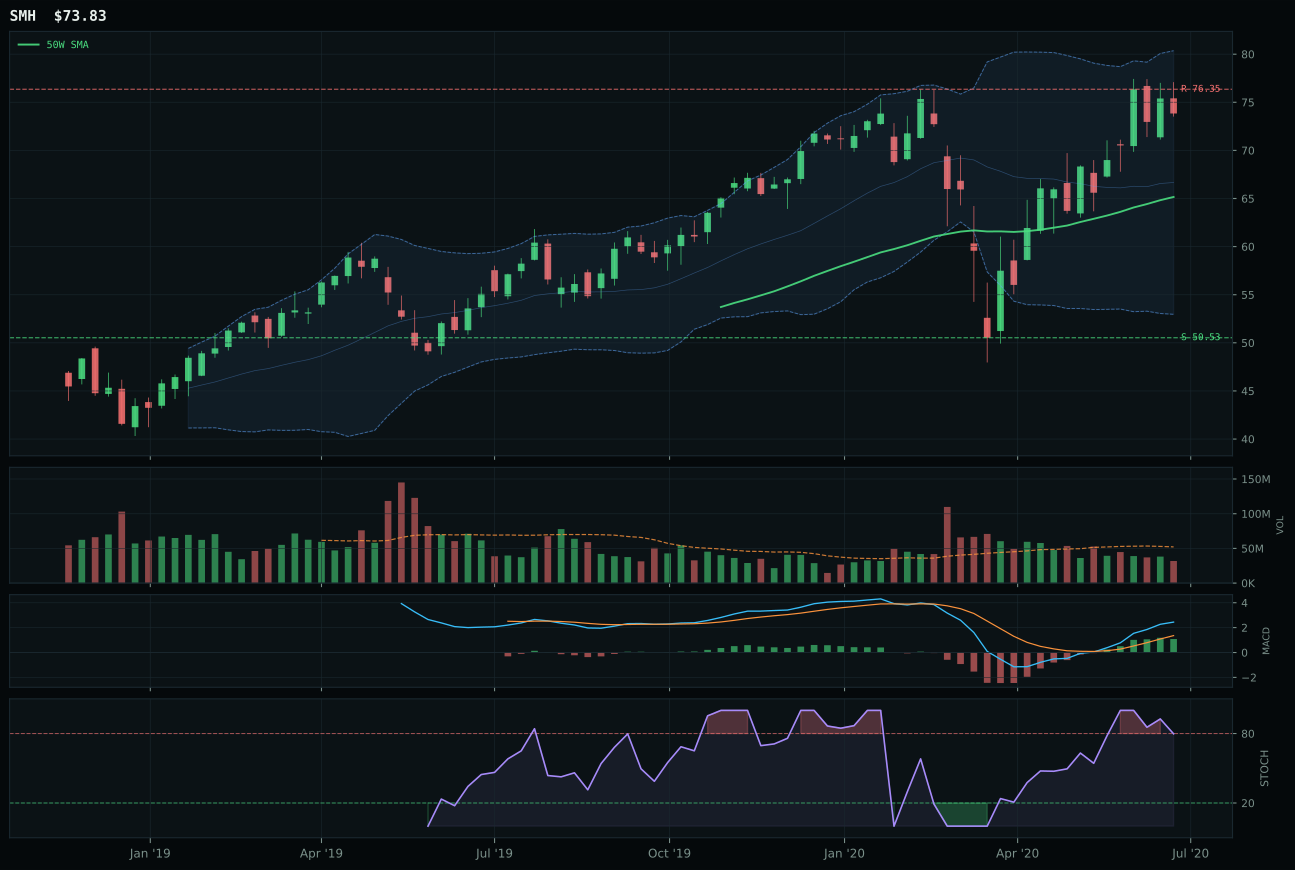
SMH has a neutral structure profile with 10.0% 13-week relative strength versus SPY.
A failed hold above support would weaken the setup.
Actionable but governed by invalidation levels.
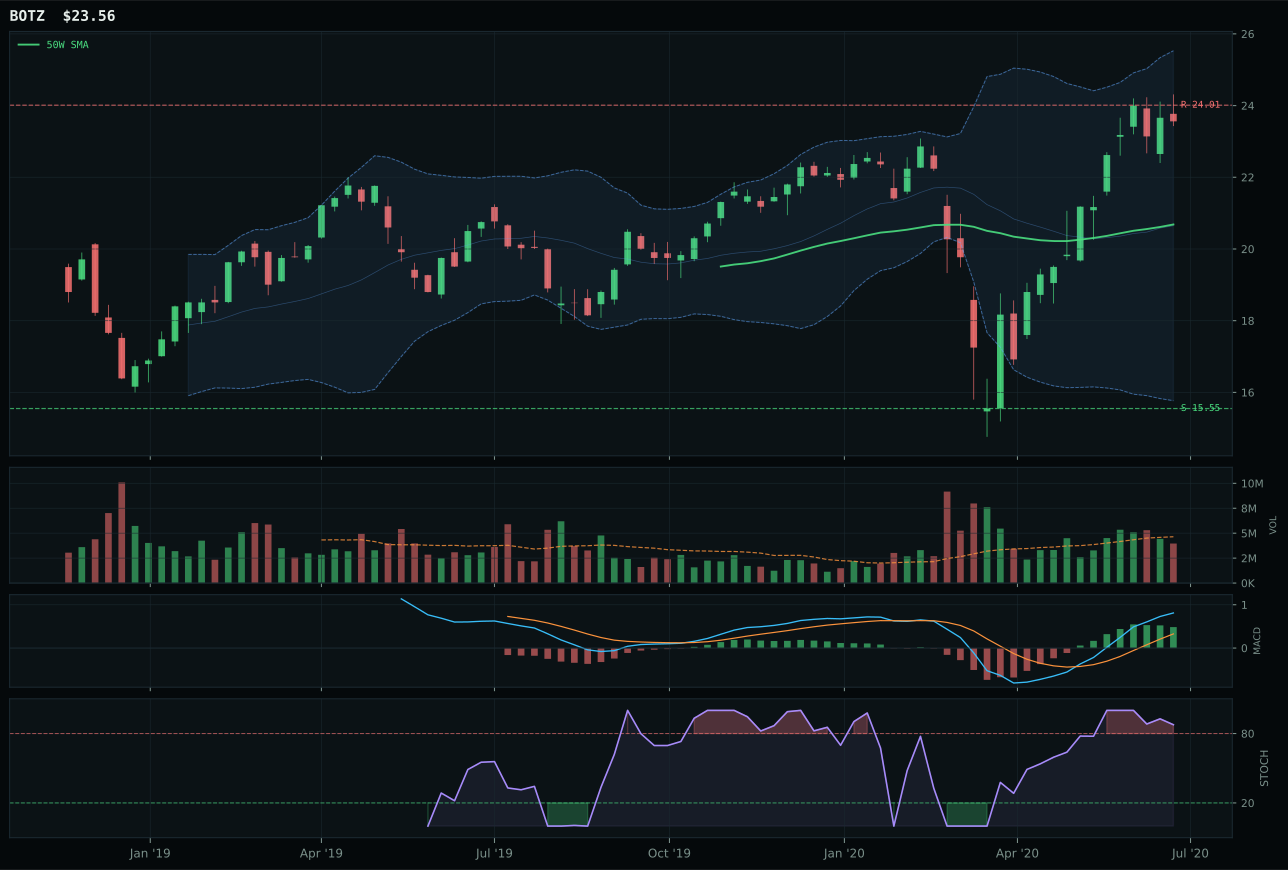
BOTZ has a neutral structure profile with 11.3% 13-week relative strength versus SPY.
A failed hold above support would weaken the setup.
Actionable but governed by invalidation levels.
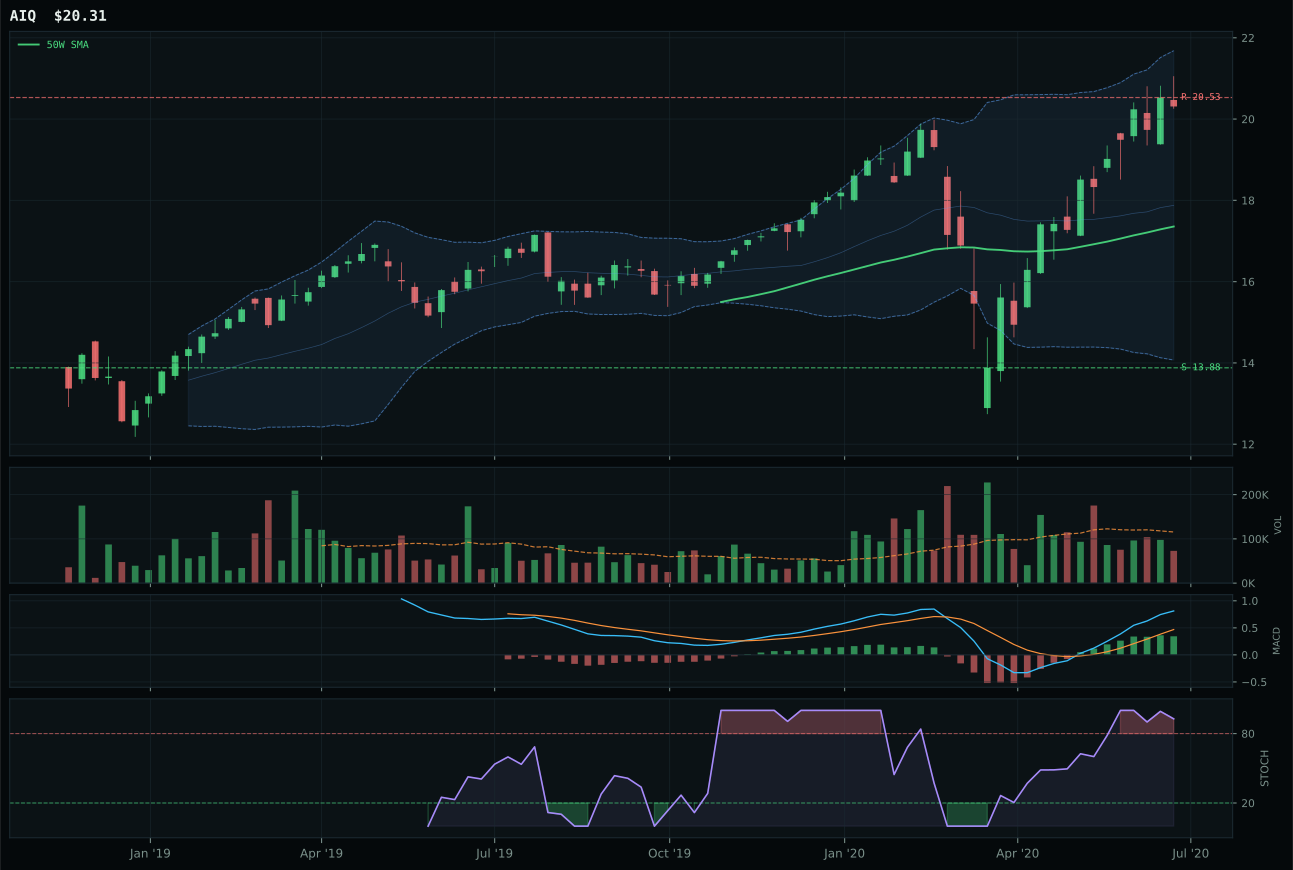
AIQ has a vertical extension profile with 11.7% 13-week relative strength versus SPY.
A failed hold above support would weaken the setup.
Tracked, but not top-2 eligible because: .
SMH claimed the AI category despite neutral structure and thin volume participation because its timing setup—just 13.3% above the 50-week moving average with MACD bullish and improving and stochastic falling into neutral—offered the cleanest re-entry point within the three-ETF basket. BOTZ's 49.0 timing score reflected stochastic already rolling over while price sat deeper in extension, a red flag for late accumulation; semiconductor compute leadership's falling/neutral stochastic conflicted with overbought price extension in a way that BOTZ could not reconcile. The 7.8-point score gap versus BOTZ was substantial enough that SMH's category-relative strength of -1.2% (technically lagging within its peers) mattered less than the quality of the technical setup itself—a setup where new buyers had not yet exhausted themselves.
AI's 10% allocation reflects a category rank outside the top two despite 53.3 final score and compelling macro sponsorship, suggesting the portfolio required concrete breakout evidence before committing a larger sleeve. AI growth sponsorship is active with +14 weight, and risk appetite positive carries +10, combining to generate 58.0 macro fit; yet the category's technical evidence only reached 75.6/100 due to thin volume participation and divergent momentum readings across the basket. SMH's trend came in at 100/100, but momentum confirmation dropped to 100/100 while risk/reward fell to 31.3/100—a setup where price is already pressing against resistance, leaving minimal room for new participants. The category would move to 20% only if SMH broke above resistance on sustained volume, confirming that AI compute leadership can attract institutional accumulation; until then, the current 10% stake captures the upside without overcommitting capital to a setup where risk/reward asymmetry has deteriorated.
Traditional Energy — XLE
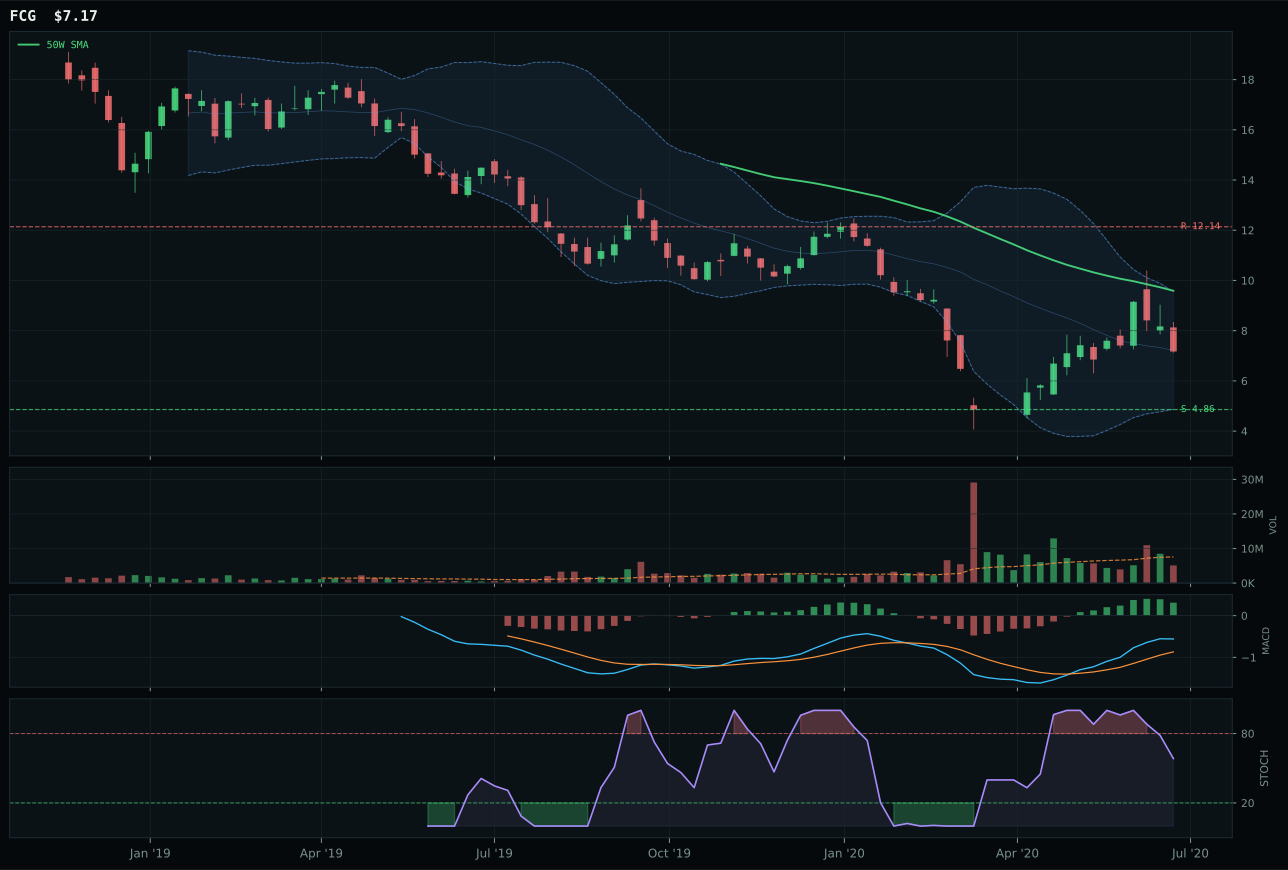
FCG has a neutral structure profile with 62.7% 13-week relative strength versus SPY.
Extension and support failure are the main tactical risks.
Tracked, but not top-2 eligible because: structurally broken.
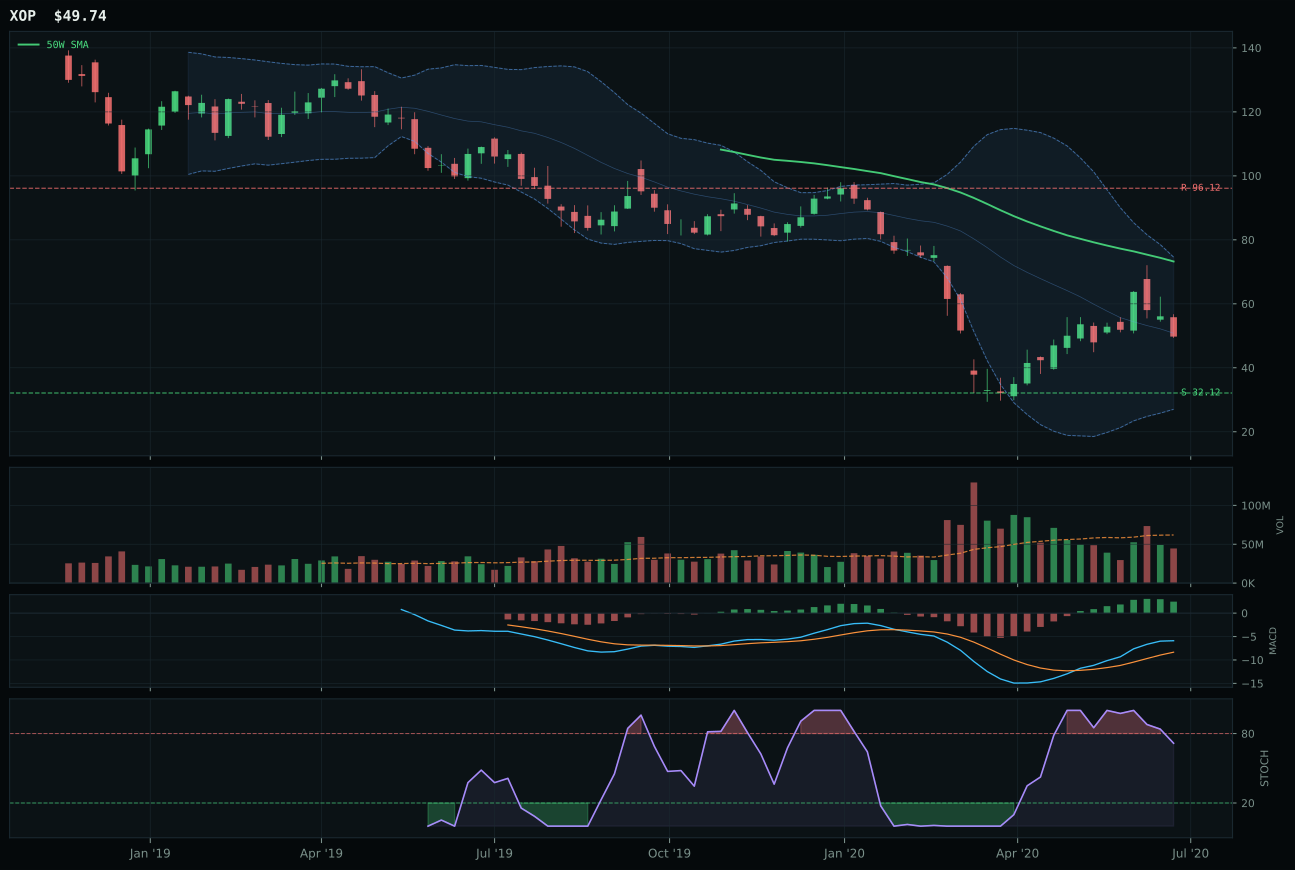
XOP has a neutral structure profile with 36.5% 13-week relative strength versus SPY.
Extension and support failure are the main tactical risks.
Tracked, but not top-2 eligible because: structurally broken.
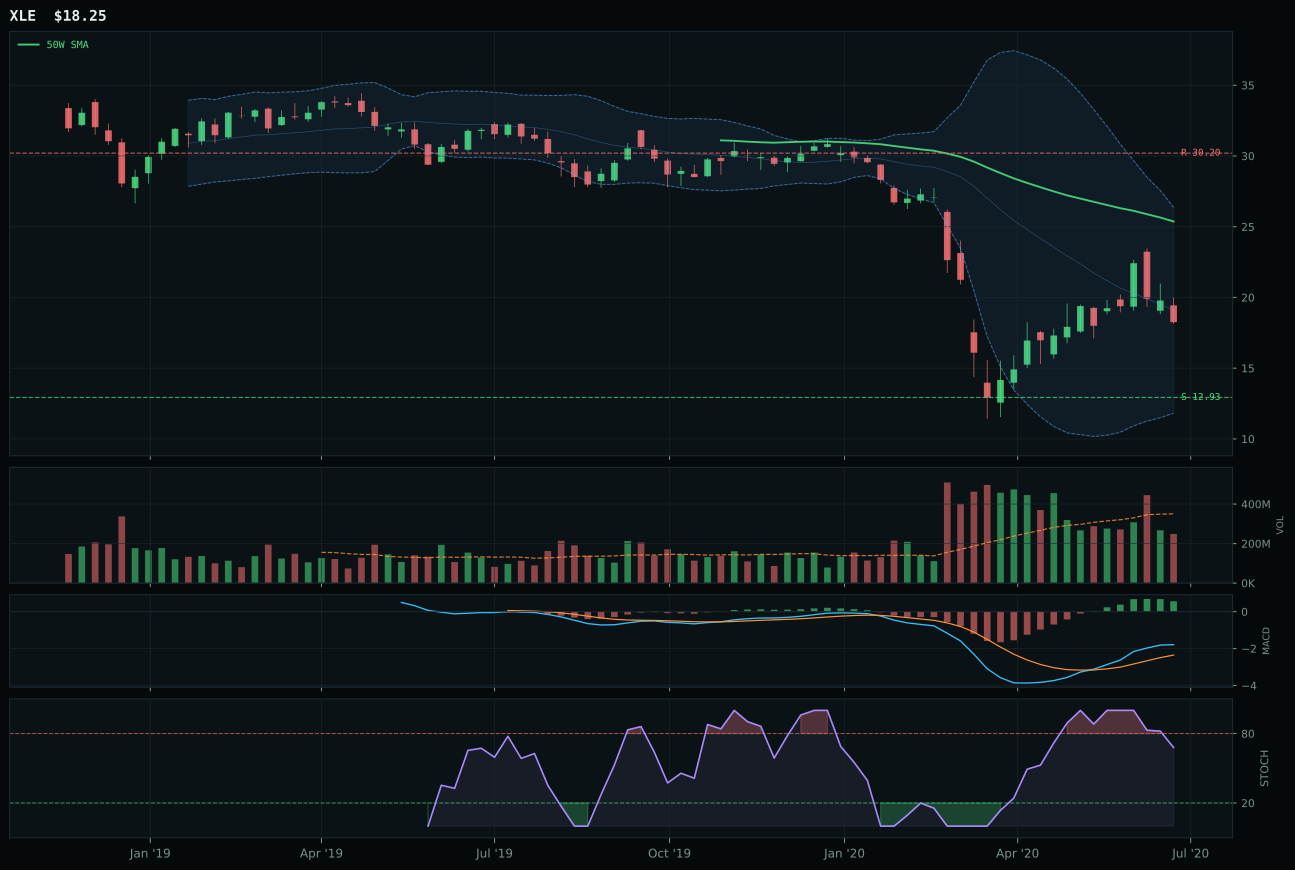
XLE has a neutral structure profile with 10.5% 13-week relative strength versus SPY.
Extension and support failure are the main tactical risks.
Tracked, but not top-2 eligible because: structurally broken.
XLE won Traditional Energy by elimination rather than enthusiasm, capturing a category where all three ETFs exhibited poor technical structure and fragile trends. Energy's 28.9% thirteen-week return sits atop a base that is 28% below the 50-week moving average, occupying deep retracement / value zone pricing that appeals only to committed value rotators, not trend followers. XLE's 55.0 trend score reflected the reality that price remains below both the 50W and 200W, while structure deteriorated to 34.0/100—the worst reading in this allocation universe—indicating technical chaos rather than clean setup. FCG's thin volume (thin participation) and 0.71x average volume on XLE precluded either ETF from demonstrating institutional accumulation; this category represents macro conviction (energy scarcity +16, inflation pressure +10) deployed despite technical evidence suggesting continued weakness. MACD is bullish-and-improving on all three contenders, a solo positive in an otherwise dreary technical landscape.
Traditional Energy earned 10% allocation as a macro hedge against energy scarcity escalation despite failing eligibility (eligible: False) due to structural deterioration in both price and volume. The 81.0 category-level macro fit (highest in the portfolio) offset 38.4 technical evidence, creating a stark risk-reward imbalance where the allocator is betting macro outweighs technicals. XLE's 31.8 volume-price confirmation and 39.1 persistence scores confirm that energy is being accumulated passively by macro hedgers, not actively by technical traders; the price action is grinding upward against minimal conviction. The 10% allocation should be deployed with clear exit triggers: if XLE closes below 12.93 (support at Fib 0.618), the macro thesis has failed and the position should shrink to 5%; if energy scarcity descriptors turn inactive due to supply surprises, the allocation has no technical anchor to defend it. This category currently exists solely because inflation is real and energy shortage is credible; without those two conditions, it ranks at the portfolio bottom.
Utilities & Infrastructure — PAVE
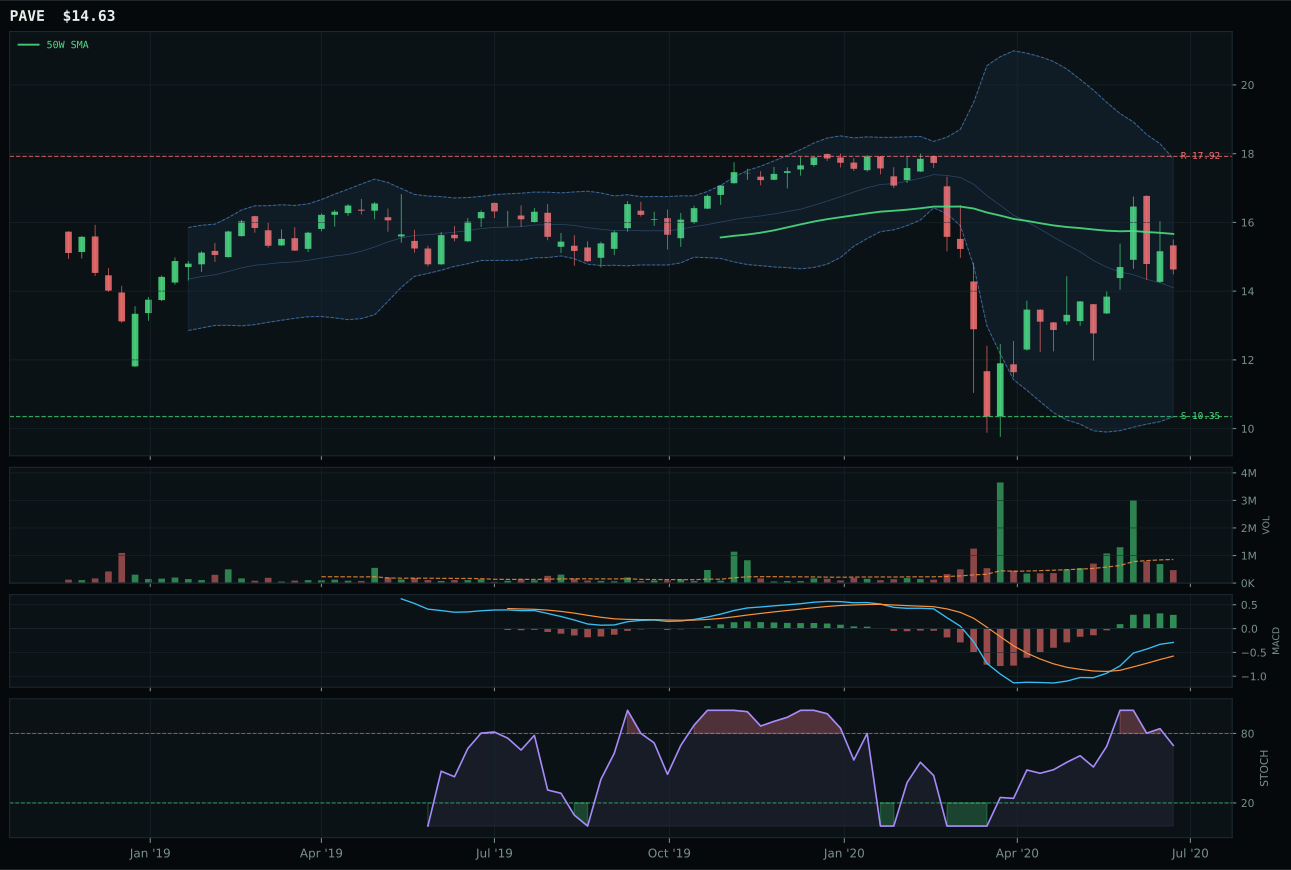
PAVE has a neutral structure profile with 4.5% 13-week relative strength versus SPY.
A failed hold above support would weaken the setup.
Actionable but governed by invalidation levels.
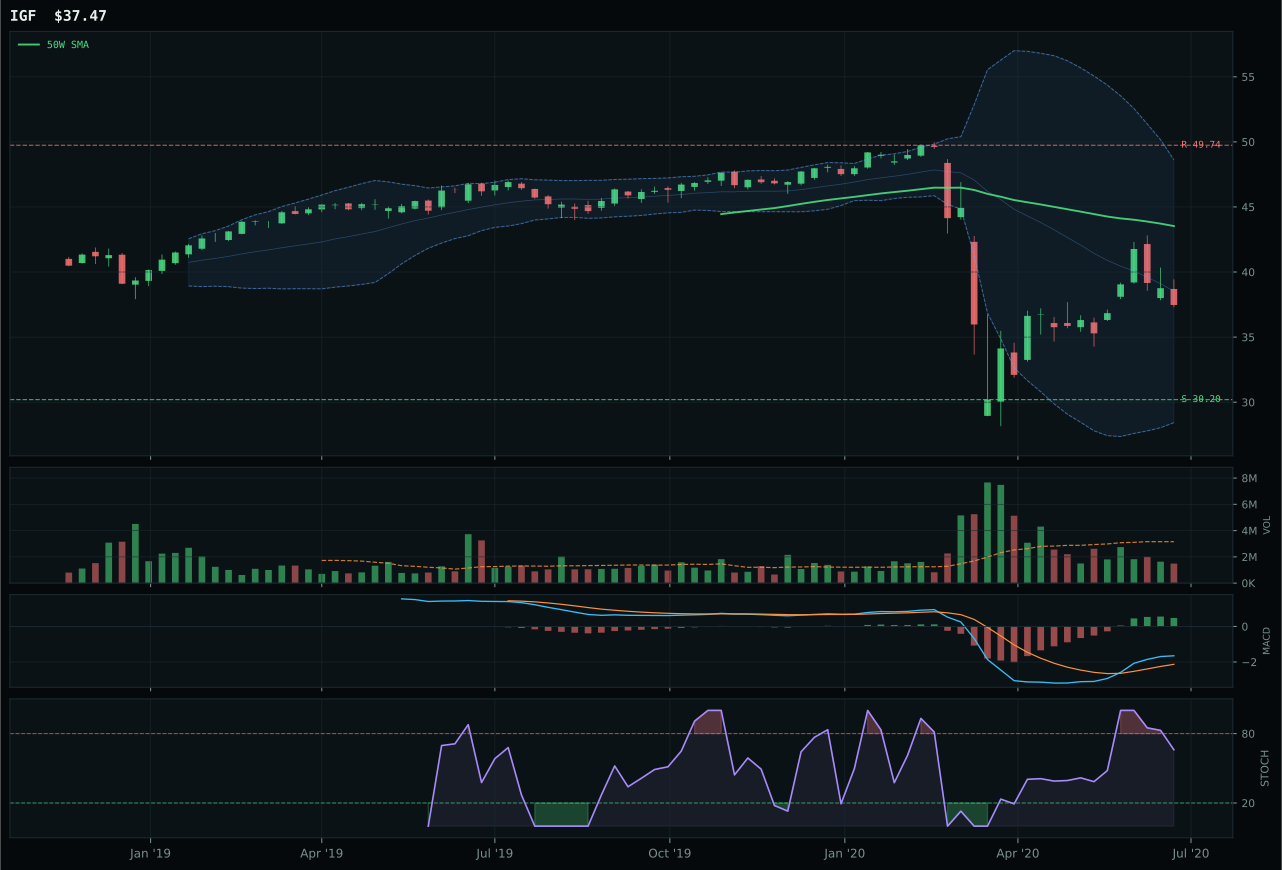
IGF has a neutral structure profile with -8.6% 13-week relative strength versus SPY.
A failed hold above support would weaken the setup.
Actionable but governed by invalidation levels.
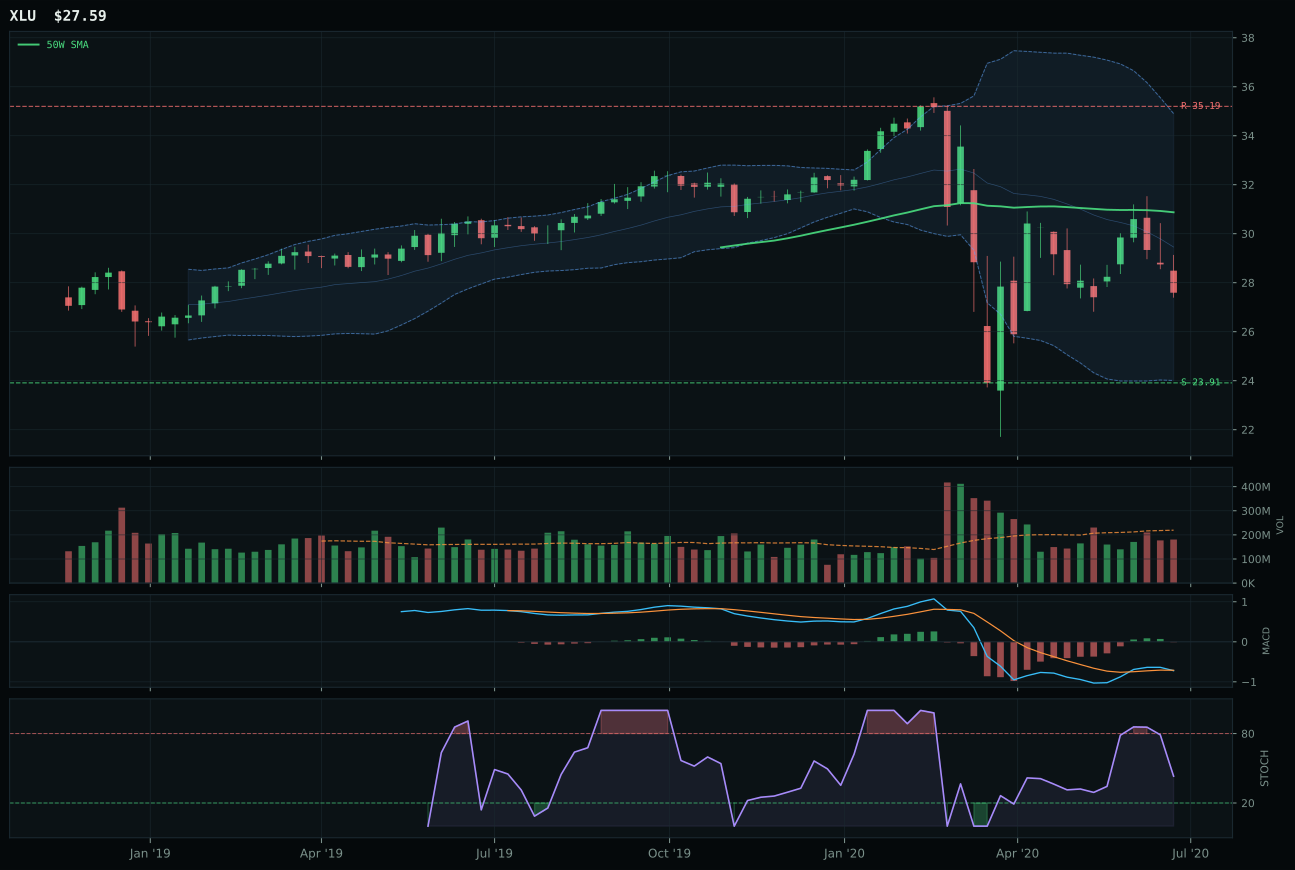
XLU has a neutral structure profile with -19.3% 13-week relative strength versus SPY.
A failed hold above support would weaken the setup.
Actionable but governed by invalidation levels.
PAVE won Utilities & Infrastructure through superior category-relative strength (13.2% versus IGF's 0.0%) and timing (75.0 versus 55.0), capturing the domestic infrastructure and capex-beta narrative with a pullback setup that offered reasonable defensive entry despite thin volume. Infrastructure equity's 22.9% thirteen-week return and bullish-and-improving MACD with falling/neutral stochastic created conditions where the chart had pulled back (6.6% below 50W) but momentum had not yet turned hostile, mirroring the compression/coil setups preferred by Late-Cycle accumulation. IGF's -8.6% relative strength versus SPY signaled that global infrastructure income was underperforming the broad market, a red flag within a category that should offer relative strength as inflation hedges. PAVE's 100.0 momentum confirmation score reflected active 4W and 13W accumulation despite thin volume, suggesting that the buyers present were institutional and patient, not reactive retail chasing breakouts.
Utilities & Infrastructure earned 10% allocation as a defensive capex-beta hedge within an environment where defensive rotation (+12) and Late-Cycle Reflation framework both argue that infrastructure spending accelerates before business cycles peak. PAVE's 69.7 technical evidence combined with only 43.0 macro fit to produce a 40.5 category score positioned utilities as the weakest category among the eight in-allocation slots, yet the portfolio holds the position because infrastructure capex is structural, not cyclical. Domestic infrastructure (PAVE) was chosen over global income (IGF) because relative strength favored PAVE and because capex cycles typically outperform income streams in reflation regimes. The 10% allocation should shrink to 5% if PAVE breaks below 10.35 support or if defensive rotation descriptor deactivates; it should expand to 15% if the 50-week moving average slope turns decisively positive and MACD accelerates, both of which would signal that infrastructure demand had moved from defensive rotation into genuine capex acceleration. This category currently ranks at portfolio bottom on technical evidence; its allocation rests entirely on macro conviction about infrastructure spending.
Defense & Aerospace — ITA
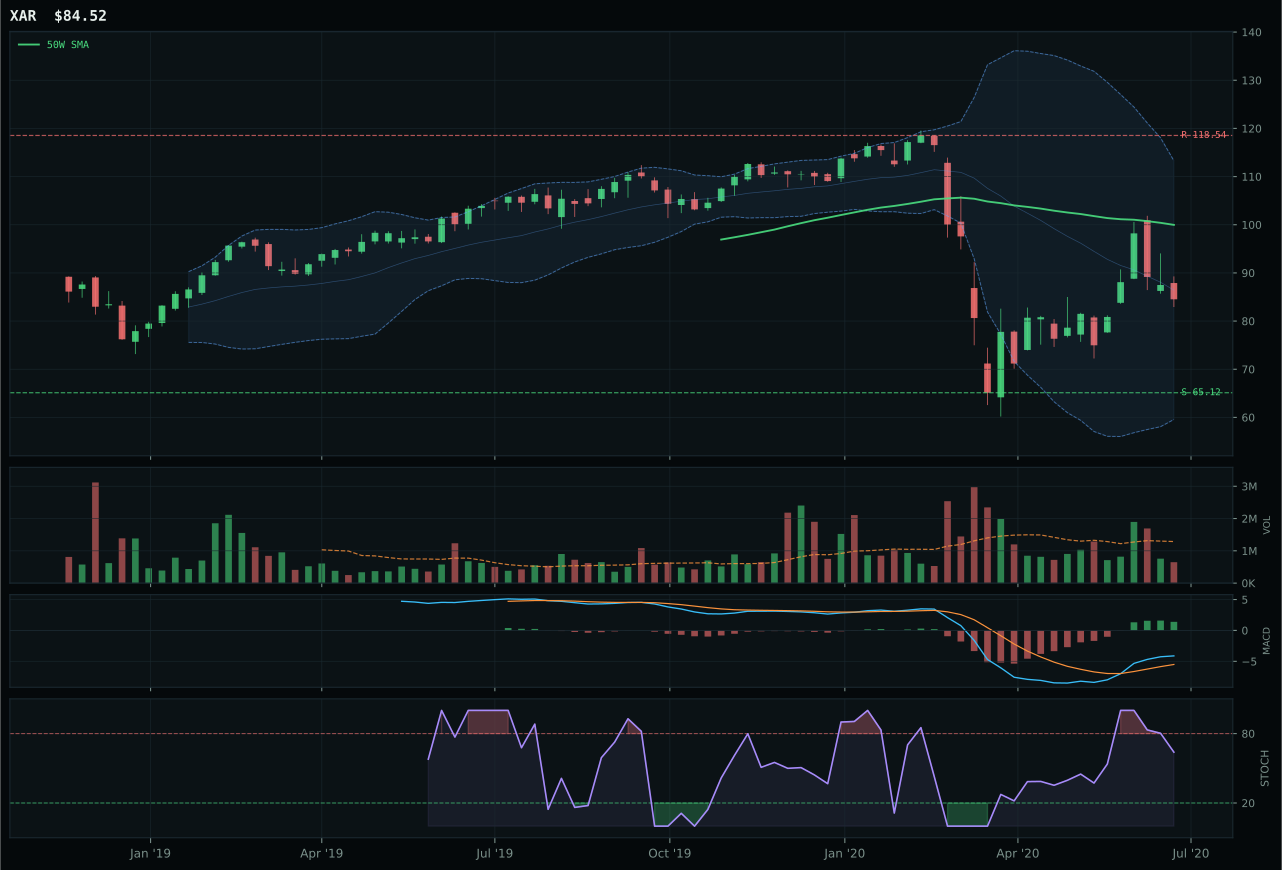
XAR has a neutral structure profile with -9.7% 13-week relative strength versus SPY.
A failed hold above support would weaken the setup.
Actionable but governed by invalidation levels.
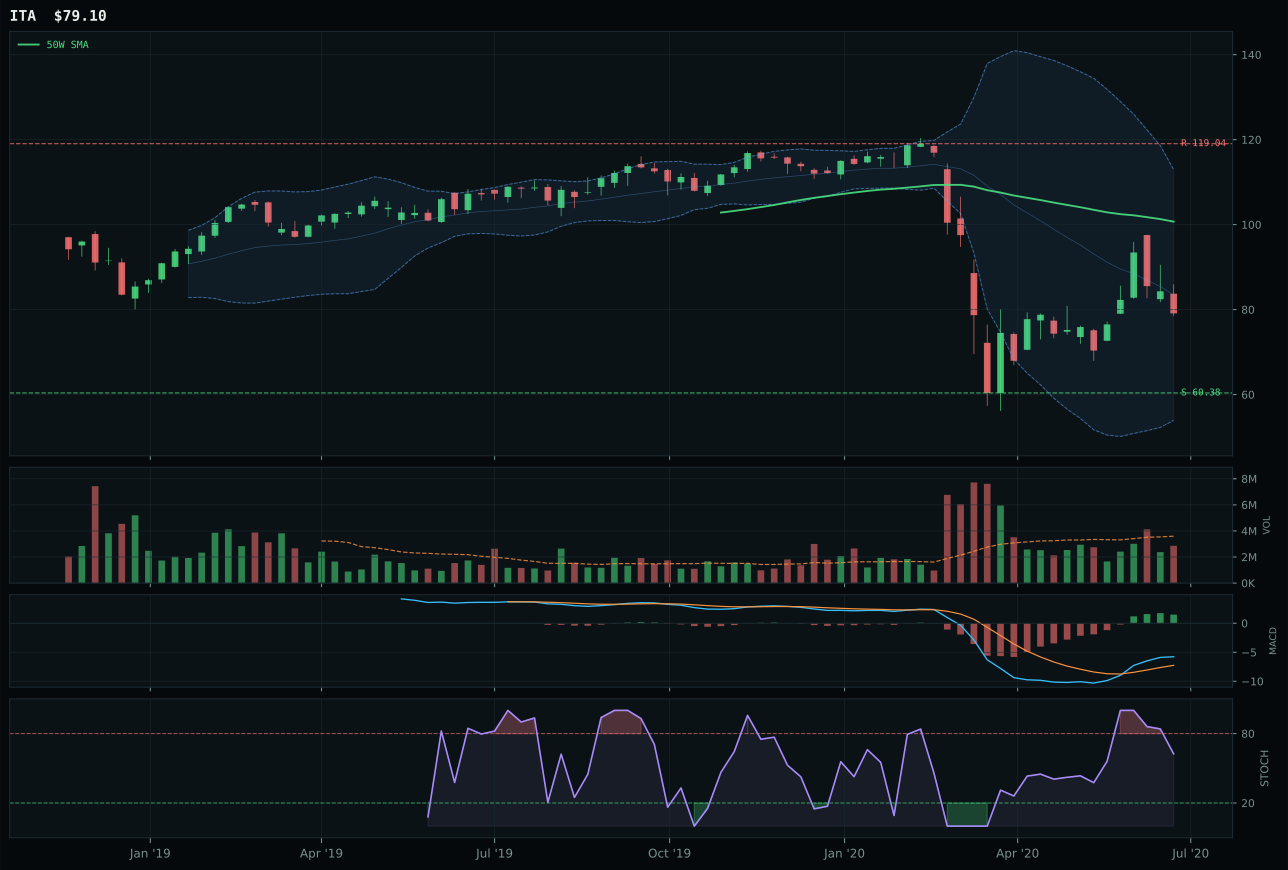
ITA has a neutral structure profile with -12.2% 13-week relative strength versus SPY.
A failed hold above support would weaken the setup.
Actionable but governed by invalidation levels.
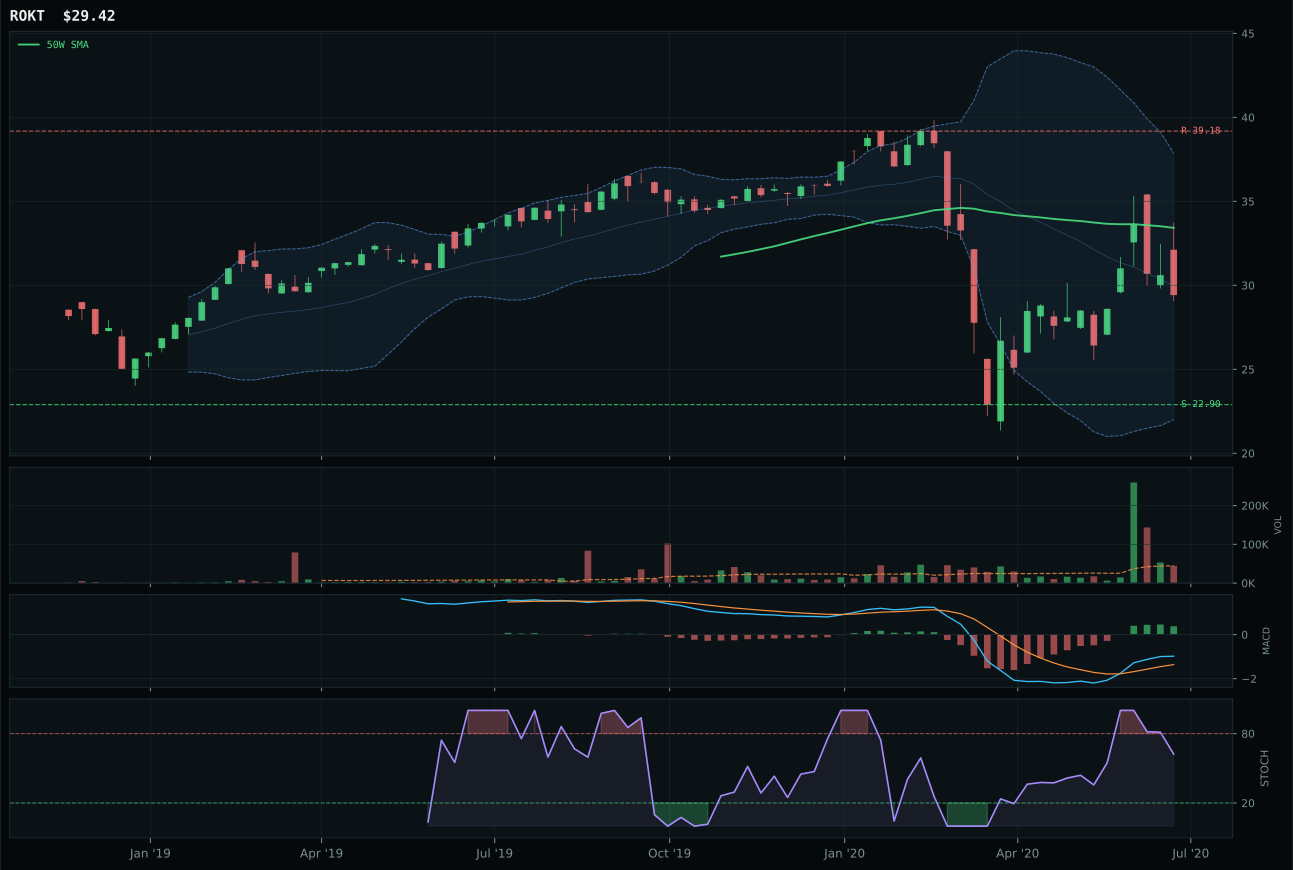
ROKT has a neutral structure profile with -8.2% 13-week relative strength versus SPY.
A failed hold above support would weaken the setup.
Tracked, but not top-2 eligible because: .
ITA won the Defense & Aerospace category not because it demonstrated strength, but because XAR's structural and momentum weaknesses were worse. Both ETFs sit below their 50-week and 200-week moving averages with -12.2% and -9.7% relative strength versus SPY respectively, occupying the deep retracement / value zone near the 0.618 Fibonacci level—classic fear-and-value territory. ITA's 57.5 risk/reward score (upside -33.6% to resistance, downside 31% to support) marginally beat XAR's 55.3, while ITA's 65.3 structure score reflected slightly better compression than XAR's 64.1. Both are supported by bullish-and-improving MACD and falling/neutral stochastic readings, but XAR's thin volume participation versus ITA's neutral participation mattered when neither ETF was attracting accumulation. This was a selection between defensive retracements, not a ringing endorsement of either candidate.
Defense & Aerospace earned 10% allocation as a defensive hedge within a Late-Cycle Reflation environment where broad market bear and defensive rotation descriptors are both active with +6 weight each. The 39.4 category score reflected weak technical fundamentals (40.7/100) rescued by 60.0 macro fit, suggesting the allocation thesis rests on macro protection rather than chart conviction. ITA's 36.0 momentum confirmation score signals virtually no accumulation is occurring; the category persists in this portfolio because late-cycle reflation typically precedes risk-off episodes where defense outperforms cyclicals. The 10% sizing is appropriate given the technical fragility and absence of constructive price structure; this allocation should shrink immediately if momentum confirmation rises above 50 and stochastic RSI rises above 0.70, both of which would signal buyers had finally stepped in. Until then, PAVE and COPX, which show actual breadth and volume, offer better relative value.
Nuclear Energy — URA
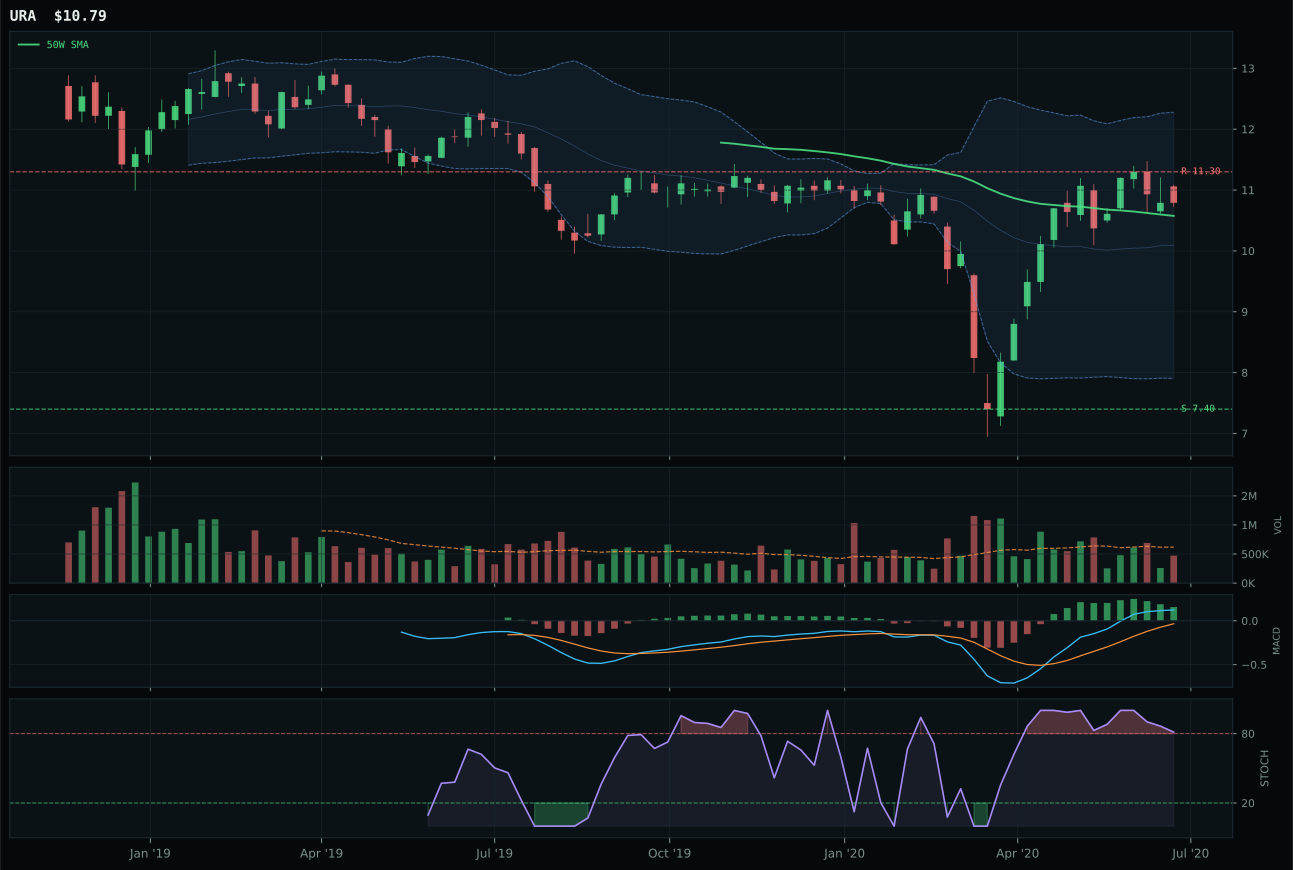
URA has a compression near 50W profile with 13.5% 13-week relative strength versus SPY.
A failed hold above support would weaken the setup.
Tracked, but not top-2 eligible because: .
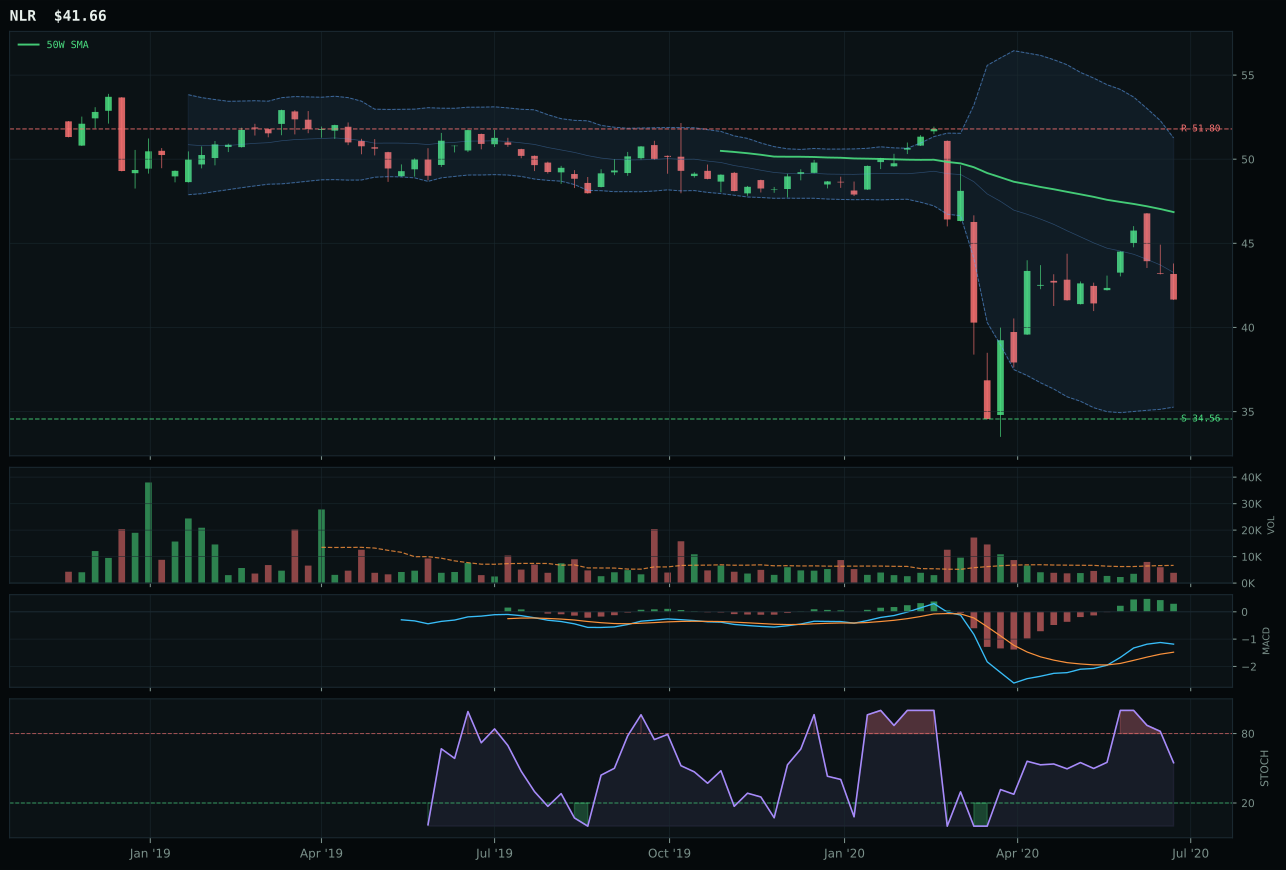
NLR has a neutral structure profile with -12.2% 13-week relative strength versus SPY.
Extension and support failure are the main tactical risks.
Tracked, but not top-2 eligible because: structurally broken.
URA secured the Nuclear Energy category with superior timing (77.0 versus NLR's 55.0) and structure (74.0 versus 37.3) by establishing compression near the 50-week moving average where a coiled setup could activate with expanded volume. Nuclear's 31.9% thirteen-week return arrived alongside only 2.0% distance to the 50W—a setup that rewards defenders of that level with explosive upside if institutional buyers step in. URA's bullish-but-flattening MACD and overbought-rolling-over stochastic signaled momentum had not yet turned hostile, while NLR's bullish-and-improving MACD masked a structurally broken chart (cleanliness 37.3 indicates scattered support/resistance levels). Category-relative strength of 12.9% for URA versus -12.9% for NLR confirmed that uranium demand was consolidating around the smaller, more focused ETF, not spreading across utility-focused nuclear exposure. The 54.8-point gap was decisive because one contender offered a legitimate reaccumulation setup and the other offered deteriorating technicals.
Nuclear Energy earned 10% allocation as an energy-scarcity and real-asset-inflation hedge within a regime where energy scarcity (+9) and real asset sponsorship (+7) both reinforce the view that thermal and power-generation commodities will sustain supply premiums. URA's 45.0 technical evidence score was middling—trend only 66.0 due to price still below 200W, risk/reward only 46.8 due to compressed upside—yet 69.0 category-level macro fit justified allocation within a Late-Cycle Reflation framework. The current setup with price compressing near 50W support offers a logical entry point for allocators building inflation-hedge positions; if volume surges above 0.9x average (historically thin at 0.76x), URA could attract 10% allocation. For now, the 10% stake represents a foundation position in uranium demand that pairs naturally with COPX and MOO in the real-asset sleeve; it remains a leveraged inflation bet rather than a clean technical buy, making it the first sleeve to trim if risk appetite abruptly reverses.
Industrial Metals — COPX
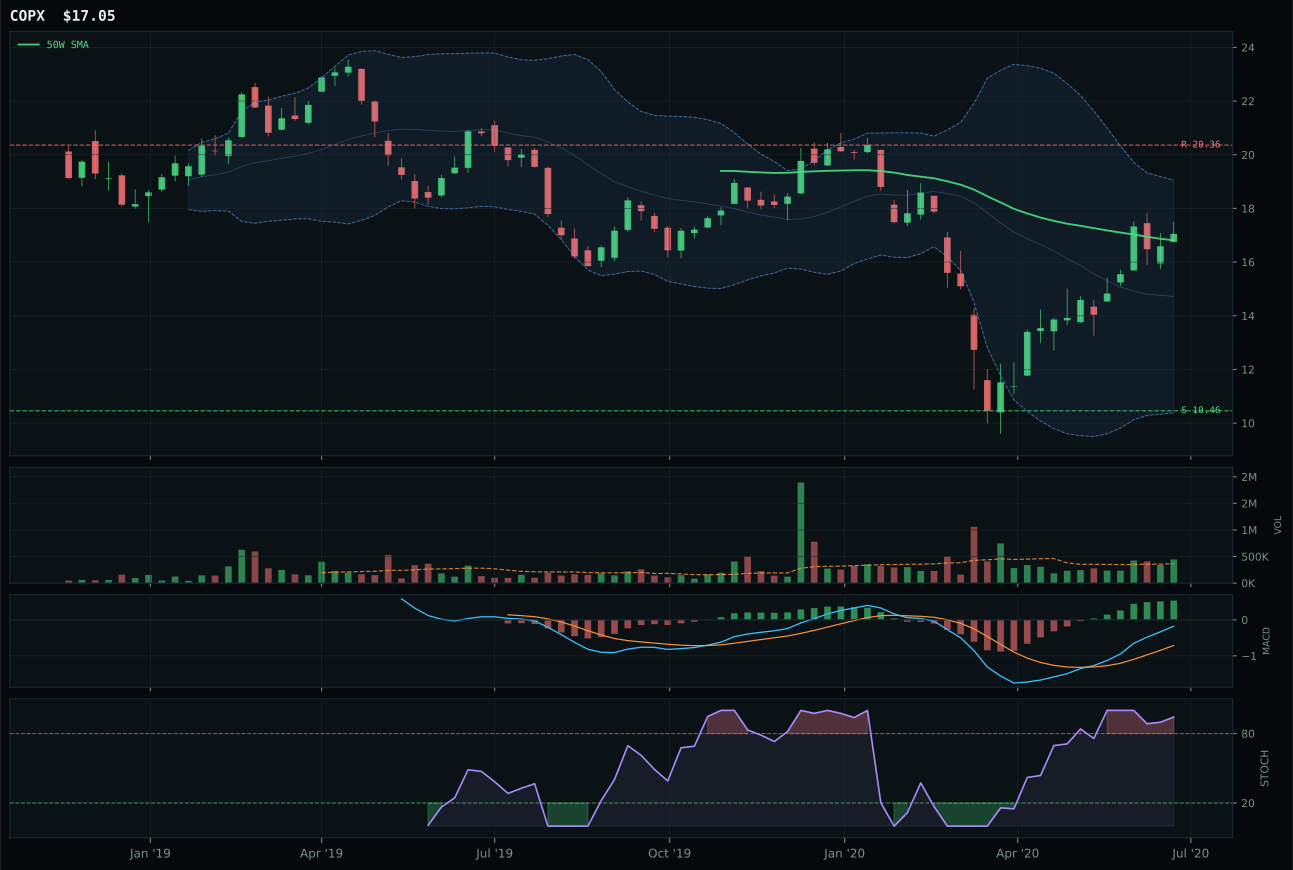
COPX has a compression near 50W profile with 29.6% 13-week relative strength versus SPY.
A failed hold above support would weaken the setup.
Tracked, but not top-2 eligible because: .
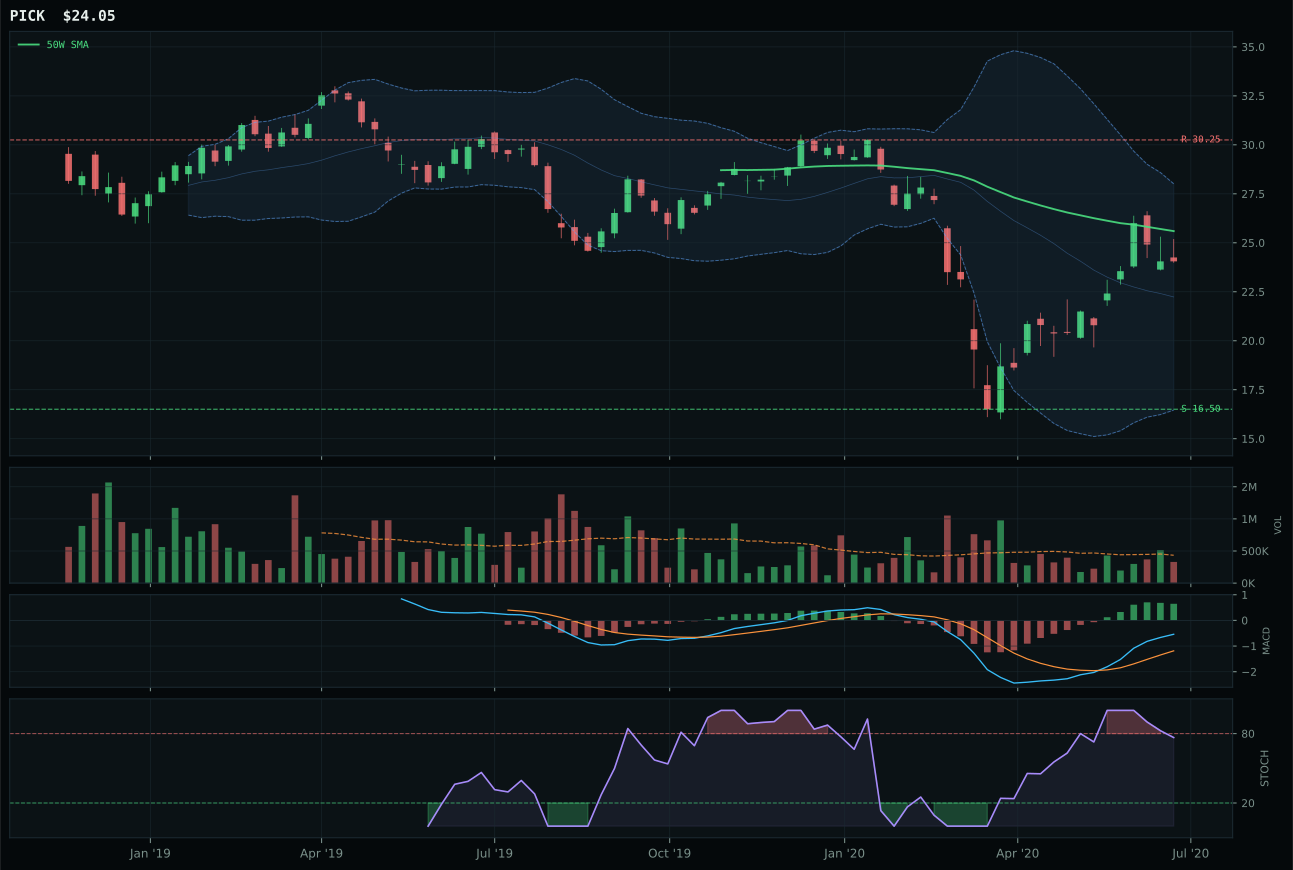
PICK has a neutral structure profile with 10.3% 13-week relative strength versus SPY.
Extension and support failure are the main tactical risks.
Tracked, but not top-2 eligible because: structurally broken.
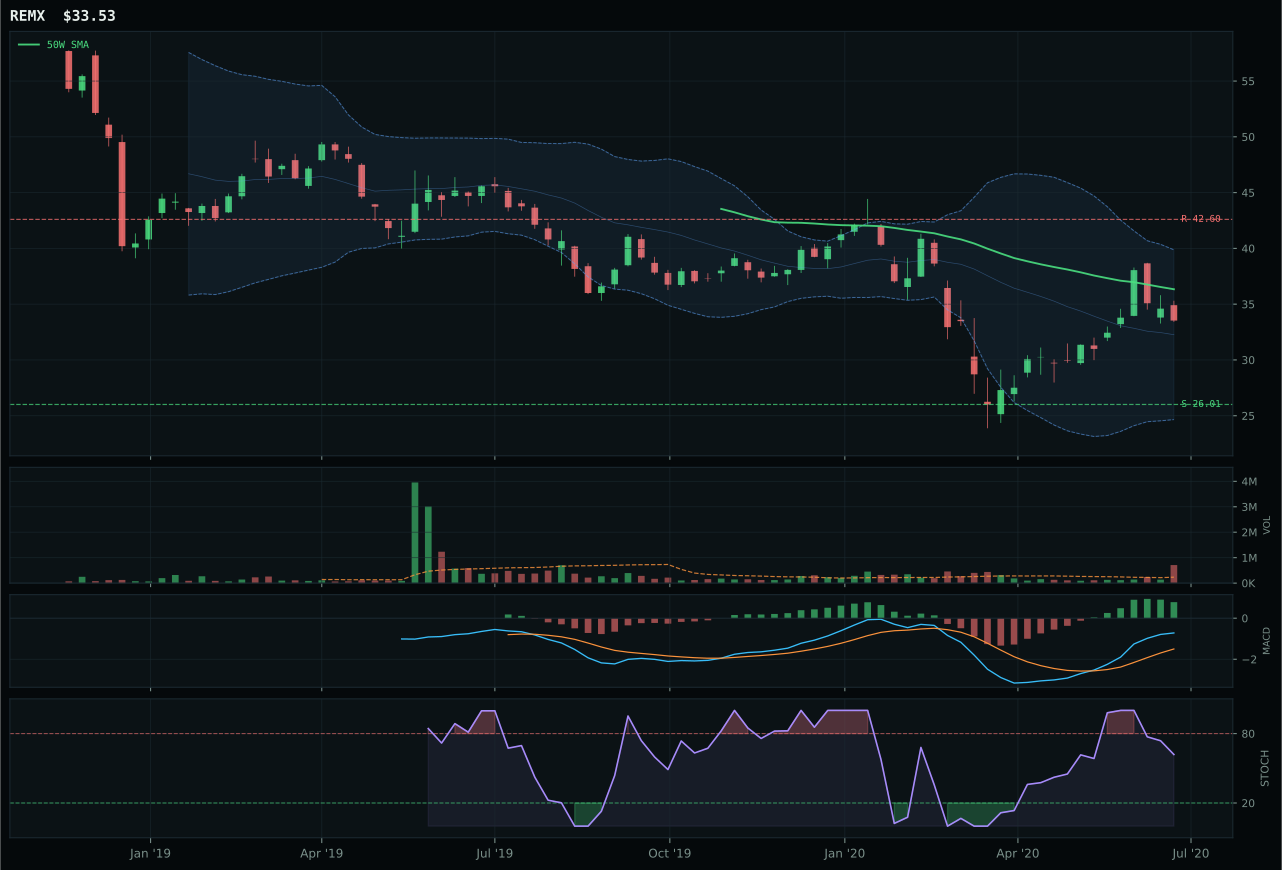
REMX has a neutral structure profile with 4.4% 13-week relative strength versus SPY.
Extension and support failure are the main tactical risks.
Tracked, but not top-2 eligible because: structurally broken.
COPX dominated Industrial Metals with dominant momentum, relative strength, and setup quality that rendered other candidates peripheral. Copper scarcity's 48.0% thirteen-week return, 29.6% relative strength versus SPY, and 19.3% category-relative strength reflected sustained conviction behind commodity inflation; the compression setup near the 50-week moving average (only 1.4% away) with MACD bullish-and-improving and stochastic overbought-rolling-over created a technically sound reaccumulation zone. PICK's structurally broken chart (39.6 structure score versus COPX's 79.4) and thin volume participation made it impossible to justify even as a secondary expression, despite 28.7% thirteen-week returns. COPX's 82.1 volume-price confirmation and 99.6 persistence scores were exceptional, signaling that buyers defending the 50W level were institutional and committed, not retail speculation. The 41.5-point gap versus PICK reflected a category where momentum leadership was absolute.
Industrial Metals earned 10% allocation despite eligibility status of False due to exceptional macro sponsorship (metals scarcity +14, Late-Cycle Reflation +10, real asset sponsorship +6) and COPX's unambiguous technical momentum, which justified accepting the structural trade-off. The category score of 35.1 was artificially depressed by COPX's poor risk/reward (34.6/100 upside to resistance, 63.0% downside to support), reflecting the reality that copper has already rallied substantially and now prices in full commodity-inflation thesis. The 10% allocation is structured as a directional inflation bet on COPX's continued momentum rather than a fundamental metals-scarcity hedge, meaning this sleeve should be reduced to 5% if COPX breaks below 50-week support or volume deteriorates below 1.0x average. The allocator is essentially betting that metals inflation persists through quarter-end; if deflationary data emerges or central banks signal rate cuts, COPX's thin downside buffer (support at 10.46 represents 63% drawdown risk) becomes untenable.
Agriculture & Livestock — MOO
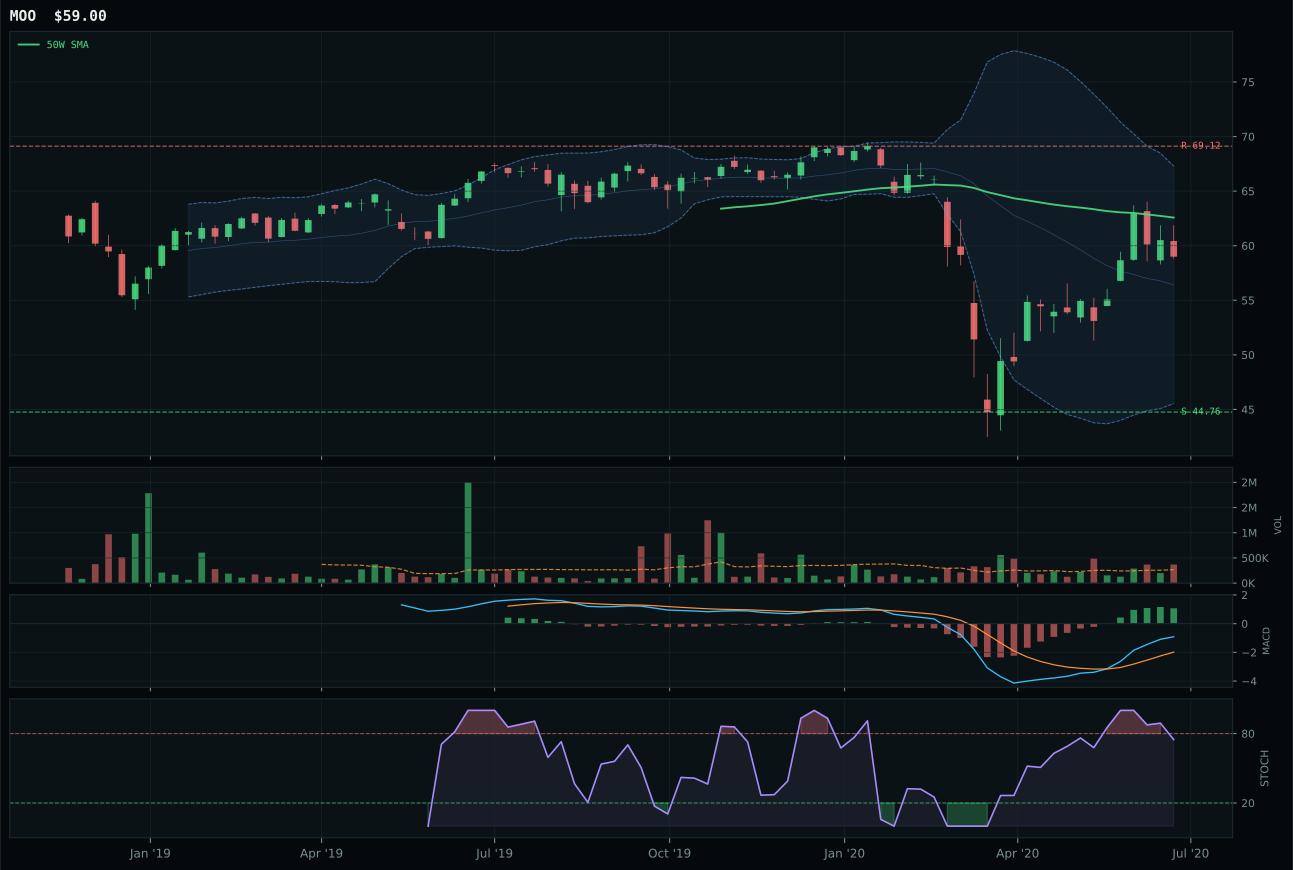
MOO has a neutral structure profile with 1.0% 13-week relative strength versus SPY.
A failed hold above support would weaken the setup.
Actionable but governed by invalidation levels.
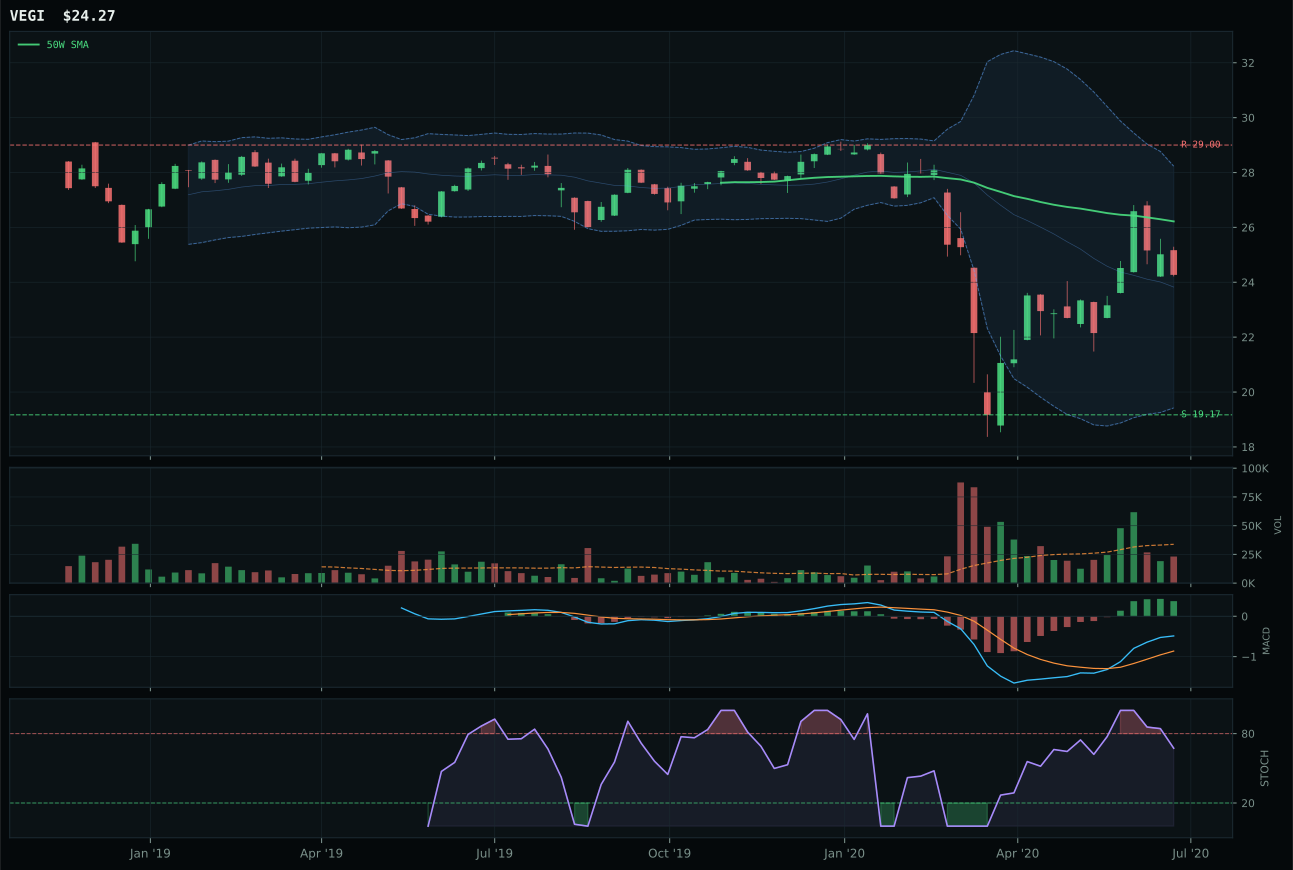
VEGI has a neutral structure profile with -3.2% 13-week relative strength versus SPY.
Extension and support failure are the main tactical risks.
Tracked, but not top-2 eligible because: structurally broken.
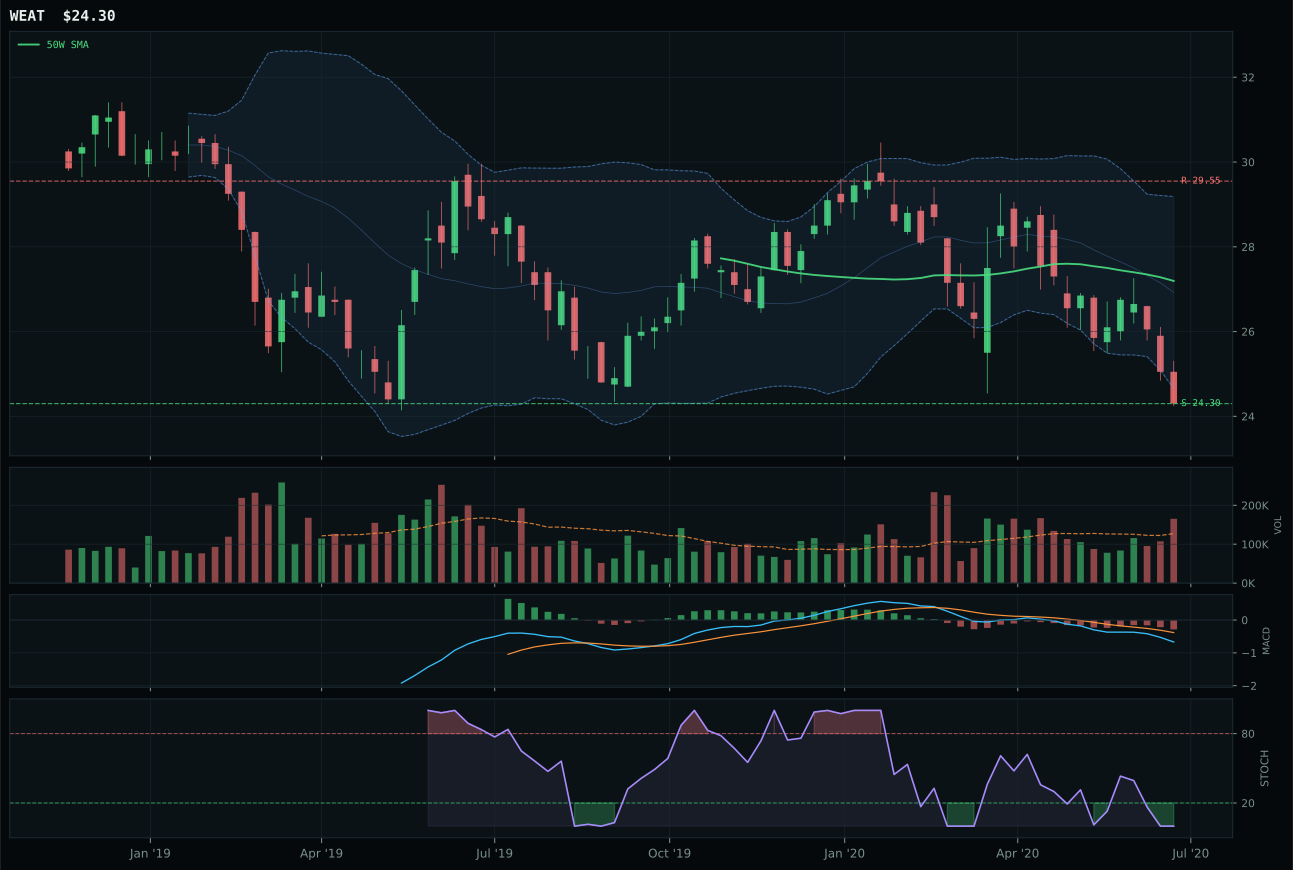
WEAT has a pullback into support profile with -33.1% 13-week relative strength versus SPY.
Extension and support failure are the main tactical risks.
Tracked, but not top-2 eligible because: structurally broken.
MOO captured Agriculture & Livestock despite sitting 5.7% below its 50-week moving average because its above-average volume participation (1.38x twenty-week average) and 92.2 momentum confirmation score demonstrated active accumulation in a pullback setup, not passive bouncing. VEGI's structurally broken chart (34.0 structure score versus MOO's 71.3) and thin volume participation made it ineligible despite 15.2% thirteen-week returns; when structure deteriorates that badly, relative strength gains become noise rather than evidence of sponsorship. MOO's 4.1% category-relative strength and bullish-and-improving MACD positioned the agribusiness ETF as the only legitimate expression of agricultural asset demand within the basket. The 57.6-point gap versus VEGI was decisive precisely because MOO offered clean technical evidence (volume above average, MACD confirming, compression zone near 50W) in a category where both commodity prices and equity demand are fragile.
Agriculture & Livestock earns zero allocation this week despite MOO's strong technicals because the category scored only 29.4 and failed eligibility filters. The macro fit is excellent (72% from inflation pressure and real asset sponsorship active), but technical evidence at 75.3 for MOO cannot overcome the category-level structural breakdown when tested against persistence (65.8) and volume-price confirmation (71.2). At this moment, MOO's setup is too narrow relative to the broader commodity complex; the system would rather wait for category-wide confirmation before deploying capital into agribusiness.
Emerging Markets — IEMG
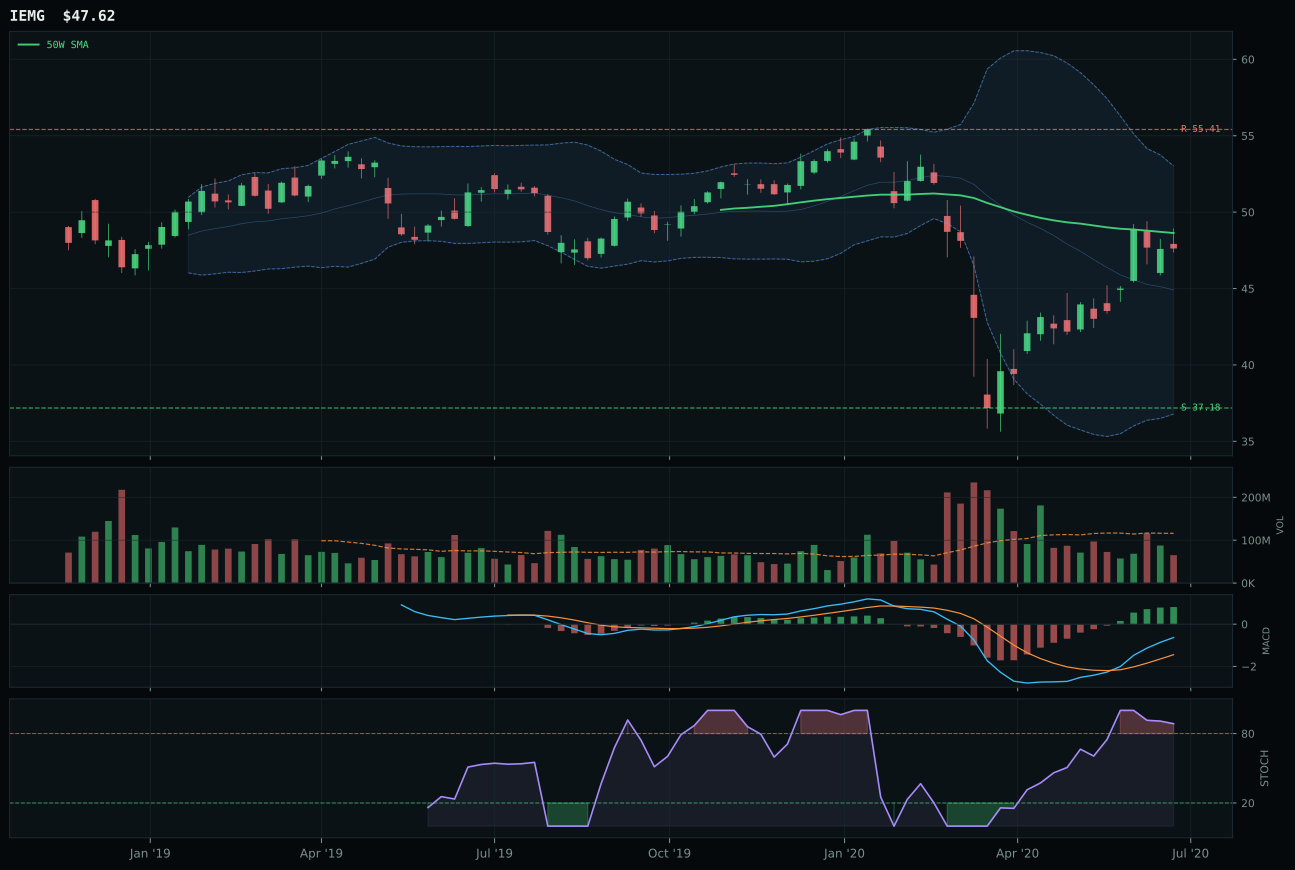
IEMG has a compression near 50W profile with 1.9% 13-week relative strength versus SPY.
Extension and support failure are the main tactical risks.
Tracked, but not top-2 eligible because: structurally broken.
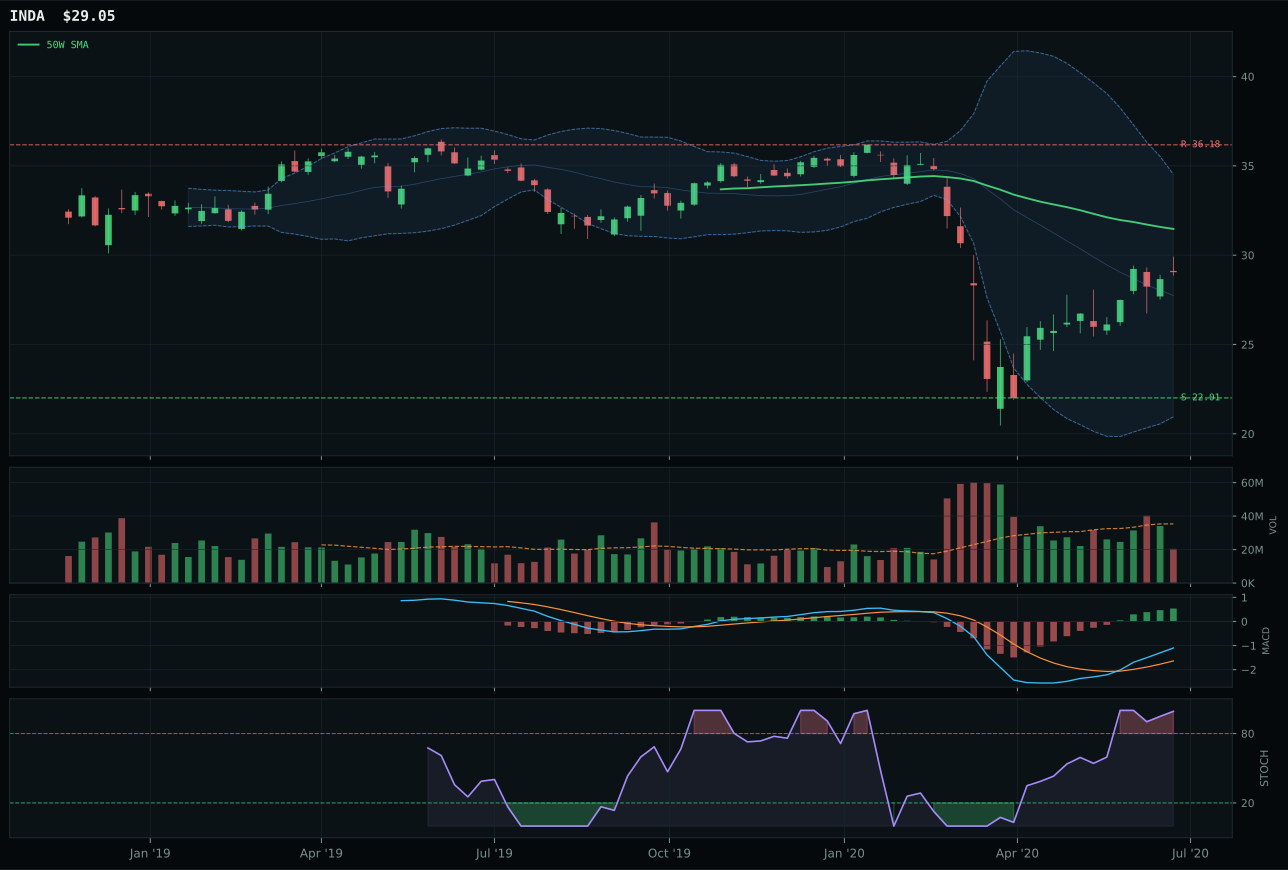
INDA has a neutral structure profile with 4.0% 13-week relative strength versus SPY.
Extension and support failure are the main tactical risks.
Tracked, but not top-2 eligible because: structurally broken.
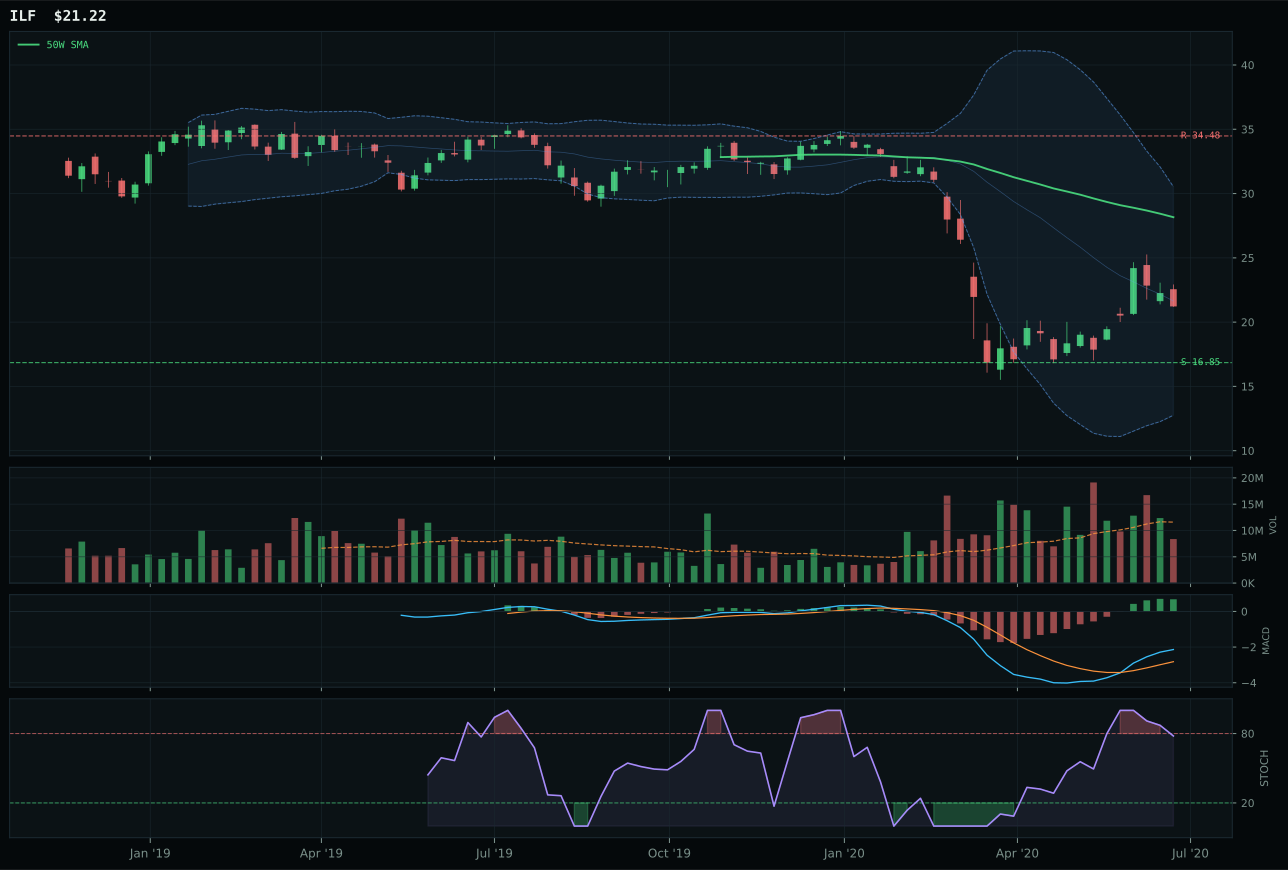
ILF has a neutral structure profile with -0.2% 13-week relative strength versus SPY.
Extension and support failure are the main tactical risks.
Tracked, but not top-2 eligible because: structurally broken.
IEMG won Emerging Markets by offering compression near the 50-week moving average (just 2.1% below) with the cleanest timing setup (82.0) among a basket where all three candidates were struggling. Broad emerging-market beta's 20.3% thirteen-week return paired with bullish-and-improving MACD and compression zone created the only legitimate reaccumulation setup available; INDA's neutral structure and 57.0 timing score reflected price sitting deeper into the middle retracement zone with less urgency for buyers to defend. IEMG's 80.8 momentum confirmation indicated adequate conviction despite thin volume participation, while INDA's failure to break above compression cost it timing score and placed it in structurally-broken territory. Both contenders faced identical macro headwinds (credit stress -8, liquidity stress -8, broad market bear is active), so the winner was determined purely by chart quality and entry urgency.
Emerging Markets scored 5.1 and sits completely outside the allocation (0%) because the category macro fit is only 29%, dragged down by credit stress (-10) and liquidity stress (-10) now active against risk appetite positive (+8). IEMG's timing and compression are appealing, but the macro regime is hostile to emerging-market capital flows. The technical setup alone cannot overcome a 29% macro fit in Late-Cycle Reflation with twin stress signals active. To re-enter allocation, this category needs either a reversal in credit or liquidity stress descriptors, or a breakout in EM technicals so clean that it forces a reassessment. Neither is visible.