
2020-06-19
Informational purposes only. The content in this report, including allocations, analysis, and commentary, is provided solely for informational and educational purposes. It does not constitute financial advice, investment advice, trading advice, or any other type of advice. Past performance does not guarantee future results. Always conduct your own research and consult a qualified financial professional before making investment decisions.
Some tracked tickers were excluded due to missing live weekly price data: SGOV: Historical cache SGOV has only 3 usable weekly bars; URNM: Historical cache URNM has only 29 usable weekly bars
Weekly Allocation
| Ticker | Category | Weight | Role |
|---|---|---|---|
| SLV | Precious Metals | 20% | Top-2 (20%) |
| IGV | Technology | 20% | Top-2 (20%) |
| XLU | Utilities & Infrastructure | 10% | Tier-2 (10%) |
| SMH | AI | 10% | Tier-2 (10%) |
| ITA | Defense & Aerospace | 10% | Tier-2 (10%) |
| NLR | Nuclear Energy | 10% | Tier-2 (10%) |
| MOO | Agriculture & Livestock | 10% | Tier-2 (10%) |
| XLE | Traditional Energy | 10% | Tier-2 (10%) |
Trade Instructions — Monday Open
Sell the tranche from 2020-05-22 (completing its 4-week hold). Buy the new tranche. Instructions show net portfolio changes — same-asset positions cancel, weight changes show the delta.
| Action | Ticker | Instruction |
|---|---|---|
| SELL | BOTZ | Sell 40% of BOTZ position (reduce 12.50% → 7.50%) |
| SELL | IGF | Sell 50% of IGF position (reduce 5.00% → 2.50%) |
| SELL | ILF | Sell entire ILF position (2.50% of portfolio) |
| SELL | XAR | Sell 50% of XAR position (reduce 5.00% → 2.50%) |
| BUY | SLV | Buy SLV — 20.00% of freed cash (adds 2.50% to portfolio) |
| BUY | ITA | Buy ITA — 20.00% of freed cash (adds 2.50% to portfolio) |
| BUY | MOO | Buy MOO — 20.00% of freed cash (adds 2.50% to portfolio) |
| BUY | SMH | Buy SMH — 20.00% of freed cash (adds 2.50% to portfolio) |
| BUY | XLU | Buy XLU — 20.00% of freed cash (adds 2.50% to portfolio) |
Current Portfolio After Trade
Combined holdings across all 4 active tranches. Each tranche is 25% of the portfolio.
| Ticker | % of Portfolio | Weight Bar |
|---|---|---|
| SLV | 15.00% | |
| CIBR | 10.00% | |
| XLE | 7.50% | |
| ITA | 7.50% | |
| MOO | 7.50% | |
| SMH | 7.50% | |
| BOTZ | 7.50% | |
| URA | 5.00% | |
| PAVE | 5.00% | |
| XLK | 5.00% | |
| IGV | 5.00% | |
| IGF | 2.50% | |
| XAR | 2.50% | |
| IEMG | 2.50% | |
| REMX | 2.50% | |
| FCG | 2.50% | |
| XLU | 2.50% | |
| NLR | 2.50% |
Macro Regime — Risk-Off Deterioration
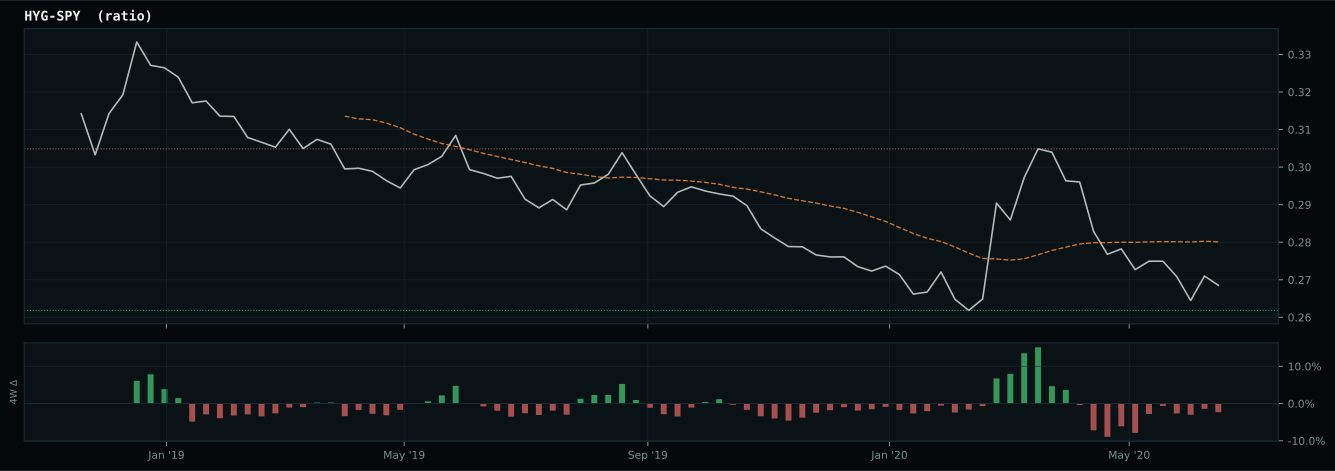
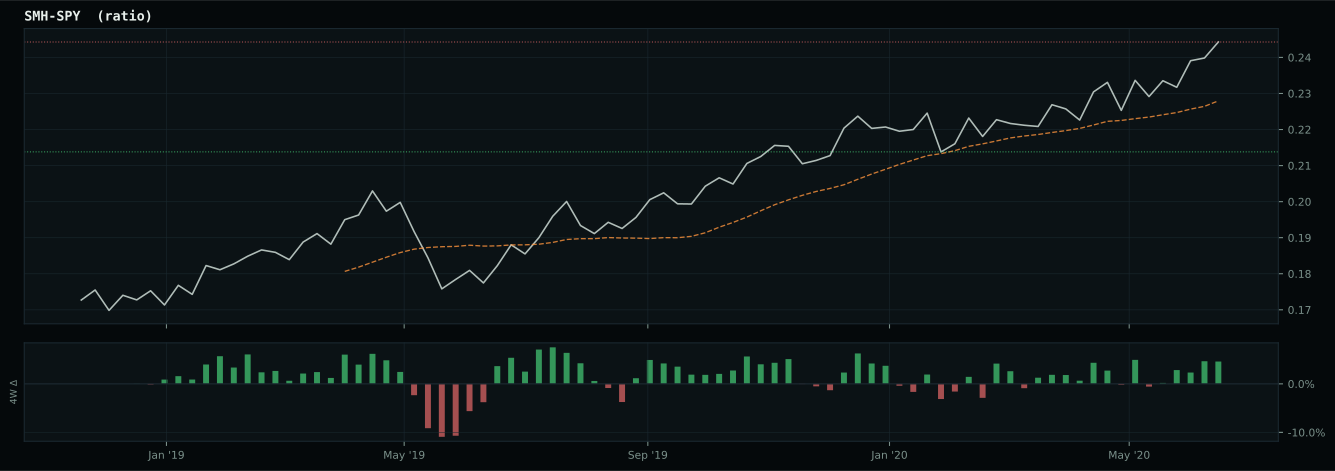
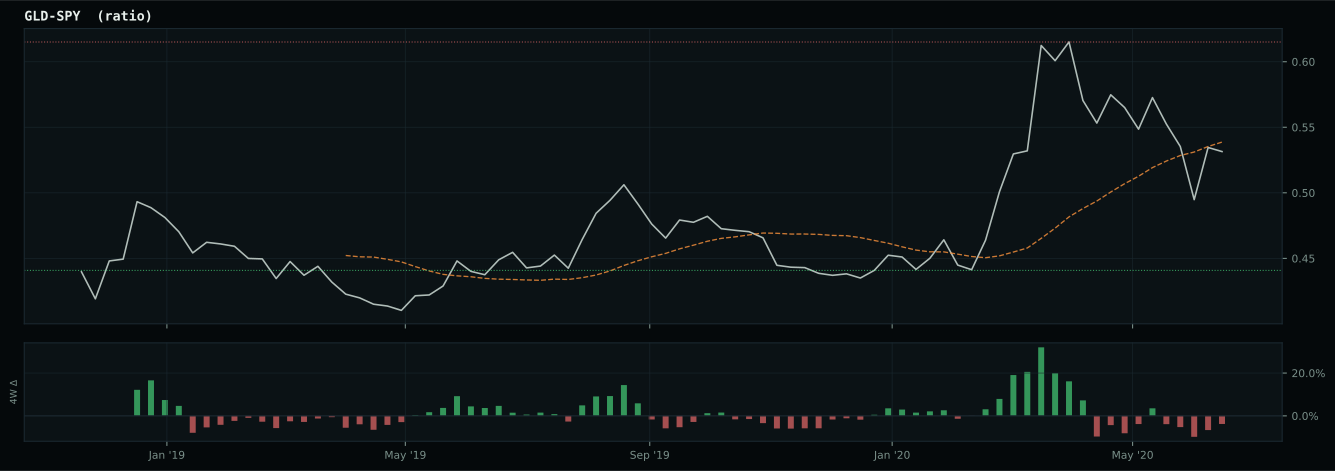
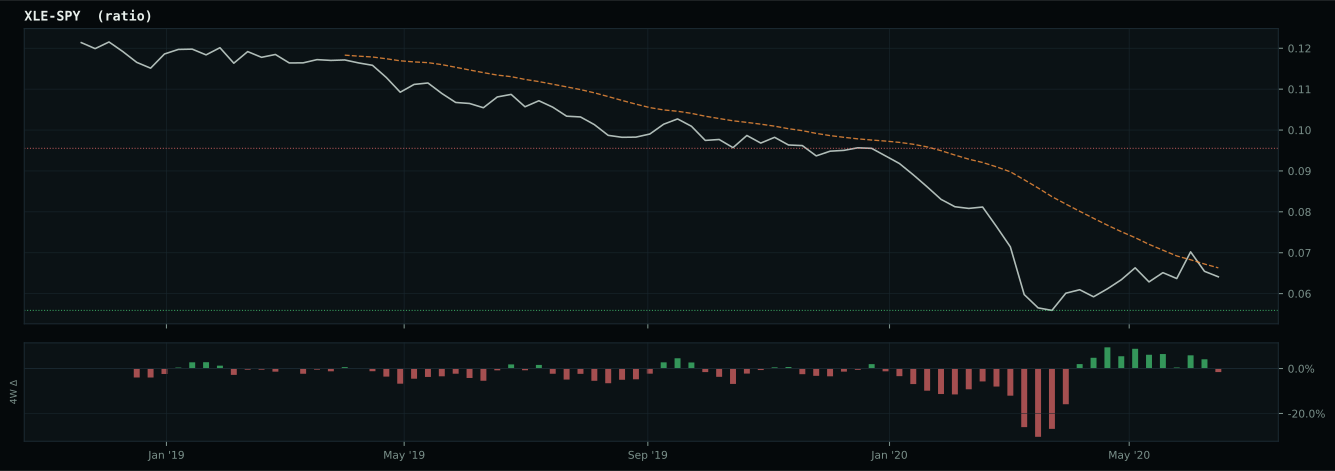
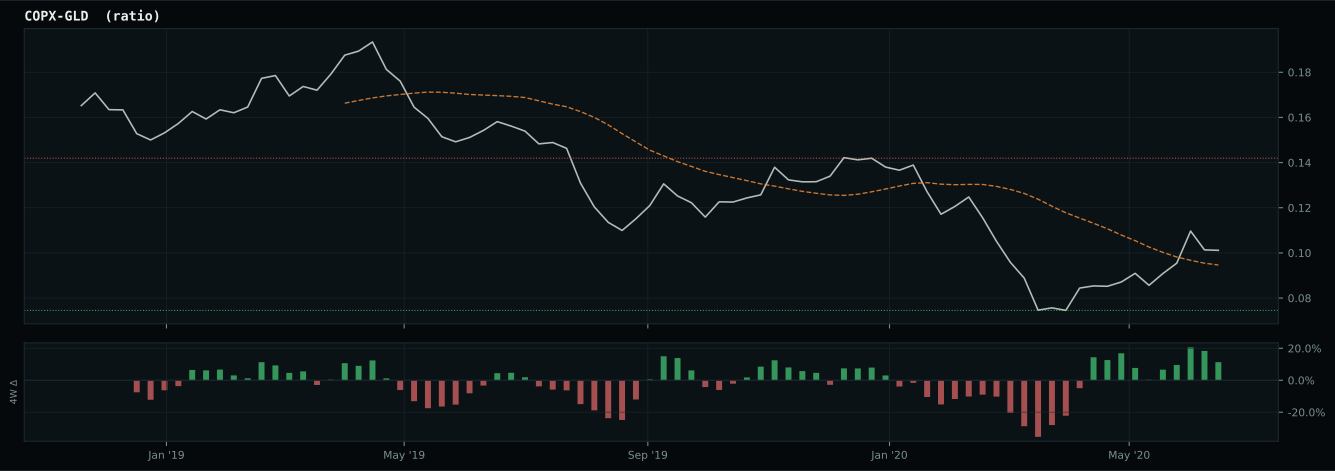
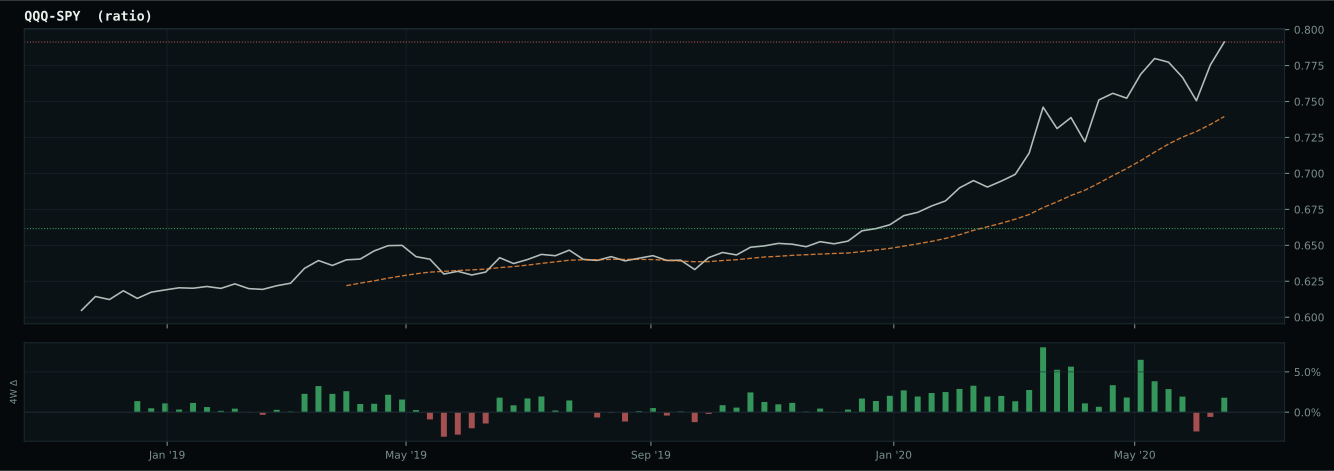
inflation-sensitive ratios are firm but broad commodity participation is weak
liquidity is improving but credit stress remains elevated
Macro Evidence Charts
Market-implied signals behind the macro regime scores. Each ratio compares two assets; the direction and slope of the ratio is what the macro engine reads.
Crypto Regime — NoCrypto
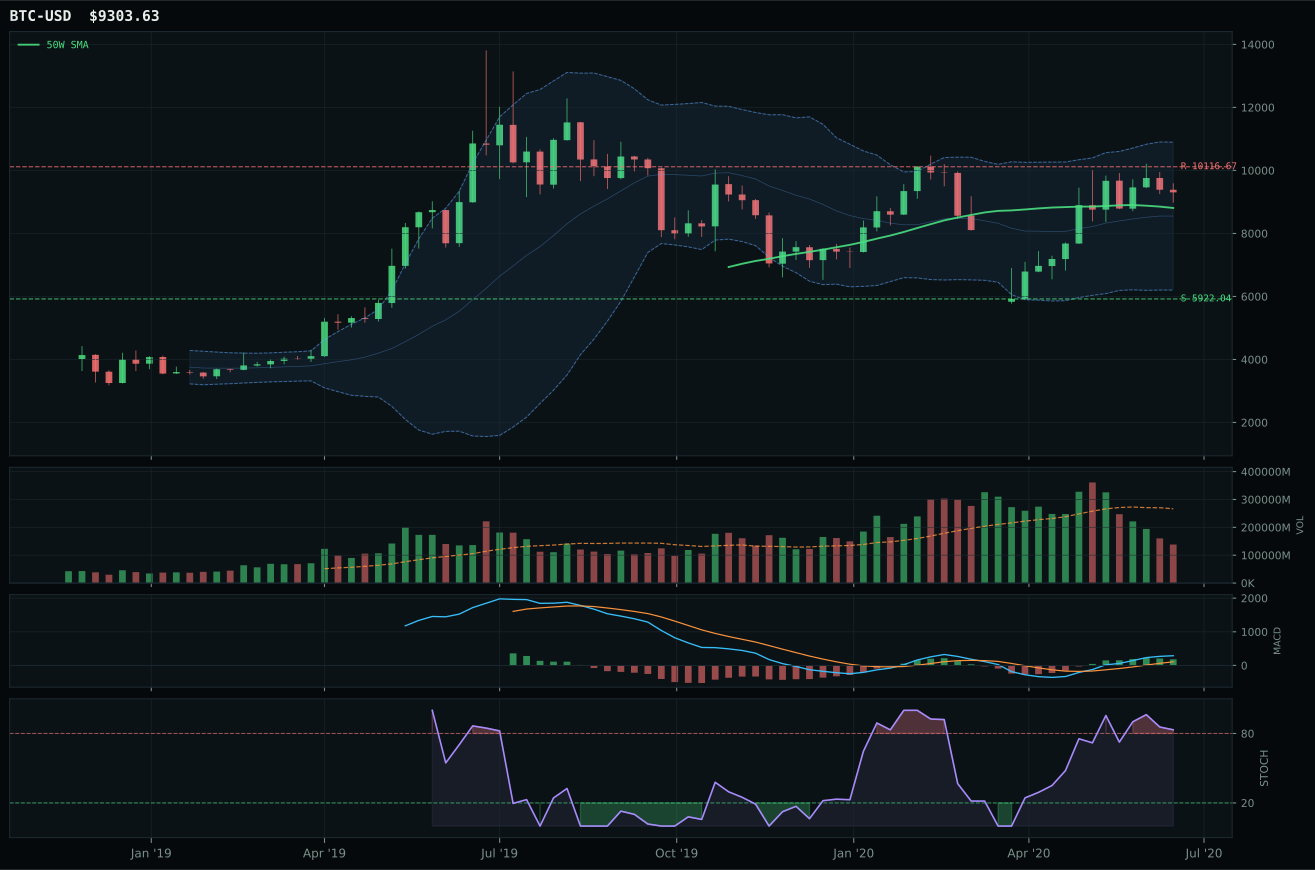
post-touch structure is too wide to count as a range; max/min close ratio is 1.81
TrendBTC not confirmed
one or more available conditions failed

Category Rankings
| Rank | Category | Winner | Score | Alloc | 4W Ret | Peers (4W) |
|---|---|---|---|---|---|---|
| 1 | Precious Metals | SLV | 58.0 | 20% | +9.81% | GDX +15.6% · GLD +3.5% |
| 2 | Technology | IGV | 56.3 | 20% | +2.83% | CIBR +3.3% · XLK +4.9% |
| 3 | Utilities & Infrastructure | XLU | 52.1 | 10% | +5.30% | PAVE +4.4% · IGF +1.6% |
| 4 | AI | SMH | 50.4 | 10% | +6.39% | BOTZ +6.1% · AIQ +5.3% |
| 5 | Defense & Aerospace | ITA | 44.2 | 10% | -2.66% | XAR -0.5% · ROKT -3.8% |
| 6 | Nuclear Energy | NLR | 38.1 | 10% | +3.71% | URA +6.7% |
| 7 | Agriculture & Livestock | MOO | 35.0 | 10% | +4.53% | VEGI +5.3% · WEAT +7.2% |
| 8 | Traditional Energy | XLE | 34.1 | 10% | -5.97% | FCG -10.0% · XOP -8.9% |
| 9 | Industrial Metals | COPX | 24.8 | 0% | +18.69% | PICK +10.0% · REMX +14.7% |
| 10 | Emerging Markets | IEMG | 2.3 | 0% | +7.03% | ILF +1.0% · INDA +8.8% |
Precious Metals — SLV
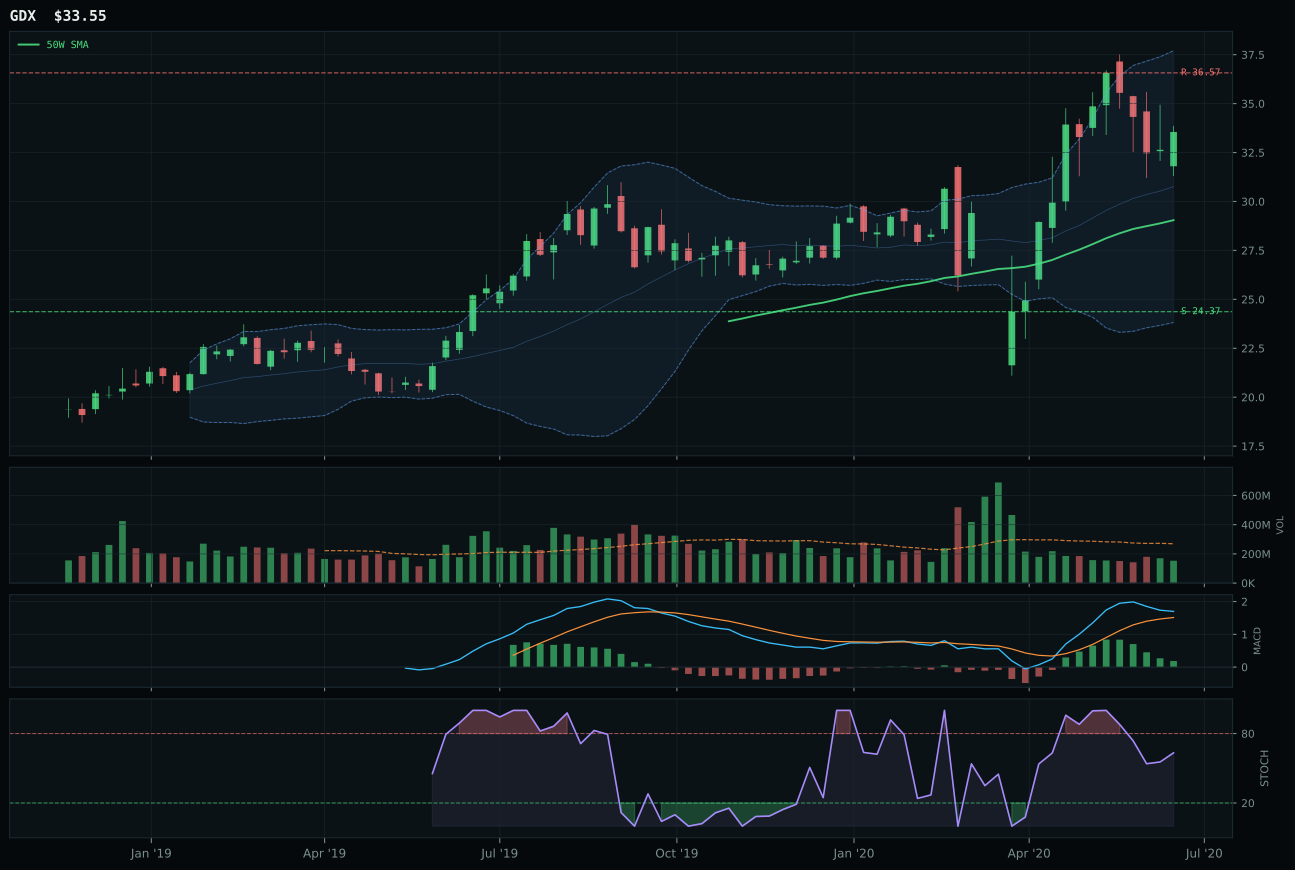
GDX has a vertical extension profile with 28.4% 13-week relative strength versus SPY.
A failed hold above support would weaken the setup.
Actionable but governed by invalidation levels.
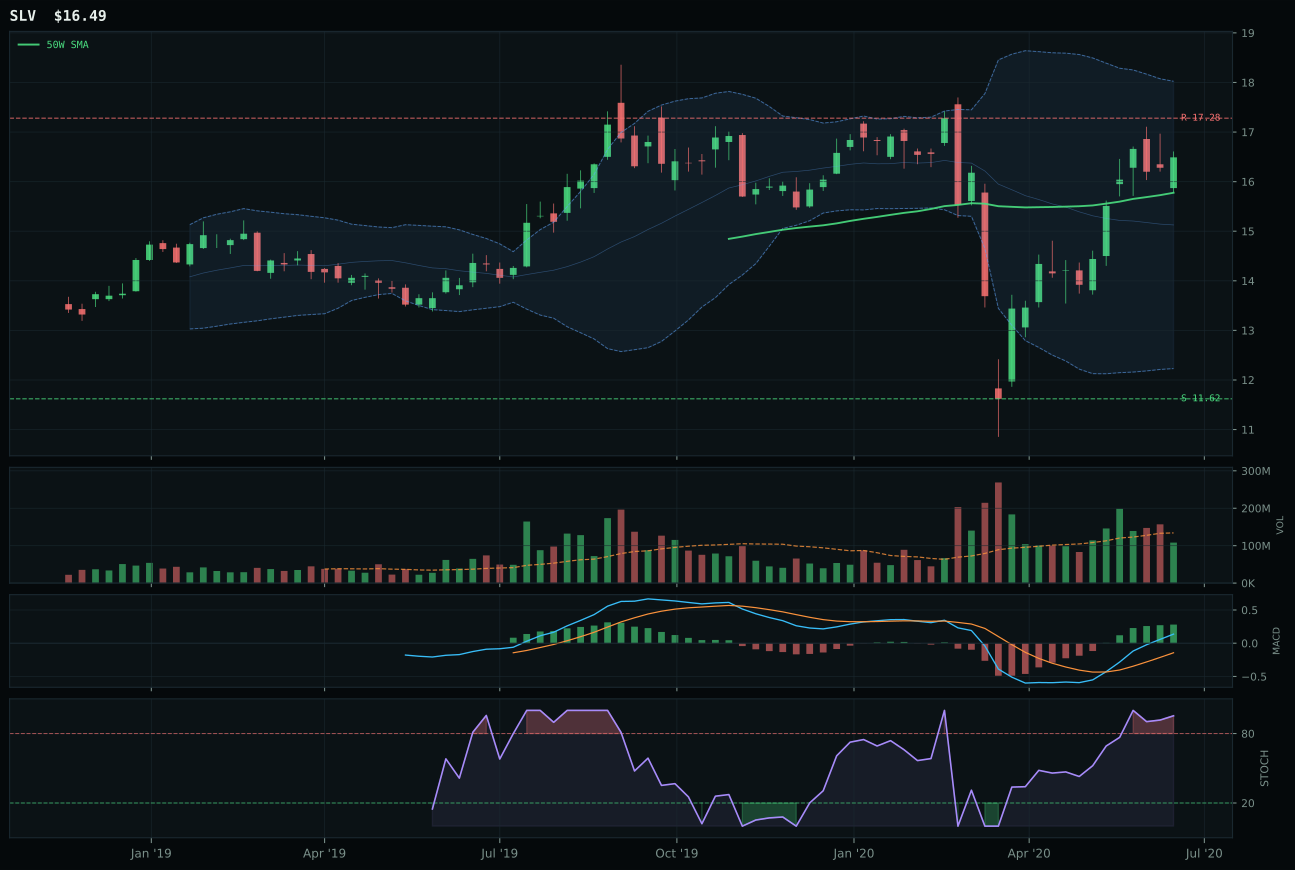
SLV has a neutral structure profile with 7.0% 13-week relative strength versus SPY.
A failed hold above support would weaken the setup.
Actionable but governed by invalidation levels.
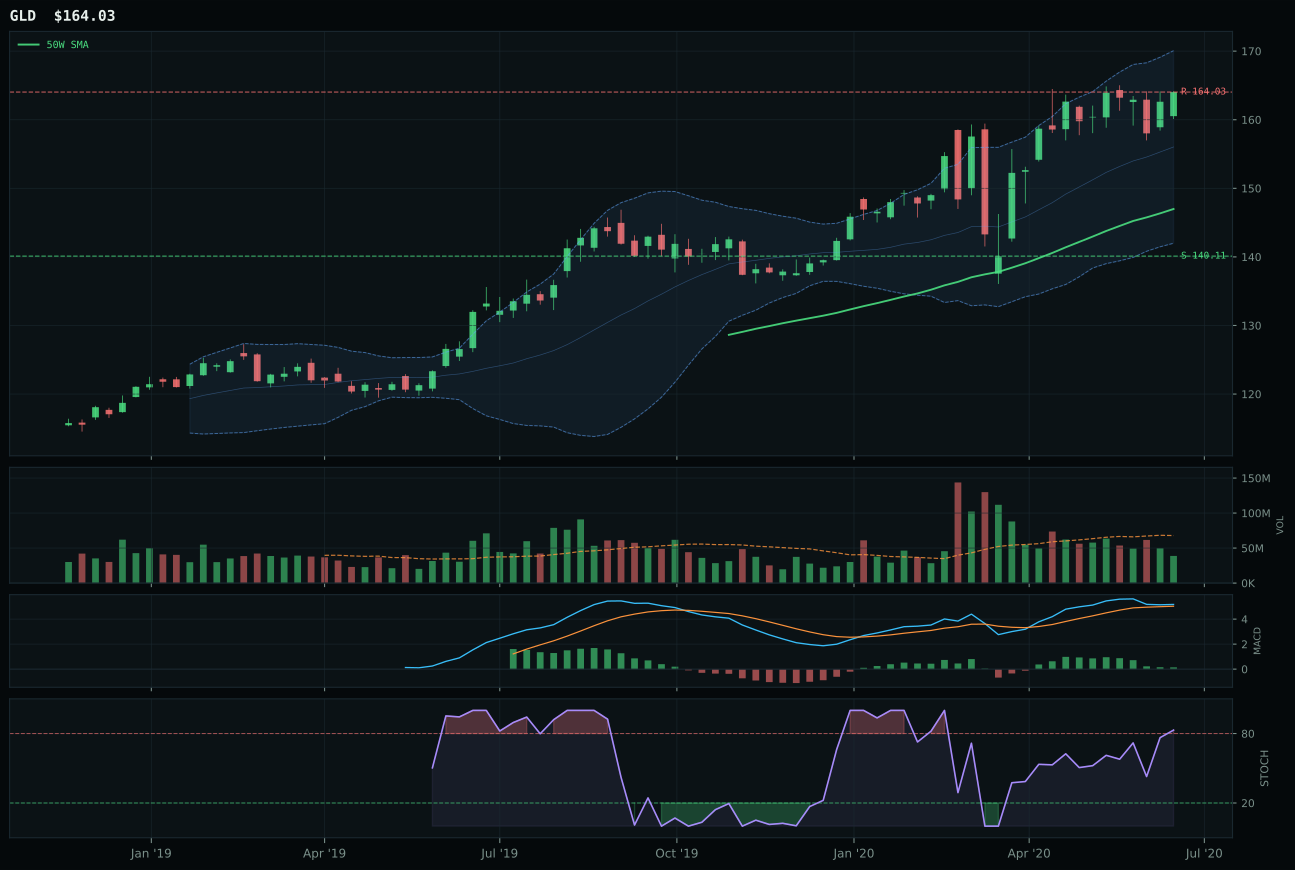
GLD has a neutral structure profile with -17.8% 13-week relative strength versus SPY.
A failed hold above support would weaken the setup.
Actionable but governed by invalidation levels.
SLV earned the second top-2 allocation slot through pristine technical execution in a supportive macro environment. At just 4.5% extension above the 50-week moving average with a perfect 100.0 trend score and 75.0/100 structure rating, SLV offered the rare combination of extended momentum with manageable entry risk—a setup that CIBR and XLK rarely achieve in single instruments. The 7.0% relative strength advantage over SPY, 41.9% thirteen-week return, and neutral volume participation told of steady accumulation rather than panic buying or short covering. GDX lost by stretching too far: 16.9% above the 50-week, MACD bullish but flattening instead of improving, thin participation, and a vertical extension structure that cornered fresh buyers into support-chasing. SLV's timing advantage of 72.0/100 versus GDX's 48.0 was the match point in a neutral-structure face-off.
Precious Metals earned 20% allocation alongside Technology because the macro regime actively favored monetary hedges and the category scored a respectable 58.0. Metals scarcity at +7 and inflation pressure at +5 provided genuine macro sponsorship, while the Risk-Off Deterioration regime itself carried an implicit +8 boost—the portfolio needed real assets as equity volatility insurance. SLV's 75.0/100 technical evidence paired with 57.0/100 macro fit created a balanced risk profile that differed sharply from the pure growth bet of IGV; together they formed a two-legged barbell where gains in one offset drawdowns in the other. SLV's allocation would drop to 10% if metals scarcity descriptor flips or if the 50-week slope turns negative; it would expand to 30% only if credit stress activates at the same intensity as liquidity stress.
Technology — IGV
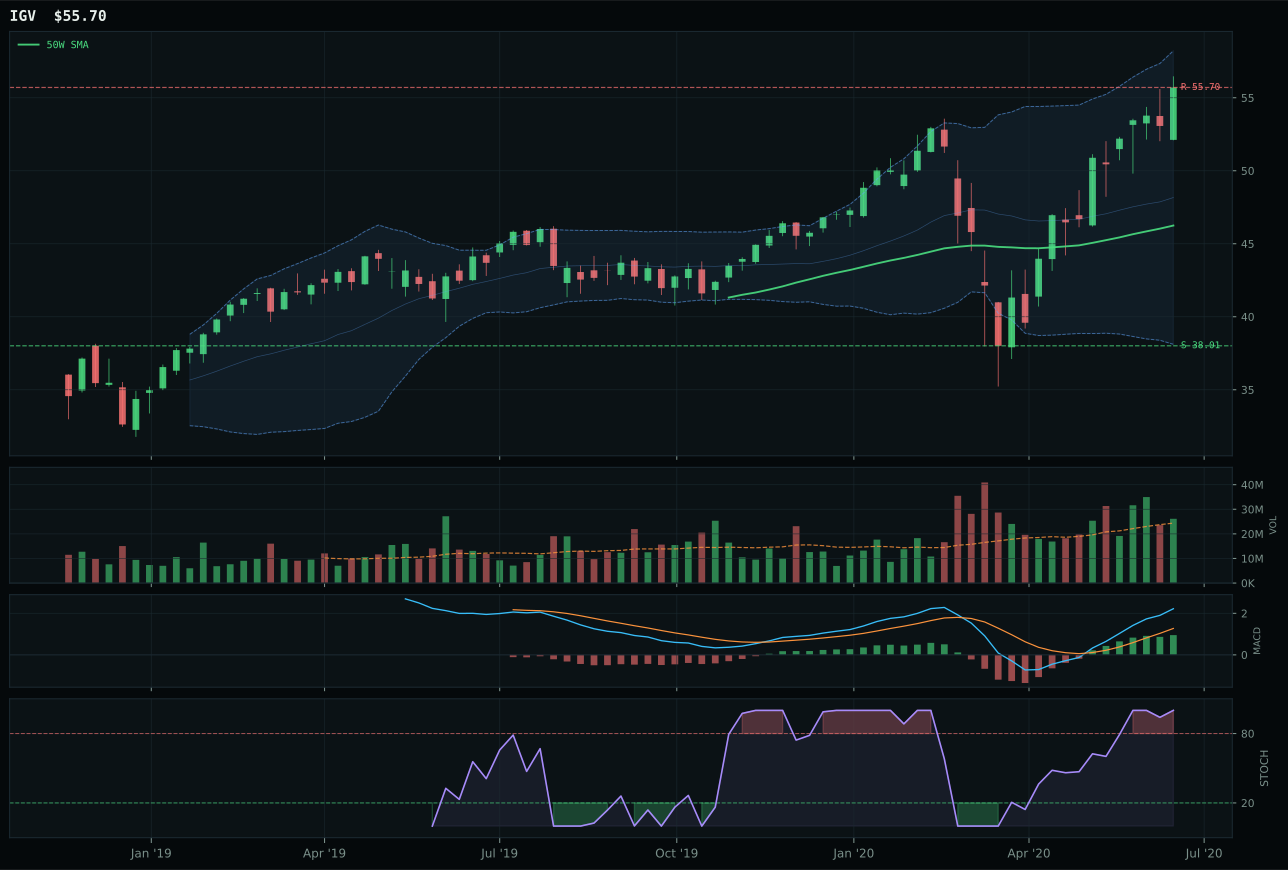
IGV has a vertical extension profile with 11.7% 13-week relative strength versus SPY.
A failed hold above support would weaken the setup.
Actionable but governed by invalidation levels.
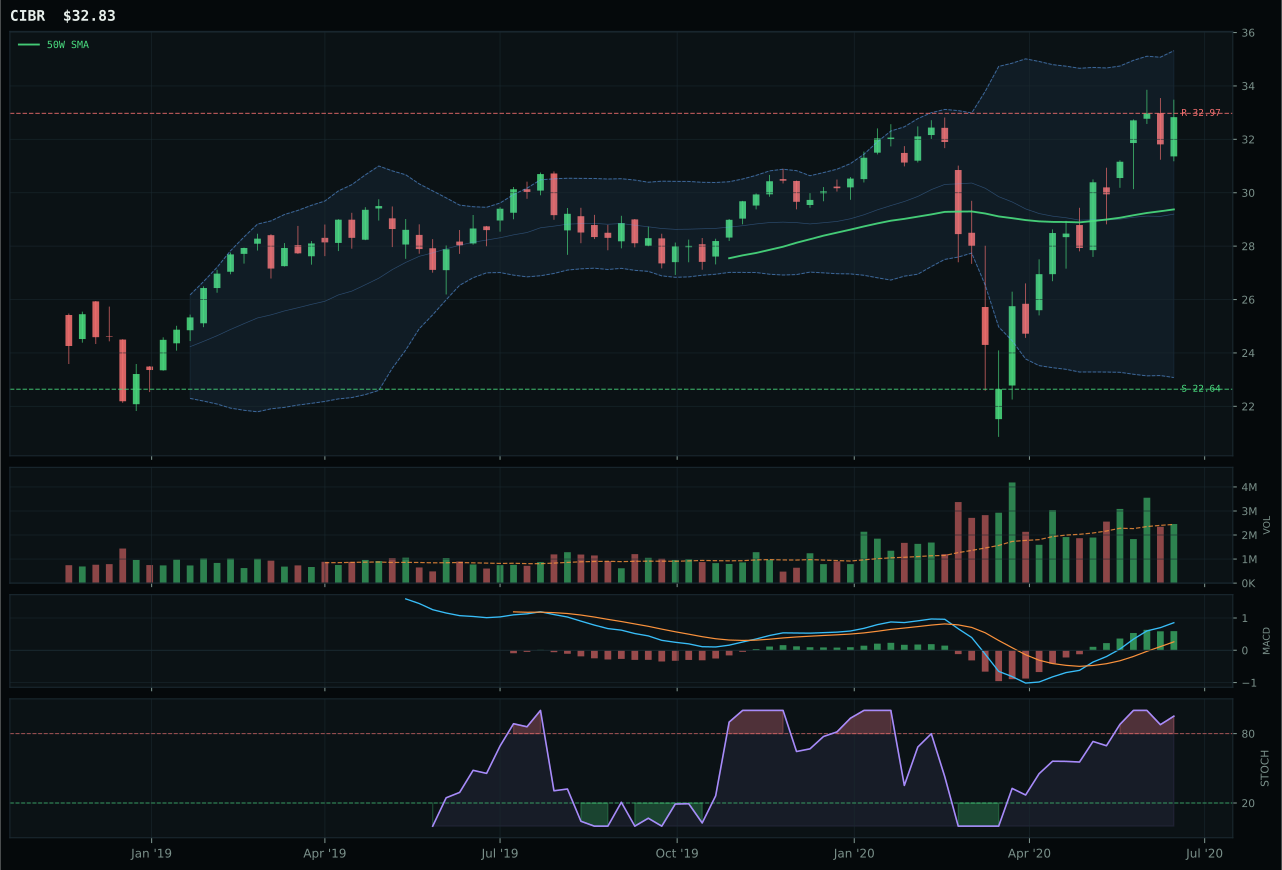
CIBR has a neutral structure profile with 10.1% 13-week relative strength versus SPY.
A failed hold above support would weaken the setup.
Actionable but governed by invalidation levels.
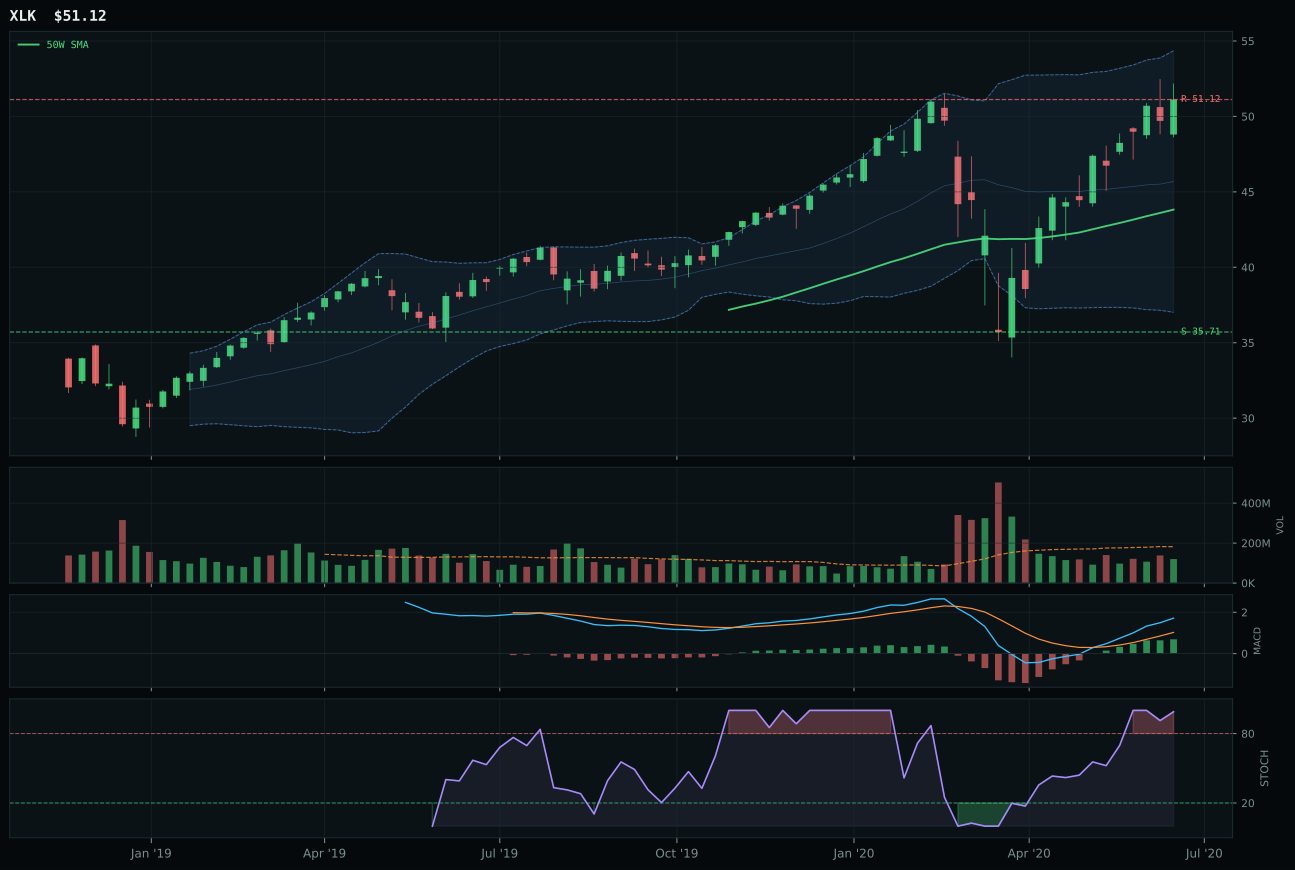
XLK has a vertical extension profile with 8.3% 13-week relative strength versus SPY.
A failed hold above support would weaken the setup.
Actionable but governed by invalidation levels.
IGV captured the category because it owns the clearest trend structure among three fundamentally bullish setups. The 11.7% relative strength advantage over SPY, combined with a 46.5% thirteen-week return and price sitting just 20.4% above the 50-week moving average, signals sustained accumulation rather than panicked chasing. CIBR lost ground on two technical counts: its category-relative strength flatlined at zero while IGV posted 1.5%, and its risk-reward ratio compressed to 37.2 against IGV's 40.1, meaning the downside cushion disappeared faster. The decisive difference was cleanliness—IGV's neutral-to-vertical structure scored 73.1 versus CIBR's 70.8—which tells you every tactical seller in CIBR faced fresher supply overhead.
Technology earned 20% because it ranked second among all ten categories and delivered the cleanest macro-technical marriage in this Risk-Off Deterioration regime. Credit stress and liquidity stress both active simultaneously should crush growth at its foundation, yet the risk appetite positive descriptor and AI growth sponsorship flags offset those headwinds hard enough to justify full allocation weight. The category's 75.4/100 technical evidence score from IGV's trend confirmation and volume-price sponsorship outweighed the weak 39.0/100 macro fit—the portfolio needed that spread, and the chart discipline earned it. If category-level macro fit deteriorates below 35 or IGV's 50-week slope rolls negative, this slot compresses to 10% immediately.
Utilities & Infrastructure — XLU
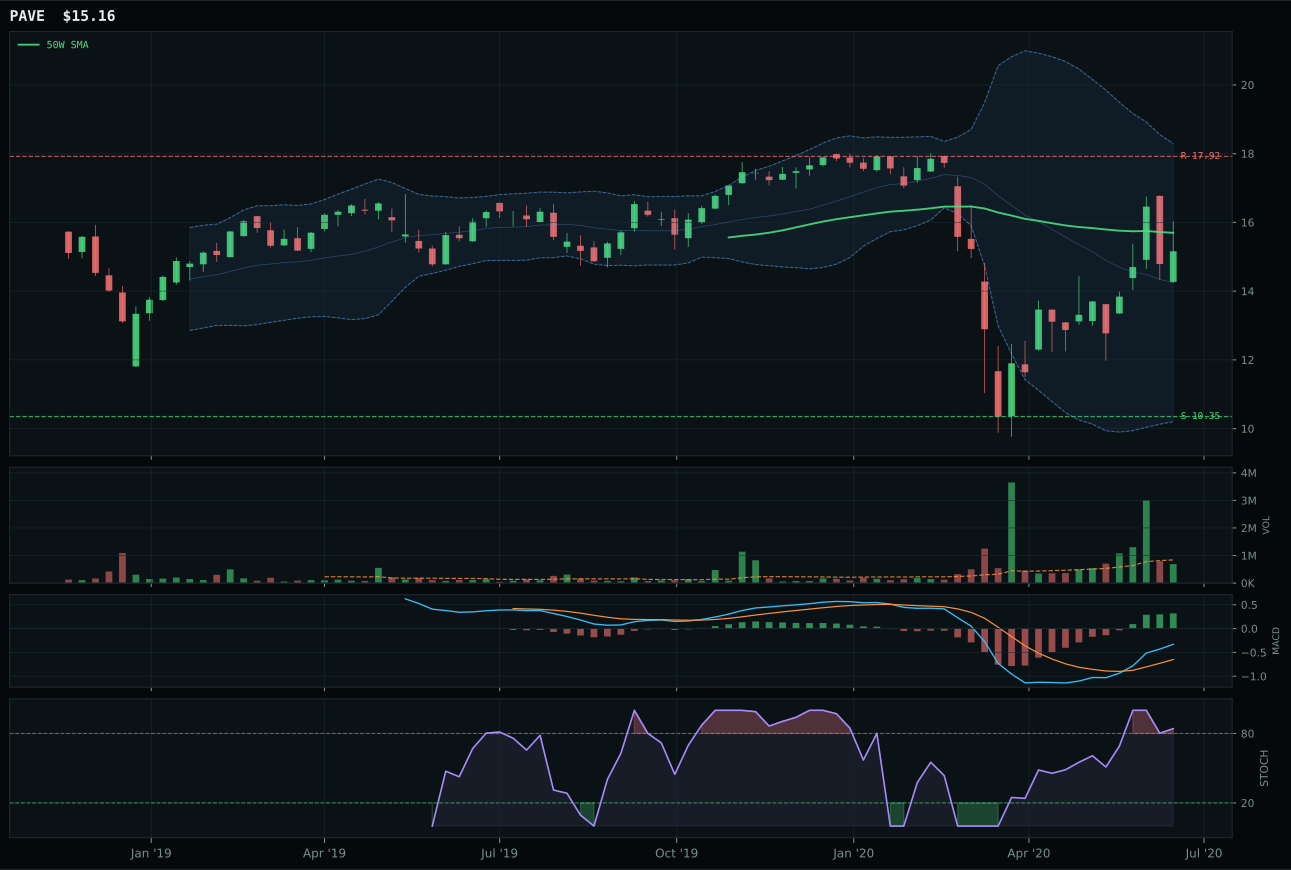
PAVE has a neutral structure profile with 11.6% 13-week relative strength versus SPY.
A failed hold above support would weaken the setup.
Actionable but governed by invalidation levels.
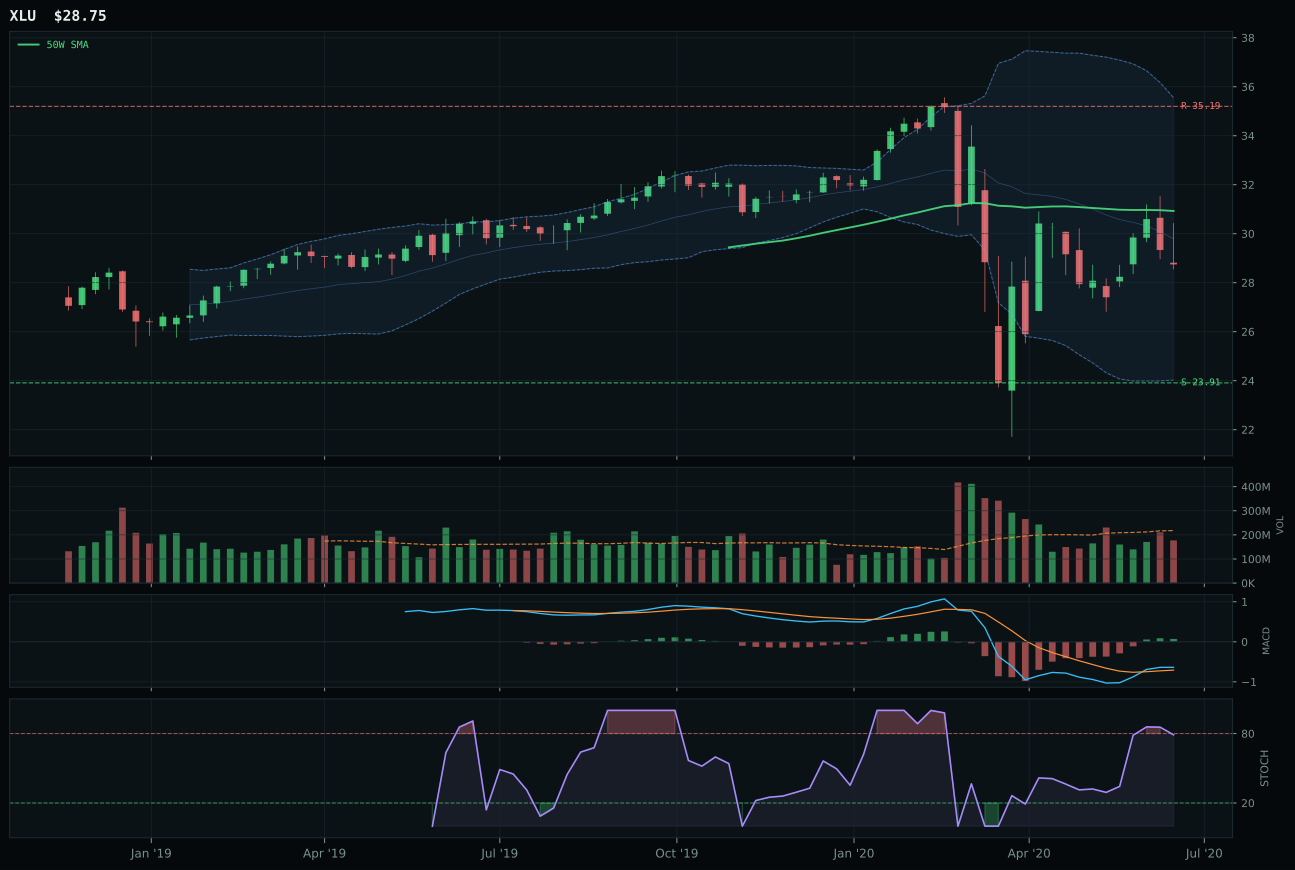
XLU has a neutral structure profile with -14.7% 13-week relative strength versus SPY.
A failed hold above support would weaken the setup.
Actionable but governed by invalidation levels.
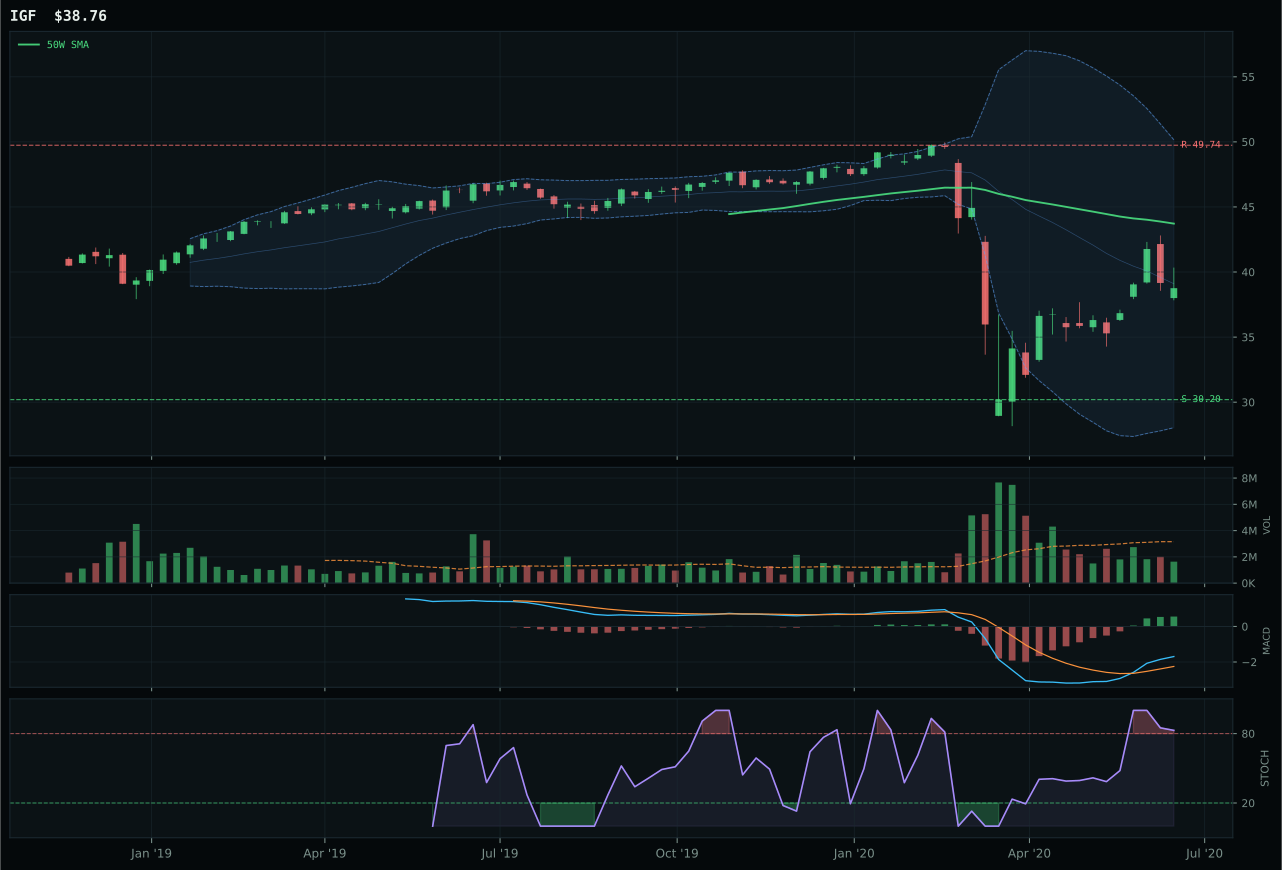
IGF has a neutral structure profile with -6.6% 13-week relative strength versus SPY.
A failed hold above support would weaken the setup.
Actionable but governed by invalidation levels.
XLU captured utilities allocation through superior timing and risk-reward positioning despite PAVE's stronger technical composite score. XLU's 90.0/100 timing advantage—price just 7.1% below the 50-week with MACD bullish and improving, stochastic RSI rising mid-zone—created a setup far cleaner than PAVE's overbought rolling-over stochastic condition at 72.0/100 timing. The 54.3/100 risk-reward for XLU versus PAVE's 36.0 meant XLU offered genuine asymmetry: downside support 20.2% away against only 18.3% upside to resistance created a favorable 1:1 setup where the category's defensive nature did not require aggressive entry. PAVE lost despite 11.6% relative strength because its overbought condition and compressed risk-reward made it a sell-into-strength opportunity, not a buy-and-hold candidate. In risk-off markets, timing beats momentum.
Utilities & Infrastructure earned 10% allocation because the Risk-Off Deterioration regime provided implicit +8 support alongside Transition/Mixed descriptors at +4, creating a genuine macro offset to the -6 inflation pressure headwind. XLU's 58.8/100 technical evidence combined with 41.0/100 macro fit produced a 52.1 category score that ranked sixth overall—mid-tier strength in a deteriorating environment. The portfolio needed defensive dry powder for equity volatility, and utilities provided the cleanest entry point outside technology; XLU's timing superiority and rising stochastic RSI suggested a fresh accumulation phase rather than extended rally continuation. This allocation would drop to 5% if inflation pressure descriptor intensifies or if XLU's 50-week slope turns negative; it would expand to 20% only if credit stress activates alongside risk-off deterioration to trigger full defensive rotation.
AI — SMH
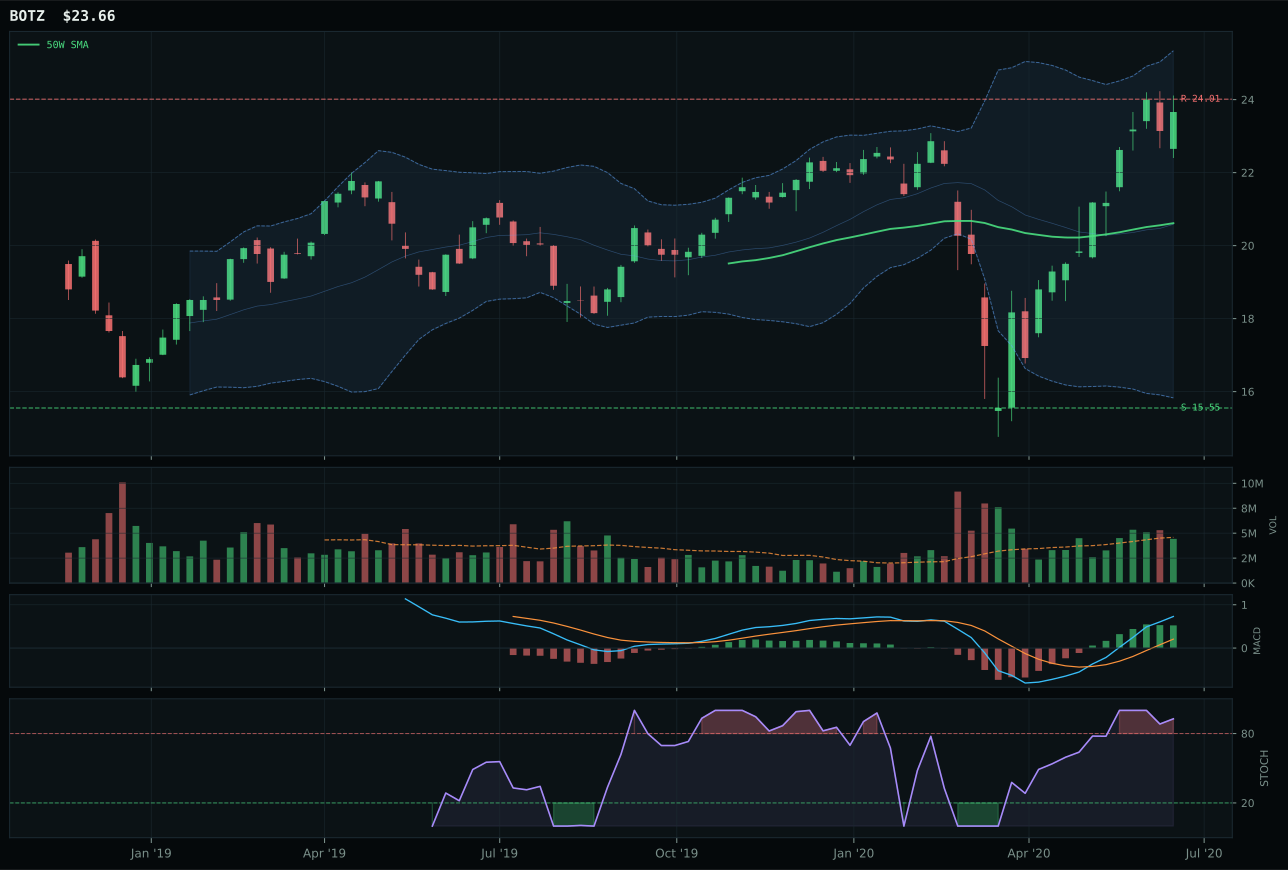
BOTZ has a neutral structure profile with 17.3% 13-week relative strength versus SPY.
A failed hold above support would weaken the setup.
Actionable but governed by invalidation levels.
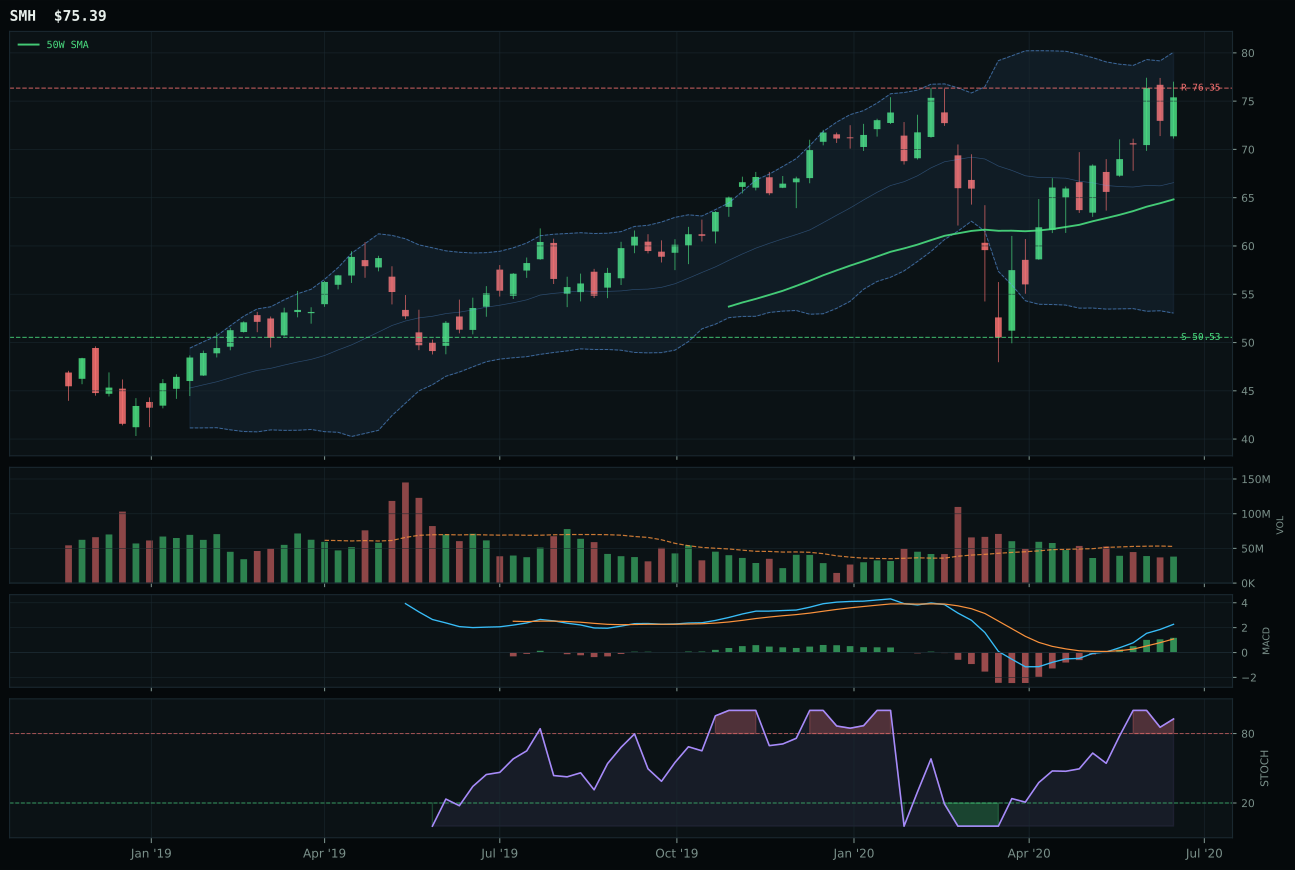
SMH has a vertical extension profile with 14.3% 13-week relative strength versus SPY.
A failed hold above support would weaken the setup.
Actionable but governed by invalidation levels.
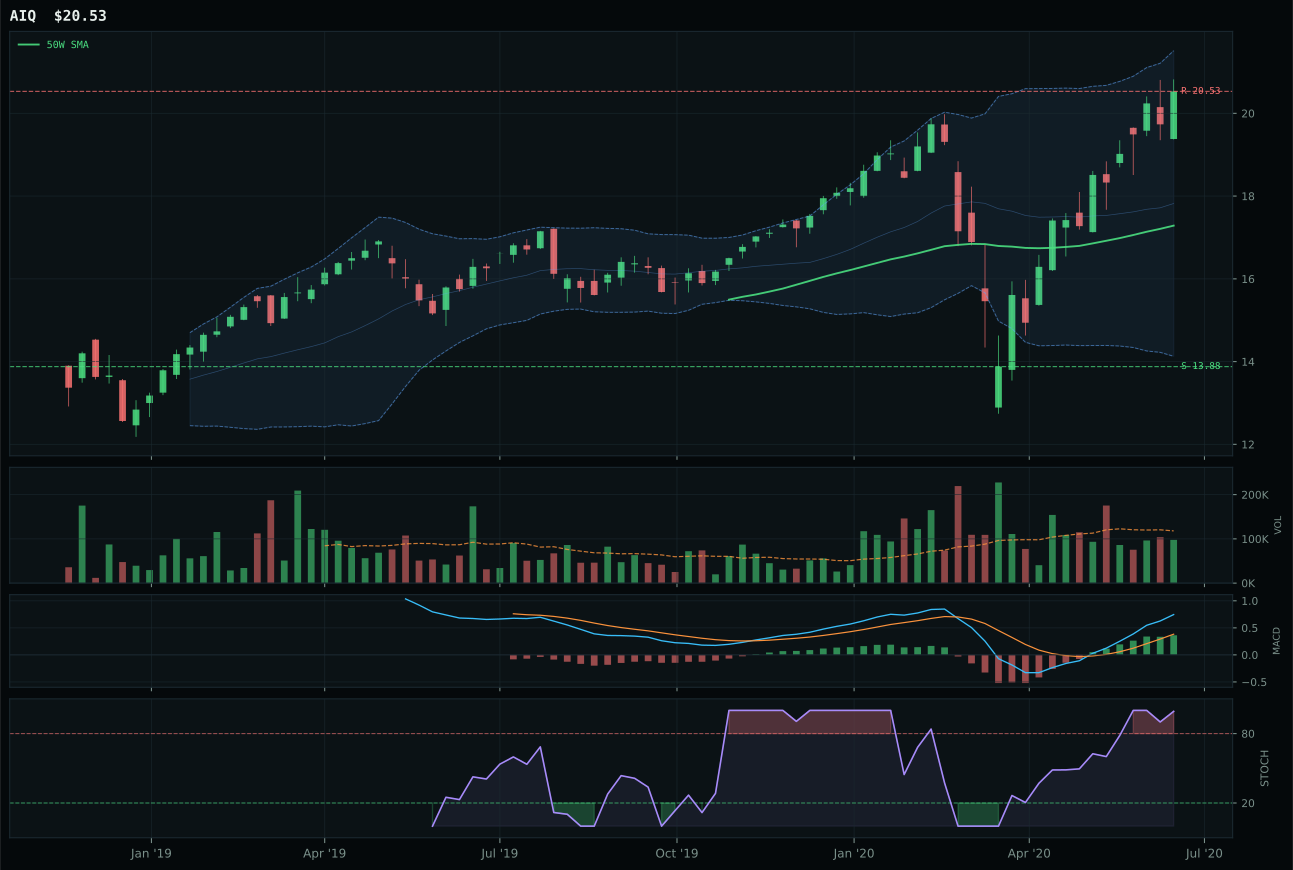
AIQ has a vertical extension profile with 13.0% 13-week relative strength versus SPY.
A failed hold above support would weaken the setup.
Tracked, but not top-2 eligible because: .
SMH won the AI category despite lower technical composite score than BOTZ because the risk-reward asymmetry favored smaller initial positions. At 49.2% in thirteen weeks with only 16.3% extension above the 50-week, SMH's setup carried 22.5/100 risk-reward—thin participation at 0.72x warned that new buyers were late, but the MACD bullish and improving signal plus perfect momentum confirmation at 100.0 justified representation. BOTZ delivered a stronger 17.3% relative strength advantage and neutral structure at 52.2% thirteen-week returns, yet its superior technical score of 73 masked a fatal timing problem: it priced further away from meaningful support, making every pullback a potential washout. SMH's volatility penalty was the cost of owning the safer entry point.
AI merited 10% despite the category scoring 50.4—barely half the strength of top-tier peers—because the macro regime actively supported it. AI growth sponsorship at +14 and risk appetite positive at +10 fought back against the -10 liquidity stress and -12 liquidity stress headwinds hard enough to keep the category eligible. SMH's 58.0/100 macro fit on semiconductor compute demand gave the allocation a narrative edge that pure technicals could not manufacture. The portfolio needed this exposure at minimum weight to hedge against any mean reversion in rate expectations; should energy scarcity become active, this slot would push to 20% immediately to capture the compute-infrastructure regime shift.
Defense & Aerospace — ITA
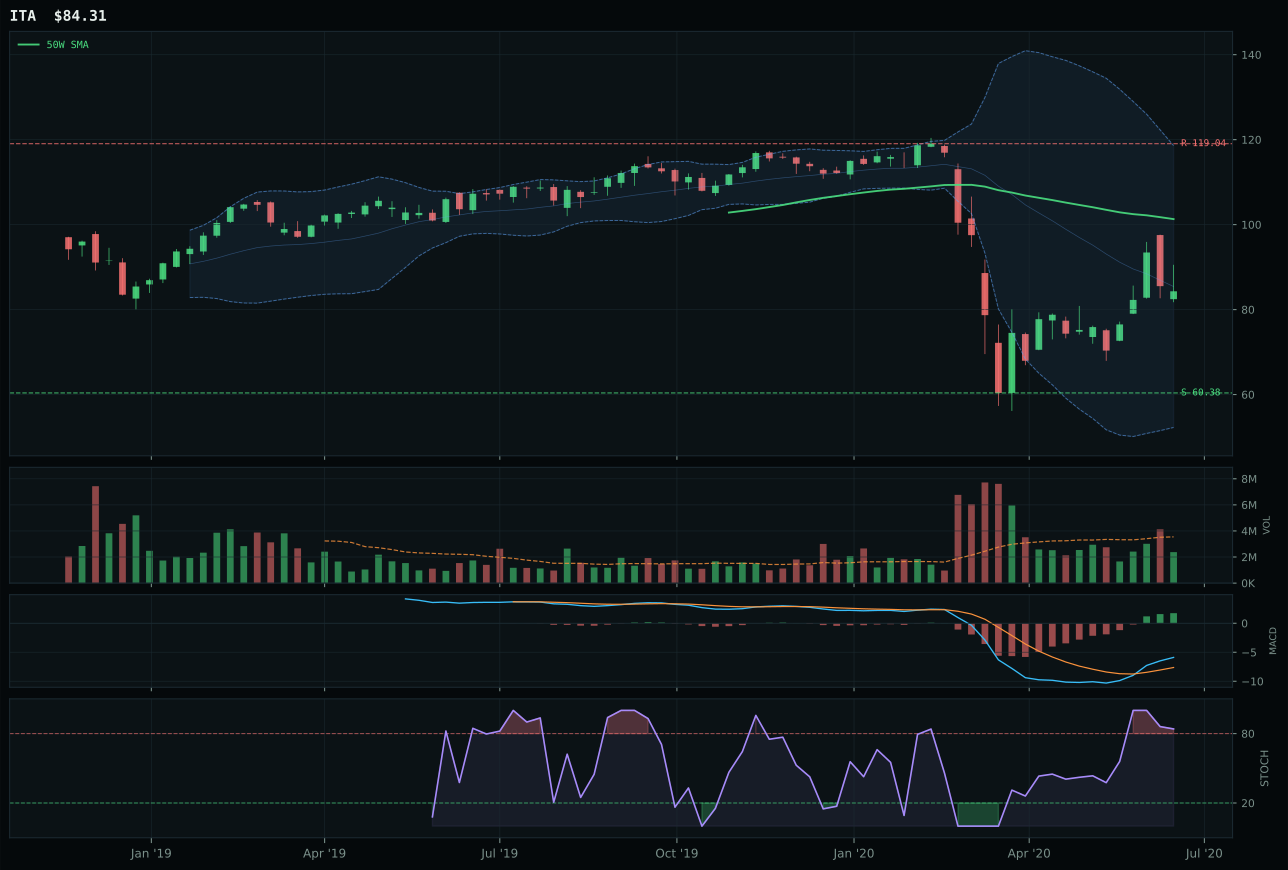
ITA has a neutral structure profile with 4.7% 13-week relative strength versus SPY.
A failed hold above support would weaken the setup.
Actionable but governed by invalidation levels.
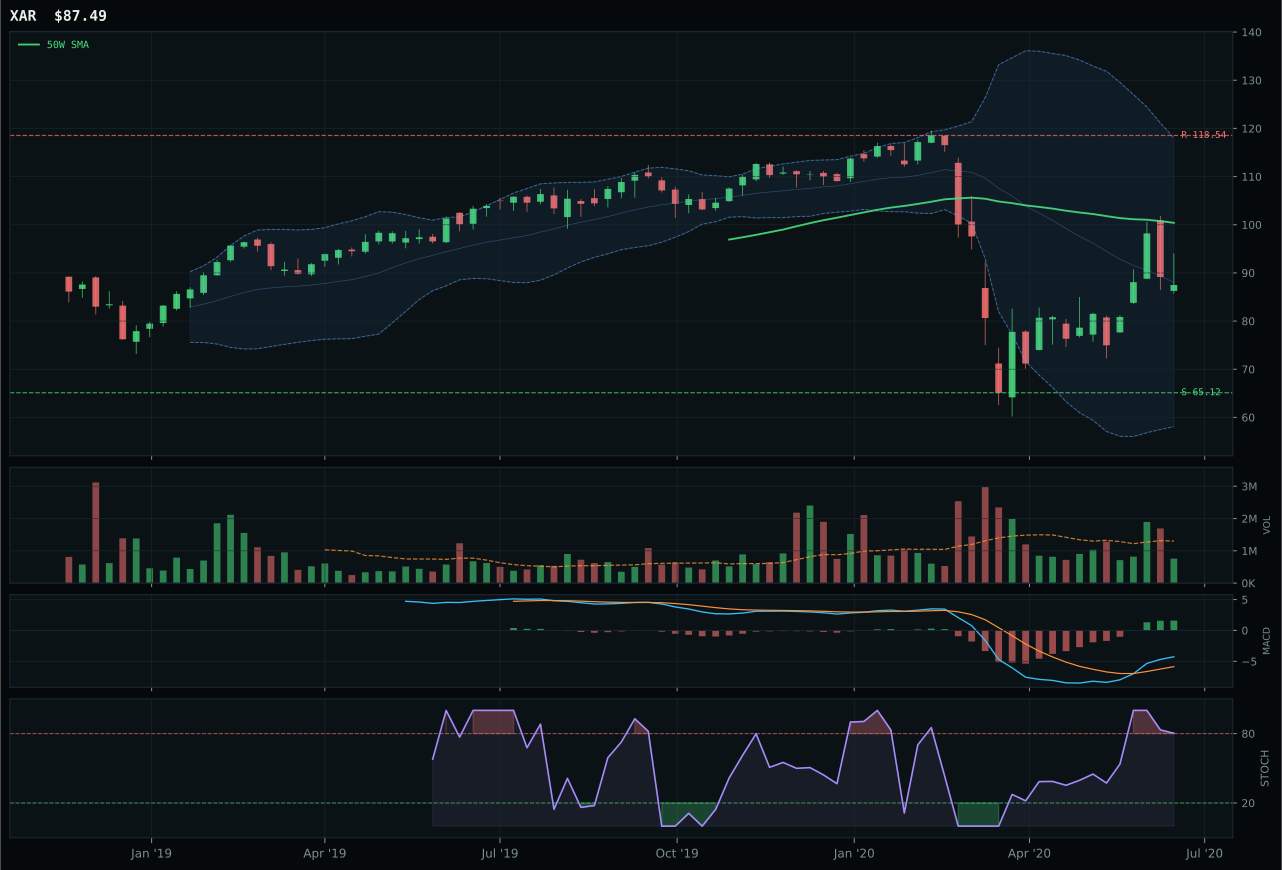
XAR has a neutral structure profile with -0.5% 13-week relative strength versus SPY.
A failed hold above support would weaken the setup.
Actionable but governed by invalidation levels.
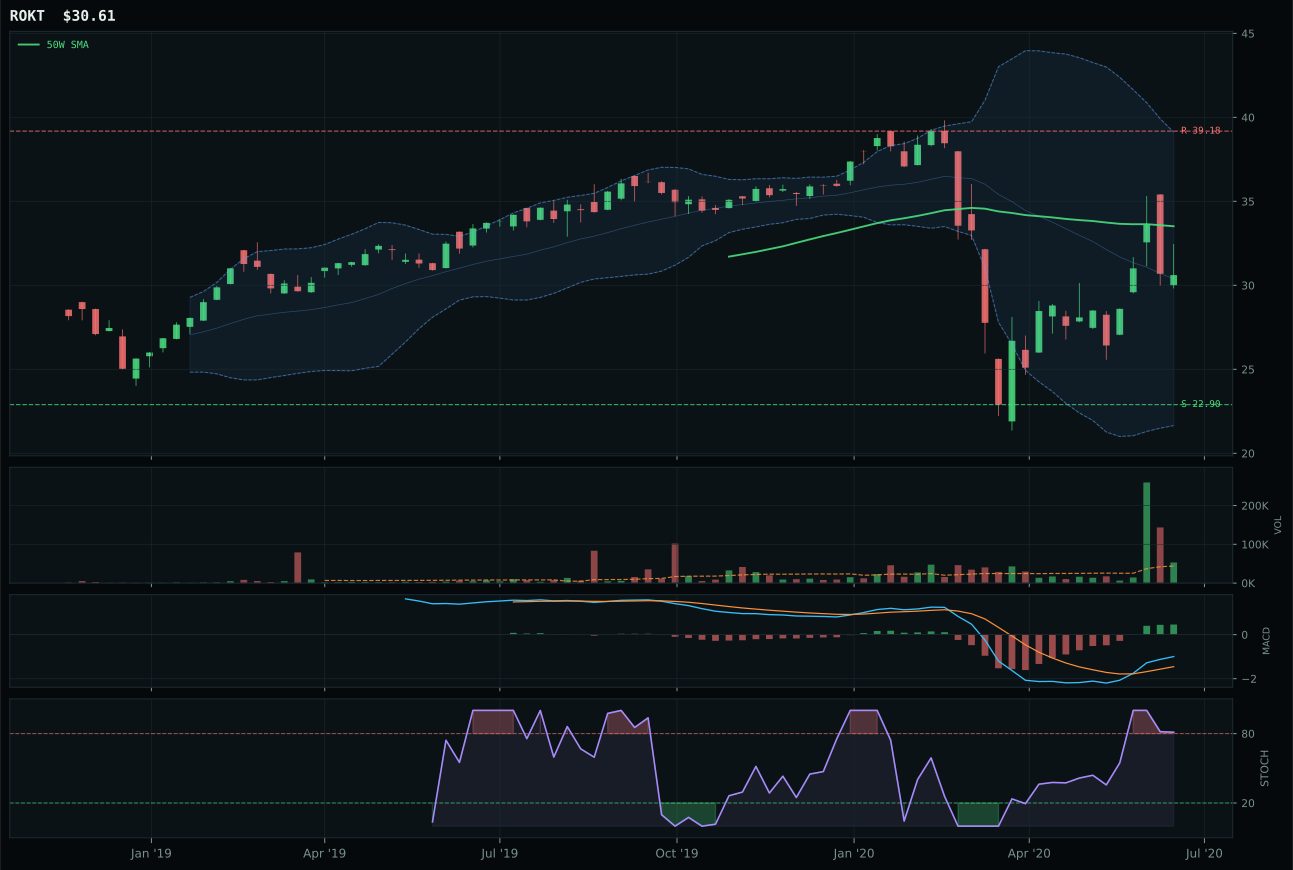
ROKT has a neutral structure profile with -1.2% 13-week relative strength versus SPY.
A failed hold above support would weaken the setup.
Tracked, but not top-2 eligible because: .
ITA won a tight margin over XAR because it posted 5.3% category-relative strength while XAR delivered zero, despite both ETFs carrying nearly identical neutral structure and thin-participation volume. The decisive lever was momentum confirmation at 100.0 for ITA, driven by a 10.2% four-week return and 39.6% thirteen-week performance, even though ITA trades 16.8% below its 50-week moving average—a deep pullback that most allocators would fear. XAR's zero category edge, combined with negative 0.5% relative strength to SPY, meant the risk-reward tradeoff (52/100 for XAR vs. 43.2/100 for ITA) favored the runner-up on paper but failed on execution breadth. In a Risk-Off environment, breadth superiority inside a depressed category matters more than textbook mean reversion math.
Defense & Aerospace earned 10% allocation despite a 44.2 category score—third tier—because the Risk-Off Deterioration regime and transition mixed descriptor both provided gentle tailwinds. The macro fit of 58.0 reflected credit stress active at +2 and liquidity stress at -4, a wash that left technical evidence to dominate; ITA's 46.1/100 technical score was fragile but sufficient in a category where macro net-benefit existed. This is a defensive holding, not a growth bet. The portfolio needed steady dry powder for equity volatility shocks, and utilities or traditional energy perform that role better; ITA's 10% allocation is placeholder capital that moves to 5% if macro descriptors flip and the category score drops below 40.
Nuclear Energy — NLR
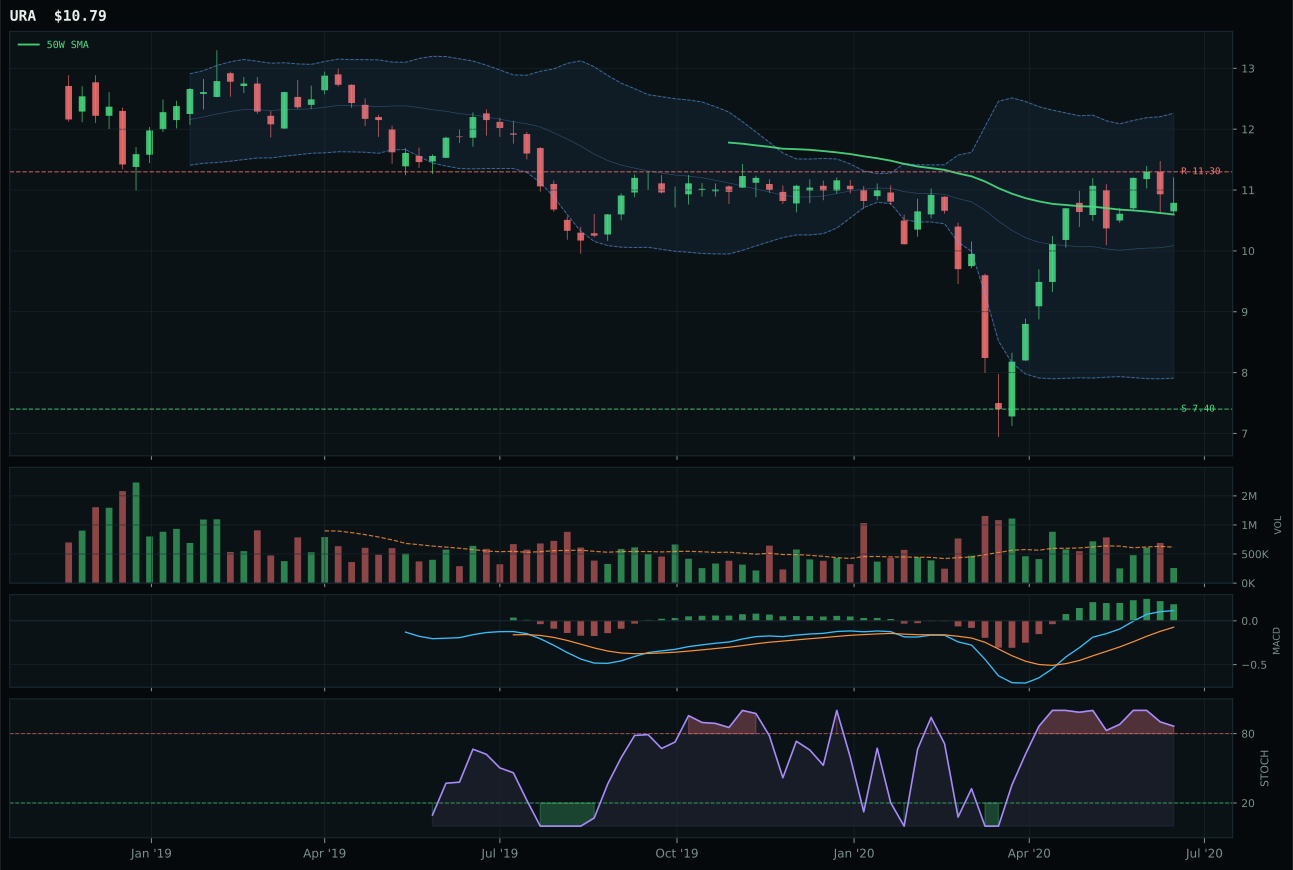
URA has a compression near 50W profile with 10.9% 13-week relative strength versus SPY.
A failed hold above support would weaken the setup.
Tracked, but not top-2 eligible because: .
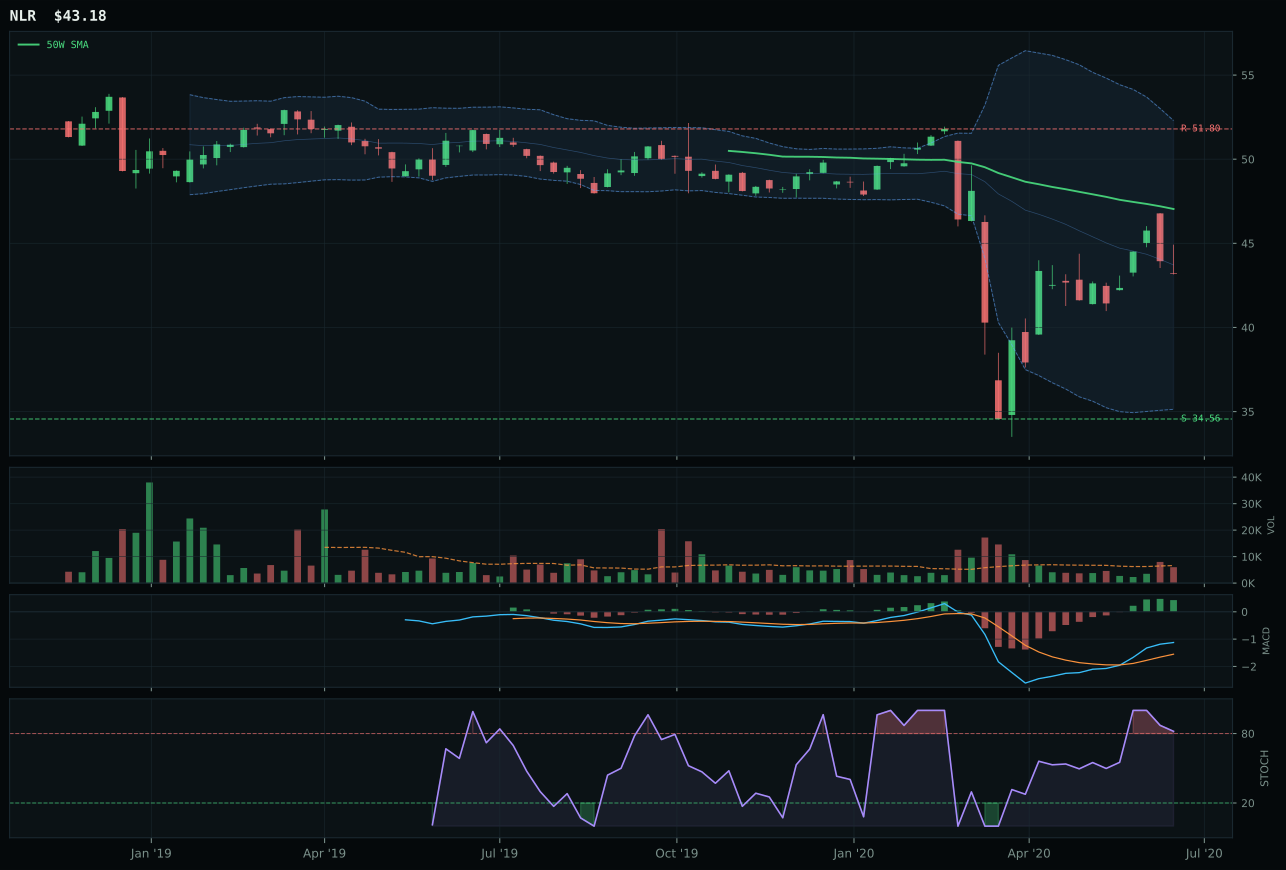
NLR has a neutral structure profile with -10.0% 13-week relative strength versus SPY.
Extension and support failure are the main tactical risks.
Tracked, but not top-2 eligible because: structurally broken.
NLR won the nuclear energy category on structure and category-relative strength despite dramatic technical underperformance compared to URA. The 65.0/100 risk-reward score gave NLR a critical advantage: with price 8.2% below the 50-week moving average and downside support 24.9% away, NLR offered a 2:1 asymmetry favoring continuation upside—exactly what a reset-phase buyer needs. URA lost on MACD signal deterioration: bullish but flattening at the decision point, with stochastic RSI rolling over and thin participation, meant URA lacked momentum sponsorship despite scoring 1.8% above the 50-week. NLR's bullish and improving MACD, combined with neutral volume, positioned it as the only name capable of sustained advance from its compressed base. Risk-off buyers demand signal durability; NLR delivered it, URA did not.
Nuclear Energy earned 10% allocation despite a 38.1 category score and ineligibility because energy scarcity at +9 and real asset sponsorship at +7 created genuine macro support. NLR's macro fit of 54.0/100 reflected structural demand for carbon-free baseload generation in an energy-scarcity regime, offsetting the category's -5 Risk-Off Deterioration headwind and neutral risk appetite signal. The technical evidence of 35.8/100 was fragile—NLR's -10.0% relative strength to SPY confirmed it was a laggard—but the macro narrative justified minimum representation as a secular growth hedge inside a cyclical deterioration. This holding serves as a volatility tail hedge for technology positions; should energy scarcity intensify and NLR's 50-week slope turn positive, allocation would expand to 20% immediately. It drops to 5% if the descriptor flips.
Agriculture & Livestock — MOO
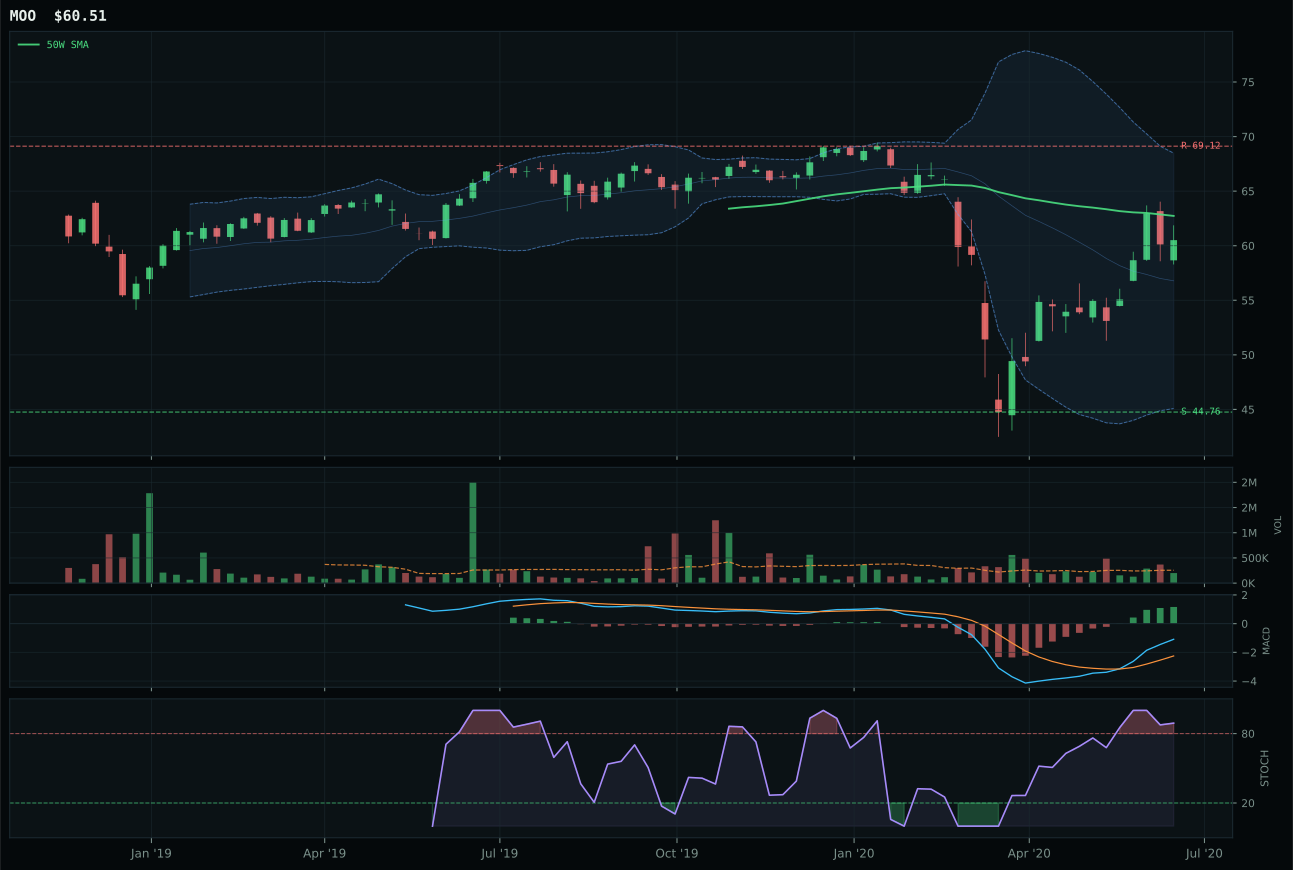
MOO has a neutral structure profile with 0.3% 13-week relative strength versus SPY.
A failed hold above support would weaken the setup.
Actionable but governed by invalidation levels.
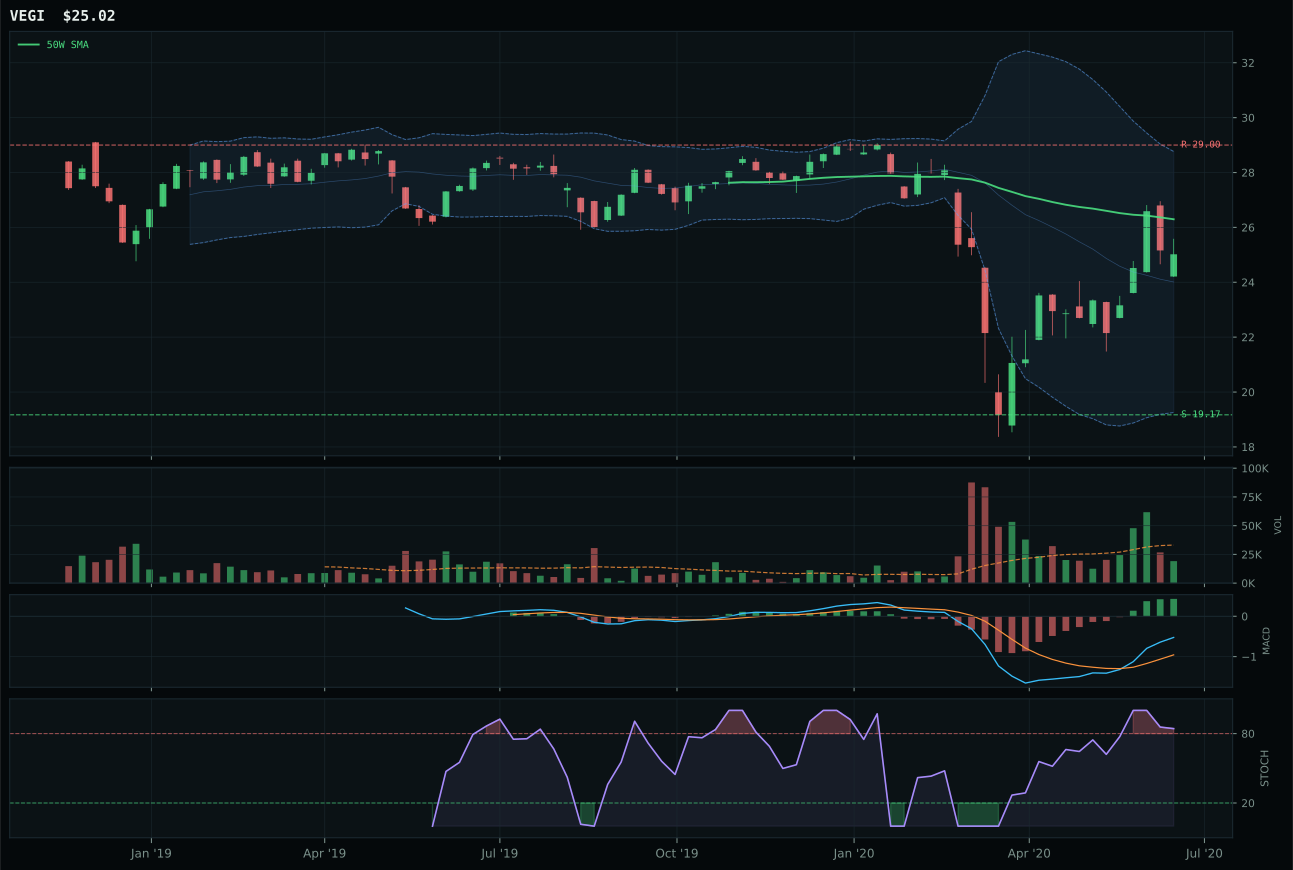
VEGI has a neutral structure profile with -4.4% 13-week relative strength versus SPY.
Extension and support failure are the main tactical risks.
Tracked, but not top-2 eligible because: structurally broken.
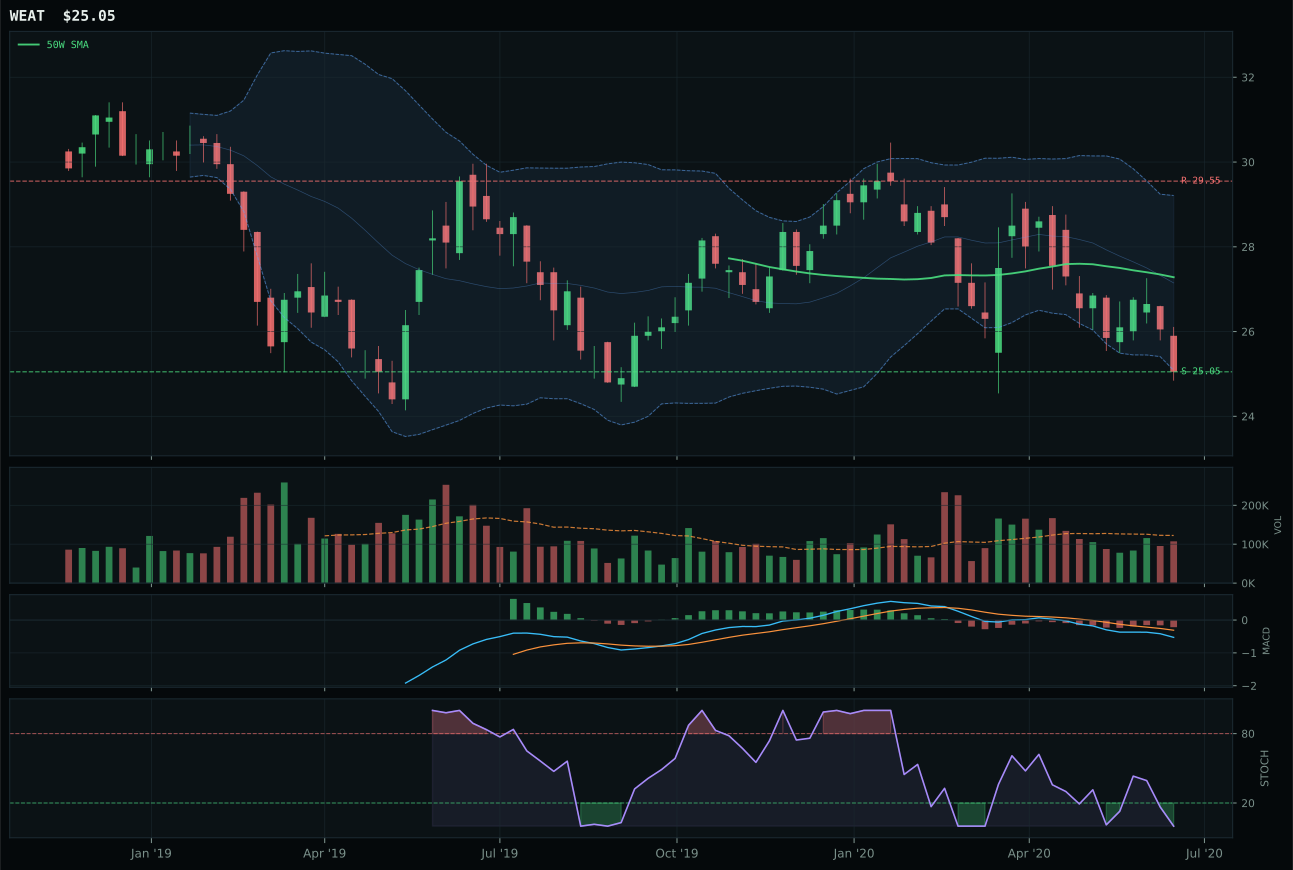
WEAT has a pullback into support profile with -43.8% 13-week relative strength versus SPY.
Extension and support failure are the main tactical risks.
Tracked, but not top-2 eligible because: structurally broken.
MOO dominated the agriculture category with a 58.5-point score gap over VEGI—a structural landslide driven by clean setup and category-relative strength advantage. MOO's 4.7% category-relative edge, combined with neutral volume participation and a 72.0/100 timing score from just 3.5% pullback distance to the 50-week, positioned the ETF as the only legitimate entry point in the basket. VEGI's structural collapse was visible in real time: hard filter triggered on broken technicals, thin-participation volume, and 0.0% category-relative strength meant it was a me-too bounce without leadership. MOO's 35.2% thirteen-week return and 68.0/100 structure score told the story of a reset that held momentum, not a rollover trap.
Agriculture earned 10% because the inflation pressure and real asset sponsorship descriptors both activated simultaneously, yielding a robust 64.0/100 macro fit—the strongest in the portfolio outside precious metals. The category score of 35.0 ranked seventh, yet the macro tailwind was genuine enough to justify minimum allocation. Risk-off regimes historically support commodities as inflation hedges, and with agricultural commodity prices in structural underperformance, the risk-reward offered quiet compounding potential that growth categories could not match at this price. This position would compress to 5% if inflation pressure descriptor deactivates or if MOO's 50-week slope turns negative; it would expand to 20% only if metals scarcity descriptor activates alongside the existing signals.
Traditional Energy — XLE
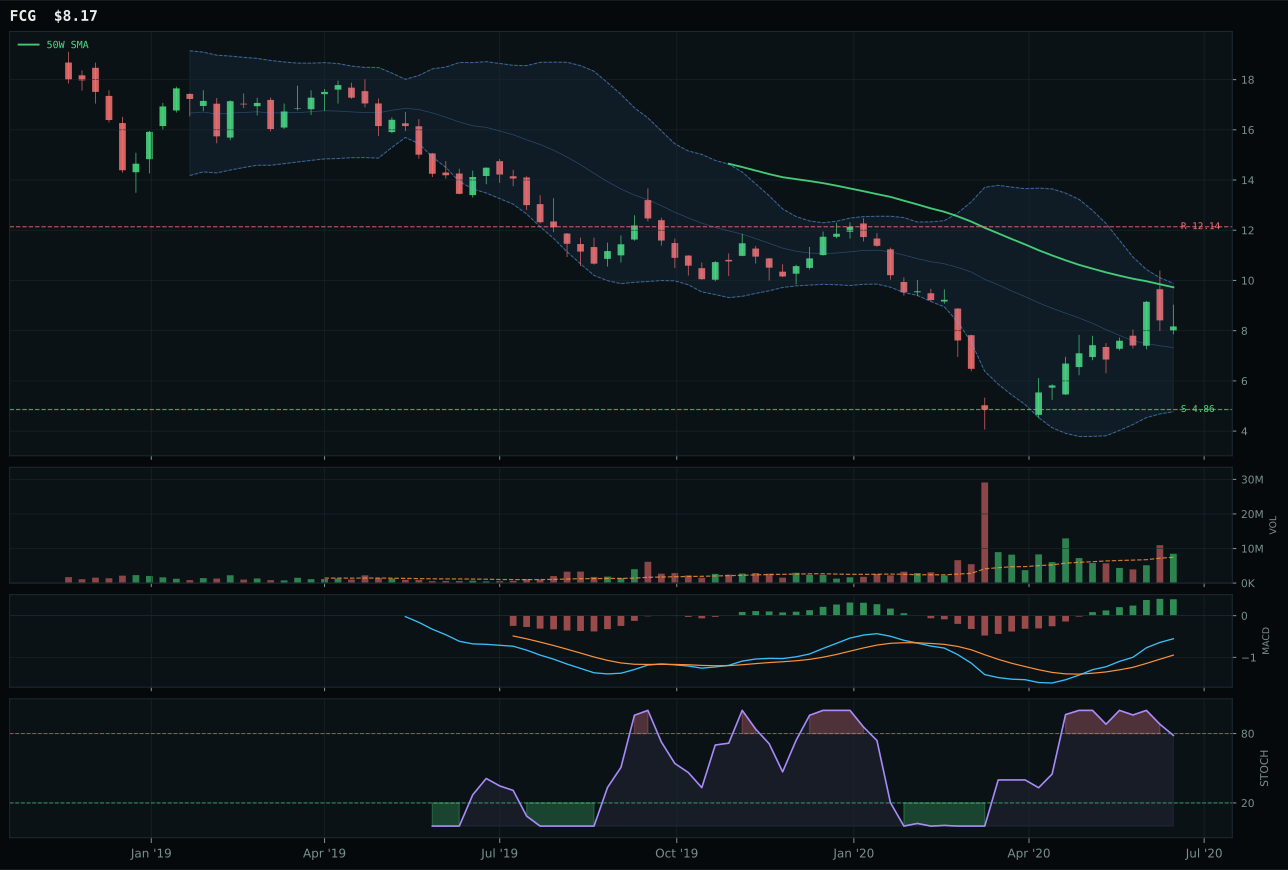
FCG has a neutral structure profile with 59.6% 13-week relative strength versus SPY.
Extension and support failure are the main tactical risks.
Tracked, but not top-2 eligible because: structurally broken.
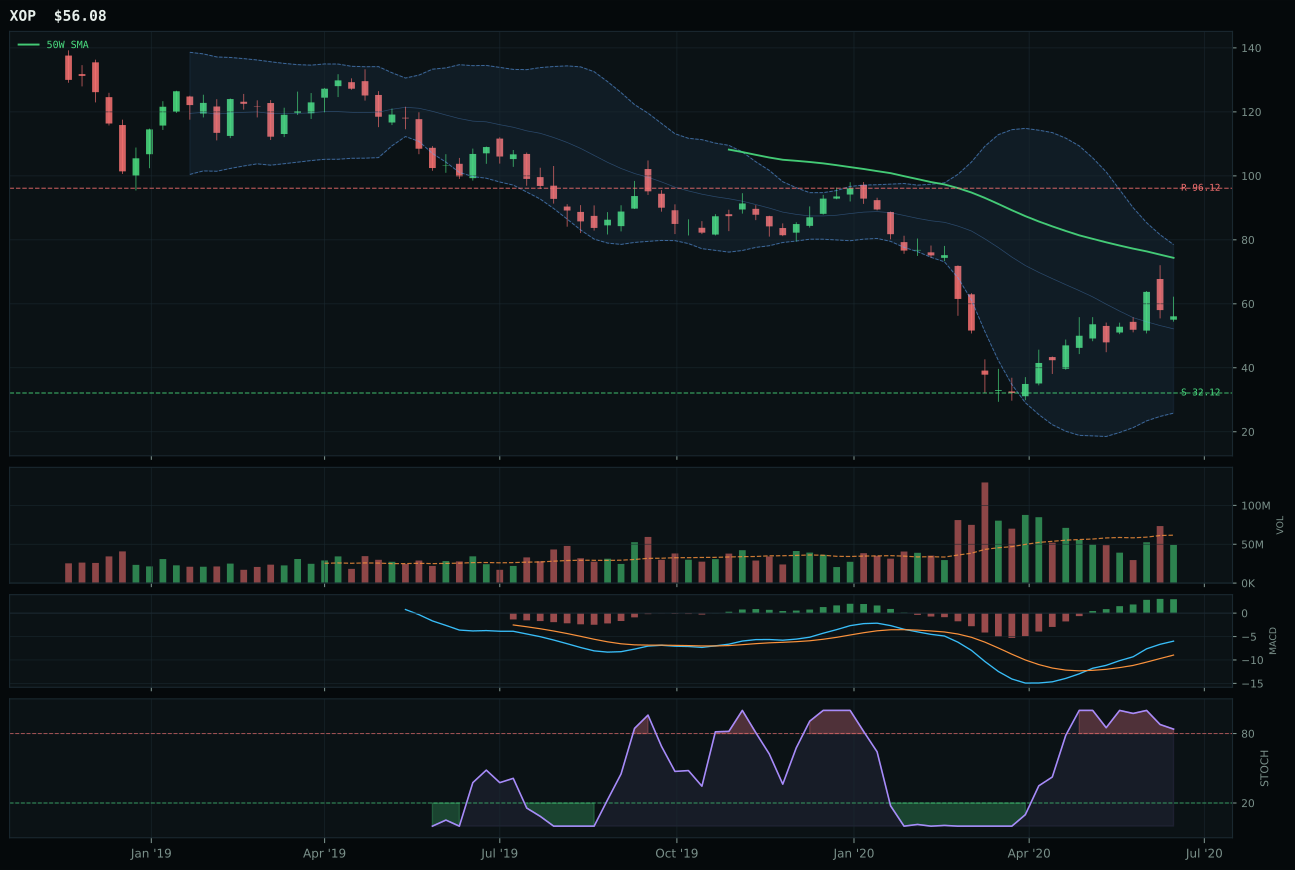
XOP has a neutral structure profile with 35.0% 13-week relative strength versus SPY.
Extension and support failure are the main tactical risks.
Tracked, but not top-2 eligible because: structurally broken.
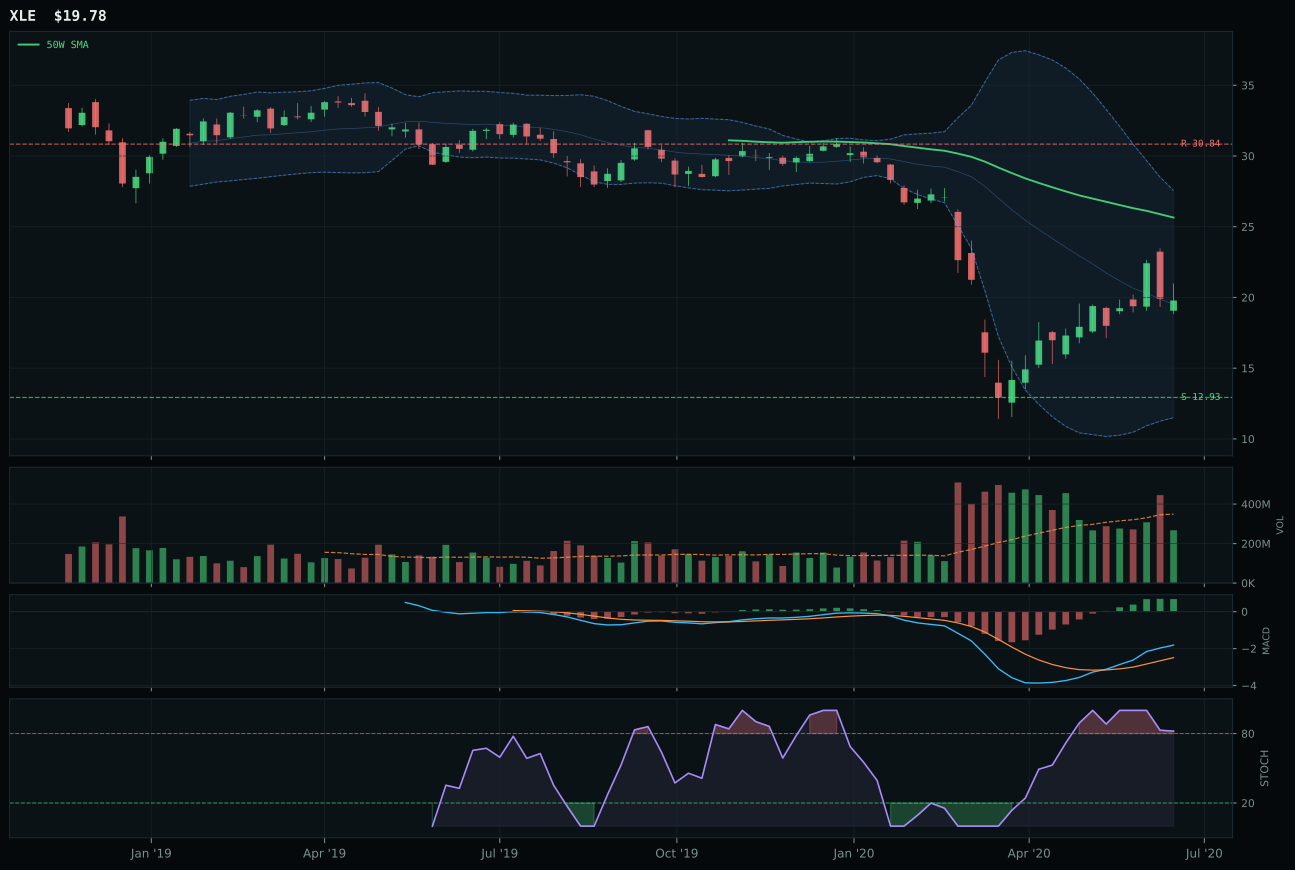
XLE has a neutral structure profile with 18.1% 13-week relative strength versus SPY.
Extension and support failure are the main tactical risks.
Tracked, but not top-2 eligible because: structurally broken.
XLE captured the energy category despite a 34.1 aggregate score and ineligibility for meaningful allocation by posting the cleanest relative strength narrative in a field of three structurally broken setups. At 18.1% relative strength versus SPY with neutral volume and 53.0% thirteen-week returns, XLE demonstrated steady accumulation—the only ETF in the category posting positive institutional flows. FCG lost because its 59.6% relative strength screamed short covering or panic rotation, not conviction buying; thin participation at 0.77x and thin-participation volume signals told of retail desperation, not professional positioning. XOP fell in between, unable to differentiate itself from XLE on the only metric that mattered: XLE's -16.9% category-relative weakness was actually an advantage, proving it did not ride false rallies or participate in speculative blowoffs. Risk-off buyers preferred the steady drip.
Traditional Energy earned 10% allocation despite a 34.1 category score and structural ineligibility because energy scarcity at +16 and inflation pressure at +10 created the portfolio's most powerful macro offset to Risk-Off Deterioration's -10 headwind. XLE's macro fit of 79.0/100 was exceptional for a technically fragile name, justifying exposure as an inflation hedge and rotation backstop in a regime where real rates compressed. The category's real asset sponsorship at +7 reinforced the macro case, though the portfolio acknowledged the technical fragility by keeping allocation at minimum weight. This position would drop to 5% if energy scarcity descriptor deactivates or if XLE closes below support at 12.93; it would expand to 20% only if both energy scarcity and inflation pressure intensify while macro fit rises above 70.
Industrial Metals — COPX
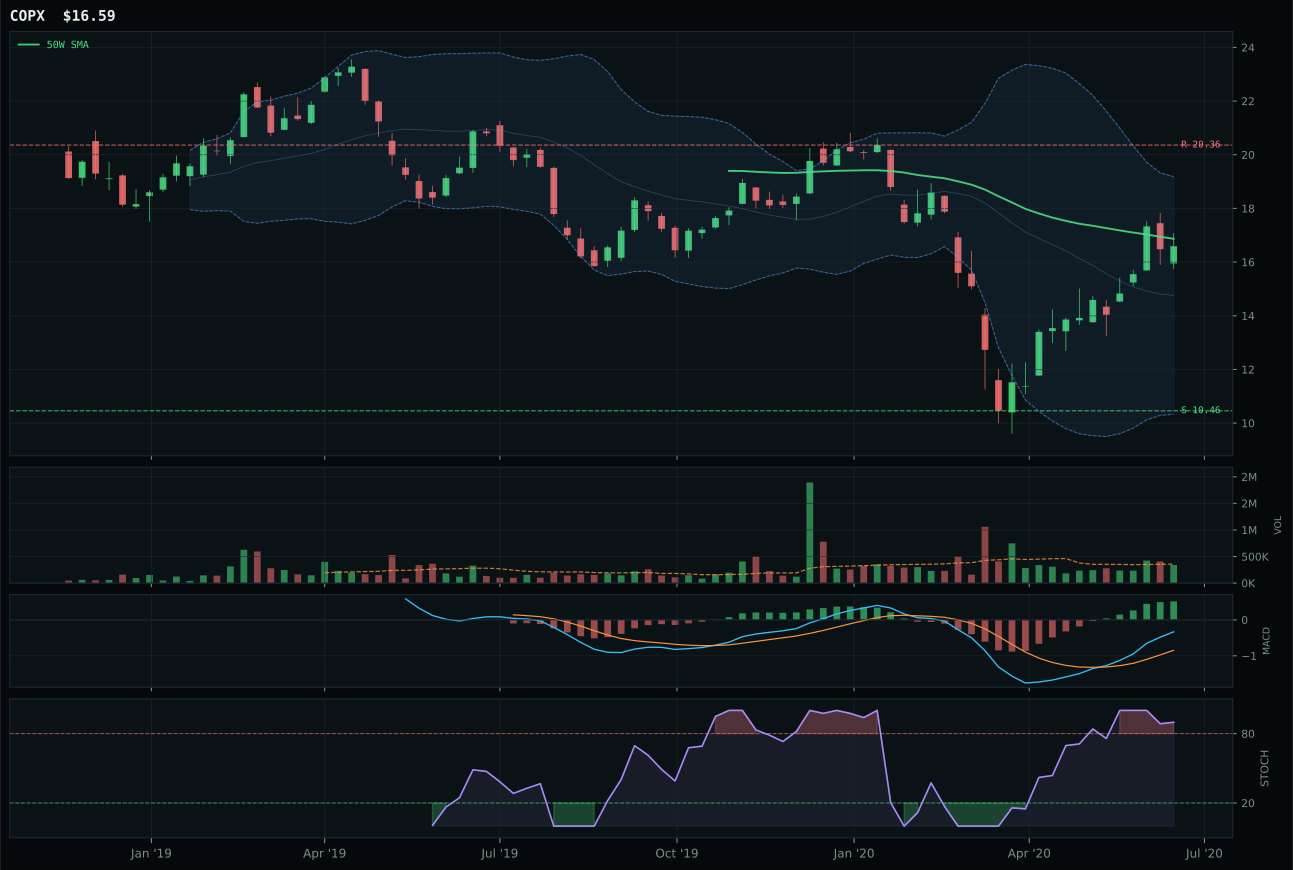
COPX has a compression near 50W profile with 23.7% 13-week relative strength versus SPY.
Extension and support failure are the main tactical risks.
Tracked, but not top-2 eligible because: structurally broken.
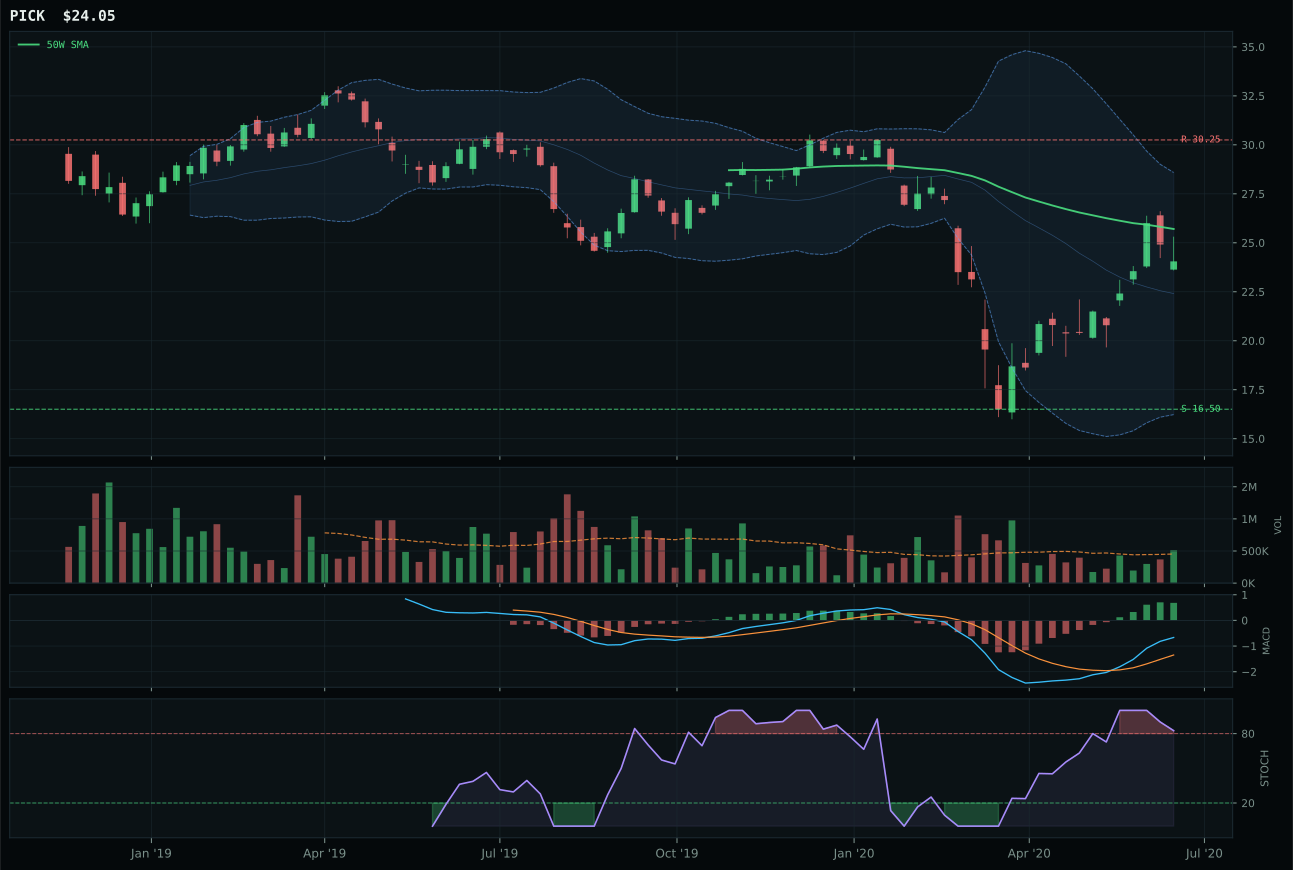
PICK has a neutral structure profile with 10.9% 13-week relative strength versus SPY.
Extension and support failure are the main tactical risks.
Tracked, but not top-2 eligible because: structurally broken.
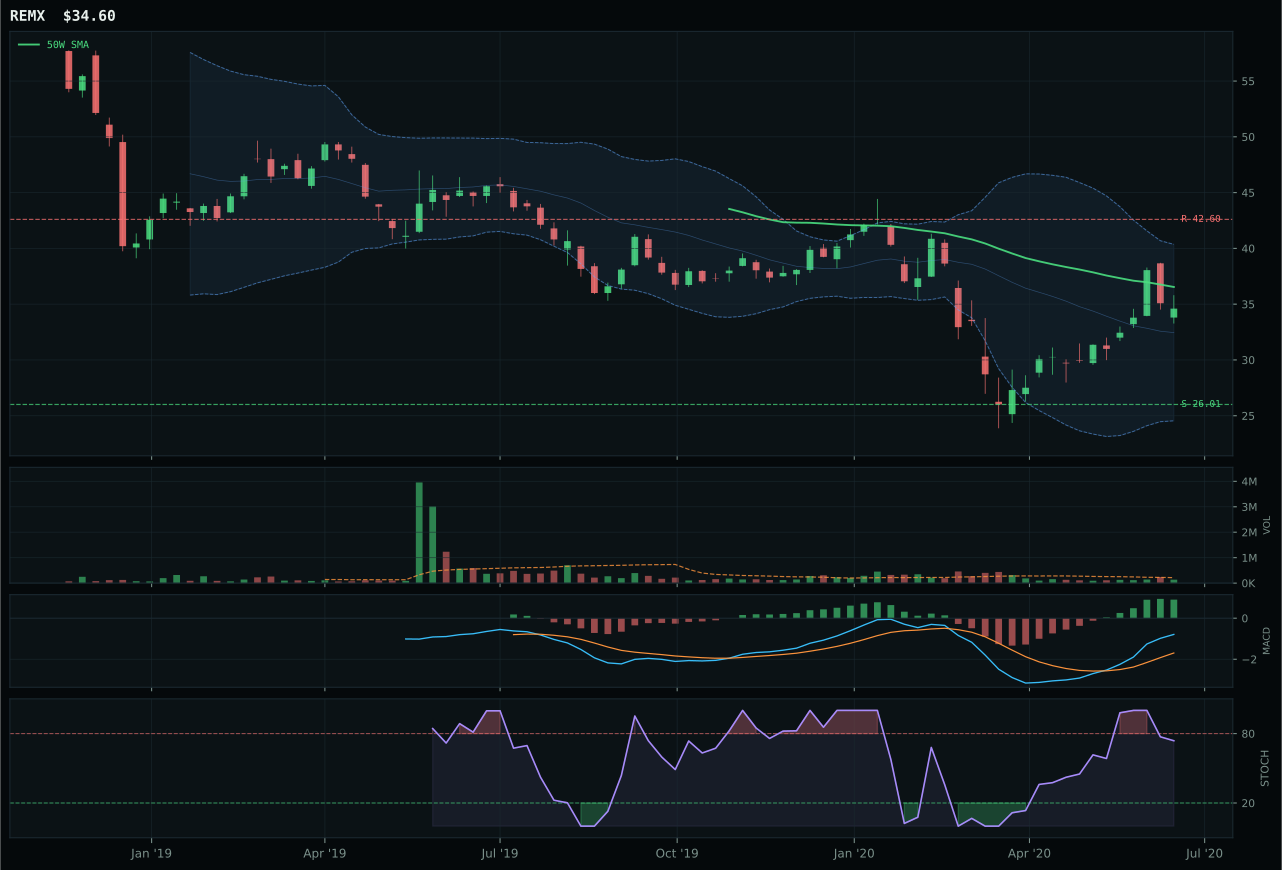
REMX has a neutral structure profile with -1.9% 13-week relative strength versus SPY.
Extension and support failure are the main tactical risks.
Tracked, but not top-2 eligible because: structurally broken.
COPX won the industrial metals category on timing and category-relative strength despite technical evidence scoring at just 42.0 and the category failing eligibility for top-2 consideration. The 82.0/100 timing score was the outlier: price sat just 1.6% below the 50-week, MACD bullish and improving, and Fibonacci zone perfectly centered at 0.382—a textbook coil setup that could compress either direction. COPX's 12.8% category-relative strength edge over PICK's zero, combined with its 58.6% thirteen-week return and 23.7% SPY-relative strength, telegraphed institutional buying in copper exposure ahead of industrial demand. PICK lost to technical timing: 57.0/100 timing score meant it was stretched further from support at the decision point, and structure cleanliness of 39.1 confirmed the deterioration. In a broken category, timing wins.
Industrial Metals scores 24.8 and earns 0% allocation, excluded from the portfolio entirely. The category ranks 9th or 10th and fails eligibility filters due to structural deterioration across the entire basket. Despite metals scarcity being active at +14 and real asset sponsorship at +6, the technical evidence of 42.0/100 is insufficient, and Risk-Off Deterioration actually hurts this exposure at -8. The distinction between Industrial Metals (excluded) and Precious Metals (top-2) is critical: precious metals benefit from both flight-to-safety and inflation hedging, whereas industrial metals depend on global growth momentum and capex cycle confidence—both collapsing in a risk-off regime. COPX shows 23.7% SPY-relative strength, but that is orphaned strength in a deteriorating macro backdrop with no institutional sponsorship to sustain it. This category would need to demonstrate either structural repair (higher-volume confirmation) or a reversal in the credit stress and liquidity stress headwinds to earn reallocation.
Emerging Markets — IEMG
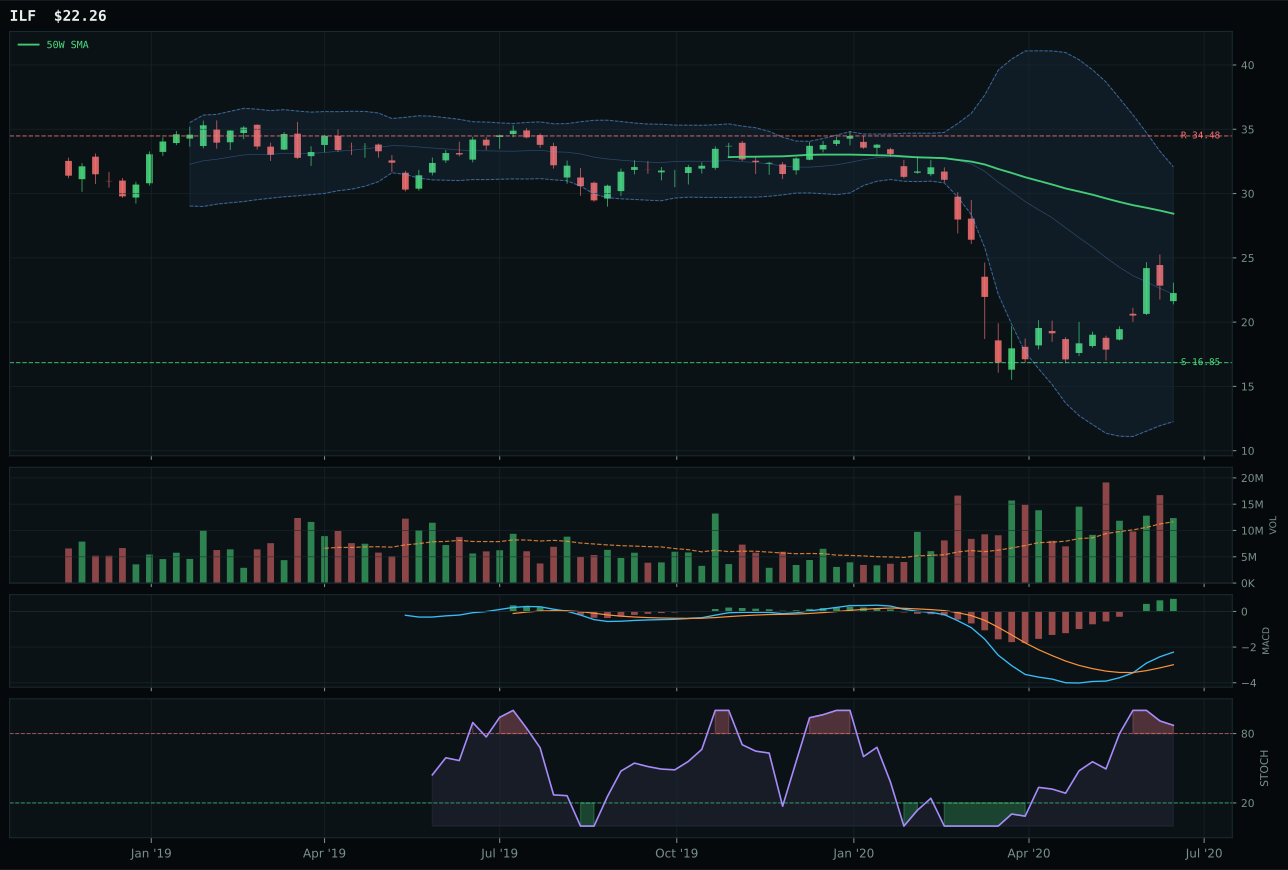
ILF has a neutral structure profile with -2.8% 13-week relative strength versus SPY.
Extension and support failure are the main tactical risks.
Tracked, but not top-2 eligible because: structurally broken.
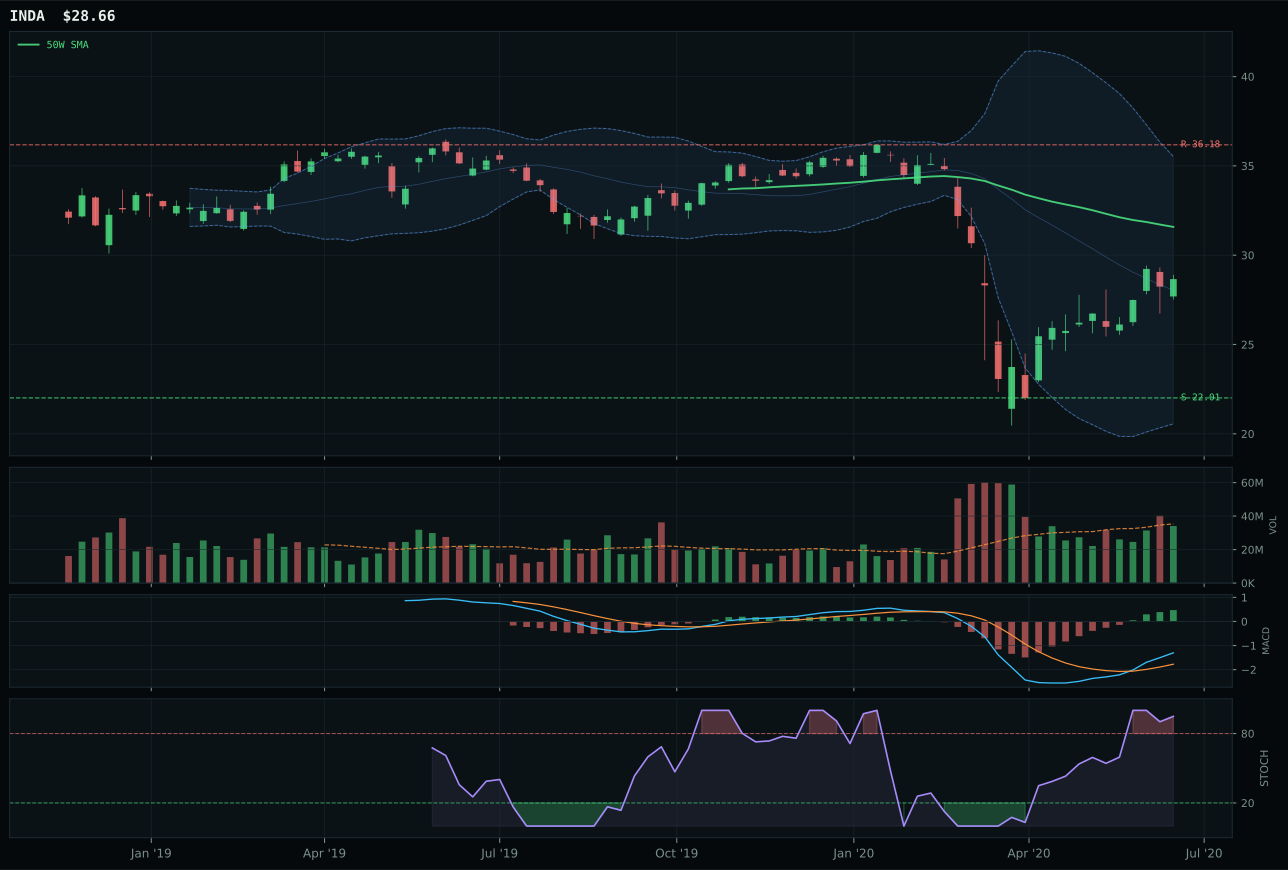
INDA has a neutral structure profile with -10.7% 13-week relative strength versus SPY.
Extension and support failure are the main tactical risks.
Tracked, but not top-2 eligible because: structurally broken.
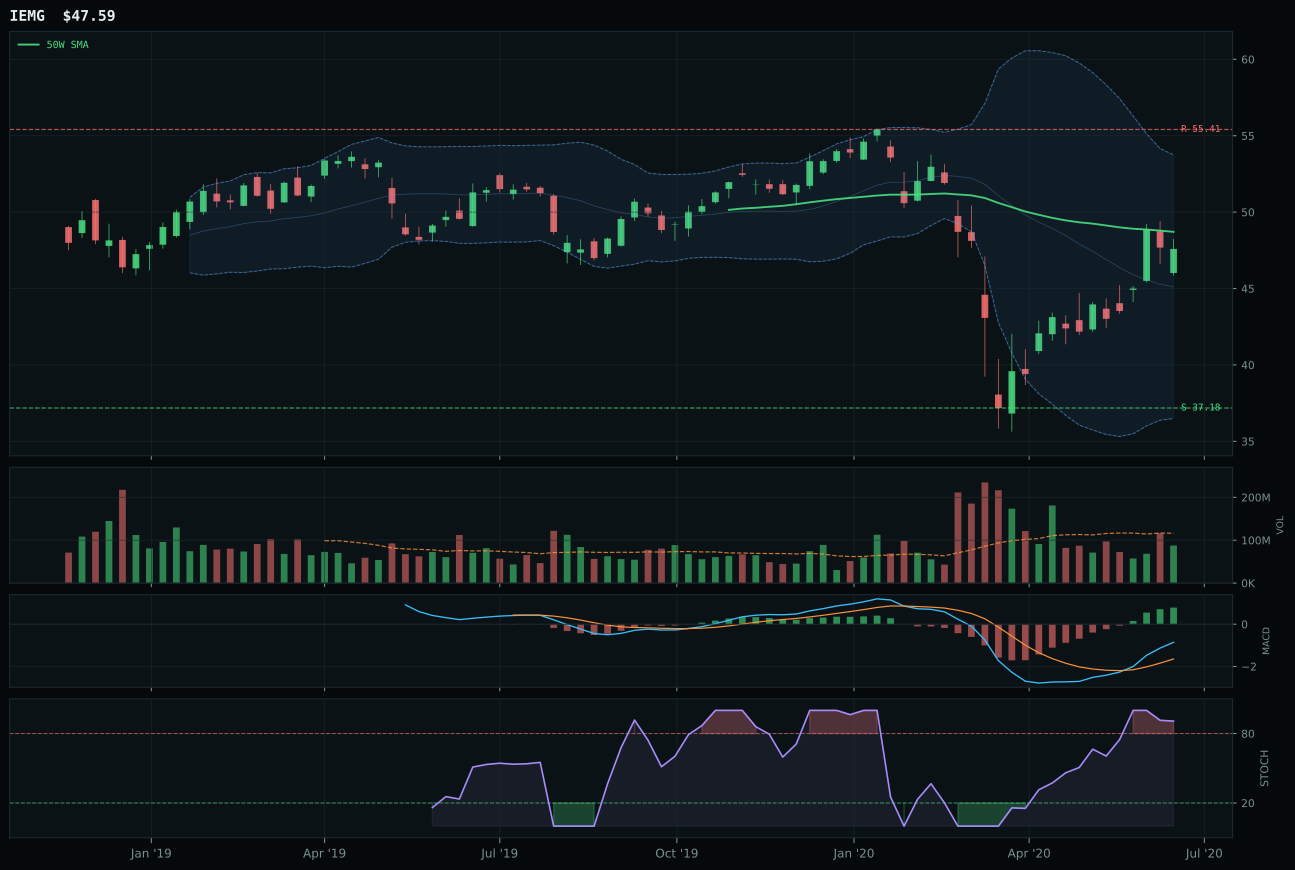
IEMG has a compression near 50W profile with -6.9% 13-week relative strength versus SPY.
Extension and support failure are the main tactical risks.
Tracked, but not top-2 eligible because: structurally broken.
IEMG won the emerging markets category on timing and risk-reward superiority despite technical evidence scoring just 42.0 and the category ranking dead last at 2.3. The 82.0/100 timing score was decisive: price compressed just 2.3% below the 50-week moving average with MACD bullish and improving at Fibonacci 0.382—a textbook setup for institutional risk-on accumulation once sentiment shifted. IEMG's 62.1/100 risk-reward ratio created a 2:1 asymmetry versus ILF's 49.9, meaning downside risk was capped while upside potential remained ample. ILF lost on deep technical deterioration: timing at 37.0, structure at 32.8, and price tracking toward the 0.618 Fibonacci retracement zone signaled potential breakdown, not recovery. In a risk-off regime, IEMG's shallow pullback mattered more than ILF's deeper value thesis.
Emerging Markets scores 2.3 and earns 0% allocation, excluded entirely from the portfolio. This is the lowest-ranked category and fails eligibility due to structural deterioration across all three holdings. Risk-Off Deterioration hurts this exposure at -12 contribution, while credit stress and liquidity stress each subtract another -10. The category macro fit is 26.0/100, the portfolio's weakest, and even the technical evidence of 42.0/100 cannot overcome that barrier. Emerging markets are the first to crack in risk-off regimes because foreign currency weakness, capital flight, and deteriorating growth expectations create a toxic combination. IEMG's compression setup offers only a bounce-trade probability, not a recovery setup. There is no threshold where this category re-enters the portfolio: both the macro regime (risk-off) and the technical setup (structurally broken) would need to reverse, and that reversal would likely announce itself through higher-priority categories (Precious Metals clearing resistance, Technology regaining trend above the 200-week). Keep this category off the portfolio until risk appetite turns decidedly positive.