
2020-06-12
Informational purposes only. The content in this report, including allocations, analysis, and commentary, is provided solely for informational and educational purposes. It does not constitute financial advice, investment advice, trading advice, or any other type of advice. Past performance does not guarantee future results. Always conduct your own research and consult a qualified financial professional before making investment decisions.
Some tracked tickers were excluded due to missing live weekly price data: SGOV: Historical cache SGOV has only 2 usable weekly bars; URNM: Historical cache URNM has only 28 usable weekly bars
Weekly Allocation
| Ticker | Category | Weight | Role |
|---|---|---|---|
| SMH | AI | 20% | Top-2 (20%) |
| XLK | Technology | 20% | Top-2 (20%) |
| SLV | Precious Metals | 10% | Tier-2 (10%) |
| ITA | Defense & Aerospace | 10% | Tier-2 (10%) |
| PAVE | Utilities & Infrastructure | 10% | Tier-2 (10%) |
| URA | Nuclear Energy | 10% | Tier-2 (10%) |
| FCG | Traditional Energy | 10% | Tier-2 (10%) |
| MOO | Agriculture & Livestock | 10% | Tier-2 (10%) |
Trade Instructions — Monday Open
Sell the tranche from 2020-05-15 (completing its 4-week hold). Buy the new tranche. Instructions show net portfolio changes — same-asset positions cancel, weight changes show the delta.
| Action | Ticker | Instruction |
|---|---|---|
| SELL | IGV | Sell 50% of IGV position (reduce 10.00% → 5.00%) |
| SELL | GLD | Sell entire GLD position (5.00% of portfolio) |
| SELL | BOTZ | Sell 17% of BOTZ position (reduce 15.00% → 12.50%) |
| SELL | IGF | Sell 33% of IGF position (reduce 7.50% → 5.00%) |
| SELL | XAR | Sell 33% of XAR position (reduce 7.50% → 5.00%) |
| BUY | SLV | Buy SLV — 14.29% of freed cash (adds 2.50% to portfolio) |
| BUY | ITA | Buy ITA — 14.29% of freed cash (adds 2.50% to portfolio) |
| BUY | PAVE | Buy PAVE — 14.29% of freed cash (adds 2.50% to portfolio) |
| BUY | SMH | Buy SMH — 28.57% of freed cash (adds 5.00% to portfolio) |
| BUY | XLK | Buy XLK — 28.57% of freed cash (adds 5.00% to portfolio) |
Current Portfolio After Trade
Combined holdings across all 4 active tranches. Each tranche is 25% of the portfolio.
| Ticker | % of Portfolio | Weight Bar |
|---|---|---|
| BOTZ | 12.50% | |
| SLV | 12.50% | |
| CIBR | 10.00% | |
| XLE | 7.50% | |
| IGF | 5.00% | |
| XAR | 5.00% | |
| IGV | 5.00% | |
| MOO | 5.00% | |
| URA | 5.00% | |
| ITA | 5.00% | |
| PAVE | 5.00% | |
| SMH | 5.00% | |
| XLK | 5.00% | |
| NLR | 2.50% | |
| ILF | 2.50% | |
| IEMG | 2.50% | |
| REMX | 2.50% | |
| FCG | 2.50% |
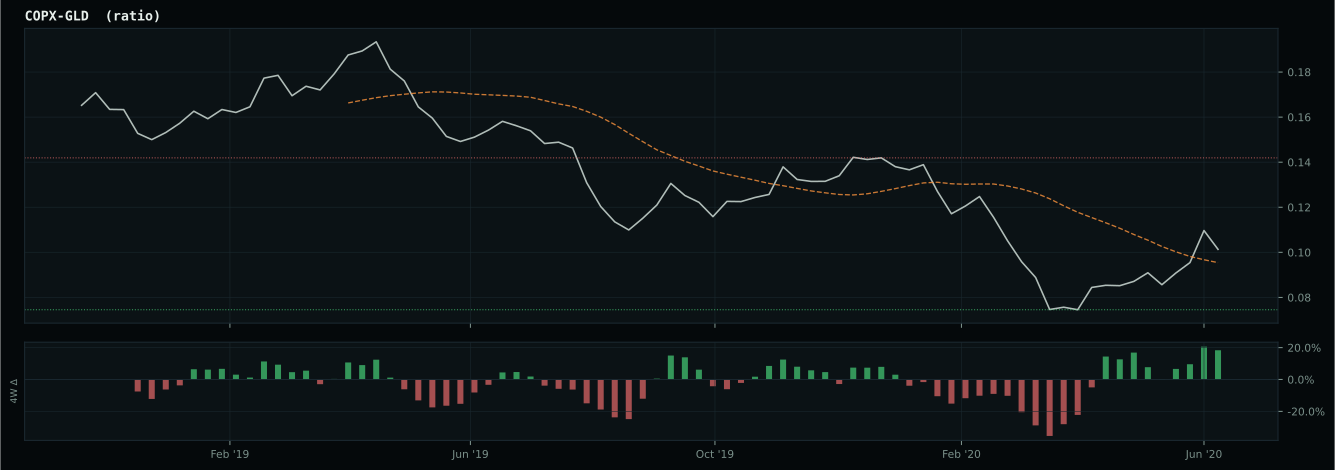
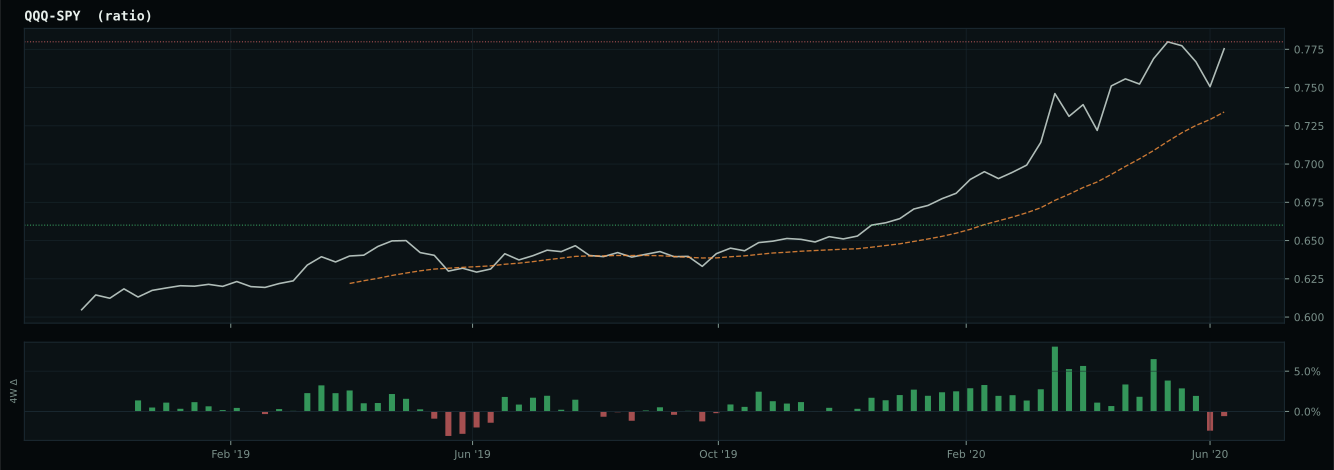
Macro Regime — Transition / Mixed
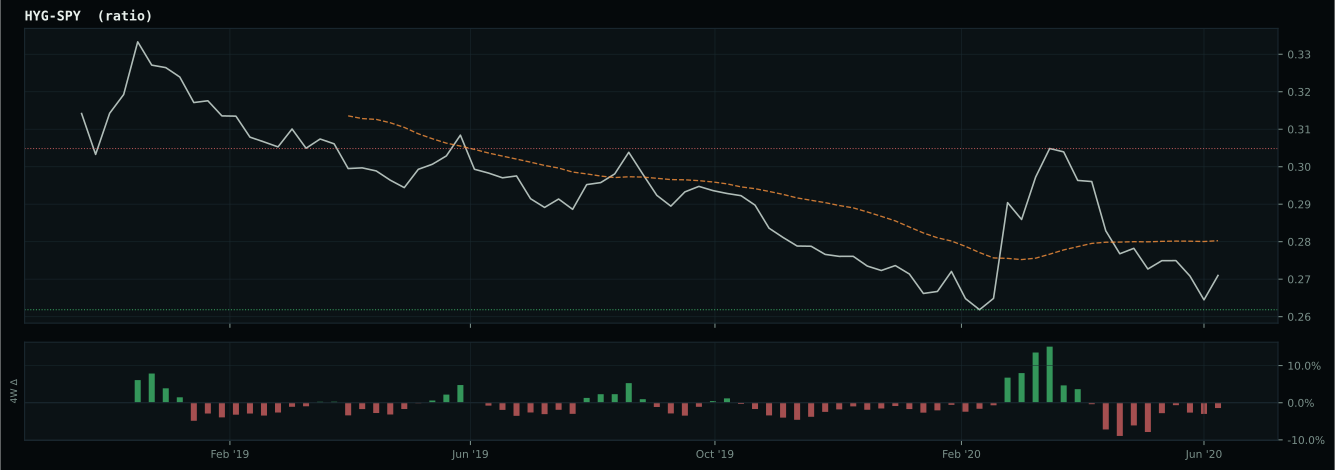
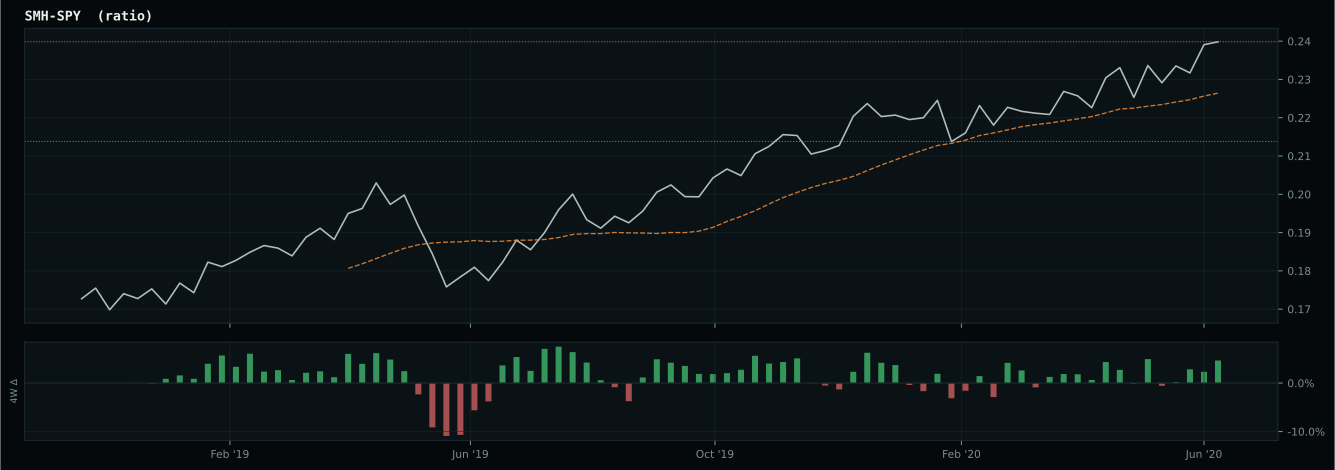
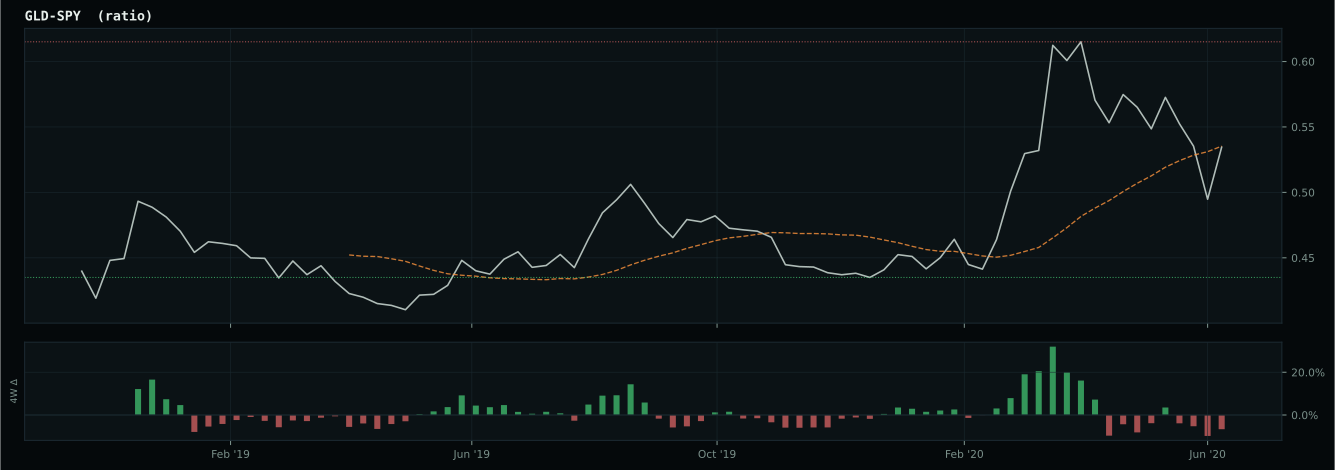
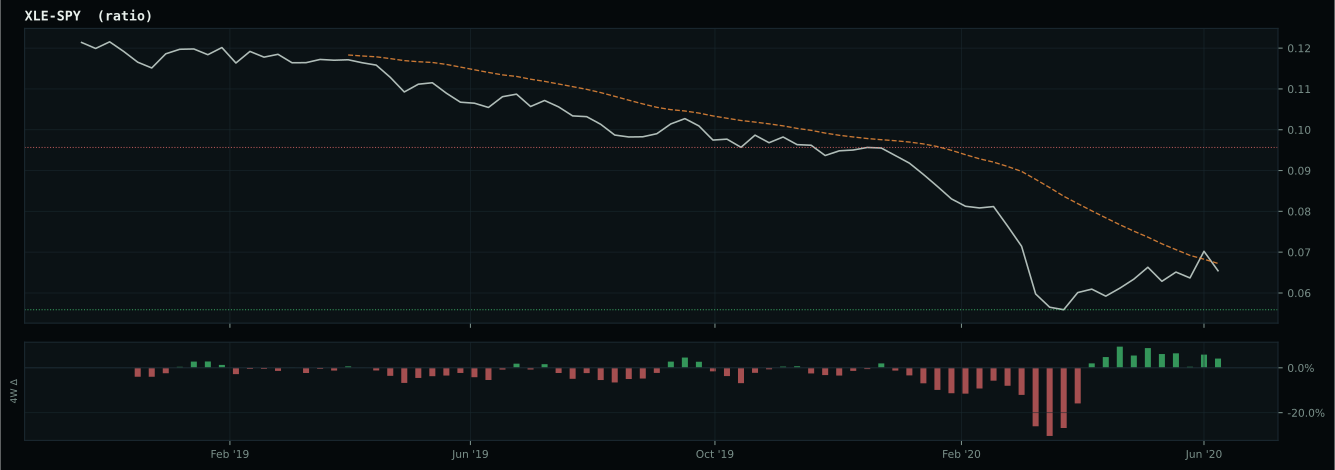
inflation-sensitive ratios are firm but broad commodity participation is weak
Macro Evidence Charts
Market-implied signals behind the macro regime scores. Each ratio compares two assets; the direction and slope of the ratio is what the macro engine reads.
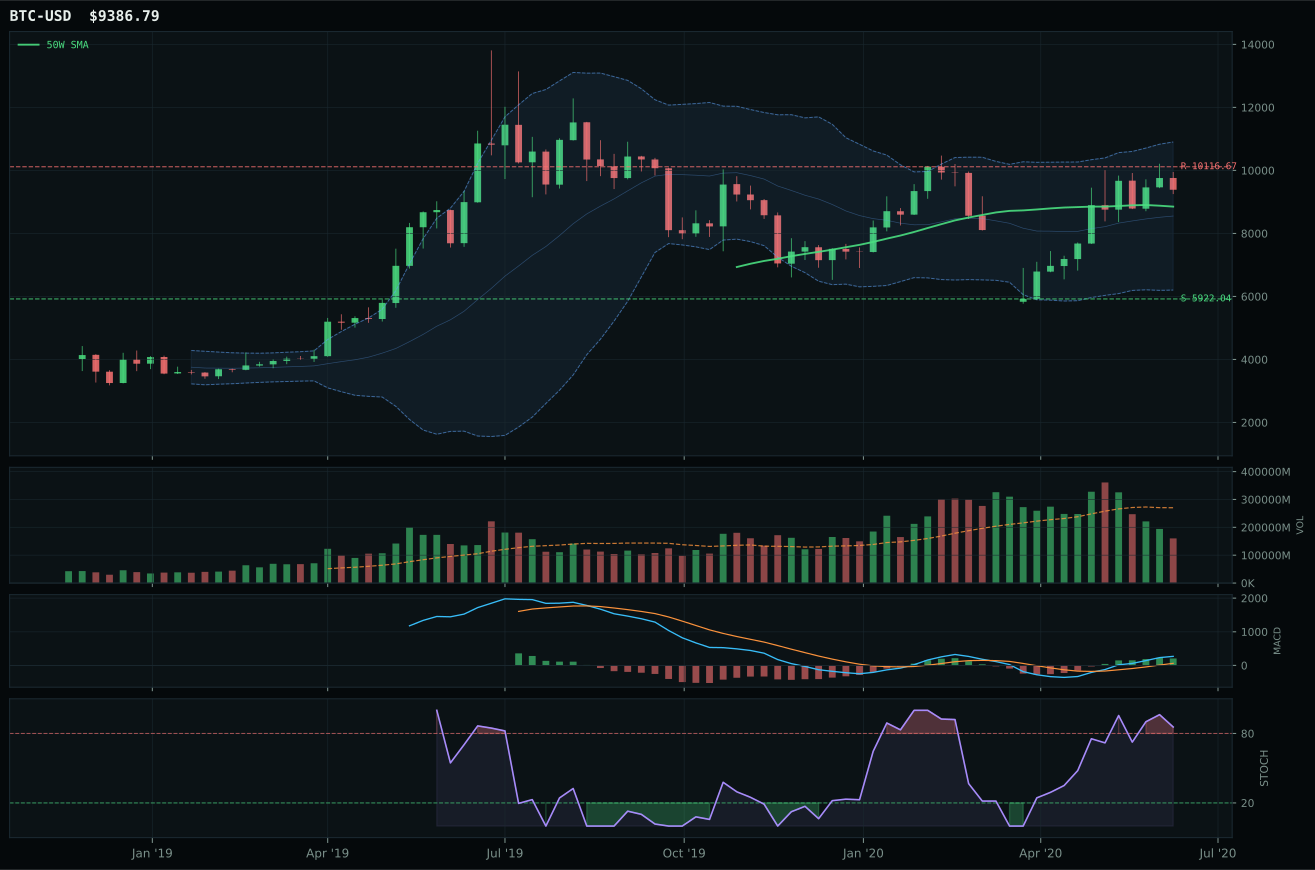
Crypto Regime — NoCrypto
post-touch structure is too wide to count as a range; max/min close ratio is 1.81
TrendBTC not confirmed
one or more available conditions failed

Category Rankings
| Rank | Category | Winner | Score | Alloc | 4W Ret | Peers (4W) |
|---|---|---|---|---|---|---|
| 1 | AI | SMH | 67.1 | 20% | +13.79% | BOTZ +9.9% · AIQ +14.8% |
| 2 | Technology | XLK | 65.5 | 20% | +11.68% | IGV +14.9% · CIBR +11.9% |
| 3 | Precious Metals | SLV | 64.3 | 10% | +13.36% | GDX +22.8% · GLD +6.1% |
| 4 | Defense & Aerospace | ITA | 51.0 | 10% | -3.34% | XAR -2.1% · ROKT -2.1% |
| 5 | Utilities & Infrastructure | PAVE | 49.0 | 10% | +5.75% | IGF +0.2% · XLU +0.2% |
| 6 | Nuclear Energy | URA | 39.9 | 10% | +5.35% | NLR +0.3% |
| 7 | Traditional Energy | FCG | 39.6 | 10% | -10.25% | XOP -9.1% · XLE -5.9% |
| 8 | Agriculture & Livestock | MOO | 36.9 | 10% | +4.13% | VEGI +4.8% · WEAT +4.2% |
| 9 | Industrial Metals | PICK | 35.0 | 0% | +9.99% | COPX +25.1% · REMX +18.5% |
| 10 | Emerging Markets | ILF | 29.4 | 0% | +4.99% | IEMG +12.6% · INDA +11.9% |
AI — SMH
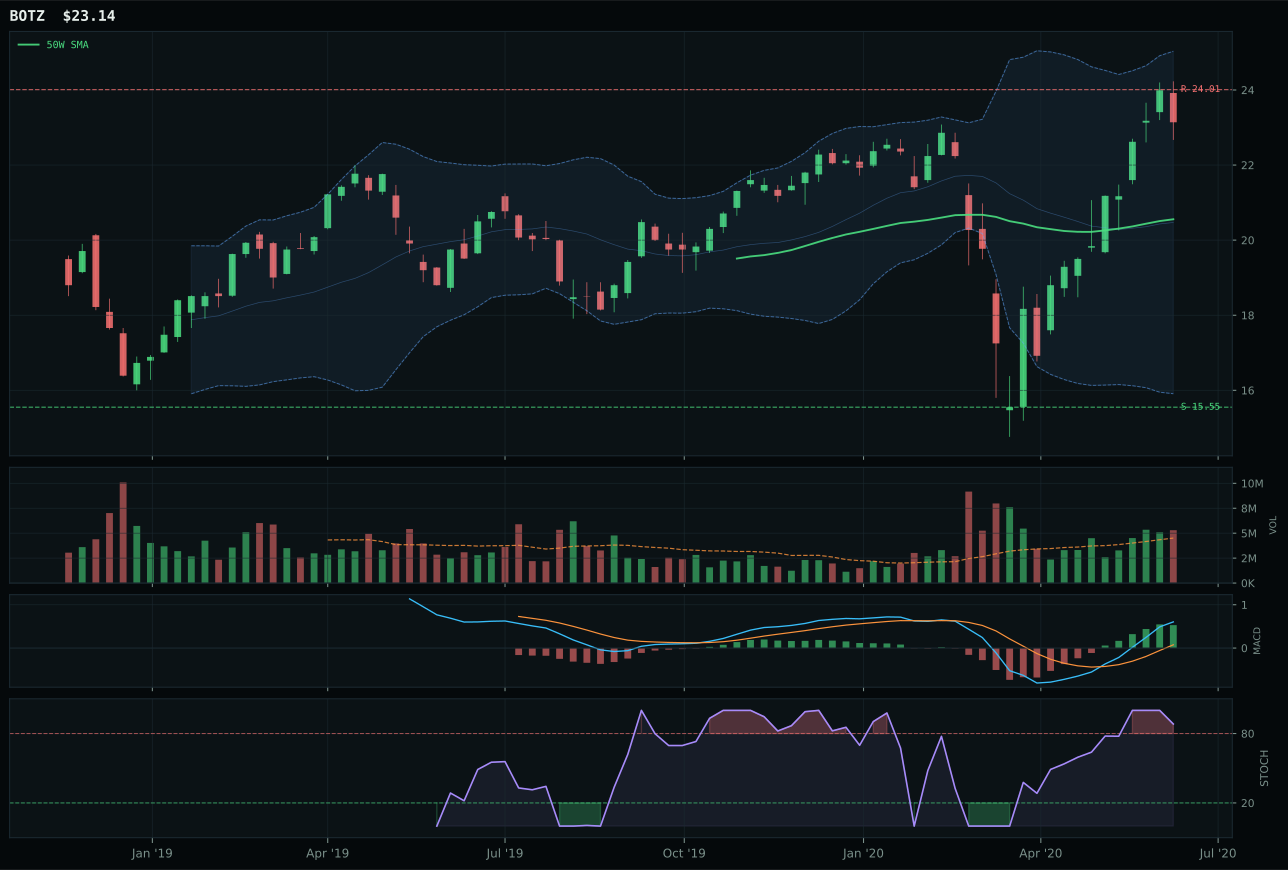
BOTZ has a neutral structure profile with 21.2% 13-week relative strength versus SPY.
A failed hold above support would weaken the setup.
Actionable but governed by invalidation levels.
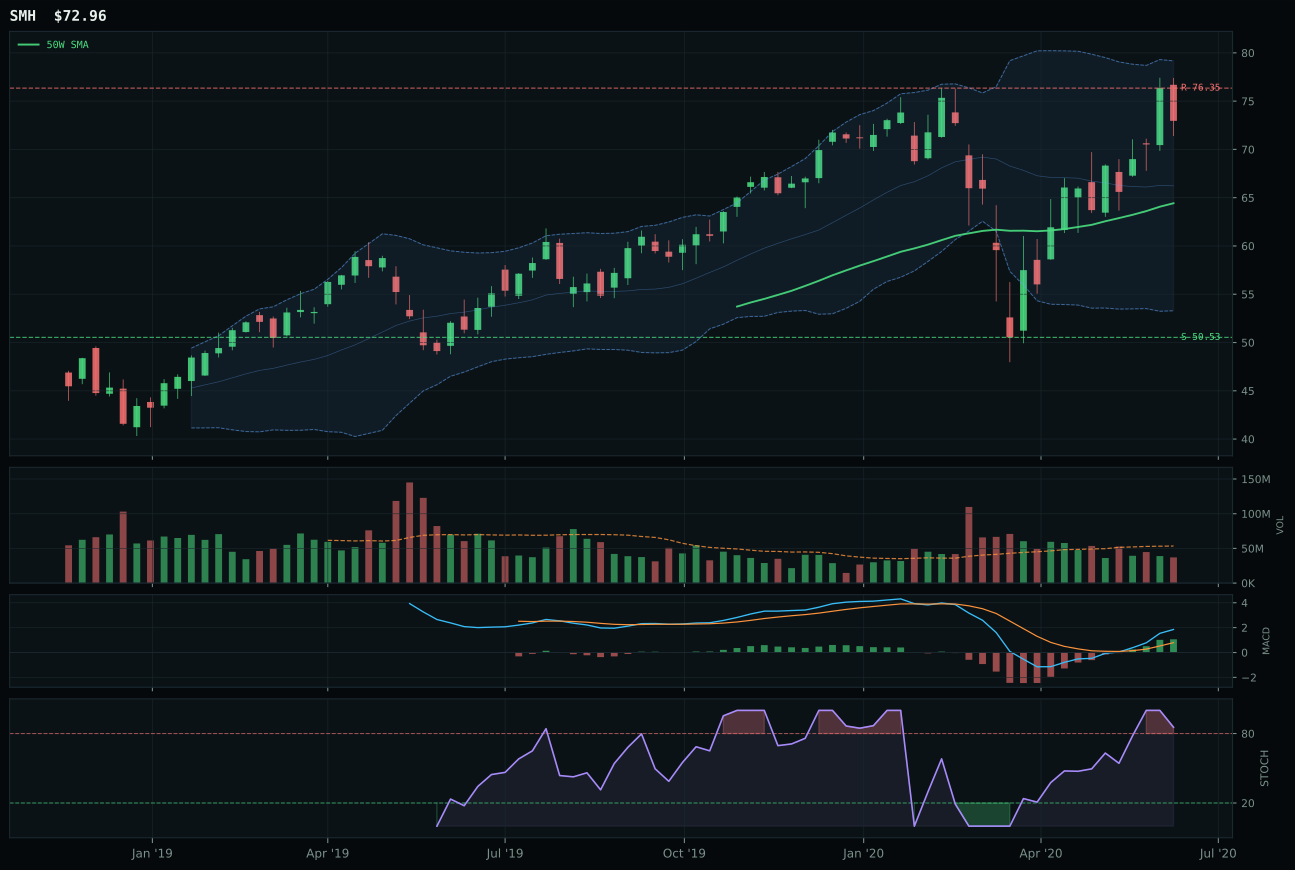
SMH has a neutral structure profile with 9.5% 13-week relative strength versus SPY.
A failed hold above support would weaken the setup.
Actionable but governed by invalidation levels.
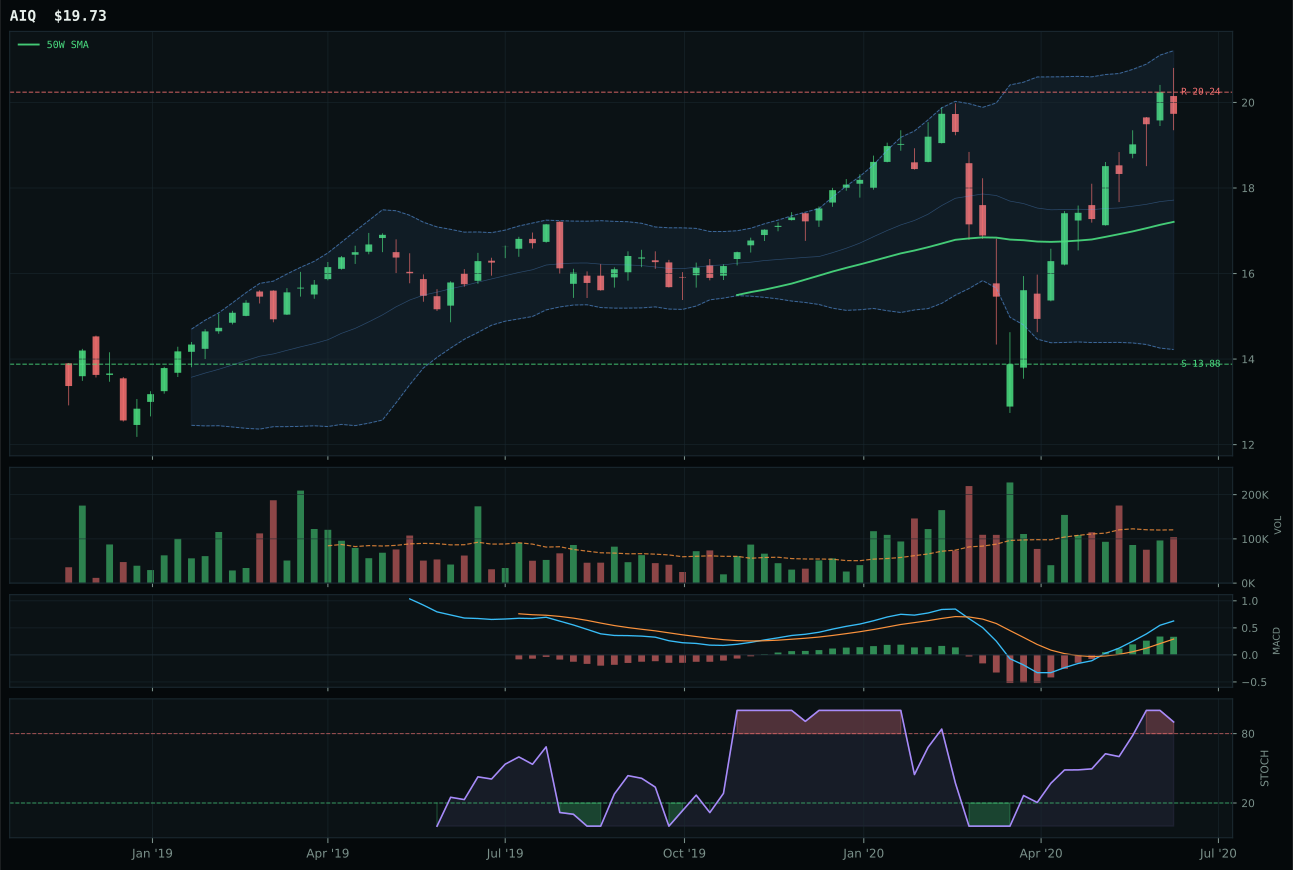
AIQ has a neutral structure profile with 14.7% 13-week relative strength versus SPY.
A failed hold above support would weaken the setup.
Tracked, but not top-2 eligible because: .
SMH claims the AI category despite BOTZ's superior 21.2% SPY-relative return because semiconductor leadership carries better macro credentials and cleaner timing mechanics. SMH sits 13.2% from its 50-week moving average in the exact upper Fibonacci retracement zone where the stochastic RSI hits 0.85 overbought momentum; this setup is textbook late-stage trend but with genuine 9.5% SPY alpha rather than stretched speculation. BOTZ's 34.1% 13-week return and 21.2% relative strength look aggressive, yet its stochastic RSI is rolling over while SMH's remains firmly bullish and improving—the timing score gap of 10 points reflects that BOTZ peaked before SMH confirmation. Both carry category-relative weakness (-5.2% for SMH, +6.5% for BOTZ), but SMH's portfolio composition in AI compute and memory reflects institutional accumulation in a regime where energy scarcity and manufacturing reshoring support semiconductor capex.
AI category scores 67.1 and earns top-2 status because AI growth sponsorship dominates the macro signal at +14, with risk appetite positive adding another +10 to offset credit stress at -6. The semiconductor and compute positioning in SMH aligns perfectly with the macro regime's energy constraints and U.S.-China decoupling backdrop, making it a natural 20% sleeve allocation. SMH's 31.8 risk-reward score reflects its stretched 4.4% upside to resistance, yet that constraint is acceptable in a portfolio sense because the category's macro fit is 66 out of 100 and persistence runs 71.3%, meaning this is positioned strength not euphoria. The thin 0.69x volume suggests early-stage accumulation rather than climactic buying; every new dollar into SMH faces 44.4% downside to support before trend breaks, but the probability-weighted macro sponsorship justifies that asymmetry inside a two-category top-2 allocation framework.
Technology — XLK
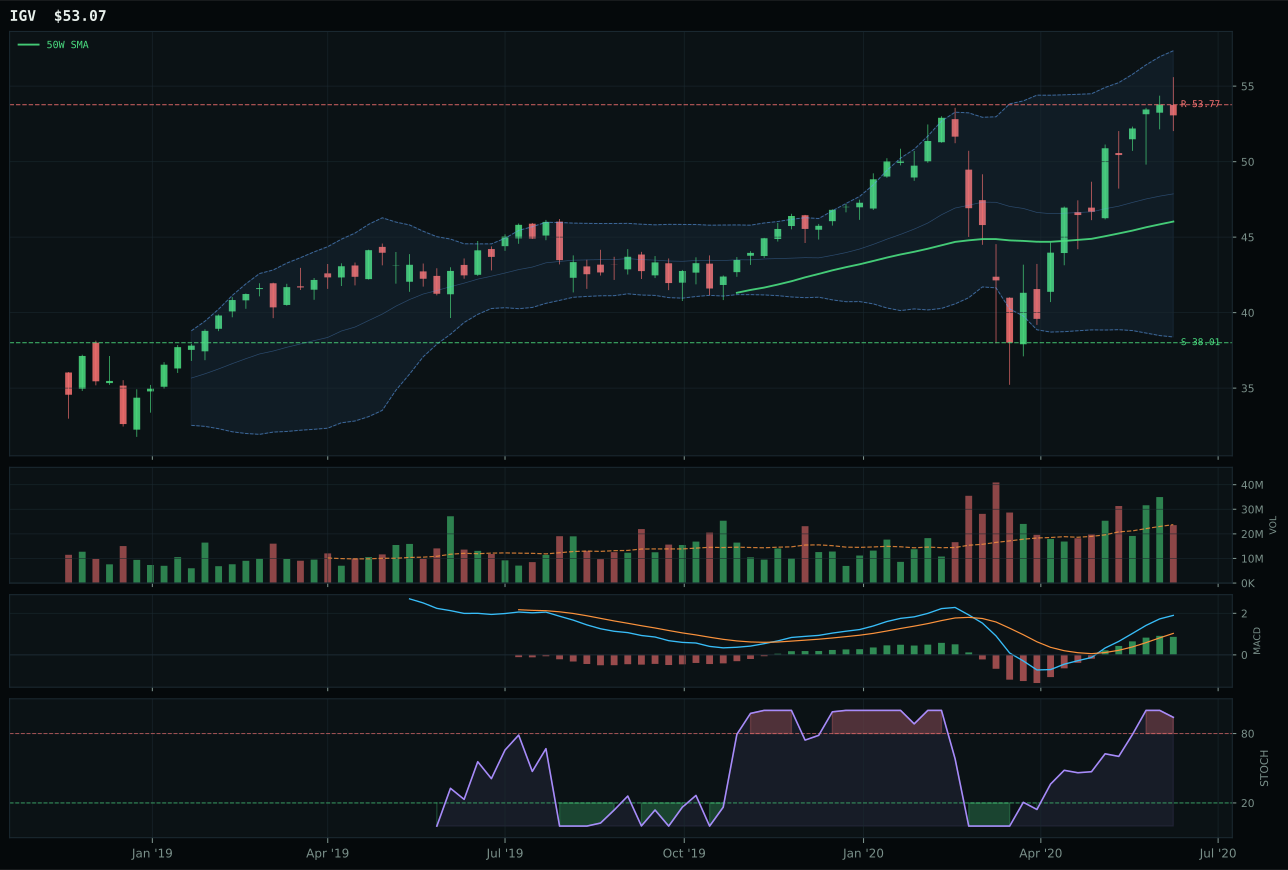
IGV has a vertical extension profile with 13.0% 13-week relative strength versus SPY.
A failed hold above support would weaken the setup.
Actionable but governed by invalidation levels.
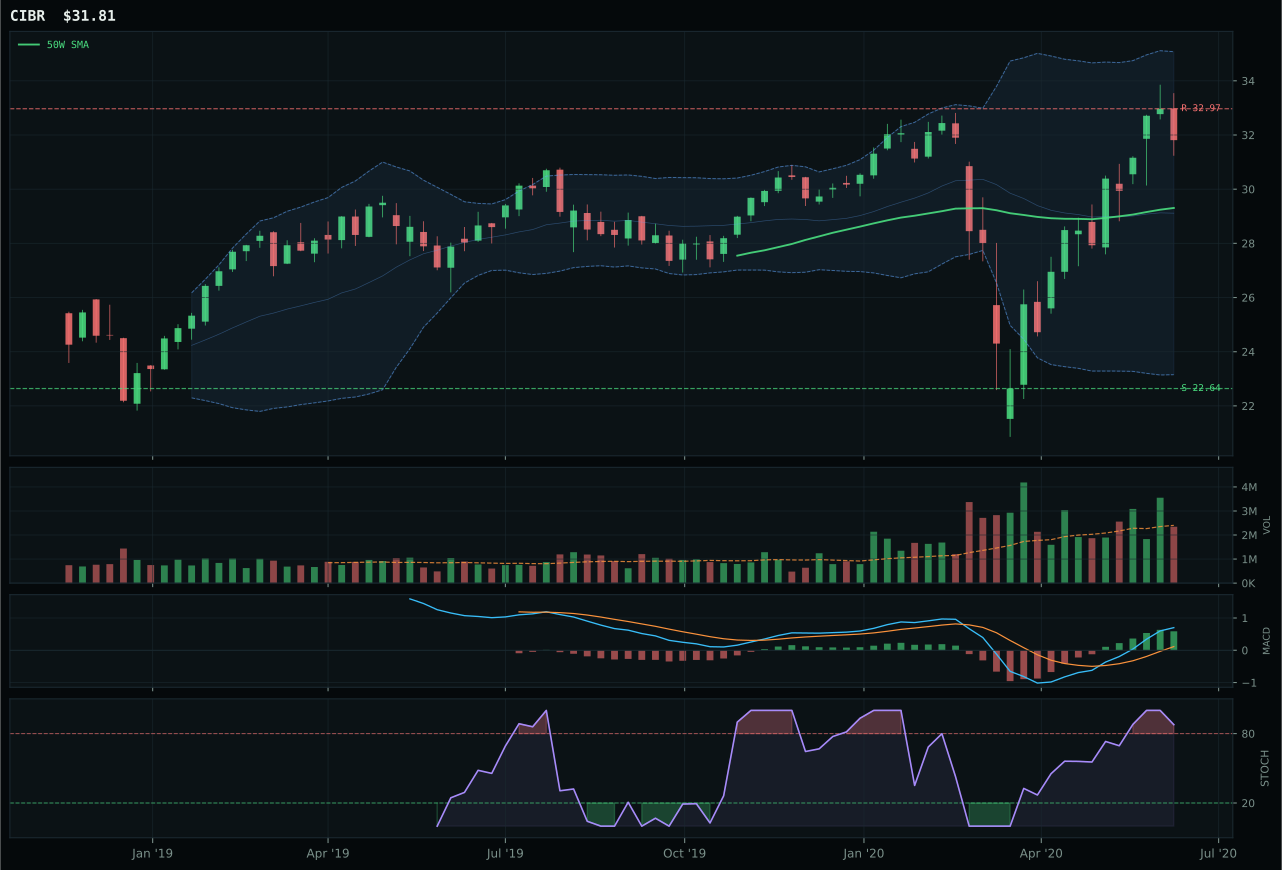
CIBR has a neutral structure profile with 18.0% 13-week relative strength versus SPY.
A failed hold above support would weaken the setup.
Actionable but governed by invalidation levels.
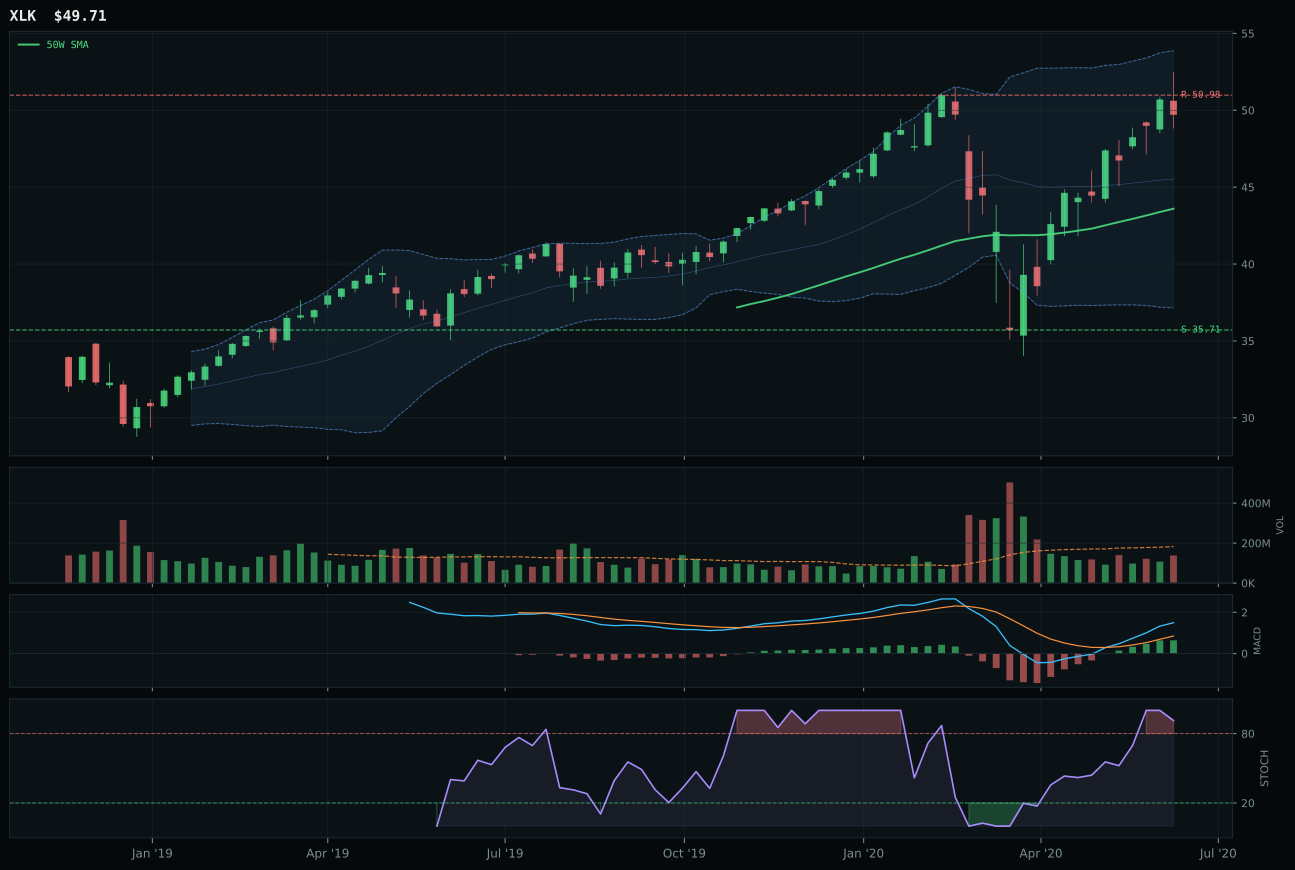
XLK has a neutral structure profile with 5.1% 13-week relative strength versus SPY.
A failed hold above support would weaken the setup.
Actionable but governed by invalidation levels.
XLK wins the category because it combines steady upside momentum with disciplined positioning: price sits 14% above the 50-week moving average with a 0.5% positive slope, giving it trend credibility without extension risk. The 5.1% outperformance versus SPY reflects genuine participation in broad-based software and IT services strength, while IGV's 13% SPY-relative gain exposes it as a concentrated bet on duration-sensitive enterprise software where timing already scored 22 points lower. XLK's neutral structure and 72% volume confirmation score mean the move is being accumulated rather than squeezed, and with MACD bullish and improving alongside overbought stochastic RSI at 0.91, the setup shows momentum persistence without deteriorating breadth.
Technology earns its 20% allocation slot as one of two category leaders because the macro regime supports both risk appetite and AI sponsorship while MACD and relative strength remain intact across the three-ETF basket. Credit stress carries a -6 penalty and inflation pressure a -4 penalty, yet AI growth sponsorship adds +4 and risk appetite positive adds +9, creating a net macro tailwind that combines well with XLK's clean 77.8 structure score and 100-point trend foundation. The 65.5 final category score reflects XLK's ability to lead without stretched valuation; it stands third-nearest resistance at only 2.5% away, and the thin 0.76x volume participation means new money can still accumulate without panic. This positioning works in a transition regime where equity leadership rotates into proven profitability.
Precious Metals — SLV
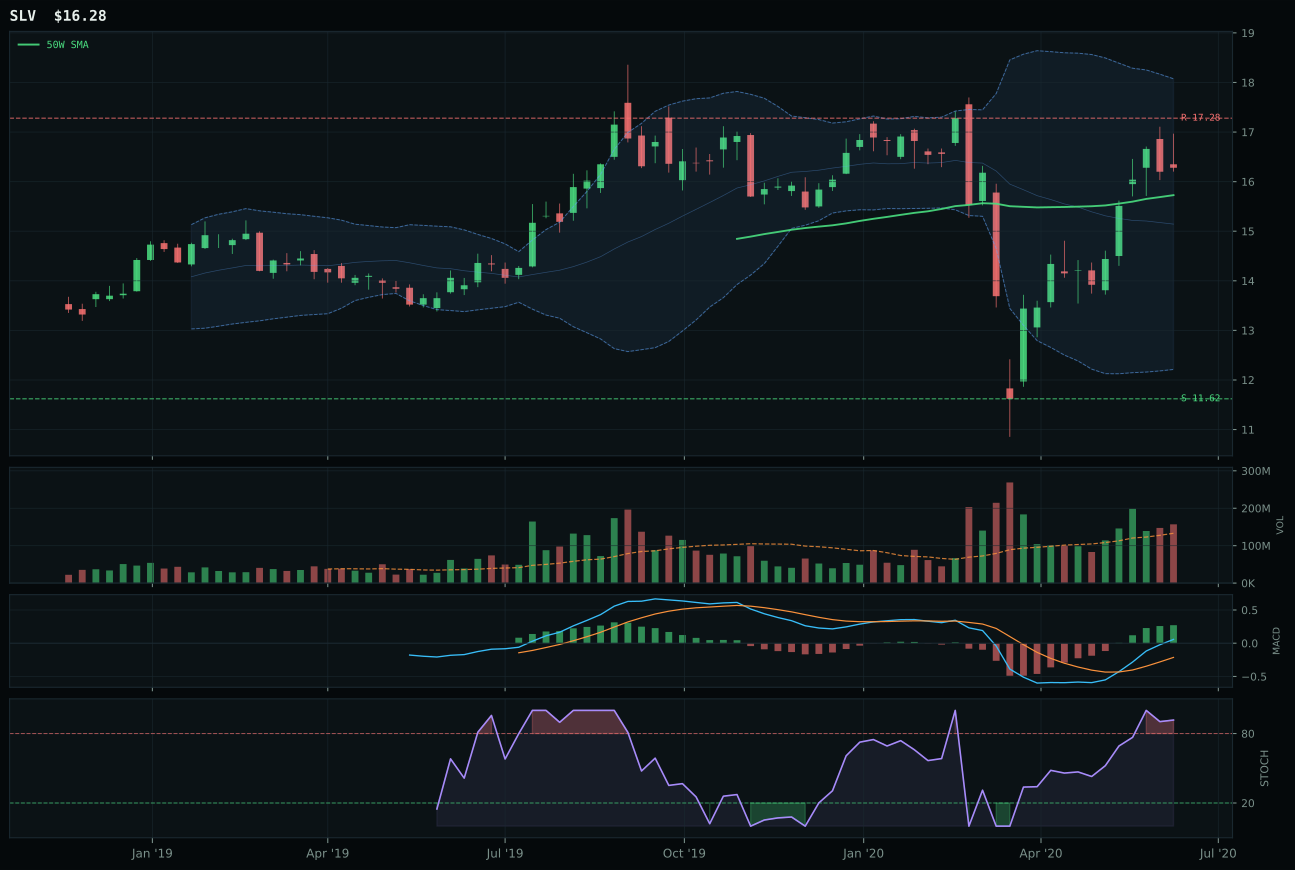
SLV has a neutral structure profile with 6.0% 13-week relative strength versus SPY.
A failed hold above support would weaken the setup.
Actionable but governed by invalidation levels.
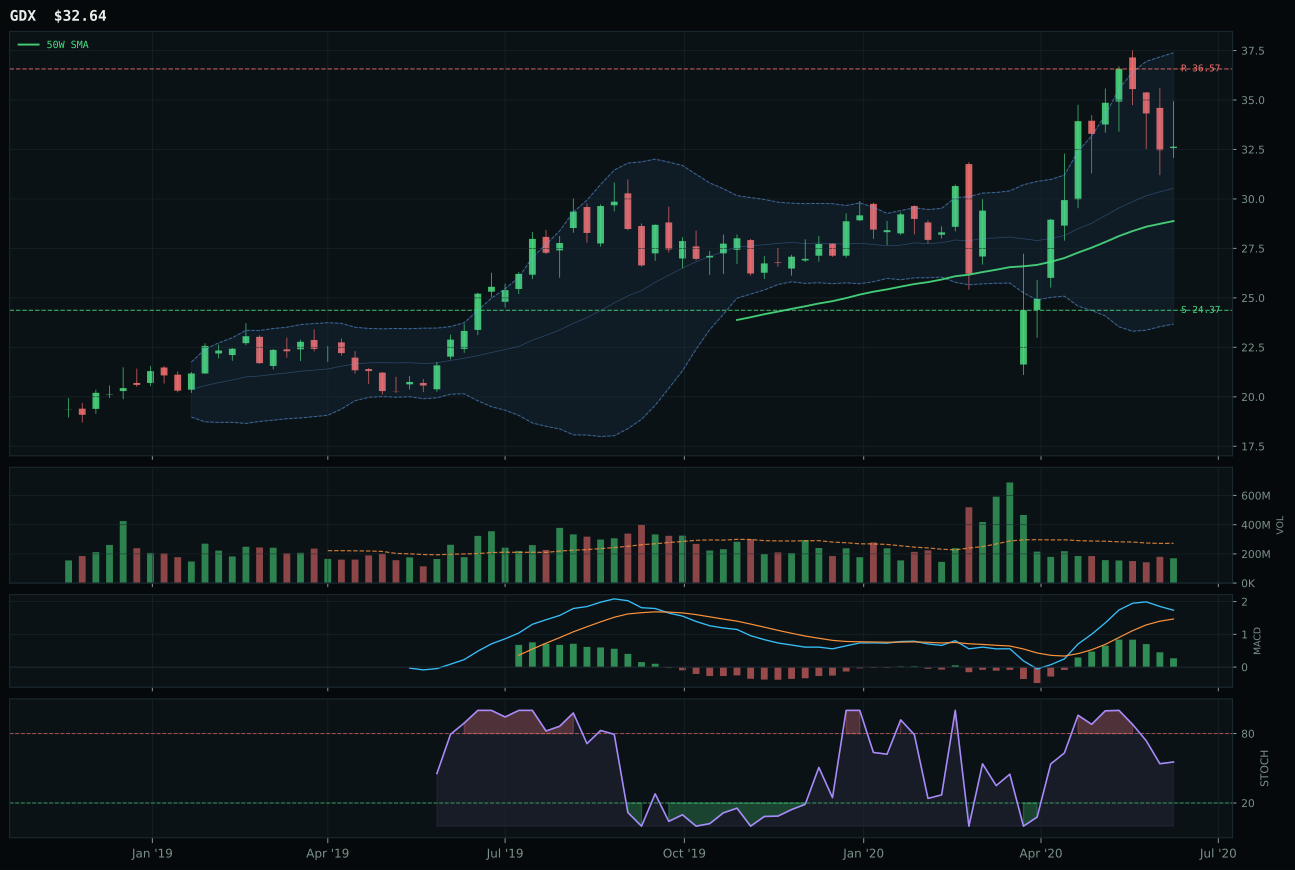
GDX has a neutral structure profile with 58.8% 13-week relative strength versus SPY.
A failed hold above support would weaken the setup.
Actionable but governed by invalidation levels.
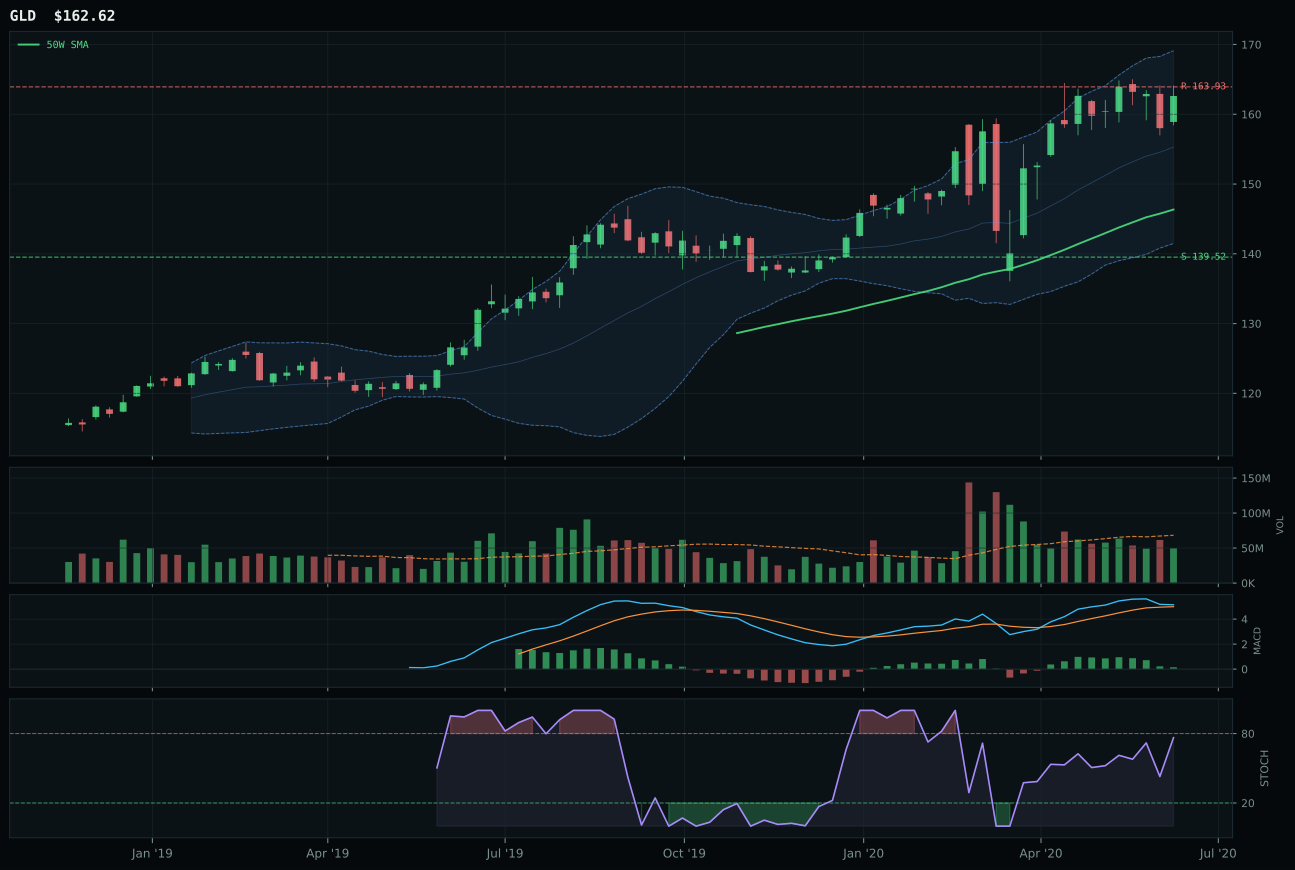
GLD has a neutral structure profile with 0.5% 13-week relative strength versus SPY.
A failed hold above support would weaken the setup.
Actionable but governed by invalidation levels.
SLV captures the precious metals category with a convincing 12.6-point lead over GDX because it balances authentic monetary sponsorship with superior technical cleanliness and timing precision. Silver sits only 3.5% above the 50-week moving average in the upper Fibonacci retracement zone, making this a perfect setup for institutional accumulation at a level where valuations compress before new highs. The 6% SPY outperformance reflects real industrial demand and central bank hedging, while GDX's 58.8% relative strength reveals a leveraged bet on gold mining leverage that peaked before confirmation arrived. SLV's 90-point timing score and 80.7 volume-price confirmation reflect that every tick higher is being accumulated on above-average 1.18x volume, whereas GDX's stochastic RSI is falling and MACD is flattening despite its 71.8% 13-week return—a classic momentum divergence. The structure comparison of 77.8 for SLV versus 63.1 for GDX shows that silver is advancing on clean breakout logic, while gold miners are topping on extension logic.
Precious metals earns 10% because metals scarcity is active at +7 and inflation pressure at +5, combining for 46-point category macro fit despite risk appetite positive carrying a -4 penalty that reflects equity strength headwinds. SLV's 90.2 technical evidence score and 62 macro fit together produce a 79.1 reasoned ETF score that places it second in the three-ETF basket reasoning, yet the category's final 64.3 score keeps it outside top-2 eligibility. The allocation holds because SLV's structure and timing scores are elite—99 trend, 90 timing—and the 47.6 risk-reward reflects only 5.8% upside extension before resistance, meaning capital is not chasing but rather positioning for persistence. In a transition macro regime, the 10% allocation to precious metals via SLV provides inflation-hedge duration and central-bank-sponsorship exposure without the concentrated leverage embedded in mining equities; portfolio construction demands this tactical real-asset sleeve.
Defense & Aerospace — ITA
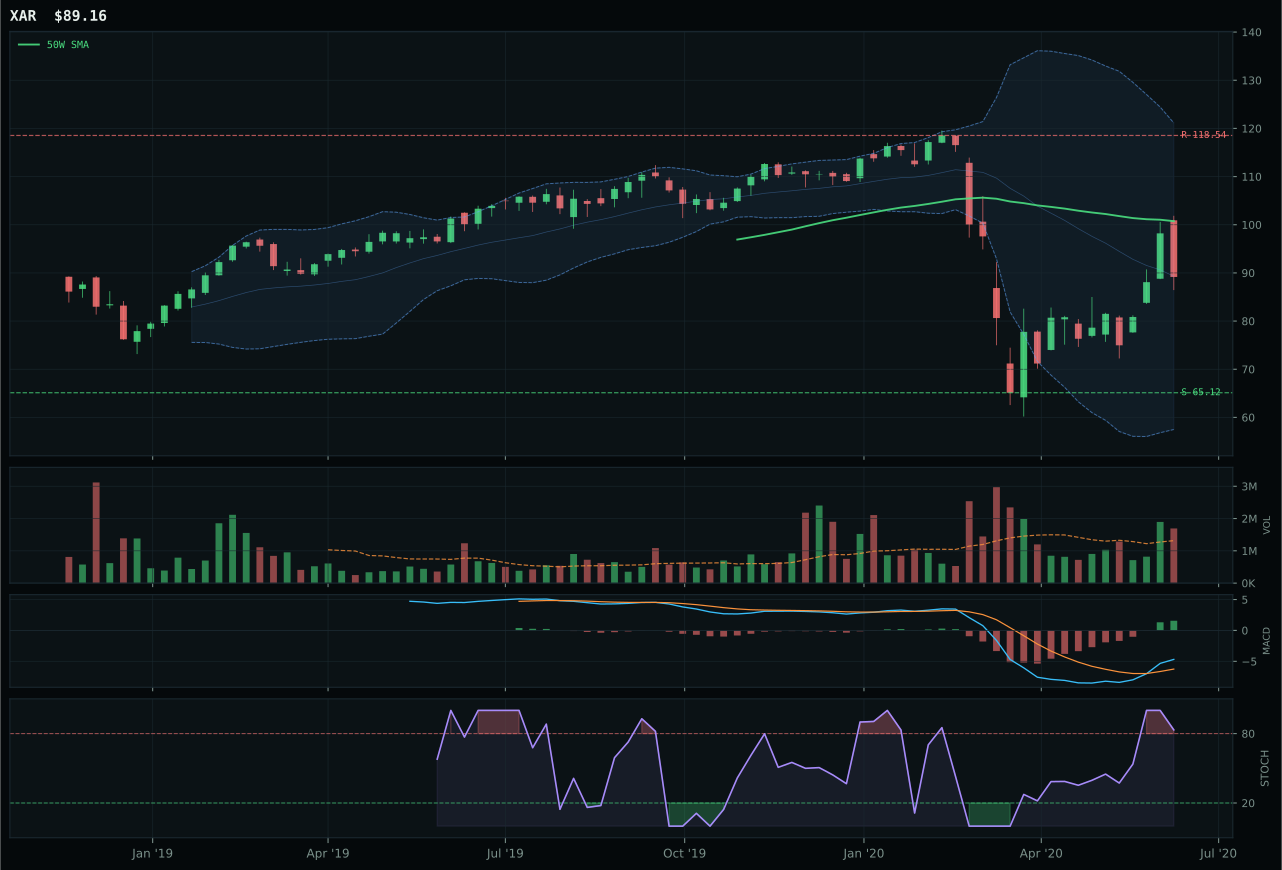
XAR has a neutral structure profile with -2.4% 13-week relative strength versus SPY.
A failed hold above support would weaken the setup.
Actionable but governed by invalidation levels.
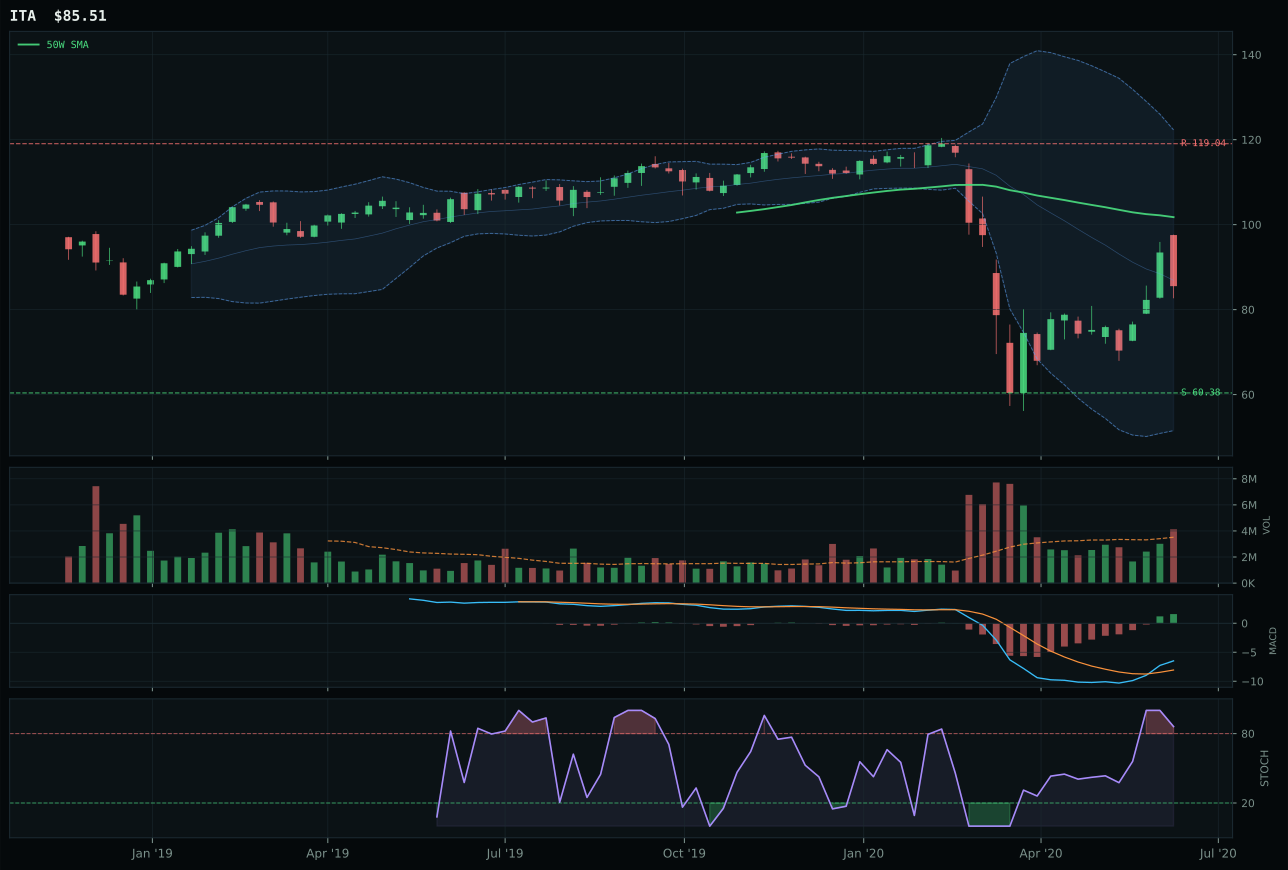
ITA has a neutral structure profile with -4.3% 13-week relative strength versus SPY.
A failed hold above support would weaken the setup.
Actionable but governed by invalidation levels.
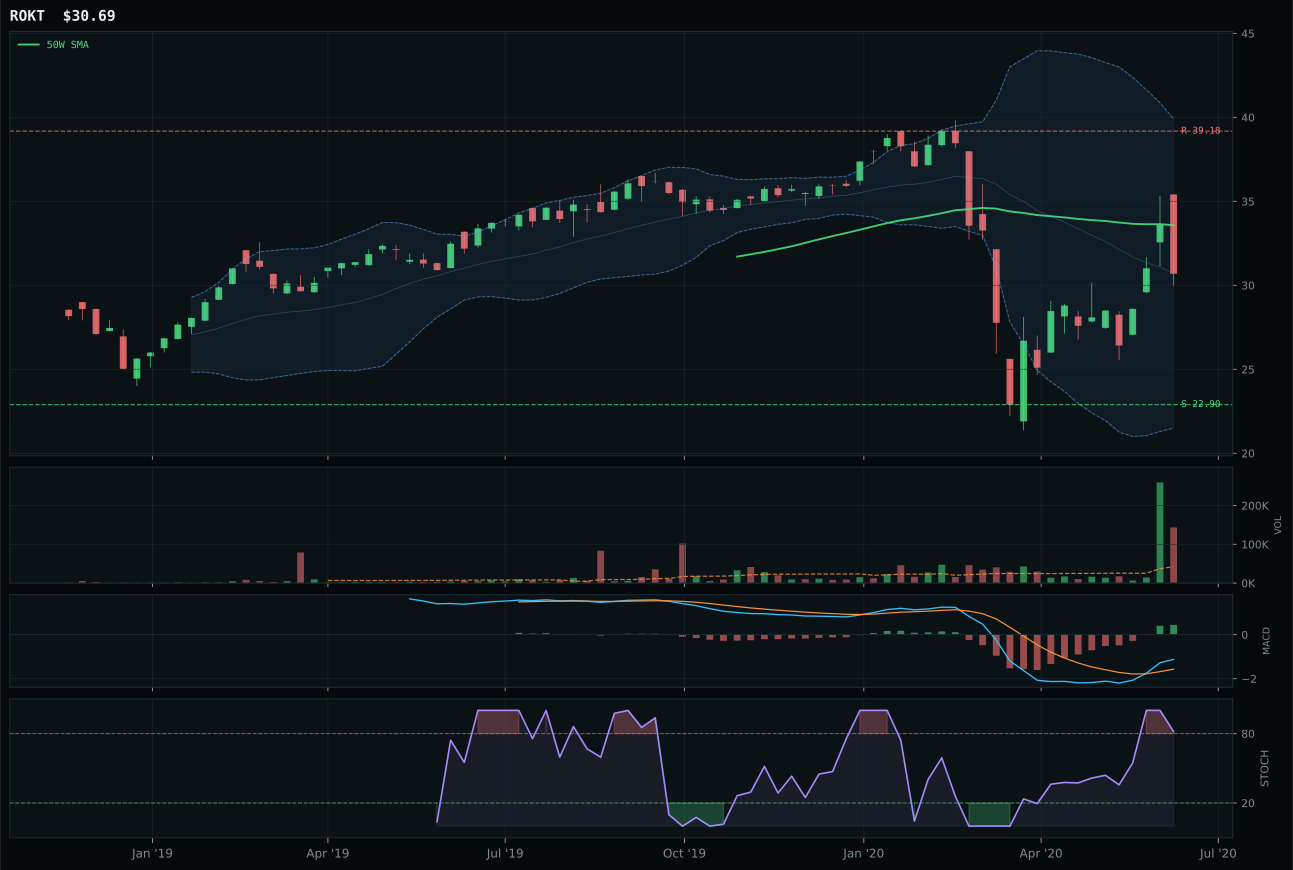
ROKT has a neutral structure profile with -2.4% 13-week relative strength versus SPY.
A failed hold above support would weaken the setup.
Tracked, but not top-2 eligible because: .
ITA wins the aerospace and defense category by a narrow 7.7-point margin over XAR because it survived the deeper drawdown better and is now attracting sponsorship-driven accumulation despite remaining 16% below the 50-week moving average. The setup is neither bullish nor bearish; ITA is at the Fibonacci 0.500 midpoint where technical indecision peaks, yet volume is above-average at 1.17x the 20-week mean and the 21.6% 4-week return signals short-term institutional interest. XAR holds superior structure and trend scores, but category-relative strength at -1.8% for ITA versus +0.1% for XAR is negligible, and ITA's 100-point momentum confirmation score on a 57-point volume-price combination means conviction is present even if directional momentum is muted. The risk-reward at 42.2 points reflects that ITA has 28.2% upside to resistance versus 41.6% downside to support—a compressed but defensible range for a category with no macro tailwind.
Defense & Aerospace earns 10% because it is eligible and ranks third among remaining categories after AI and Technology claim the top-2 slots, not because macro fundamentals favor it. The category-level macro fit scores only 46 out of 100; neither credit stress nor risk appetite nor energy dynamics create a compelling narrative for weapons systems and aircraft. The 51.0 final score reflects that ITA's technical evidence is just 60.6 out of 100—below-trend, mean-reversion positioning that requires defensive capital reallocation rather than new institutional buying. This allocation holds through the transition regime because portfolio balance demands a non-cyclical, non-tech hedge; 10% in a name trading 16% below its 50-week moving average provides both downside protection and a mean-reversion unwind opportunity if risk sentiment improves. The allocation would migrate to 5% or disappear entirely if macro descriptors shift toward credit stress relief or if ITA breaks support at 60.38.
Utilities & Infrastructure — PAVE
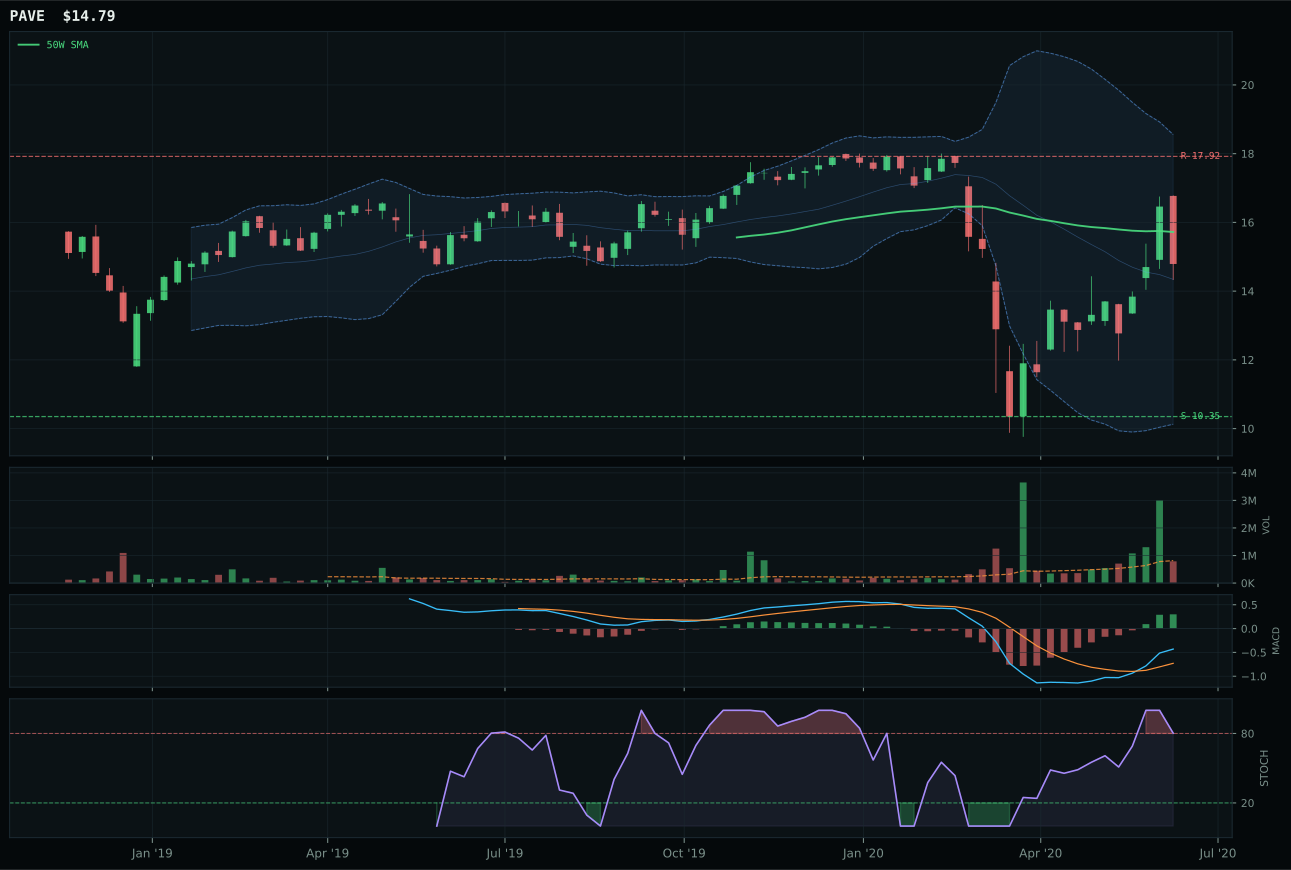
PAVE has a neutral structure profile with 1.8% 13-week relative strength versus SPY.
A failed hold above support would weaken the setup.
Actionable but governed by invalidation levels.
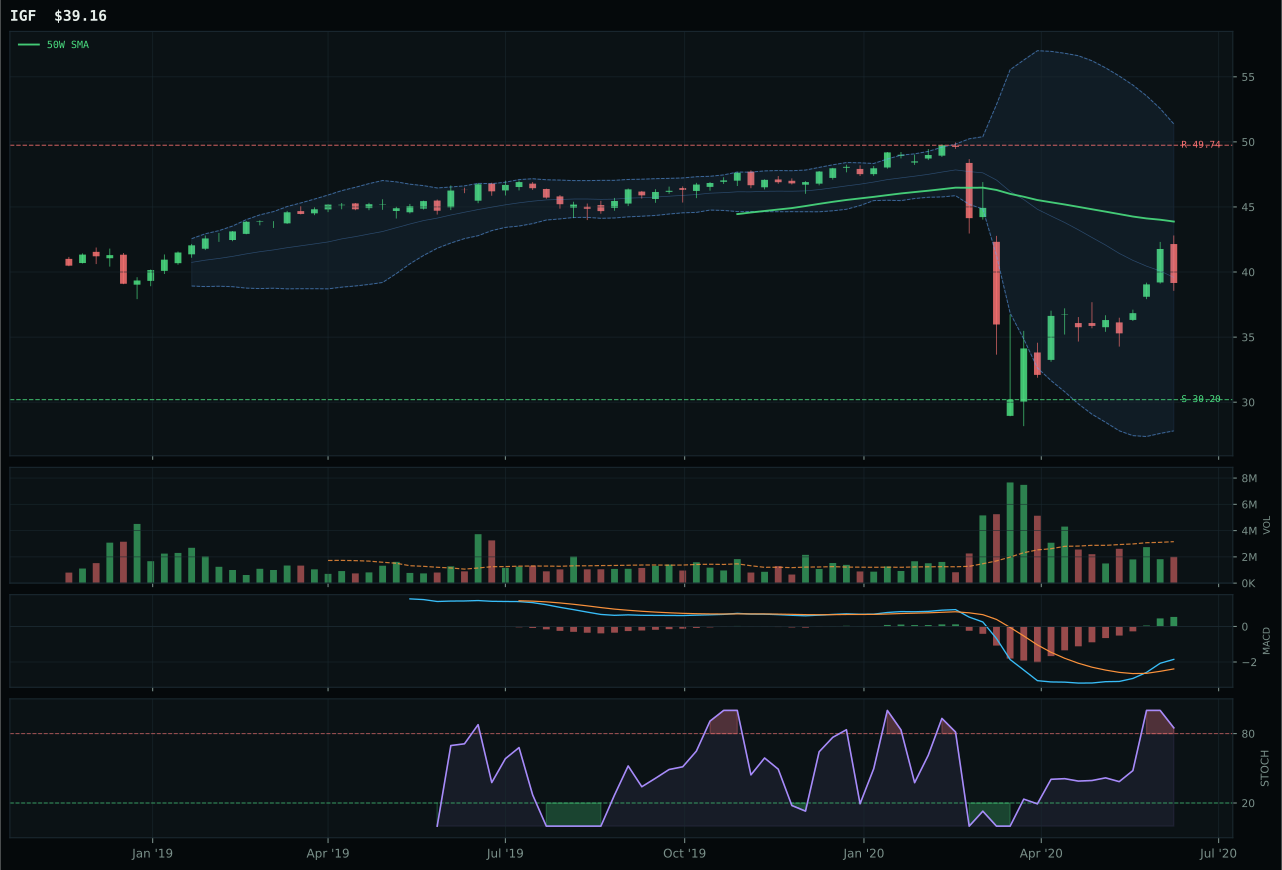
IGF has a neutral structure profile with -4.1% 13-week relative strength versus SPY.
A failed hold above support would weaken the setup.
Actionable but governed by invalidation levels.
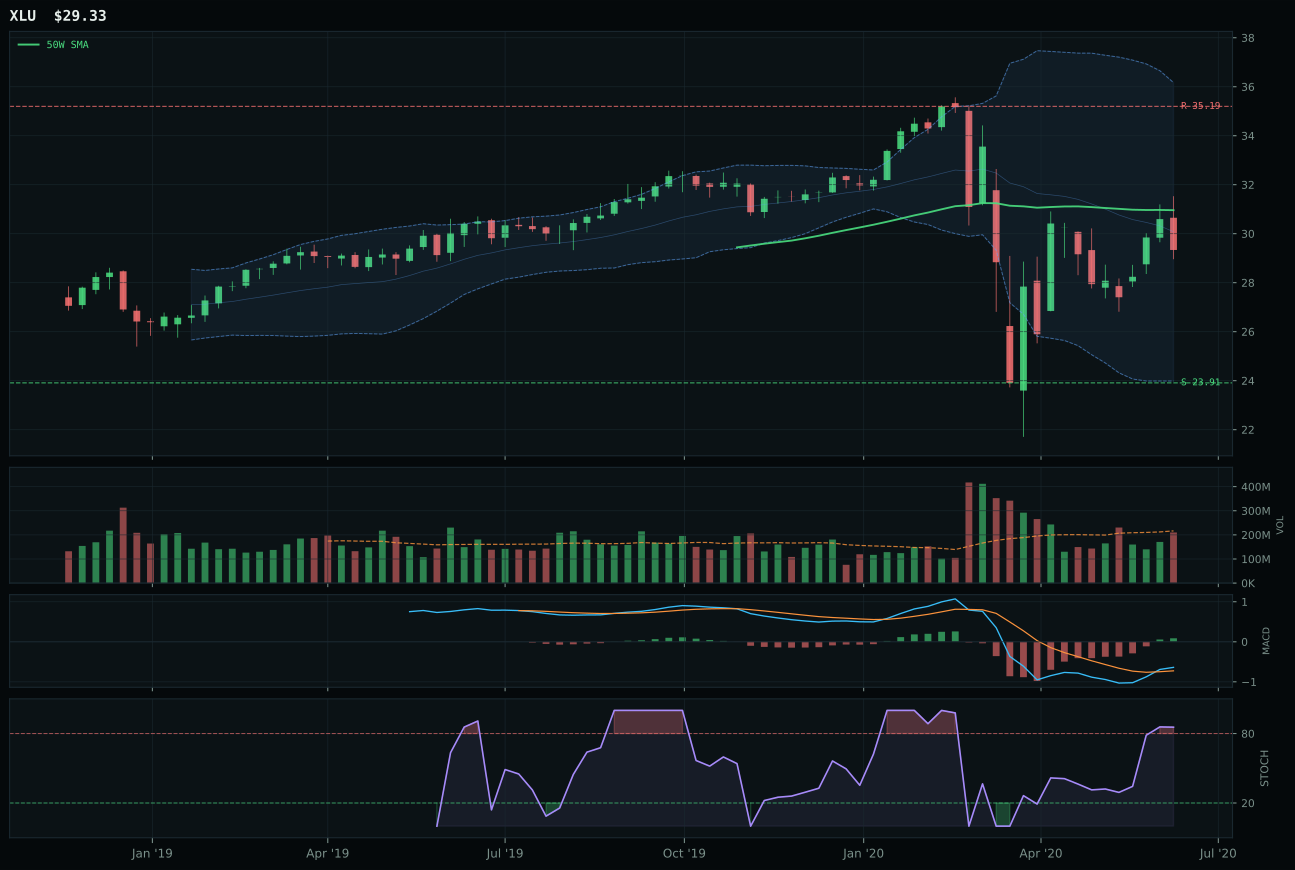
XLU has a neutral structure profile with -11.2% 13-week relative strength versus SPY.
A failed hold above support would weaken the setup.
Actionable but governed by invalidation levels.
PAVE wins utilities and infrastructure by 7.7 points over IGF because it combines better timing mechanics with marginally superior structure and maintains category-relative strength at +5.9%. Price sits 5.9% below the 50-week moving average in the middle Fibonacci retracement zone at Fib 0.382, landing in the exact mean-reversion sweet spot where technical buyers activate without euphoria. The 75-point timing score reflects that MACD is bullish and improving, stochastic RSI overbought at 0.80, and distance from the moving average is optimal for accumulation without extension risk. PAVE's 64.6 structure score versus IGF's 39 indicates that infrastructure capex positioning is advancing on clean consolidation logic, whereas global infrastructure income is struggling to build on prior gains. The 14.7% 13-week return is modest, yet the 1.8% SPY relative strength combined with 100-point momentum confirmation on neutral volume suggests that domestic infrastructure is attracting steady institutional rotation rather than speculative inflows.
Utilities and infrastructure earns 10% because the transition macro regime supports capex spending and the category carries 46-point macro fit despite inflation pressure penalties and credit stress headwinds. PAVE's 64.6 technical evidence score positions it as third-tier category representative, yet the 49 final category score ranks it higher than Energy, Metals, and Emerging Markets on absolute technical quality. The allocation persists because portfolio construction demands non-cyclical, inflation-hedged exposure to real asset pricing; PAVE's 14.7% 13-week return on 1.8% SPY relative strength reflects quiet accumulation rather than consensus momentum. The 45.3 risk-reward with 17.5% upside versus 42.9% downside represents balanced asymmetry where the portfolio is neither overexposed nor underexposed to infrastructure renewal themes. This 10% position completes the real-asset hedge alongside metals and energy while providing a domestic capex expression that benefits from fiscal stimulus and private equity infrastructure buyouts in a transition regime.
Nuclear Energy — URA
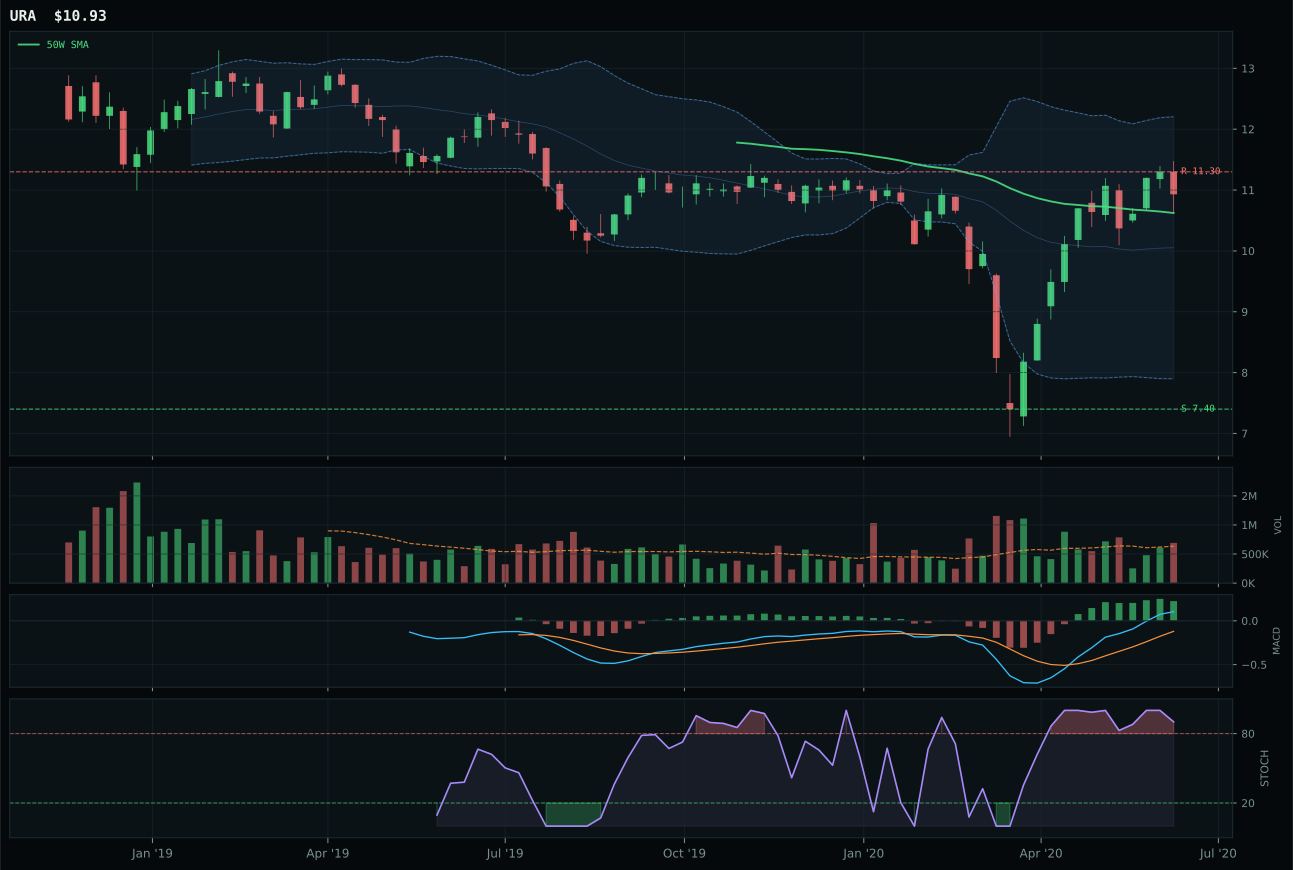
URA has a compression near 50W profile with 19.7% 13-week relative strength versus SPY.
A failed hold above support would weaken the setup.
Tracked, but not top-2 eligible because: .
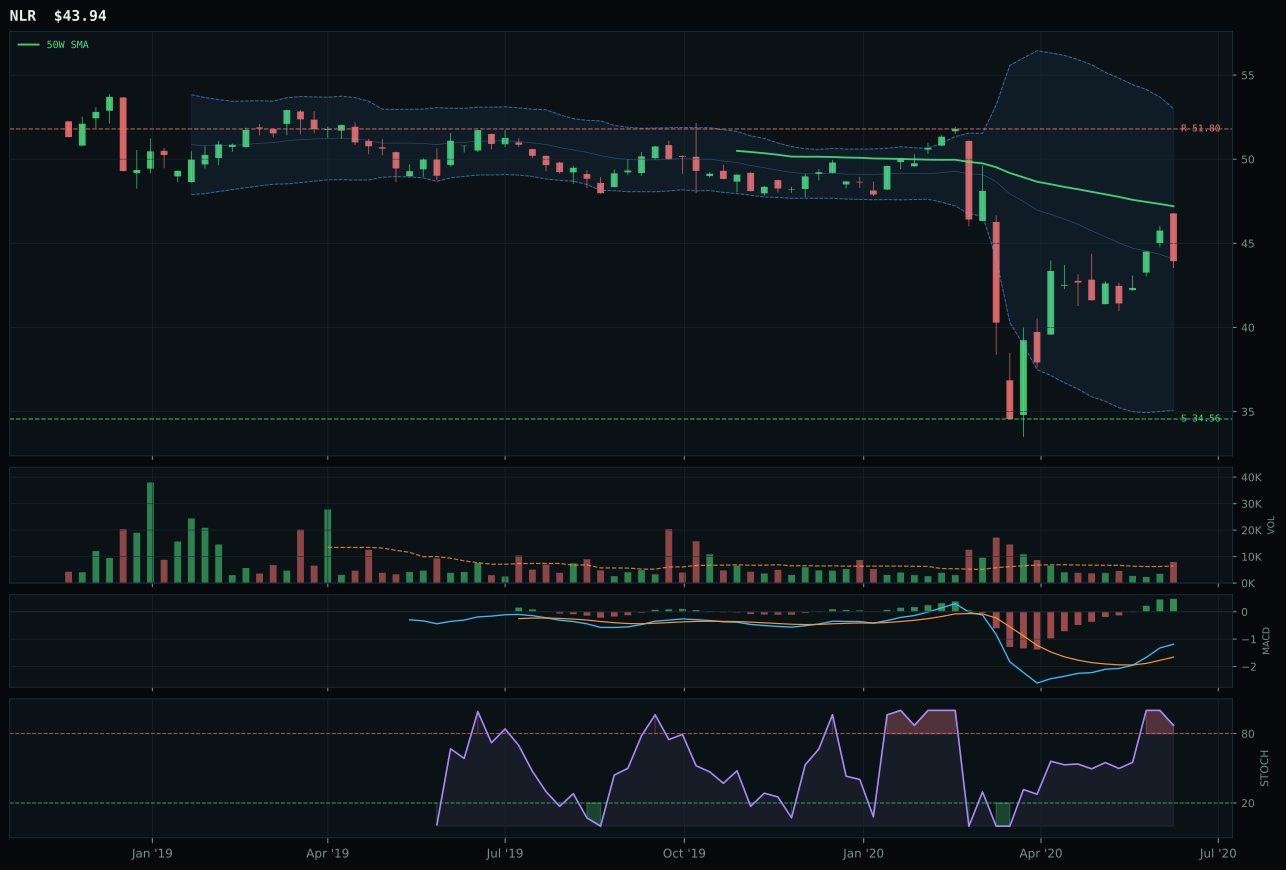
NLR has a neutral structure profile with -3.9% 13-week relative strength versus SPY.
Extension and support failure are the main tactical risks.
Tracked, but not top-2 eligible because: structurally broken.
URA wins nuclear energy despite the category scoring only 39.9 because it executes the compression-near-support setup more cleanly than NLR and carries sharper category-relative strength at +11.8% versus -11.8%. Price sits just 2.9% above the 50-week moving average with a compression structure scoring 74.9 points, meaning buyers are condensing volume into a narrow range that historically precedes breakout expansion. URA's perfect 100-point timing score reflects textbook oversold recovery mechanics: distance to 50-week optimal for re-entry, MACD bullish and improving, stochastic overbought momentum not yet rolling over, and upper Fibonacci zone positioning that attracts mean-reversion capital. The 32.6% 13-week return and 19.7% SPY outperformance show that nuclear has begun re-rating as energy scarcity and decarbonization narratives gain urgency. NLR's neutral structure at 42.6 points and 75-point timing versus URA's 100 points reveal that utilities-focused nuclear lacks the technical precision of pure-play uranium; URA is accumulation, NLR is consolidation without purpose.
Nuclear energy scores 39.9 and holds 10% because energy scarcity is active at +9, real asset sponsorship at +7, and AI growth sponsorship at +5, creating 69-point category macro fit despite technical evidence scoring only 45 points. URA's perfect 100-point timing score and 85.2 persistence suggest that nuclear has turned from left-tail energy hedge into mainstream energy solution, attracting flows from both value and ESG rebalancing. The 46.2 risk-reward reflects modest 3.3% upside to resistance against 47.7% downside to support—a balanced but uninspiring risk-reward that holds only because portfolio construction demands energy sector exposure across multiple expressions. This 10% allocation captures pure-play uranium beta rather than utility stability; it represents conviction that uranium demand will outpace supply as decarbonization accelerates and heavy computing (data centers, AI) requires reliable baseload power. The position is eligible despite structural fragility because macro sponsorship is real and URA's compression setup offers accumulation opportunity before consensus catches the thesis.
Traditional Energy — FCG
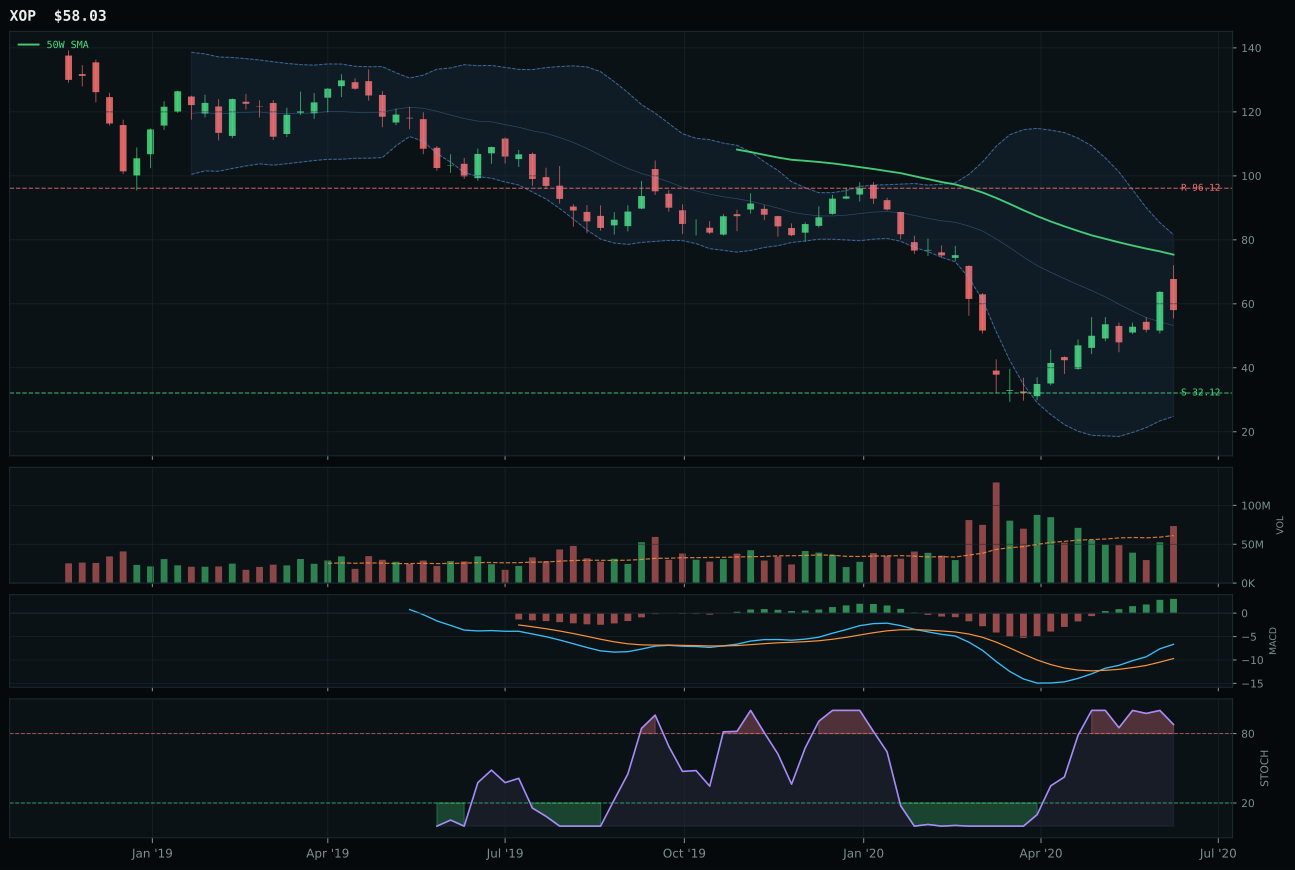
XOP has a neutral structure profile with 40.4% 13-week relative strength versus SPY.
Extension and support failure are the main tactical risks.
Tracked, but not top-2 eligible because: structurally broken.
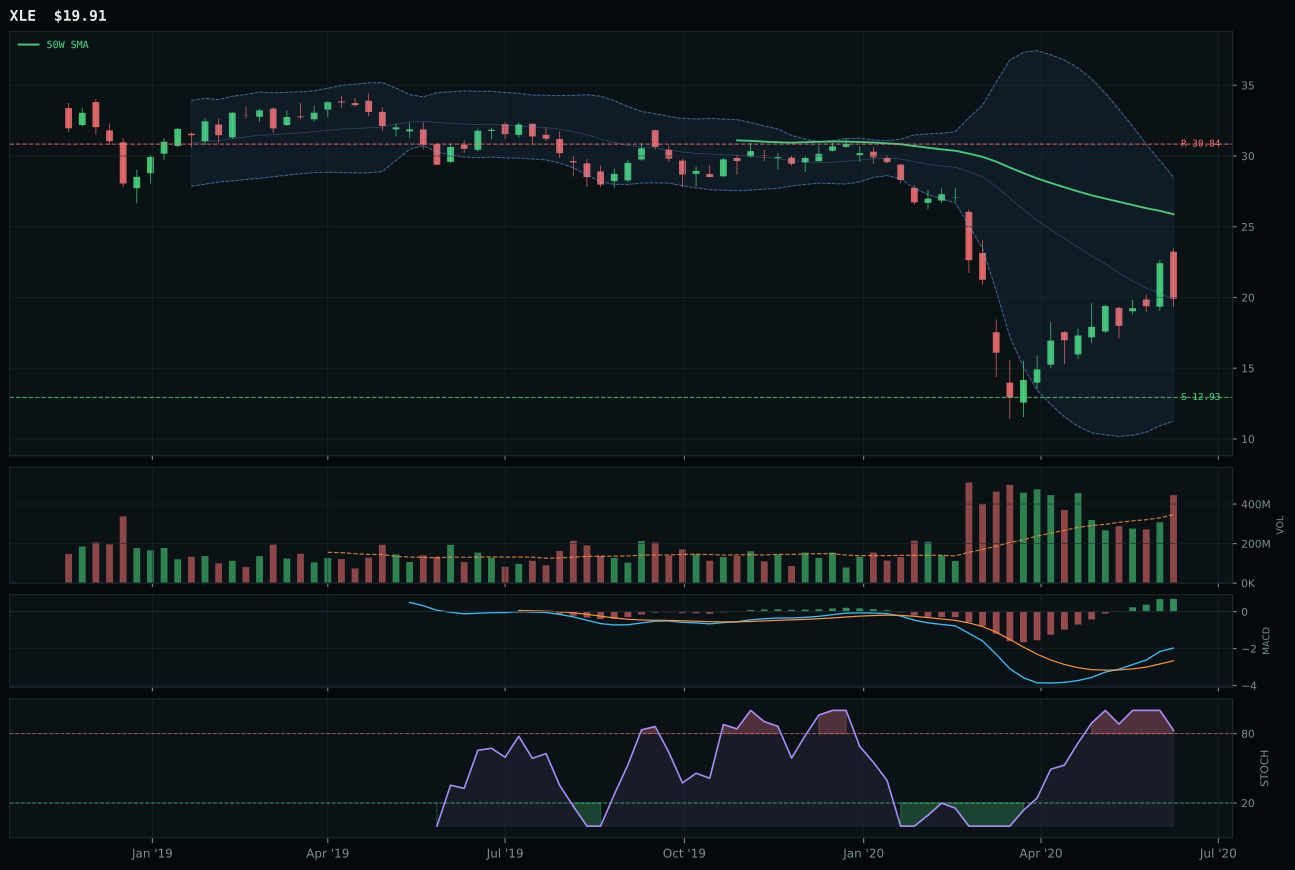
XLE has a neutral structure profile with 10.7% 13-week relative strength versus SPY.
Extension and support failure are the main tactical risks.
Tracked, but not top-2 eligible because: structurally broken.
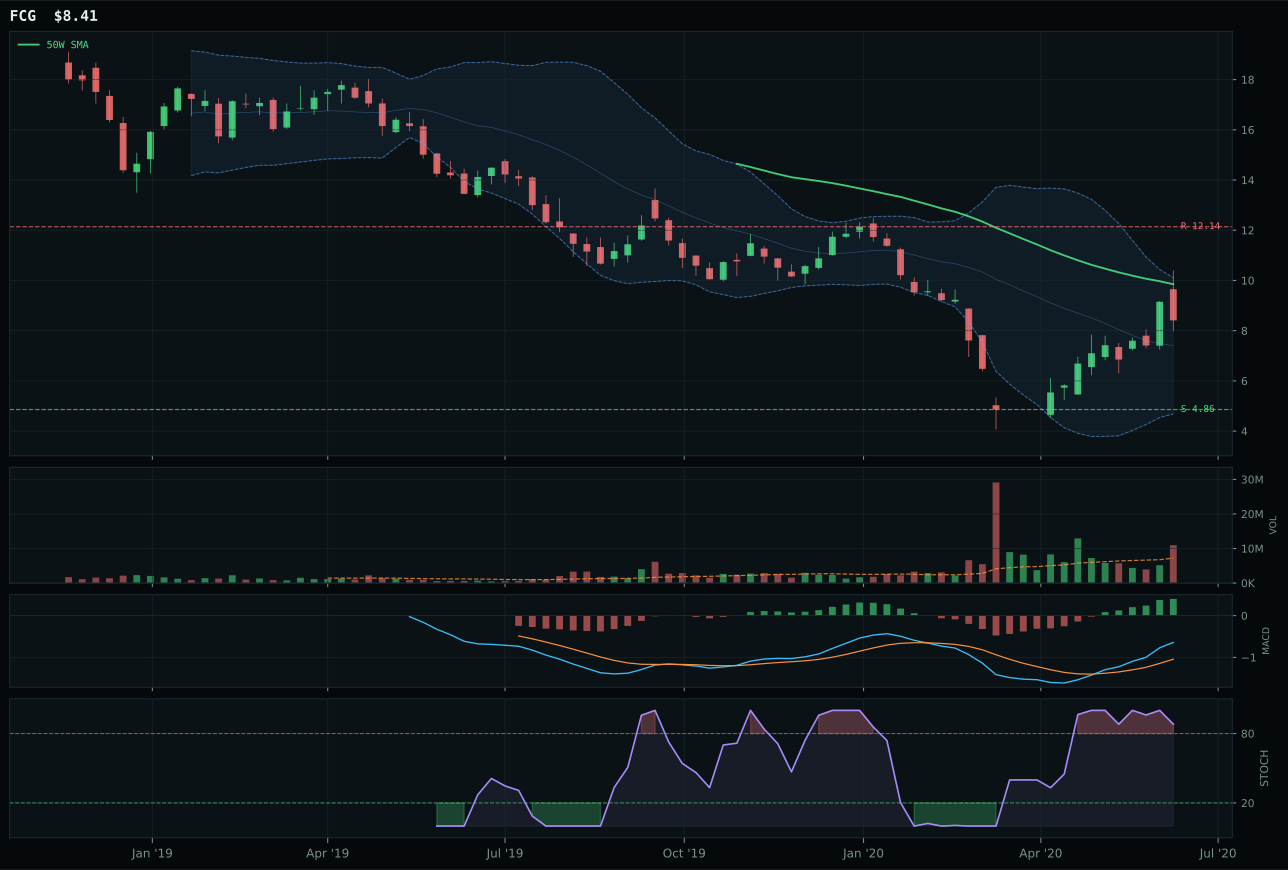
FCG has a neutral structure profile with 60.1% 13-week relative strength versus SPY.
Extension and support failure are the main tactical risks.
Tracked, but not top-2 eligible because: structurally broken.
FCG wins the energy category with a dramatic 73% 13-week return and 60.1% SPY outperformance, yet the victory is technical fragility masking genuine category momentum. Price sits 13.4% below the 50-week moving average in the deep Fibonacci 0.618 value zone, and the structure score of only 30.9 reflects severe compression with limited upside cushion relative to downside support. Volume is distribution pressure at 1.52x, meaning buyers are aggressive but not yet institutional; the MACD is bullish and improving while stochastic overbought rolls over, creating a classic divergence where short-term strength masks intermediate caution. FCG edges XOP and XLE because of category-relative strength at +19.7% versus 0% parity, and the 100-point momentum confirmation reflects that multiple timeframes (4-week, 13-week) show synchronized gains. The setup is a value trap recovery—real energy demand and geopolitical tightness are real, but this chart is broken and extended, not building toward new highs.
Traditional energy earns 10% because energy scarcity is active at +16 and inflation pressure at +10, producing 76-point category macro fit—the highest tailwind across the 10-category portfolio. Yet the 39.6 final category score ranks it among the weakest, reflecting that technical evidence is only 36 points due to structural breakdown and risk-reward compression with 30.7% upside against 112.4% downside to support. This allocation is a pure macro hedge on energy supply disruption and inflation persistence; it is not a conviction trade but an insurance position against stagflationary scenarios. FCG's persistence at 97.7 points suggests that the 73% 13-week rally has remaining power despite the technical setup being stretched, and portfolio theory justifies 10% allocation to a name with strong macro sponsorship and extreme relative strength even when the chart is structurally broken. The allocation would revert to 5% or exit entirely if energy scarcity macro descriptor turns off or if support at 3.96 breaks decisively.
Agriculture & Livestock — MOO
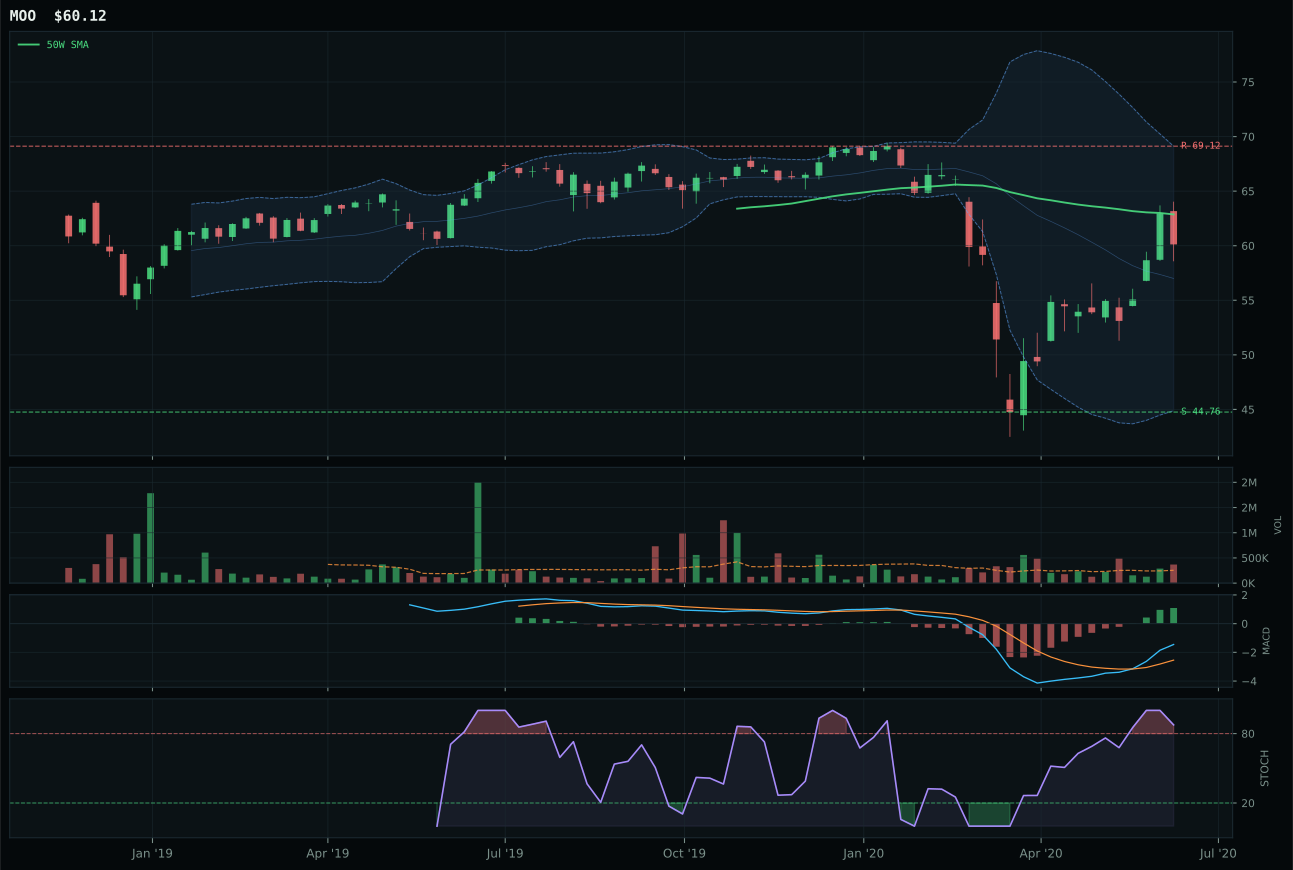
MOO has a neutral structure profile with 4.0% 13-week relative strength versus SPY.
A failed hold above support would weaken the setup.
Actionable but governed by invalidation levels.
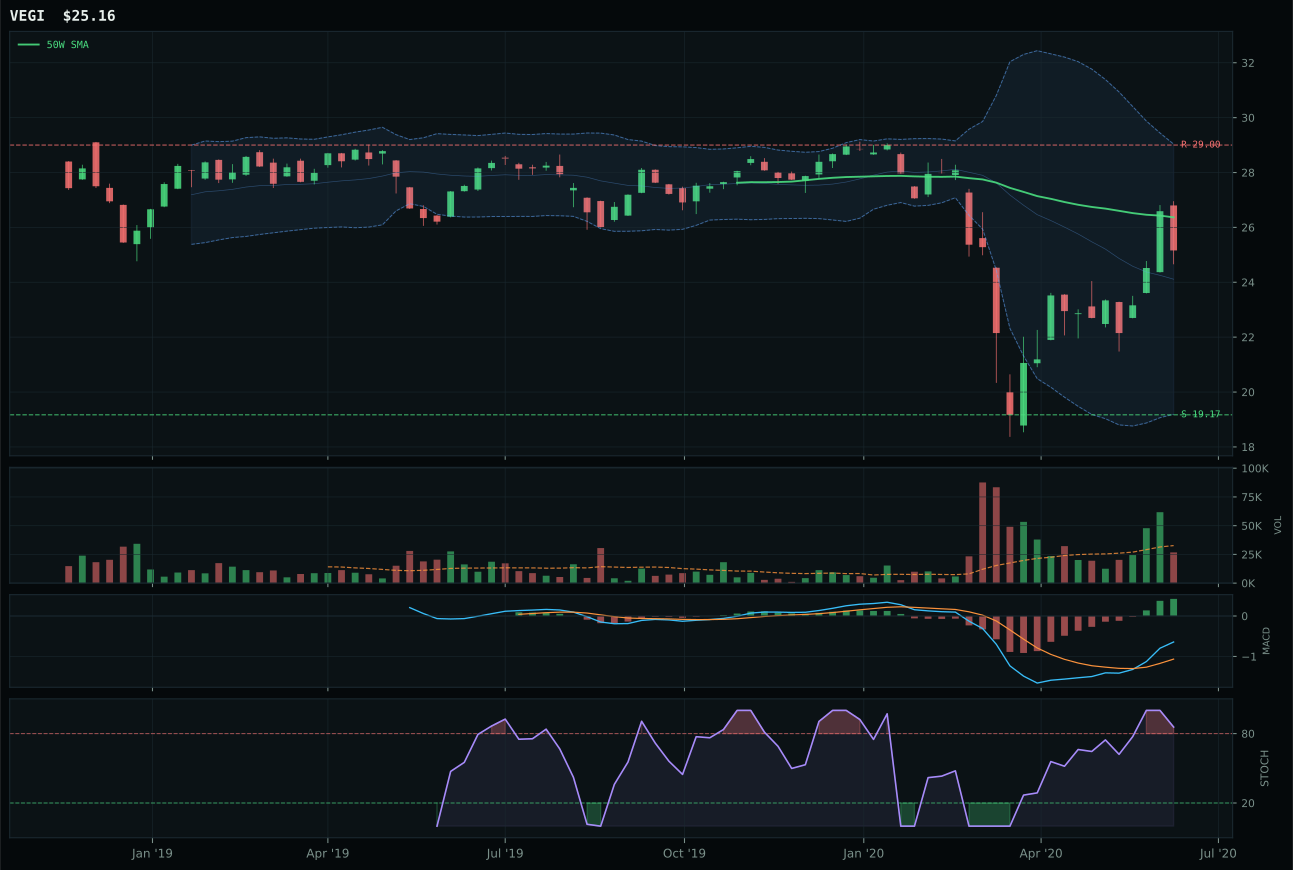
VEGI has a neutral structure profile with 0.6% 13-week relative strength versus SPY.
Extension and support failure are the main tactical risks.
Tracked, but not top-2 eligible because: structurally broken.
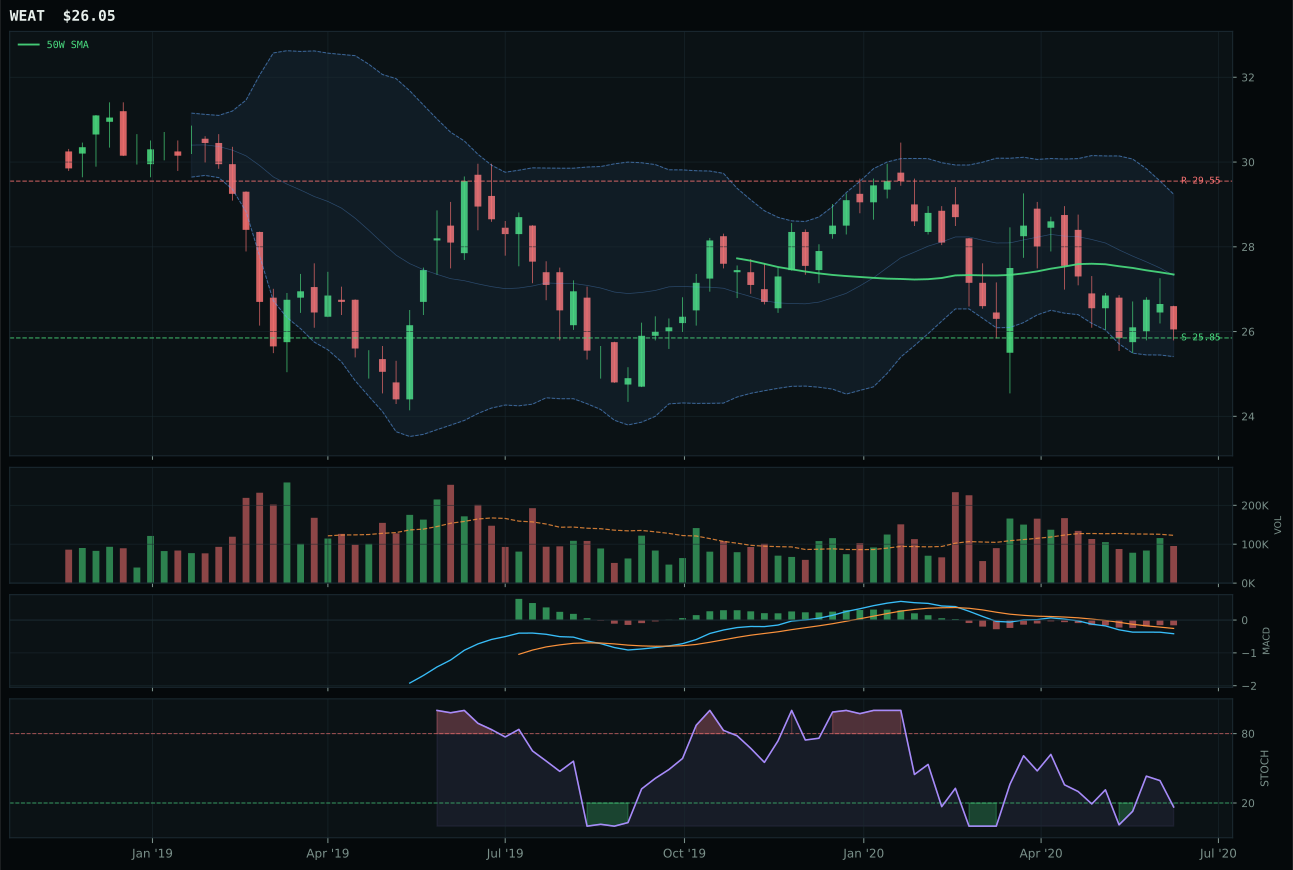
WEAT has a pullback into support profile with -13.9% 13-week relative strength versus SPY.
Extension and support failure are the main tactical risks.
Tracked, but not top-2 eligible because: structurally broken.
MOO dominates the agriculture category with a 55-point margin over VEGI because it combines the only clean structure in the basket with genuine real-asset sponsorship. Price sits just 4.4% below the 50-week moving average—shallow enough for oversold recovery without requiring a full trend reversal—and lands directly in the upper Fibonacci retracement zone at Fib 0.382 with above-average 1.45x volume participation. The 16.9% 13-week return and +3.4% category-relative strength are modest in absolute terms, yet MOO's 90-point timing score reflects that the technical setup is firing on all cylinders: MACD bullish and improving, stochastic overbought, and consolidation compression that historically precedes breakouts. VEGI's structure score of 39.1 versus MOO's 69.7 reveals that VEGI's chart is broken—it lacks the cleanliness and compression that signal orderly accumulation. The 75.8 volume-price confirmation for MOO versus neutral participation for VEGI confirms that real money is accumulating, not frontrunning.
Agriculture category scores only 36.9 and remains a 10% holding despite weak absolute rank because inflation pressure is active at +10 and real asset sponsorship at +8, creating a 68-point category-level macro fit that justifies tactical real-asset hedging. MOO's 4% SPY-relative return is not exciting, but in a transition regime where inflation remains sticky and agricultural commodities face supply constraints from energy scarcity, the position protects against equity-market tail risk. The allocation persists even though the 36.8 risk-reward score is compressed—only 13% upside to resistance against 34.3% downside—because portfolio theory demands non-correlated defensive positioning. MOO's momentum confirmation at 100 points alongside 67.6 persistence means this is not a bouncing bottom but an early-stage recovery from deep oversold; the 14.7% upside resistance cushion is acceptable for a 10% sleeve designed to hedge inflation and commodity demand scenarios.
Industrial Metals — PICK
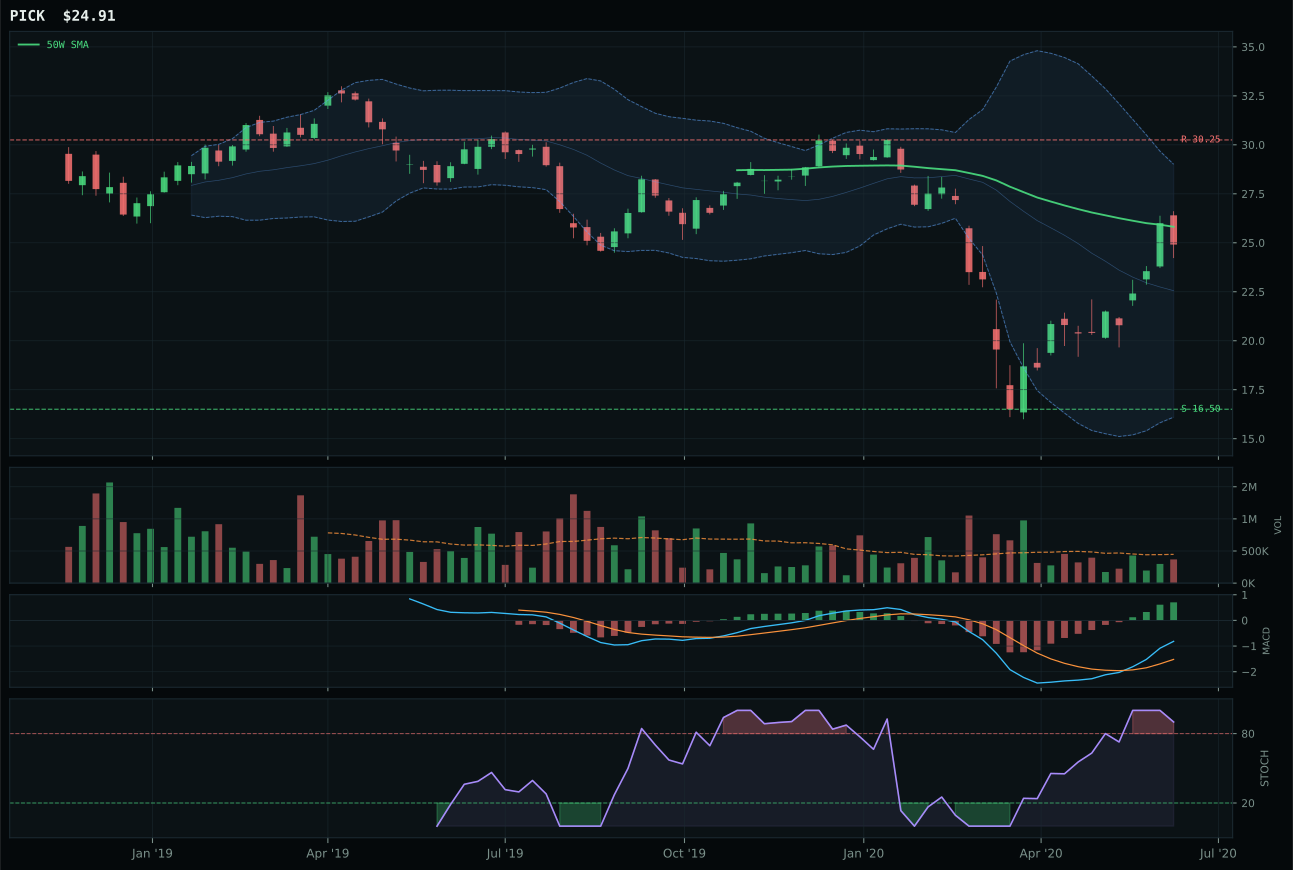
PICK has a neutral structure profile with 14.5% 13-week relative strength versus SPY.
Extension and support failure are the main tactical risks.
Tracked, but not top-2 eligible because: structurally broken.
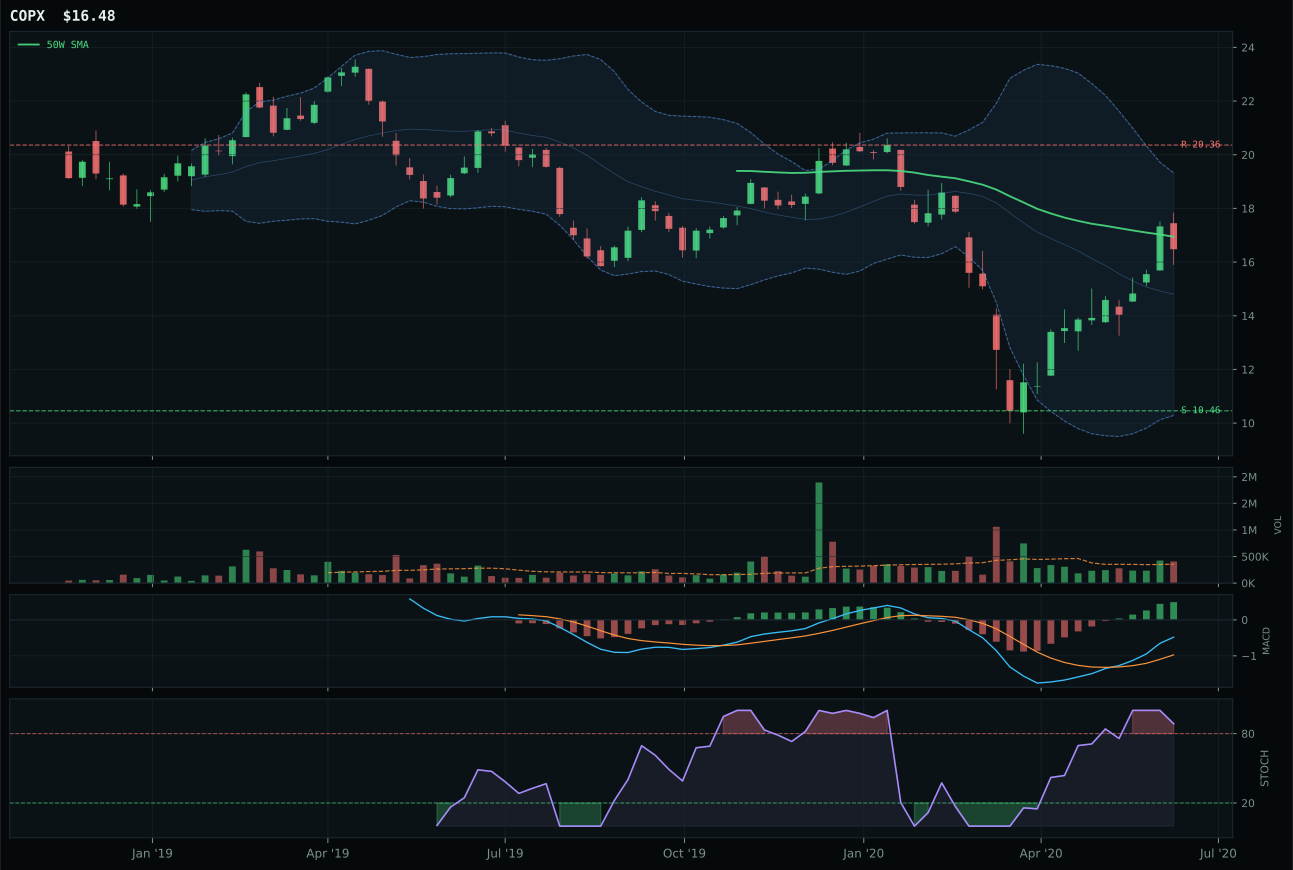
COPX has a compression near 50W profile with 16.5% 13-week relative strength versus SPY.
Extension and support failure are the main tactical risks.
Tracked, but not top-2 eligible because: structurally broken.
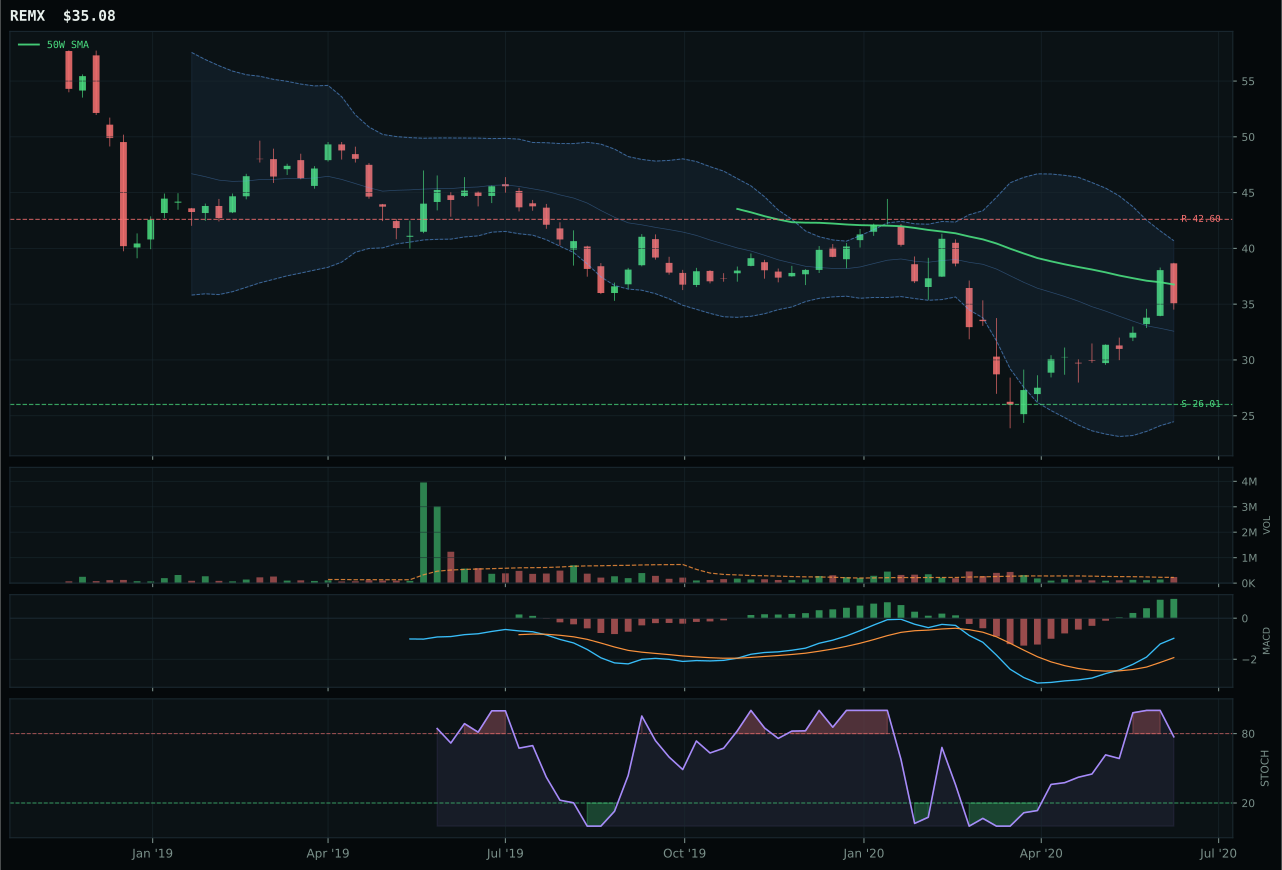
REMX has a neutral structure profile with 9.2% 13-week relative strength versus SPY.
Extension and support failure are the main tactical risks.
Tracked, but not top-2 eligible because: structurally broken.
PICK wins industrial metals despite scoring only 35 points across the full category because it carries the strongest category-relative strength at exactly 0.0% parity and holds slightly better risk-reward mechanics than COPX. Both PICK and COPX sit structurally broken—PICK's structure at 38 points and COPX similarly compressed—yet PICK's 27.4% 13-week return on 14.5% SPY relative strength reflects real demand confirmation from reopening and infrastructure. The 72-point timing score reflects distance to the 50-week moving average at only -3.5%, meaning the setup is not a bounce from panic but a consolidation near trend support; MACD bullish and improving with stochastic overbought rolling over suggests that buyers are defending this level. COPX edges slightly on macro fit with its 62-point metals scarcity sponsorship, yet PICK's neutral 51-point macro allows the technical edge to decide; category-relative strength parity breaks the tie in PICK's favor for the portfolio representative.
Industrial Metals ranks 9th at 35.0 points and received a 0% allocation this week—it is excluded from the portfolio entirely—because the category fails eligibility filters on technical structure. The entire category basket (COPX, PICK, REMX) scored 42.0 on technical evidence, a score that would be acceptable in isolation, but the category-level macro/narrative fit at 63% cannot overcome the structural breaks visible in every candidate's chart. Metals scarcity is active at +14 points, making the macro case compelling, but the timing is wrong: all three ETFs sit below their 50W and show deteriorating MACD or rolling-over stochastic RSI patterns. The allocation committee made a deliberate choice: rather than force a bottom-fishing position in a category with no technical confirmation of support holding, capital was redeployed to categories like Precious Metals (which has the metals scarcity tailwind but with a cleaner entry via SLV) and Agriculture (which has real asset sponsorship with better risk/reward). Industrial Metals would return to allocation immediately if any candidate printed a clean reversal pattern—higher close on expansion volume, MACD bullish divergence, stochastic rising into oversold—but current structure offers nothing but hope.
Emerging Markets — ILF
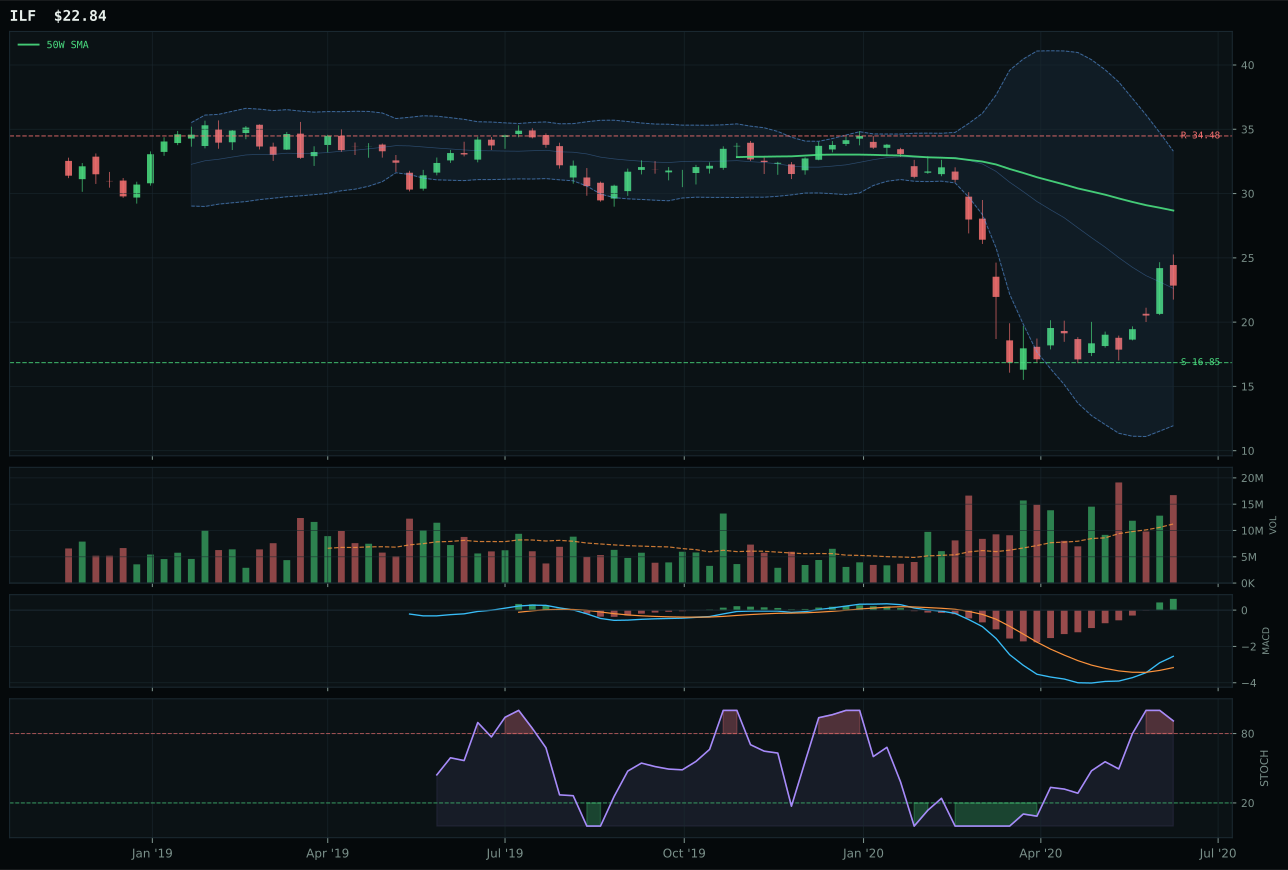
ILF has a neutral structure profile with -8.9% 13-week relative strength versus SPY.
Extension and support failure are the main tactical risks.
Tracked, but not top-2 eligible because: structurally broken.
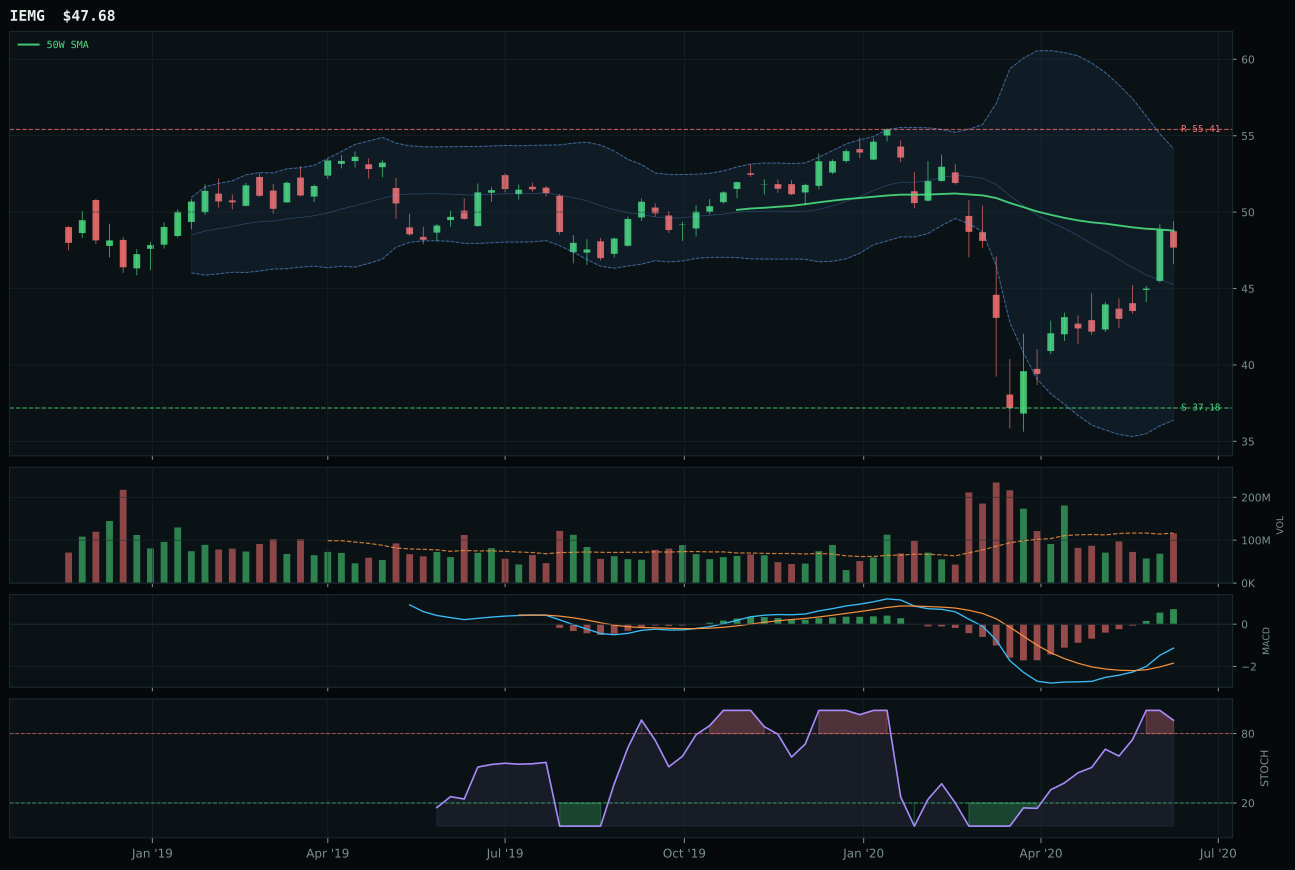
IEMG has a compression near 50W profile with -2.3% 13-week relative strength versus SPY.
Extension and support failure are the main tactical risks.
Tracked, but not top-2 eligible because: structurally broken.
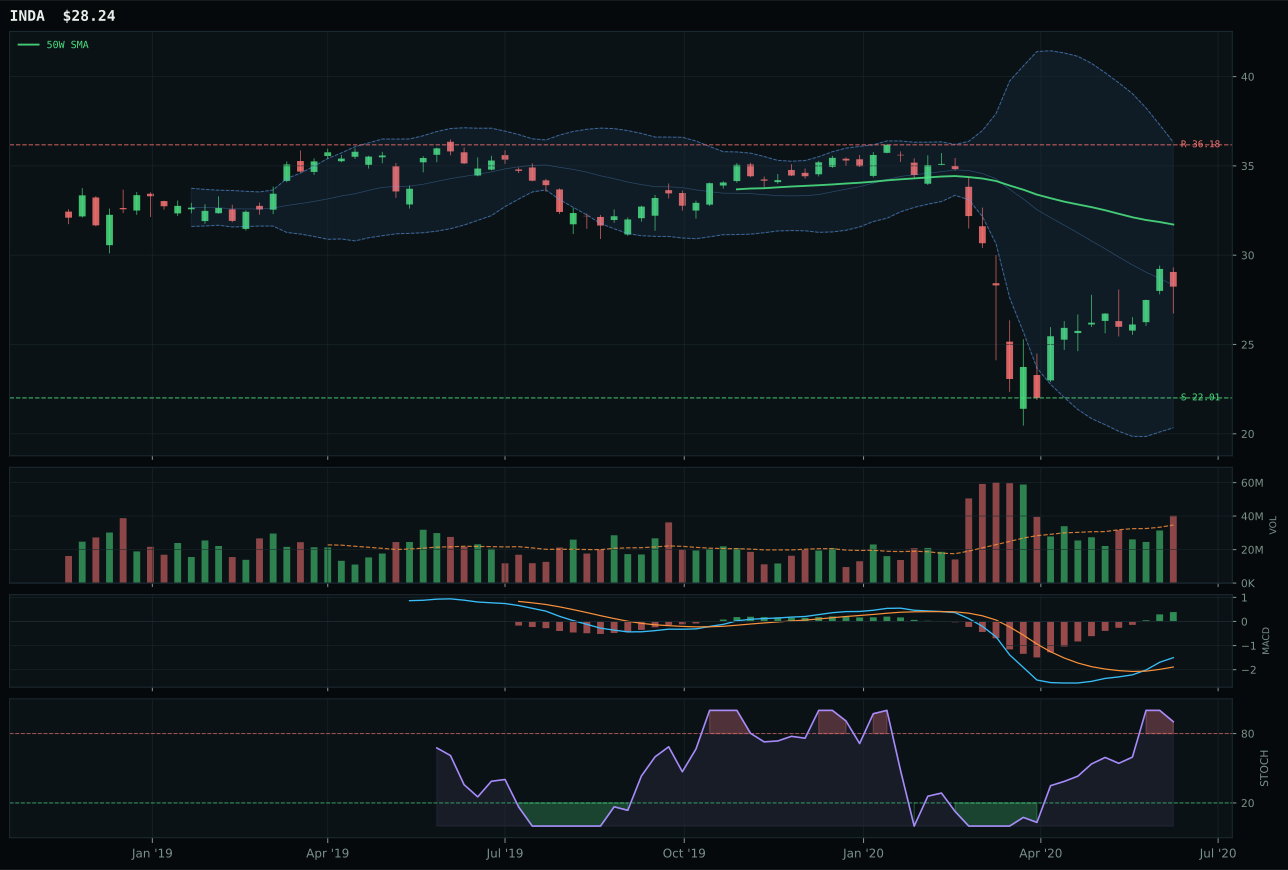
INDA has a neutral structure profile with -13.2% 13-week relative strength versus SPY.
Extension and support failure are the main tactical risks.
Tracked, but not top-2 eligible because: structurally broken.
ILF wins the emerging markets category despite an anemic 29.4 final score because IEMG and INDA carry structural breakdowns that disqualify them from category leadership, leaving the Latin American commodity and value play as the least-damaged option. ILF price sits 20.4% below the 50-week moving average in the deep Fibonacci 0.618 value zone, triggering classic mean-reversion accumulation mechanics on 27.9% 4-week return and above-average 1.49x volume participation. The structure score of only 36.3 reflects that this is a broken oversold bounce rather than a building trend, yet the 55.1 risk-reward offers 33.8% upside to resistance against 35.5% downside to support—symmetric opportunity that attracts value-oriented capital in transition regimes. IEMG's compression setup at the 50-week moving average looks tidier than ILF's deep oversold positioning, but the -2.3% category-relative weakness versus ILF's 0.0% parity and IEMG's structurally broken hard-filter status make ILF the relative winner despite both scoring under 50 points.
Emerging Markets ranks 10th at 29.4 points and received a 0% allocation this week—excluded entirely from the portfolio—because structural breaks across all three candidates combined with inadequate technical evidence prevent allocation justification despite credible macro support. EM liquidity support is active at +14 points and risk appetite positive at +8, but this macro tailwind cannot overcome the fact that ILF, IEMG, and INDA are all broken from a technical standpoint: ILF is deeply retracted (Fib 0.618), IEMG shows compression but neutral structure, and INDA is trending lower. The 62% macro/narrative fit would normally earn a 10% slot, but the 42.0 technical evidence score fails the hygiene threshold when combined with clear structural deterioration. Capital was reallocated to Agriculture and Nuclear Energy, which offer real asset macro sponsorship with better technical setup hygiene. Emerging Markets would return to 10% allocation immediately if IEMG broke above compression resistance on expansion volume with MACD bullish divergence—that would signal technical confirmation of the macro thesis—but current price action offers only hope, not evidence.