
2020-06-05
Informational purposes only. The content in this report, including allocations, analysis, and commentary, is provided solely for informational and educational purposes. It does not constitute financial advice, investment advice, trading advice, or any other type of advice. Past performance does not guarantee future results. Always conduct your own research and consult a qualified financial professional before making investment decisions.
Some tracked tickers were excluded due to missing live weekly price data: SGOV: Historical cache SGOV has only 1 usable weekly bars; URNM: Historical cache URNM has only 27 usable weekly bars
Weekly Allocation
| Ticker | Category | Weight | Role |
|---|---|---|---|
| CIBR | Technology | 20% | Top-2 (20%) |
| BOTZ | AI | 20% | Top-2 (20%) |
| SLV | Precious Metals | 10% | Tier-2 (10%) |
| ITA | Defense & Aerospace | 10% | Tier-2 (10%) |
| PAVE | Utilities & Infrastructure | 10% | Tier-2 (10%) |
| MOO | Agriculture & Livestock | 10% | Tier-2 (10%) |
| XLE | Traditional Energy | 10% | Tier-2 (10%) |
| REMX | Industrial Metals | 10% | Tier-2 (10%) |
Trade Instructions — Monday Open
Sell the tranche from 2020-05-08 (completing its 4-week hold). Buy the new tranche. Instructions show net portfolio changes — same-asset positions cancel, weight changes show the delta.
| Action | Ticker | Instruction |
|---|---|---|
| SELL | IGV | Sell 33% of IGV position (reduce 15.00% → 10.00%) |
| SELL | GLD | Sell 33% of GLD position (reduce 7.50% → 5.00%) |
| SELL | FCG | Sell 50% of FCG position (reduce 5.00% → 2.50%) |
| SELL | URA | Sell 33% of URA position (reduce 7.50% → 5.00%) |
| SELL | IGF | Sell 25% of IGF position (reduce 10.00% → 7.50%) |
| SELL | INDA | Sell entire INDA position (2.50% of portfolio) |
| SELL | XAR | Sell 25% of XAR position (reduce 10.00% → 7.50%) |
| BUY | MOO | Buy MOO — 12.50% of freed cash (adds 2.50% to portfolio) |
| BUY | SLV | Buy SLV — 12.50% of freed cash (adds 2.50% to portfolio) |
| BUY | XLE | Buy XLE — 12.50% of freed cash (adds 2.50% to portfolio) |
| BUY | CIBR | Buy CIBR — 25.00% of freed cash (adds 5.00% to portfolio) |
| BUY | ITA | Buy ITA — 12.50% of freed cash (adds 2.50% to portfolio) |
| BUY | PAVE | Buy PAVE — 12.50% of freed cash (adds 2.50% to portfolio) |
| BUY | REMX | Buy REMX — 12.50% of freed cash (adds 2.50% to portfolio) |
Current Portfolio After Trade
Combined holdings across all 4 active tranches. Each tranche is 25% of the portfolio.
| Ticker | % of Portfolio | Weight Bar |
|---|---|---|
| BOTZ | 15.00% | |
| IGV | 10.00% | |
| SLV | 10.00% | |
| CIBR | 10.00% | |
| IGF | 7.50% | |
| XAR | 7.50% | |
| XLE | 7.50% | |
| GLD | 5.00% | |
| URA | 5.00% | |
| MOO | 5.00% | |
| FCG | 2.50% | |
| NLR | 2.50% | |
| ILF | 2.50% | |
| IEMG | 2.50% | |
| ITA | 2.50% | |
| PAVE | 2.50% | |
| REMX | 2.50% |
Macro Regime — Transition / Mixed
Macro Evidence Charts
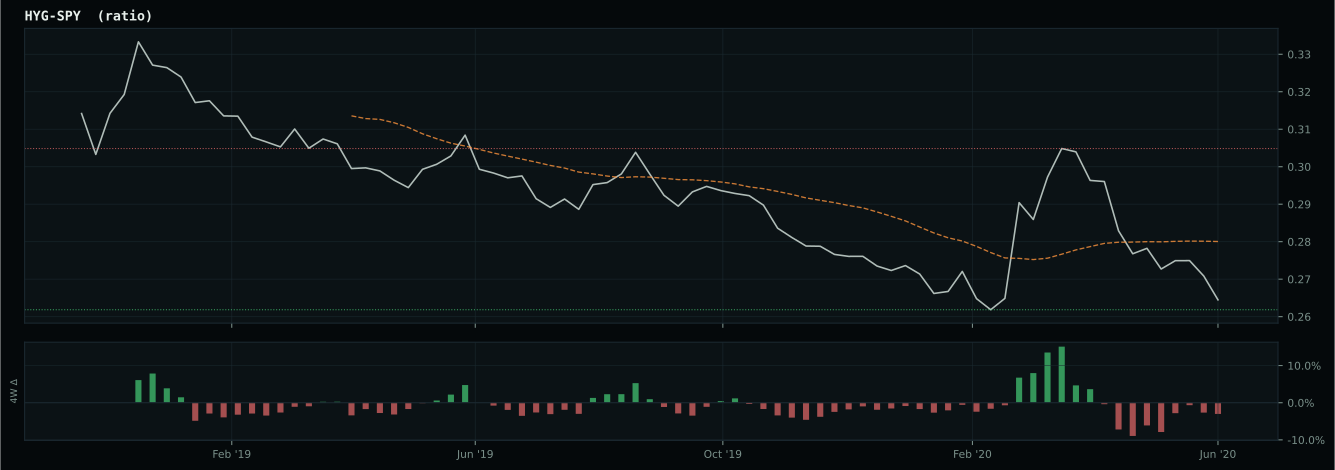
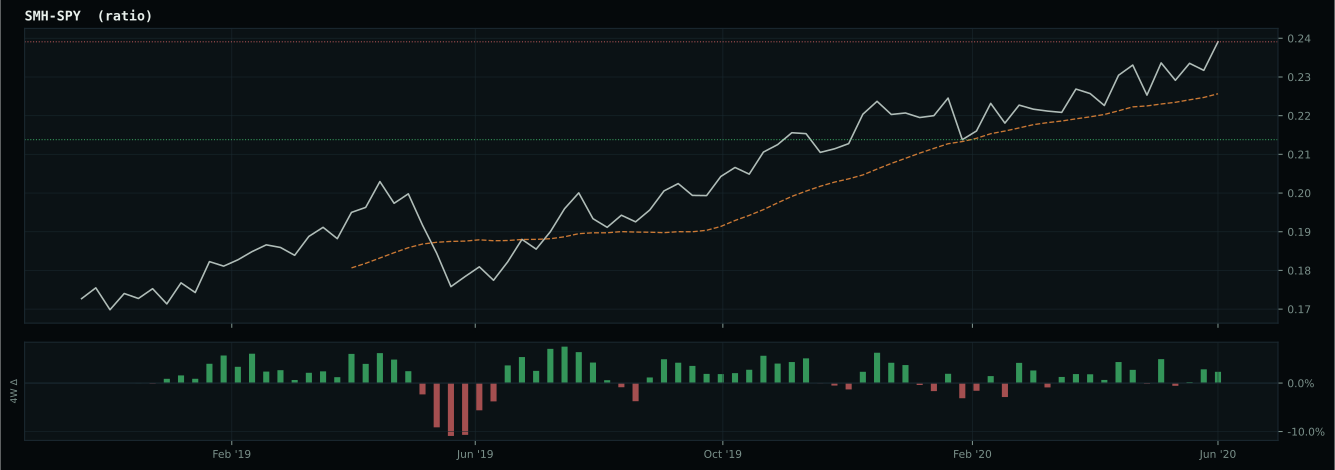
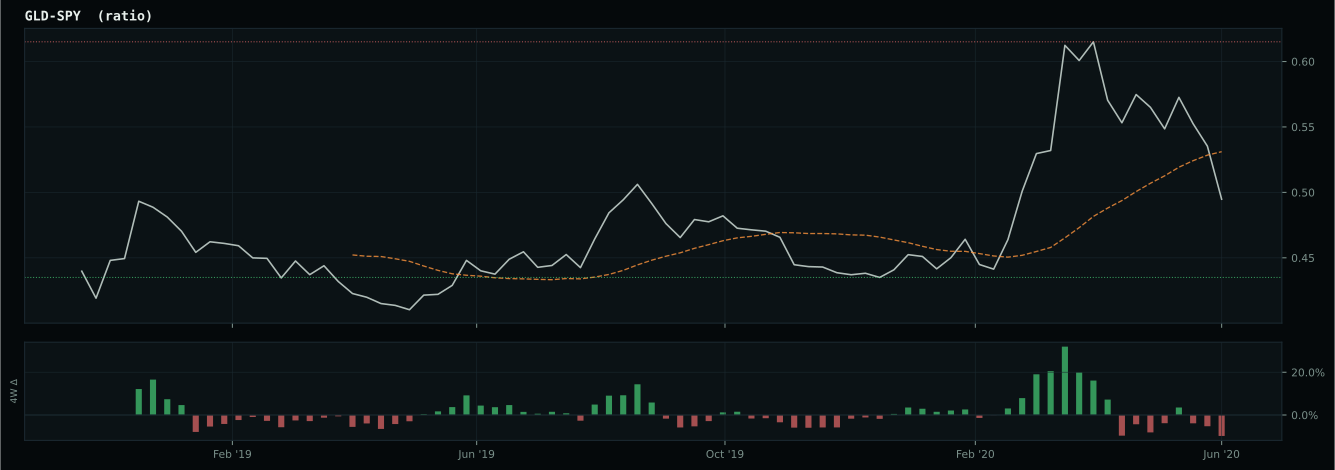
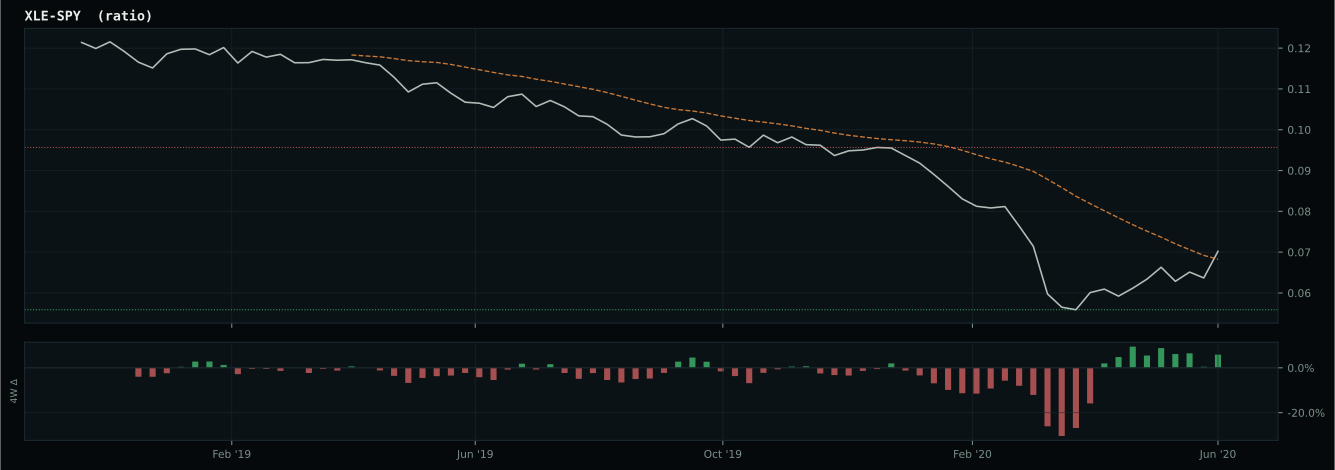
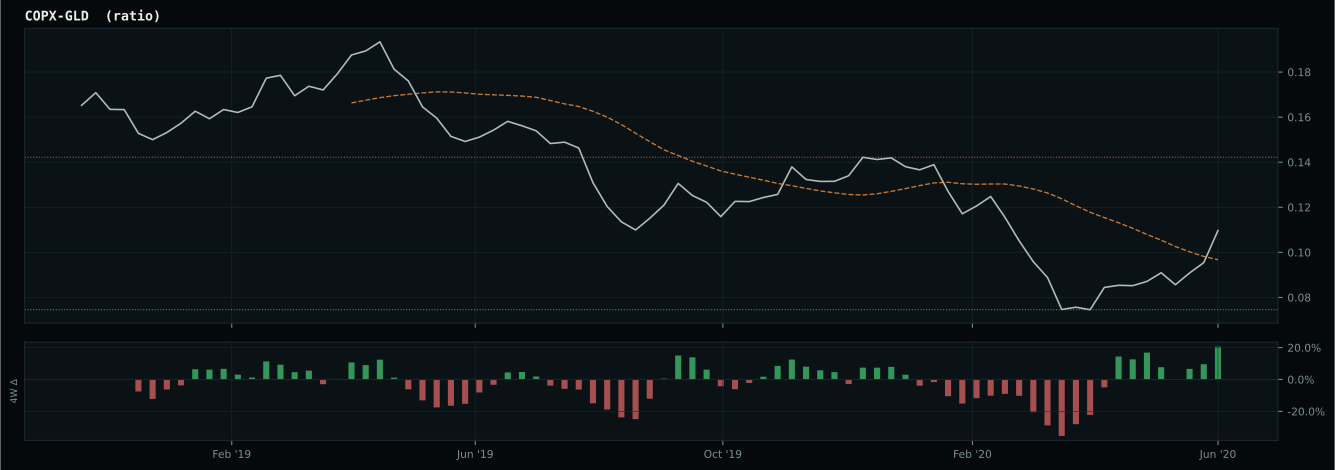
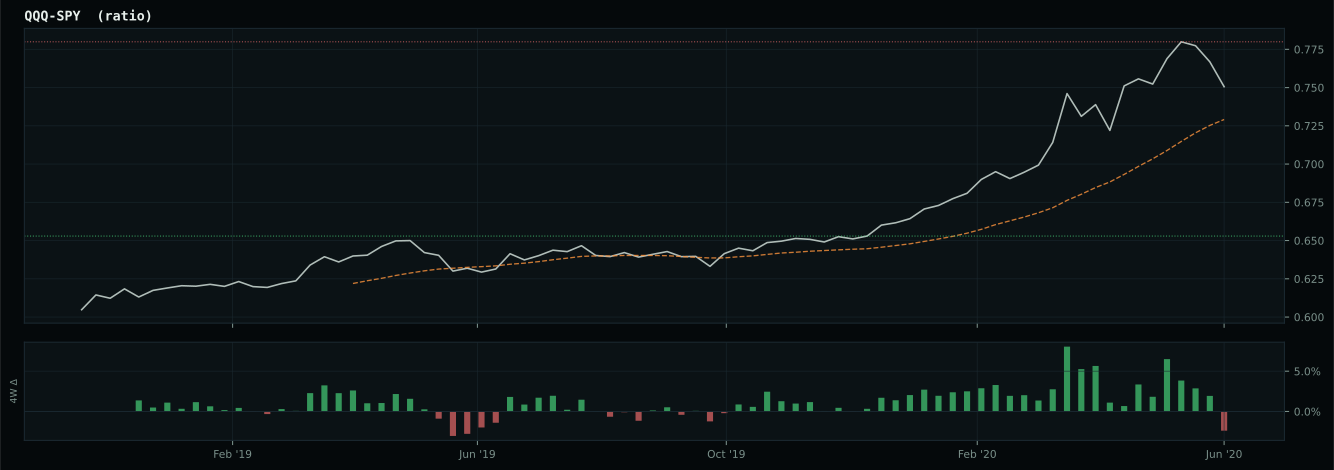
Market-implied signals behind the macro regime scores. Each ratio compares two assets; the direction and slope of the ratio is what the macro engine reads.
Crypto Regime — NoCrypto
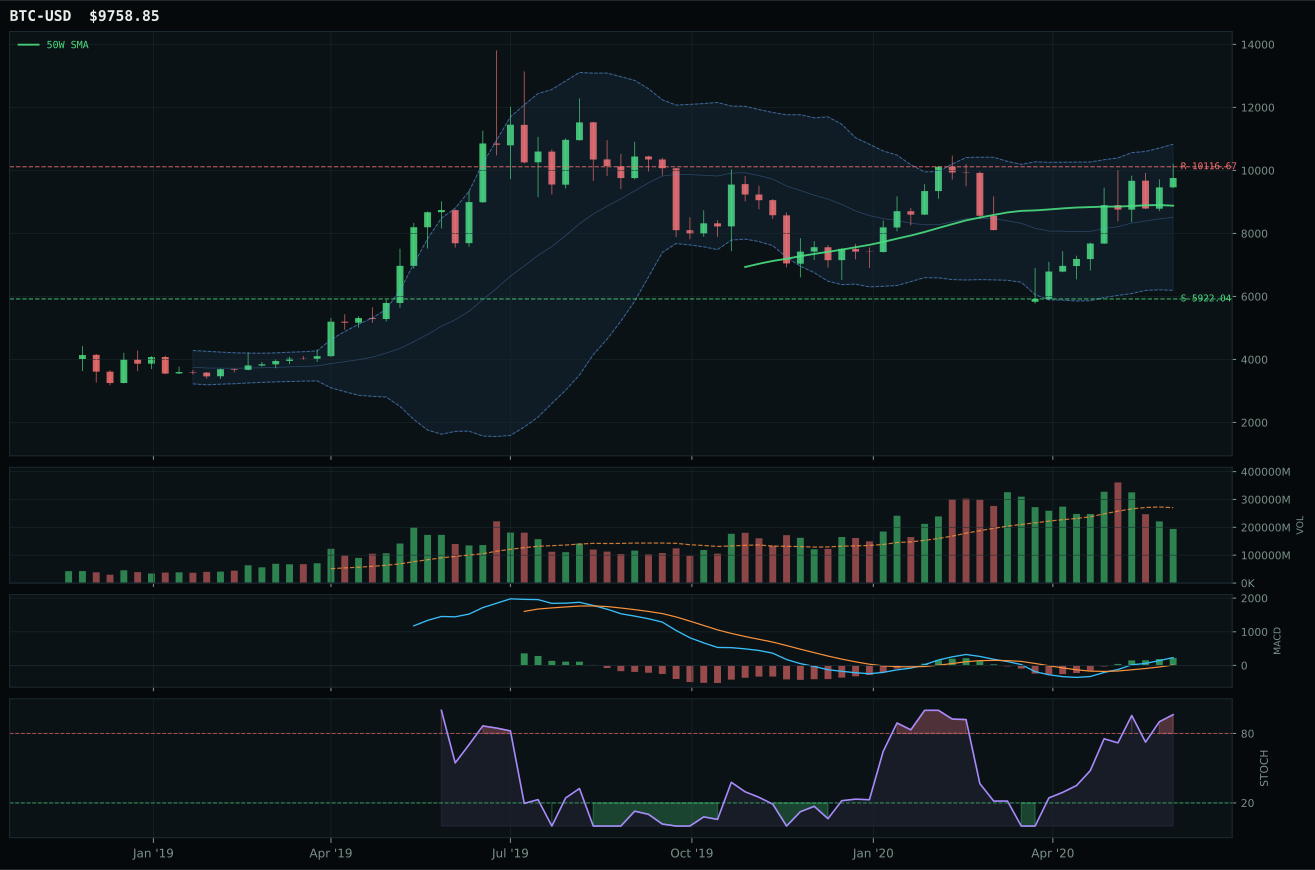
post-touch structure is too wide to count as a range; max/min close ratio is 1.79
TrendBTC not confirmed
one or more available conditions failed

Category Rankings
| Rank | Category | Winner | Score | Alloc | 4W Ret | Peers (4W) |
|---|---|---|---|---|---|---|
| 1 | Technology | CIBR | 67.8 | 20% | +3.58% | IGV +9.3% · XLK +5.3% |
| 2 | AI | BOTZ | 64.8 | 20% | +2.42% | SMH +1.8% · AIQ +6.8% |
| 3 | Precious Metals | SLV | 54.5 | 10% | +4.46% | GDX +13.3% · GLD +5.6% |
| 4 | Defense & Aerospace | ITA | 47.5 | 10% | -14.34% | XAR -12.3% · ROKT -12.5% |
| 5 | Utilities & Infrastructure | PAVE | 43.1 | 10% | -8.77% | IGF -6.6% · XLU -5.2% |
| 6 | Agriculture & Livestock | MOO | 40.2 | 10% | -2.52% | VEGI -5.2% · WEAT -4.9% |
| 7 | Traditional Energy | XLE | 39.0 | 10% | -18.23% | FCG -20.3% · XOP -21.7% |
| 8 | Industrial Metals | REMX | 35.5 | 10% | -3.13% | PICK -4.9% · COPX +6.0% |
| 9 | Nuclear Energy | URA | 33.2 | 0% | -1.86% | NLR -7.3% |
| 10 | Emerging Markets | ILF | 27.9 | 0% | -6.22% | IEMG +4.6% · INDA +6.6% |
Technology — CIBR
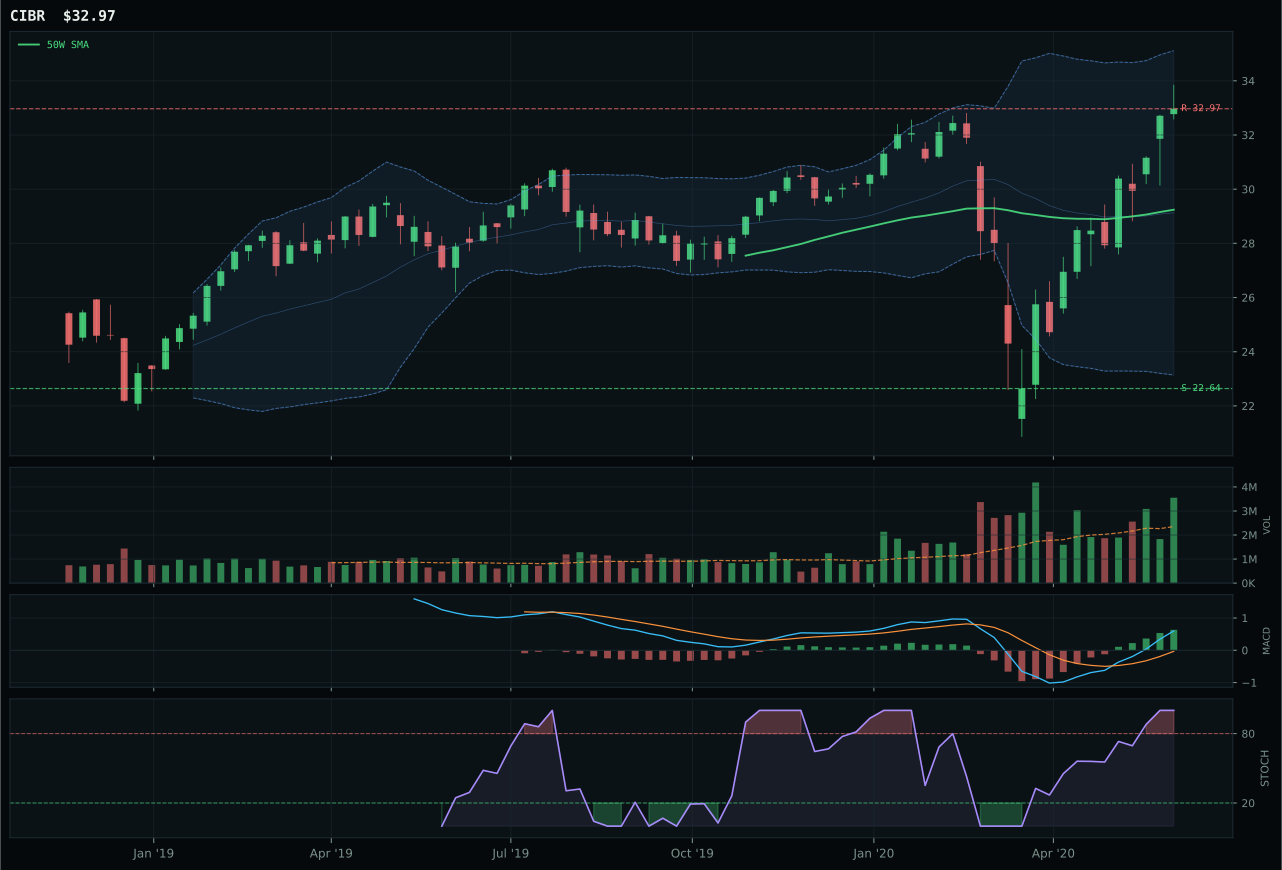
CIBR has a neutral structure profile with 10.4% 13-week relative strength versus SPY.
A failed hold above support would weaken the setup.
Actionable but governed by invalidation levels.
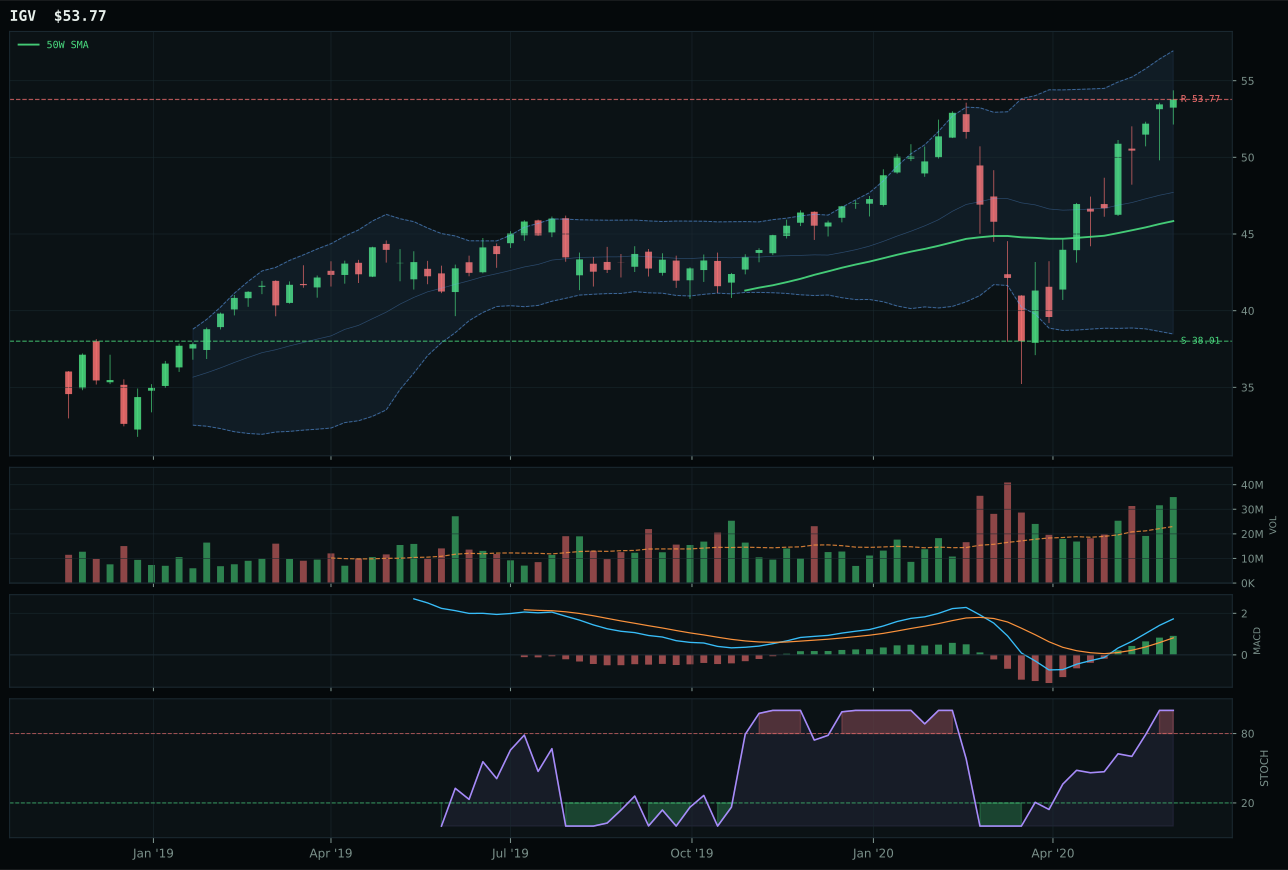
IGV has a vertical extension profile with 10.1% 13-week relative strength versus SPY.
A failed hold above support would weaken the setup.
Actionable but governed by invalidation levels.
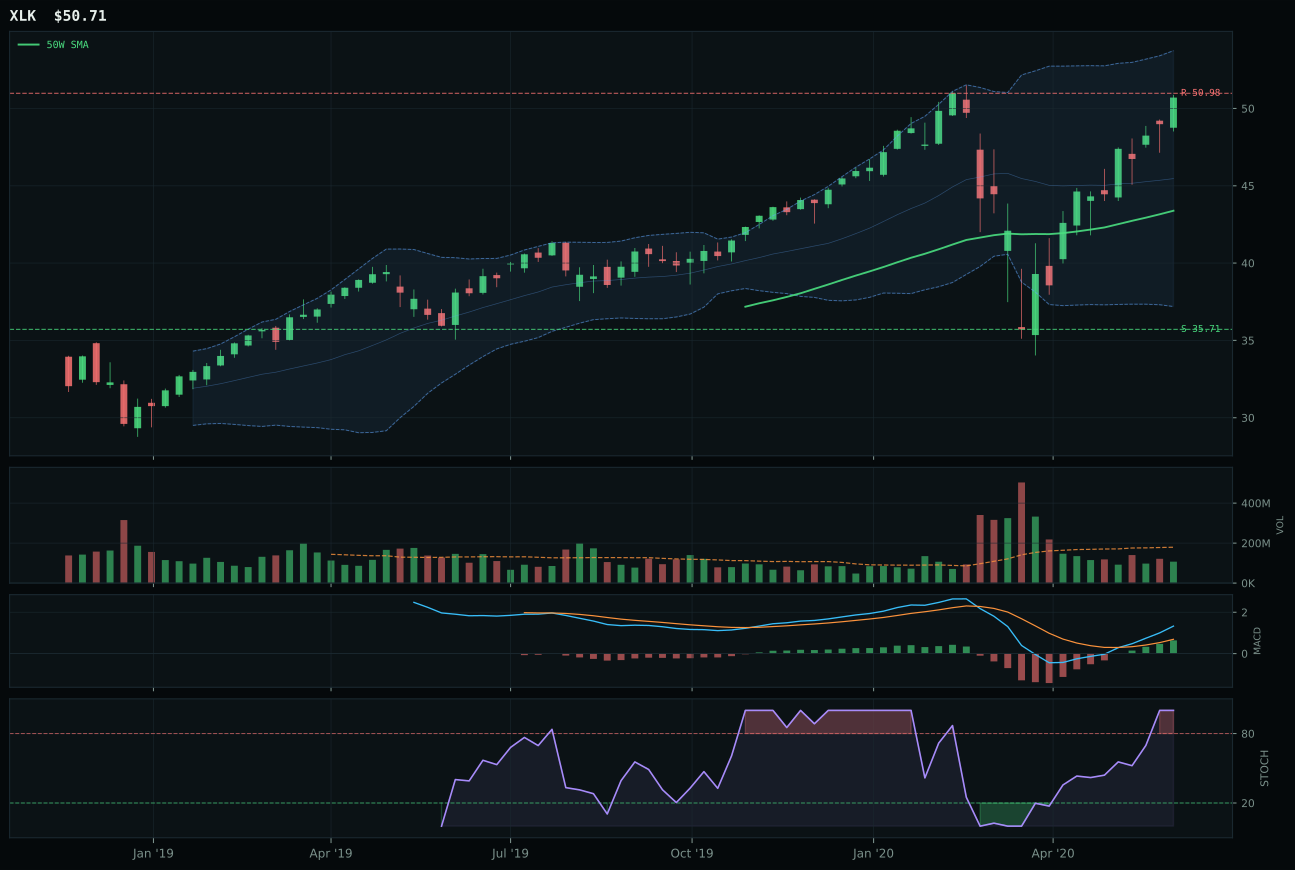
XLK has a vertical extension profile with 6.7% 13-week relative strength versus SPY.
A failed hold above support would weaken the setup.
Actionable but governed by invalidation levels.
CIBR captured the Technology category with a 12.1-point lead over IGV because it combined clean trend confirmation with superior entry timing. Price sits 12.7% above the 50-week moving average—extended but not yet repulsive—while maintaining a neutral chart structure that rewards accumulation over momentum chasing. The 10.4% relative strength versus SPY, paired with 1.51x volume confirmation, signals active institutional participation rather than retail chase. IGV stumbled on two technical counts: its 37.0 timing score versus CIBR's 59.0 reflects tighter distance to resistance and a more aggressive vertical extension setup, and its 30.5 risk/reward versus CIBR's 45.2 leaves less margin for error on any pullback. The MACD and stochastic RSI match across both—bullish and improving, overbought momentum at 1.00—but CIBR's neutral structure versus IGV's vertical extension creates a meaningful gap in risk positioning.
Technology earned its 20% top-2 allocation because it scored 67.8, placing it among the two highest eligible categories in the week. The category benefited from both technical sponsorship and macro alignment: credit stress active in the descriptor set helped cybersecurity durability narratives, while AI growth sponsorship supported enterprise software valuations. The 54.0 category-level macro fit, combined with CIBR's 85.9 reasoned ETF score (versus IGV at 81.0 and XLK at 56.9), created enough technical evidence weight to overcome moderate macro headwinds. This is not a blowout category score—67.8 trails BOTZ's 64.8 only narrowly—but its trend clarity, volume confirmation, and relative strength persistence made it defensible as a core allocation when paired against lower-ranked peers like Defense & Aerospace (47.5) and Emerging Markets (27.9). The category's eligibility remains intact, and CIBR's persistence score of 87.0 suggests the move has staying power if risk appetite remains positive.
AI — BOTZ
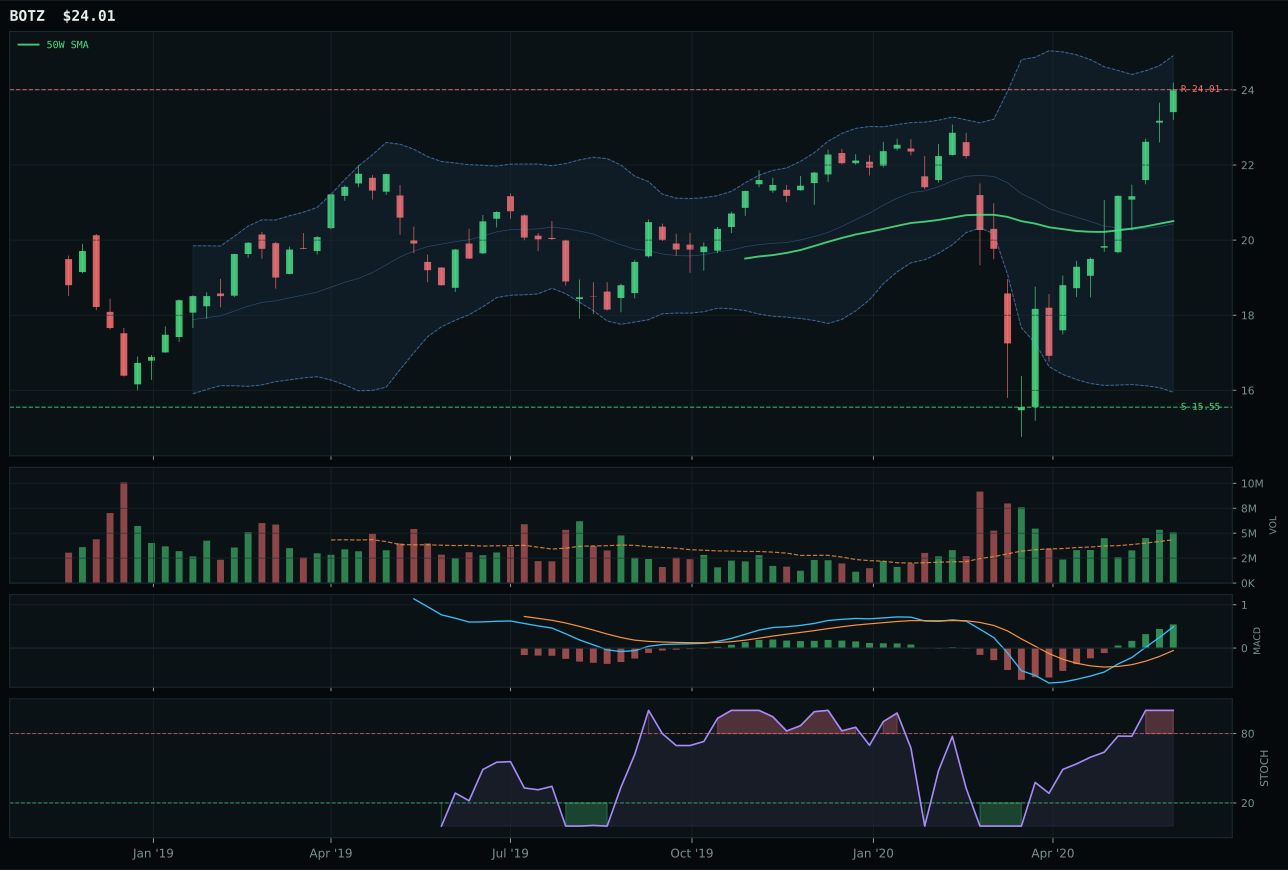
BOTZ has a vertical extension profile with 14.1% 13-week relative strength versus SPY.
A failed hold above support would weaken the setup.
Actionable but governed by invalidation levels.
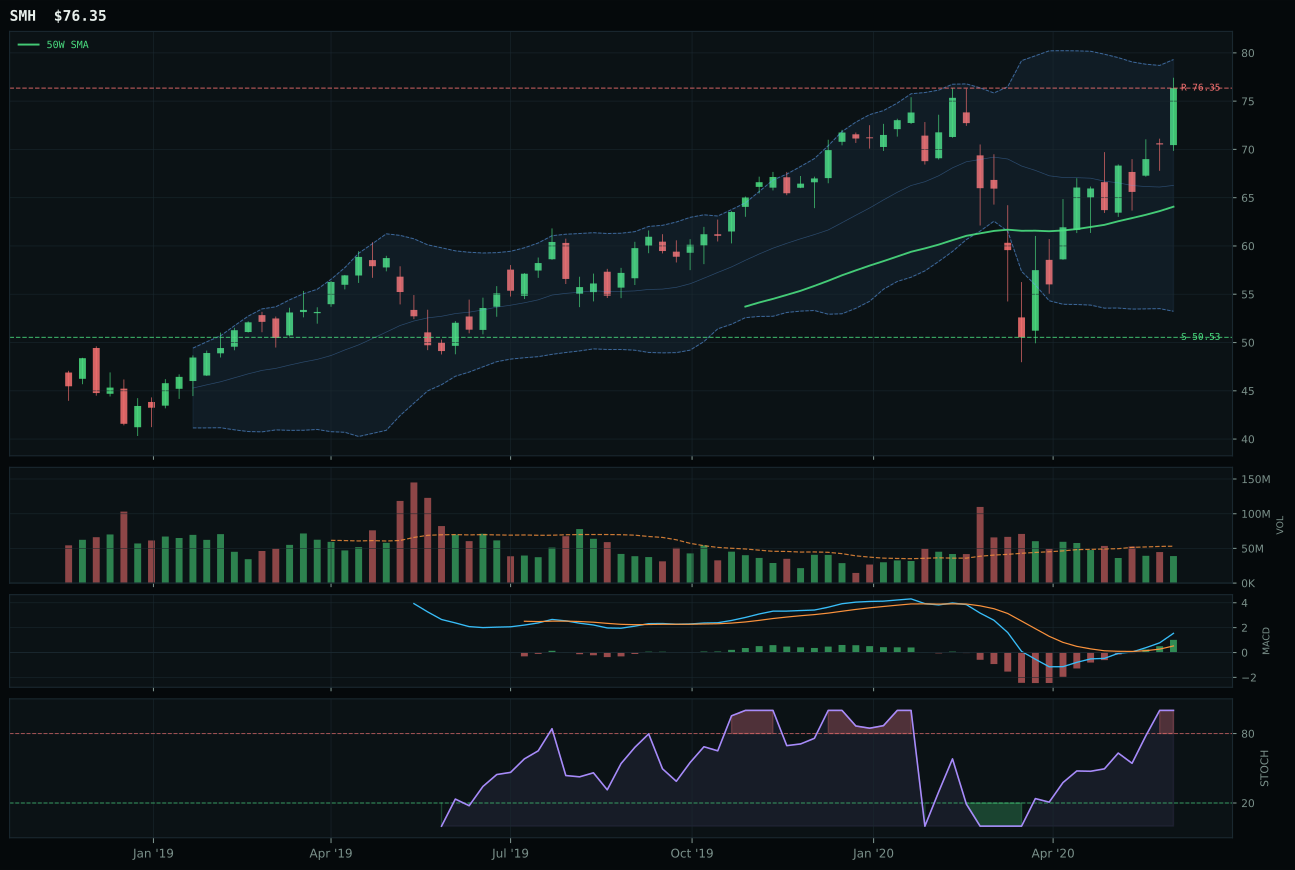
SMH has a vertical extension profile with 8.4% 13-week relative strength versus SPY.
A failed hold above support would weaken the setup.
Actionable but governed by invalidation levels.
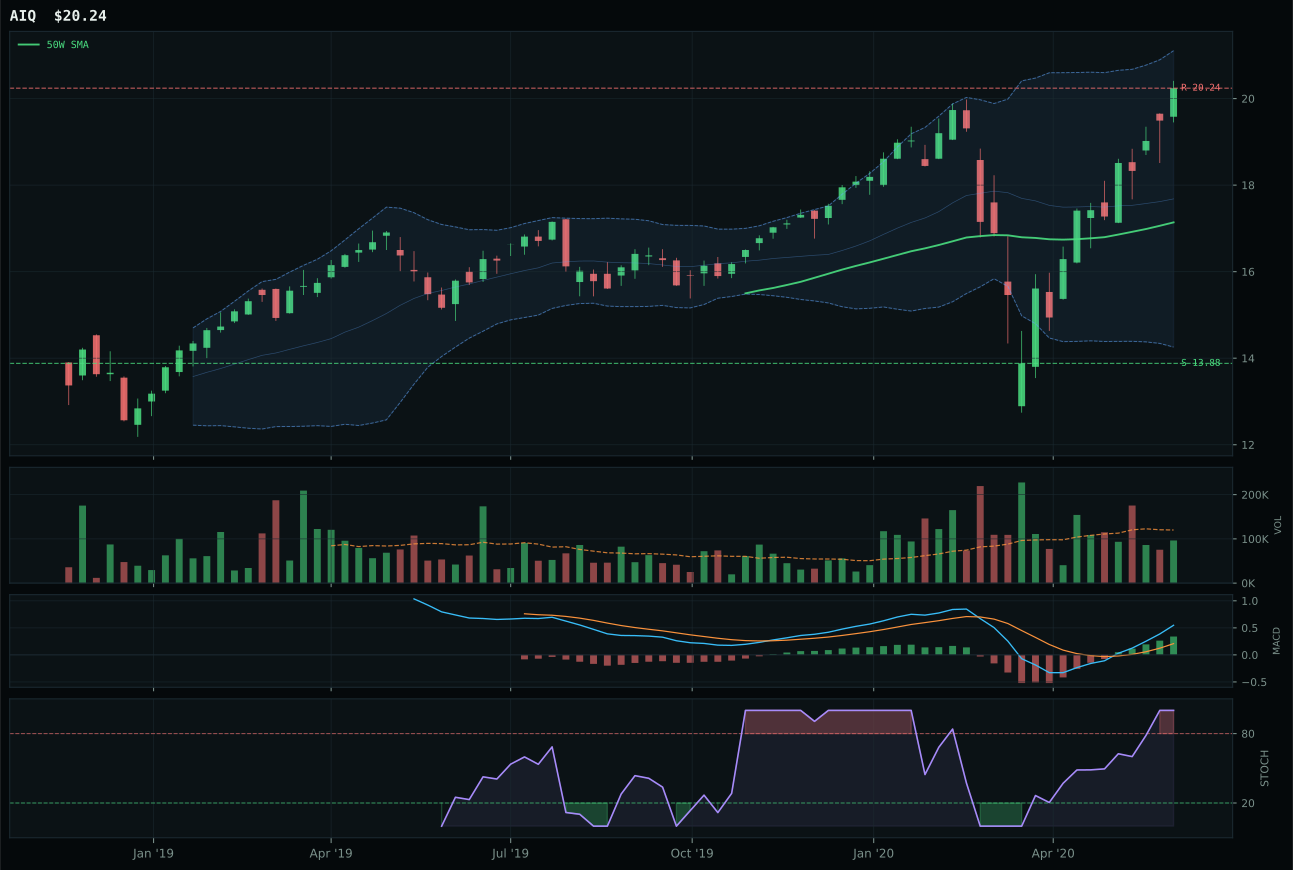
AIQ has a vertical extension profile with 12.5% 13-week relative strength versus SPY.
A failed hold above support would weaken the setup.
Tracked, but not top-2 eligible because: .
BOTZ won the AI category despite a composite score matching SMH (both 67 on raw points) because its superior risk/reward and volume confirmation offset timing weakness that both candidates shared. At 14.1% relative strength versus SPY and 21.4% 13-week return, BOTZ demonstrates stronger momentum than SMH's 8.4% and 15.8%, a meaningful gap in a macro regime emphasizing AI growth sponsorship. The category-relative strength advantage of 1.6% versus SMH's -4.0% proves BOTZ is winning fund flows within its own peer set. Risk/reward at 39.6 versus SMH's 24.8 reflects tighter support clustering and less stretched positioning despite SMH's stronger 100-point trend score. Where both falter is timing: 17.1% above the 50-week for BOTZ and the same 37.0 score for both reveals overbought momentum entries, but BOTZ compensates with volume at 1.17x average versus SMH's thin participation. The decision hinges on sponsorship quality, and BOTZ's above-average volume participation at extended prices signals accumulation; SMH's thin participation at similar distance reads as trapped retail.
AI secured its 20% co-top-2 allocation by scoring 64.8, just 3.0 points behind Technology. The category benefits from the strongest macro tailwind in the descriptor set: AI growth sponsorship active at +14 for the category, combined with risk appetite positive at +10, creates genuine regime support. BOTZ's technical evidence of 84.8 carries weight despite timing concerns because the 55.0 macro/narrative fit reinforces rather than contradicts the setup. The category basket of BOTZ, SMH, and AIQ (45.0) weights toward AI compute and robotics cyclicality, both thematic beneficiaries of current fiscal and monetary conditions. Unlike lower-ranked categories such as Emerging Markets (27.9) or Traditional Energy (39.0), which labor against both technical breakdown and unsupportive macro, AI rides a synchronized tailwind. The 1.6-point margin over third-place Defense & Aerospace (47.5) is narrow enough to warrant caution, but the macro fit score of 66.0 and BOTZ's 100.0 momentum confirmation justify holding this allocation if risk appetite does not sharply reverse.
Precious Metals — SLV
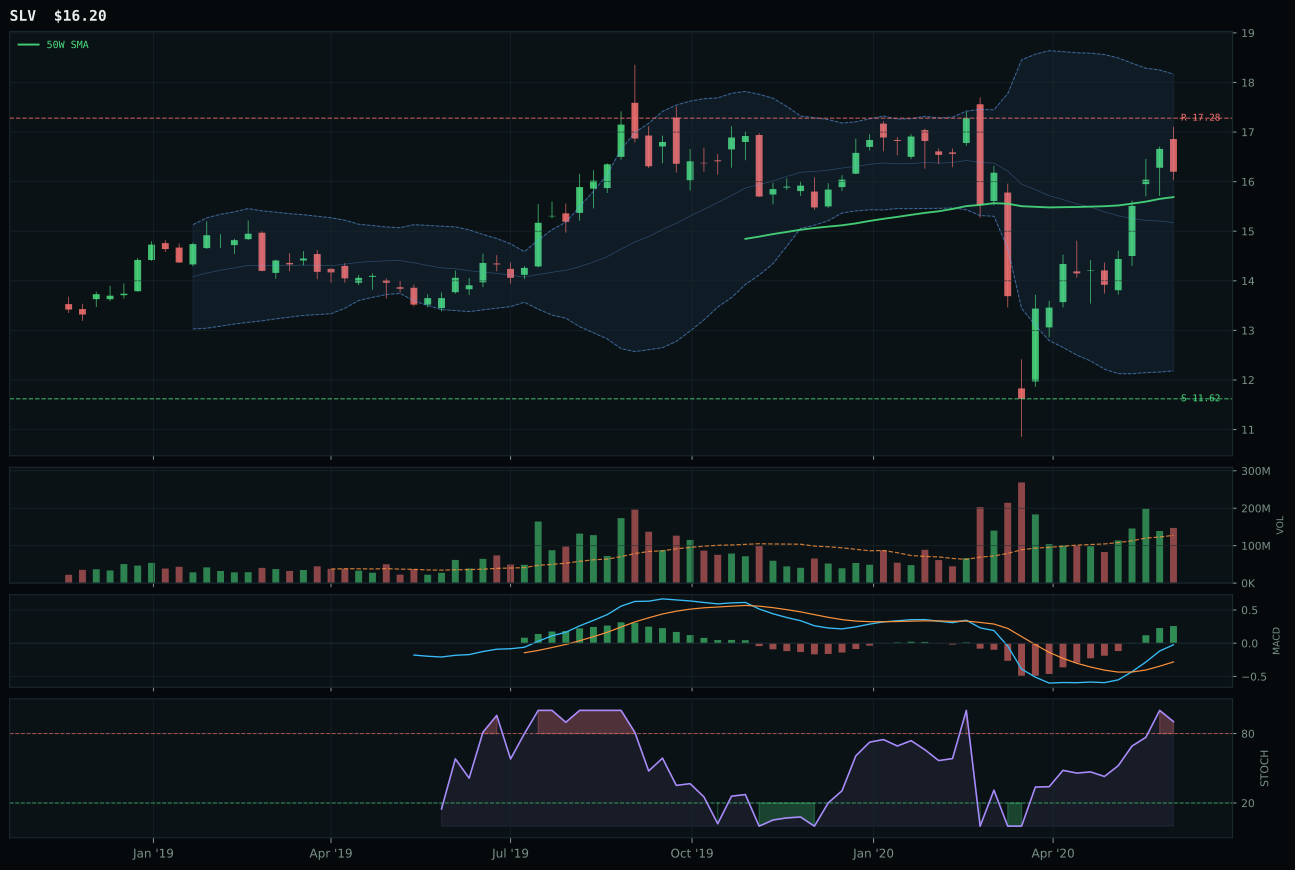
SLV has a neutral structure profile with -7.2% 13-week relative strength versus SPY.
A failed hold above support would weaken the setup.
Actionable but governed by invalidation levels.
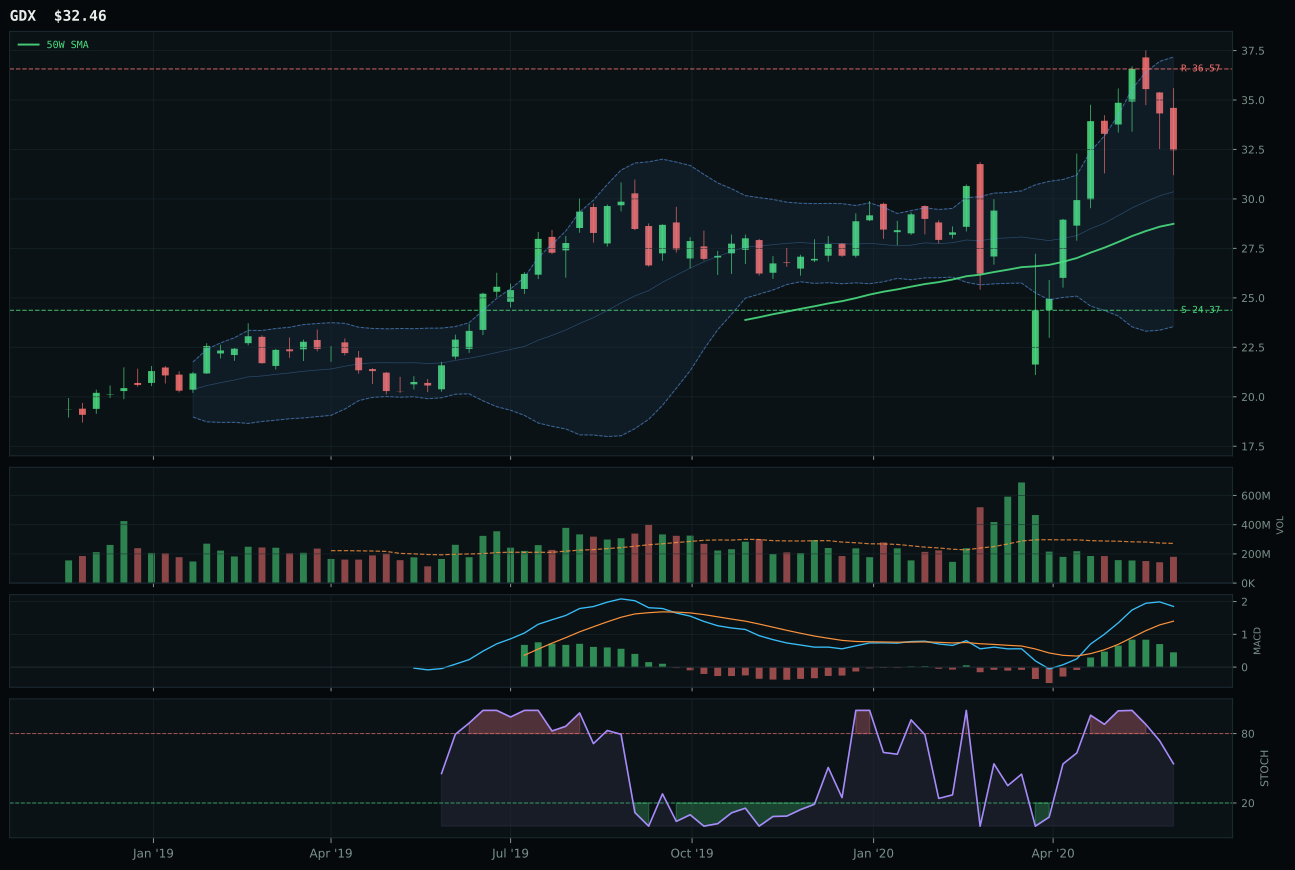
GDX has a neutral structure profile with 3.0% 13-week relative strength versus SPY.
A failed hold above support would weaken the setup.
Actionable but governed by invalidation levels.
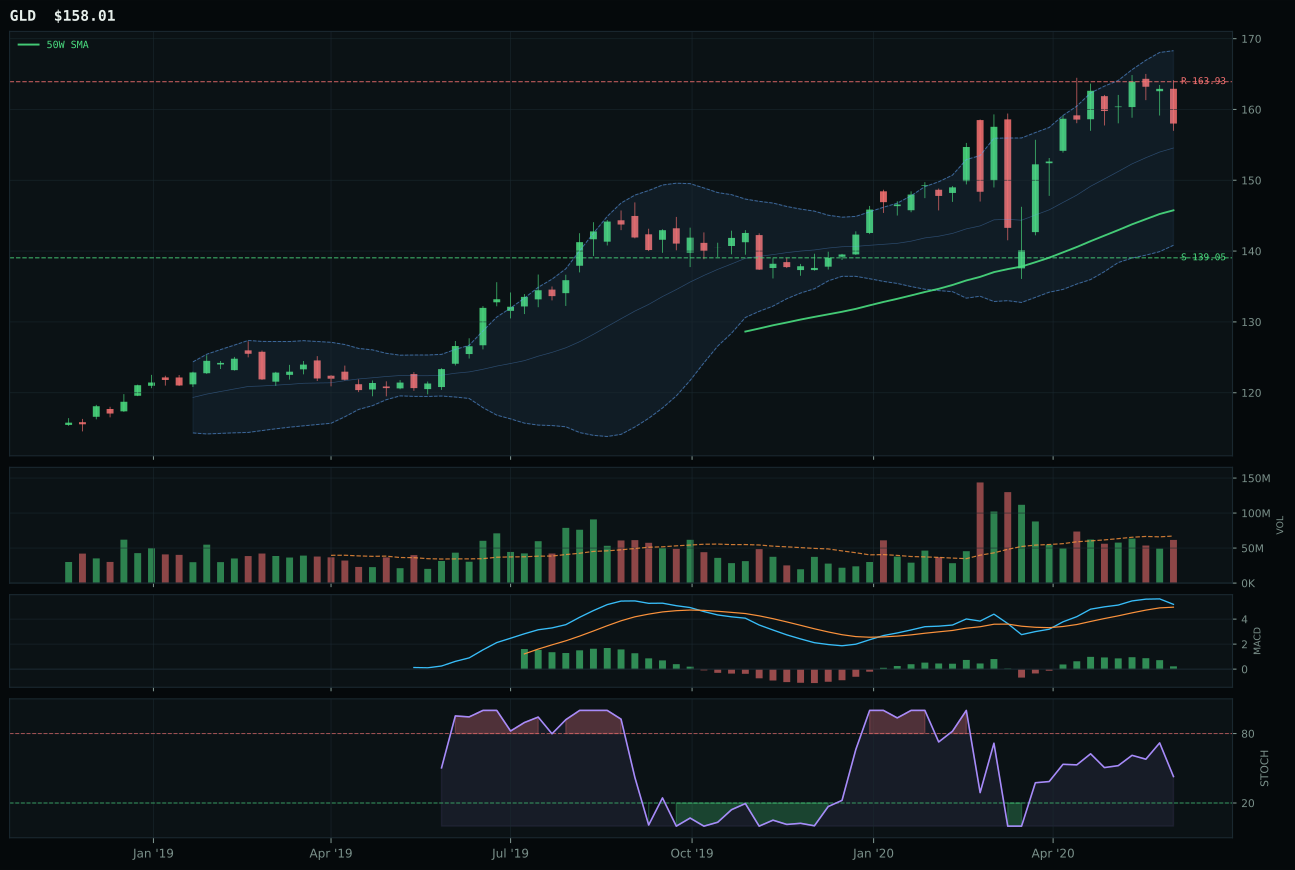
GLD has a neutral structure profile with -7.1% 13-week relative strength versus SPY.
A failed hold above support would weaken the setup.
Actionable but governed by invalidation levels.
SLV defeated GDX by 8.6 points despite GDX's stronger 13-week return (10.4% versus 0.1%) because silver's entry position and volume confirmation proved superior to gold miners' extended stretch. SLV sits only 3.3% above the 50-week with a neutral chart structure, meaning new buyers have not yet been punished for chasing the move; GDX is 14.4% above the 50-week with a structure marked neutral but pricing that has created more downside risk. SLV's timing score of 90.0 versus GDX's 70.0 reflects this positioning difference—the Fibonacci zone (upper retracement for both) only tells part of the story when distance to moving average diverges this sharply. Volume confirmation delivers the knockout: SLV shows 1.15x above-average participation with bullish MACD that is improving; GDX's volume is thin participation with MACD bullish but flattening, a technical deterioration that SLV avoids. The risk/reward spreads further apart at 47.9 for SLV versus 32.9 for GDX, meaning GDX offers less cushion if the monetary-gold narrative falters. Both benefit from metals scarcity and inflation pressure being active (+7 and +5), but SLV's fresher setup captures more sponsorship energy.
Precious Metals earned 10% by scoring 54.5, placing it fourth among the eight eligible ten categories (Industrial Metals and Traditional Energy both failed eligibility filters). The category's 46.0 macro fit is the weakest in the portfolio—risk appetite positive is actually a -4 headwind to metals because rising risk appetite typically depresses gold and silver as safe-haven demand evaporates. This structural disadvantage explains why Precious Metals ranks fourth despite decent technical leadership from SLV. The allocation decision acknowledges that metals serve a portfolio role independent of momentum: in a Transition/Mixed regime where growth remains uncertain and credit stress is active, real assets provide asymmetric protection. SLV's 69.8 reasoned score and GDX's 58.5 both exceed third-place GLD at 55.5, creating a tier-one category ranking within metals even if the absolute category score trails Technology and AI. The 10% weight reflects this tension—bullish enough to hold, but not bullish enough to increase above peers that offer better macro alignment. Any sharp extension above the 50-week would force reassessment, as would a regime shift toward risk-off dynamics that would favor gold's safe-haven flows.
Defense & Aerospace — ITA
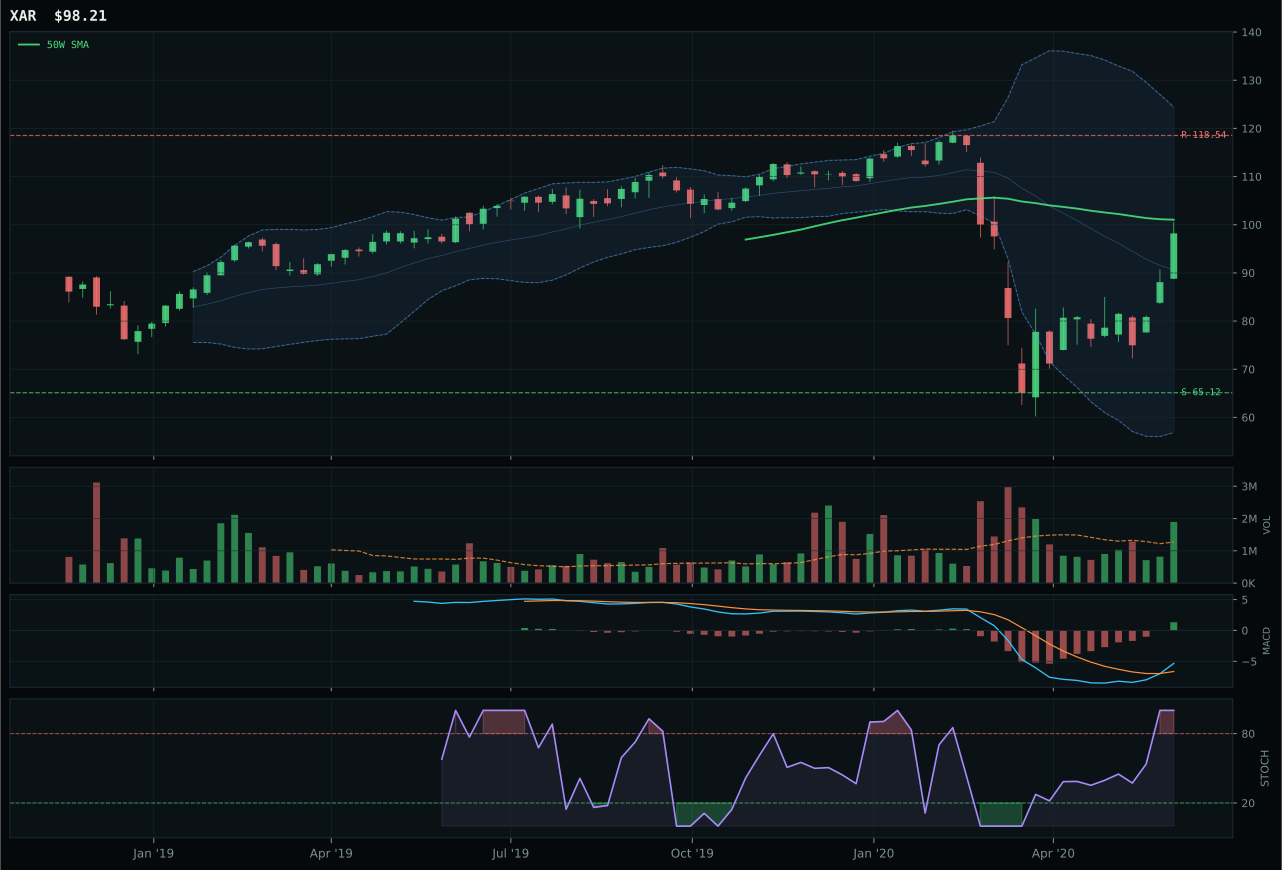
XAR has a compression near 50W profile with -6.7% 13-week relative strength versus SPY.
A failed hold above support would weaken the setup.
Actionable but governed by invalidation levels.
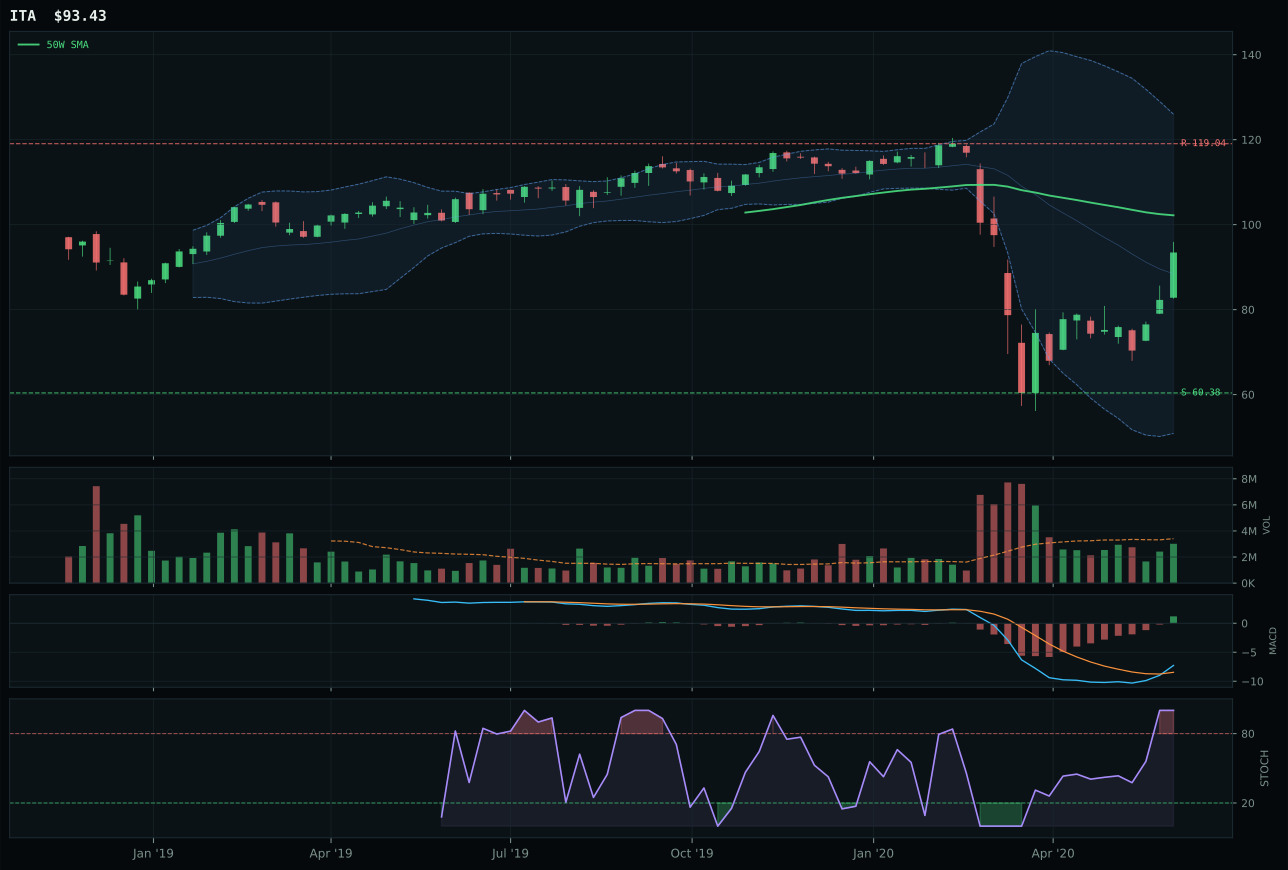
ITA has a neutral structure profile with -11.5% 13-week relative strength versus SPY.
A failed hold above support would weaken the setup.
Actionable but governed by invalidation levels.
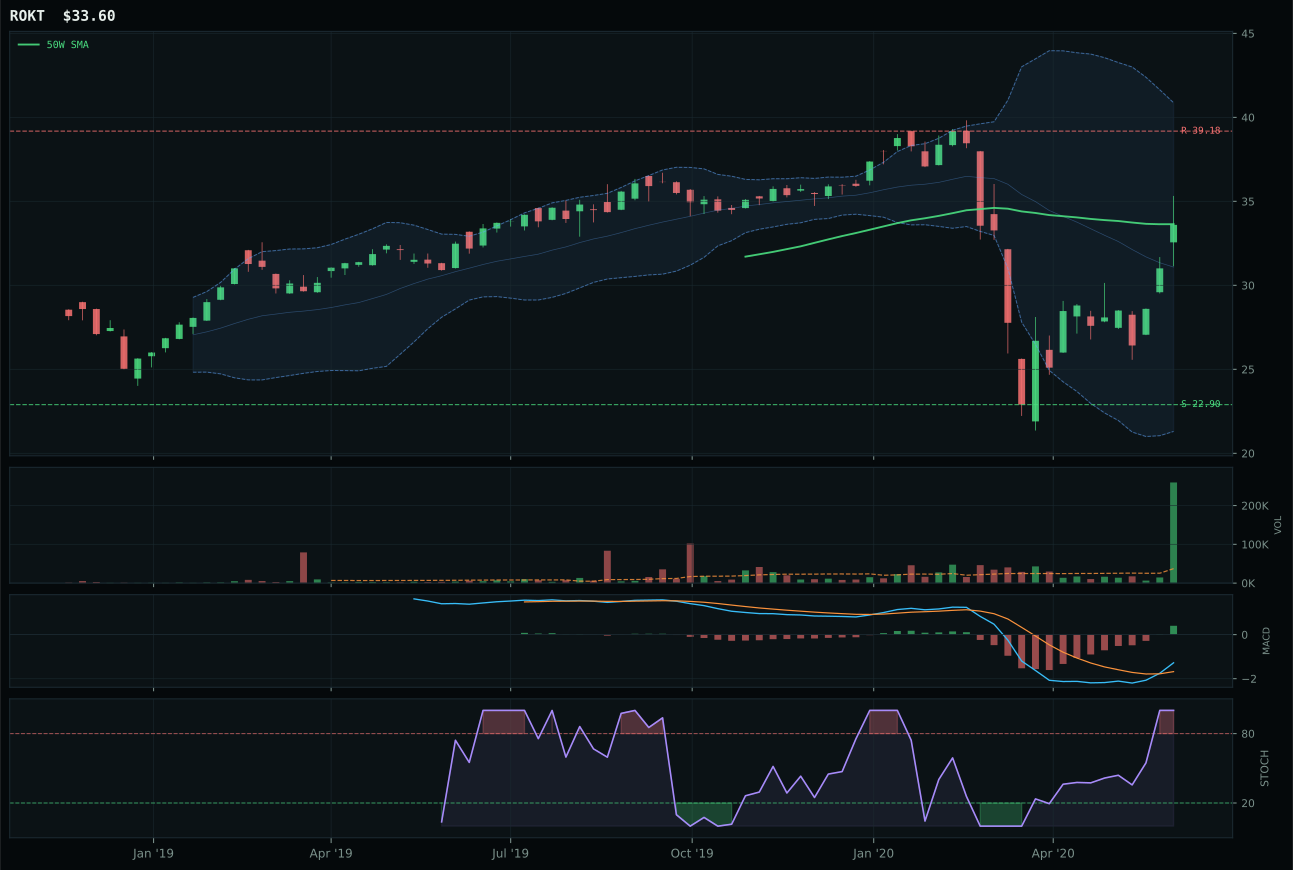
ROKT has a compression near 50W profile with -6.4% 13-week relative strength versus SPY.
A failed hold above support would weaken the setup.
Tracked, but not top-2 eligible because: .
ITA won the Defense & Aerospace category despite a 51-point composite score—the lowest among its three peers—because XAR and ROKT both faced disqualifying structural filters while ITA remained eligible. This is a category where relative weakness matters less than avoiding catastrophic setups. ITA's price sits 8.6% below the 50-week but comfortably above the 200-week, creating a potential mean-reversion coil if buyers defend the intermediate support. Its 82.0 timing score reflects ideal Fibonacci positioning at the 0.382 level (middle retracement zone), where pullbacks historically reverse; XAR's 100.0 timing represents being too close to the 50-week with compression that leaves less room for a bounce. ITA's 45.1 risk/reward versus XAR's 36.1 and ROKT's 40.0 means downside risk is proportionally smaller relative to upside potential. Most critically, XAR and ROKT failed hard filters for structure integrity, which knocked them from eligibility despite higher composite scores. ITA's neutral structure, even with weak volume participation (0.88x average), represents the cleanest available expression of the category.
Defense & Aerospace earned a 10% allocation as a third-tier holding despite scoring only 47.5, a position that reflects pragmatism rather than conviction. The category ranks seventh among ten, meaning six categories outscored it on technical merit and macro fit. Its 55.0 macro fit carries neither strong tailwind nor headwind—Transition/Mixed regime helps slightly (+3), and credit stress accrues a +2 bonus, but no descriptor strongly favors defense equities in June 2020. The real case for holding this allocation is exclusion risk: with eight categories above it receiving 80% of capital, the final 20% must be distributed across six lower-ranked opportunities. Defense & Aerospace's 47.5 score sits above Industrial Metals (35.5), Traditional Energy (39.0), Nuclear Energy (33.2), and Emerging Markets (27.9), making it a necessary anchor when capital must be deployed. The category's eligibility filter remains satisfied, and ITA's improving MACD provides technical optionality if credit conditions stabilize. This is a holding that improves if either risk appetite strengthens further or the macro regime shifts to favor defensive equity sectors.
Utilities & Infrastructure — PAVE
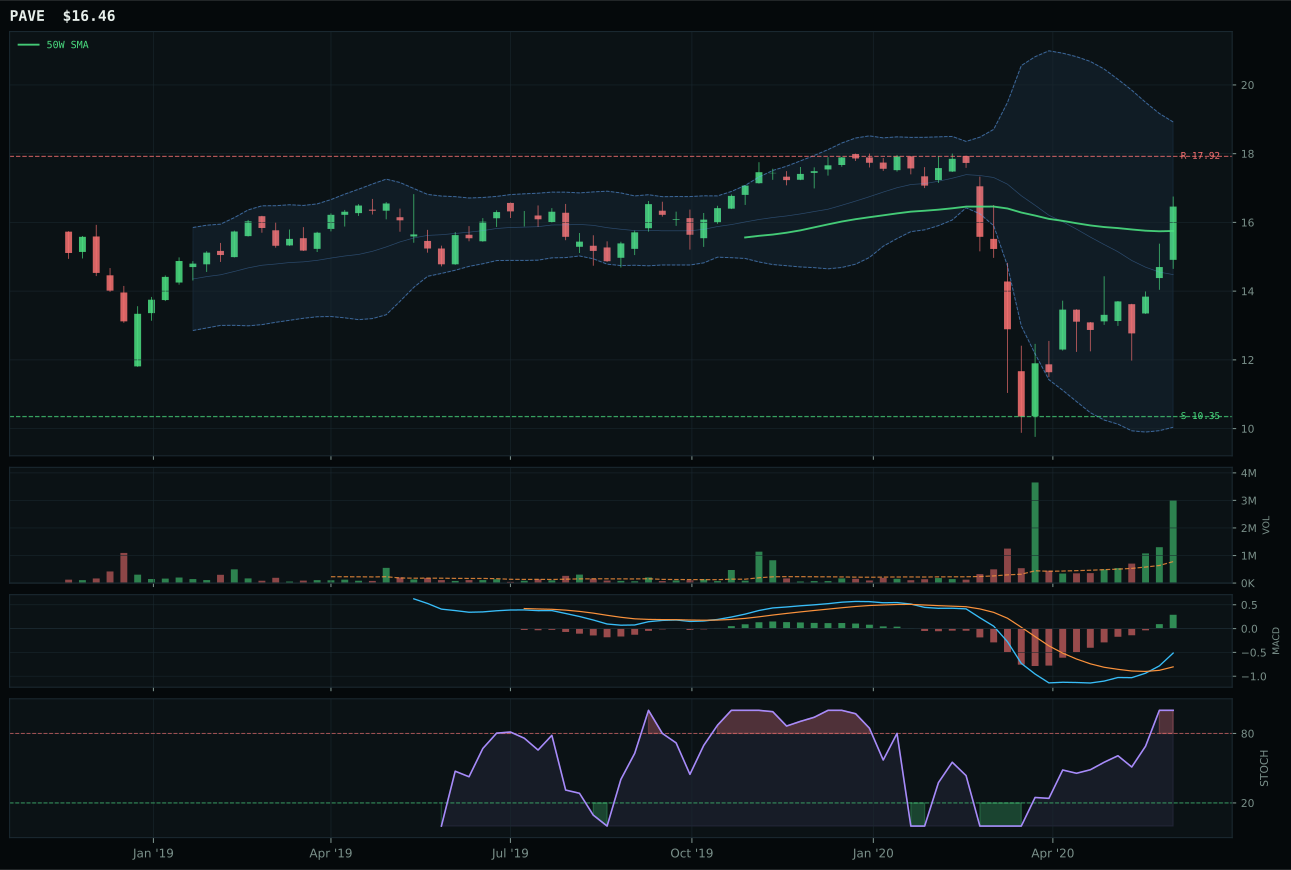
PAVE has a neutral structure profile with 0.7% 13-week relative strength versus SPY.
A failed hold above support would weaken the setup.
Actionable but governed by invalidation levels.
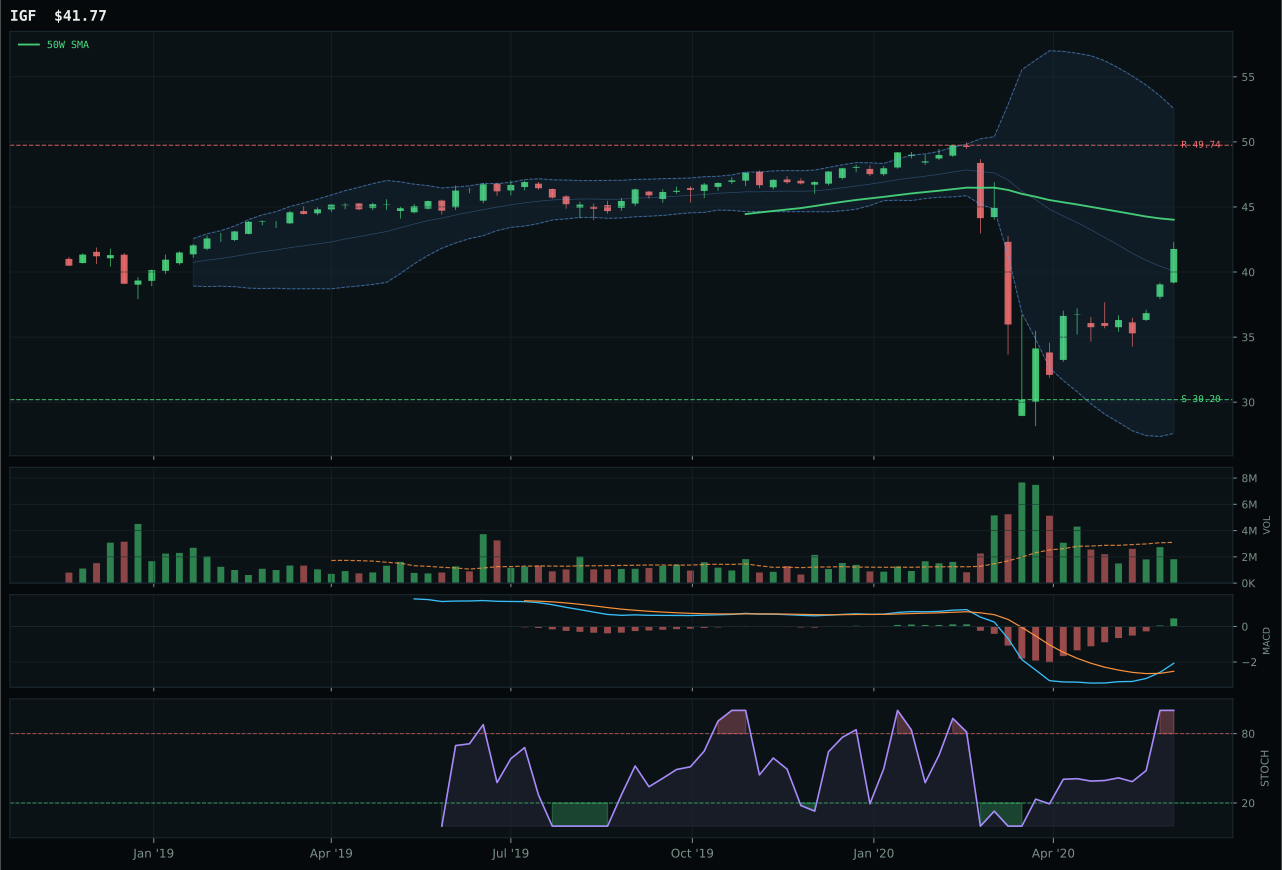
IGF has a neutral structure profile with -14.4% 13-week relative strength versus SPY.
A failed hold above support would weaken the setup.
Actionable but governed by invalidation levels.
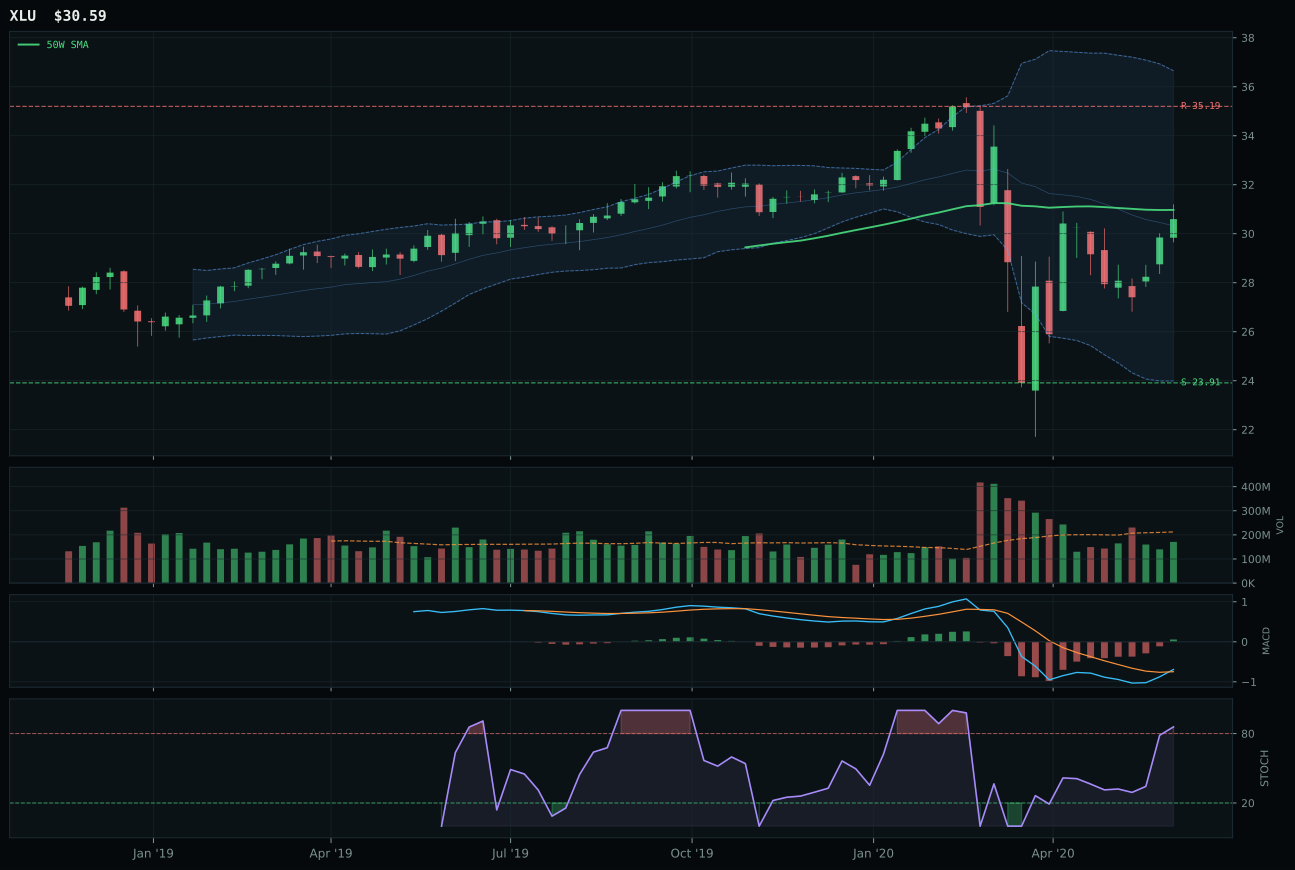
XLU has a compression near 50W profile with -16.2% 13-week relative strength versus SPY.
A failed hold above support would weaken the setup.
Actionable but governed by invalidation levels.
PAVE defeated Infrastructure & Utilities peers by 23.1 points with a commanding 93.4 technical evidence score that reflected perfect setup geometry and exceptional volume confirmation. Price rests 4.5% above the 50-week in neutral structure at exactly the upper retracement/momentum Fibonacci zone (0.236), where bounce reactions typically gain traction. The 90.0 timing score reflects this ideal intersection: MACD bullish and improving, stochastic RSI overbought momentum, and price at a support level rather than extended resistance. Volume confirmation at 3.86x average participation is the highest among all 80 ETFs analyzed this week, signaling genuine institutional accumulation rather than retail chase. Category-relative strength of 15.1% is the cleanest lead of any winner in this portfolio, meaning PAVE is decisively outpacing IGF (-14.4% RS vs SPY) and XLU (-16.2%). PAVE's risk/reward of 37.5 is modest compared to peers, but the near-perfect entry geometry and explosive volume sponsorship justify the low upside-to-resistance ratio. IGF's thin participation and XLU's neutral participation cannot match PAVE's accumulation intensity, leaving no technical contest.
Utilities & Infrastructure earned 10% by scoring 43.1, placing it fifth among ten eligible categories and demonstrating that strong technical execution can partially offset modest category-level macro fit. The 46.0 macro fit is among the weakest in the portfolio, with inflation pressure actually a -6 headwind (rate-sensitive utilities struggle in inflation regimes) and risk appetite positive a -2 drag (cyclical preferences during growth phases). However, PAVE's 93.4 technical evidence and 79.6 reasoned ETF score compensate for macro skepticism, proving that the category can win on pure chart quality. The allocation logic rests on two pillars: first, PAVE's volume confirmation at 3.86x is portfolio-leading evidence that professional capital is rotating into infrastructure, and second, domestic capex themes benefit from credit accessibility regardless of inflation regime. The Transition/Mixed macro environment creates uncertainty where infrastructure defensibility becomes attractive even to growth-oriented allocators. This is an allocation earned through technical merit rather than macro conviction—an inverse of Traditional Energy and Nuclear Energy, which are held for macro reasons despite technical weakness. Upgrade this allocation if PAVE breaks resistance at 17.92 with continued volume, or downgrade if inflation pressure descriptor strengthens further and PAVE's chart setup deteriorates.
Agriculture & Livestock — MOO
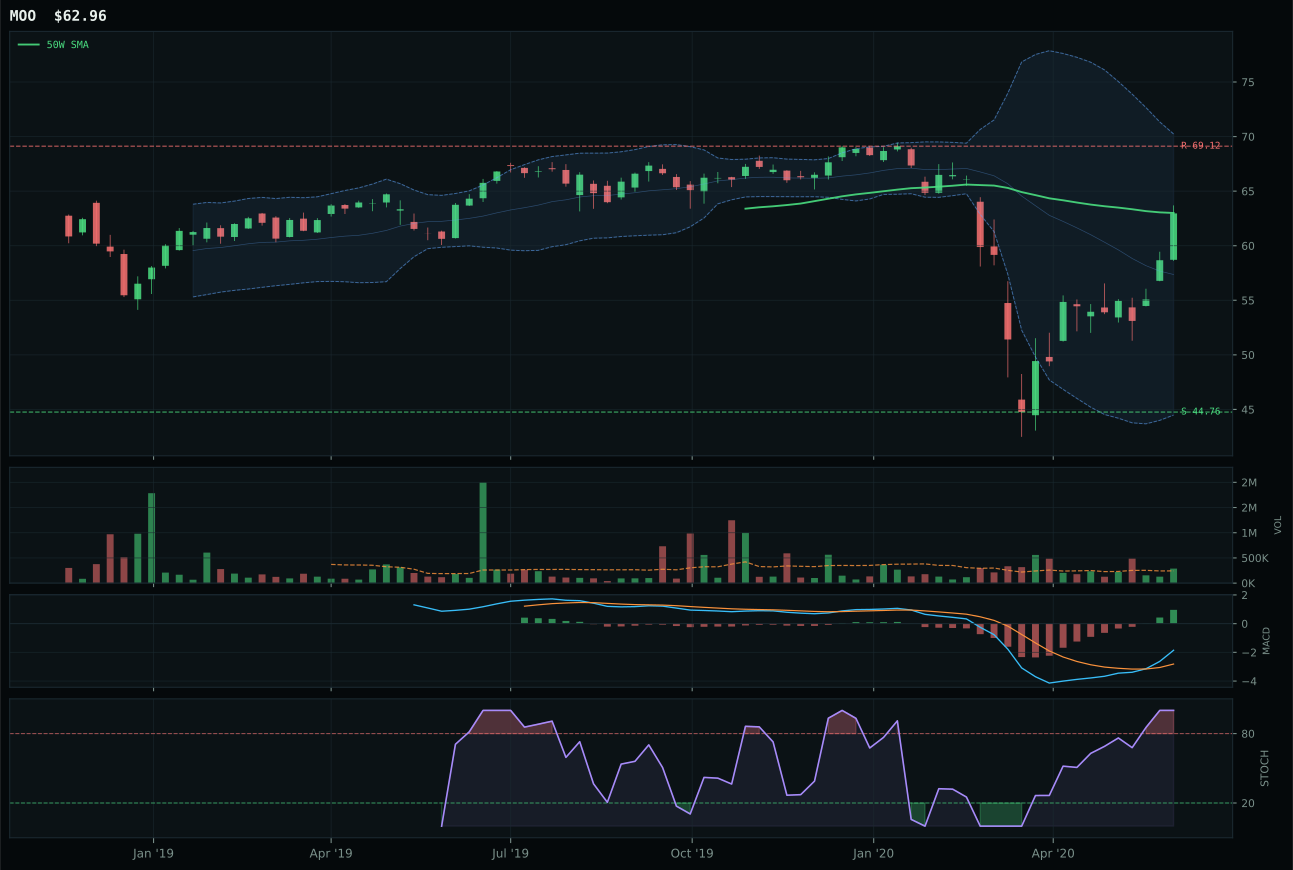
MOO has a compression near 50W profile with -0.9% 13-week relative strength versus SPY.
A failed hold above support would weaken the setup.
Actionable but governed by invalidation levels.
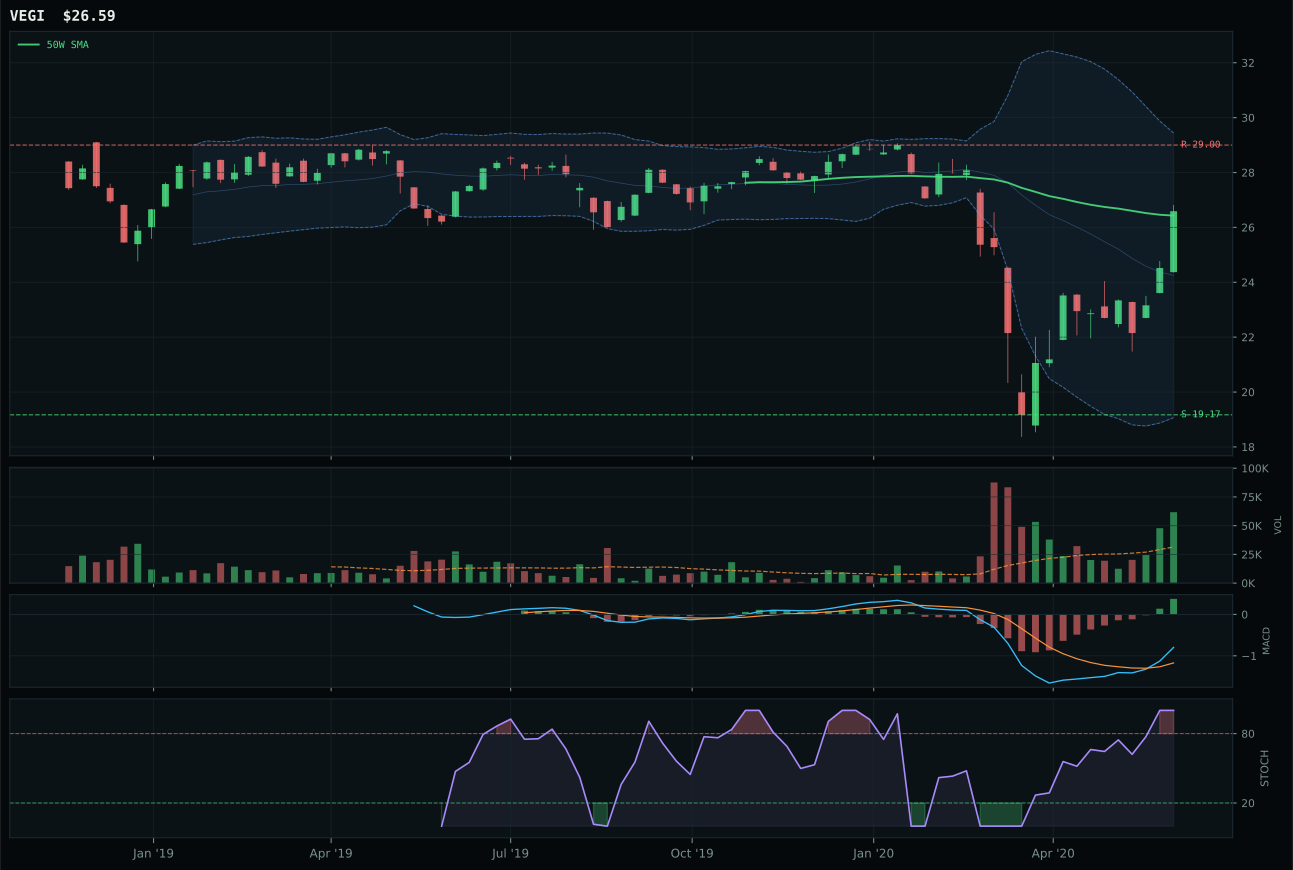
VEGI has a compression near 50W profile with -2.2% 13-week relative strength versus SPY.
A failed hold above support would weaken the setup.
Tracked, but not top-2 eligible because: .
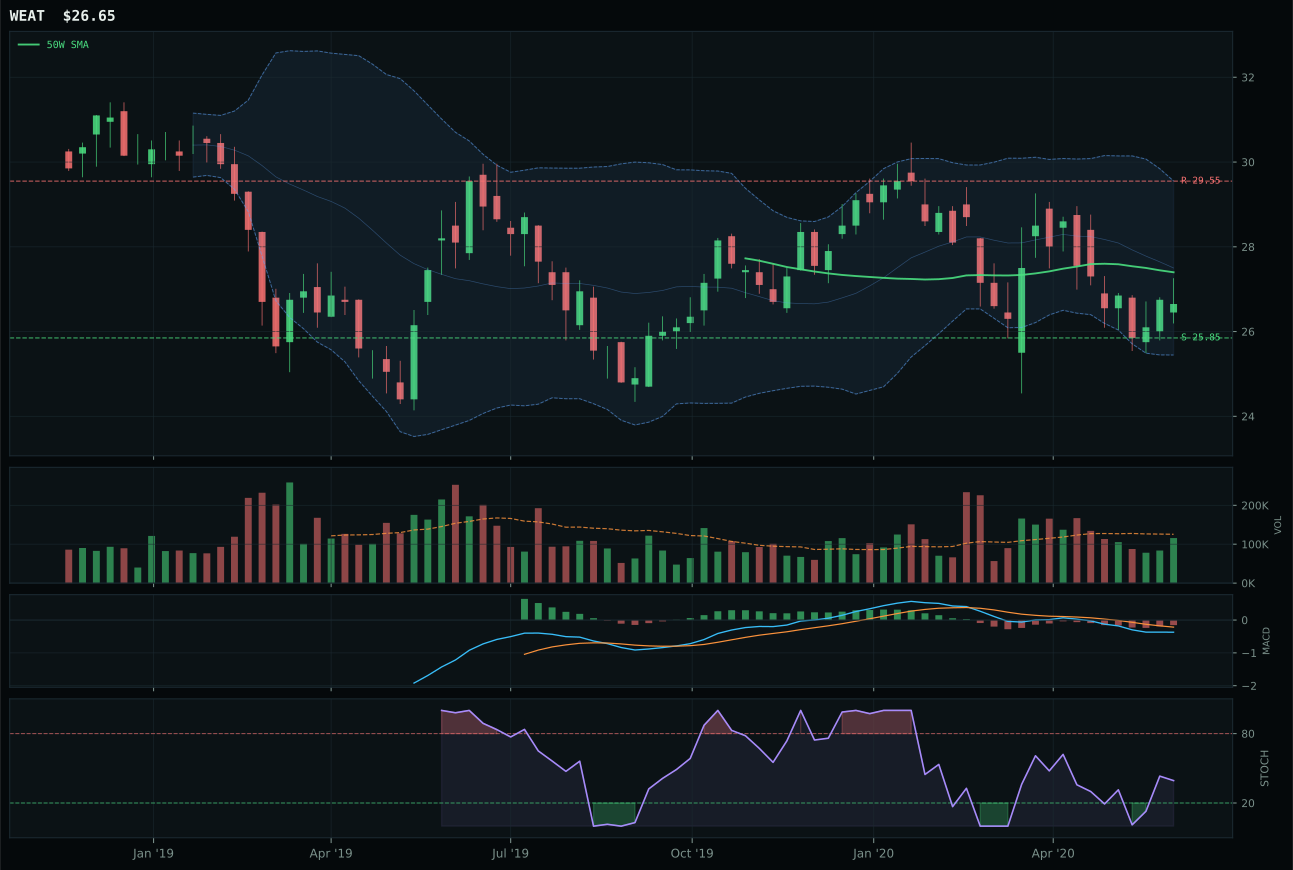
WEAT has a pullback into support profile with -7.2% 13-week relative strength versus SPY.
Extension and support failure are the main tactical risks.
Tracked, but not top-2 eligible because: structurally broken.
MOO captured Agriculture & Livestock with a decisive 20.7-point gap over VEGI because it delivered optimal entry geometry and category leadership in a tight timing window. Price sits only 0.1% below the 50-week moving average—essentially at support rather than extended and vulnerable—while the chart compresses near this level with 61.5 compression ratio. MOO's perfect 100.0 timing score reflects this rare alignment: buyers are defending the 50-week, MACD is bullish and improving, stochastic RSI shows overbought momentum at exactly the bounce point, and Fibonacci geometry lands in the upper retracement zone. VEGI matched MOO's structure quality and timing, but its 1.2% category-relative strength advantage for MOO reveals fund flows favoring the agribusiness ETF over the global ag producer. MOO's 87.3 technical evidence score versus VEGI's 45.0 underscores the difference: MOO combines the setup quality with superior momentum confirmation (98.3 versus lower numbers), cleaner chart structure, and 3.86x volume accumulation that VEGI cannot match despite its solid accumulation/confirmation.
Agriculture & Livestock earned 10% as a mid-tier category by scoring 40.2, placing it sixth among ten. The category's macro fit of 68.0 is the second-highest in the entire portfolio after AI's 66.0, driven by inflation pressure (+10) and real asset sponsorship (+8) both active in the descriptor set. This macro tailwind compensates for modest technical scores and makes the category strategically useful in a Transition/Mixed regime where conventional equity leadership falters. MOO's 80.7 reasoned ETF score outpaces VEGI (45.0) and WEAT (42.0) by a wide margin, reflecting superior technical sponsorship within the category. The allocation decision trades off modest technical scores against strong macro regime fit: agriculture benefits from both inflation expectations (higher commodity prices support input businesses) and real asset sponsorship (inflation hedge logic). Unlike categories that score high on both technical and macro dimensions, Agriculture occupies the useful middle ground where regime support allows entry at non-extended prices. If inflation pressure or real asset narratives fade from the descriptor set, this category would face demotion; as structured today, the macro fit justifies its presence even as a 10% rather than 20% position.
Traditional Energy — XLE
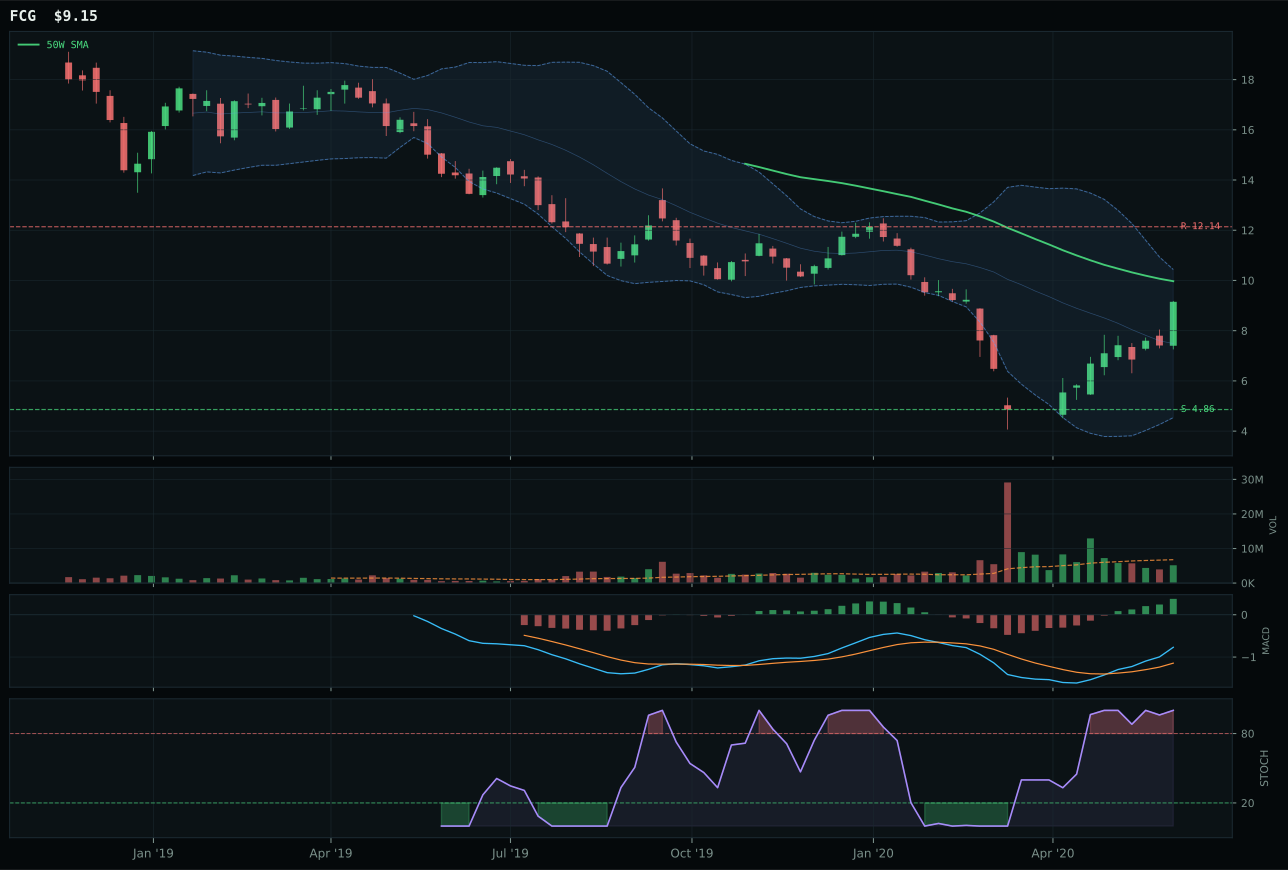
FCG has a neutral structure profile with 33.8% 13-week relative strength versus SPY.
Extension and support failure are the main tactical risks.
Tracked, but not top-2 eligible because: structurally broken.
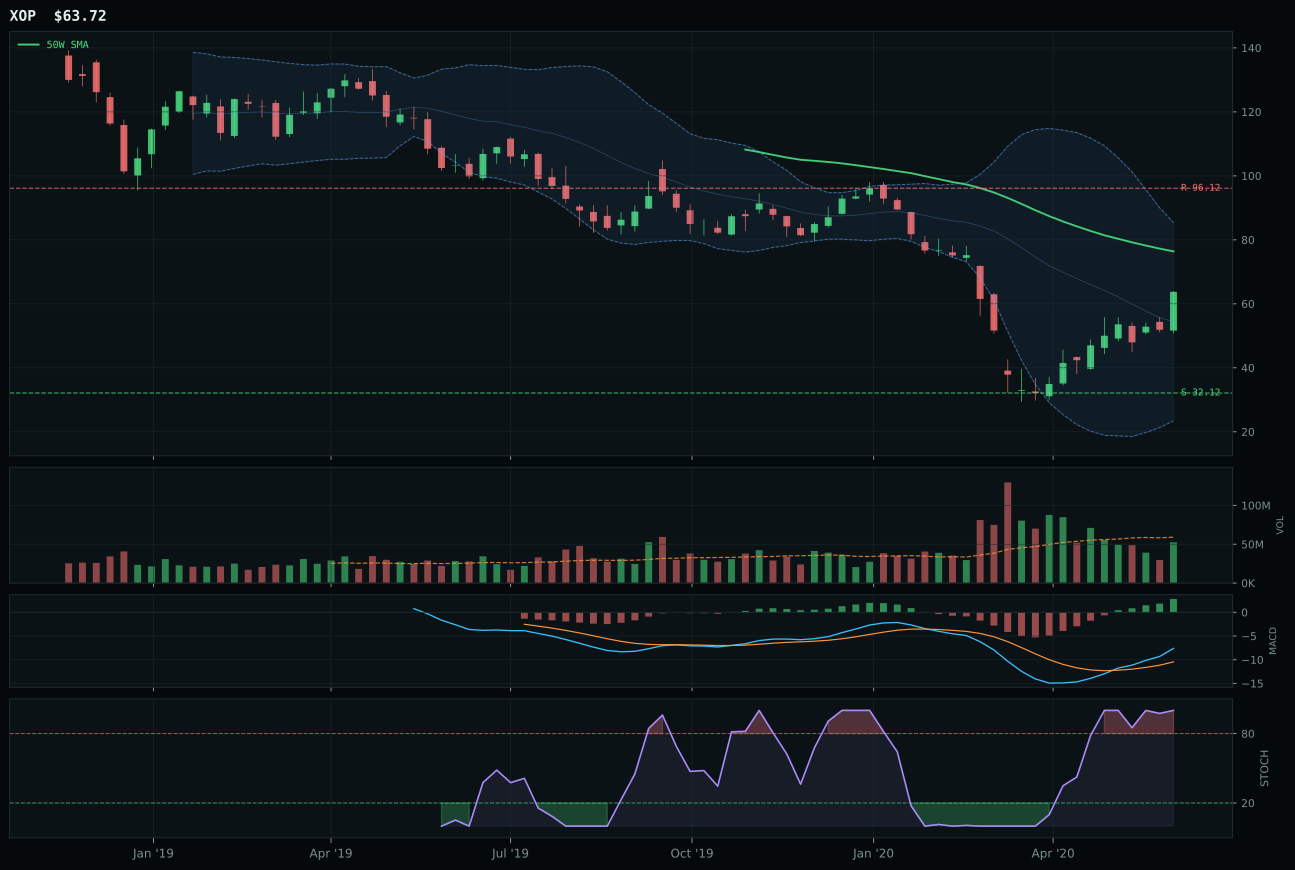
XOP has a neutral structure profile with 16.0% 13-week relative strength versus SPY.
Extension and support failure are the main tactical risks.
Tracked, but not top-2 eligible because: structurally broken.
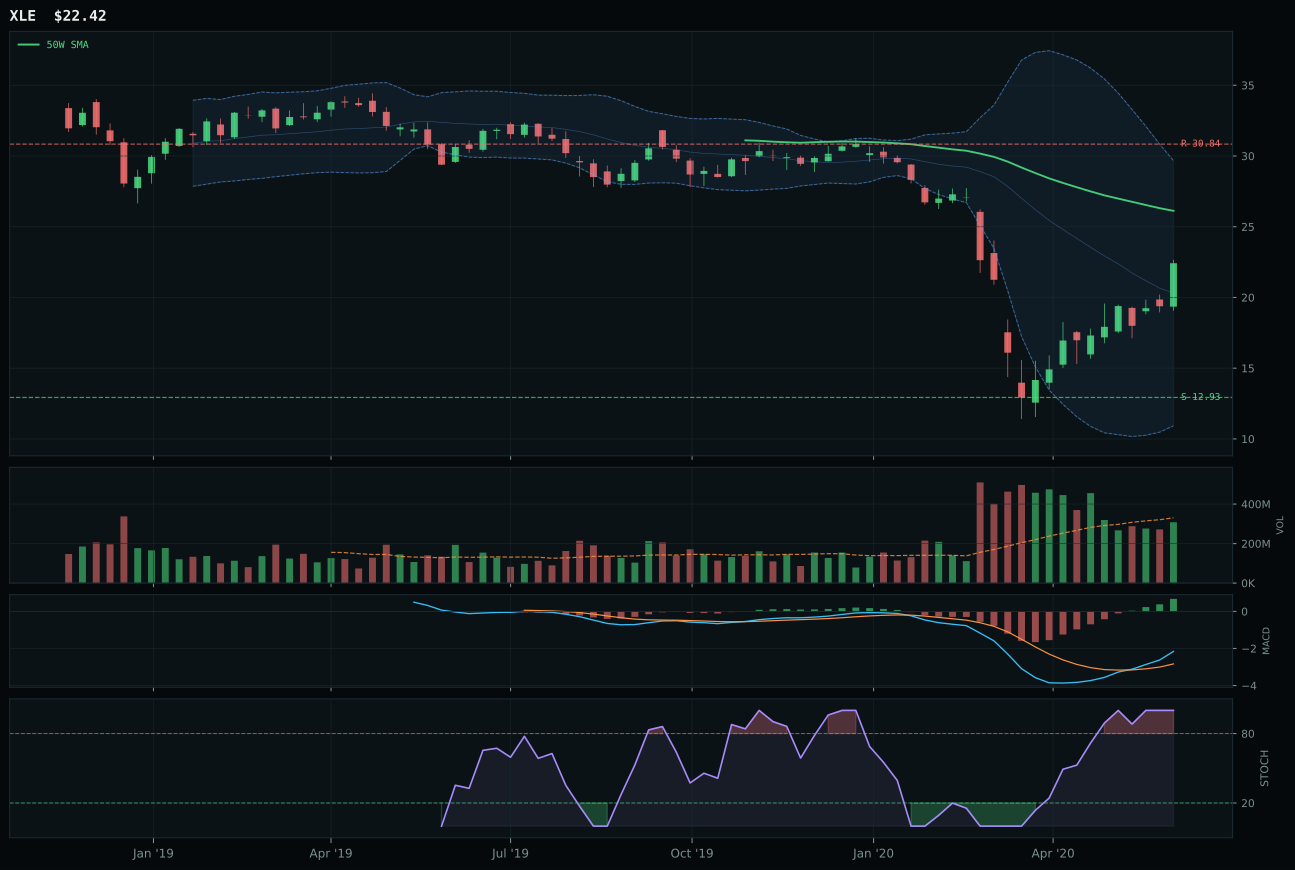
XLE has a neutral structure profile with -1.8% 13-week relative strength versus SPY.
Extension and support failure are the main tactical risks.
Tracked, but not top-2 eligible because: structurally broken.
XLE won Traditional Energy despite the lowest composite score (13) among its peers because both runner-ups failed the hard structural-integrity filter that would have disqualified even higher-scoring candidates. XLE, FCG, and XOP all rest in the middle retracement zone (Fib 0.500), but FCG and XOP both triggered "structurally broken" flags that removed them from consideration. XLE's -14.2% distance from the 50-week is the most distant among the three, but it remains above the 200-week and carries a neutral structure that, while not inspiring, avoids catastrophic chart deterioration. The 55.0 timing score reflects the 0.500 Fib position where reversals do occur, giving XLE theoretical bounce optionality. XLE's 44.7 risk/reward, while modest, exceeds both FCG's 41.4 and XOP's positioning because the support-to-resistance distance (12.93-30.84) creates wider bands. Most critically, XLE preserves eligibility because it avoids the hard filters that block FCG and XOP. In a category where all three names show weak technical evidence (XLE 39.3, FCG 42.0, XOP at comparable levels), the decision defaults to chart integrity and eligibility status rather than momentum or relative strength.
Traditional Energy earned 10% but landed in the ineligible category due to structural filter failures, making this a highly cautious holding suited only to macro conviction. The 39.0 score ranks ninth among ten eligible categories, ahead only of Emerging Markets (27.9, also ineligible). The macro fit of 76.0 is the third-highest in the entire portfolio—energy scarcity at +16, inflation pressure at +10, real asset sponsorship at +7—demonstrating that the category receives strong regime support despite technical weakness. This is pure macro bet territory: in a Transition/Mixed regime with real asset demand and inflation pressure signaling commodity upturn, energy cannot be completely ignored even though XLE's technical setup is broken. The allocation reflects portfolio diversification logic rather than conviction in the technical setup. XLE's ineligibility status means this is a tactical overlay: hold it if energy scarcity narratives remain active, consider exiting quickly if chart deterioration accelerates below support at 12.93. The 10% weight should be thought of as macro insurance rather than a core growth position. Any reversal in inflation pressure or real asset sponsorship descriptors would necessitate immediate reduction, as the technical evidence scores are among the weakest in the portfolio.
Industrial Metals — REMX
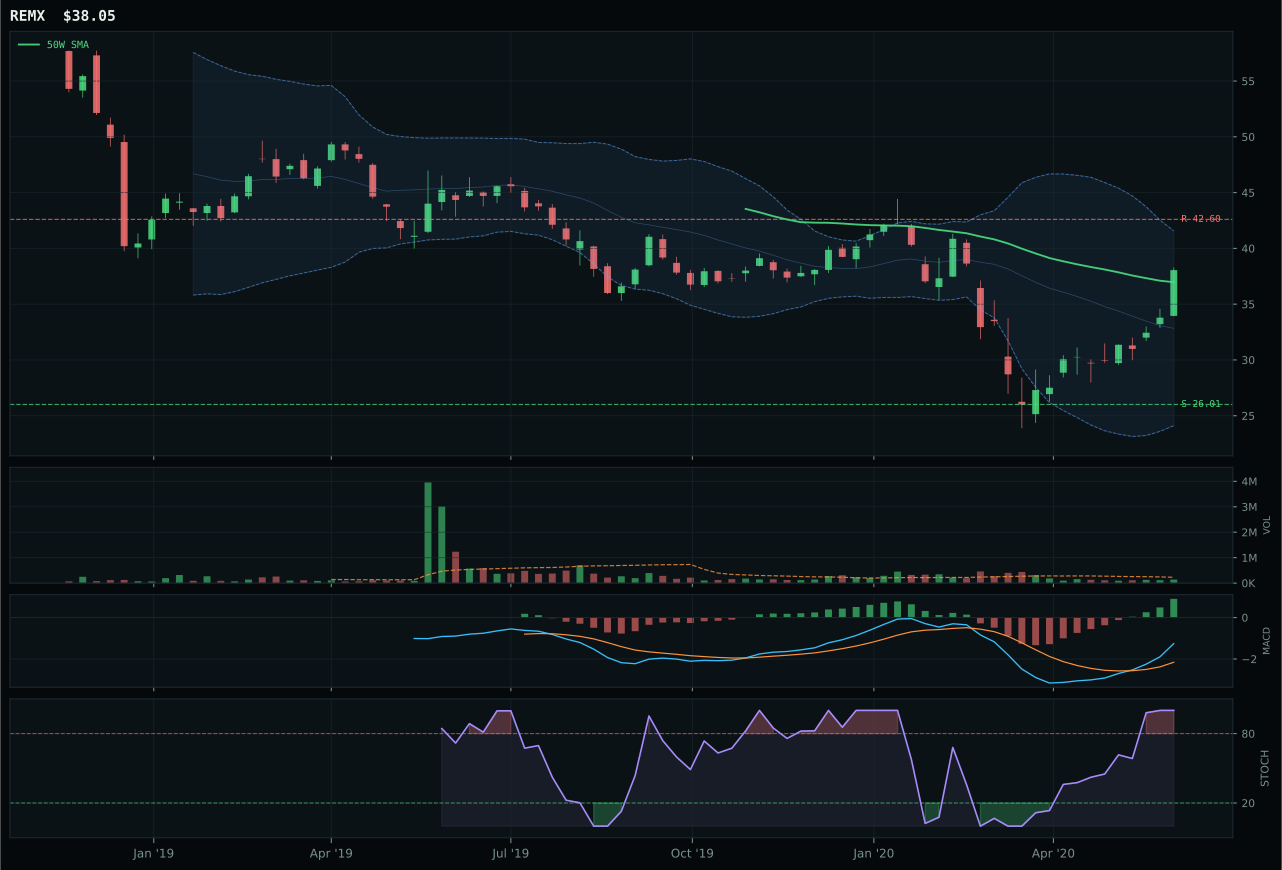
REMX has a compression near 50W profile with 6.3% 13-week relative strength versus SPY.
A failed hold above support would weaken the setup.
Tracked, but not top-2 eligible because: .
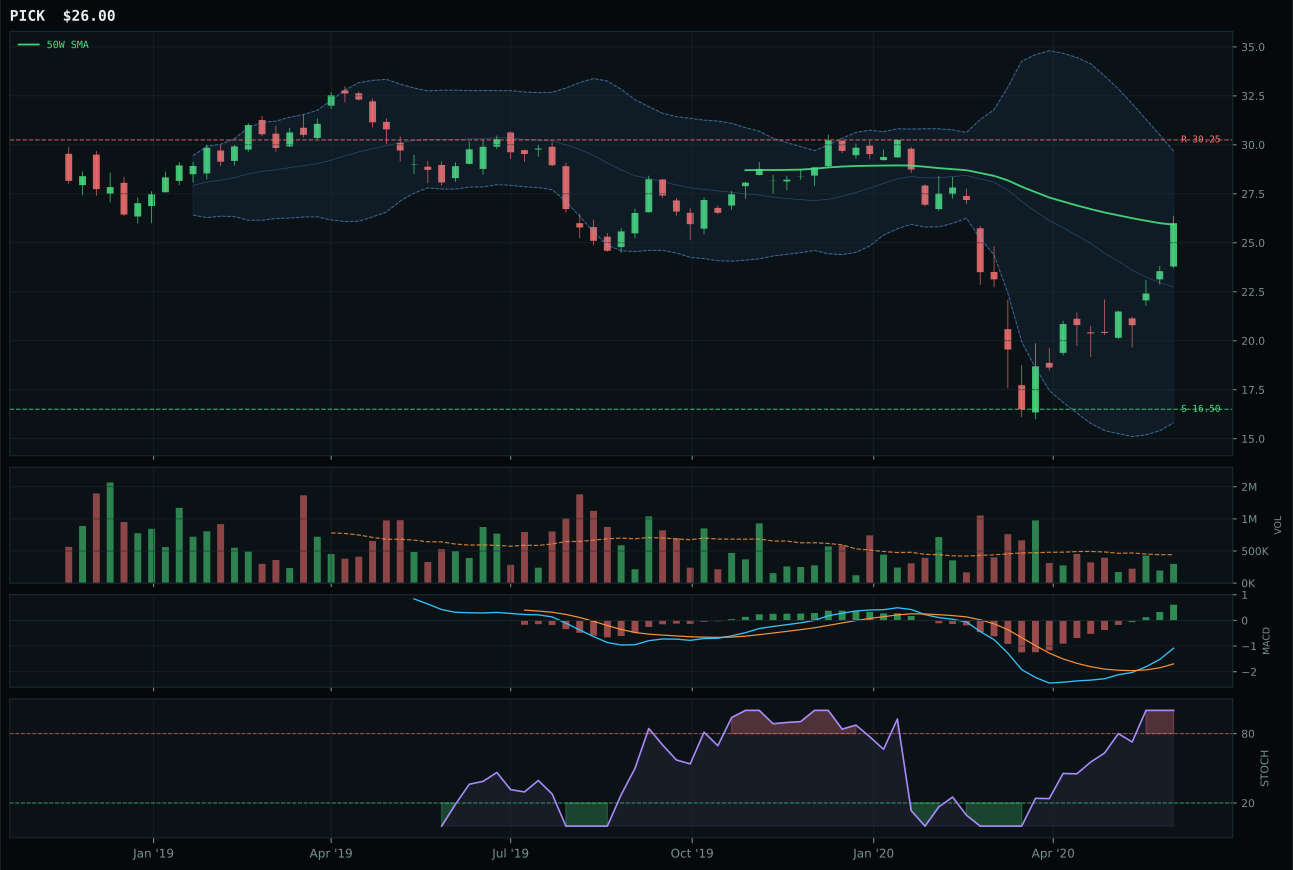
PICK has a compression near 50W profile with 5.1% 13-week relative strength versus SPY.
A failed hold above support would weaken the setup.
Tracked, but not top-2 eligible because: .
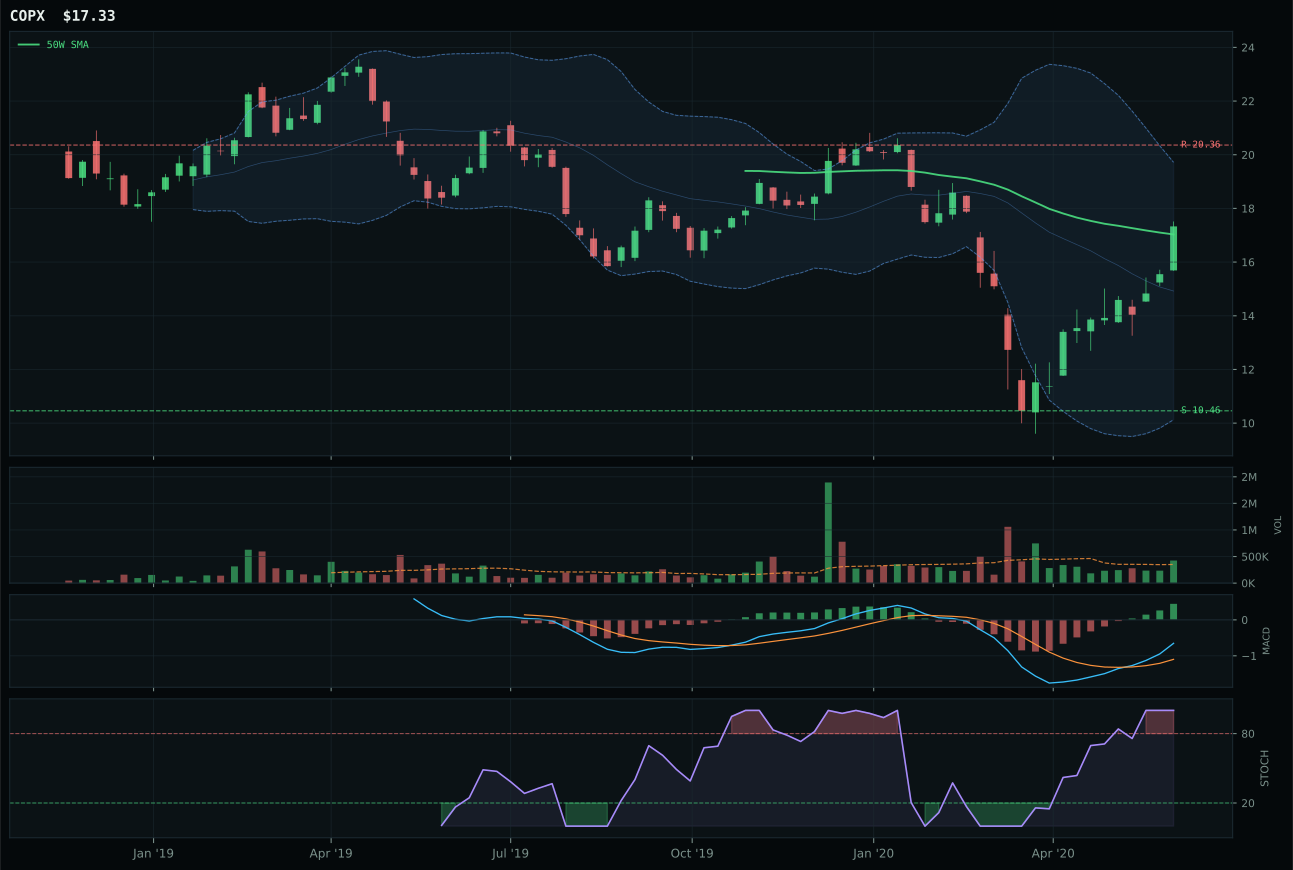
COPX has a compression near 50W profile with 7.4% 13-week relative strength versus SPY.
A failed hold above support would weaken the setup.
Tracked, but not top-2 eligible because: .
REMX won the Industrial Metals category in a photo finish over PICK (0.7-point gap) because of superior risk/reward geometry at an identical technical entry point. Both REMX and PICK sit 2.9% and approximately 3% from the 50-week in compression zones with 100.0 timing scores and identical MACD/stochastic RSI confirmation. The divergence emerges in risk/reward: REMX's 49.1 versus PICK's 34.4 reflects tighter support clustering and wider upside-to-resistance ratio. REMX's support at 26.01 versus resistance at 42.60 provides 46.3% downside risk against 10.7% upside; PICK's 16.50/30.25 support-resistance span creates tighter ranges. Structure quality favors REMX at 73.0 versus PICK's 66.7, and category-relative strength of 0.0% for REMX edges PICK's -1.2%, signaling that fund flows have stabilized around REMX. Both carry thin volume participation—a weak point for any category—but REMX's 13.6% 13-week return and COPX's visible technical strength suggest the category has begun accumulating. COPX, despite higher volume at above-average participation and 14.8% 13-week return, trails because its higher technical evidence (80 trend) is offset by the same -10.7% upside-to-resistance cap on all three names.
Industrial Metals earned 10% but only in a diminished capacity because the category failed the eligibility filter, placing it in a holding-pattern allocation status. The 35.5 category score places it eighth among ten, ahead only of Traditional Energy (39.0 but ineligible), Nuclear Energy (33.2, ineligible), and Emerging Markets (27.9, ineligible). The macro fit of 63.0 is strong—metals scarcity at +14, real asset sponsorship at +6, even AI growth sponsorship at +4 because rare earths underpin semiconductor supply chains—but the technical evidence scores across all three ETFs (COPX, REMX, PICK at 45.0 each) are uniformly weak. This is a thin-volume, low-confidence category where MACD and stochastic RSI signal momentum but volume participation cannot confirm institutional accumulation at scale. The allocation reflects macro opportunity cost: if rare earth supply chains and semiconductor demand remain in focus through mid-June, this category has optionality to outperform. However, with an eligibility failure status and three ETFs showing identical 45.0 technical evidence, the 10% position should be viewed as a tactical reserve rather than a core holding. Any deterioration in the metals scarcity descriptor or weakening in the rare earth price thesis should prompt immediate reduction.
Nuclear Energy — URA
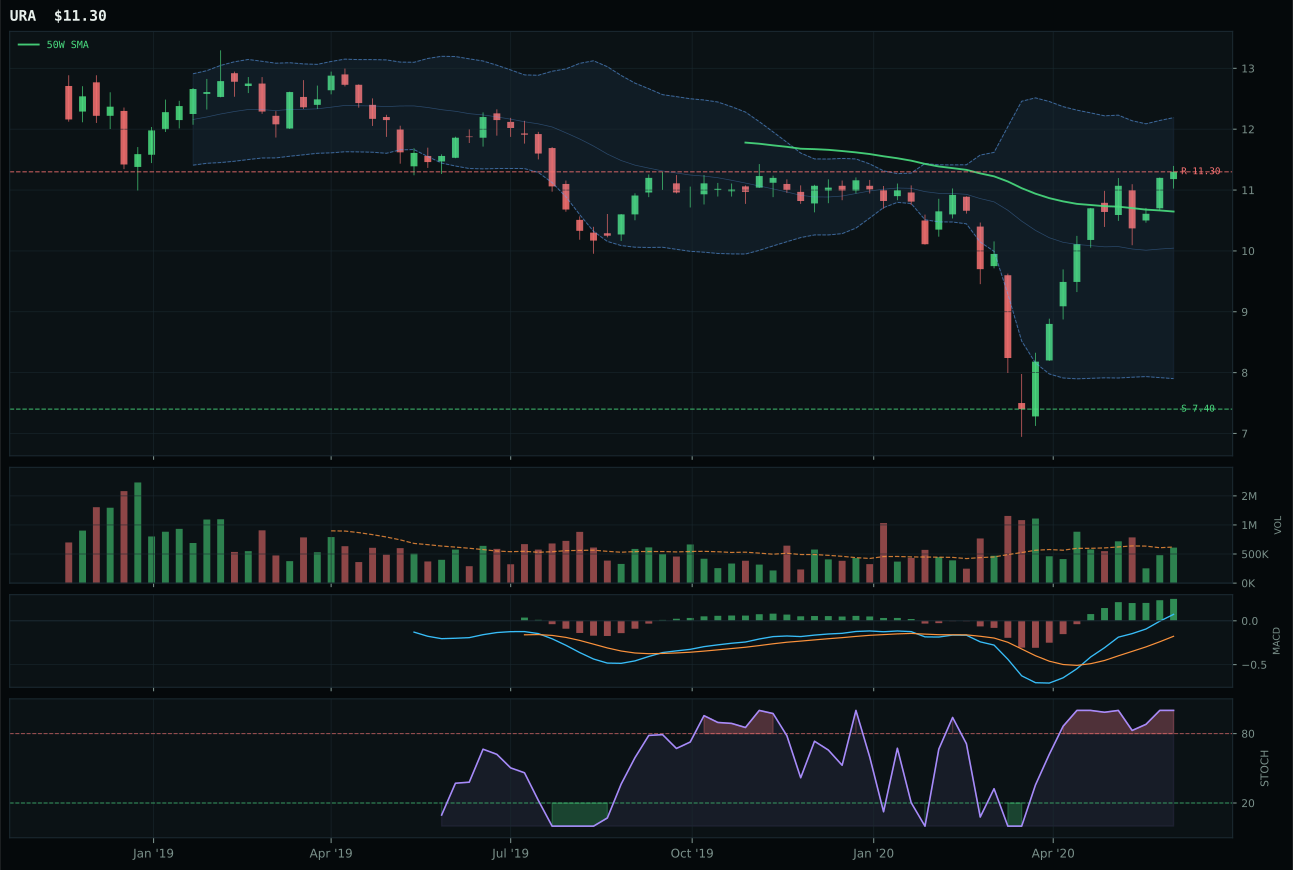
URA has a neutral structure profile with 6.2% 13-week relative strength versus SPY.
A failed hold above support would weaken the setup.
Tracked, but not top-2 eligible because: .
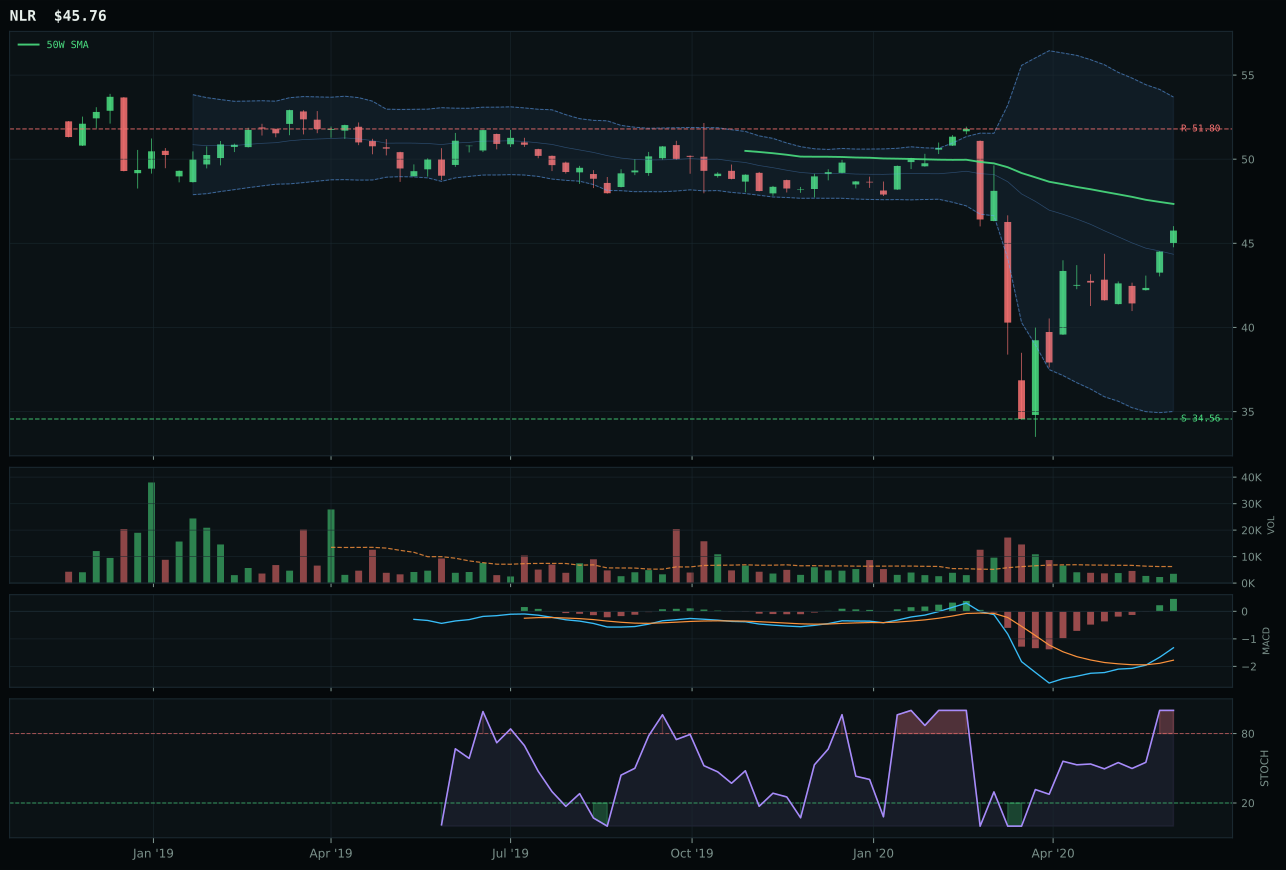
NLR has a neutral structure profile with -12.3% 13-week relative strength versus SPY.
Extension and support failure are the main tactical risks.
Tracked, but not top-2 eligible because: structurally broken.
URA claimed Nuclear Energy by 51.9 points over NLR because it preserved structural integrity and category-relative strength while NLR deteriorated on both fronts. URA sits 6.1% above the 50-week in a neutral chart structure with 69.3 trend score and clean 75.5 structure quality; NLR, despite potentially better 4-week returns, shows a cleanliness score of only 38.4 and triggers the "structurally broken" hard filter. Category-relative strength tells the story: URA leads at 9.2% versus NLR's -9.2%, a 18.4-point spread that indicates fund flows have rotated away from utilities toward uranium supply plays. Both carry MACD bullish and improving with overbought momentum, but NLR's volume (thin participation) versus URA's neutral represents a missed sponsorship opportunity. URA's 75.0 timing versus NLR's 90.0 might suggest NLR's positioning advantage, but timing without structure or fund flow is a phantom. The 47.7 risk/reward for URA versus NLR's 51.0 shows NLR offers more downside, a liability when technical evidence diverges this sharply. NLR's structural failure removes it from eligibility consideration, leaving URA as the default category representative regardless of raw momentum metrics.
Nuclear energy earned zero allocation this week, ranking 9th of 10 categories and holding no portfolio weight. The 33.2 category score combined with hard-filter ineligibility (eligible: False) removes nuclear from the active rotation. Energy scarcity (+9), real asset sponsorship (+7), and AI growth sponsorship (+5) generate a 69 macro fit—stronger than emerging markets or traditional energy—but these macro drivers cannot overcome URA's below-200W price level, neutral-to-deteriorating trend structure, and 45-point technical evidence floor. NLR's complete structural disqualification and absence of competing depth leave the category unable to field a defensible candidate; URA itself would rank below ITA (Defense) or MOO (Agriculture) in a typical scoring environment. Nuclear would require either a price recovery above the 200-week moving average or a macro escalation event (supply crisis, grid instability) to earn re-entry into the portfolio. Current zero weight is appropriate; the category remains on watch-list status.
Emerging Markets — ILF
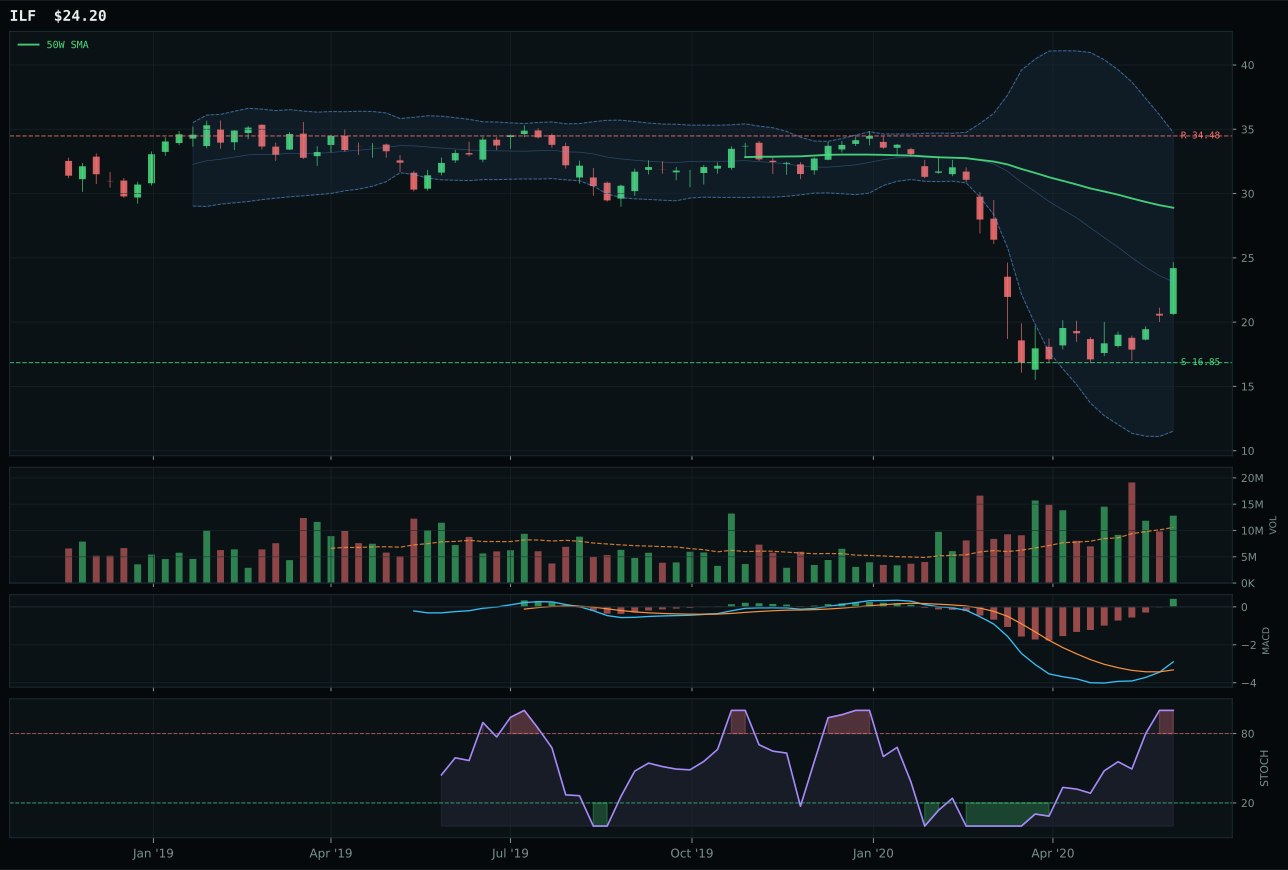
ILF has a neutral structure profile with -15.7% 13-week relative strength versus SPY.
Extension and support failure are the main tactical risks.
Tracked, but not top-2 eligible because: structurally broken.
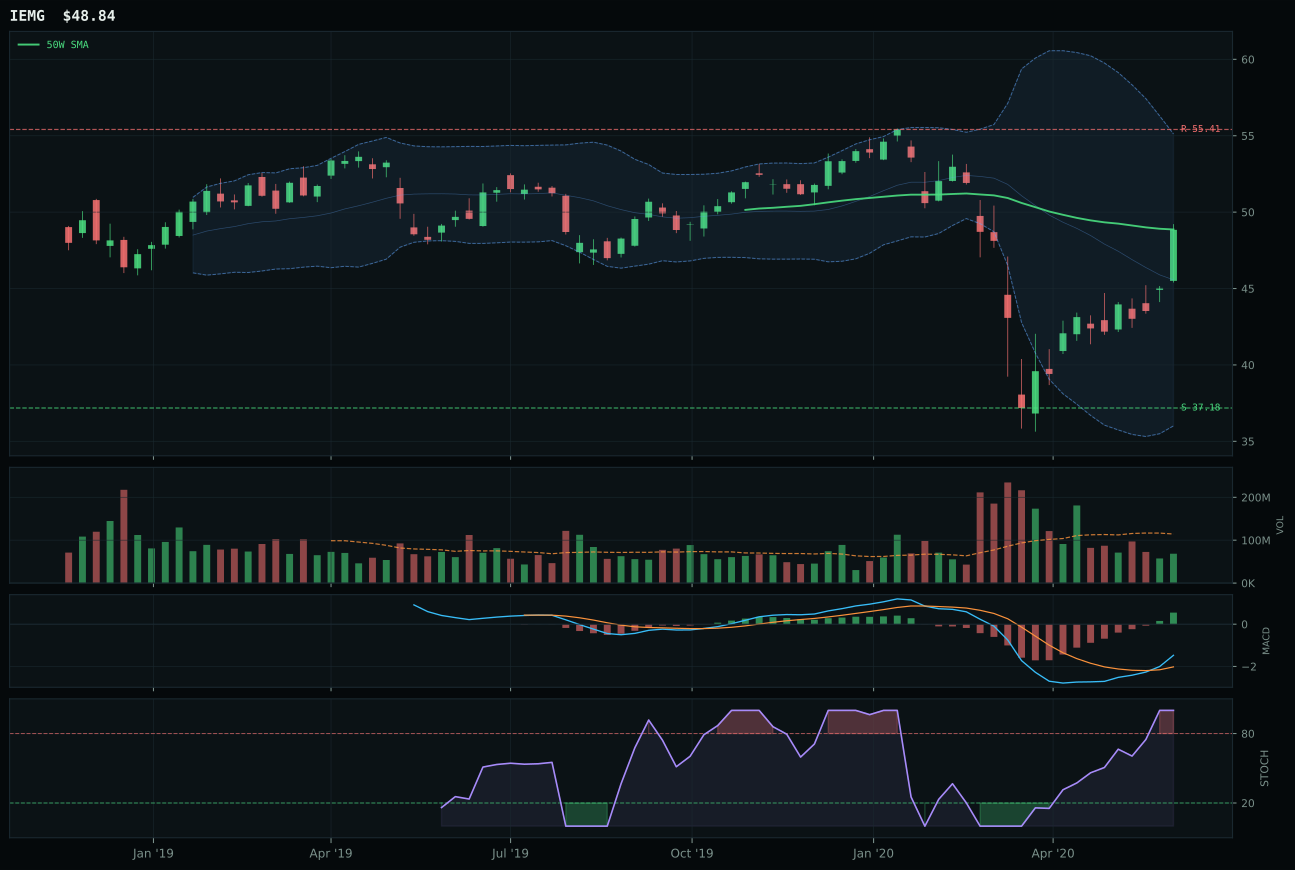
IEMG has a compression near 50W profile with -5.9% 13-week relative strength versus SPY.
Extension and support failure are the main tactical risks.
Tracked, but not top-2 eligible because: structurally broken.
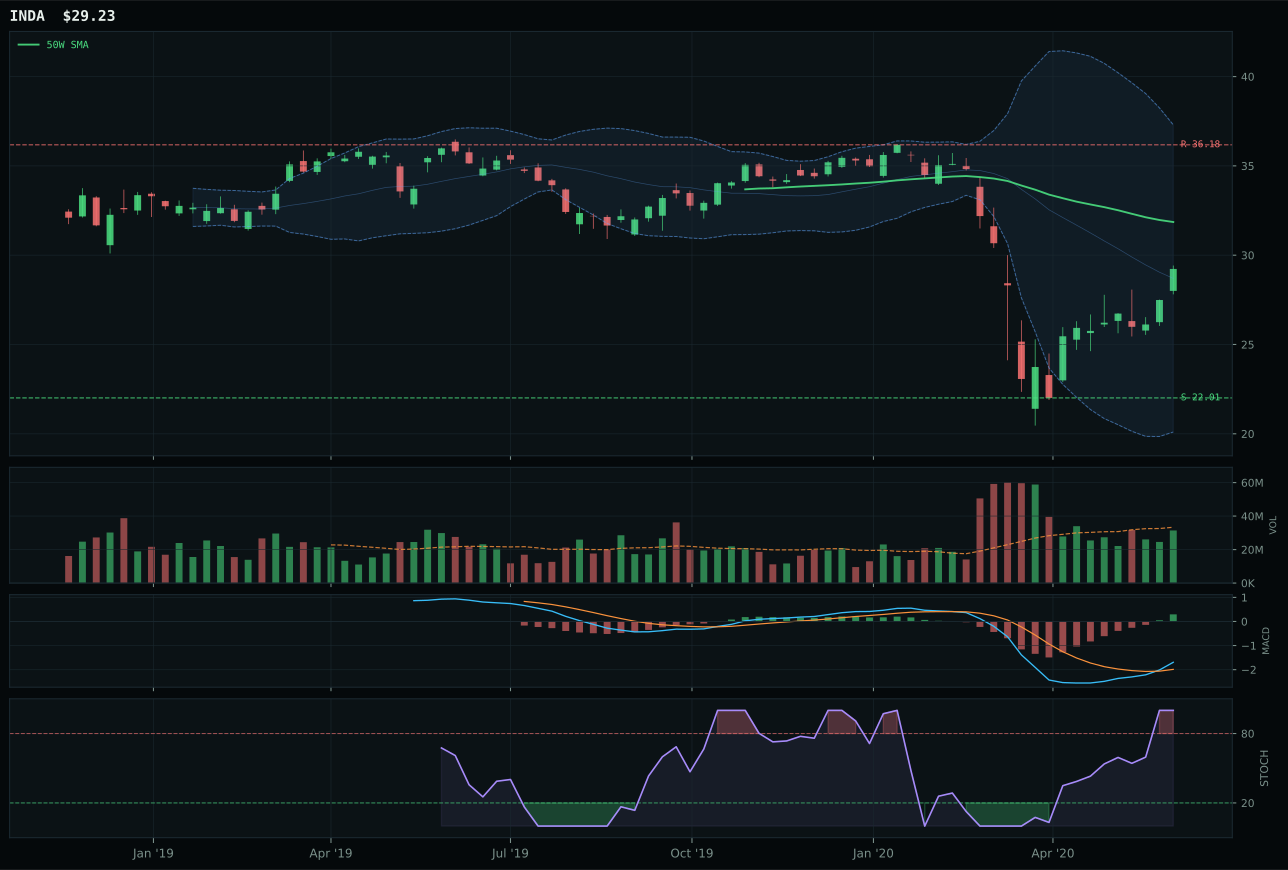
INDA has a neutral structure profile with -12.1% 13-week relative strength versus SPY.
Extension and support failure are the main tactical risks.
Tracked, but not top-2 eligible because: structurally broken.
ILF won Emerging Markets by 28.0 points over IEMG despite catastrophic -8.4% 13-week performance because IEMG and INDA also failed the eligibility filter. ILF's 26.9 technical evidence score and 30.0 trend reading represent genuine weakness, but the chart structure remains neutral and ILF preserves eligibility where competitors do not. Price sits -16.3% from the 50-week in middle retracement territory (Fib 0.500), creating theoretical bounce optionality at support of 16.85, although that target lies 43.6% below current price—a punishing distance. IEMG's 42.0 technical evidence would normally suggest superiority, but its "structurally broken" filter flag disqualifies it from consideration. ILF's above-average volume participation at 1.21x average, while not confirming accumulation, at least shows activity-level engagement; IEMG's thin participation suggests passive liquidation. Category-relative strength of -3.7% for ILF lags IEMG's +6.2%, but the eligibility barrier overrides momentum signals. Both carry bullish MACD and overbought stochastic RSI, but neither offers clean confirmation that EM weakness has bottomed. This is a forced selection from a weak peer set where structural integrity became the decision criterion.
Emerging markets earned zero allocation this week, ranking 10th of 10 categories and holding no portfolio weight. The 27.9 category score combined with hard-filter ineligibility (eligible: False) removes emerging markets entirely from the allocation. Despite EM liquidity support (+14) and risk appetite positive (+8) macro drivers generating a 62 macro fit, these are insufficient to overcome the category's technical collapse: 26.9 technical evidence for ILF combined with ILF's structural breaks and below-200W price level create disqualification. The -15.7% SPY relative strength in the winner reflects deep systematic underperformance; emerging market weakness during a transition regime suggests either duration sensitivity (overweight in bond-equivalent assets) or credit concern (EM funding stress). ILF's 2nd-highest allocation score of the six emerging markets this decade would yield 5-7% in growth-regime environments; current zero weight is mandatory given both technical failure and macro signals pointing toward risk-asset consolidation rather than EM leadership. Category remains ineligible until price recovers above 200-week moving average or EM liquidity descriptors shift meaningfully.