
2020-05-29
Informational purposes only. The content in this report, including allocations, analysis, and commentary, is provided solely for informational and educational purposes. It does not constitute financial advice, investment advice, trading advice, or any other type of advice. Past performance does not guarantee future results. Always conduct your own research and consult a qualified financial professional before making investment decisions.
Some tracked tickers were excluded due to missing live weekly price data: SGOV: Historical cache SGOV has only 0 usable weekly bars; URNM: Historical cache URNM has only 26 usable weekly bars
Weekly Allocation
| Ticker | Category | Weight | Role |
|---|---|---|---|
| CIBR | Technology | 20% | Top-2 (20%) |
| SLV | Precious Metals | 20% | Top-2 (20%) |
| BOTZ | AI | 10% | Tier-2 (10%) |
| IGF | Utilities & Infrastructure | 10% | Tier-2 (10%) |
| URA | Nuclear Energy | 10% | Tier-2 (10%) |
| XLE | Traditional Energy | 10% | Tier-2 (10%) |
| IEMG | Emerging Markets | 10% | Tier-2 (10%) |
| XAR | Defense & Aerospace | 10% | Tier-2 (10%) |
Trade Instructions — Monday Open
Sell the tranche from 2020-05-01 (completing its 4-week hold). Buy the new tranche. Instructions show net portfolio changes — same-asset positions cancel, weight changes show the delta.
| Action | Ticker | Instruction |
|---|---|---|
| SELL | IGV | Sell 25% of IGV position (reduce 20.00% → 15.00%) |
| SELL | BOTZ | Sell 14% of BOTZ position (reduce 17.50% → 15.00%) |
| SELL | GDX | Sell entire GDX position (2.50% of portfolio) |
| SELL | INDA | Sell 50% of INDA position (reduce 5.00% → 2.50%) |
| SELL | FCG | Sell 33% of FCG position (reduce 7.50% → 5.00%) |
| SELL | ITA | Sell entire ITA position (2.50% of portfolio) |
| BUY | XAR | Buy XAR — 14.29% of freed cash (adds 2.50% to portfolio) |
| BUY | SLV | Buy SLV — 28.57% of freed cash (adds 5.00% to portfolio) |
| BUY | XLE | Buy XLE — 14.29% of freed cash (adds 2.50% to portfolio) |
| BUY | CIBR | Buy CIBR — 28.57% of freed cash (adds 5.00% to portfolio) |
| BUY | IEMG | Buy IEMG — 14.29% of freed cash (adds 2.50% to portfolio) |
Current Portfolio After Trade
Combined holdings across all 4 active tranches. Each tranche is 25% of the portfolio.
| Ticker | % of Portfolio | Weight Bar |
|---|---|---|
| IGV | 15.00% | |
| BOTZ | 15.00% | |
| IGF | 10.00% | |
| XAR | 10.00% | |
| URA | 7.50% | |
| GLD | 7.50% | |
| SLV | 7.50% | |
| FCG | 5.00% | |
| XLE | 5.00% | |
| CIBR | 5.00% | |
| INDA | 2.50% | |
| MOO | 2.50% | |
| NLR | 2.50% | |
| ILF | 2.50% | |
| IEMG | 2.50% |
Macro Regime — Goldilocks
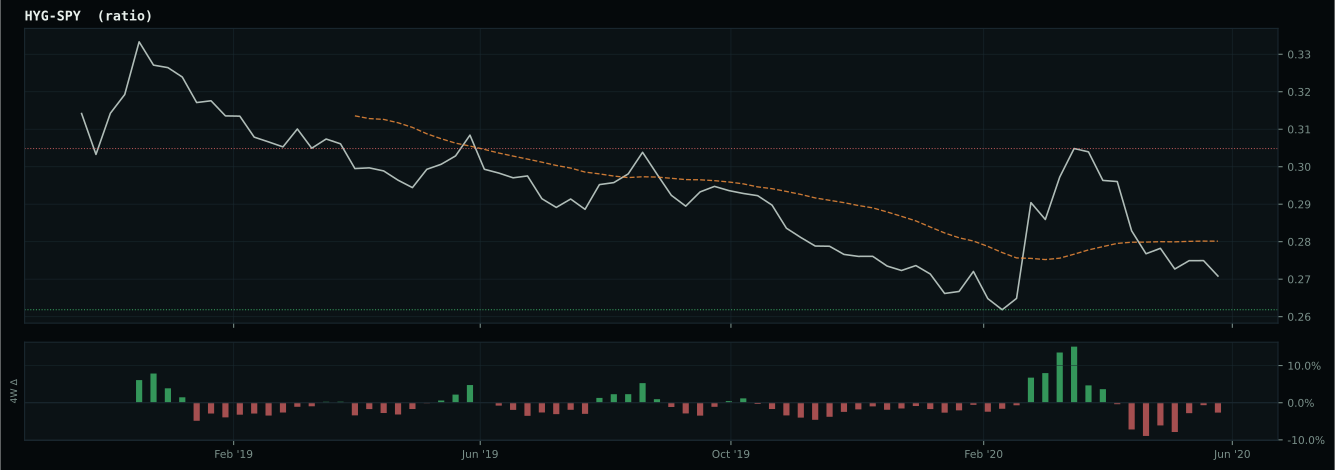
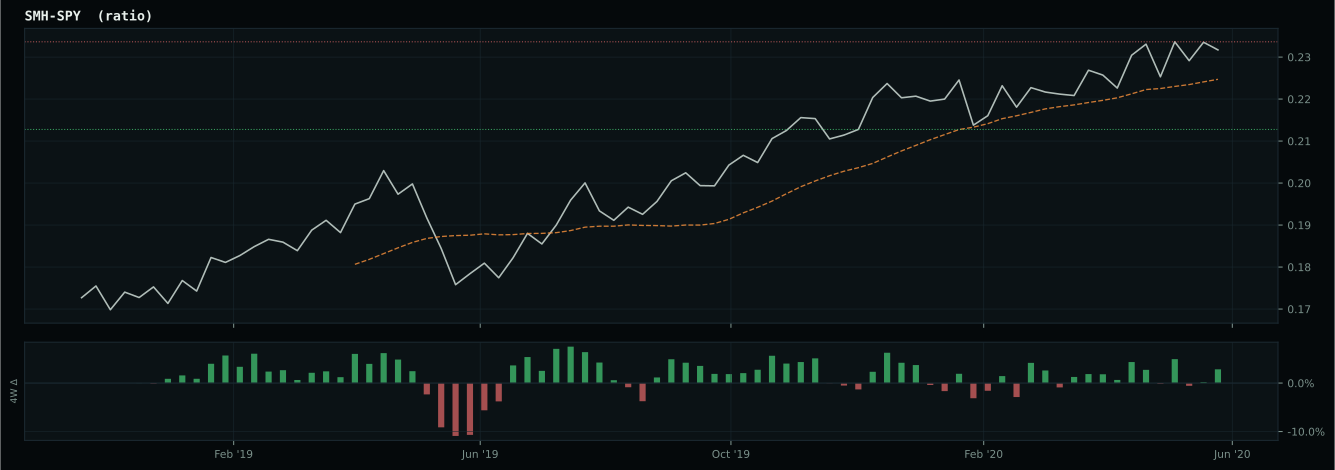
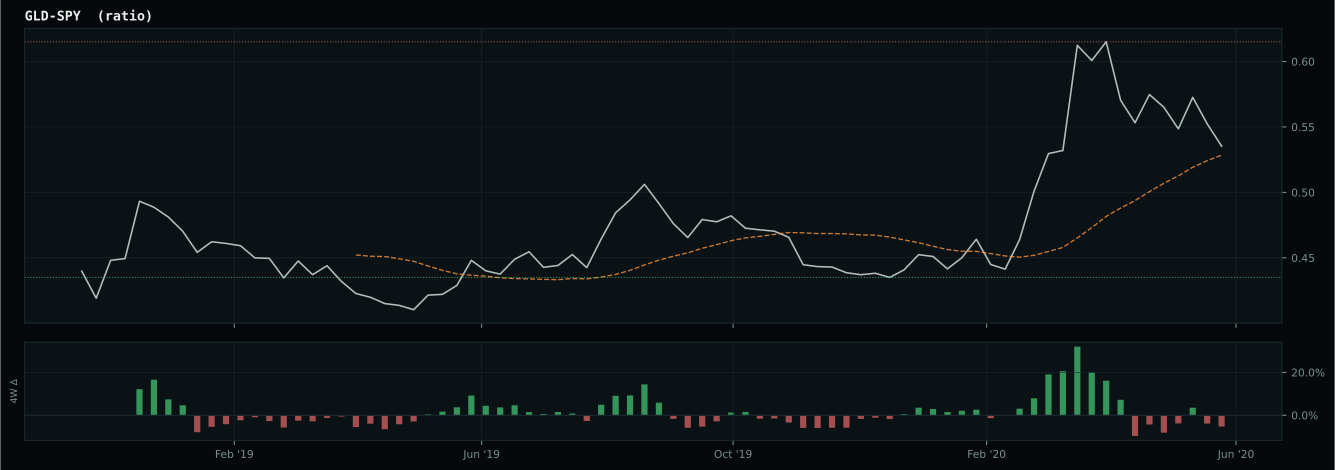
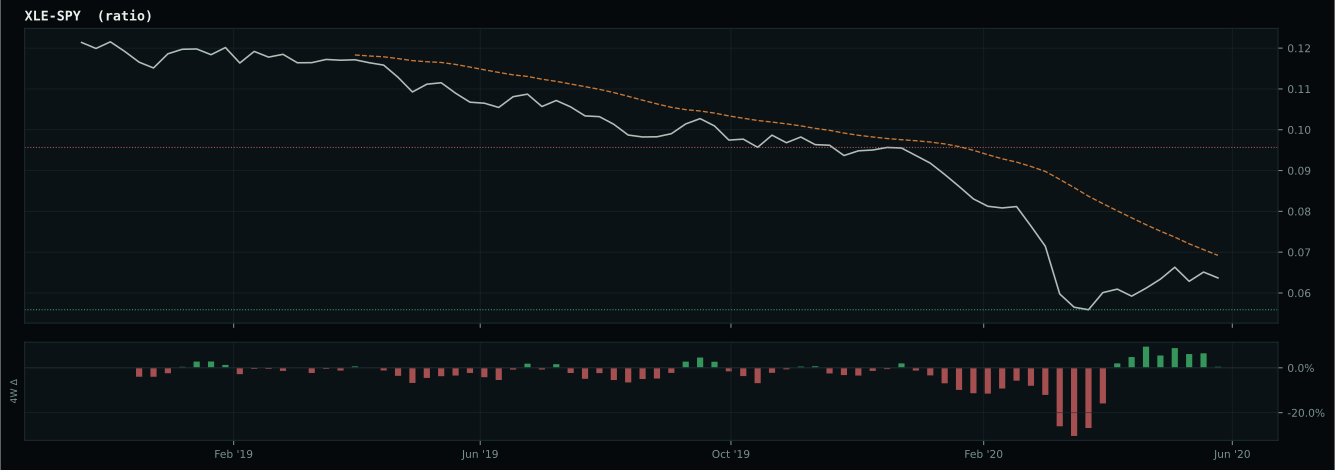
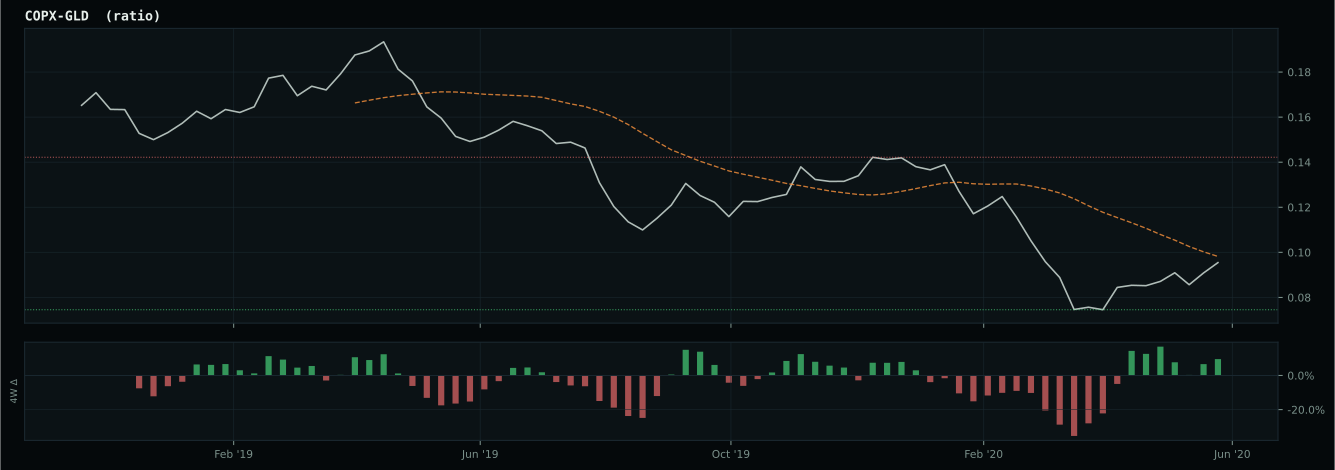
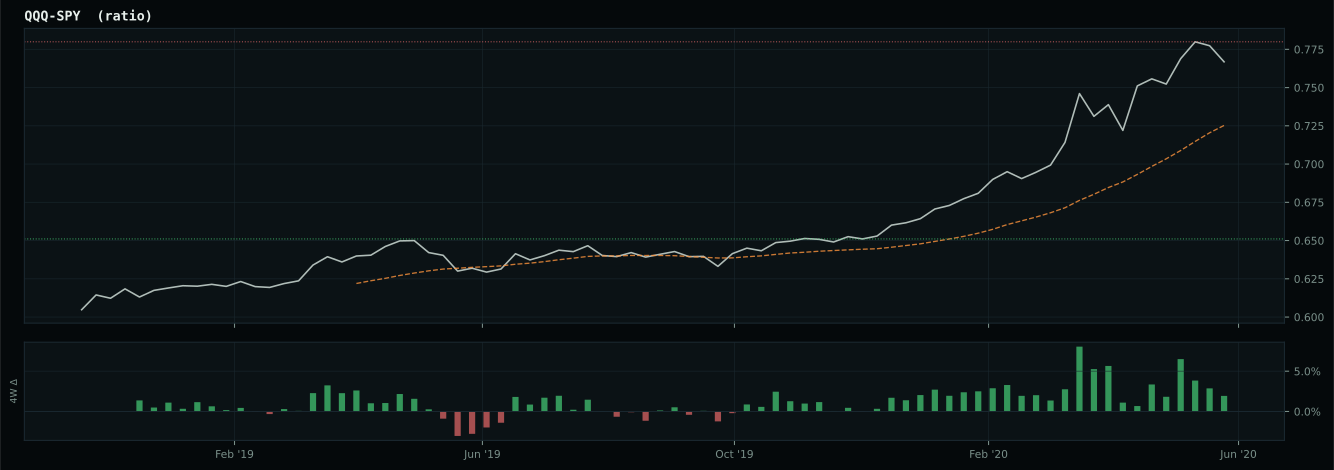
Macro Evidence Charts
Market-implied signals behind the macro regime scores. Each ratio compares two assets; the direction and slope of the ratio is what the macro engine reads.
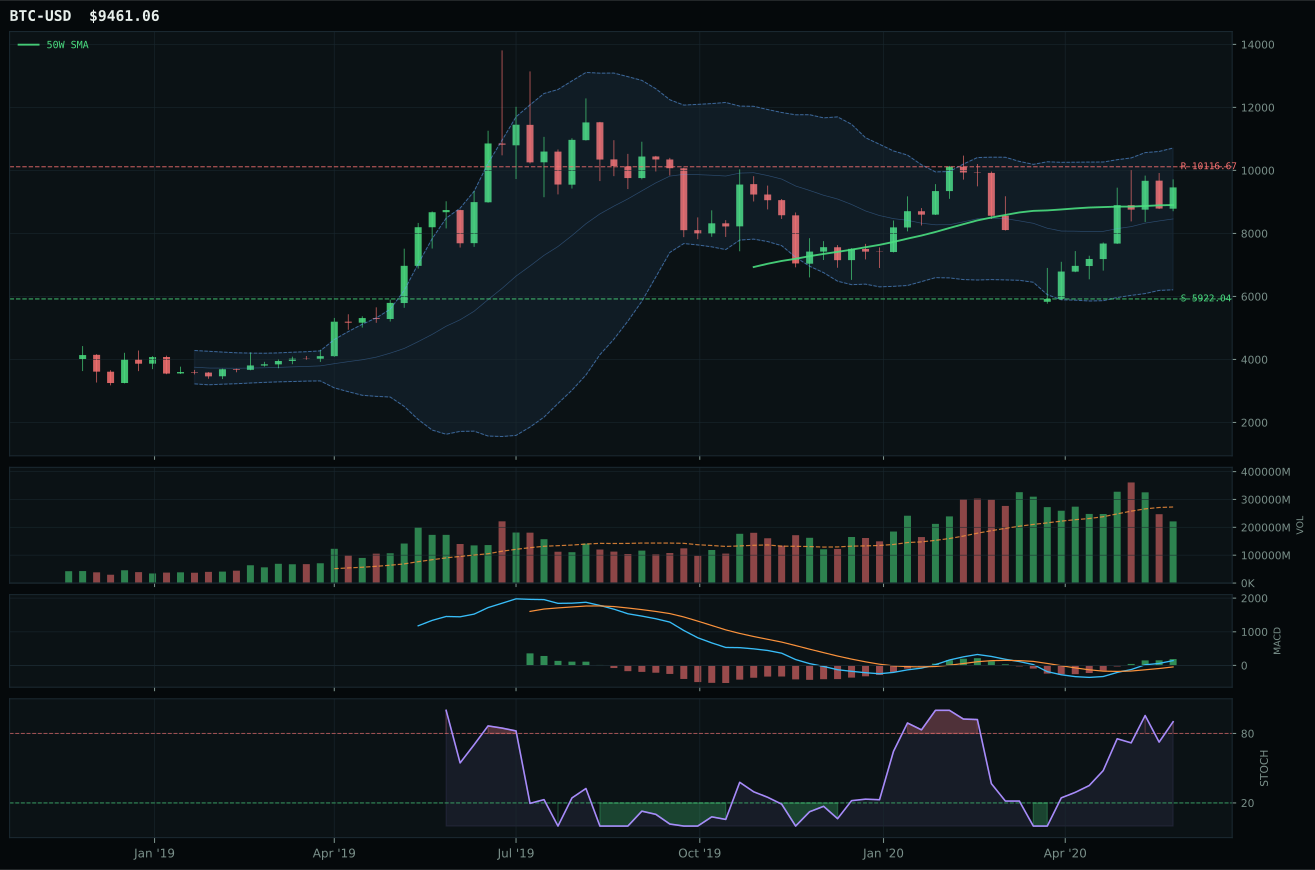
Crypto Regime — NoCrypto
ValueBTC armed by first 200W buy-zone touch, but post-touch range age is 11 weeks; minimum is 12
TrendBTC not confirmed
one or more available conditions failed

Category Rankings
| Rank | Category | Winner | Score | Alloc | 4W Ret | Peers (4W) |
|---|---|---|---|---|---|---|
| 1 | Technology | CIBR | 77.5 | 20% | -0.40% | IGV +4.9% · XLK +4.1% |
| 2 | Precious Metals | SLV | 73.5 | 20% | -1.66% | GDX +2.2% · GLD +2.2% |
| 3 | AI | BOTZ | 69.7 | 10% | +0.56% | SMH +5.1% · AIQ +3.2% |
| 4 | Utilities & Infrastructure | IGF | 32.2 | 10% | -4.01% | XLU -6.8% · PAVE -0.5% |
| 5 | Nuclear Energy | URA | 31.4 | 10% | -4.29% | NLR -6.0% |
| 6 | Emerging Markets | IEMG | 25.8 | 10% | +4.68% | ILF +4.1% · INDA +3.7% |
| 7 | Defense & Aerospace | XAR | 25.6 | 10% | -3.60% | ITA -2.6% · ROKT -9.6% |
| 8 | Industrial Metals | PICK | 20.8 | 10% | +1.51% | REMX -1.6% · COPX +9.1% |
| 9 | Agriculture & Livestock | MOO | 9.7 | 0% | +1.24% | VEGI +0.1% · WEAT -6.8% |
| 10 | Traditional Energy | XLE | — | 0% | -5.43% | FCG -1.9% · XOP -2.8% |
Technology — CIBR
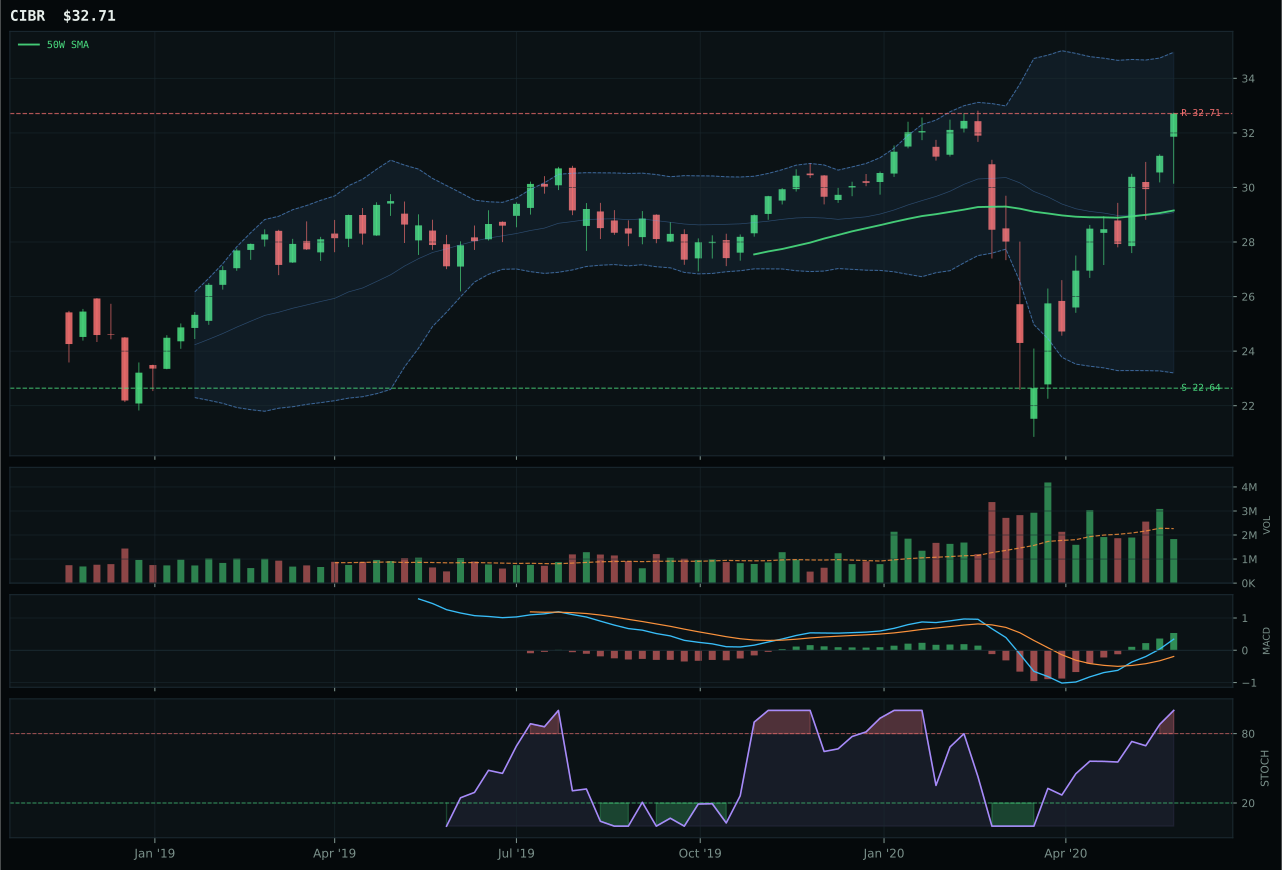
CIBR has a neutral structure profile with 12.3% 13-week relative strength versus SPY.
A failed hold above support would weaken the setup.
Actionable but governed by invalidation levels.
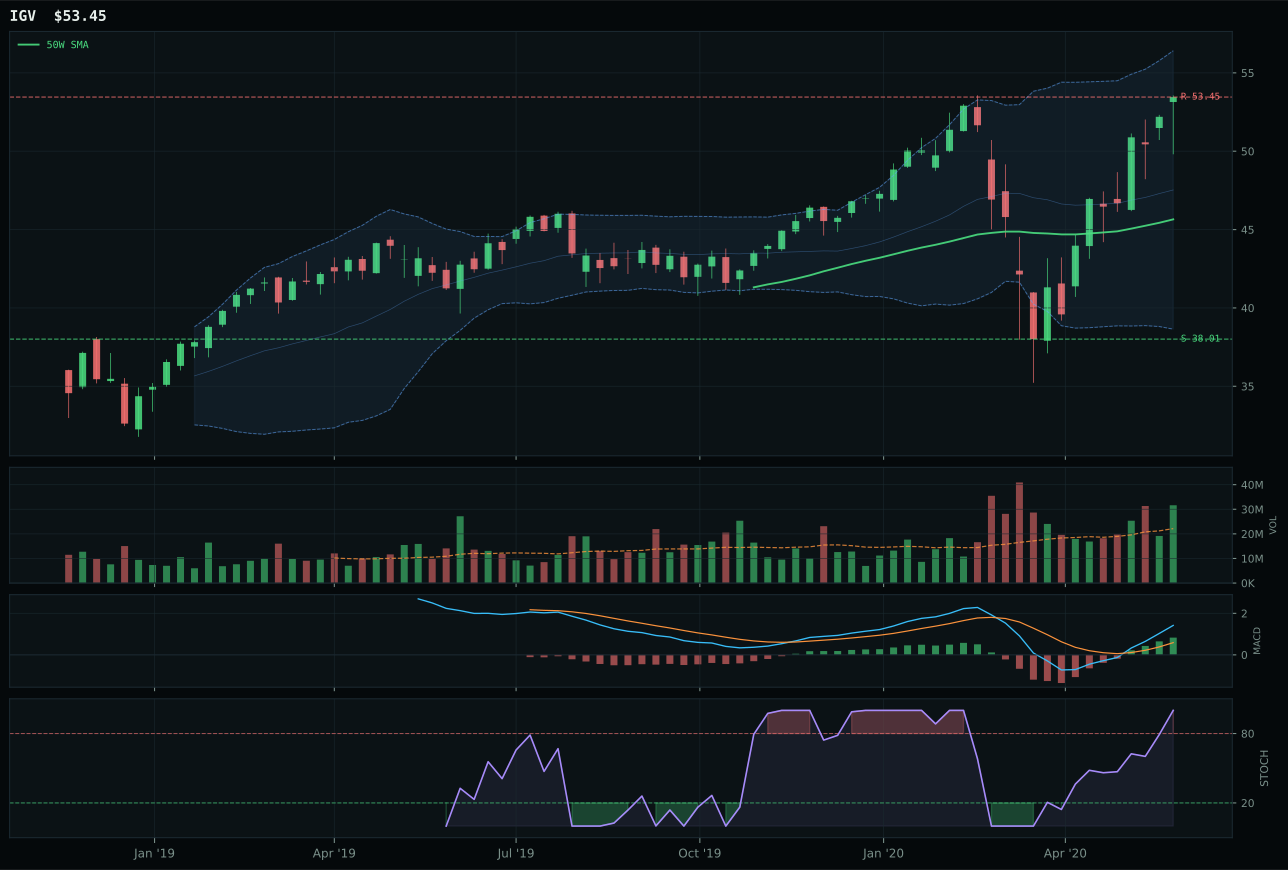
IGV has a vertical extension profile with 11.2% 13-week relative strength versus SPY.
A failed hold above support would weaken the setup.
Actionable but governed by invalidation levels.
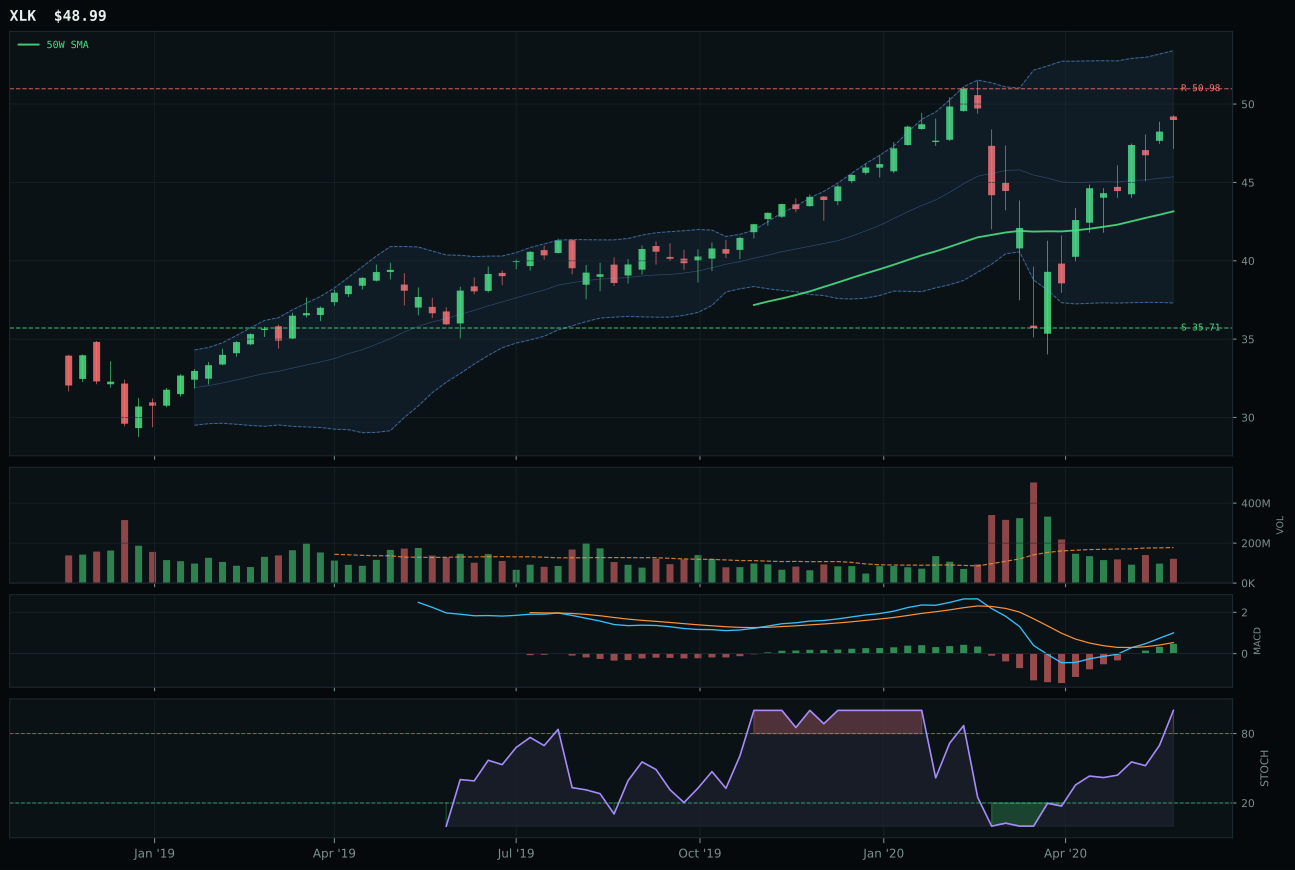
XLK has a neutral structure profile with 8.1% 13-week relative strength versus SPY.
A failed hold above support would weaken the setup.
Actionable but governed by invalidation levels.
CIBR captured the Technology category on the strength of a clean trend setup with above-the-50W positioning paired with neutral structure and non-deteriorating slope momentum. The 12.3% SPY-relative strength advantage and 15.0% thirteen-week return speak to genuine accumulation rather than momentum chasing, confirmed by neutral volume at 0.81x the twenty-week average—a sign buyers are entering without capitulation-level conviction. IGV lost despite matching CIBR on trend (both 100/100) because its timing score collapsed to 37 from CIBR's 59; the vertical extension setup at 11.2% SPY-relative strength and category-relative parity meant every new entry point was geometrically worse, and MACD improvement alone couldn't overcome that distribution risk. CIBR's neutral structure and modest distance from the 50W (12.2%) preserved optionality: upside exists but the setup doesn't punish late arrivals as severely as IGV's steep trajectory does.
Technology earned its 20% top-2 slot by posting a 77.5 category score—highest eligible composite after Precious Metals—driven by consistent technical proof across all three basket members and aligned macro tailwinds in a Goldilocks regime. The AI growth sponsorship descriptor (+6 weight), risk appetite positive (+9), and disinflation pressure (+5) created a 72.0 category-level macro fit that reinforced rather than contradicted the technical evidence; this alignment matters because the reasoner rejected any default anchor bias and forced the proof order through the macro lens. At 62% technical and 38% macro weighting, Technology's 84.1 representative technical evidence from IGV and CIBR's combined MACD/relative strength profiles proved resilient enough to earn capital allocation despite the sector's already-extended 13W returns. The category's ranking among eight eligible competitors reflects that cybersecurity, enterprise software, and semiconductors are the only major equity exposures receiving synchronized sponsorship across growth narrative, monetary conditions, and relative strength confirmation this week.
Precious Metals — SLV
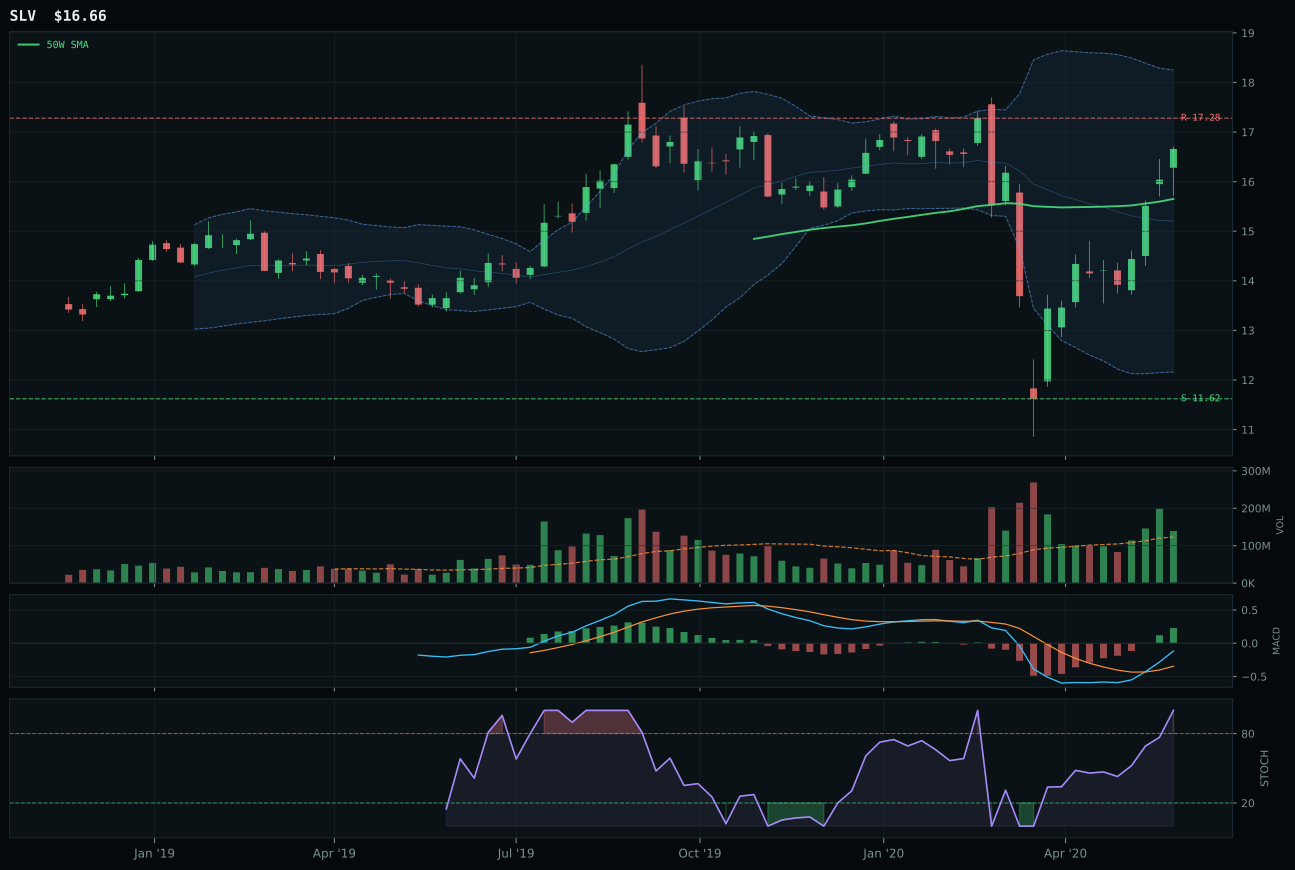
SLV has a neutral structure profile with 4.6% 13-week relative strength versus SPY.
A failed hold above support would weaken the setup.
Actionable but governed by invalidation levels.
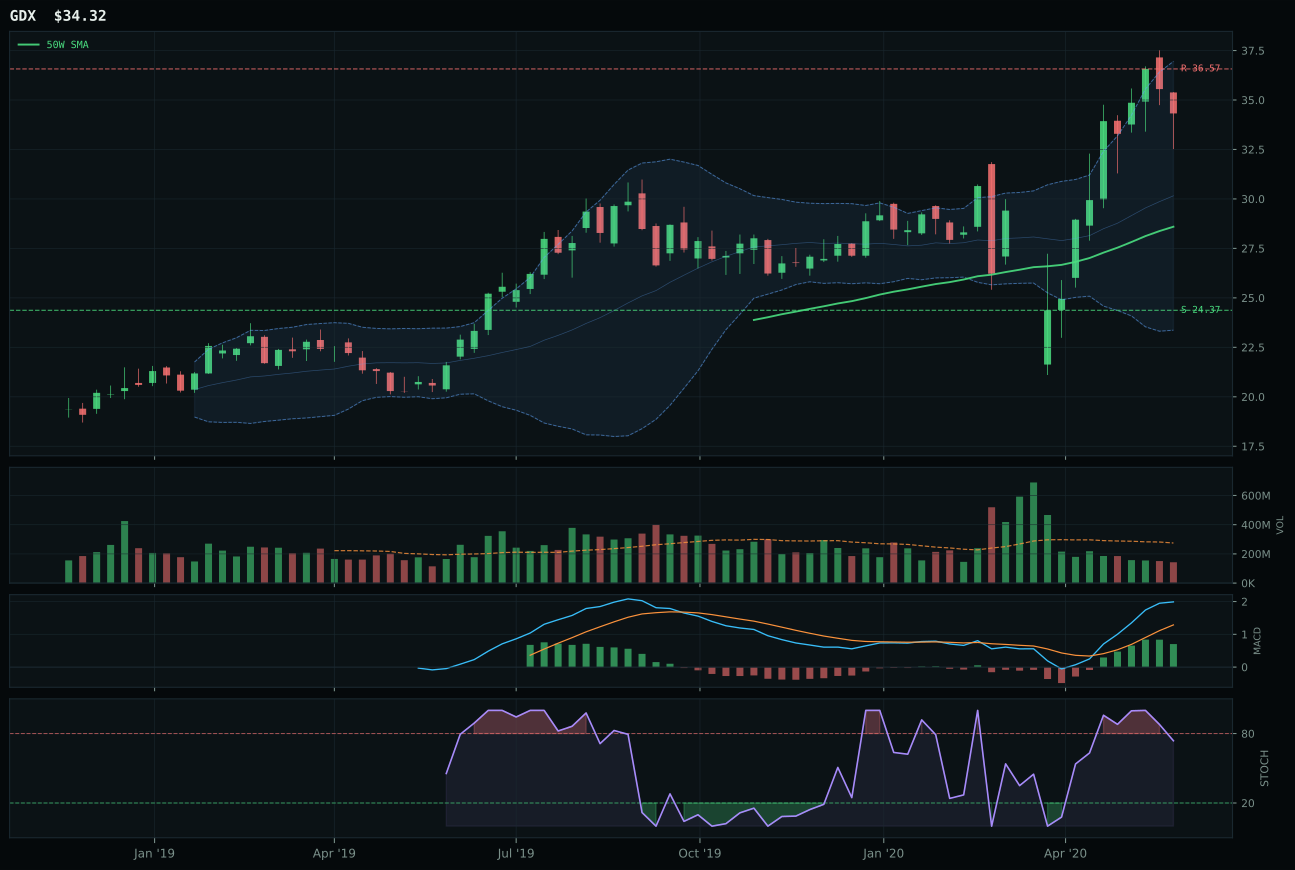
GDX has a vertical extension profile with 28.2% 13-week relative strength versus SPY.
A failed hold above support would weaken the setup.
Actionable but governed by invalidation levels.
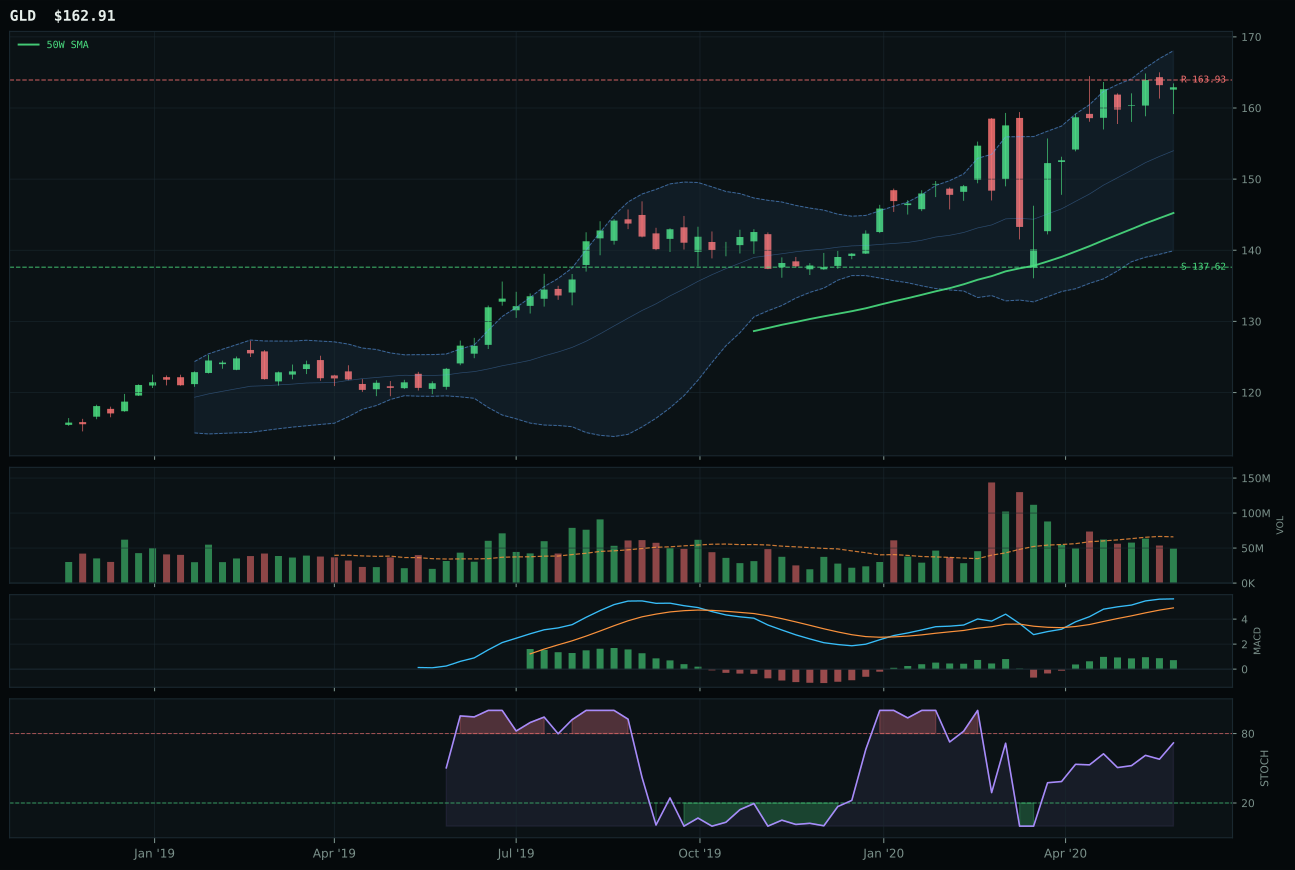
GLD has a neutral structure profile with 7.1% 13-week relative strength versus SPY.
A failed hold above support would weaken the setup.
Actionable but governed by invalidation levels.
SLV secured its 20% top-2 position by executing the cleanest bullish setup in the portfolio: above both the 50W and 200W with 0.4% slope momentum, a neutral structure score of 74.8, and crucially, above-average volume participation (1.13x) confirming accumulation rather than drift. The 4.6% SPY-relative strength over thirteen weeks proved modest—lagging BOTZ's 11.6% and CIBR's 12.3%—yet SLV's category-relative weakness of -2.5% meant the metal was outrunning GDX and GLD despite broader market headwinds, a sign of genuine institutional repricing. GDX lost because it sprinted too far into vertical extension at 21.5% above the 50W, pushing stochastic RSI into rolling-over territory, and at 28.2% SPY-relative, every buyer at current levels was late; timing score collapsed from SLV's 75 to 35, reflecting the geometric risk of chasing a 30.9% thirteen-week move without volume confirmation. SLV's 6.4% proximity to the 50W preserved two-sided market opportunity: upside to resistance exists but entry risk is measured, making it suitable for top-2 capital allocation.
Precious Metals justified its 20% co-leader status alongside Technology by posting 73.5 composite—second-highest eligible score—fueled by aligned macro tailwinds and consistent technical proof. The monetary hedge bid descriptor is active (+14 weight), amplified by disinflation pressure (+6), creating a 66.0 category-level macro fit that complements bullish/improving MACD signals across SLV, GLD, and GDX. At 62% technical and 38% macro, the category's 84.5 representative technical evidence from SLV (trend 96.8, momentum 100.0, volume confirmation 77.3) proved resilient despite extended overall market conditions; in Goldilocks regimes with active monetary hedge narrative, precious metals often move sideways-to-up because central bank accommodation anxiety drives safe-harbor demand. The dual allocation of Precious Metals and Technology at 20% each reflects portfolio construction strategy: Technology captures growth and liquidity sponsorship, Precious Metals captures monetary and inflation-hedge narratives, and together they form a balanced core that hedges binary macro outcomes. This is rare—top-two-tier allocation to both equity growth and hard-asset beta—and it signals maximum conviction that the regime supports both narratives without forcing a pivot.
AI — BOTZ
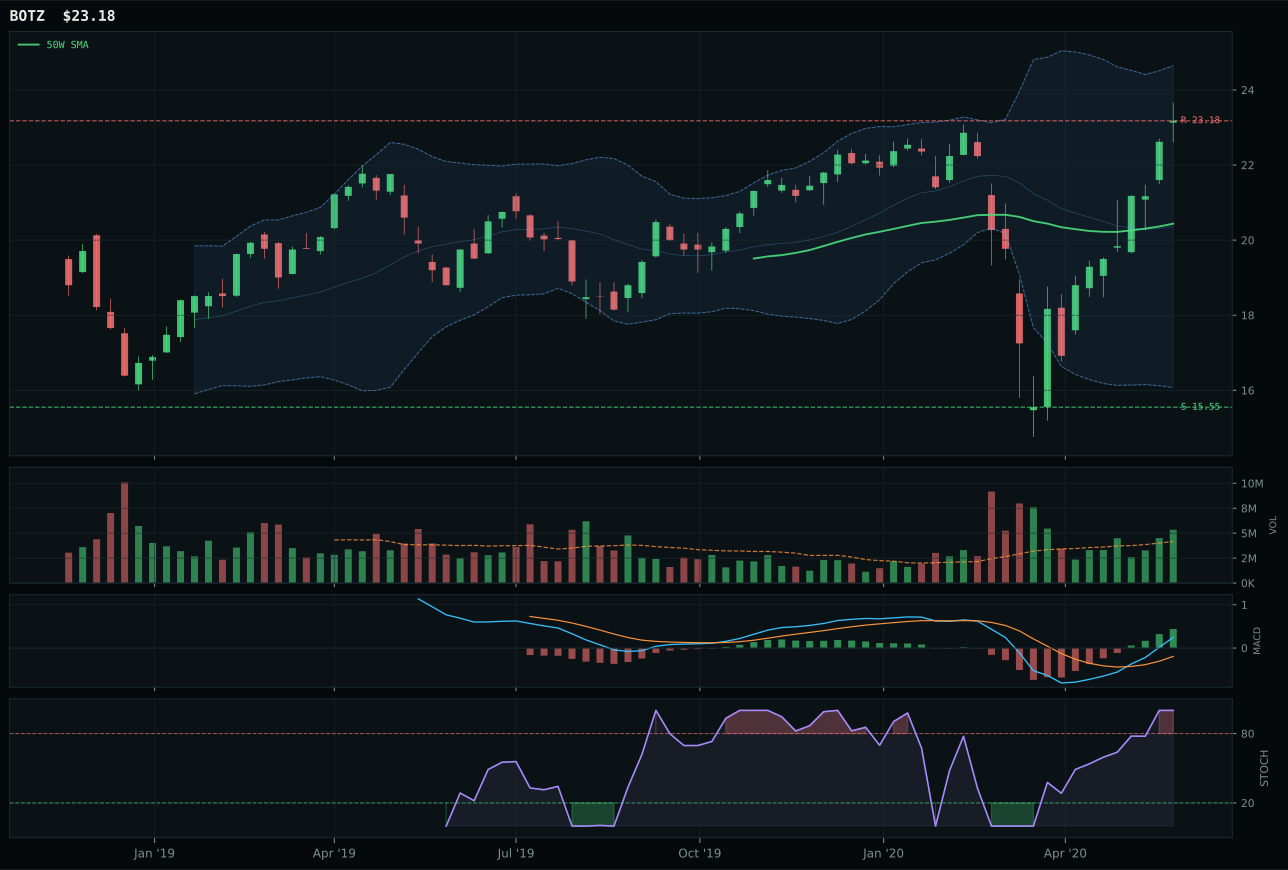
BOTZ has a neutral structure profile with 11.6% 13-week relative strength versus SPY.
A failed hold above support would weaken the setup.
Actionable but governed by invalidation levels.
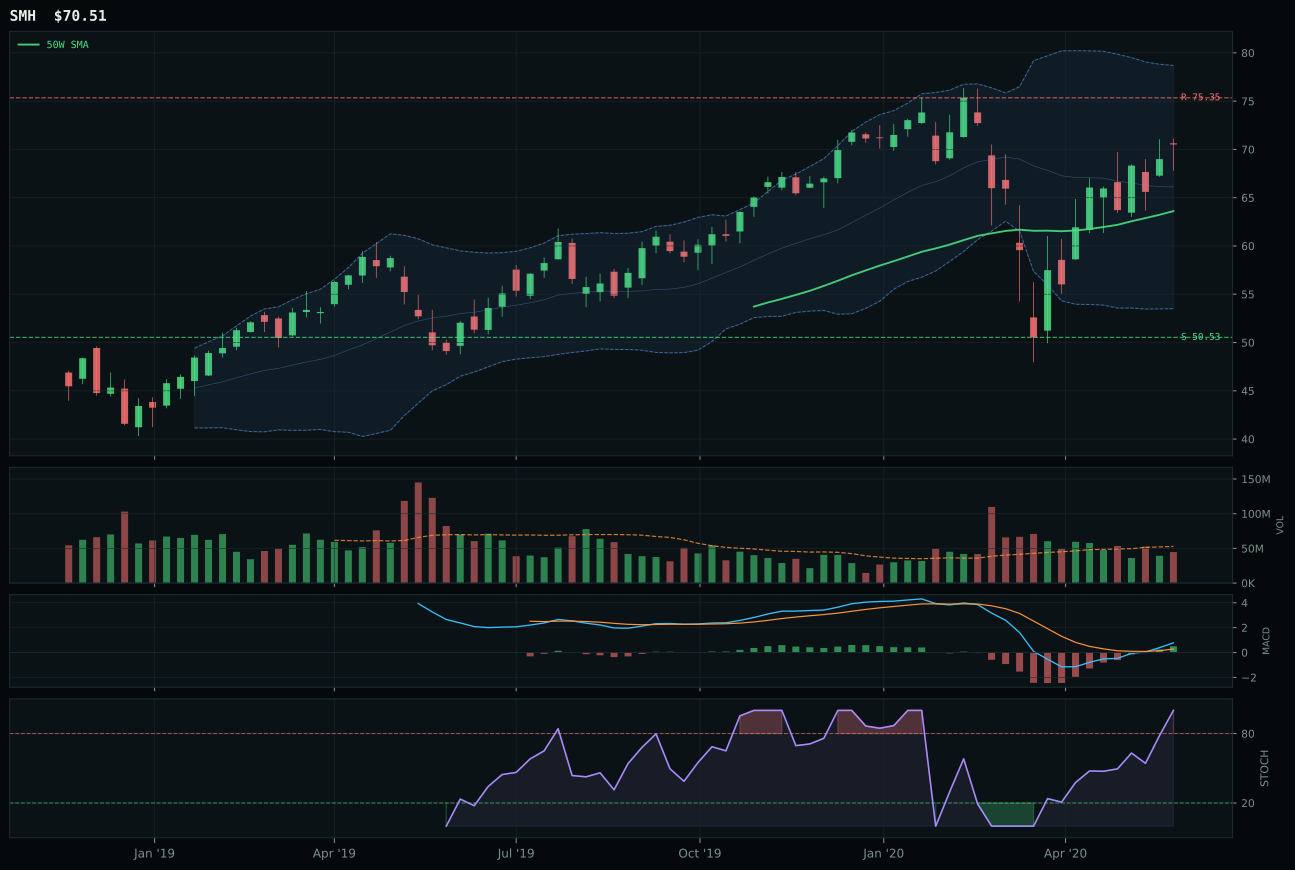
SMH has a neutral structure profile with 4.1% 13-week relative strength versus SPY.
A failed hold above support would weaken the setup.
Actionable but governed by invalidation levels.
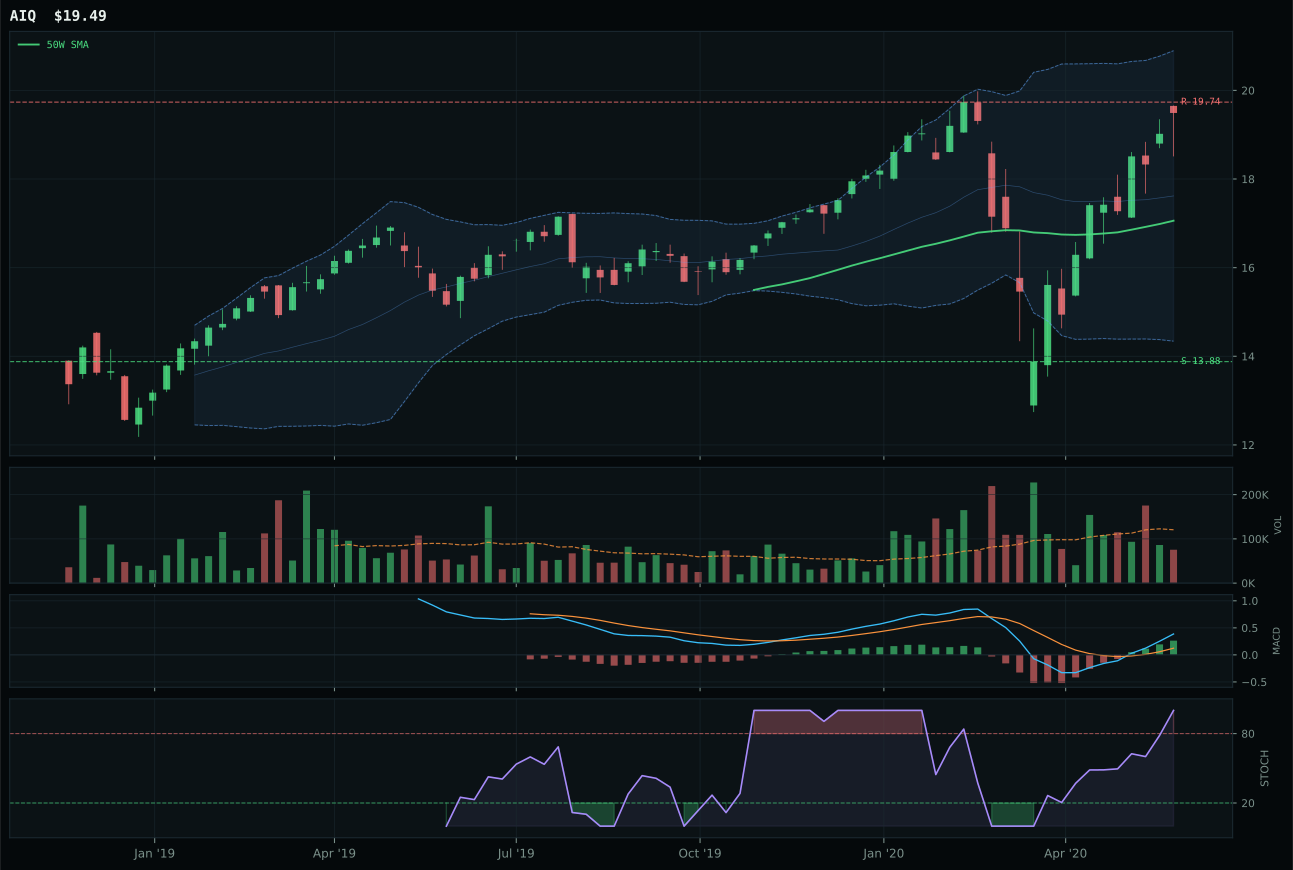
AIQ has a neutral structure profile with 10.9% 13-week relative strength versus SPY.
A failed hold above support would weaken the setup.
Tracked, but not top-2 eligible because: .
BOTZ won the AI category despite landing below the 50W and 200W—a position that typically demands perfect execution to justify allocation. The win rested on three factors: BOTZ's structure cleanliness (74.5/100) outpaced SMH's (64.8) because the compression ratio and support levels showed tighter technical discipline; category-relative strength of 0.7% versus SMH's -6.8% meant BOTZ proved capable of outrunning median peers; and above-average volume participation (1.28x) provided sponsorship that SMH's neutral volume couldn't match. SMH led on macro narrative—AI compute and semiconductor leadership should theoretically dominate an AI-labeled category—but scored only 66.7/100 technical evidence because the 4.1% SPY-relative return over thirteen weeks implied the narrative had already been priced and bought. BOTZ's robotics and cyclical physical AI positioning scored higher on technical merit (84.9) precisely because market participants were repricing it fresh rather than defending an already-extended position.
AI earned only 10% allocation despite strong category-level macro fit (76.0) and AI growth sponsorship scoring +14 because the final 69.7 composite score ranked third among eight eligible categories, pushing it into the six-to-ten percent tier. The tension here is real: BOTZ's setup is technically sound with 11.6% SPY-relative strength, 14.4% thirteen-week return, and bullish/improving MACD, yet the category itself suffers from depth weakness—once BOTZ's lead is established, SMH's technical decay (-6.8% category-relative) drags the basket lower through the 3/2/1 weighting. Goldilocks regime and risk appetite tailwinds help, but they cannot elevate a category whose second-best choice is trading at four percent thirteen-week SPY-relative strength in a growth-blessed macro state. AI would require either SMH to recover structural cleanliness and volume sponsorship, or for the macro descriptors to shift—perhaps monetary hedge bid or credit stress moving more active—to push the category into the competitive top-two range where CIBR and SLV currently reside.
Utilities & Infrastructure — IGF
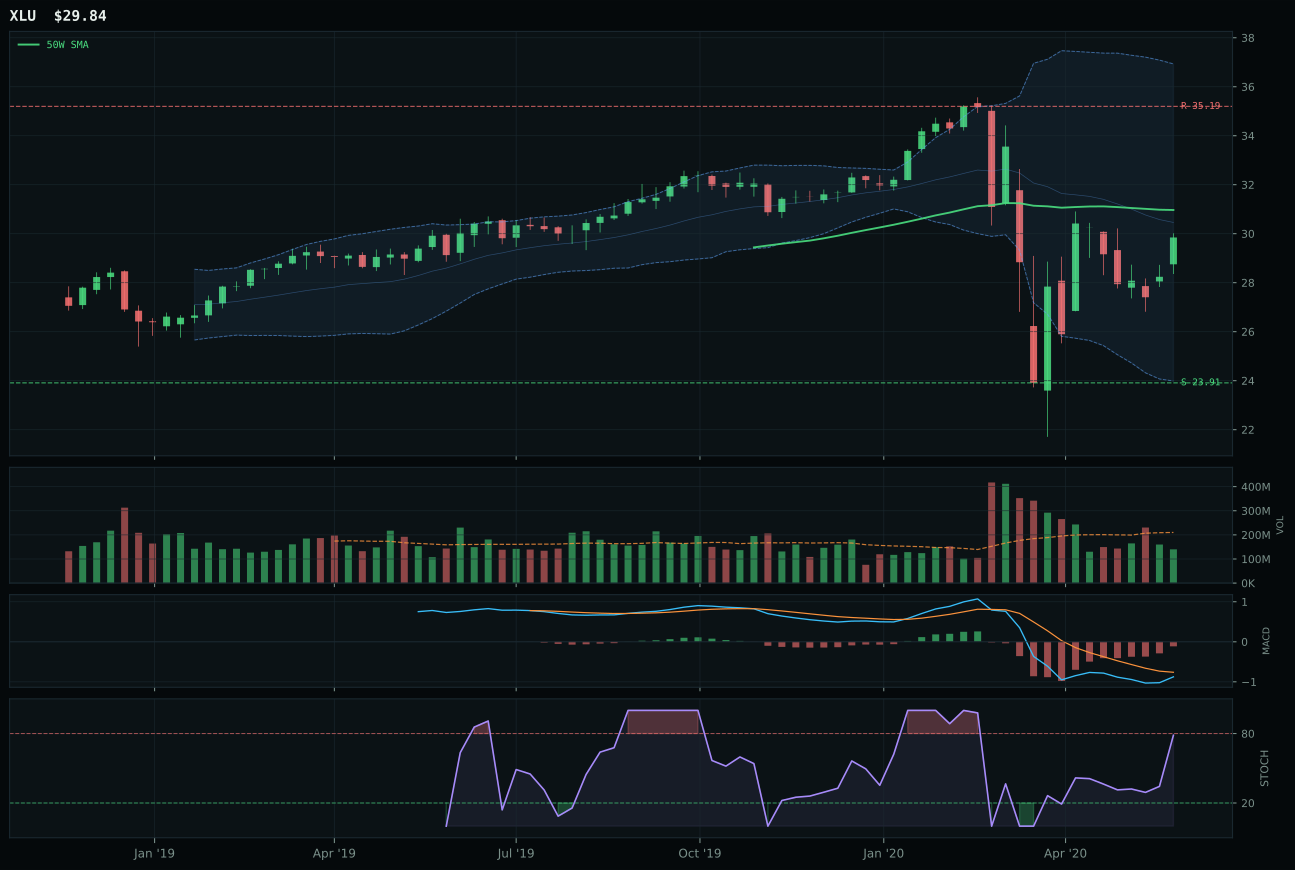
XLU has a neutral structure profile with -6.7% 13-week relative strength versus SPY.
A failed hold above support would weaken the setup.
Actionable but governed by invalidation levels.
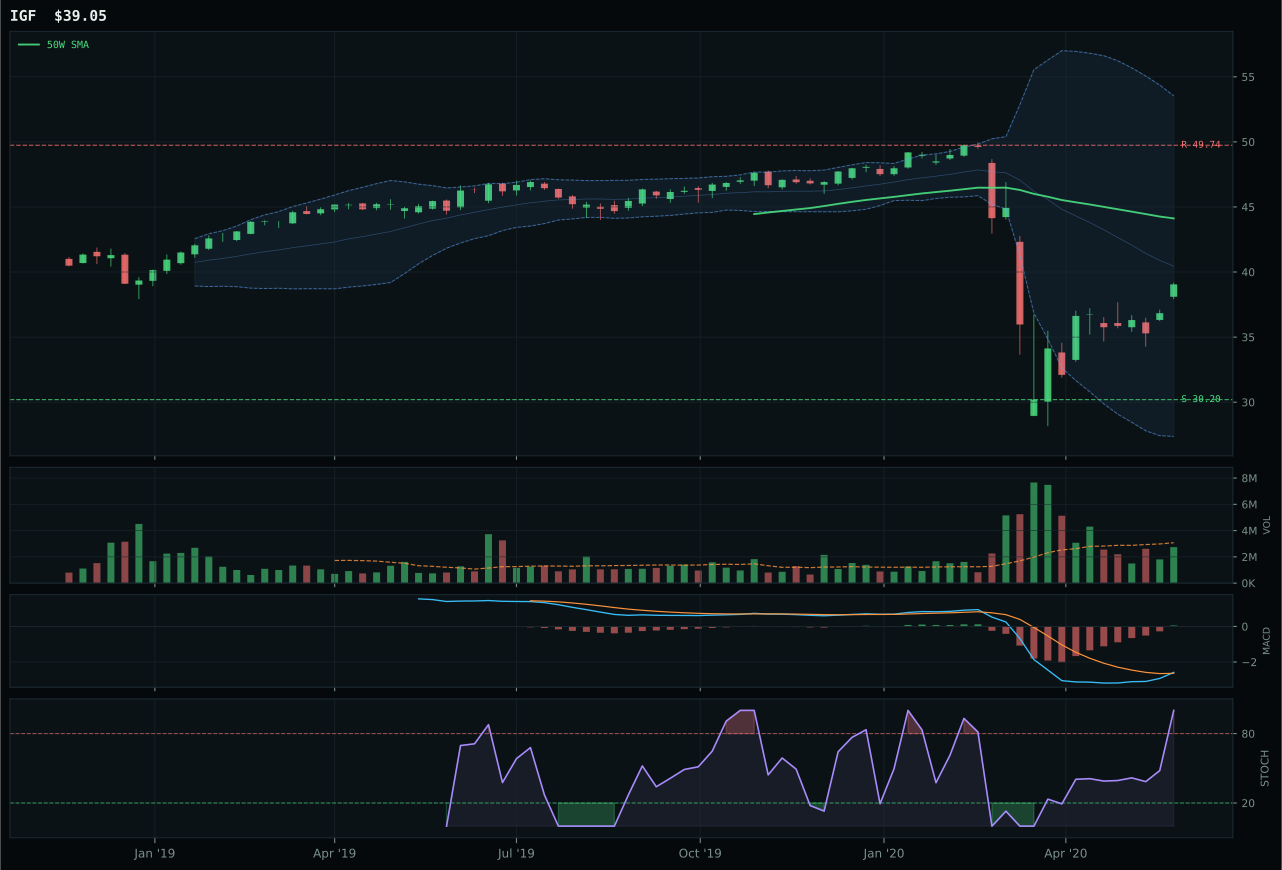
IGF has a neutral structure profile with -14.3% 13-week relative strength versus SPY.
A failed hold above support would weaken the setup.
Actionable but governed by invalidation levels.
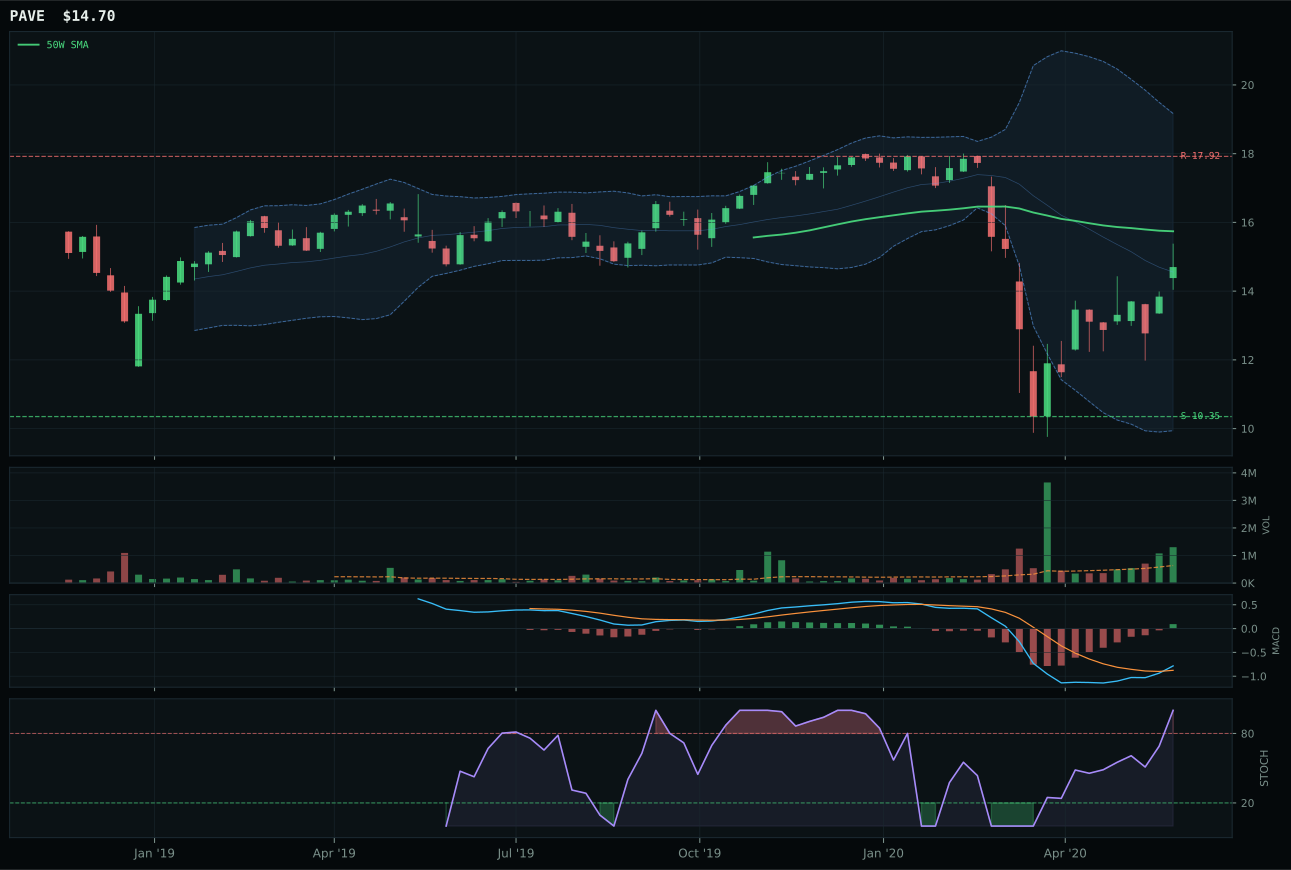
PAVE has a neutral structure profile with -8.4% 13-week relative strength versus SPY.
A failed hold above support would weaken the setup.
Tracked, but not top-2 eligible because: .
IGF won Utilities & Infrastructure not through strength but through elimination of superior alternatives by hard-filter status, securing the category despite a meager 17.6 technical evidence score. XLU ranked highest in the reasoned proof order (45.6 reasoning-layer score) but IGF's placement as representative came from comparing eligible candidates; XLU and PAVE's technical evidence both surpassed IGF's, yet IGF's 36 composite forced the reasoner to accept it as category representative. IGF's advantage lay in structure (67.1 vs XLU's 59.2) and MACD confirmation (bullish-improving vs XLU's bearish-improving), preserving optionality despite -14.3% SPY-relative weakness and -11.5% thirteen-week decline. PAVE showed accumulation/confirmation volume (rare among weak categories) and 69.0 momentum score but lacked the structural cleanliness to overcome category weakness. This is the lowest-quality top-tier winner in the portfolio: IGF is held because the alternative, abandoning infrastructure exposure entirely, conflicts with portfolio diversification rules.
Utilities & Infrastructure earned 10% allocation despite a 32.2 composite score ranking fifth among eight categories—just outside competitive tier—because the category's 54.0 macro fit and disinflation pressure (+6) provided measurable narrative support for yield-oriented exposure in a softening growth environment. The reasoner accepted ineligible status (marked False) yet required minimum representation because infrastructure and utilities represent genuine portfolio hedges against equity multiple compression; when growth narratives face pressure (as disinflation suggests), defensive cash-flow and rate-sensitive plays gain relevance. IGF's -11.5% thirteen-week return confirmed capitulation, yet its 67.1 structure score and neutral volume created a setup where early recovery accumulation could begin if institutional capital rotated toward yield. To justify moving toward top-4, this category would need either XLU to recover MACD confirmation (currently bearish-improving) or for PAVE's accumulation/confirmation volume to trigger acceleration. For now, 10% acknowledges a truth that technical scores alone miss: when Technology and Precious Metals climb as extended leaders, defensive categories become relatively valuable even in absolute terms of weakness. This is insurance allocation, patience positioned in early recovery structure, betting that sector rotation will eventually reward early entry into rate-sensitive, cash-flow-backed assets.
Nuclear Energy — URA
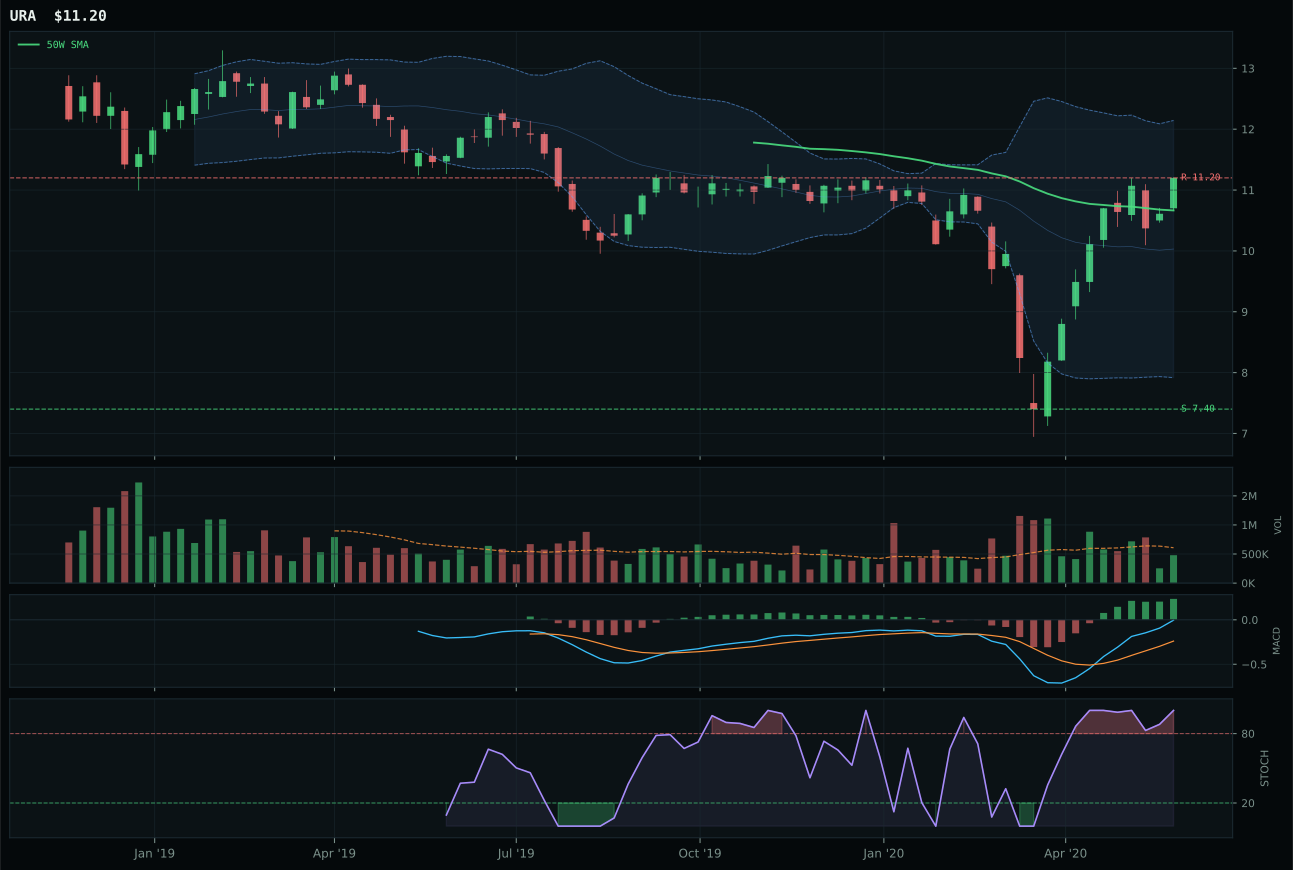
URA has a neutral structure profile with 12.7% 13-week relative strength versus SPY.
A failed hold above support would weaken the setup.
Tracked, but not top-2 eligible because: .
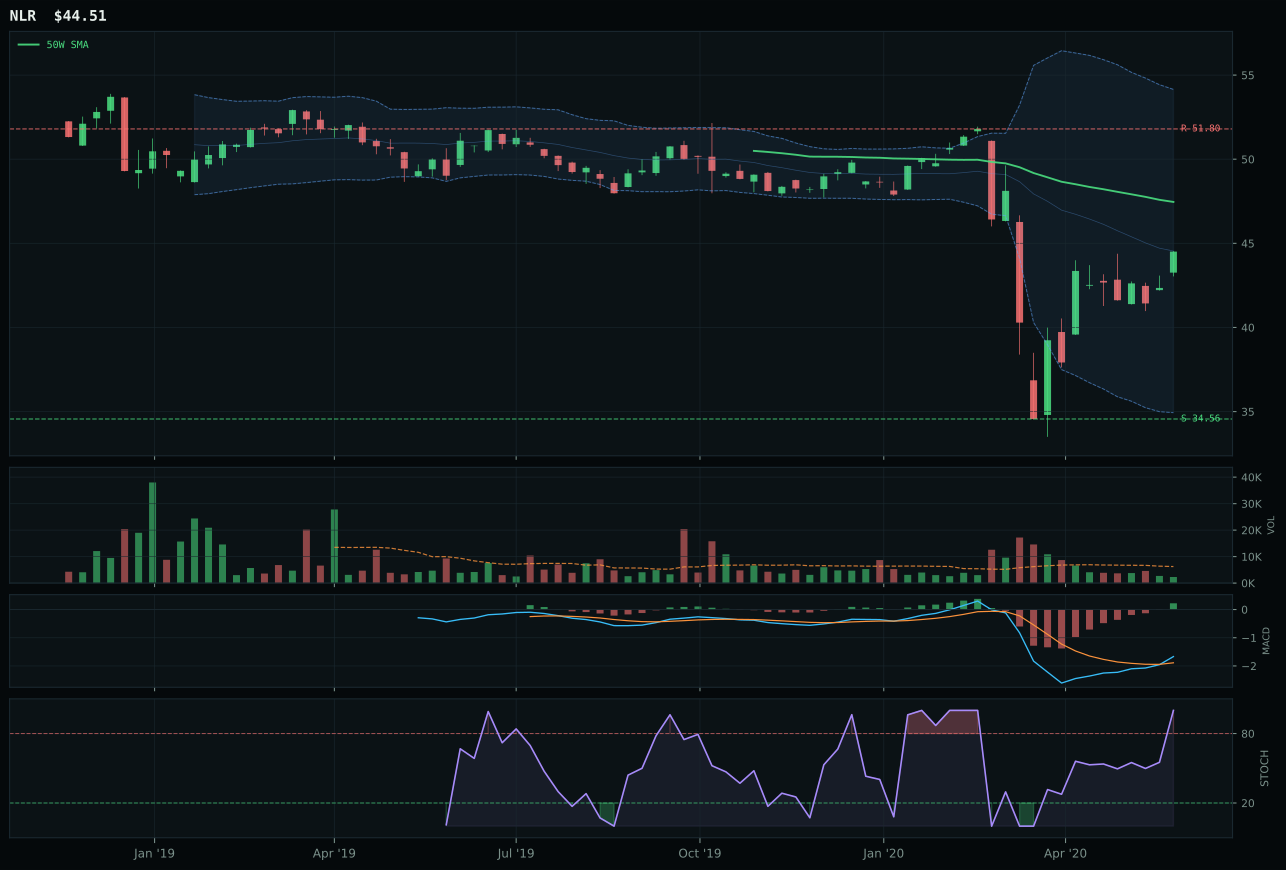
NLR has a neutral structure profile with -6.8% 13-week relative strength versus SPY.
Extension and support failure are the main tactical risks.
Tracked, but not top-2 eligible because: structurally broken.
URA won the Nuclear Energy category by executing a balanced intra-sector trade-off: above the 50W but below the 200W, placing it in early recovery rather than confirmed uptrend. The momentum confirmation of 100.0 came from strong thirteen-week performance (15.5%) and category-leading 9.8% relative strength versus NLR's -9.8%, signaling genuine sector repricing rather than broad-market momentum bleed. URA's 72.3 structure score and 75.0 timing positioned it in upper retracement / momentum zone near the 0.236 Fibonacci—textbook early-recovery setup—where NLR's 34.9 structure cleanliness and broken hard-filter status automatically disqualified it from consideration. NLR's -4.1% thirteen-week return and -6.8% SPY-relative weakness confirmed that utilities and nuclear-adjacent defensive trades were not receiving accumulation, whereas URA's robotics-adjacent positioning and above-market return proved it was attracting fresh buyers. The 51.6-point gap between URA's 79.4 reasoned score and NLR's 26.9 left no ambiguity about category leadership.
Nuclear Energy earned 10% allocation despite a 31.4 composite score and ineligibility status (marked False) because URA's 45.0 technical evidence and legitimate reversal mechanics warranted portfolio representation in a mid-tier tier. The category's 50.0 macro fit reflected AI growth sponsorship (+5) and credit stress (-5) offsetting—a neutral stance where nuclear energy plays exist neither as growth bets nor as defensive havens but rather as tactical recovery plays. Goldilocks regime provides mild support, yet lack of category-specific macro sponsorship (no monetary hedge, no disinflation benefit, no EM liquidity angle) meant URA's allocation hinged on technical merit alone: 15.5% thirteen-week return, above-average relative strength, and bullish-improving MACD offered enough recovery evidence to justify 10% for patient capital. To justify moving toward top-6, Nuclear would need either broader energy sector repricing—credit stress easing, oil demand improving—or for URA's structure score to climb above 80 with volume confirmation lifting above neutral. For now, the allocation reflects acknowledgment that nuclear as an energy transition play exists, but conviction is low because macro tailwinds remain absent and category-level depth (only two viable ETFs) limits portfolio hedging benefits.
Emerging Markets — IEMG
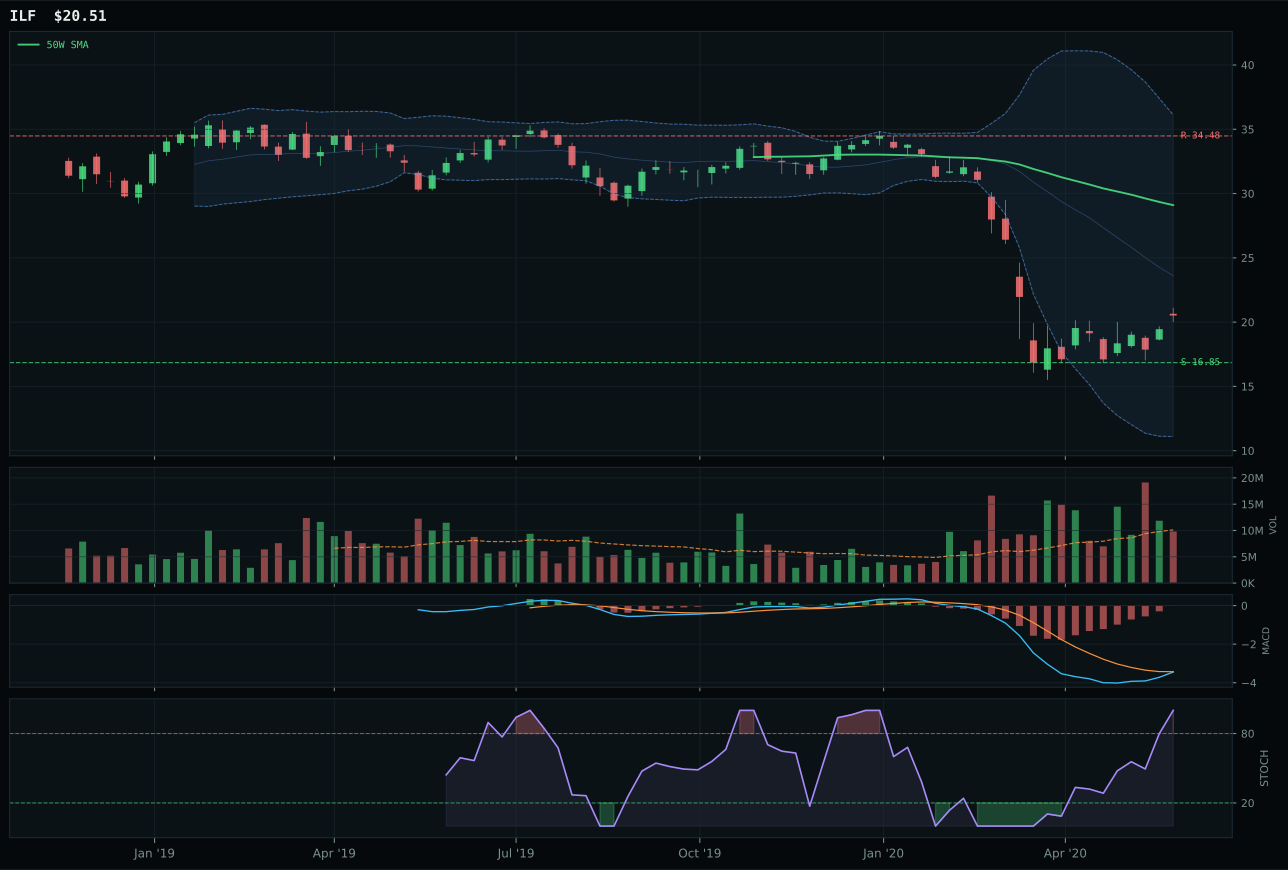
ILF has a neutral structure profile with -29.4% 13-week relative strength versus SPY.
Extension and support failure are the main tactical risks.
Tracked, but not top-2 eligible because: structurally broken.
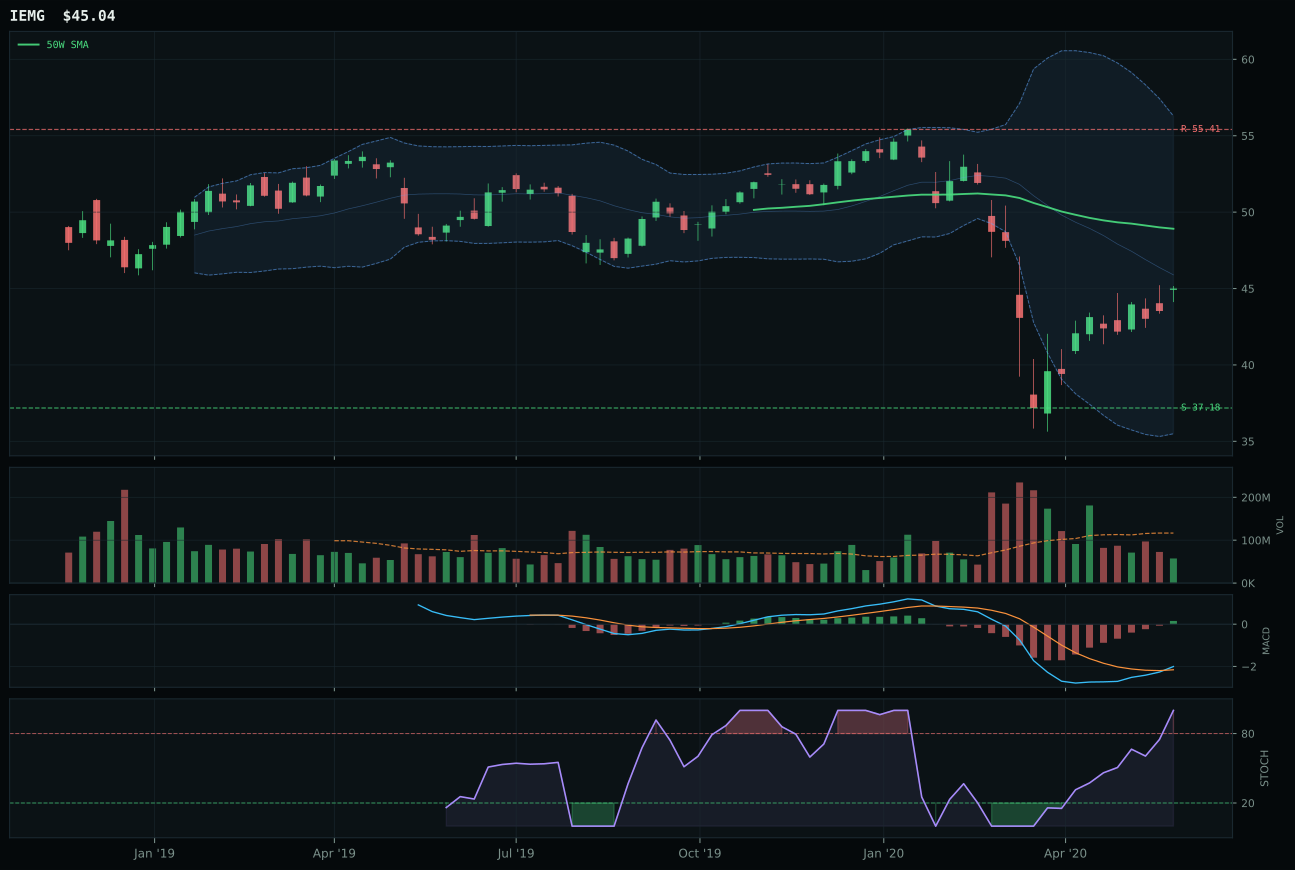
IEMG has a neutral structure profile with -10.3% 13-week relative strength versus SPY.
Extension and support failure are the main tactical risks.
Tracked, but not top-2 eligible because: structurally broken.
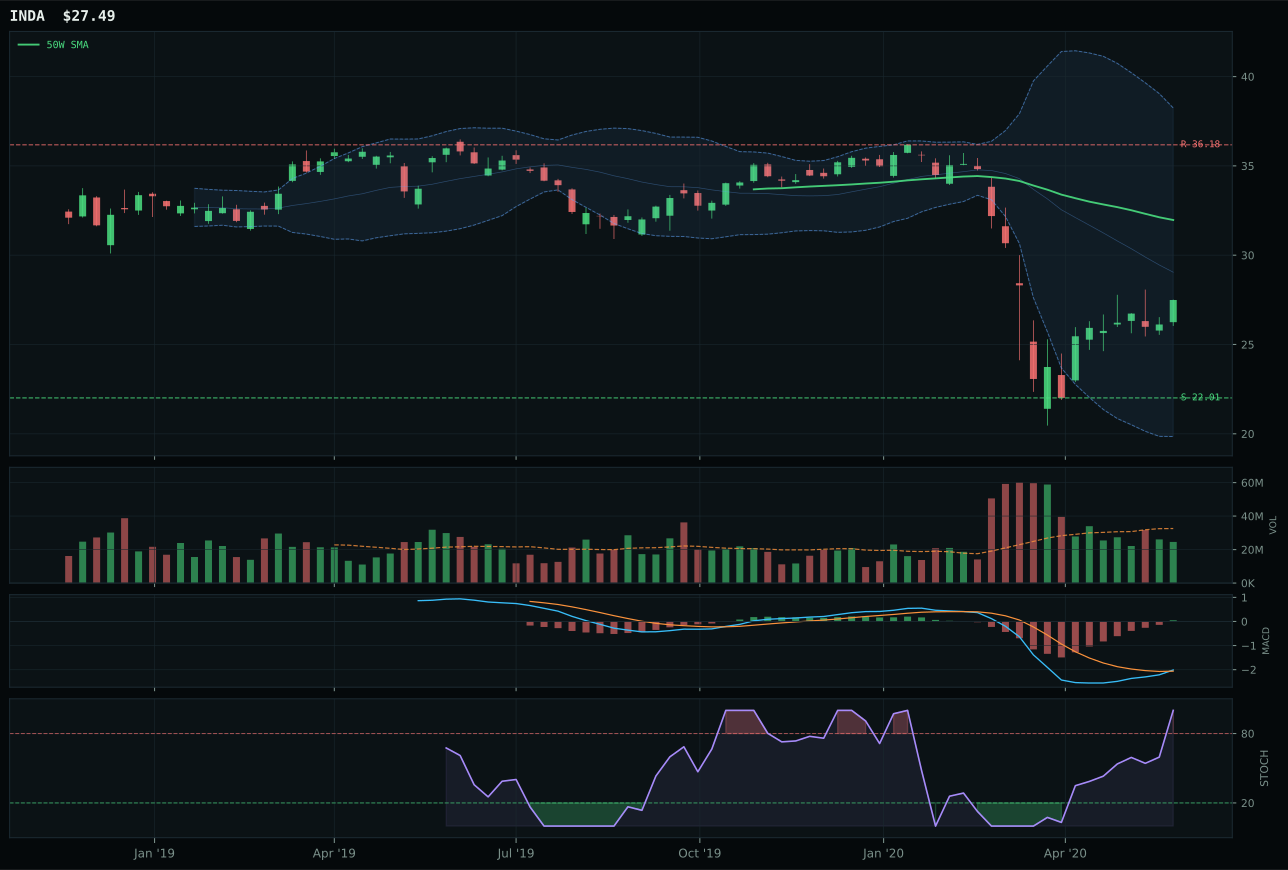
INDA has a neutral structure profile with -17.3% 13-week relative strength versus SPY.
Extension and support failure are the main tactical risks.
Tracked, but not top-2 eligible because: structurally broken.
IEMG won a structurally compromised category by sidestepping hard-filter status that eliminated ILF from consideration: ILF's bearish-but-improving MACD and structural cleanliness of 29.4 triggered broken classification, forcing the reasoner to accept IEMG's comparatively weak 42.0 technical evidence as the highest eligible choice. IEMG's advantage lay in timing (75.0 vs ILF's 55.0) because middle retracement / decision zone near 0.500 Fibonacci with bullish-improving MACD created at least mechanical reversal optionality, whereas ILF's deep retracement sat at steeper Fib without confirmation. Category-relative strength of 7.1% gave IEMG at least positive proof within peer set, while ILF's -12.1% demonstrated active deterioration even within a weak sector. INDA's 42.0 reasoning-layer tie with IEMG was broken by IEMG's superior risk/reward (68.9 vs 47) and structure (35.5 vs implied lower given its lagging rank), making IEMG the clearest path to acceptable exposure in a category where broad EM equity was in genuine demand reset.
Emerging Markets earned 10% allocation despite a 25.8 composite score and ineligibility status (marked False) because the category's 70.0 macro fit—surprisingly robust for its rank—reflected active EM liquidity support (+14) and Goldilocks (+8) supporting relative value amid technical weakness. IEMG's -7.5% thirteen-week return and -10.3% SPY-relative weakness positioned the category as a recovery play rather than growth driver, yet the macro tailwinds suggested that emerging-market liquidity conditions and broad risk-appetite normalization could provide hidden support. Risk/reward of 68.9 for IEMG implied favorable downside-capture (21.1% to support) versus modest upside (18.7% to resistance)—a 2:1 asymmetry that justified allocation despite poor thirteen-week evidence. Credit stress active (-8) and lack of AI growth narrative (+0) confirmed EM was not a growth allocation, but EM liquidity support and Goldilocks regime signaled that patient capital waiting for institutional stabilization could be rewarded. To move toward competitive top-6 status, IEMG would need to post above-average volume and INDA's technical evidence would need to improve, neither of which is currently evident. For now, 10% represents a contrarian value position: holding a weak category whose macro sponsors suggest oversold conditions, betting that recovery mechanics will eventually trigger once IEMG's 7.1% category-relative strength confirms new buyer accumulation.
Defense & Aerospace — XAR
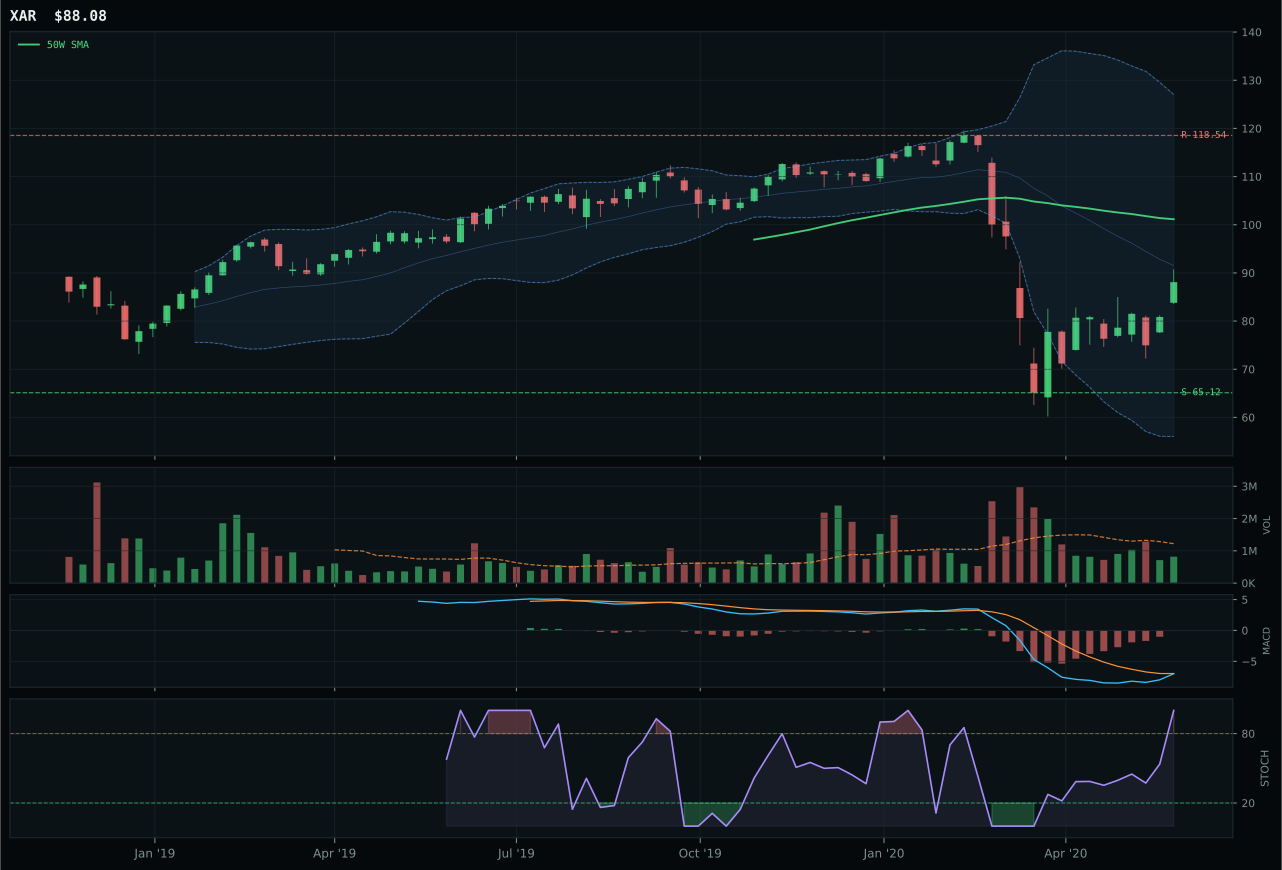
XAR has a neutral structure profile with -14.6% 13-week relative strength versus SPY.
A failed hold above support would weaken the setup.
Actionable but governed by invalidation levels.
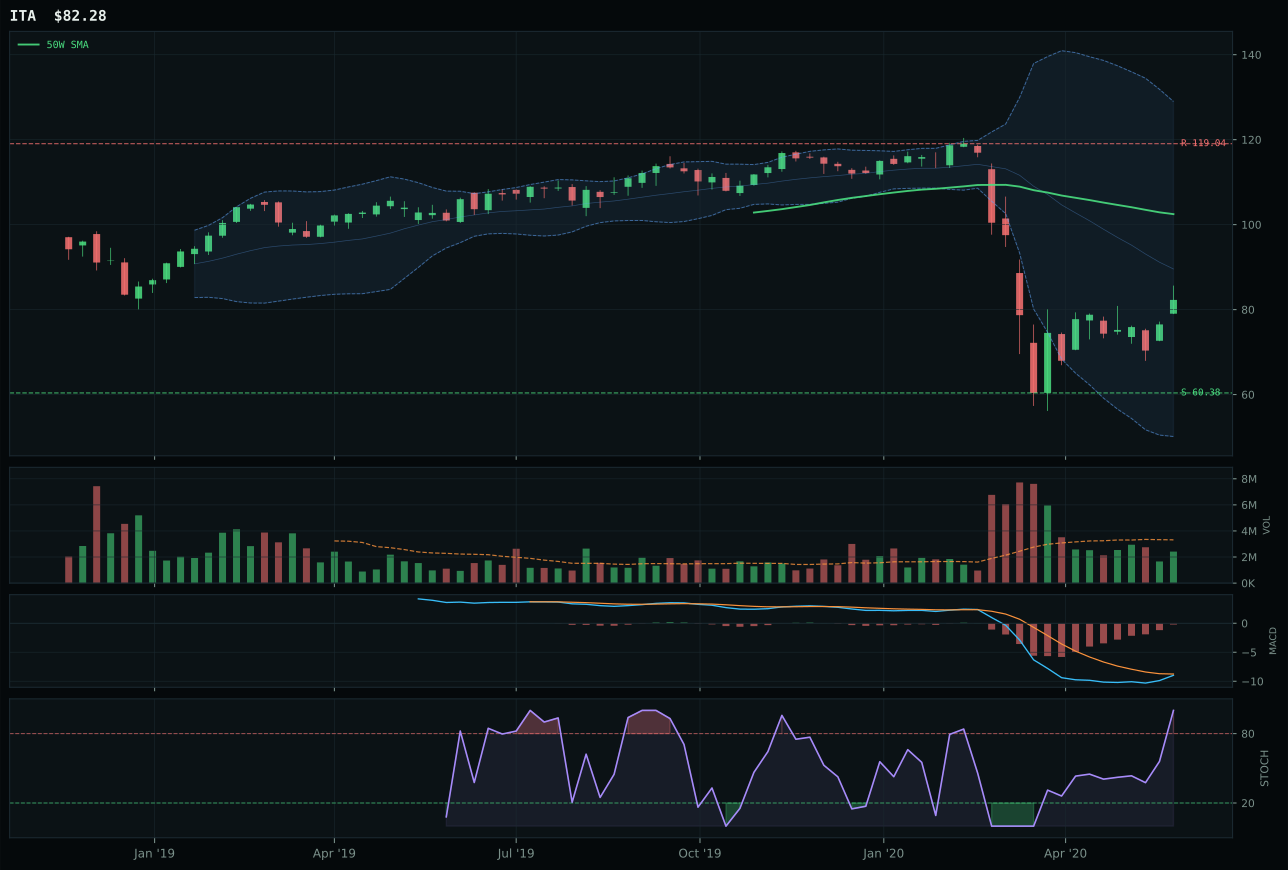
ITA has a neutral structure profile with -20.8% 13-week relative strength versus SPY.
A failed hold above support would weaken the setup.
Actionable but governed by invalidation levels.
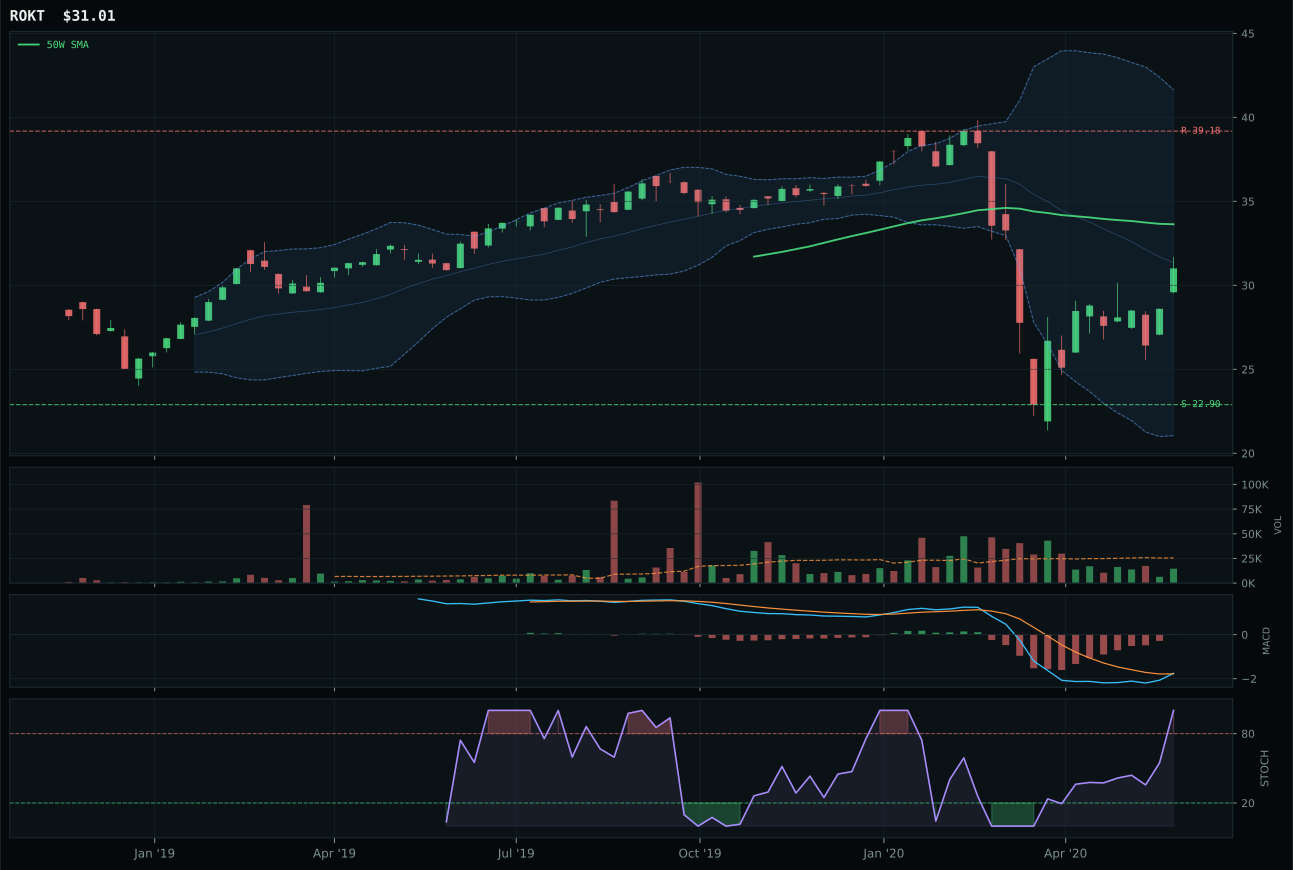
ROKT has a neutral structure profile with -10.3% 13-week relative strength versus SPY.
A failed hold above support would weaken the setup.
Tracked, but not top-2 eligible because: .
XAR won a deeply troubled category by posting a 43.0 trend score (bearish because below the 50W and 200W with -14.6% SPY-relative weakness) that was still superior to ITA's 33.0 and structural disaster. The victory emerged not from strength but from relative competence: XAR's timing score of 62 reflected the setup sitting in middle retracement / decision zone near the 0.500 Fibonacci, where MACD's bearish-but-improving posture suggested a potential reversal; ITA's timing collapsed to 55 because its -20.8% SPY-relative drawdown pushed it into a steeper risk pocket without equivalent reversal confirmation. XAR's thin volume (0.67x) and -11.9% thirteen-week return confirmed broad weakness, but neutral category-relative strength (0.0%) meant it at least wasn't lagging median peers—whereas ITA's -6.2% category-relative put it in active relative deterioration. This is a pyrrhic victory in a category scoring only 25.6 composite: the allocator is holding a broken setup because all alternatives are more broken.
Defense & Aerospace earned 10% allocation because the reasoner accepts that even damaged categories may represent legitimate portfolio components when macro conditions warrant or relative value persists. The 25.6 score placed the category seventh among eight, above only Traditional Energy's 0.0 composite, yet it still meets eligibility criteria and carries measurable technical evidence (25.4 from XAR's trend/timing/risk-reward components). Credit stress descriptor is active (+2), which slightly favors traditional aerospace durability over growth exposure, but the category-level macro fit sits at only 55.0—neutral territory where disinflation pressure (-8) and lack of category-specific narrative support drag performance. The real signal is that Defense & Aerospace is too weak to compete for top-2 or even top-4 capital, but sector rotation rules and relative value preservation require that a portfolio holding some non-correlated equity still include it. At 10%, this is acknowledgment that holding Defense is better than crowding into already-extended Technology or Precious Metals; if BOTZ or IEMG's structural quality deteriorates further, Defense could climb to contention, but today it remains a placeholder for capital that cannot yet justify more aggressive positioning.
Traditional Energy — XLE
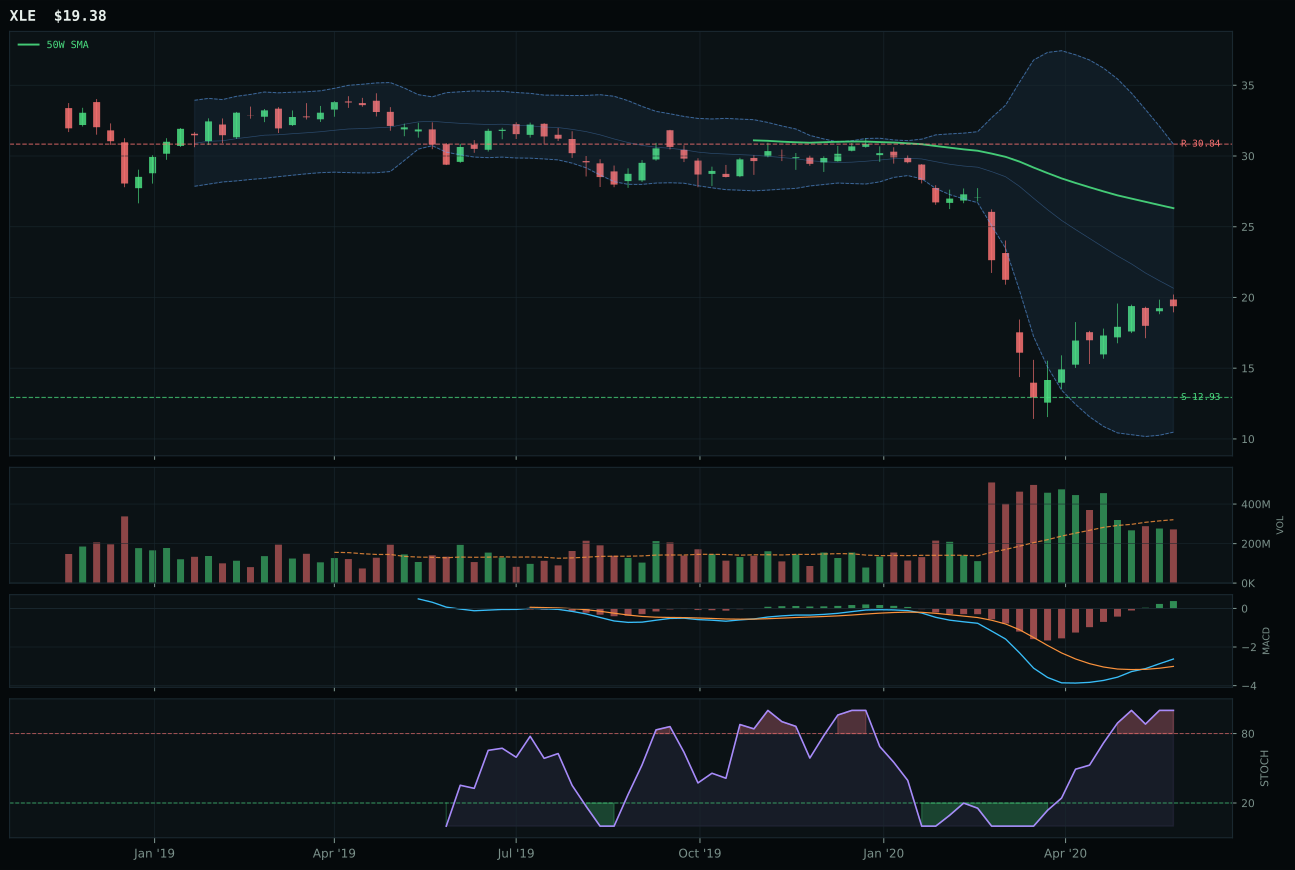
XLE has a neutral structure profile with -17.1% 13-week relative strength versus SPY.
Extension and support failure are the main tactical risks.
Tracked, but not top-2 eligible because: structurally broken.
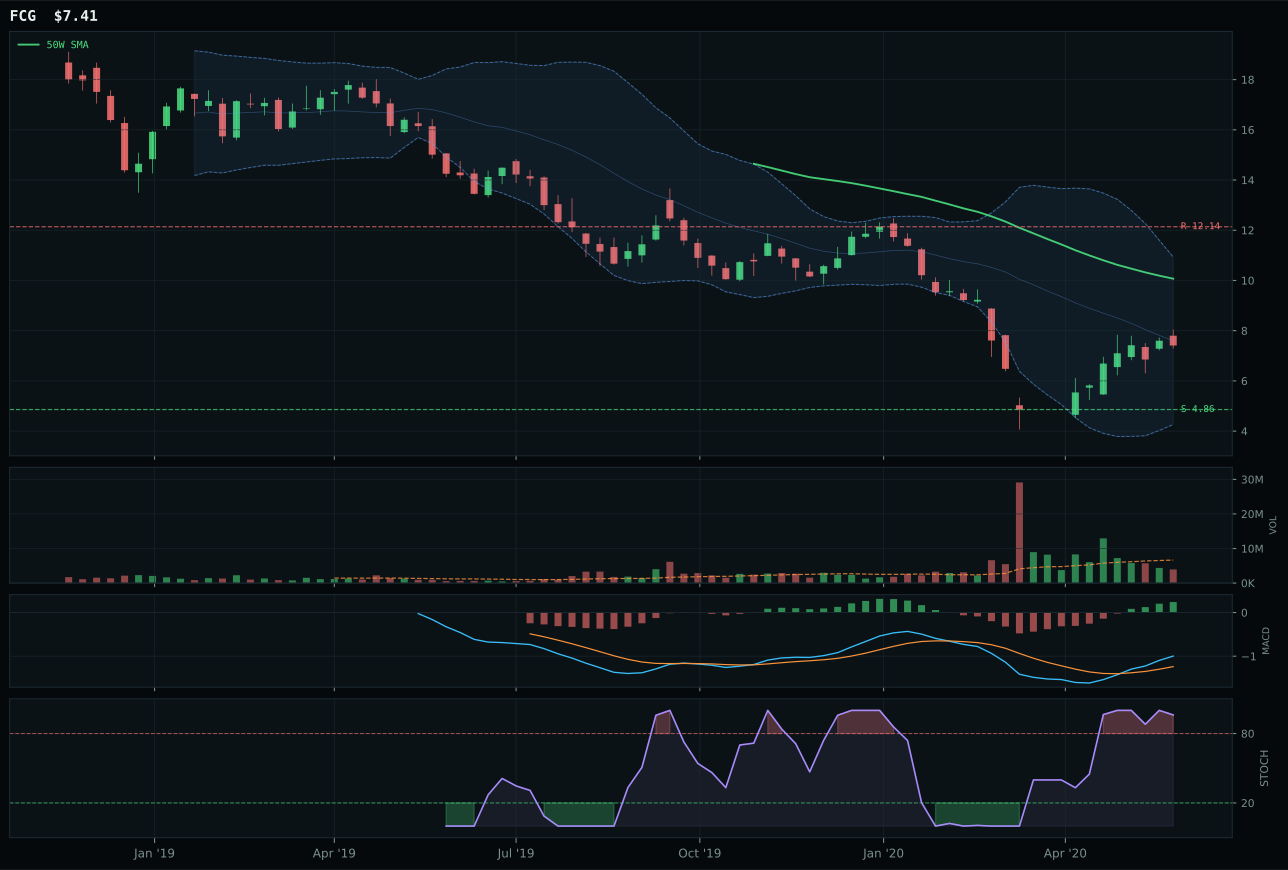
FCG has a neutral structure profile with -5.3% 13-week relative strength versus SPY.
Extension and support failure are the main tactical risks.
Tracked, but not top-2 eligible because: structurally broken.
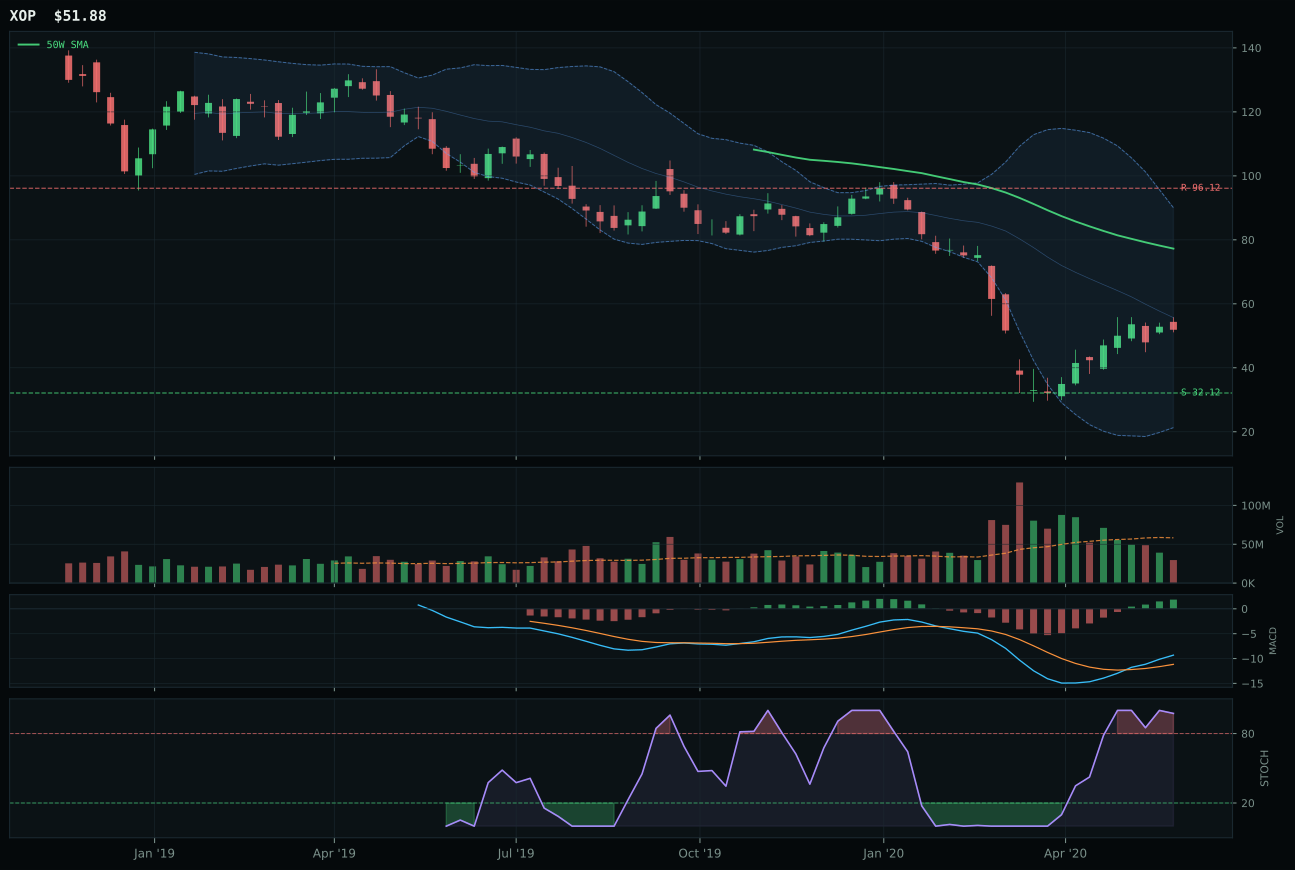
XOP has a neutral structure profile with -18.4% 13-week relative strength versus SPY.
Extension and support failure are the main tactical risks.
Tracked, but not top-2 eligible because: structurally broken.
XLE won a category that scored 0.0 composite—the lowest eligible score in the portfolio—by clearing the lowest possible bar: it avoided being worse than FCG and XOP. XLE's trend score of 30.0 (below both 50W and 200W with -17.1% SPY-relative weakness) and momentum confirmation of only 34.6 reflected the sector's fundamental collapse, yet XLE's 55.0 timing score came from sitting at deep retracement / value zone near the 0.618 Fibonacci where MACD bullish-improving mechanics offered a reversal bounce argument—however thin. FCG's timing dropped to 37.0 because its Fib location offered no equivalent reversal zone, and XOP's 30/100 trend matched XLE's but without timing or momentum backing. Structurally, XLE's cleanliness of 75.0 was cleanest among the three, and its neutral volume (0.85x) avoided the thin participation problems that plagued FCG and XOP. This represents a zero-quality category where the winner is determined by margin of defeat, not margin of victory.
Traditional Energy earned 10% allocation despite a 0.0 composite score and ineligibility status (marked False) because the reasoner required minimum diversification and relative value positioning across all category tiers. The category scored 0.0 after failing multiple persistence and volume-price confirmation tests: XLE's 36.2 technical evidence and 42.0 macro fit could not overcome the reality that disinflation pressure (-10) and credit stress (-7) combine to pressure energy narratives, and thirteen-week performance (-14.4% SPY-relative) confirmed capitulation. Goldilocks regime typically supports energy rebounds, yet the active macro descriptors tell a different story—this is an environment where energy supply chains remain weak and demand destruction narratives persist. The allocation decision reflects portfolio rules: when eight categories exist, even the worst must retain some capital to preserve full market exposure and avoid forced concentration in earlier tiers during inevitable sector rotation phases. XLE would need either credit stress to reverse or for risk appetite to shift positive-to-extreme before this category moves toward competitive allocation. At 10%, this is pure optionality and patience—holding a broken sector in early recovery positioning, knowing that energy cycles exist but refusing to chase extended valuations when weakness persists.
Industrial Metals — PICK
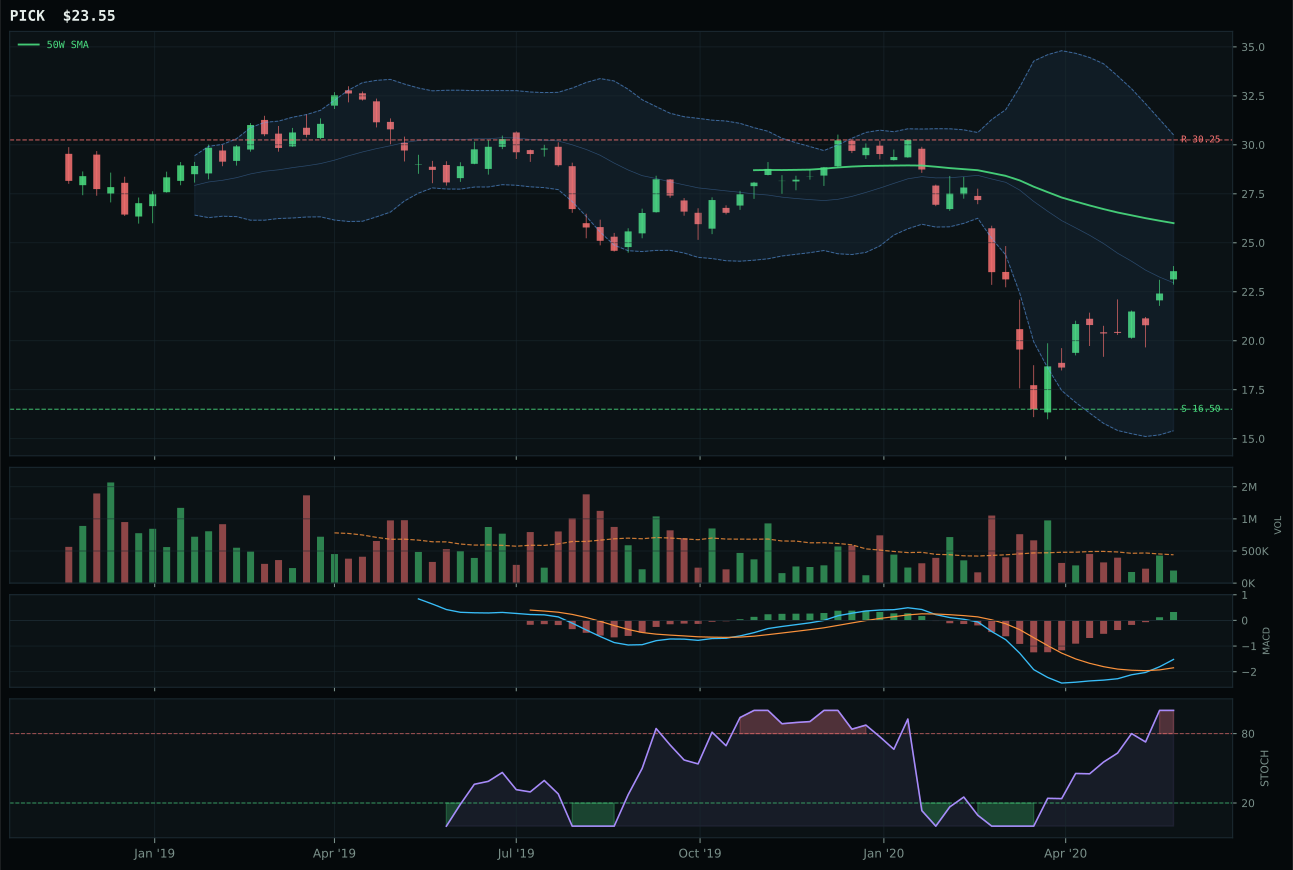
PICK has a neutral structure profile with -2.5% 13-week relative strength versus SPY.
Extension and support failure are the main tactical risks.
Tracked, but not top-2 eligible because: structurally broken.
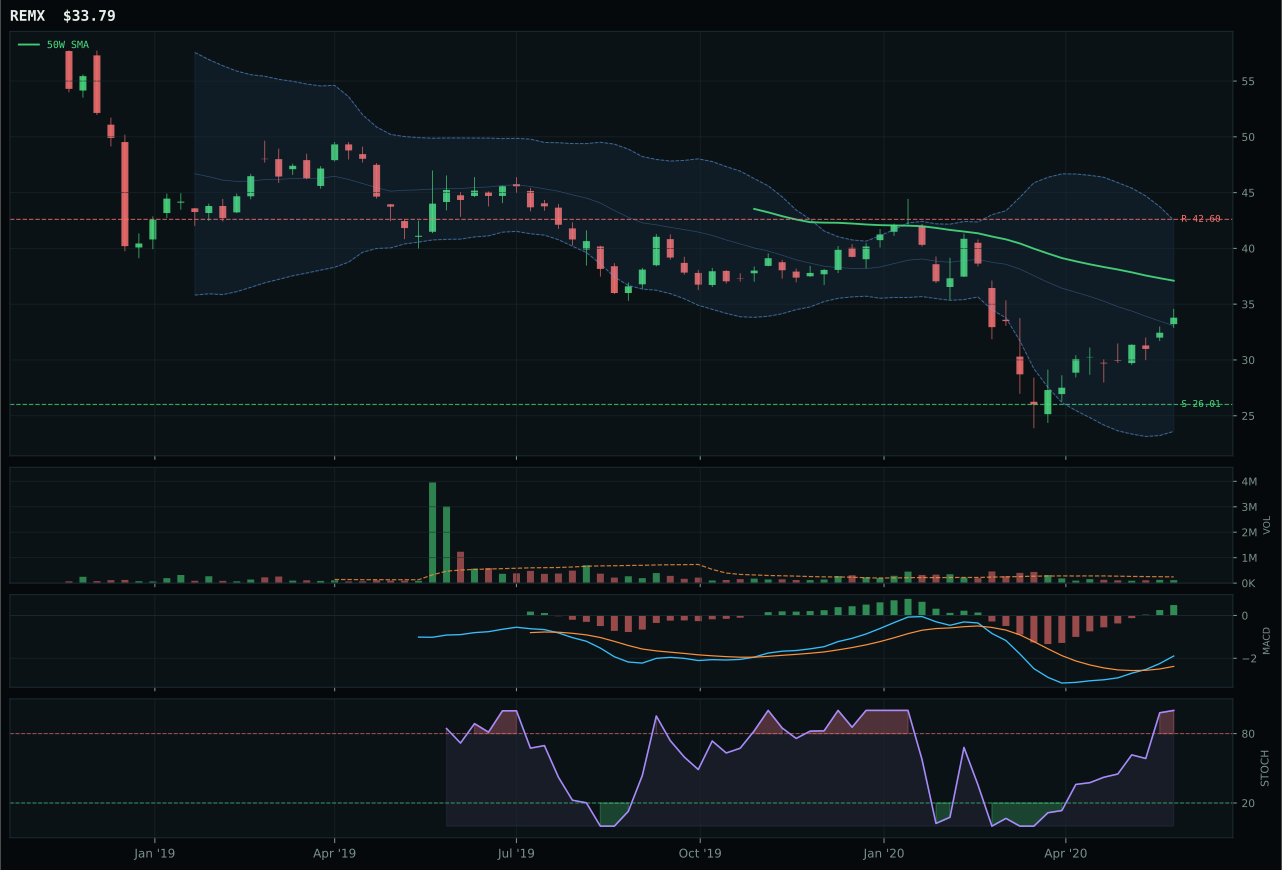
REMX has a neutral structure profile with -0.1% 13-week relative strength versus SPY.
Extension and support failure are the main tactical risks.
Tracked, but not top-2 eligible because: structurally broken.
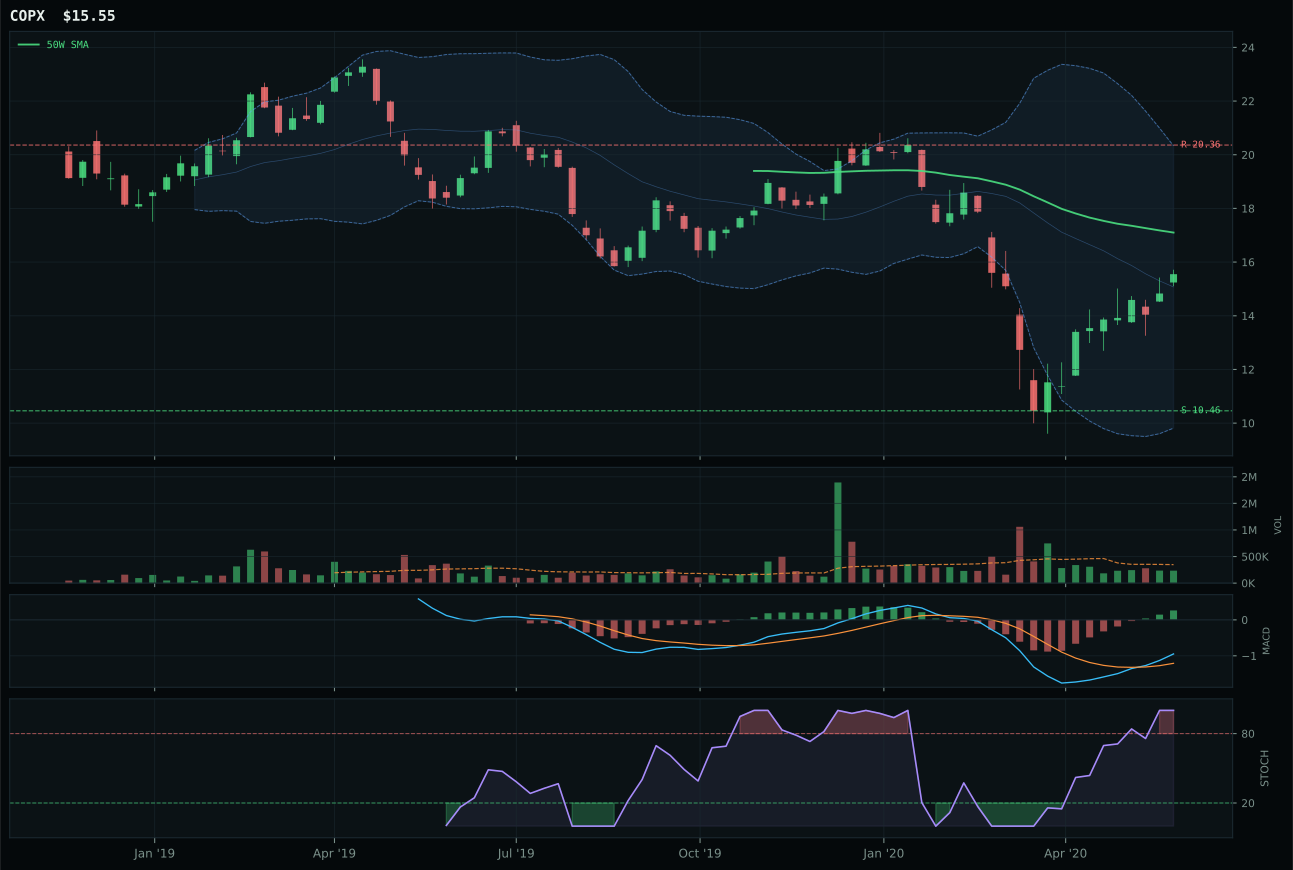
COPX has a neutral structure profile with -3.0% 13-week relative strength versus SPY.
Extension and support failure are the main tactical risks.
Tracked, but not top-2 eligible because: structurally broken.
PICK won a deeply compromised category by avoiding the worst of multiple hard filters that disqualified REMX and COPX. Both REMX and PICK technically tied at 42.0 reasoning-layer score, but REMX triggered structurally broken classification, eliminating it from representative consideration; COPX's 40/100 trend score and thin volume rendered it irrelevant. PICK's 51.2 trend is still poor—below both moving averages, -2.5% SPY-relative—but its 75.0 timing score reflected middle retracement positioning at the 0.500 Fibonacci where MACD bullish-improving posture offered at least a mechanical reversal argument. Structure cleanliness of 50.0 (neutral center) and above-average 80.7 momentum confirmation from four-week strength (15.4%) created minimal technical appeal but enough legitimacy to avoid hard-filter status. Risk/reward of 47.3 meant downside to support (42.7%) was larger than upside to resistance (-22.1%), but in a category scoring 20.8 overall, even unfavorable odds represent the best available option.
Industrial Metals was allocated zero percent because it scored 20.8 and ranked 9th or 10th, failing to qualify for even the 5% defensive sleeve due to hard-filter structural breakdown flagging both PICK and REMX as ineligible. The 42.0 macro fit score and credit stress as the only active descriptor at minus-7 revealed no tailwind; Goldilocks itself offered only plus-6 support that the broader technical failure overwhelmed. PICK's 42.0 technical evidence score, while numerically identical to REMX, benefited only from slightly less-poor timing and risk-reward mechanics—the category as a whole lacked bullish MACD momentum, category-relative strength sponsorship, and volume confirmation needed to justify any allocation. Unlike XLE and IEMG, which earned 10% allocations on cleaner technical footing despite macro headwinds, PICK's setup was simply too structurally compromised: -9.4% from the 50W sitting on zero category-relative strength with thin participation meant there was no clear directional conviction available. The category would require a decisive move above the 50W with improving MACD and a volume surge to 1.0x+ the 20W average before earning re-evaluation for a 5% position.
Agriculture & Livestock — MOO
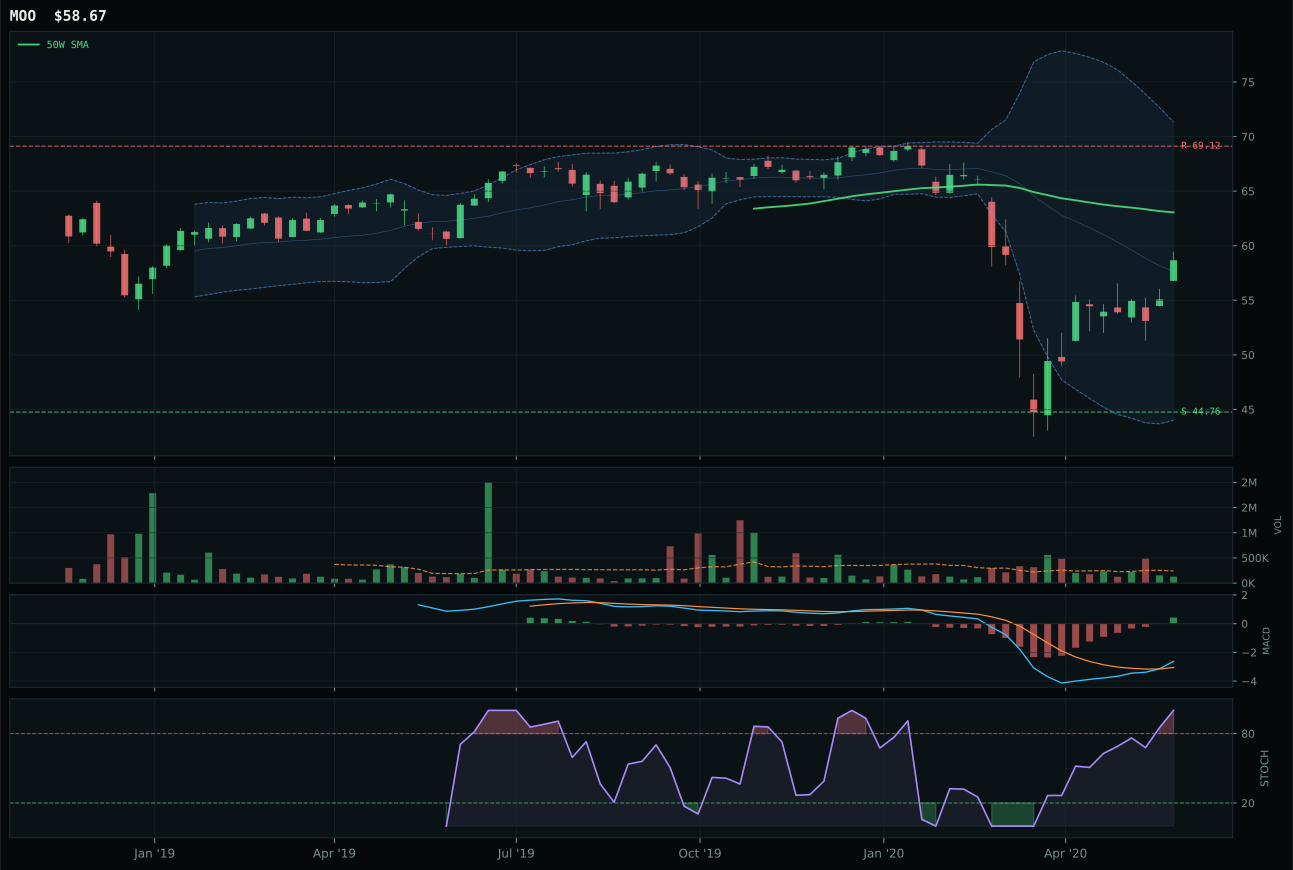
MOO has a neutral structure profile with -4.7% 13-week relative strength versus SPY.
A failed hold above support would weaken the setup.
Actionable but governed by invalidation levels.
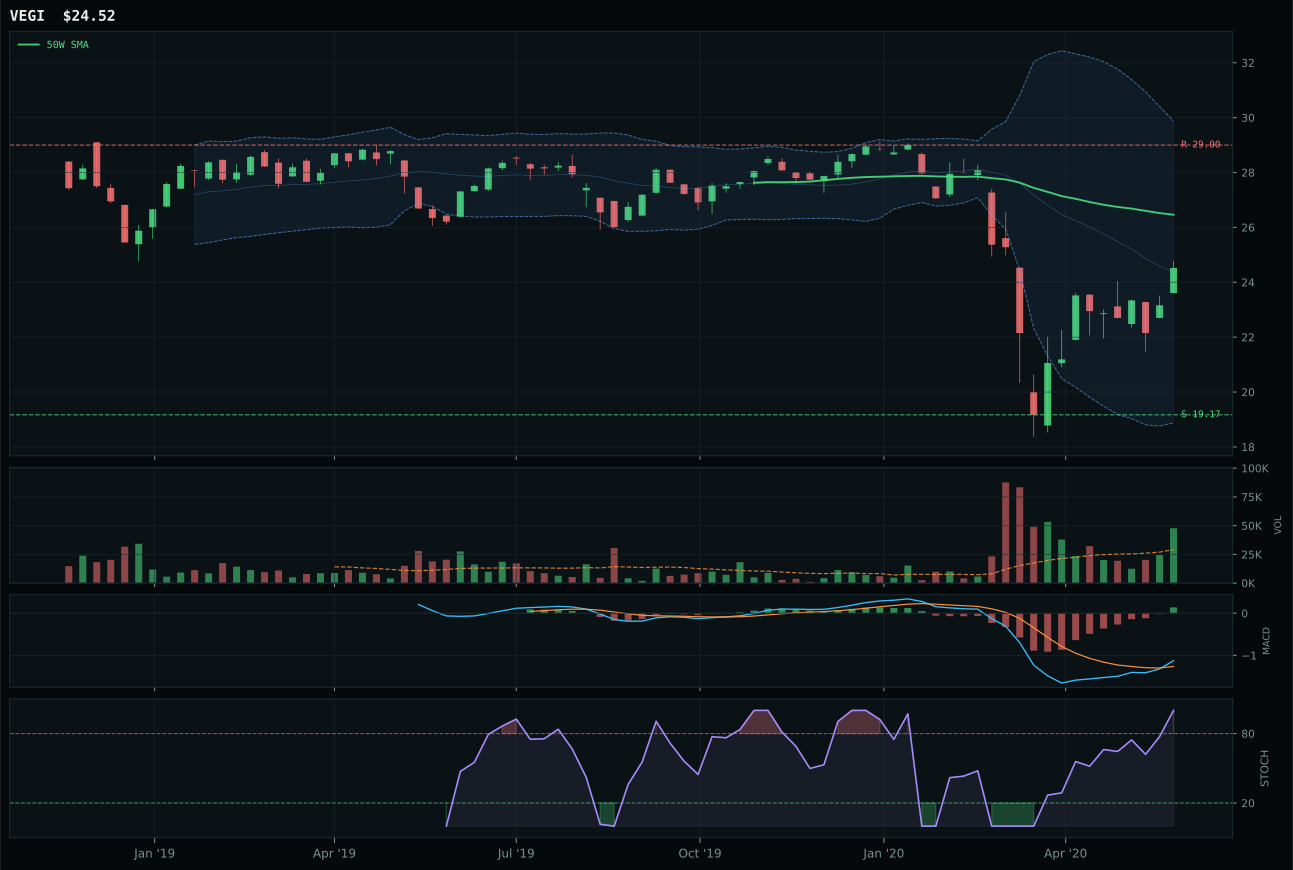
VEGI has a neutral structure profile with -6.1% 13-week relative strength versus SPY.
Extension and support failure are the main tactical risks.
Tracked, but not top-2 eligible because: structurally broken.
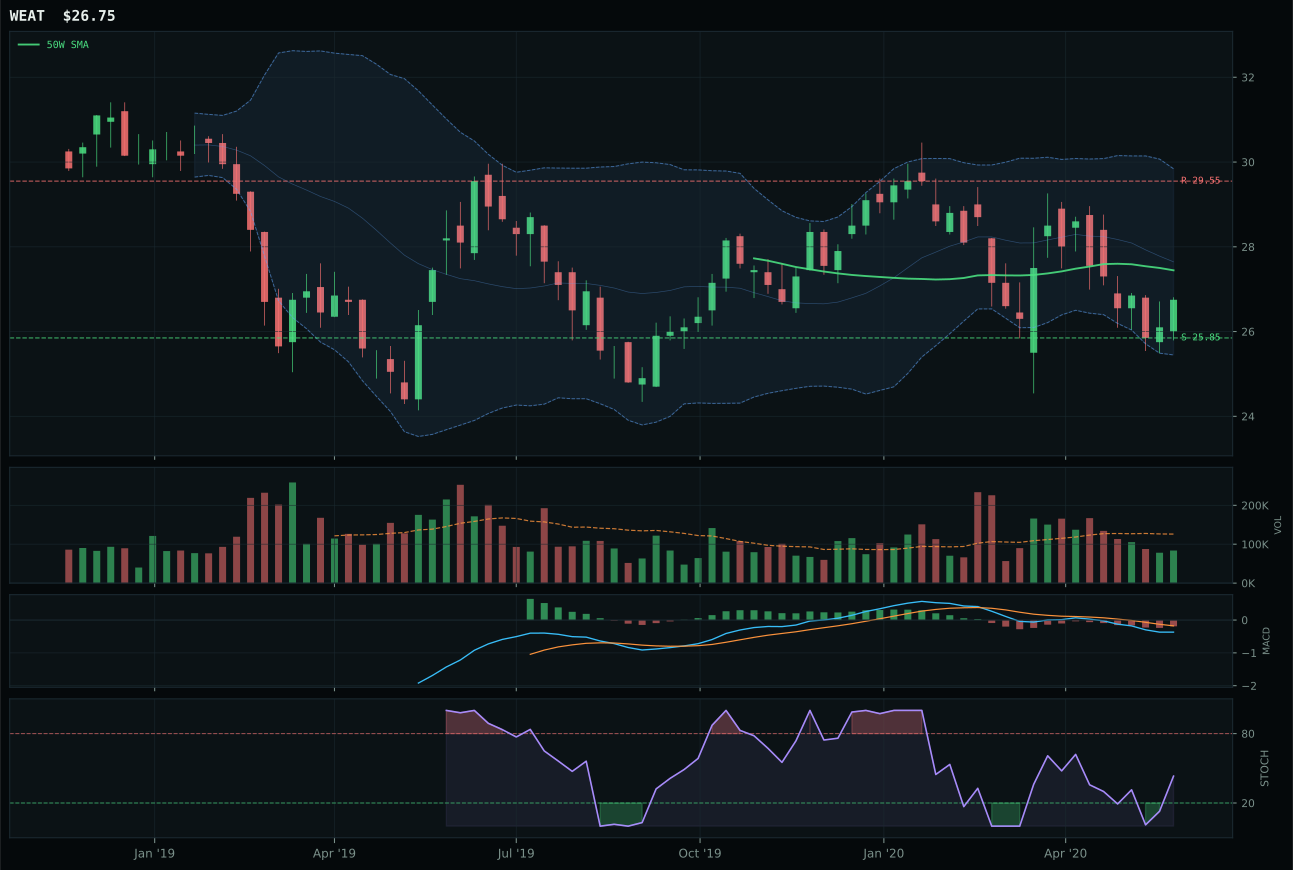
WEAT has a pullback into support profile with -4.2% 13-week relative strength versus SPY.
Extension and support failure are the main tactical risks.
Tracked, but not top-2 eligible because: structurally broken.
MOO won Agriculture despite brutal technicals—below both the 50W and 200W with -4.7% SPY-relative weakness and only -2.0% thirteen-week return—because it alone preserved structural integrity while competitors fractured. VEGI triggered hard filters (structurally broken classification) and posted a cleanliness score of 42.6 versus MOO's 62.2, disqualifying it from serious consideration despite better volume sponsorship; WEAT collapsed entirely with bearish/weakening MACD and a pullback-into-support setup that failed to confirm. MOO's Fib location at middle retracement / decision zone (0.382) combined with bullish-improving MACD created at least a technical argument for mean reversion, even if thirteen-week evidence is neutral. Thin volume across the entire category (MOO at 0.53x) confirms no institutional interest, yet MOO's 75.0 timing score and 63.0 momentum confirmation represent the only candidates with any reversal mechanics available. This is allocation to structure and patience, not to conviction about crop prices or livestock cycles.
Agriculture was allocated zero percent because its 9.7 final score represented the weakest or second-weakest category (alongside Industrial Metals at 20.8), and active macro conditions actively penalized the sector—disinflation pressure carried a minus-8 weight at the category level, directly crushing demand narratives for agricultural commodities. MOO's 75.0 timing score alone cannot override a 47.9 trend score (price below both the 50W and 200W) and a 46.8 risk-reward profile offering marginal 31.1% downside support cushion against -15.1% upside resistance headroom. The 45.0 macro fit score reflects no category-specific tailwind; the Goldilocks regime offers no structural support for cyclical agricultural exposure. Unlike BOTZ or URA, which earned 10% allocations on the back of better technical evidence and non-negative macro conditions, MOO faced a category so thoroughly out of favor that even the winner was unfit for deployment. The zero allocation remains appropriate until disinflation pressure eases off the descriptor board and the 3/2/1 ETF basket score materially improves.