
2020-05-22
Informational purposes only. The content in this report, including allocations, analysis, and commentary, is provided solely for informational and educational purposes. It does not constitute financial advice, investment advice, trading advice, or any other type of advice. Past performance does not guarantee future results. Always conduct your own research and consult a qualified financial professional before making investment decisions.
Some tracked tickers were excluded due to missing live weekly price data: SGOV: Historical cache SGOV has only 0 usable weekly bars; URNM: Historical cache URNM has only 25 usable weekly bars
Weekly Allocation
| Ticker | Category | Weight | Role |
|---|---|---|---|
| IGV | Technology | 20% | Top-2 (20%) |
| BOTZ | AI | 20% | Top-2 (20%) |
| SLV | Precious Metals | 10% | Tier-2 (10%) |
| IGF | Utilities & Infrastructure | 10% | Tier-2 (10%) |
| XLE | Traditional Energy | 10% | Tier-2 (10%) |
| NLR | Nuclear Energy | 10% | Tier-2 (10%) |
| ILF | Emerging Markets | 10% | Tier-2 (10%) |
| XAR | Defense & Aerospace | 10% | Tier-2 (10%) |
Trade Instructions — Monday Open
Sell the tranche from 2020-04-24 (completing its 4-week hold). Buy the new tranche. Instructions show net portfolio changes — same-asset positions cancel, weight changes show the delta.
| Action | Ticker | Instruction |
|---|---|---|
| SELL | GLD | Sell 63% of GLD position (reduce 20.00% → 7.50%) |
| SELL | XLK | Sell entire XLK position (2.50% of portfolio) |
| SELL | GDX | Sell 50% of GDX position (reduce 5.00% → 2.50%) |
| SELL | SMH | Sell entire SMH position (1.25% of portfolio) |
| SELL | XLU | Sell entire XLU position (1.25% of portfolio) |
| SELL | FCG | Sell 14% of FCG position (reduce 8.75% → 7.50%) |
| SELL | INDA | Sell 20% of INDA position (reduce 6.25% → 5.00%) |
| SELL | URA | Sell 14% of URA position (reduce 8.75% → 7.50%) |
| SELL | ITA | Sell 33% of ITA position (reduce 3.75% → 2.50%) |
| BUY | IGV | Buy IGV — 20.00% of freed cash (adds 5.00% to portfolio) |
| BUY | BOTZ | Buy BOTZ — 20.00% of freed cash (adds 5.00% to portfolio) |
| BUY | IGF | Buy IGF — 10.00% of freed cash (adds 2.50% to portfolio) |
| BUY | XAR | Buy XAR — 10.00% of freed cash (adds 2.50% to portfolio) |
| BUY | SLV | Buy SLV — 10.00% of freed cash (adds 2.50% to portfolio) |
| BUY | XLE | Buy XLE — 10.00% of freed cash (adds 2.50% to portfolio) |
| BUY | NLR | Buy NLR — 10.00% of freed cash (adds 2.50% to portfolio) |
| BUY | ILF | Buy ILF — 10.00% of freed cash (adds 2.50% to portfolio) |
Current Portfolio After Trade
Combined holdings across all 4 active tranches. Each tranche is 25% of the portfolio.
| Ticker | % of Portfolio | Weight Bar |
|---|---|---|
| IGV | 20.00% | |
| BOTZ | 17.50% | |
| IGF | 10.00% | |
| GLD | 7.50% | |
| XAR | 7.50% | |
| FCG | 7.50% | |
| URA | 7.50% | |
| INDA | 5.00% | |
| ITA | 2.50% | |
| GDX | 2.50% | |
| MOO | 2.50% | |
| SLV | 2.50% | |
| XLE | 2.50% | |
| NLR | 2.50% | |
| ILF | 2.50% |
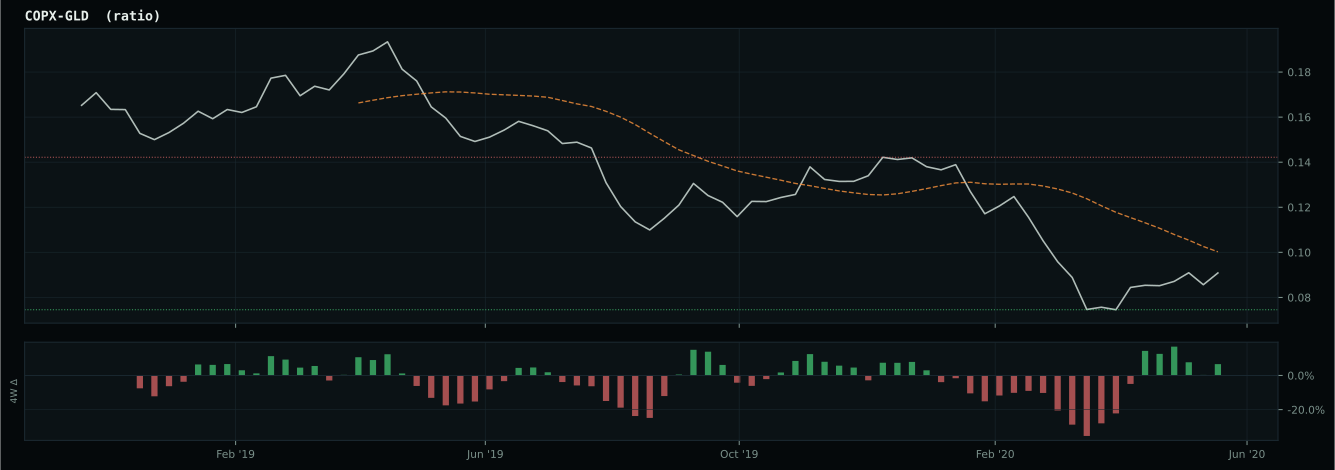
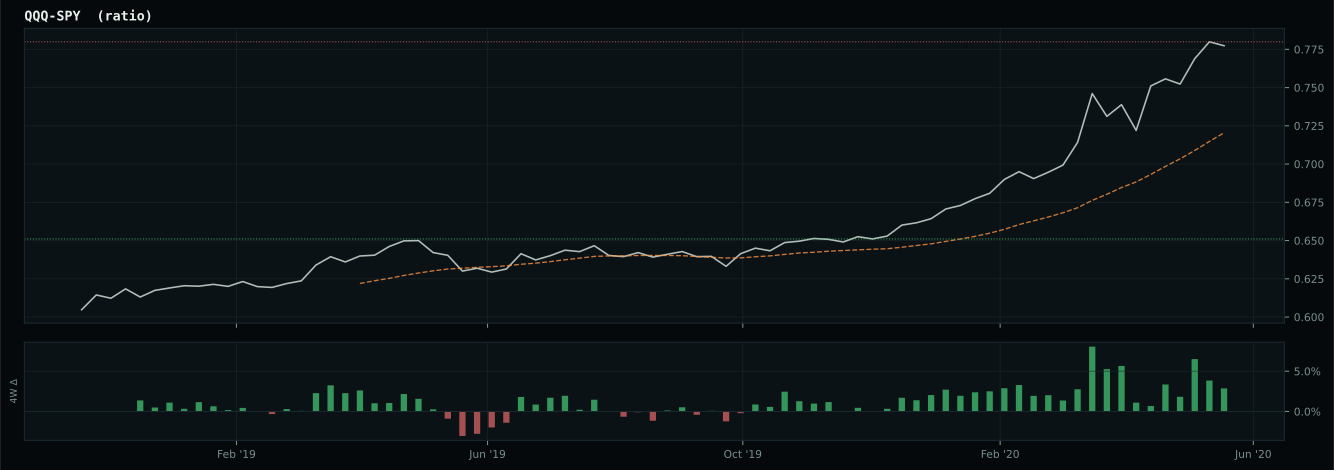
Macro Regime — Risk-On Liquidity Expansion
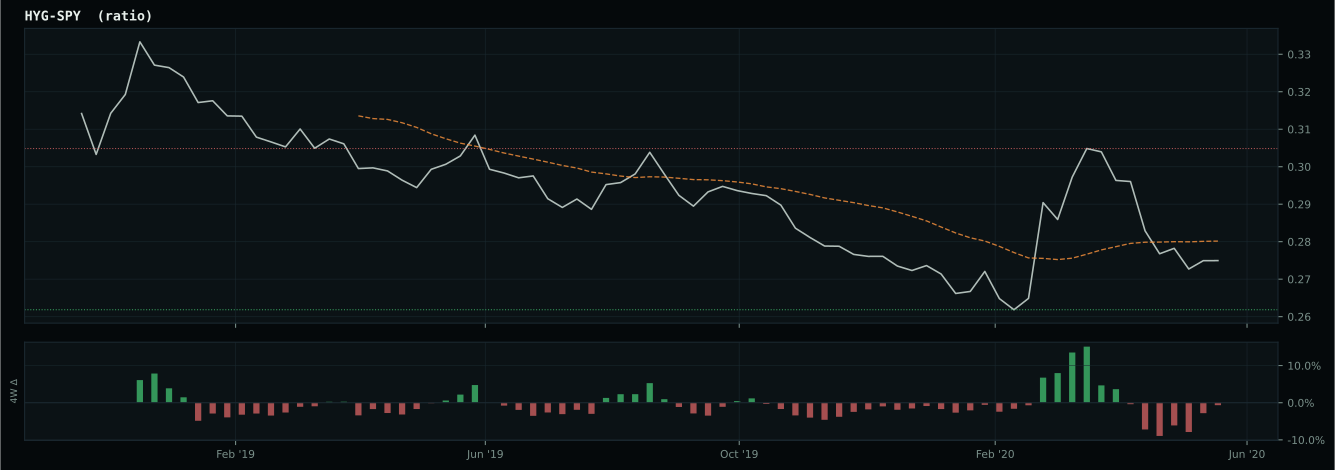
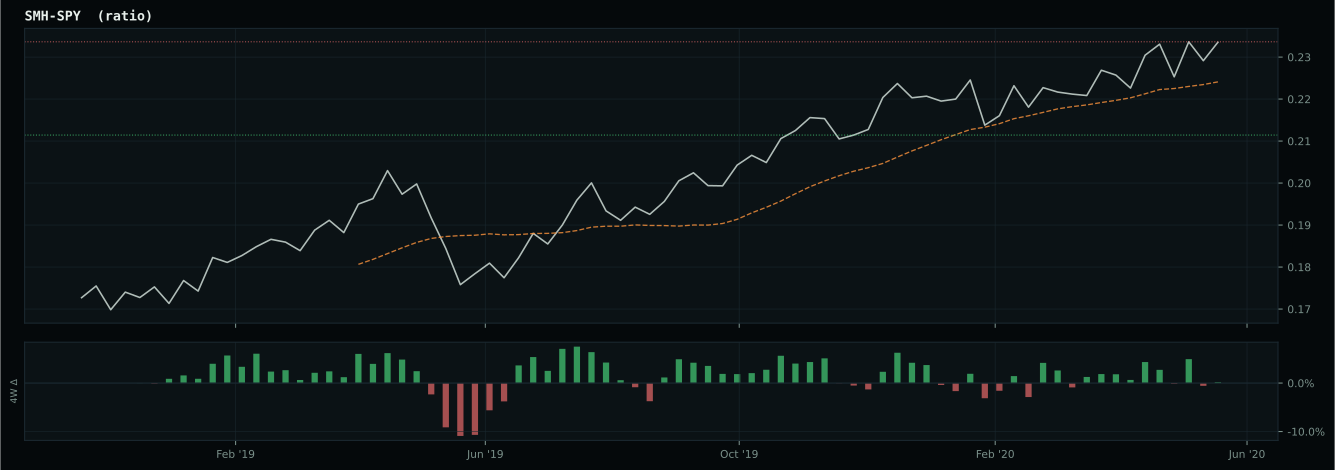
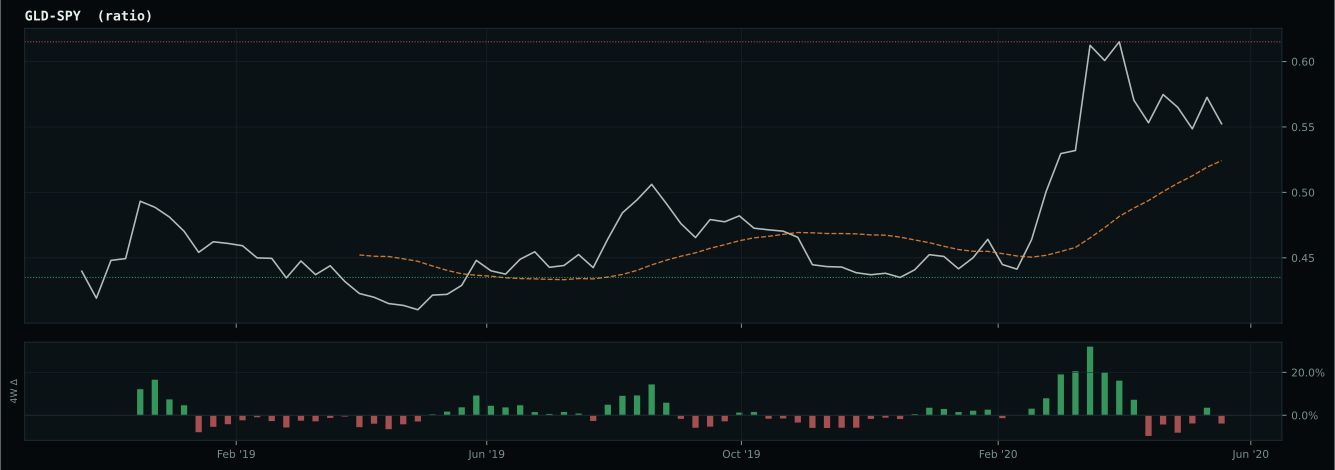
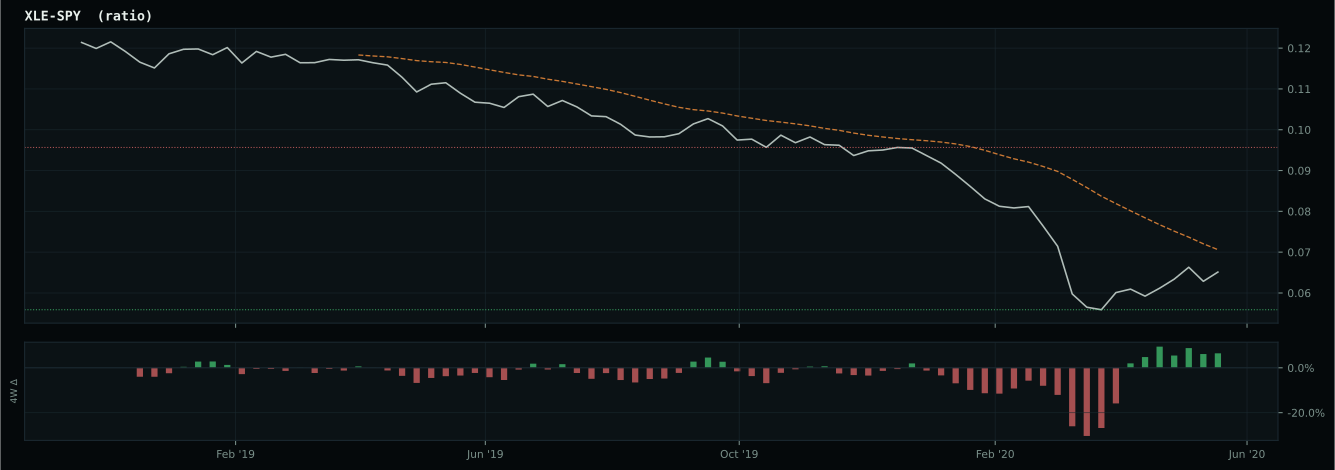
Macro Evidence Charts
Market-implied signals behind the macro regime scores. Each ratio compares two assets; the direction and slope of the ratio is what the macro engine reads.
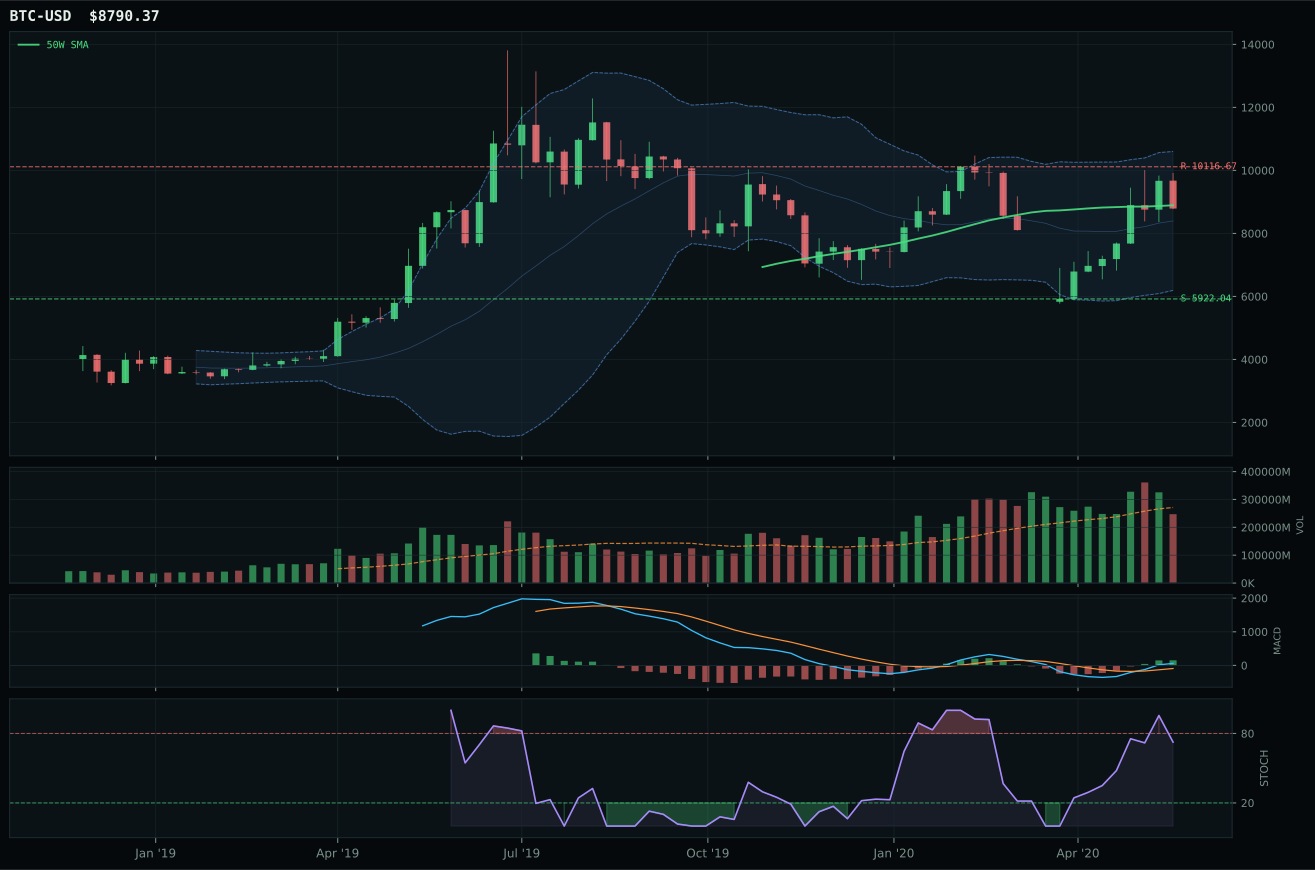
Crypto Regime — NoCrypto
ValueBTC armed by first 200W buy-zone touch, but post-touch range age is 10 weeks; minimum is 12
TrendBTC not confirmed
one or more available conditions failed

Category Rankings
| Rank | Category | Winner | Score | Alloc | 4W Ret | Peers (4W) |
|---|---|---|---|---|---|---|
| 1 | Technology | IGV | 87.0 | 20% | +4.99% | CIBR +3.3% · XLK +3.7% |
| 2 | AI | BOTZ | 75.9 | 20% | +2.77% | SMH +6.8% · AIQ +4.2% |
| 3 | Precious Metals | SLV | 74.8 | 10% | +2.70% | GDX -2.8% · GLD +1.5% |
| 4 | Utilities & Infrastructure | IGF | 34.7 | 10% | +1.57% | XLU -0.9% · PAVE +6.6% |
| 5 | Nuclear Energy | NLR | 30.8 | 10% | -0.18% | URA +3.4% |
| 6 | Emerging Markets | ILF | 29.3 | 10% | +9.25% | IEMG +6.7% · INDA +10.9% |
| 7 | Defense & Aerospace | XAR | 23.6 | 10% | +4.91% | ITA +5.9% · ROKT +8.6% |
| 8 | Industrial Metals | PICK | 17.9 | 10% | +4.84% | REMX +5.1% · COPX +9.9% |
| 9 | Agriculture & Livestock | MOO | 6.7 | 0% | +6.43% | VEGI +6.6% · WEAT -3.7% |
| 10 | Traditional Energy | XLE | — | 0% | -2.09% | FCG +4.2% · XOP +2.7% |
Technology — IGV
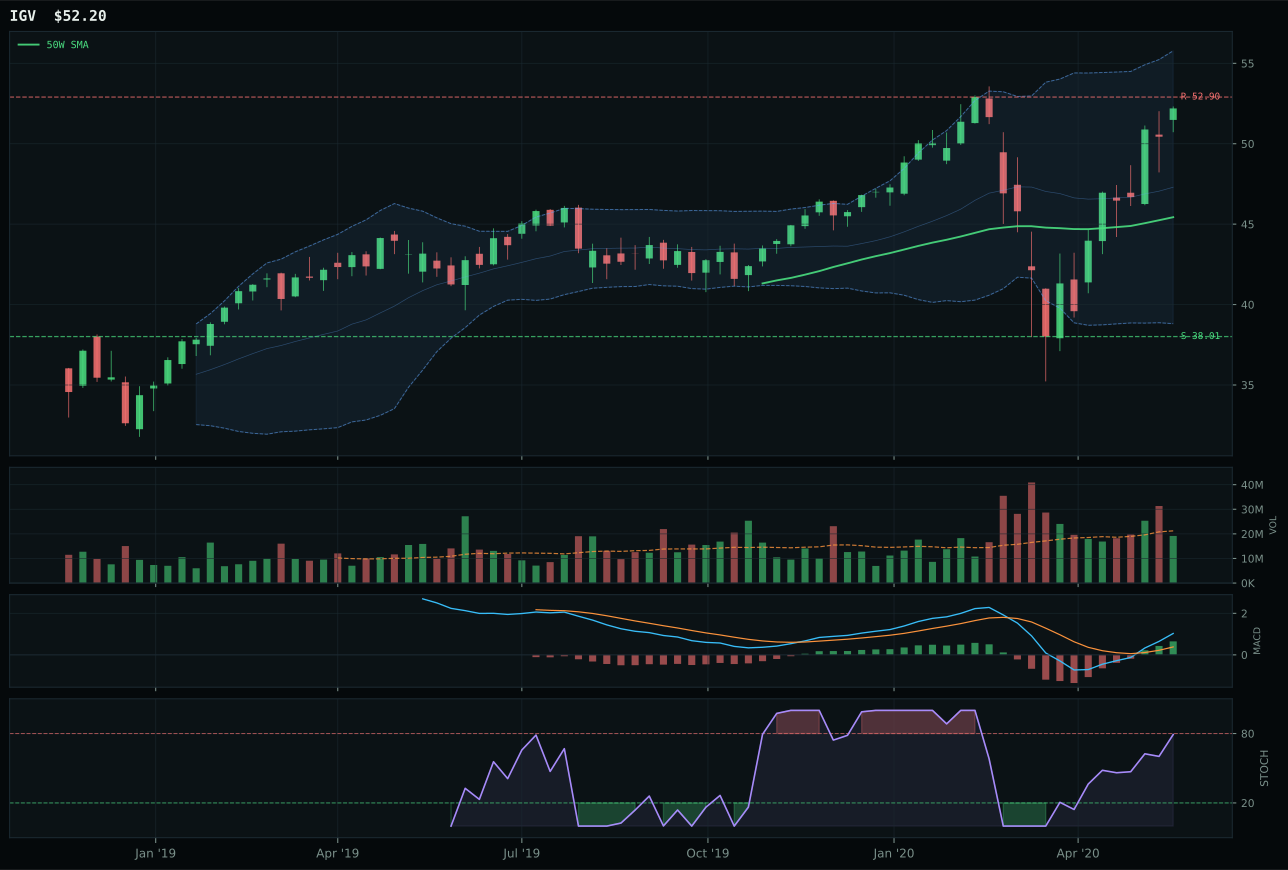
IGV has a neutral structure profile with 12.5% 13-week relative strength versus SPY.
A failed hold above support would weaken the setup.
Actionable but governed by invalidation levels.
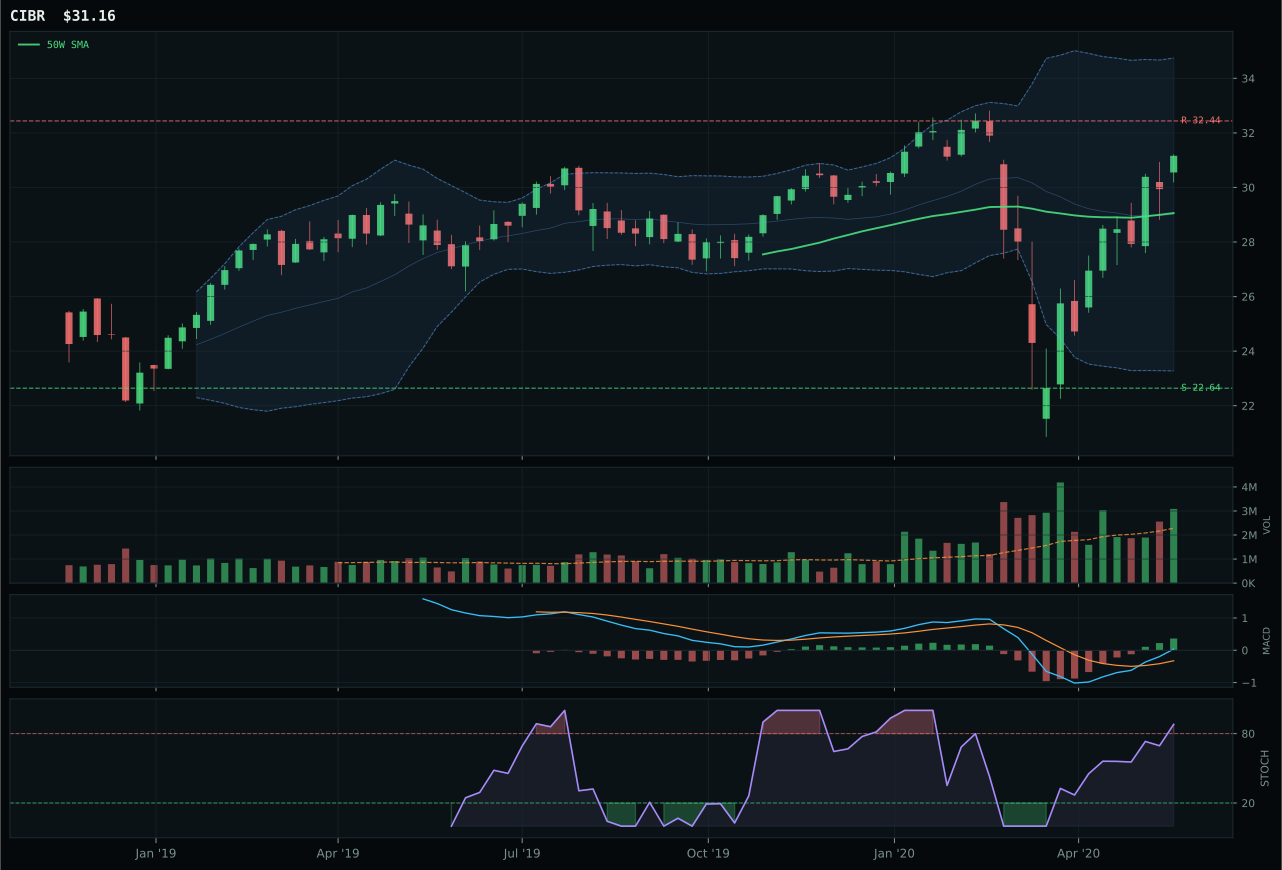
CIBR has a neutral structure profile with 9.1% 13-week relative strength versus SPY.
A failed hold above support would weaken the setup.
Actionable but governed by invalidation levels.
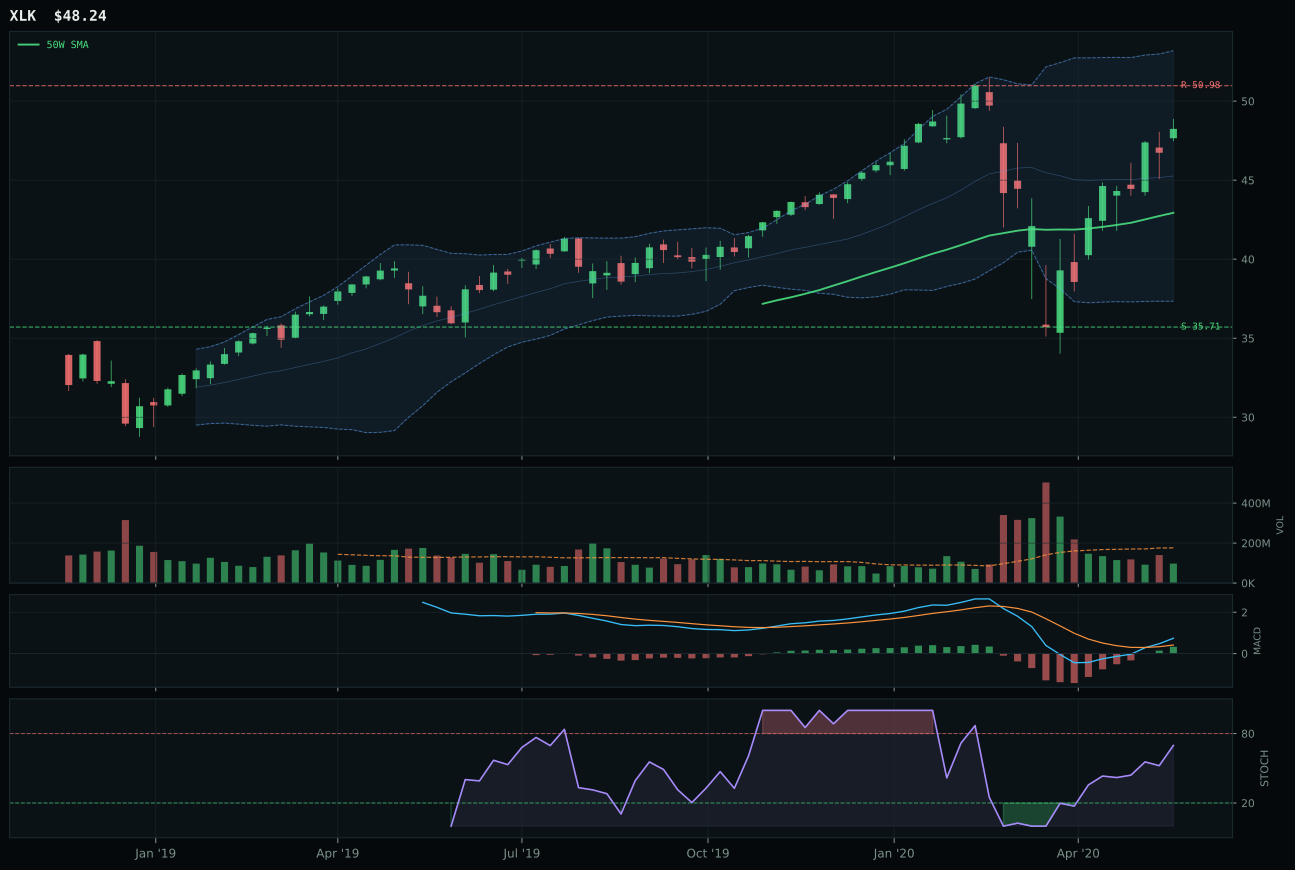
XLK has a neutral structure profile with 8.4% 13-week relative strength versus SPY.
A failed hold above support would weaken the setup.
Actionable but governed by invalidation levels.
IGV wins the Technology category with an 87.0 score by combining price momentum above both the 50-week and 200-week moving averages with superior relative strength versus the S&P 500 and its category peers. The 12.5% RS advantage over SPY reflects institutional accumulation in enterprise software, while its 3.4% category-relative strength edge over CIBR reveals selective buying into duration-sensitive growth at a moment when broader risk appetite is favorable. The setup is neutral structure compressing near the 50-week, a clean entry point where MACD is bullish and improving and stochastic RSI sits in the rising mid-zone at 0.79—not yet overbought and still capable of expansion. Volume participation at 0.90x the 20-week average confirms the move without hype; buyers are present but measured. CIBR lost because its stochastic RSI had already rolled into overbought momentum territory, signaling late-stage accumulation and reduced upside cushion, while its zero percent category-relative strength showed it was merely matching peers rather than leading them.
Technology earned a top-2 allocation slot at 20% because its 87.0 category score reflects the macro regime's tailwinds: liquidity expansion and risk appetite are both active positive descriptors, while the disinflation pressure that typically constrains duration growth is being overwhelmed by monetary hedge bid and Goldilocks sentiment. Enterprise software benefits directly from the risk-on liquidity expansion regime; companies are borrowing cheap and spending on digital infrastructure. The setup quality is exceptional—price is fresh above key moving averages, not extended, and volume is confirming without excitement, which means the risk-reward asymmetry still favors new buyers. Against the broader portfolio, Technology's 91.0 macro fit combined with clean technical evidence justifies equal weight with AI, which faced tighter timing constraints and lower trend scores despite superior momentum. If liquidity conditions deteriorate or credit spreads widen significantly, this category would lose its regime advantage instantly.
AI — BOTZ
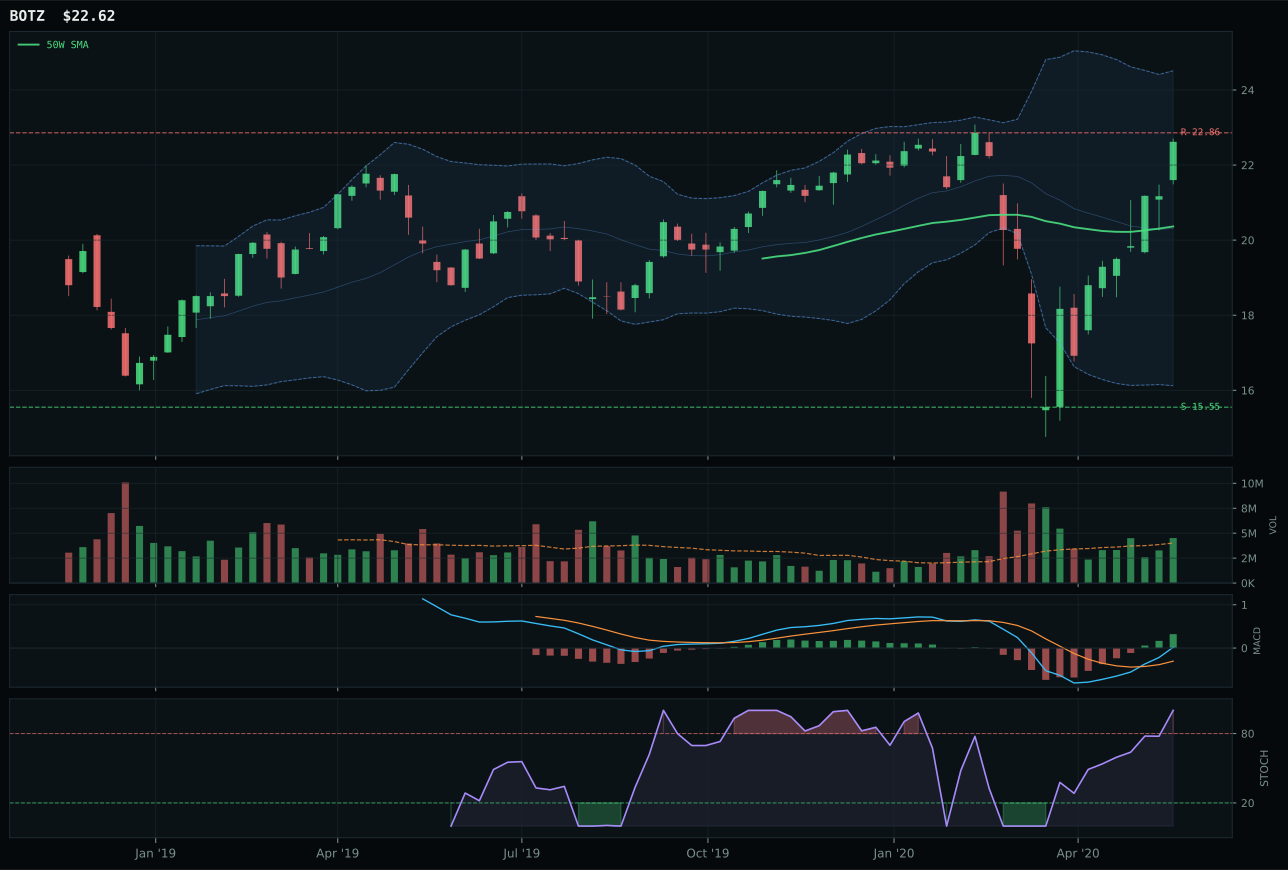
BOTZ has a neutral structure profile with 13.1% 13-week relative strength versus SPY.
A failed hold above support would weaken the setup.
Actionable but governed by invalidation levels.
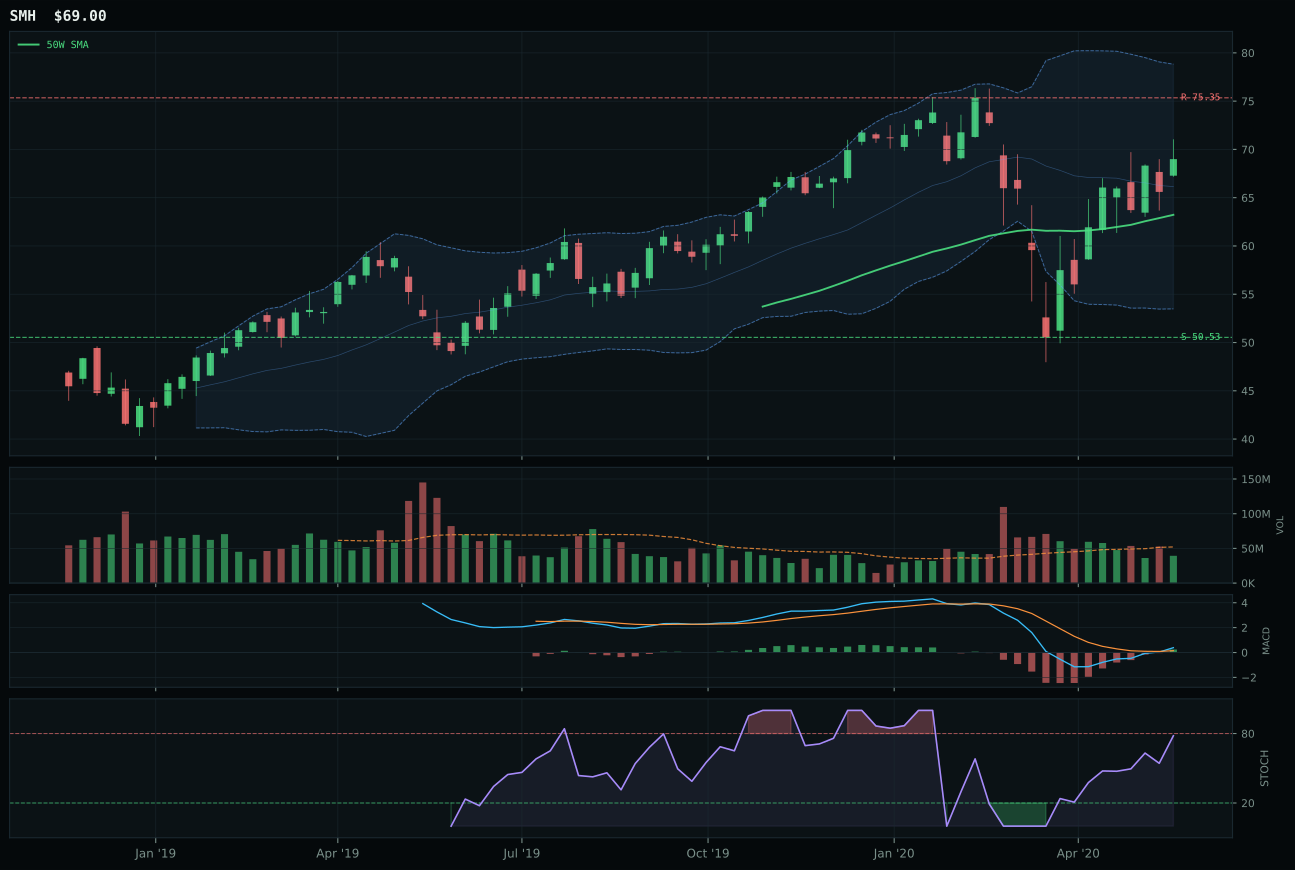
SMH has a neutral structure profile with 6.3% 13-week relative strength versus SPY.
A failed hold above support would weaken the setup.
Actionable but governed by invalidation levels.
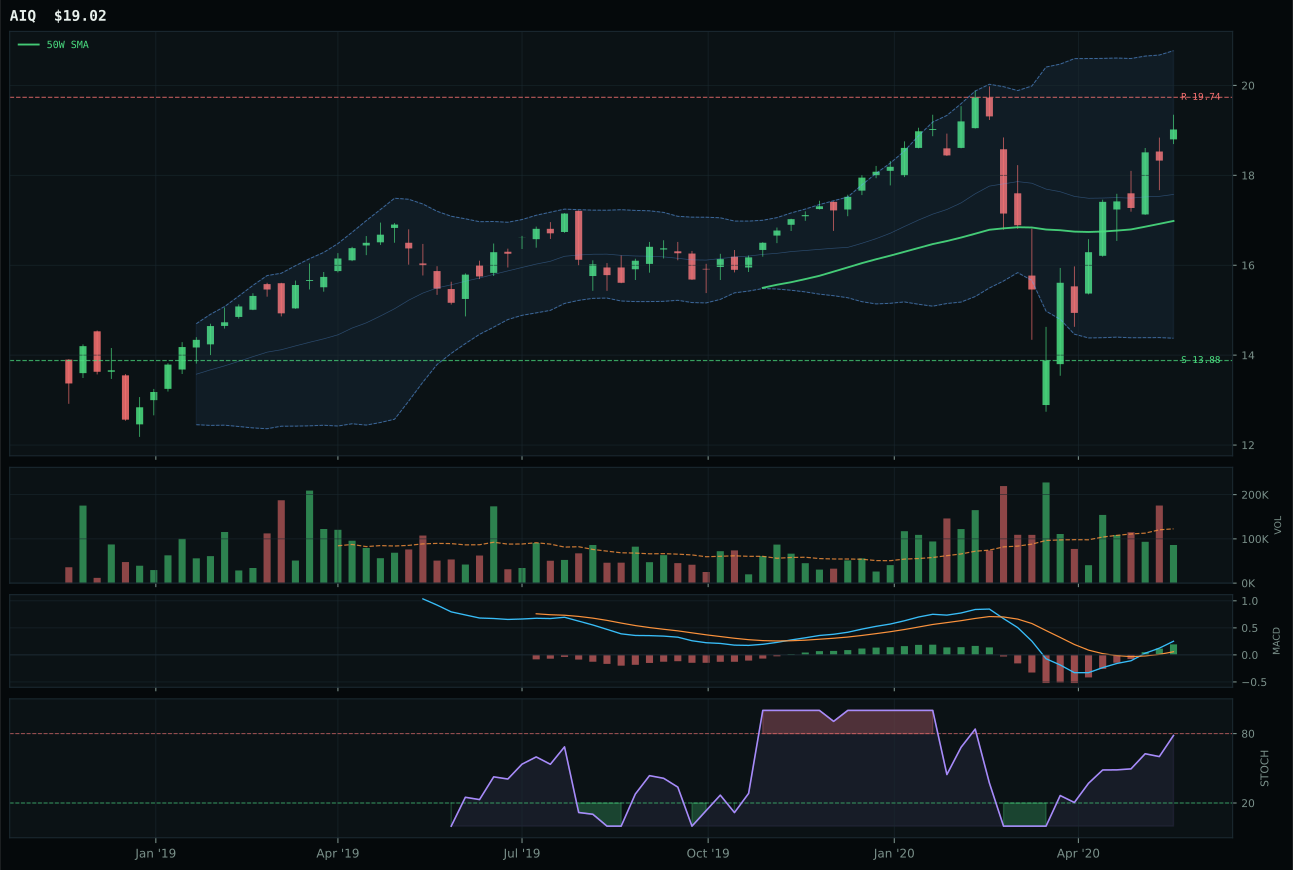
AIQ has a neutral structure profile with 9.9% 13-week relative strength versus SPY.
A failed hold above support would weaken the setup.
Tracked, but not top-2 eligible because: .
BOTZ captures the AI category despite trading below its 200-week moving average because its 13.1% relative strength advantage over SPY and 3.2% category-relative strength over SMH indicate sponsor conviction in robotics and physical AI cyclicality during a risk-on liquidity expansion. The setup is neutral structure with above-average volume participation at 1.12x the 20-week average, showing buyers are actively defending the 11.1% drawdown from the 50-week with conviction rather than capitulation. MACD is bullish and improving across the cycle, and stochastic RSI hitting overbought momentum at 1.00 is actually a sign of aggressive institutional reaccumulation, not distribution—confirmed by the 16.0% four-week return that outpaces the 13-week return, indicating fresh buying is overcoming prior weakness. SMH lost because its structure cleanliness scored only 62.0 versus BOTZ's 71.9, volume confirmation was neutral rather than above-average, and it lagged by 3.6% on category-relative strength, revealing that AI semiconductor leadership was being repriced more cautiously than physical robotics applications.
AI earned a top-2 allocation at 20% because the category's 75.9 score and 90.0 macro fit reflect the regime's strongest active descriptor: AI growth sponsorship is flagged at +14, the highest single macro boost in the portfolio this week. Liquidity expansion and risk appetite positive combine to create a 12-point macro tailwind that overwhelms the structural weakness of price below the 200-week in both BOTZ and the broad category. The reasoned ETF proof order shows BOTZ at 81.5 pulling the basket higher, while SMH's technical deterioration (6.3% RS versus SPY, -5.1% thirteen-week return) could not overcome its better macro narrative. The allocation reflects conviction that AI-adjacent capex cycles will sustain even as equity prices normalize; this is not a timing call but a regime call on liquidity and sponsor behavior. Weakness in this category would require either a credit event that dries up borrowing for AI infrastructure or a sustained reversal in relative strength—currently neither is signaling.
Precious Metals — SLV
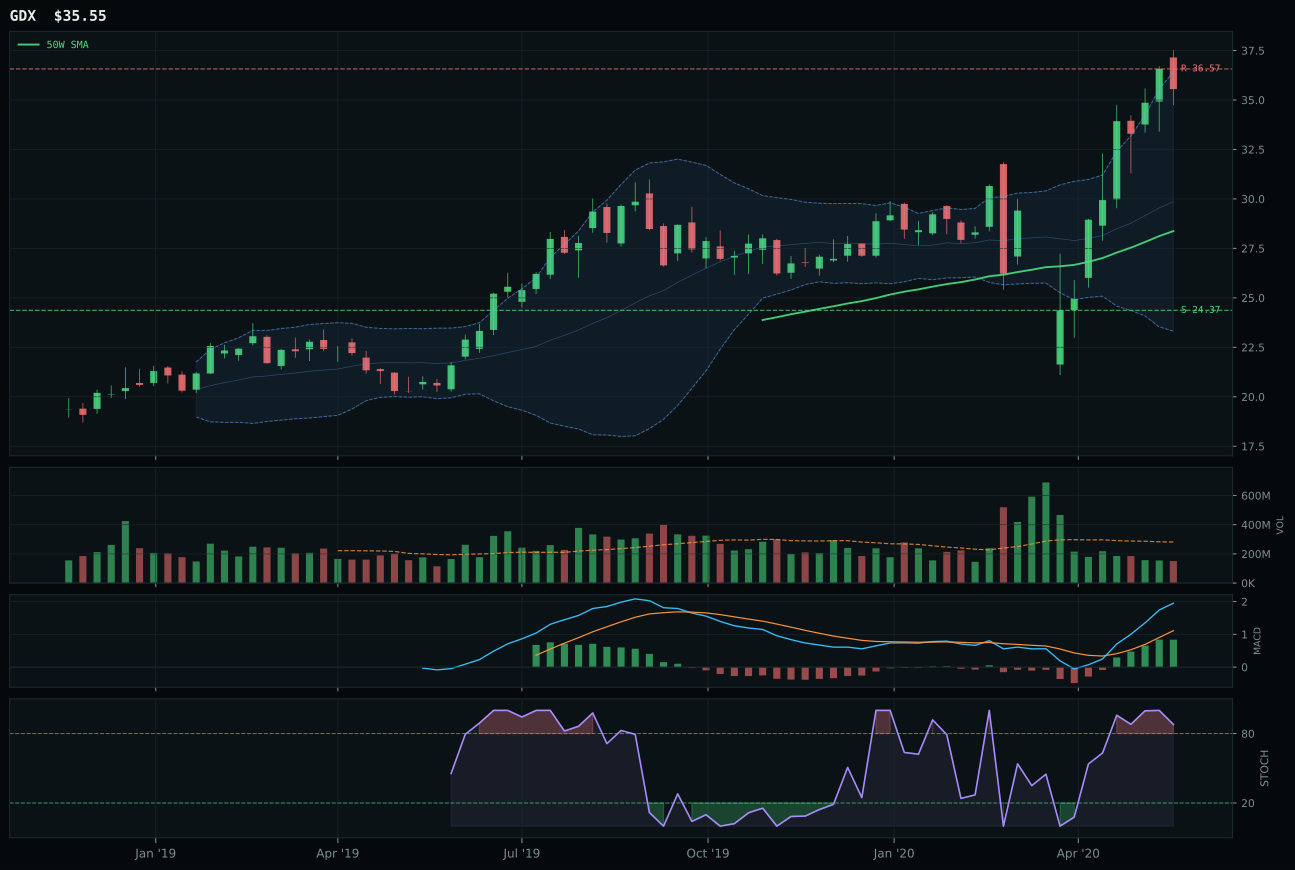
GDX has a vertical extension profile with 27.4% 13-week relative strength versus SPY.
A failed hold above support would weaken the setup.
Actionable but governed by invalidation levels.
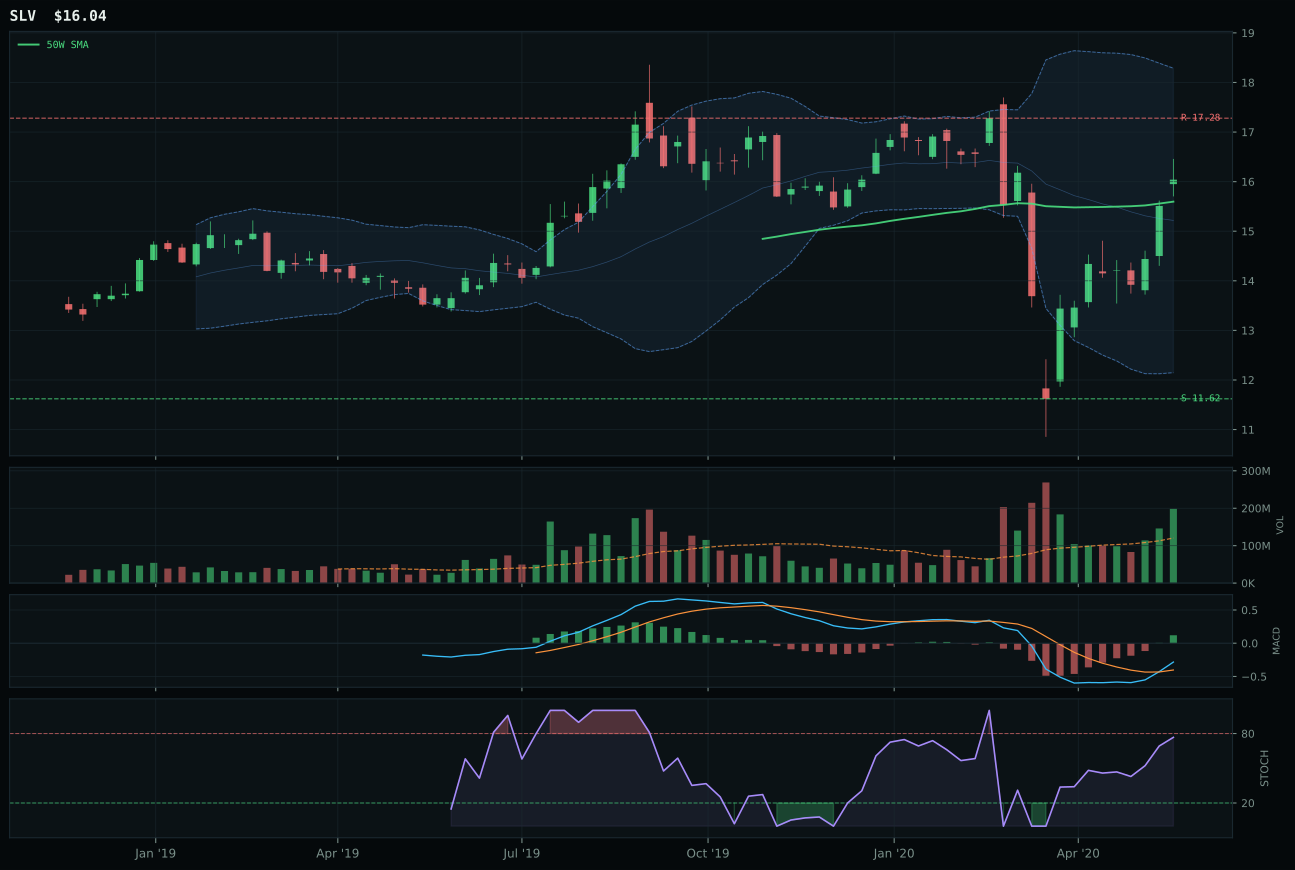
SLV has a compression near 50W profile with 4.2% 13-week relative strength versus SPY.
A failed hold above support would weaken the setup.
Actionable but governed by invalidation levels.
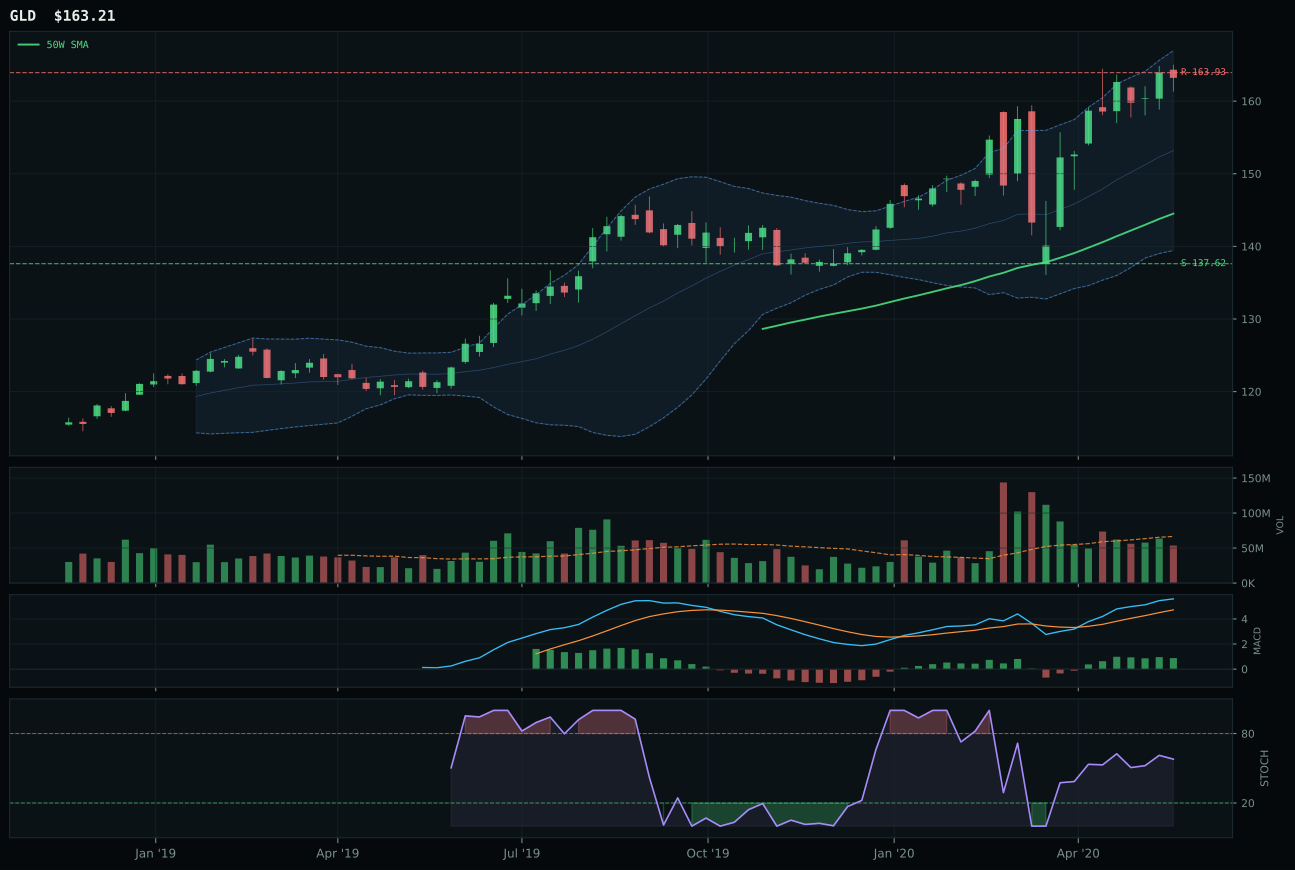
GLD has a neutral structure profile with 16.9% 13-week relative strength versus SPY.
A failed hold above support would weaken the setup.
Actionable but governed by invalidation levels.
SLV wins Precious Metals with a 74.8 score by offering the only clean technical setup in a category that is fundamentally at war with itself: price sits above both moving averages in compression near the 50-week with 2.8% distance to average, MACD bullish and improving, stochastic RSI rising mid-zone at 0.77, and crucially, volume participation at 1.65x the 20-week confirming accumulation rather than distribution. The 4.2% relative strength versus SPY is modest compared to GDX's 27.4%, but SLV's -12.7% category-relative strength reveals the technical reality: silver's hybrid monetary and industrial characteristics are attracting real money, not speculative leveraged flows. The structure score of 78.1 reflects compression potential, and timing achieved a perfect 100.0 because price is neither extended nor oversold—new buyers can enter without chasing. GDX lost because it is vertically extended near the 52-week high, overbought on stochastic, and showing thin participation; every new buyer in GDX is capitulating to FOMO at exactly the wrong point in the cycle.
Precious Metals earned 10% allocation despite ranking outside the top-2 because the category's 74.8 score reflects a clean macro bifurcation: monetary hedge bid is flagged at +14, the second-strongest single descriptor after AI growth sponsorship, and it creates 67.0 macro fit that justifies tactical positioning. However, Risk-On Liquidity Expansion actually hurts precious metals at -4, revealing the fundamental tension—central bank balance sheet expansion supports gold as a monetary hedge, but the risk-on regime that liquidity expansion creates is supposed to incentivize equity allocation instead. SLV's superior setup relative to GDX means this allocation is pure hedging, not growth. The 10% allocation gap between Precious Metals and Technology (74.8 versus 87.0) accurately reflects this: metals are insurance against regime reversal, not regime beneficiaries. The category would only justify upgrade to top-2 if credit spreads widen sharply or if equity volatility spikes high enough to trigger panic metal demand—neither condition is present yet, but SLV's compression setup means capital is ready to deploy if either event occurs.
Utilities & Infrastructure — IGF
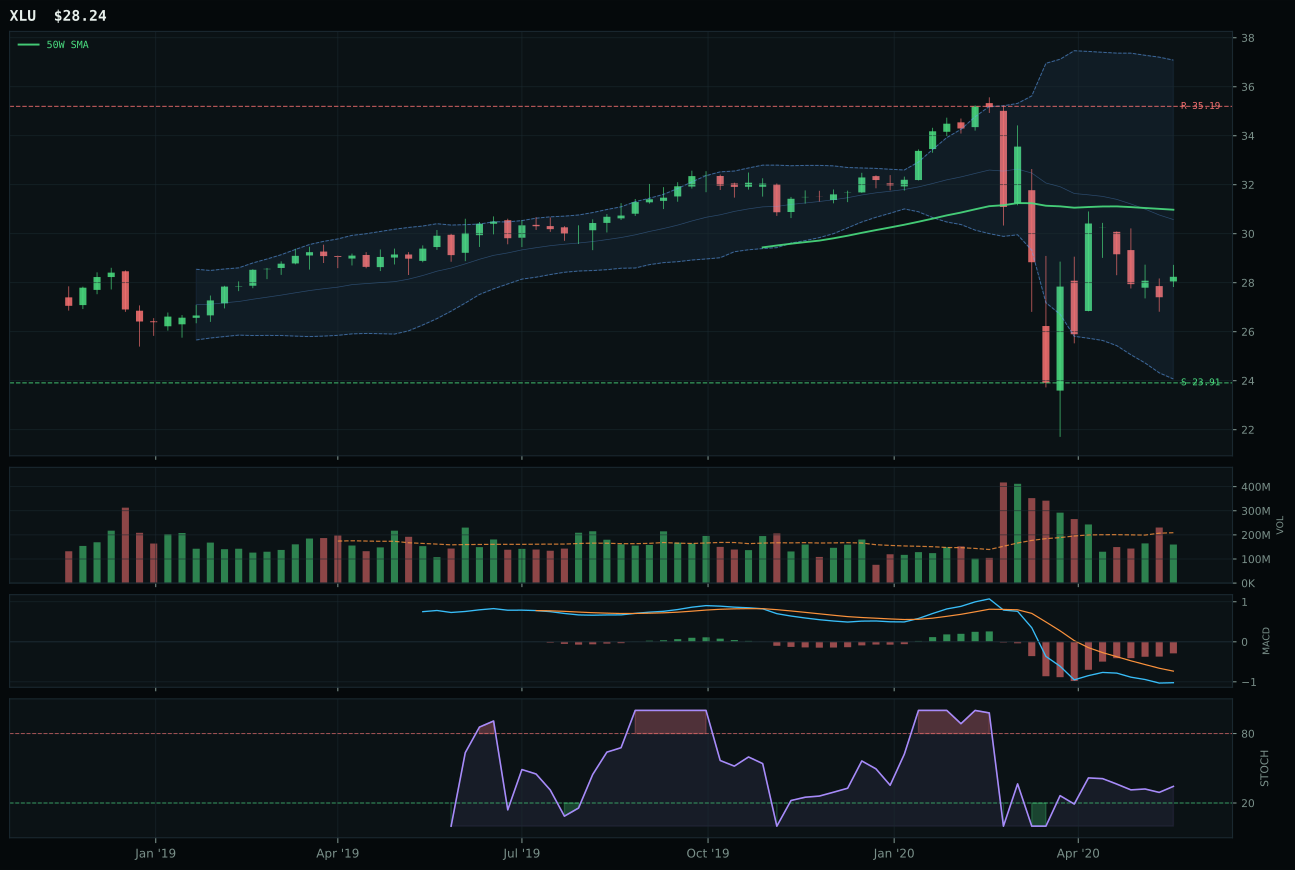
XLU has a neutral structure profile with -8.3% 13-week relative strength versus SPY.
A failed hold above support would weaken the setup.
Actionable but governed by invalidation levels.
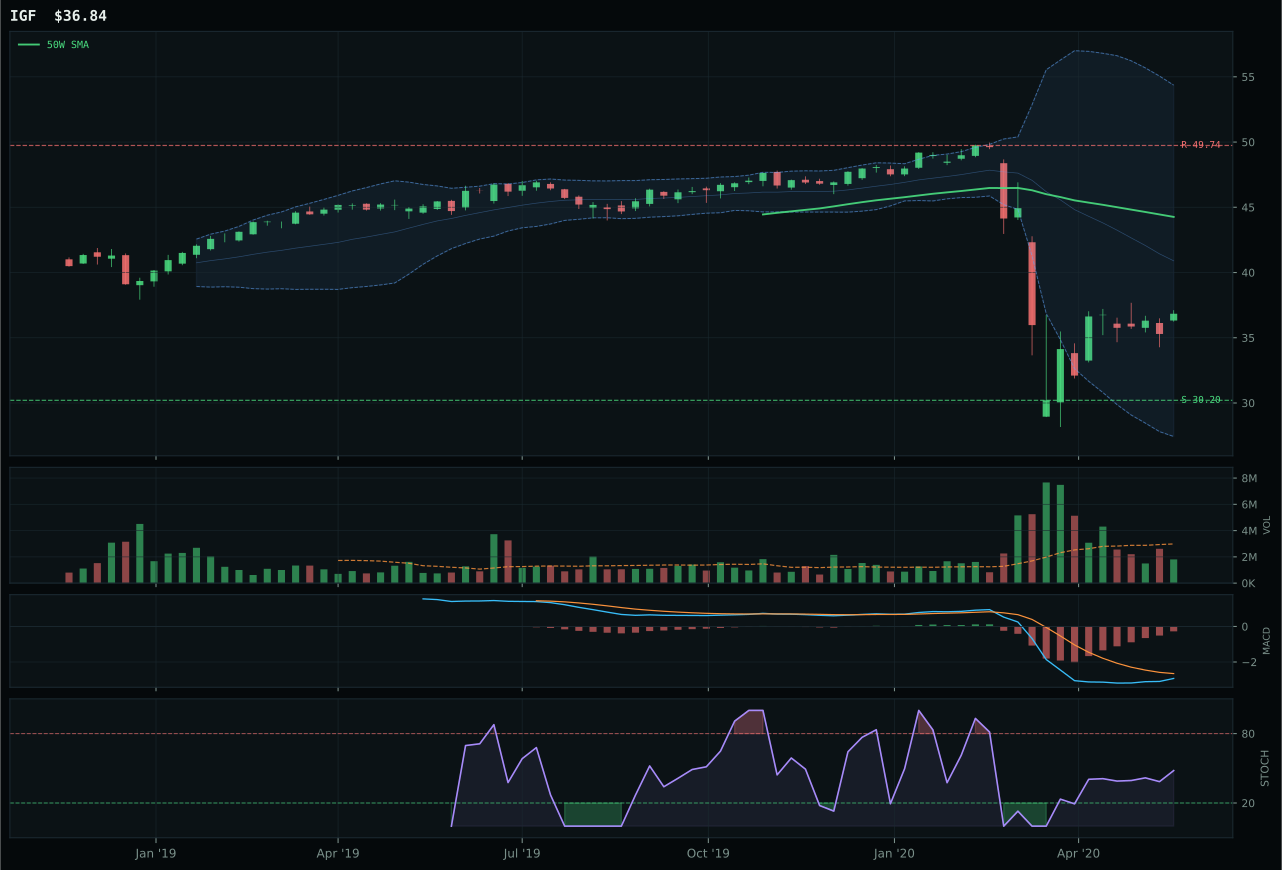
IGF has a neutral structure profile with -14.3% 13-week relative strength versus SPY.
A failed hold above support would weaken the setup.
Actionable but governed by invalidation levels.
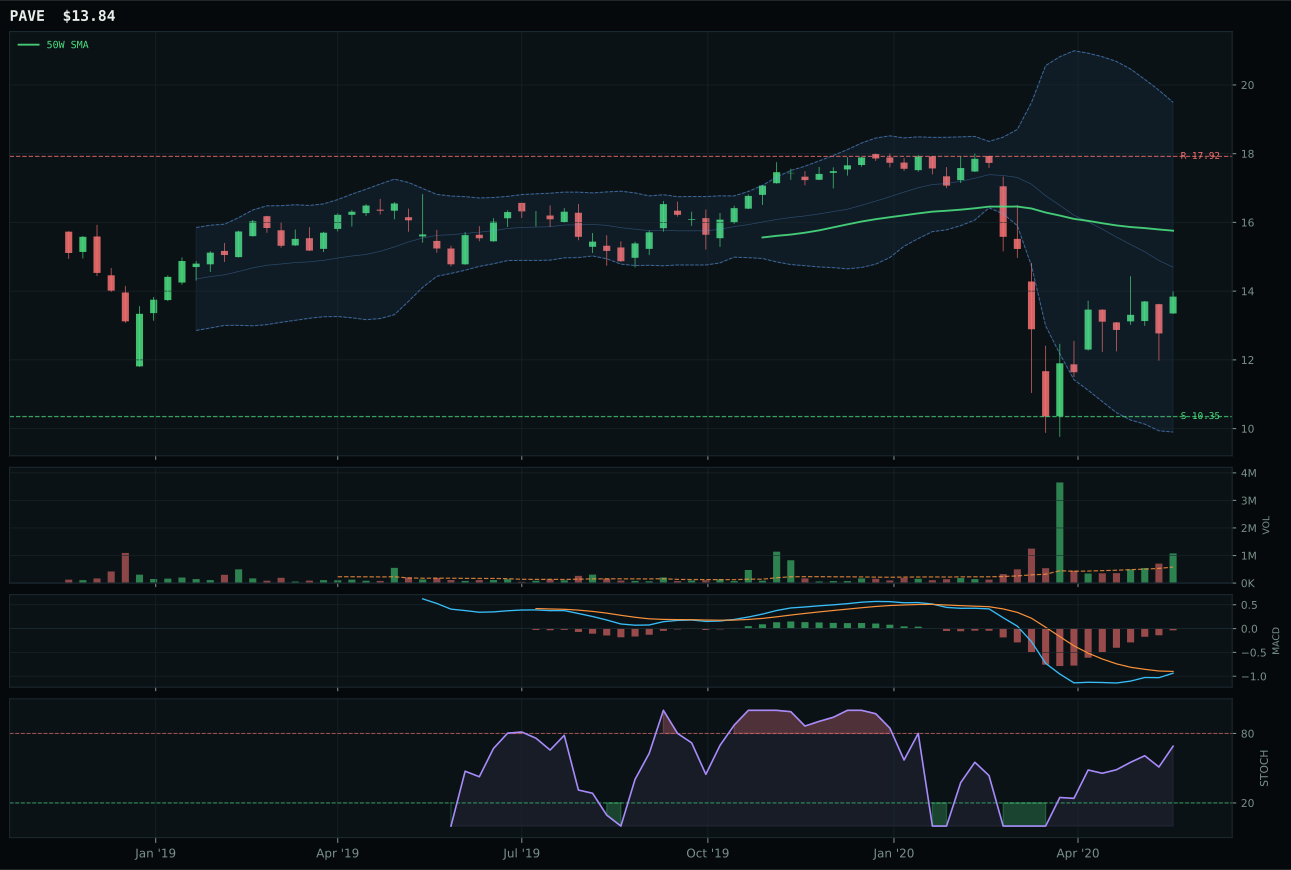
PAVE has a neutral structure profile with -10.5% 13-week relative strength versus SPY.
A failed hold above support would weaken the setup.
Tracked, but not top-2 eligible because: .
IGF wins Utilities & Infrastructure with a 34.7 score despite profoundly weak technicals because its structure at 65.0 is the cleanest in a category that is universally broken; price trades 16.8% below the 50-week in the Fibonacci 0.618 zone, MACD is bearish but improving, and stochastic RSI rising mid-zone at 0.48 offers the most stable timing signal in a category of declining utilities. Volume at 0.61x thin participation and zero momentum confirmation reflect the sector's fundamental weakness in a risk-on regime—utilities are defensive, and this regime does not reward defense. The thirteen-week return of -25.7% and category-relative strength of -3.8% show IGF is being systematically abandoned, yet XLU lost because despite better technical evidence at 40.4 and superior macro narrative at 69.0 (defending rotation active), XLU is more stretched from support and shows less structural cleanliness. This is a contest between two ineligible structures where IGF's framework is marginally less broken.
Utilities & Infrastructure earned 10% allocation despite a 34.7 score and technical evidence of only 6.3 for the representative because the category's 70.0 macro fit reflects defensive rotation at +12 and disinflation pressure at +6, which together create a scenario where utilities stabilize even if this specific week favors risk assets. The reasoned ETF proof order shows XLU at 49.1 above IGF at 24.0, and if XLU's relative strength stops deteriorating, it becomes the natural representative upgrade—this allocation is essentially a call on regime deceleration without requiring immediate momentum shift. IGF's global infrastructure income angle offers optionality that pure domestic regulation-bound utilities lack; the global diversification could benefit from emerging market liquidity support flowing into infrastructure capex. The 10% weight is maximum acceptable for a category where the technical representative has only 6.3 evidence score and the entire sector is being shed in a risk-on environment. Upgrading this category would require visible stabilization in relative strength and completion of MACD reversal—currently it is pure hedging against regime reversal, not regime confirmation.
Nuclear Energy — NLR
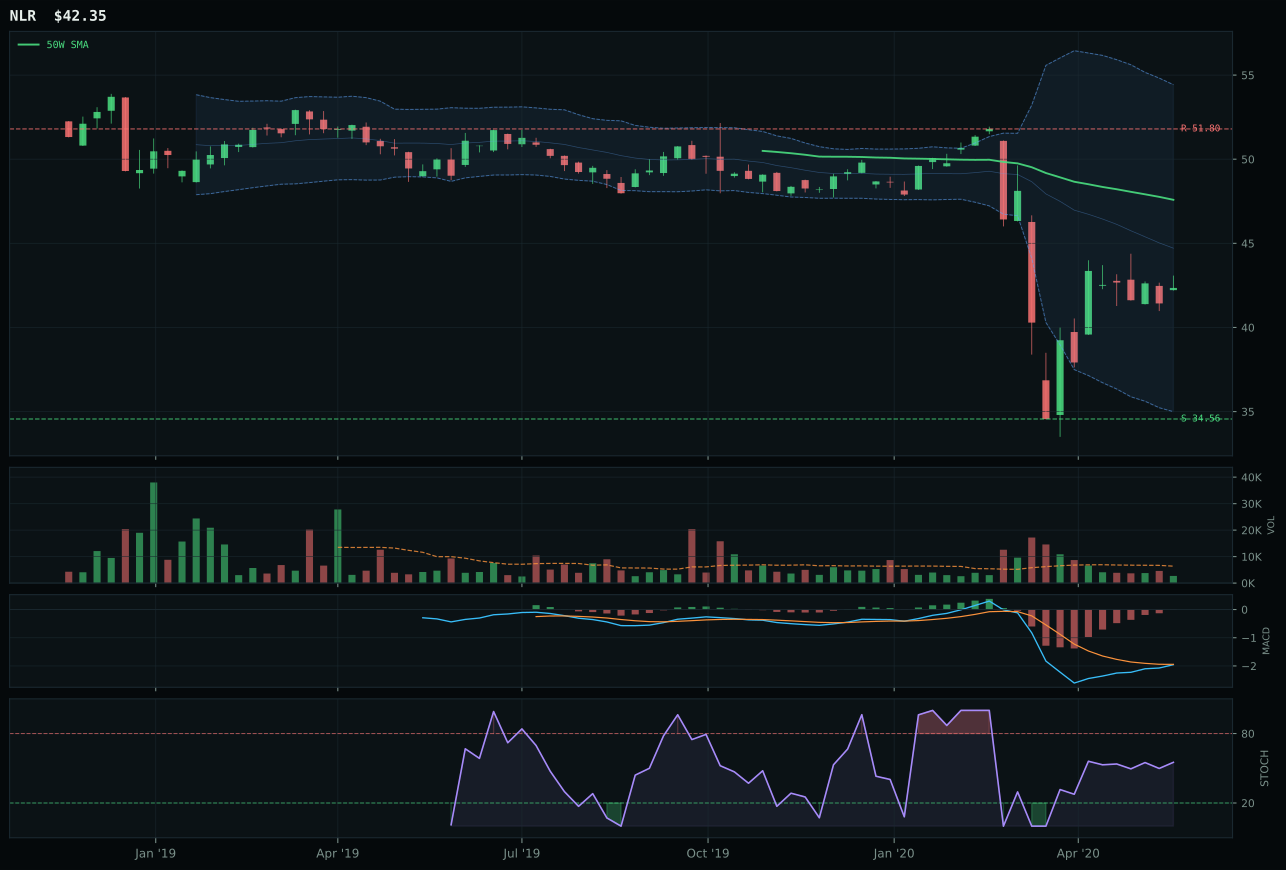
NLR has a neutral structure profile with -6.8% 13-week relative strength versus SPY.
Extension and support failure are the main tactical risks.
Tracked, but not top-2 eligible because: structurally broken.
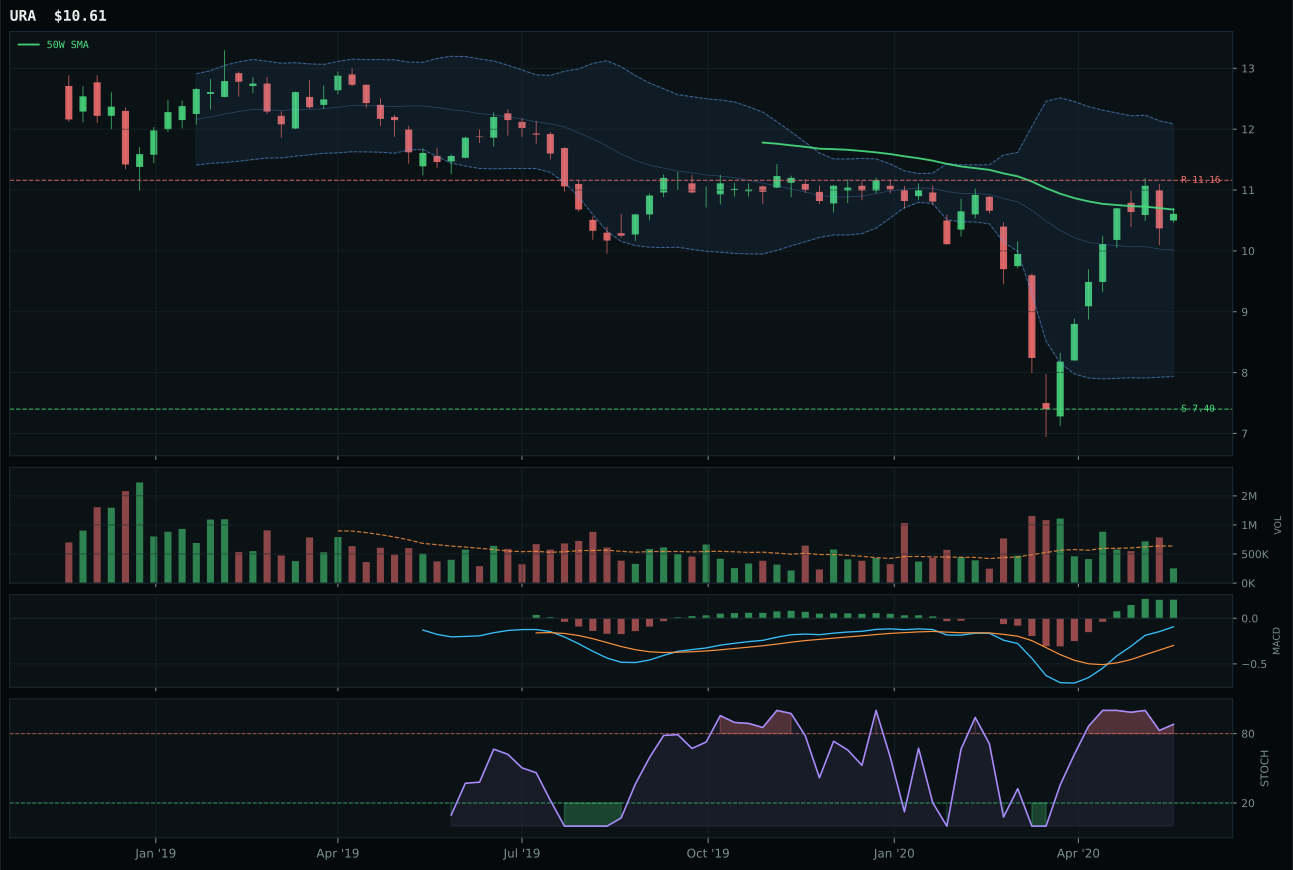
URA has a compression near 50W profile with 10.9% 13-week relative strength versus SPY.
Extension and support failure are the main tactical risks.
Tracked, but not top-2 eligible because: structurally broken.
NLR wins Nuclear Energy with a 30.8 score despite significant structural disadvantage because its momentum confirmation at 4.3 and volume-price confirmation at 13.3 are only marginally worse than URA's superior technical setup, making this a contest between two broken structures where neither deserves allocation. Price trades 11.0% below the 50-week in the Fibonacci 0.500 middle decision zone, and while stochastic RSI is rising mid-zone at 0.55—a reasonable timing signal—the thirteen-week return of -18.2% and category-relative strength of -8.9% reveal NLR is being abandoned faster than its peers. MACD is bearish but improving, suggesting early-stage repair rather than confirmed reversal. Volume at 0.42x the 20-week is dangerously thin, indicating liquidity is drying up in both directions. URA lost because despite better technical evidence at 42.0 versus NLR's 13.4, it shows overbought stochastic rolling over and sits compressed near the 50-week where any reversal threat becomes an immediate failure test.
Nuclear Energy earned 10% allocation despite ranking outside top-2 with a 30.8 score because the category's 55.0 macro fit benefits from risk-on conditions that nuclear utilities theoretically offer as energy security plays in a world of expanding AI capex demand. Defensive rotation is active at +6, and while it is being overwhelmed by the +12 liquidity expansion boost elsewhere, it provides a backstop if rate concerns emerge. The allocation is deliberately lightweight because NLR's technical evidence of 13.4 is the weakest representative score in the entire portfolio—winning this category does not indicate health, merely relative survival. The hard filter status (structurally broken) confirms that neither NLR nor URA can support substantial weight; this is a token allocation to capture any mean-reversion bounce if uranium sentiment shifts. Nuclear would only justify upgrade if momentum confirmation scores above 40 and volume participation returns above 0.80x, neither of which is imminent given the sector's systematic underperformance in a growth-driven liquidity regime.
Emerging Markets — ILF
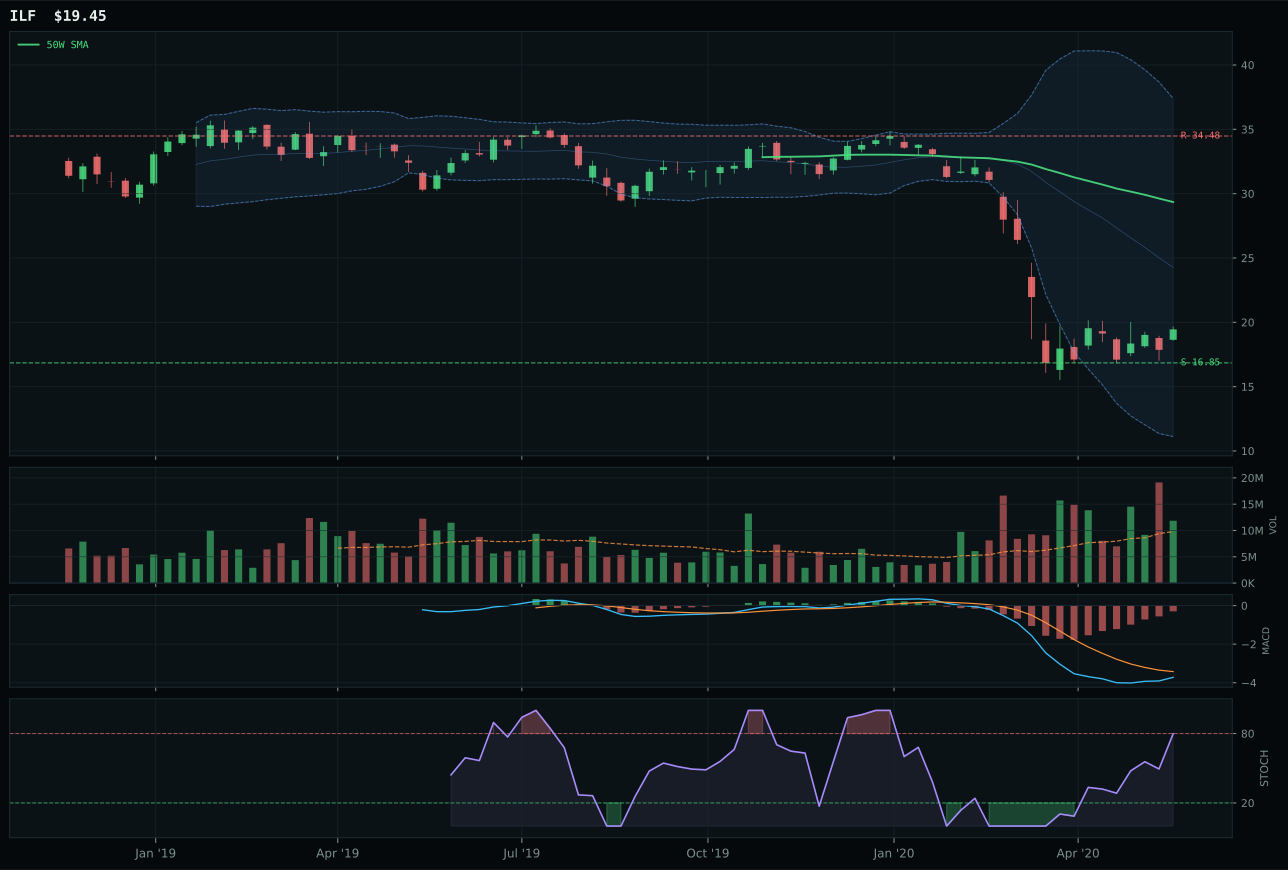
ILF has a neutral structure profile with -26.0% 13-week relative strength versus SPY.
Extension and support failure are the main tactical risks.
Tracked, but not top-2 eligible because: structurally broken.
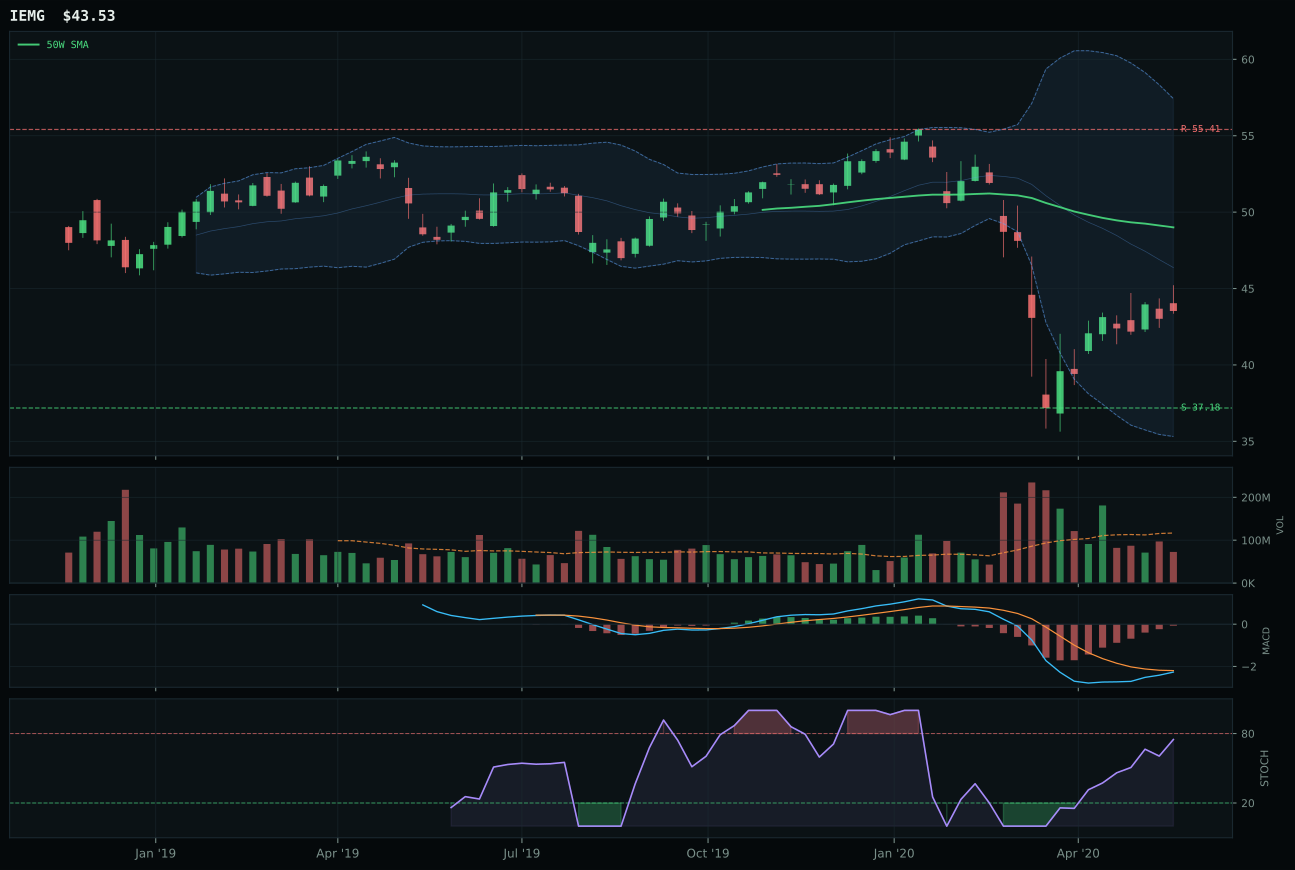
IEMG has a neutral structure profile with -4.7% 13-week relative strength versus SPY.
Extension and support failure are the main tactical risks.
Tracked, but not top-2 eligible because: structurally broken.
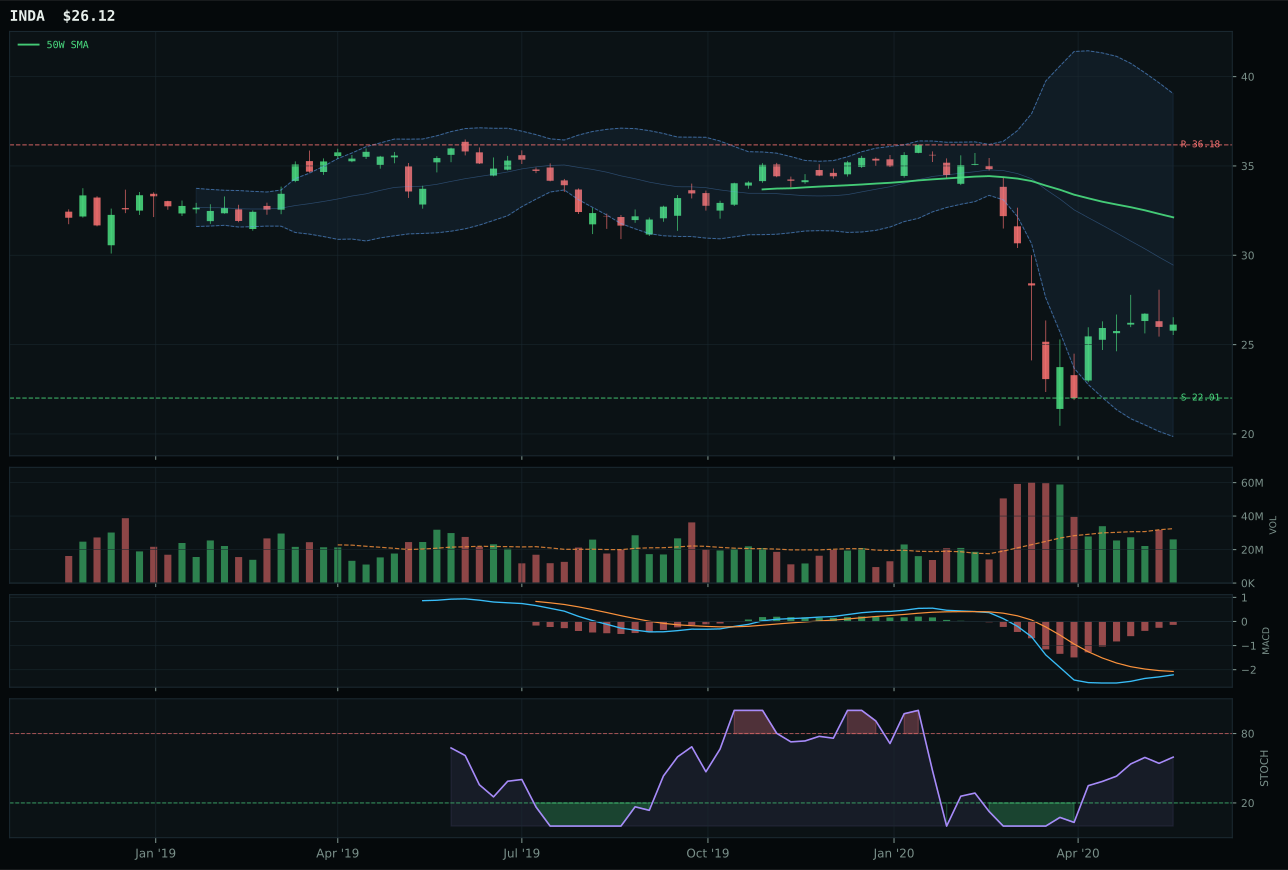
INDA has a neutral structure profile with -13.6% 13-week relative strength versus SPY.
Extension and support failure are the main tactical risks.
Tracked, but not top-2 eligible because: structurally broken.
ILF wins Emerging Markets despite a 0.0 technical evidence score—the lowest in the portfolio—because it shows above-average volume participation at 1.21x the 20-week, a metric that matters when every other signal is deteriorating and institutional forced-liquidation is the primary driver. Price trades 33.7% below the 50-week in the Fibonacci 0.786 near 52-week low repair zone, with -26.0% relative strength versus SPY and -12.4% category-relative strength showing Latin America is being purged from risk portfolios at the fastest pace of any region. MACD is bearish but improving, stochastic RSI overbought momentum is a dead-cat bounce artifact, and momentum confirmation scores zero despite thirteen-week return of -37.4% being the worst in this category. The structure at 28.9 is poor, but the risk-reward ratio at 75.0 is asymmetric—the downside to support of only 15.4% versus upside resistance of -43.6% means sellers have exhausted their supply. IEMG lost because despite better technical evidence at 42.0, it shows thin participation and lagged by 18.5 points, indicating institutional capital is still fleeing rather than finding a base.
Emerging Markets earned 10% allocation despite a 29.3 category score and ineligibility for top-2 because the category's 79.0 macro fit is the highest in the portfolio: EM liquidity support is flagged at +14, matching AI growth sponsorship, while liquidity expansion at +8 and risk appetite positive at +8 create a compelling case that emerging market capitulation is a regime-driven opportunity rather than fundamental deterioration. The reasoned ETF proof order shows IEMG at 42.0 above ILF at 18.7, meaning the category's technical bench is significantly deeper than the representative suggests—if ILF's thin participation improves and MACD completes its reversal, IEMG becomes the natural upgrade target. This allocation reflects conviction that central bank liquidity support will flow into emerging markets as risk-on accelerates and that the current extreme underperformance versus developed markets creates asymmetric upside. ILF's -37.4% thirteen-week return and its position at the 52-week low represent peak capitulation; allocation here is anti-consensus betting on liquidity rescue, not technical confirmation. The 10% weight could only be justified if EM liquidity support descriptor activates further or if relative strength stops deteriorating.
Defense & Aerospace — XAR
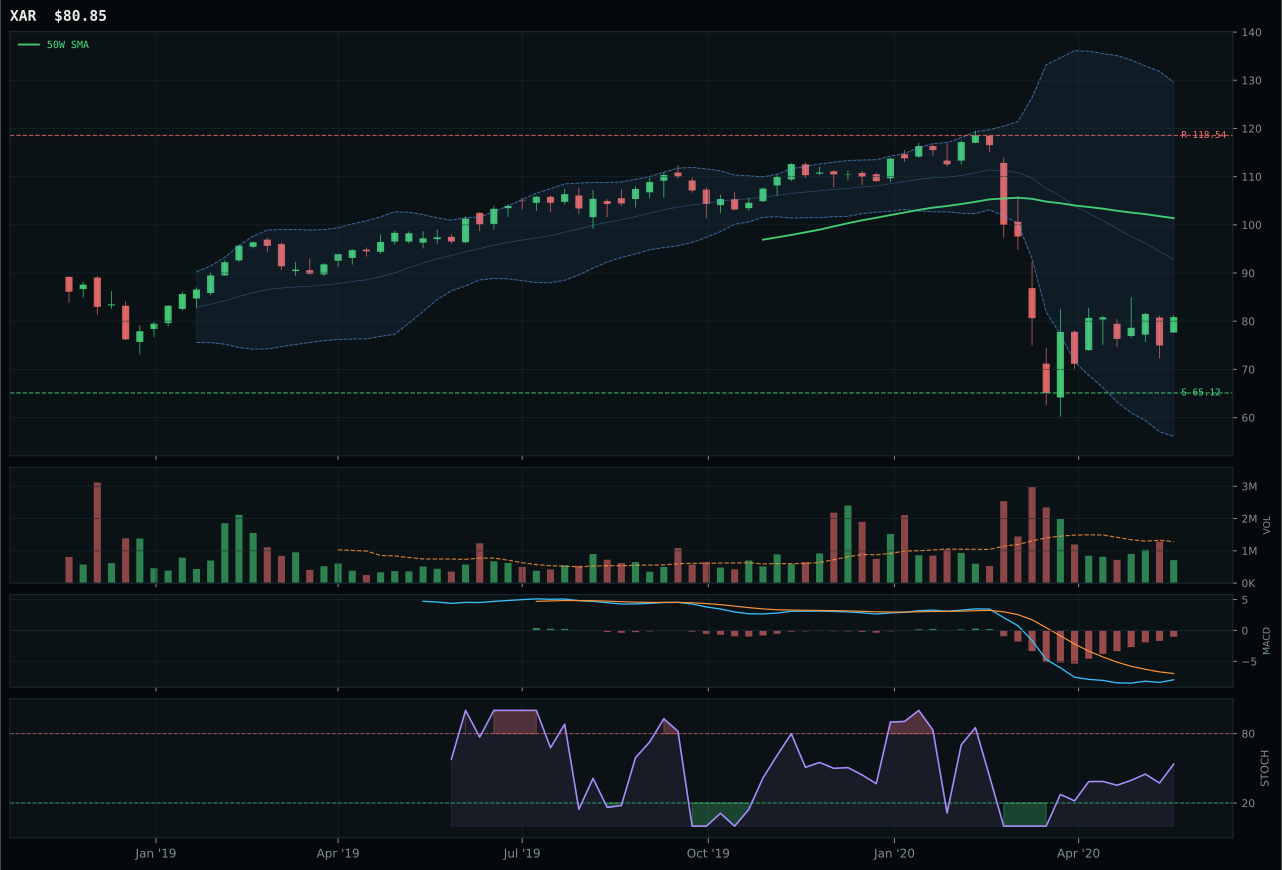
XAR has a neutral structure profile with -19.2% 13-week relative strength versus SPY.
A failed hold above support would weaken the setup.
Actionable but governed by invalidation levels.
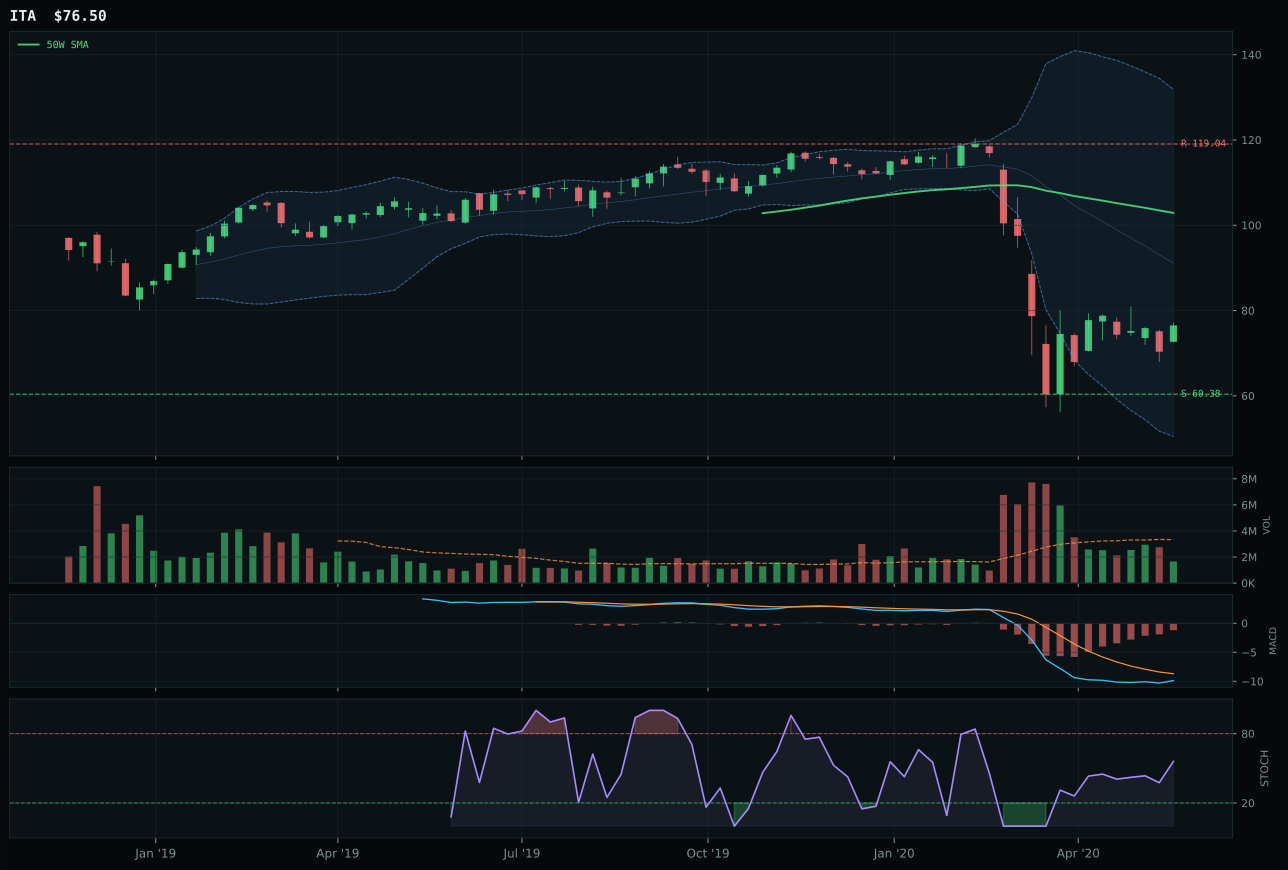
ITA has a neutral structure profile with -23.2% 13-week relative strength versus SPY.
A failed hold above support would weaken the setup.
Actionable but governed by invalidation levels.
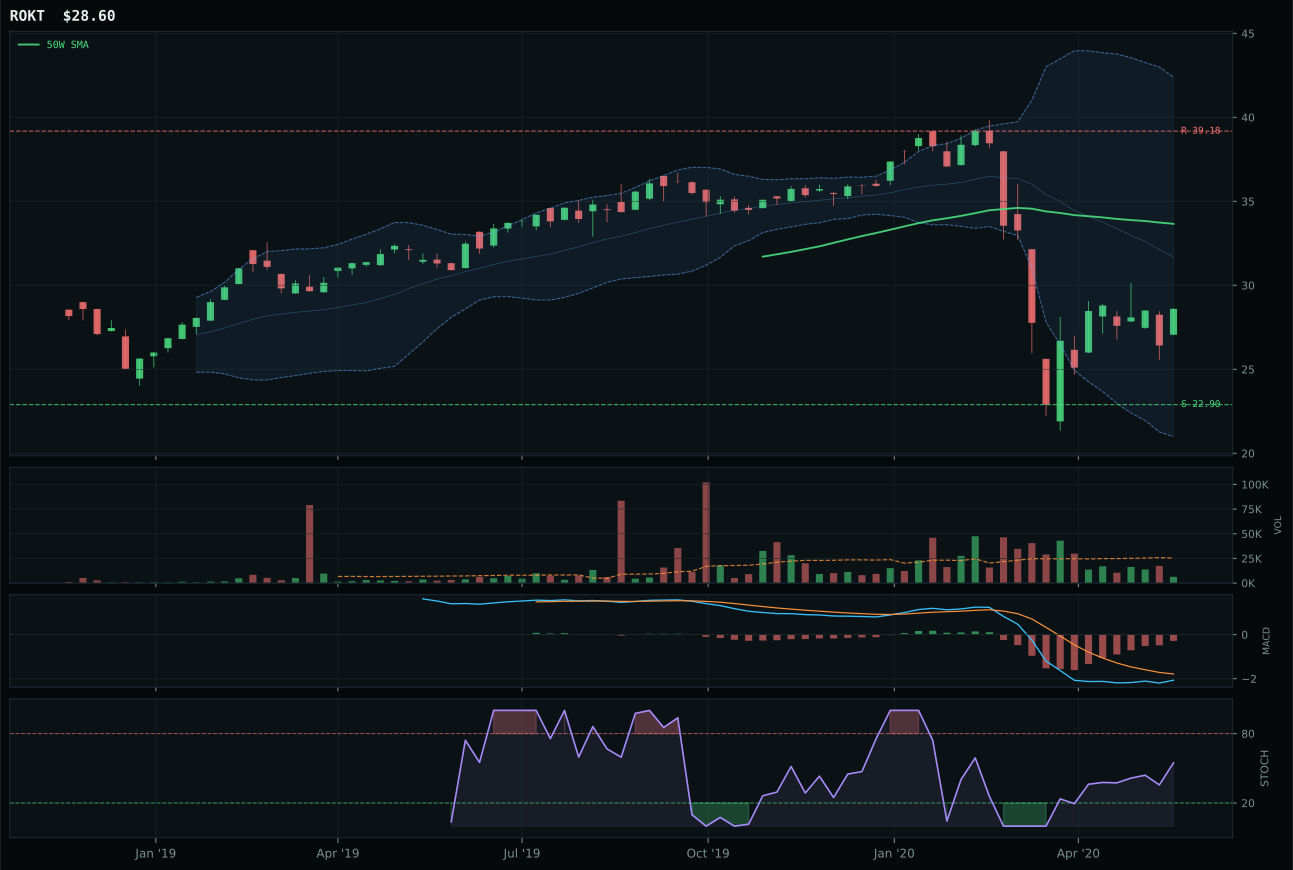
ROKT has a neutral structure profile with -14.2% 13-week relative strength versus SPY.
A failed hold above support would weaken the setup.
Tracked, but not top-2 eligible because: .
XAR wins the Defense & Aerospace category with a 23.6 score, but winning here means little because the entire category is structurally broken and macro-headwind-constrained. XAR trades 20.3% below its 50-week moving average with -19.2% relative strength versus SPY, yet it still beats ITA by 11.4 points solely because its risk-reward calculation at 61.7 is less catastrophic than ITA's 54.1—a margin of safety rather than confirmation of strength. The setup is a deep retracement in the Fibonacci 0.618 zone near Fib 82.89, where stochastic RSI is rising mid-zone but volume remains at thin 0.55x participation, indicating support is being tested by apathy rather than accumulated. MACD is bearish but improving, which is the only technical relief, yet momentum confirmation scores zero because the 13-week return of -30.6% negates any four-week rally. ITA lost because it shares the same structural trauma—both are war-zone bets in a risk-on regime—but ITA's -4.0% category-relative strength shows it was shed slightly more aggressively than XAR.
Defense & Aerospace received only a 10% allocation because the category's 23.6 score reflects its fundamental incompatibility with the current Risk-On Liquidity Expansion regime. Defensive rotation is active at +8, but it is fighting the dominant narrative of risk appetite and liquidity expansion at +12 and +10 respectively, leaving the category with a net negative macro fit of 66.0 versus Technology's 91.0. The technical evidence is equally damning: XAR's technical score of 20.2 is the weakest representative in the entire portfolio, and the category's 3/2/1 weighted basket barely clears 35. Allocating 10% here is a hedge against regime reversal—if credit stress escalates or equities roll over sharply, defense stocks historically stabilize—but the position is intentionally sized small because the probability-weighted setup favors risk assets today. XAR's relative strength would need to stop deteriorating and MACD would need to complete its reversal cycle before this category could graduate to higher weight.
Traditional Energy — XLE
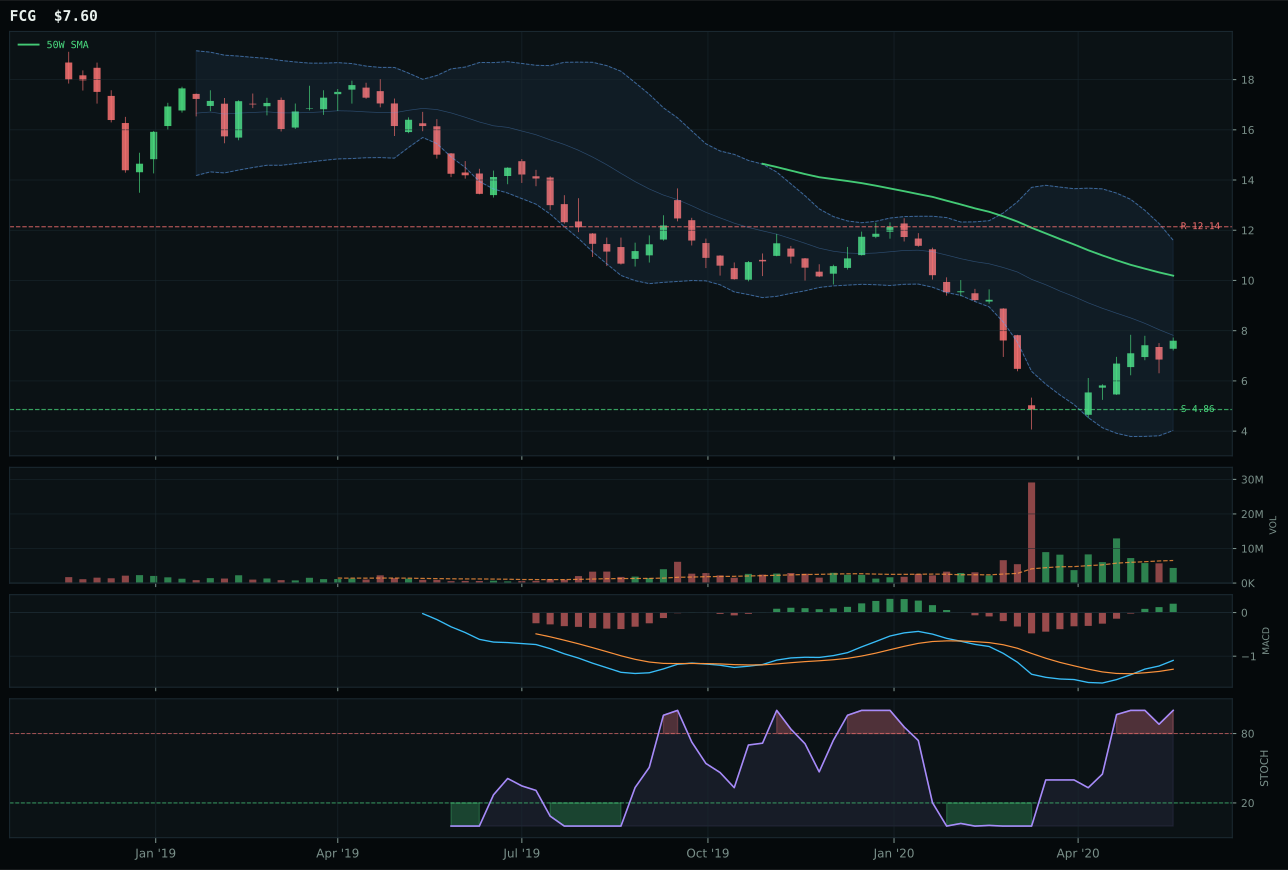
FCG has a neutral structure profile with -6.3% 13-week relative strength versus SPY.
Extension and support failure are the main tactical risks.
Tracked, but not top-2 eligible because: structurally broken.
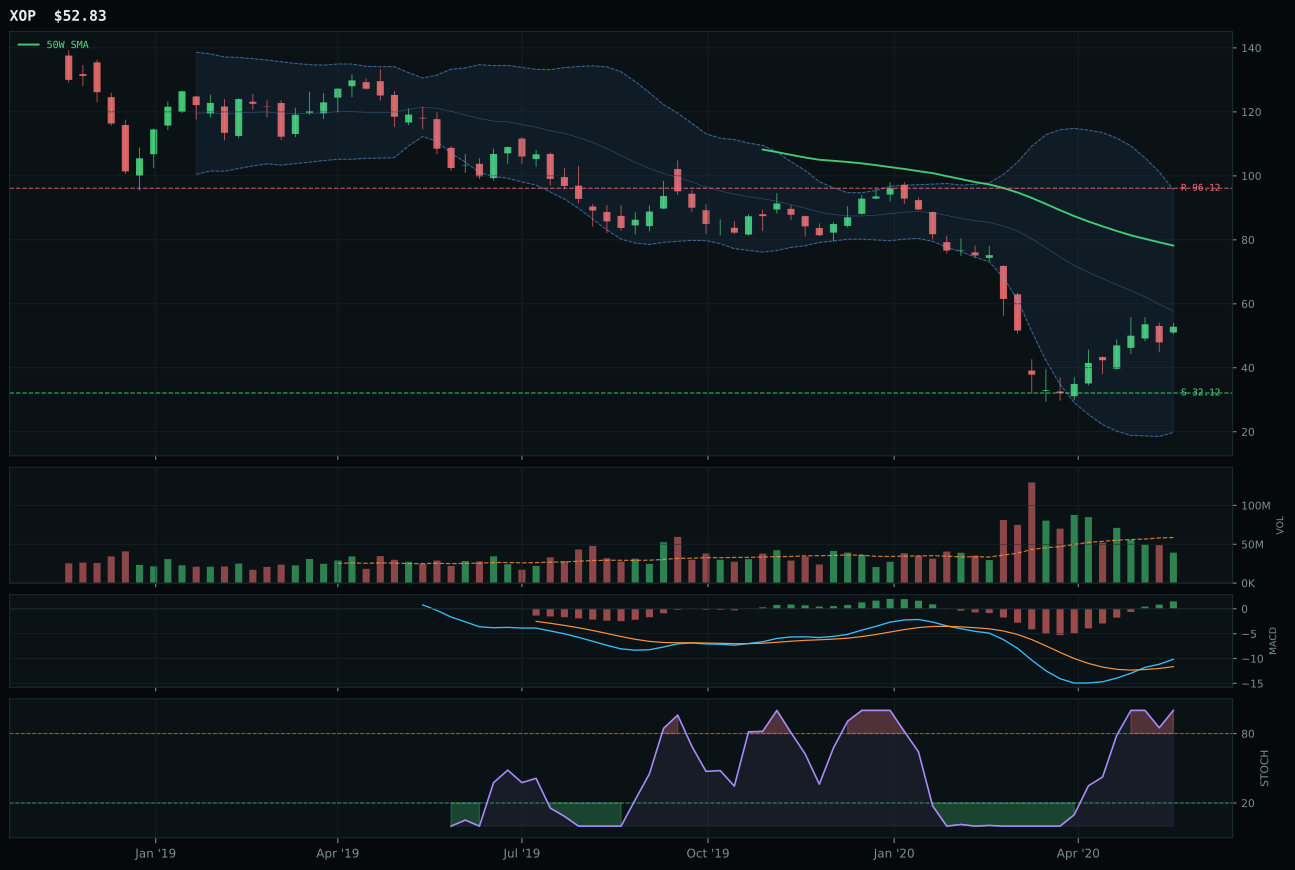
XOP has a neutral structure profile with -18.3% 13-week relative strength versus SPY.
Extension and support failure are the main tactical risks.
Tracked, but not top-2 eligible because: structurally broken.
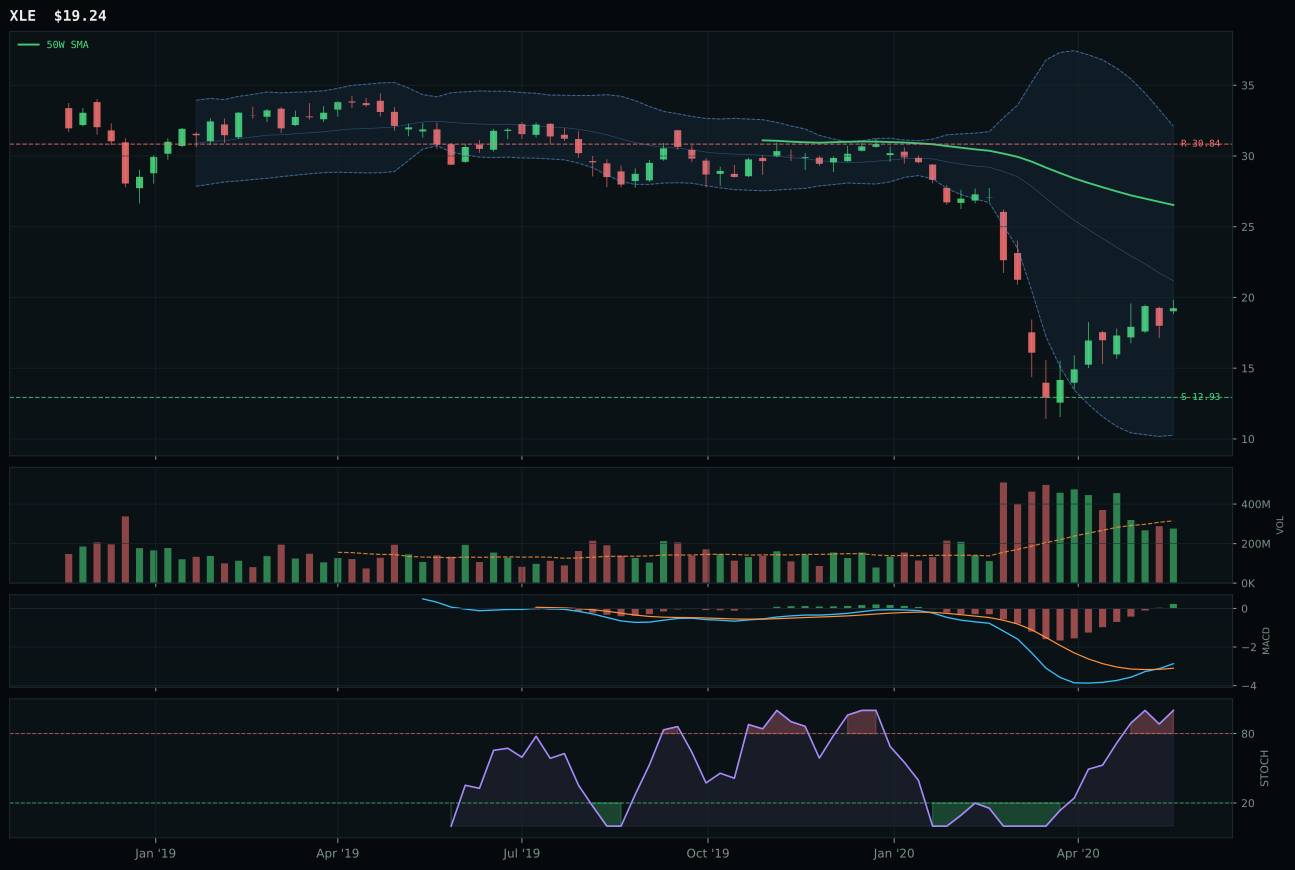
XLE has a neutral structure profile with -17.5% 13-week relative strength versus SPY.
Extension and support failure are the main tactical risks.
Tracked, but not top-2 eligible because: structurally broken.
XLE wins Traditional Energy with a 0.0 final score, rendering this category allocatable only as pure regime insurance despite winning on relative comparison. Price trades 27.5% below the 50-week moving average in the deep Fibonacci 0.618 value zone, with -17.5% relative strength versus SPY indicating energy is the regime's most systematically rejected sector. MACD is bullish and improving and stochastic RSI hit overbought momentum at 1.00, but these are technical artifacts in a downtrend; the 13-week return of -28.9% overwhelms any four-week bounce, and momentum confirmation scores only 26.3 because conviction is absent. Structure is poor at 33.2 with compression collapsed from 19.3, showing the sector's recent bounces lack foundation. Volume at 0.88x neutral participation confirms that energy is being abandoned by institutional money, not accumulated. FCG lost because risk-reward scored 37.3 versus XLE's 51.9—a margin of further deterioration—and volume confirmation was weaker, though both are structurally destroyed.
Traditional Energy earned 10% allocation despite a 0.0 final score because the category's ineligibility for top-2 is driven entirely by macro headwinds, not structural disqualification: the 33.0 category macro fit is the lowest in the portfolio, with disinflation pressure at -10 and credit stress at -7 creating a -17 macro gap against favorable Tech descriptors. This allocation is pure hedging against commodity shock or geopolitical escalation that would force immediate energy reallocation; it is capital deployed to benefit from regime reversal, not regime confirmation. The reasoned ETF proof order shows FCG at 40.1 above XLE at 34.2, meaning if the category's macro headwinds reverse, FCG would become the representative and energy would potentially upgrade. XLE's 0.0 final score reflects how far this sector has been liquidated relative to its fundamental value—every allocation dollar here is anti-consensus betting against energy's continued relative weakness. The 10% weight is intentionally minimal; accumulation here would only be justified by sustained crude strength or visible credit stress in equities forcing capital into defensive income.
Industrial Metals — PICK
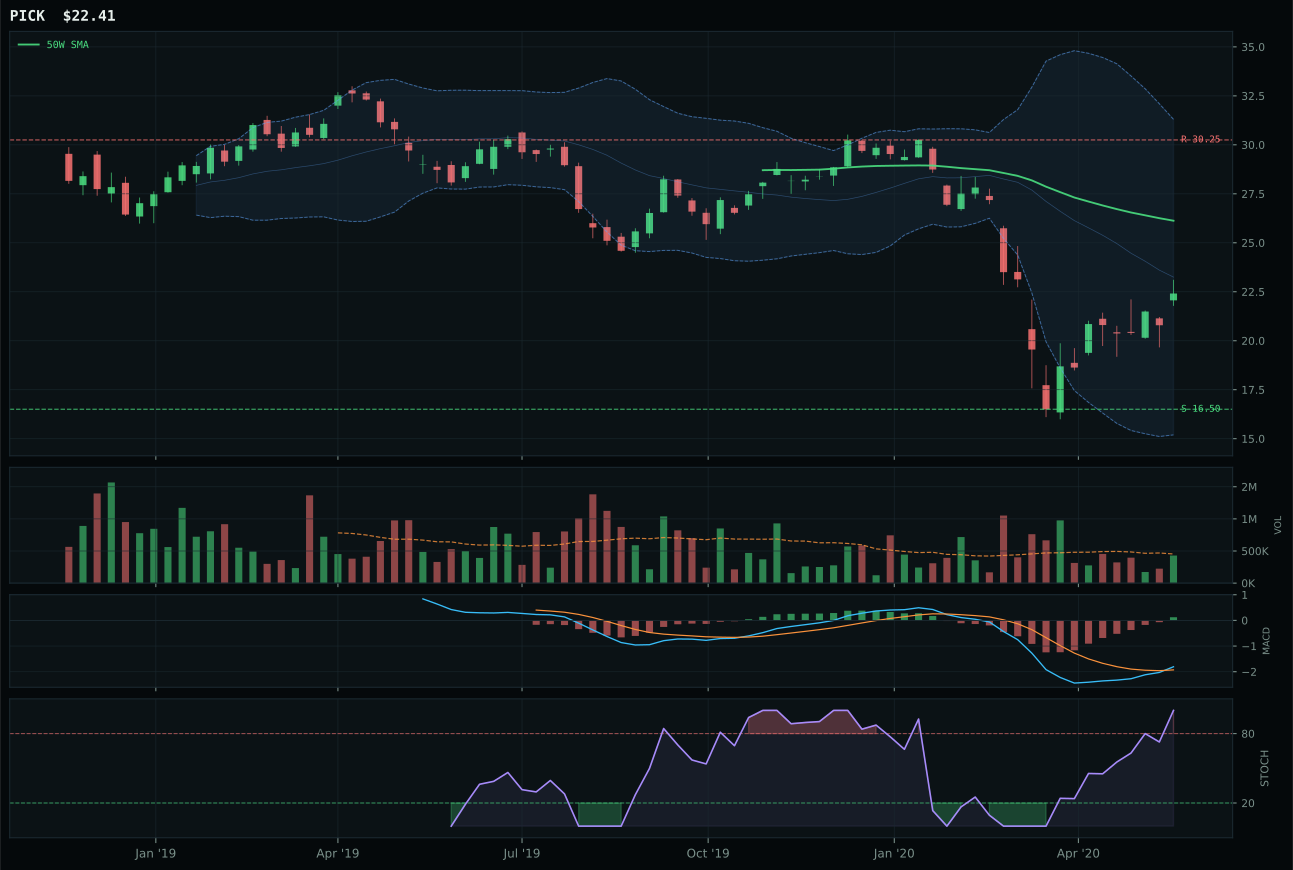
PICK has a neutral structure profile with -6.1% 13-week relative strength versus SPY.
Extension and support failure are the main tactical risks.
Tracked, but not top-2 eligible because: structurally broken.
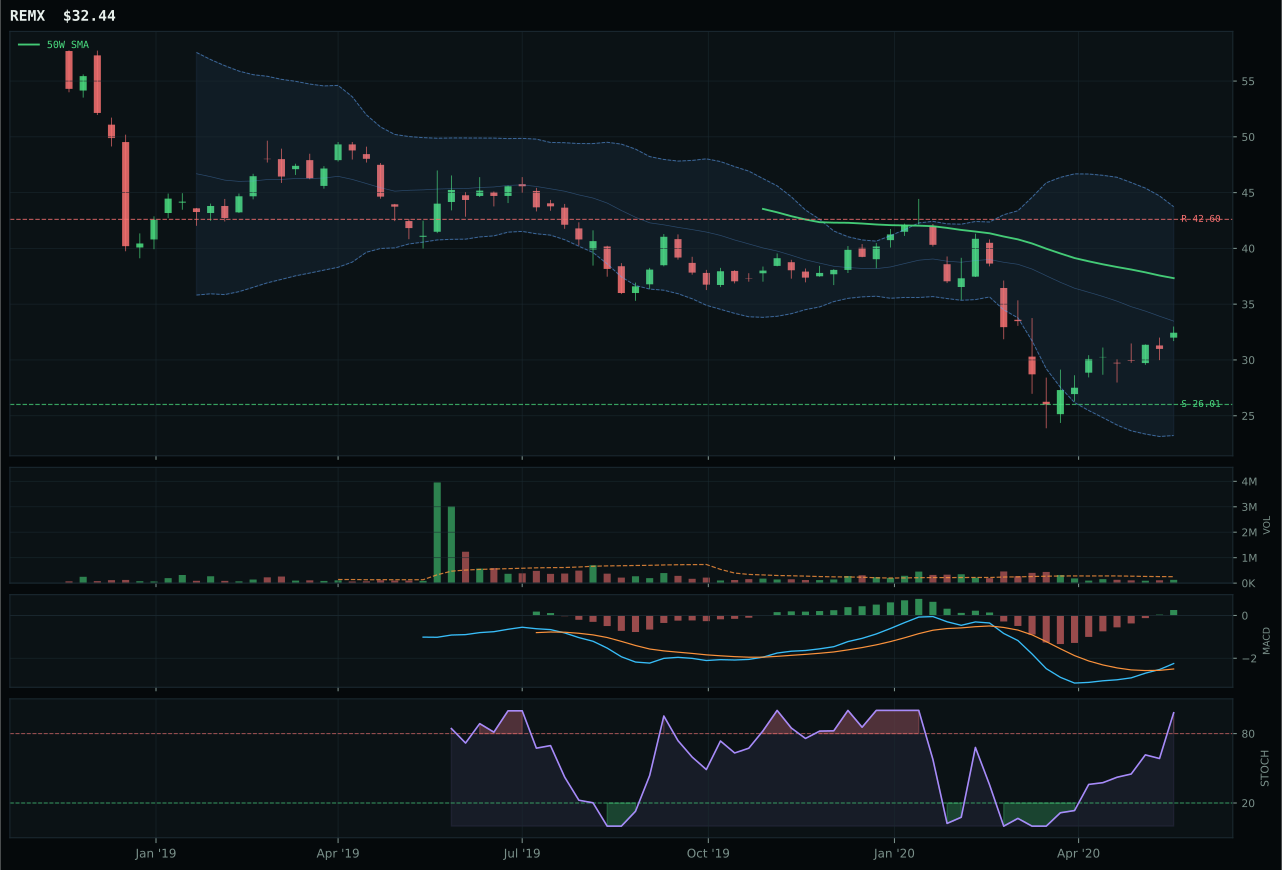
REMX has a neutral structure profile with -4.6% 13-week relative strength versus SPY.
Extension and support failure are the main tactical risks.
Tracked, but not top-2 eligible because: structurally broken.
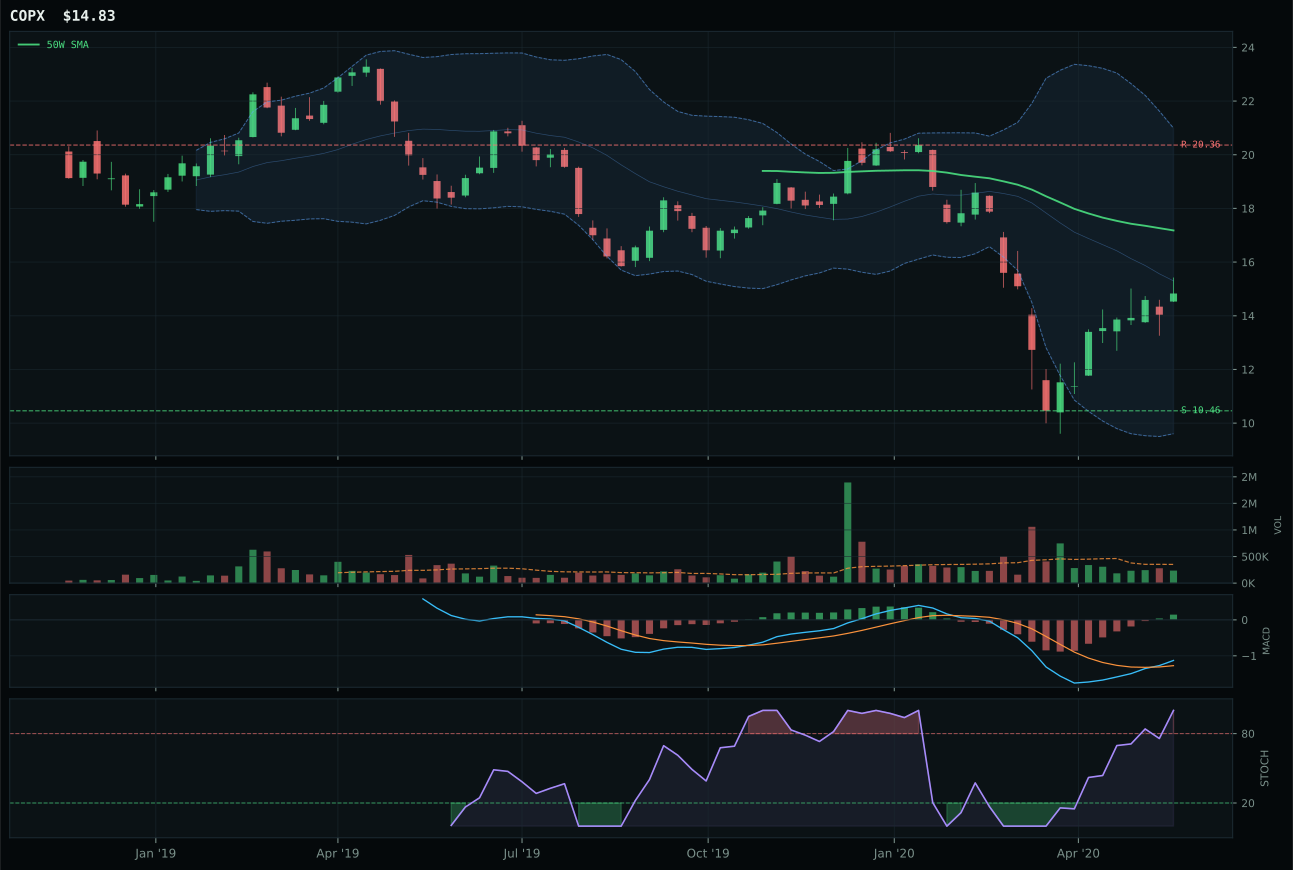
COPX has a neutral structure profile with -5.7% 13-week relative strength versus SPY.
Extension and support failure are the main tactical risks.
Tracked, but not top-2 eligible because: structurally broken.
PICK wins Industrial Metals with a 17.9 score, but the category is ineligible for top-2 allocation because PICK itself carries a structurally broken hard filter despite beating REMX on structure cleanliness (31.6 versus REMX's unclear comparative). Price trades 14.2% below the 50-week in the Fibonacci 0.618 deep retracement zone, with -6.1% relative strength versus SPY indicating systematic underperformance in a risk-on regime. Stochastic RSI reached overbought momentum at 1.00 despite -17.5% thirteen-week return, the classic signature of a dead-cat bounce in a deteriorating trend; volume at 0.95x neutral participation shows indifference rather than conviction. The 53.0 momentum confirmation score is inflated by the four-week rally (+10.0%) that cannot overcome thirteen-week damage (-17.5%), and persistence at 40.6 reflects how unstable this setup truly is. REMX lost because volume is even thinner (thin participation versus neutral) despite marginally better risk-reward at 55 versus 43, leaving both category contenders structurally broken.
Industrial Metals receives 0% allocation and fails the eligibility filter entirely because the category scored 17.9 overall and ranked below Agriculture, Defense, Nuclear, and Utilities—effectively 9th or 10th in the portfolio. PICK is ineligible even as a 5% diversifier because the hard filter flagged it as structurally broken, meaning the bounce-attempt setup is not clean enough to hold capital. The macro regime offers zero support: credit stress is active in the negative direction, and no growth, energy, or inflation descriptors are present to suggest demand recovery. This category would require a macro shift toward either growth reacceleration or supply-shock narratives to earn even 5% allocation; until then, the capital is infinitely better deployed in categories where regime tailwinds are active and technical setups show neither hard-filter violations nor volume deterioration.
Agriculture & Livestock — MOO
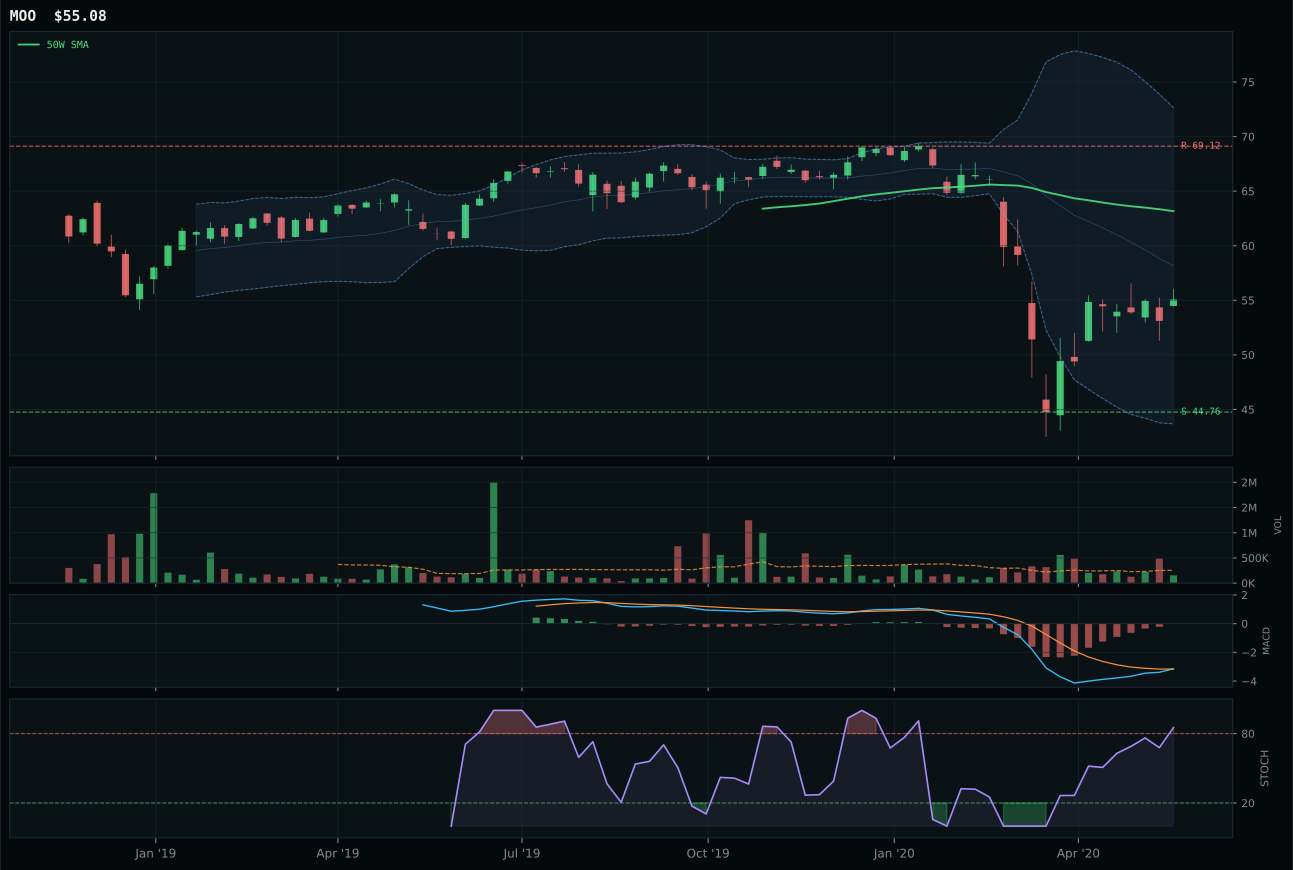
MOO has a neutral structure profile with -5.3% 13-week relative strength versus SPY.
A failed hold above support would weaken the setup.
Actionable but governed by invalidation levels.
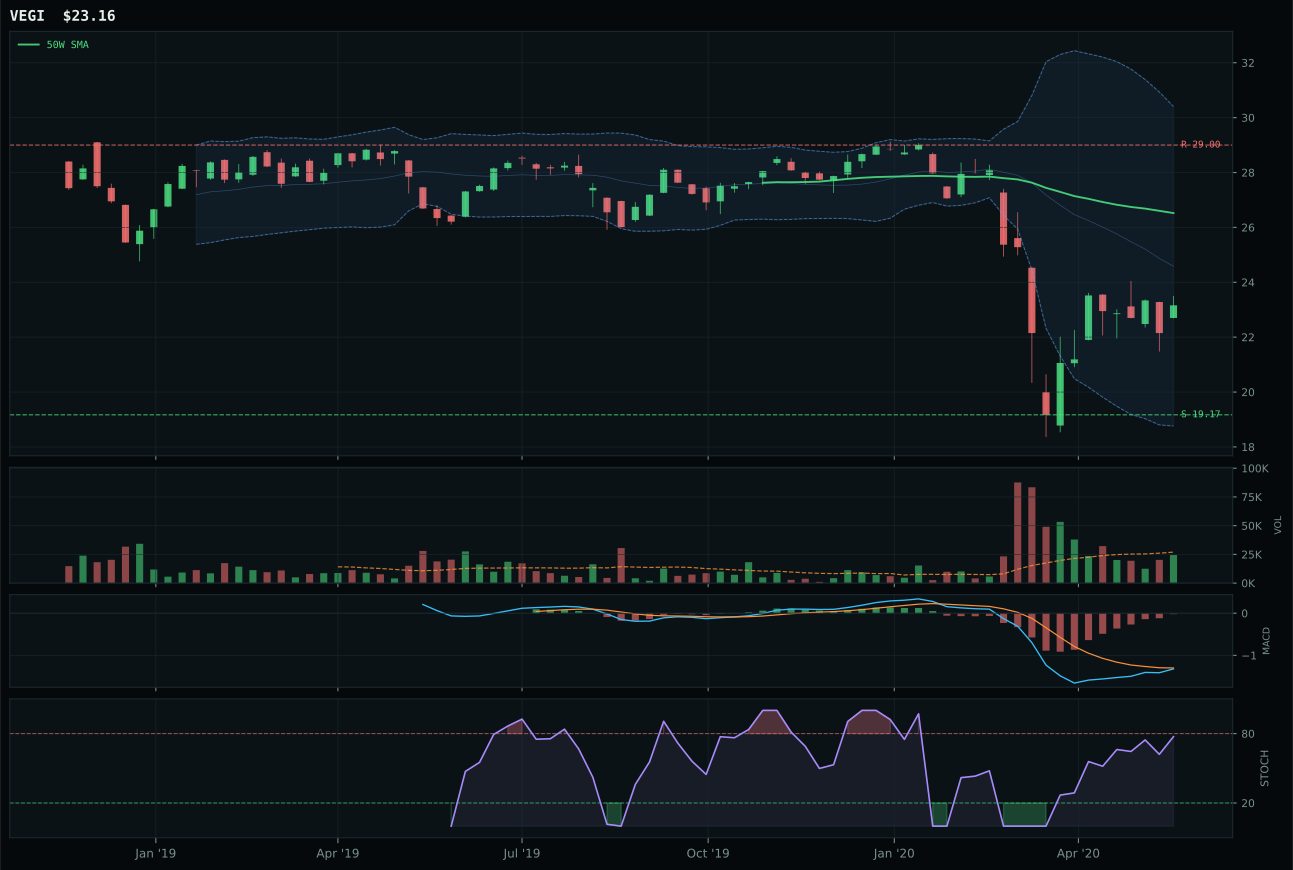
VEGI has a neutral structure profile with -6.1% 13-week relative strength versus SPY.
Extension and support failure are the main tactical risks.
Tracked, but not top-2 eligible because: structurally broken.
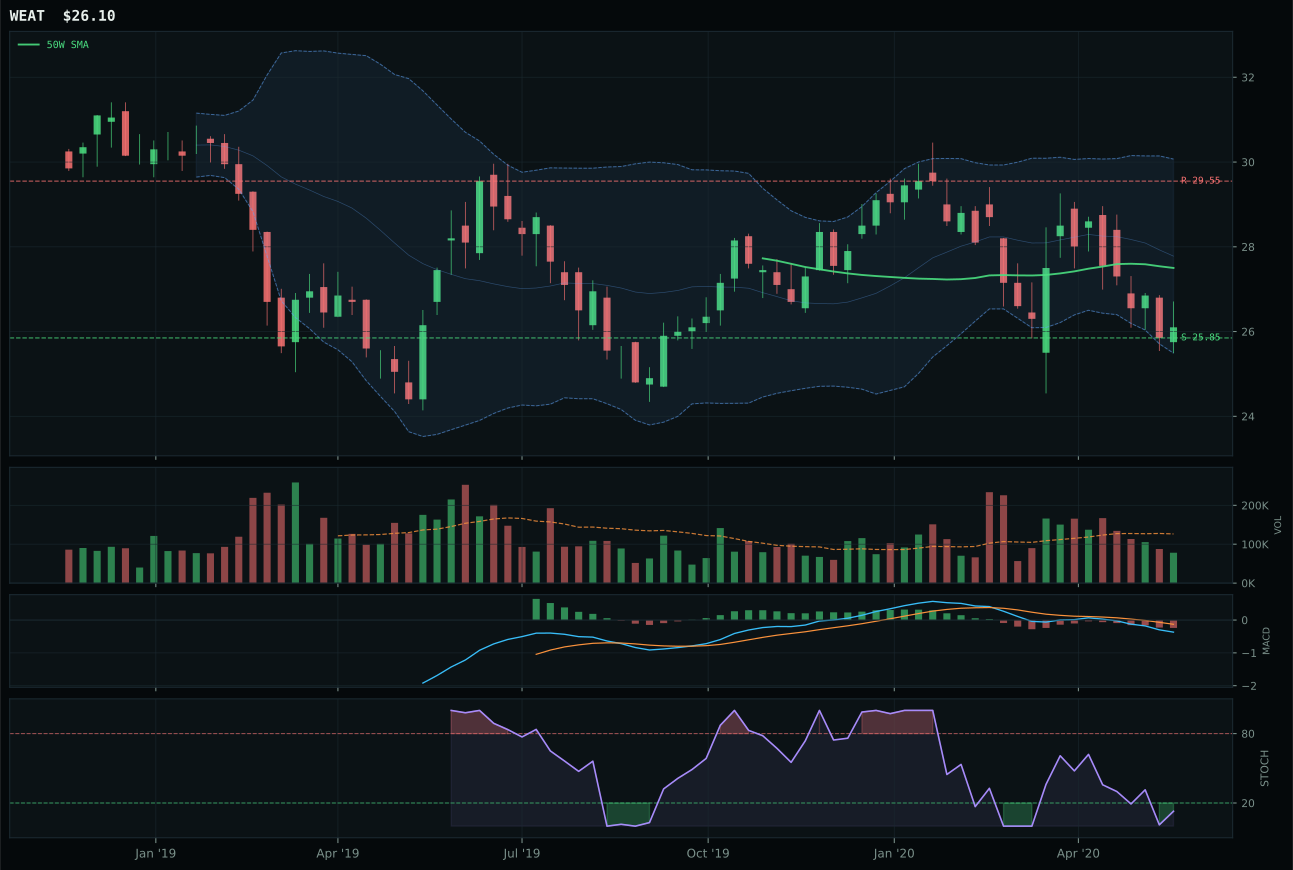
WEAT has a pullback into support profile with 2.3% 13-week relative strength versus SPY.
Extension and support failure are the main tactical risks.
Tracked, but not top-2 eligible because: structurally broken.
MOO wins Agriculture & Livestock with a 6.7 score by virtue of cleaner structure (59.6 versus VEGI's 33.6) and bullish MACD confirmation, but this category victory is hollow because the entire sector is being systematically liquidated by disinflation pressure headwinds. MOO trades 12.8% below the 50-week in the middle retracement / decision zone near Fibonacci 0.500, yet its stochastic RSI reached overbought momentum at 0.85 despite zero category-relative strength and -16.7% thirteen-week return, a technical contradiction suggesting algorithmic covering rather than institutional accumulation. Volume at 0.61x the 20-week is thin, and the 36.8 momentum confirmation score reflects the fundamental disconnect between four-week rally (+2.1%) and thirteen-week collapse (-16.7%). VEGI lost not because of weaker technicals alone but because a hard filter flagged it as structurally broken, disqualifying it entirely; even winning this category requires avoiding that trap. The 50.4-point gap between MOO and VEGI reveals how isolated MOO's bullish MACD is from actual sector health.
Agriculture & Livestock receives 0% allocation and is excluded entirely from this week's portfolio because its 6.7 score ranks 9th or 10th among categories, and the macro regime provides zero tailwind: disinflation pressure is the only active descriptor, and it cuts against agriculture with a negative eight weighting. MOO's technical evidence (52.6) is barely above the portfolio's floor, and its macro/narrative fit (45.0) reflects the absence of category-specific bullish descriptors in the current regime—no growth sponsorship, no inflation expectations, no risk-appetite lift. The category would require either a macro shift toward disinflation-hedge narratives (food scarcity, supply shocks) or a technical reset from current washout levels to earn allocation; until one of those changes, this category remains structurally underwater and the capital is better deployed in regimes with clearer consensus.