
2020-05-15
Informational purposes only. The content in this report, including allocations, analysis, and commentary, is provided solely for informational and educational purposes. It does not constitute financial advice, investment advice, trading advice, or any other type of advice. Past performance does not guarantee future results. Always conduct your own research and consult a qualified financial professional before making investment decisions.
Some tracked tickers were excluded due to missing live weekly price data: SGOV: Historical cache SGOV has only 0 usable weekly bars; URNM: Historical cache URNM has only 24 usable weekly bars
Weekly Allocation
| Ticker | Category | Weight | Role |
|---|---|---|---|
| IGV | Technology | 20% | Top-2 (20%) |
| GLD | Precious Metals | 20% | Top-2 (20%) |
| BOTZ | AI | 10% | Tier-2 (10%) |
| IGF | Utilities & Infrastructure | 10% | Tier-2 (10%) |
| MOO | Agriculture & Livestock | 10% | Tier-2 (10%) |
| FCG | Traditional Energy | 10% | Tier-2 (10%) |
| URA | Nuclear Energy | 10% | Tier-2 (10%) |
| XAR | Defense & Aerospace | 10% | Tier-2 (10%) |
Trade Instructions — Monday Open
Sell the tranche from 2020-04-17 (completing its 4-week hold). Buy the new tranche. Instructions show net portfolio changes — same-asset positions cancel, weight changes show the delta.
| Action | Ticker | Instruction |
|---|---|---|
| SELL | CIBR | Sell entire CIBR position (5.00% of portfolio) |
| SELL | SMH | Sell 67% of SMH position (reduce 3.75% → 1.25%) |
| SELL | XLU | Sell 67% of XLU position (reduce 3.75% → 1.25%) |
| SELL | XLE | Sell entire XLE position (2.50% of portfolio) |
| SELL | ITA | Sell 40% of ITA position (reduce 6.25% → 3.75%) |
| SELL | INDA | Sell 29% of INDA position (reduce 8.75% → 6.25%) |
| BUY | FCG | Buy FCG — 14.29% of freed cash (adds 2.50% to portfolio) |
| BUY | IGV | Buy IGV — 28.57% of freed cash (adds 5.00% to portfolio) |
| BUY | BOTZ | Buy BOTZ — 14.29% of freed cash (adds 2.50% to portfolio) |
| BUY | IGF | Buy IGF — 14.29% of freed cash (adds 2.50% to portfolio) |
| BUY | XAR | Buy XAR — 14.29% of freed cash (adds 2.50% to portfolio) |
| BUY | MOO | Buy MOO — 14.29% of freed cash (adds 2.50% to portfolio) |
Current Portfolio After Trade
Combined holdings across all 4 active tranches. Each tranche is 25% of the portfolio.
| Ticker | % of Portfolio | Weight Bar |
|---|---|---|
| GLD | 20.00% | |
| IGV | 15.00% | |
| BOTZ | 12.50% | |
| URA | 8.75% | |
| FCG | 8.75% | |
| IGF | 7.50% | |
| INDA | 6.25% | |
| GDX | 5.00% | |
| XAR | 5.00% | |
| ITA | 3.75% | |
| XLK | 2.50% | |
| MOO | 2.50% | |
| SMH | 1.25% | |
| XLU | 1.25% |
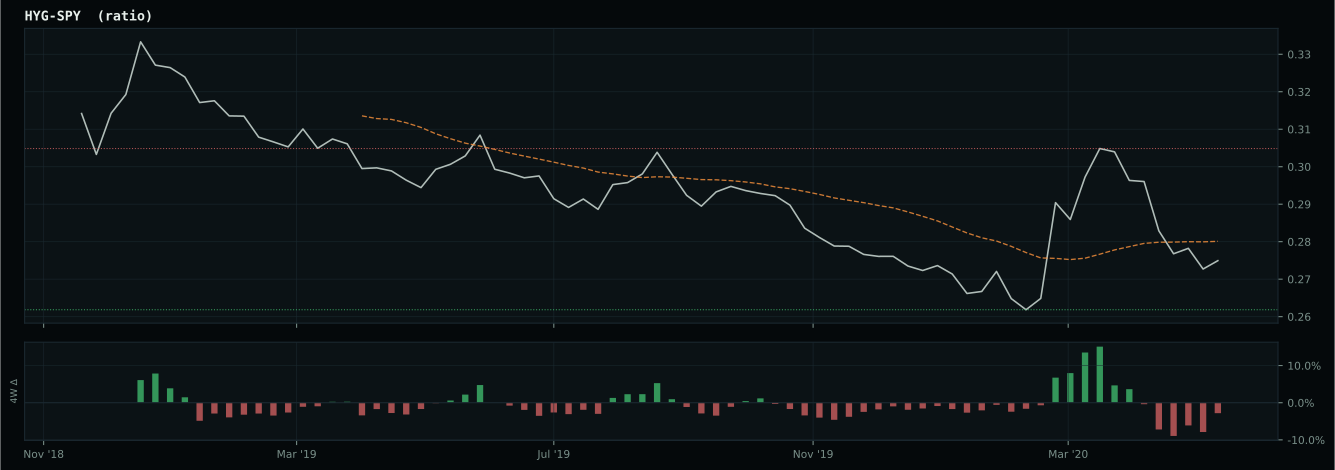
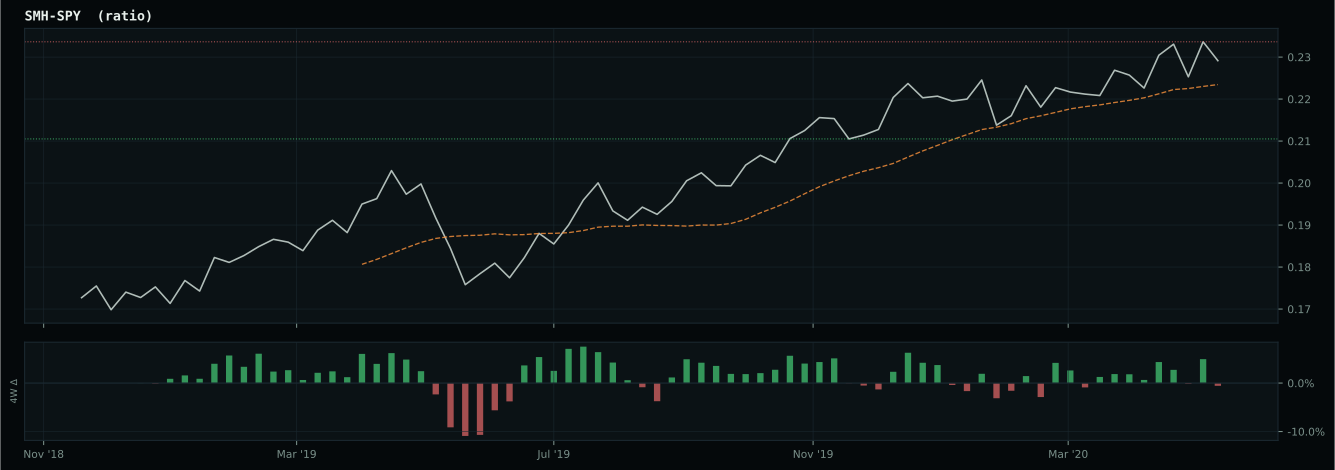
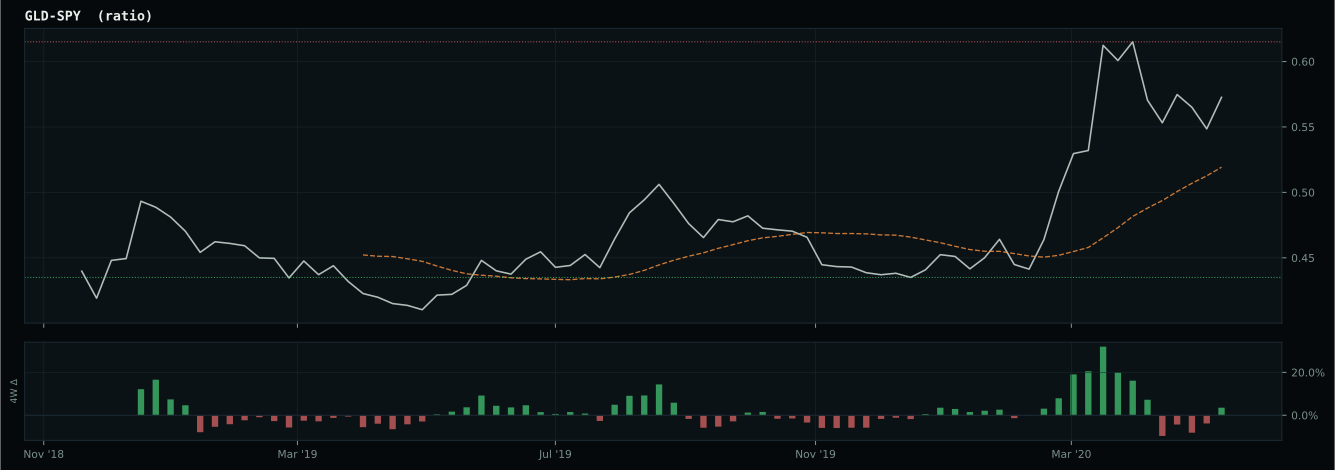
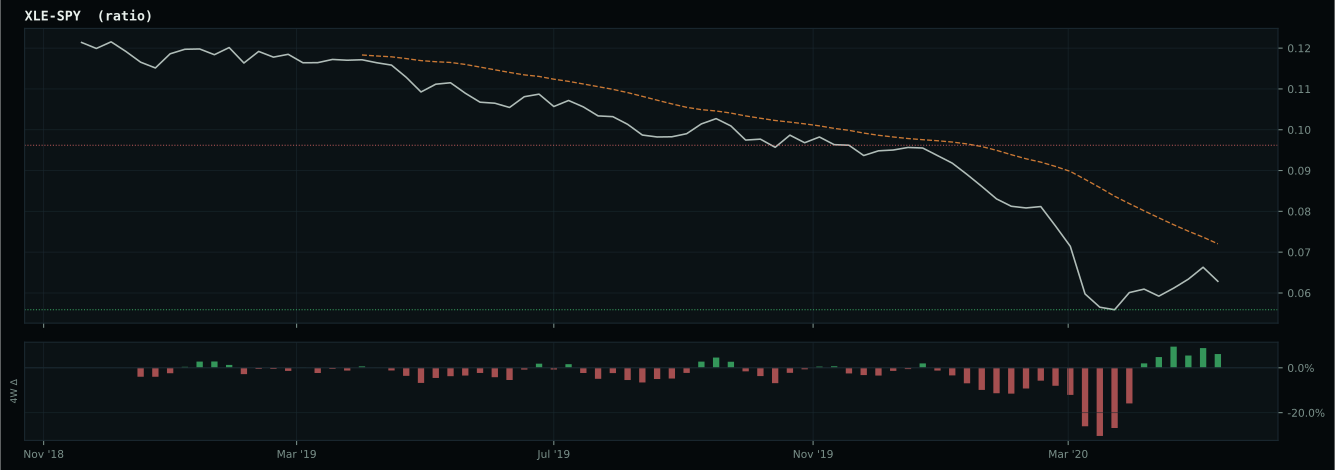
Macro Regime — Goldilocks
Macro Evidence Charts
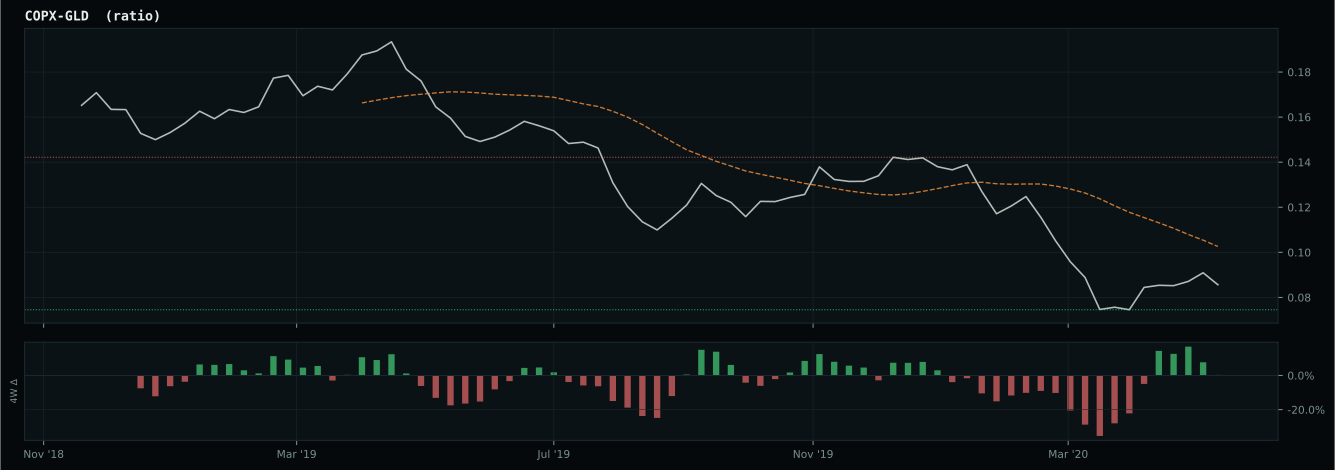
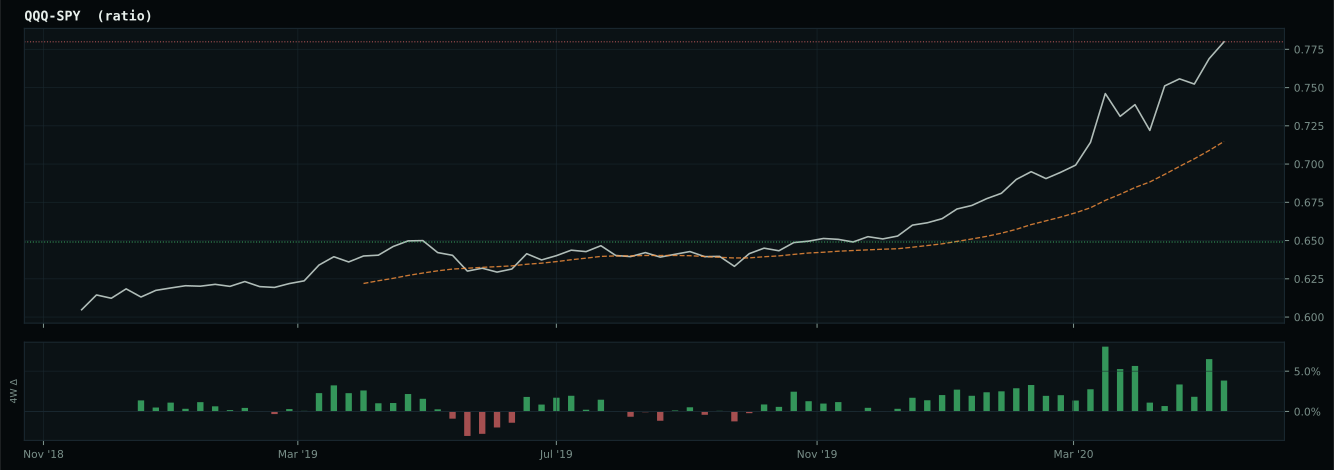
Market-implied signals behind the macro regime scores. Each ratio compares two assets; the direction and slope of the ratio is what the macro engine reads.
Crypto Regime — NoCrypto
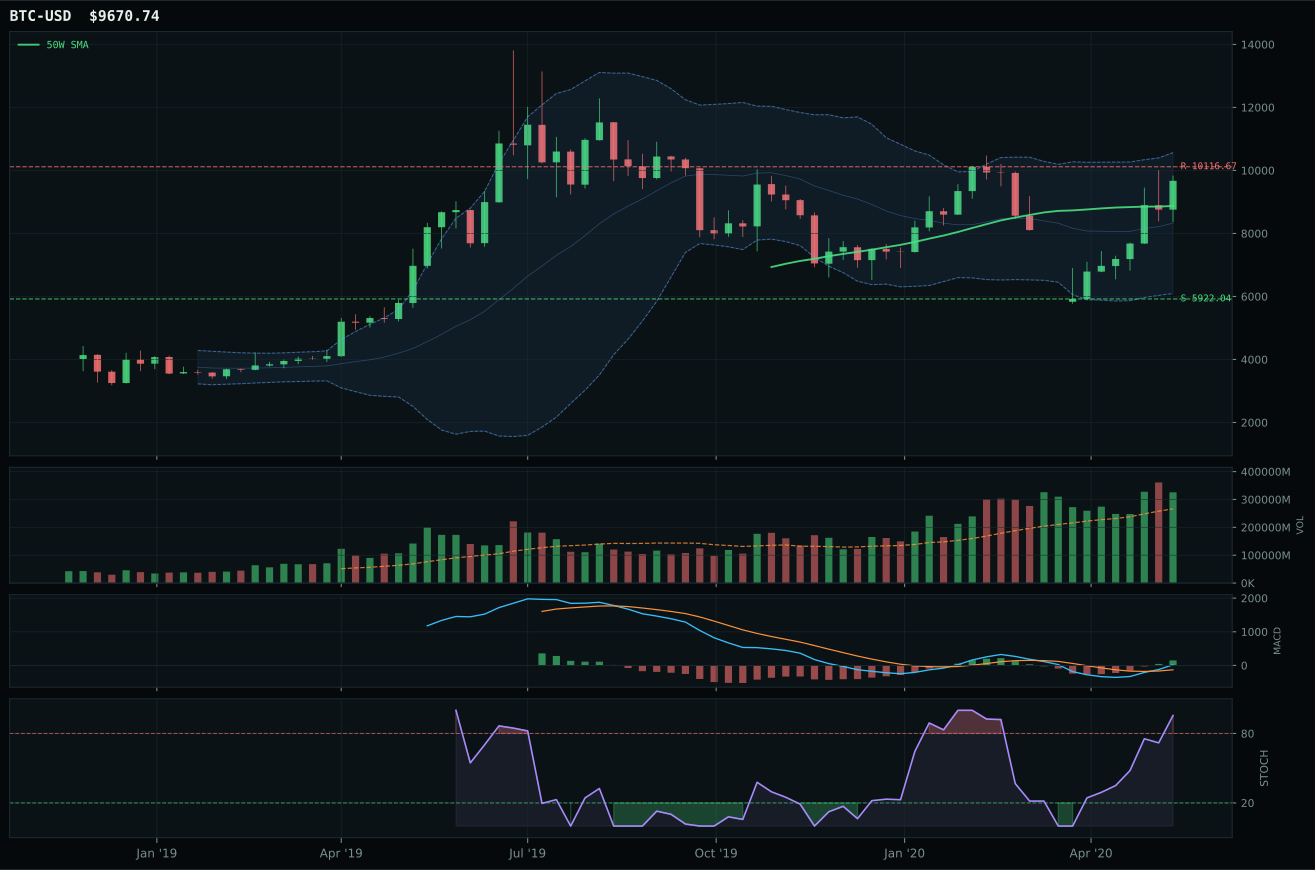
ValueBTC armed by first 200W buy-zone touch, but post-touch range age is 9 weeks; minimum is 12
TrendBTC not confirmed
one or more available conditions failed

Category Rankings
| Rank | Category | Winner | Score | Alloc | 4W Ret | Peers (4W) |
|---|---|---|---|---|---|---|
| 1 | Technology | IGV | 79.3 | 20% | +1.23% | CIBR +2.7% · XLK +2.4% |
| 2 | Precious Metals | GLD | 67.5 | 20% | -2.32% | GDX -14.4% · SLV -0.5% |
| 3 | AI | BOTZ | 58.4 | 10% | +4.86% | SMH +6.1% · AIQ +3.1% |
| 4 | Utilities & Infrastructure | IGF | 32.9 | 10% | +4.63% | XLU +2.7% · PAVE +6.9% |
| 5 | Nuclear Energy | URA | 28.9 | 10% | +1.43% | NLR +2.4% |
| 6 | Defense & Aerospace | XAR | 28.1 | 10% | +11.09% | ROKT +10.9% · ITA +13.5% |
| 7 | Emerging Markets | IEMG | 24.6 | 10% | +4.50% | INDA +7.4% · ILF +16.0% |
| 8 | Industrial Metals | PICK | 15.4 | 10% | +7.12% | COPX +9.8% · REMX +5.6% |
| 9 | Agriculture & Livestock | MOO | — | 0% | +7.67% | VEGI +6.7% · WEAT +0.6% |
| 10 | Traditional Energy | FCG | — | 0% | +9.89% | XOP +7.9% · XLE +0.2% |
Technology — IGV
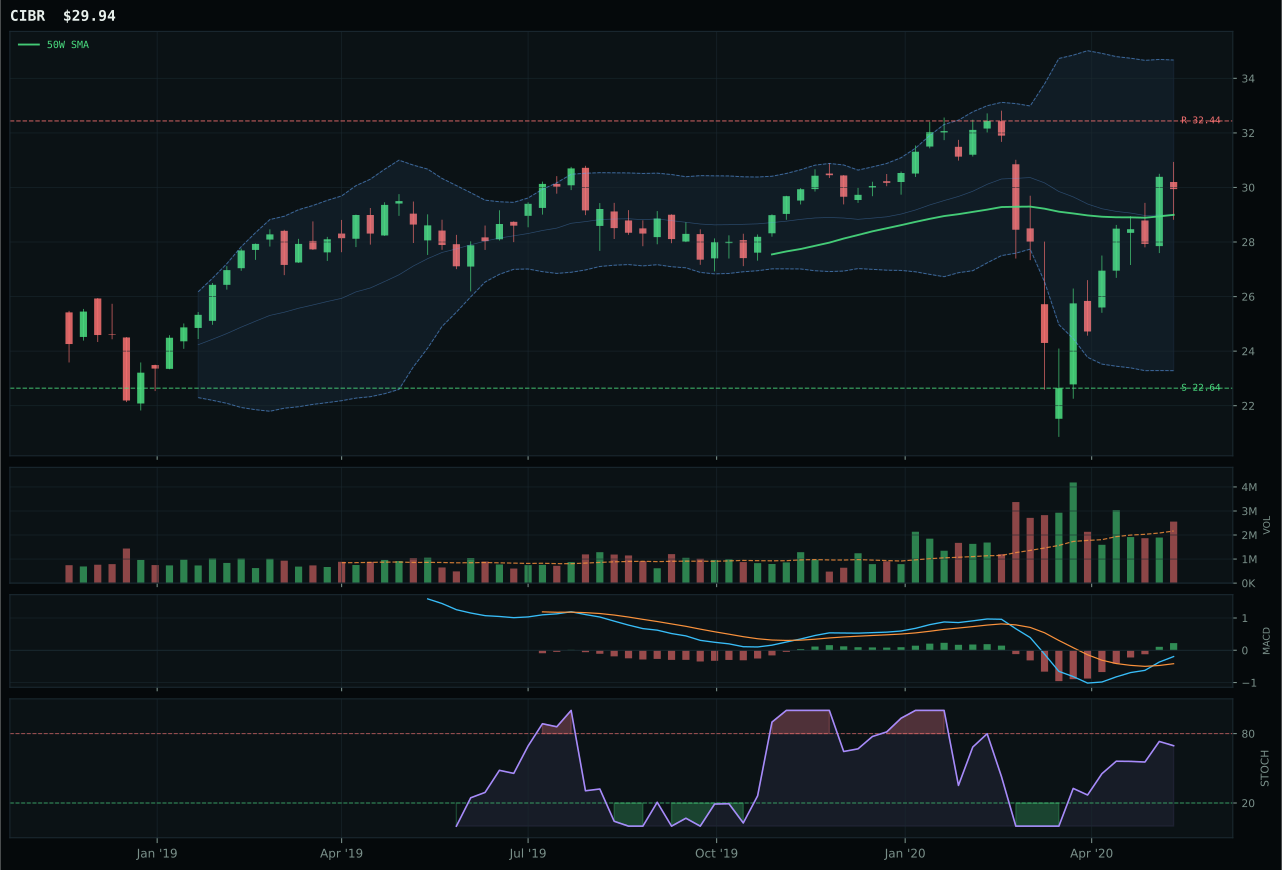
CIBR has a neutral structure profile with 7.5% 13-week relative strength versus SPY.
A failed hold above support would weaken the setup.
Actionable but governed by invalidation levels.
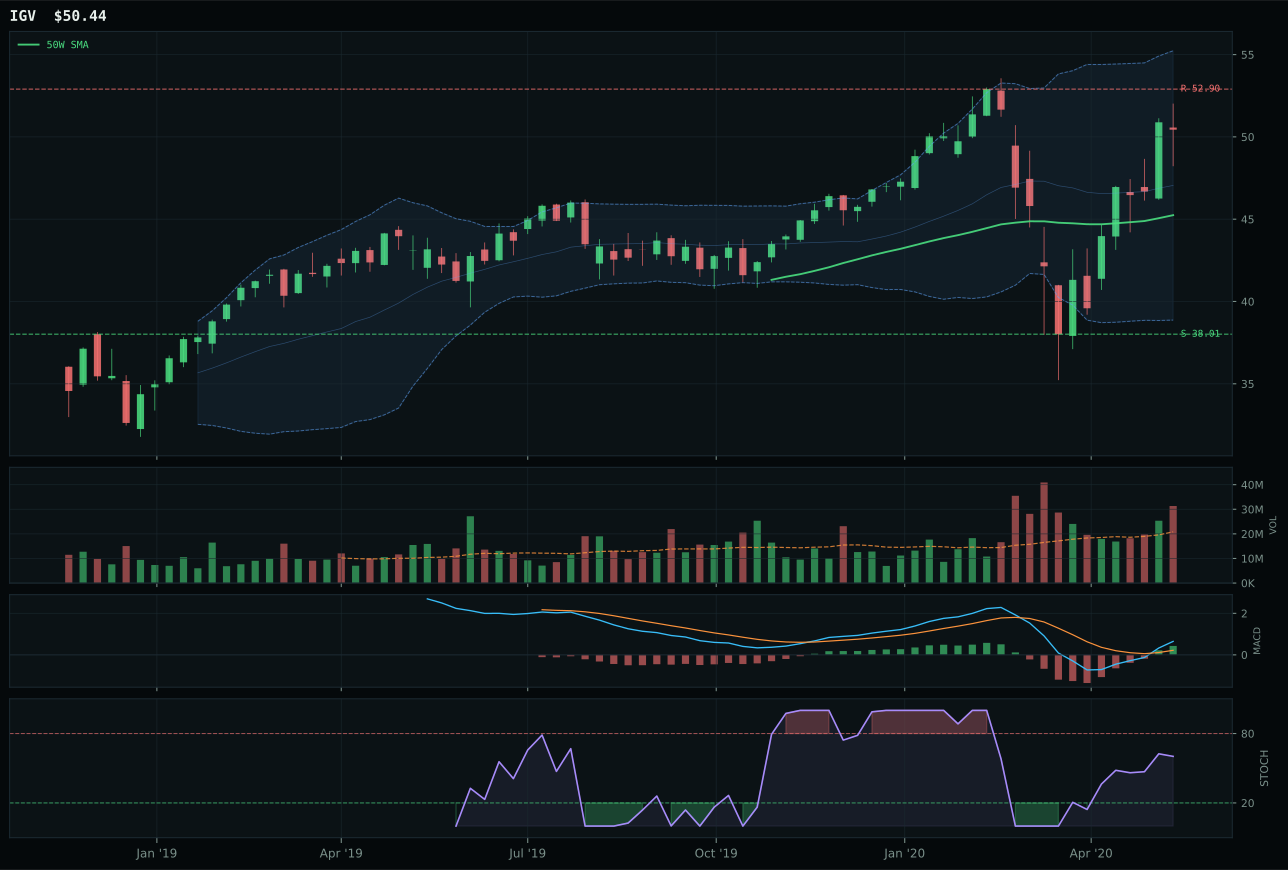
IGV has a neutral structure profile with 10.5% 13-week relative strength versus SPY.
A failed hold above support would weaken the setup.
Actionable but governed by invalidation levels.
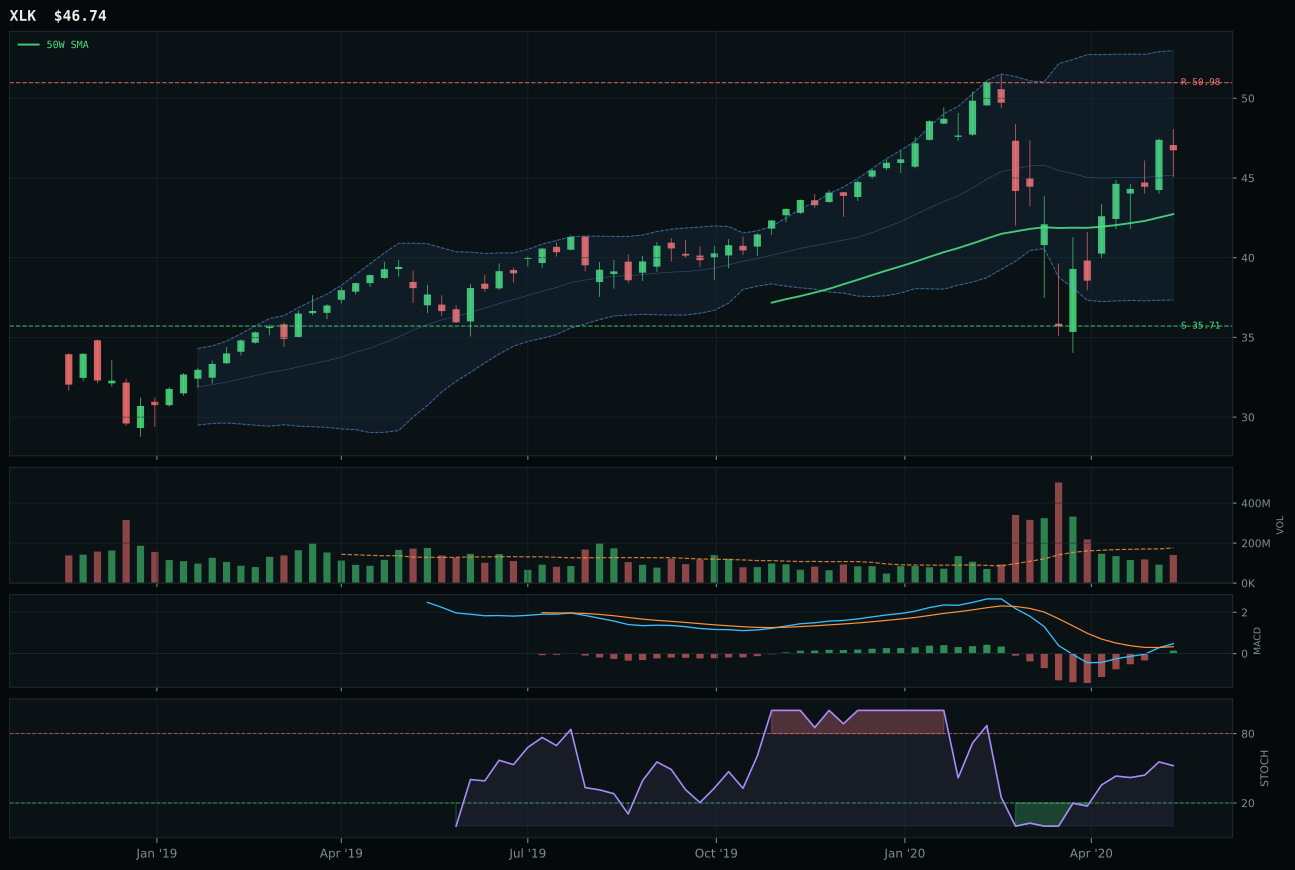
XLK has a neutral structure profile with 6.9% 13-week relative strength versus SPY.
A failed hold above support would weaken the setup.
Actionable but governed by invalidation levels.
IGV claimed the category by capturing 10.5% relative strength versus SPY, outpacing CIBR's 7.5% despite CIBR's superior composite technicals (81 vs 77). The decisive factor was IGV's 3.0% category-relative strength advantage, signaling that buyers within the software cohort were rotating specifically toward enterprise duration plays rather than distributing broadly. Both held neutral structures with bullish, improving MACD and mid-zone stochastic RSI readings, but IGV's 11.5% extension above the 50W placed it in the upper retracement zone at the exact point where distribution pressure emerged at 1.50x average volume—not capitulation, but measured accumulation into a frothy setup. CIBR's weakness was momentum confirmation: its -7.7% thirteen-week return and 0.0% category-relative strength revealed it was bouncing alone, not leading the basket.
Technology earned its 20% top-2 slot on a 79.3 composite score driven by clean trend mechanics and macro tailwinds that few other categories could match. Goldilocks regime support, active liquidity expansion, risk-appetite positivity, and AI sponsorship flowing through the descriptor checklist all reinforced what the chart was already saying: prices above both key averages with steady slope, MACD improving, and 25.2% SPY-relative gains that translated to real money flow into duration-sensitive names. The category's macro fit of 81.0 left no ambiguity; disinflation pressure (-5) did sting, but liquidity expansion and risk appetite together overwhelmed it. This is not a late-cycle extension—it's a dislocation being filled by a regime shift, and the 10.5% SPY edge confirms the market is acting on it right now, not pricing it in retroactively.
Precious Metals — GLD
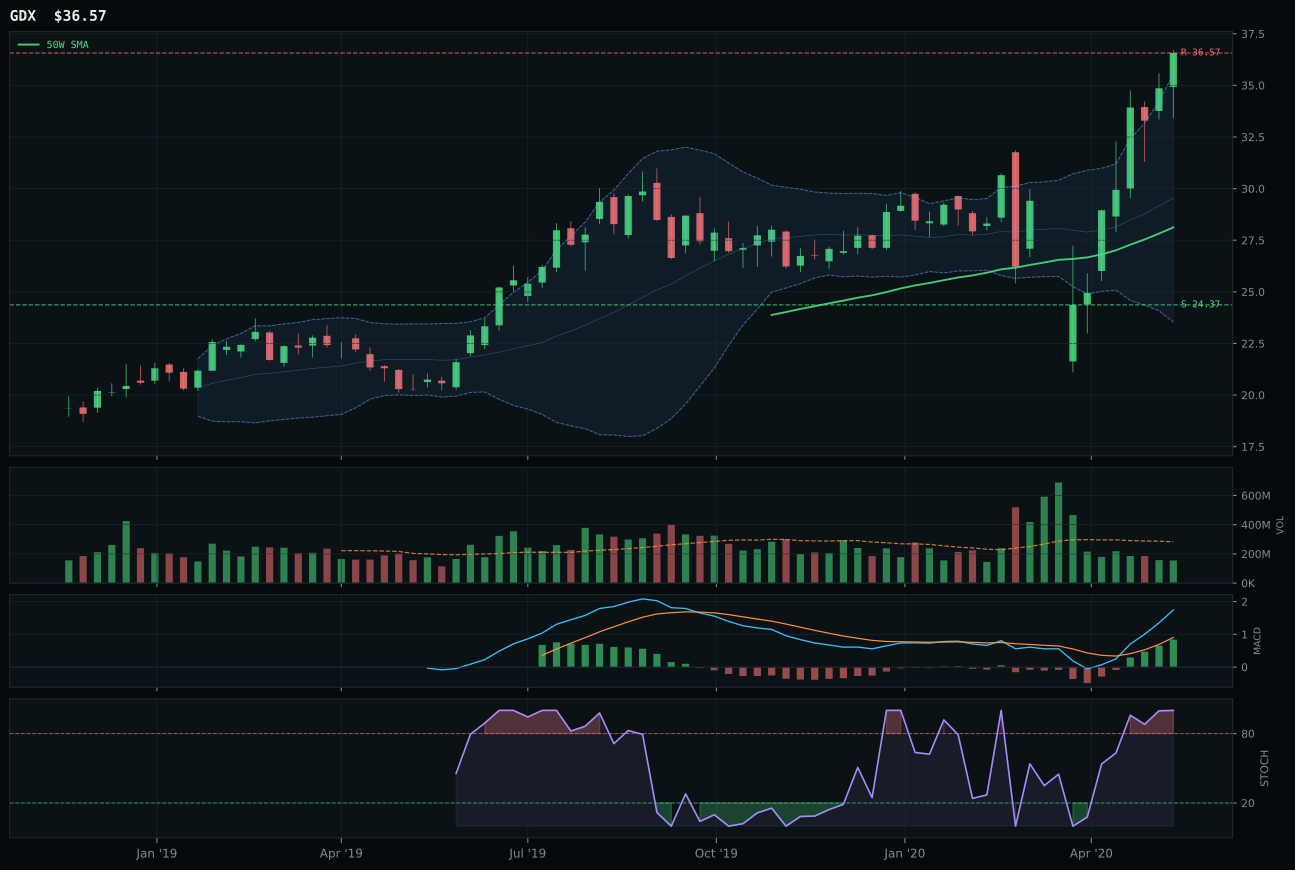
GDX has a vertical extension profile with 44.4% 13-week relative strength versus SPY.
A failed hold above support would weaken the setup.
Actionable but governed by invalidation levels.
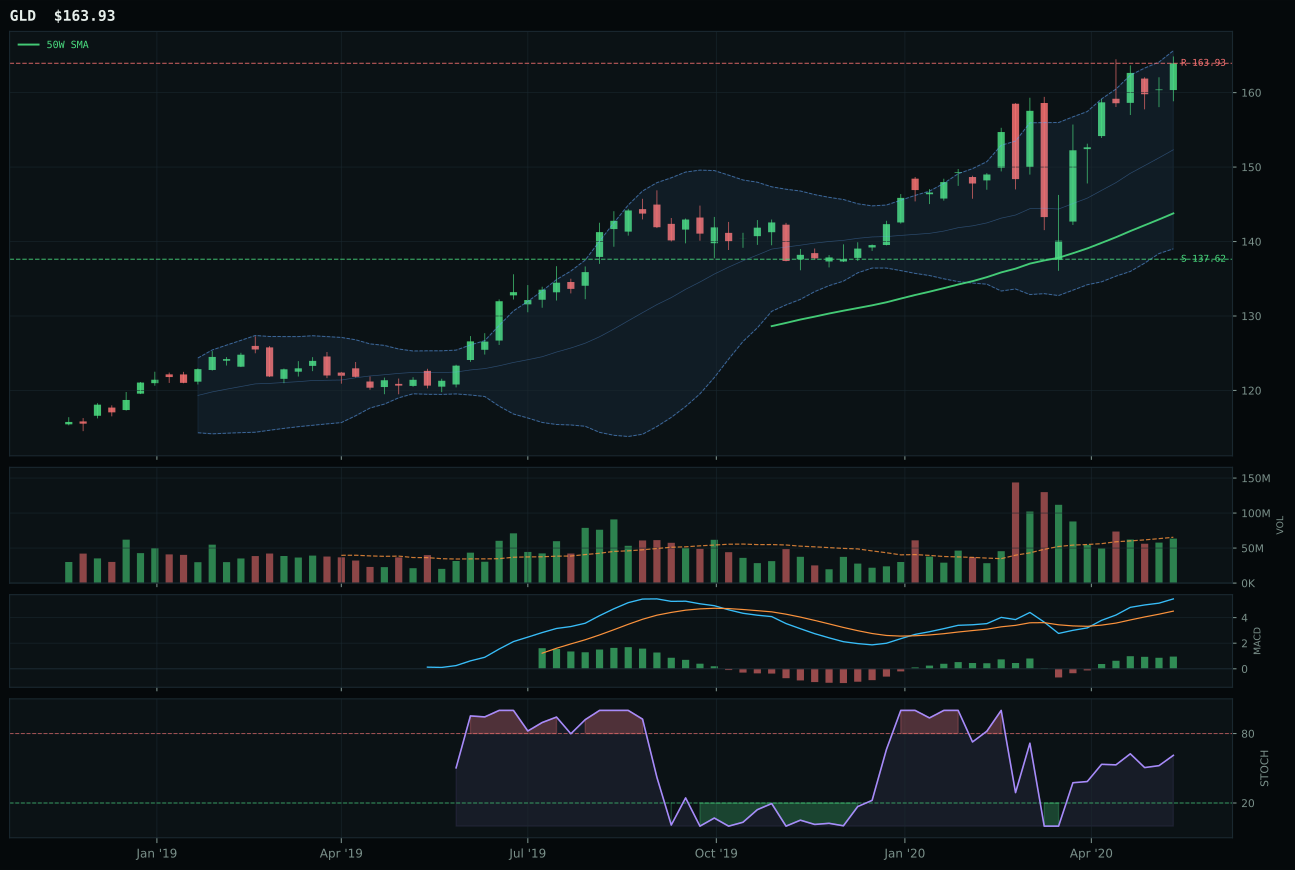
GLD has a neutral structure profile with 25.2% 13-week relative strength versus SPY.
A failed hold above support would weaken the setup.
Actionable but governed by invalidation levels.
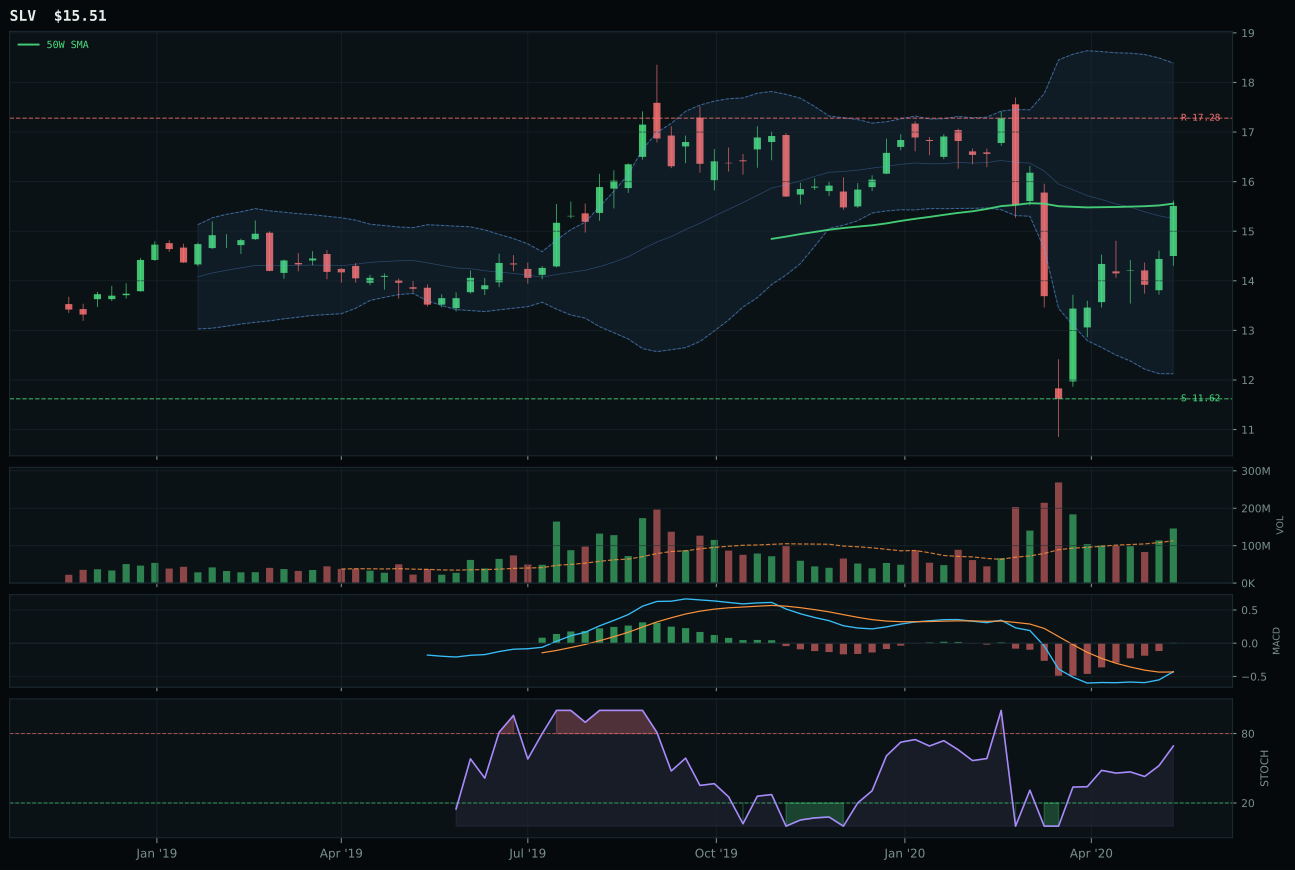
SLV has a compression near 50W profile with 8.9% 13-week relative strength versus SPY.
Extension and support failure are the main tactical risks.
Tracked, but not top-2 eligible because: structurally broken.
GLD dominated with perfect trend scores (100 on both price position and RS, 0.6% 50W slope), crushing GDX's vertical extension setup and thin volume participation. The split was stark: GLD's 14.0% distance from the 50W placed it in measured upper-retracement momentum, while GDX at 31.7% sat in the truly exhausted zone where every new buyer is late and stochastic RSI overbought at the peak guaranteed a pullback. GLD's 10.0% thirteen-week return paired with 25.2% SPY-relative strength created the dual confirmation the system demands—not borrowed momentum from a broad risk-on squeeze, but specific capital rotation into the gold complex. Volume at 0.97x average stayed neutral rather than panicked, and the stochastic RSI falling-neutral reading (0.62) meant the move was extended but not ripped. GDX's 29.2% thirteen-week and 44.4% SPY-relative screamed leveraged tail, not leadership.
Precious Metals earned its 20% top-2 allocation on a 67.5 score backed by 74.0 macro fit—the strongest defensive macro anchor in this week's regime. Monetary hedge bid is active at +14, disinflation pressure at +8, and defensive rotation at +6; these are not theoretical tilts but live money flows responding to credit stress (-7 in the weighting, but present). GLD's 100 momentum confirmation is rare this week and reflects genuine buyer conviction, not forced rebalancing. The setup is extended but clean: price above both trend averages, MACD bullish and improving, structure neutral with good compression (75.3), and risk/reward at 44.5 that demands respect. Goldilocks helps at +9, but the real fuel is the narrative shift toward safety; this is not a tactical bounce but a regime allocation rotating out of equities into hard money and inflation protection. The 20% slot is earned because the category combines the best trend technicals in the portfolio with the strongest macro wind.
AI — BOTZ
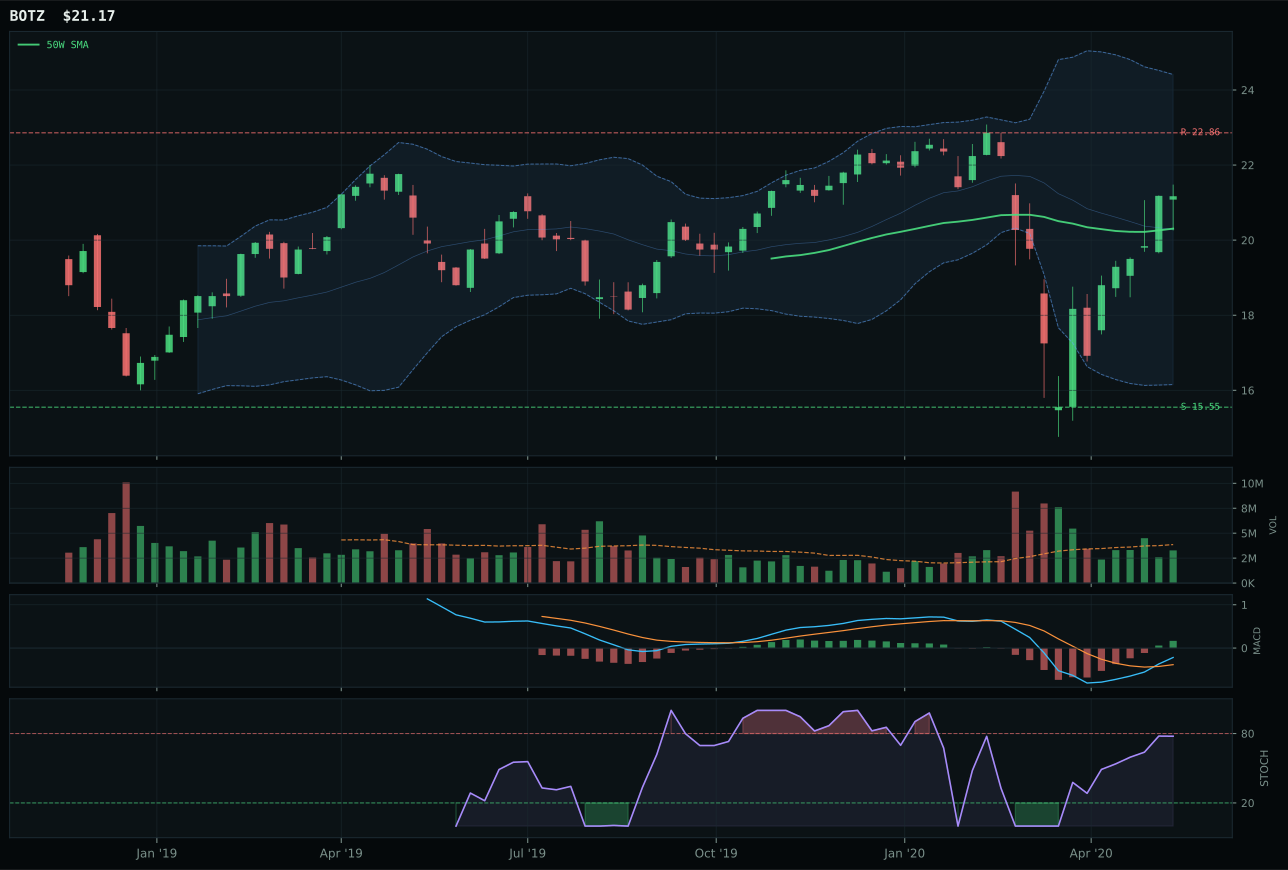
BOTZ has a neutral structure profile with 7.8% 13-week relative strength versus SPY.
A failed hold above support would weaken the setup.
Actionable but governed by invalidation levels.
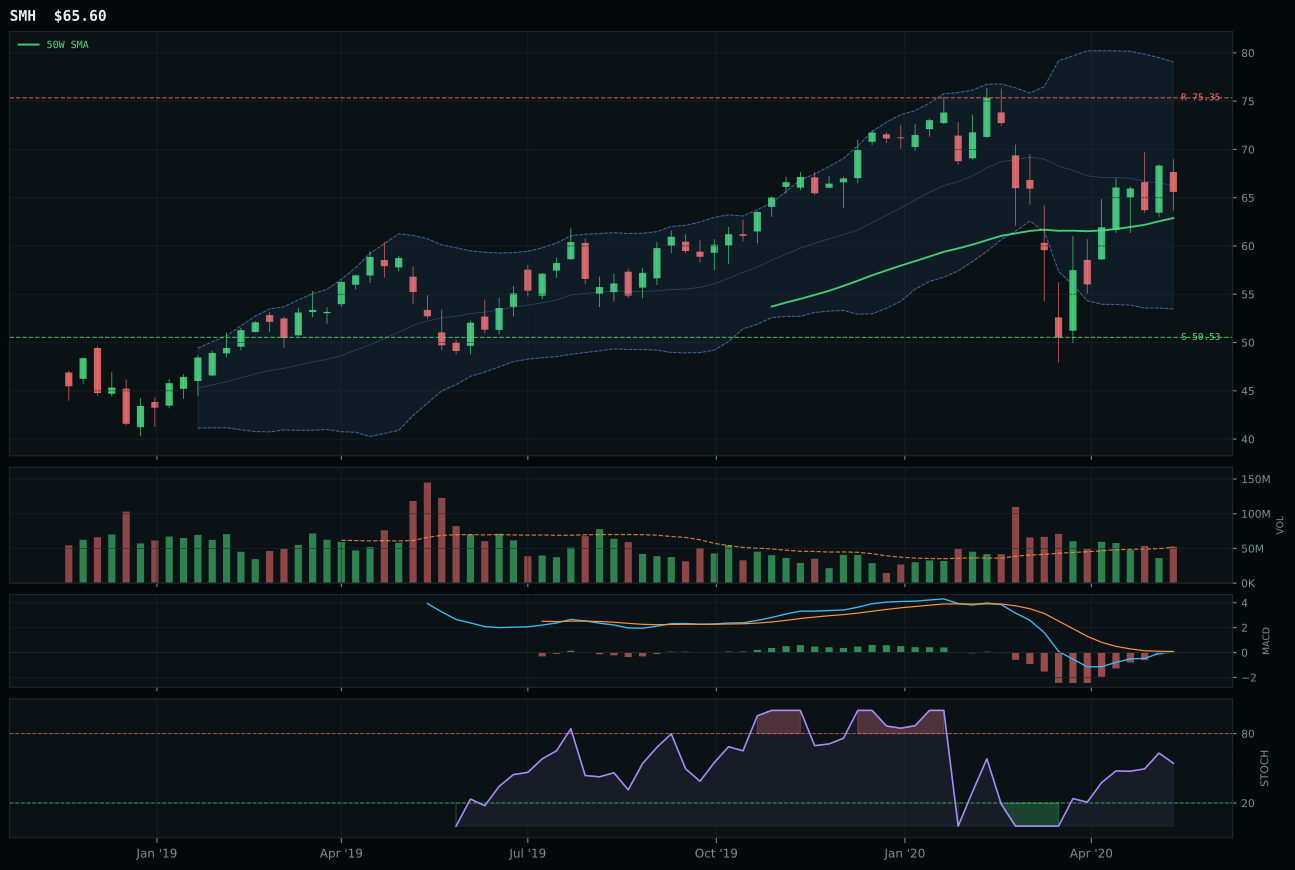
SMH has a neutral structure profile with 2.3% 13-week relative strength versus SPY.
A failed hold above support would weaken the setup.
Actionable but governed by invalidation levels.
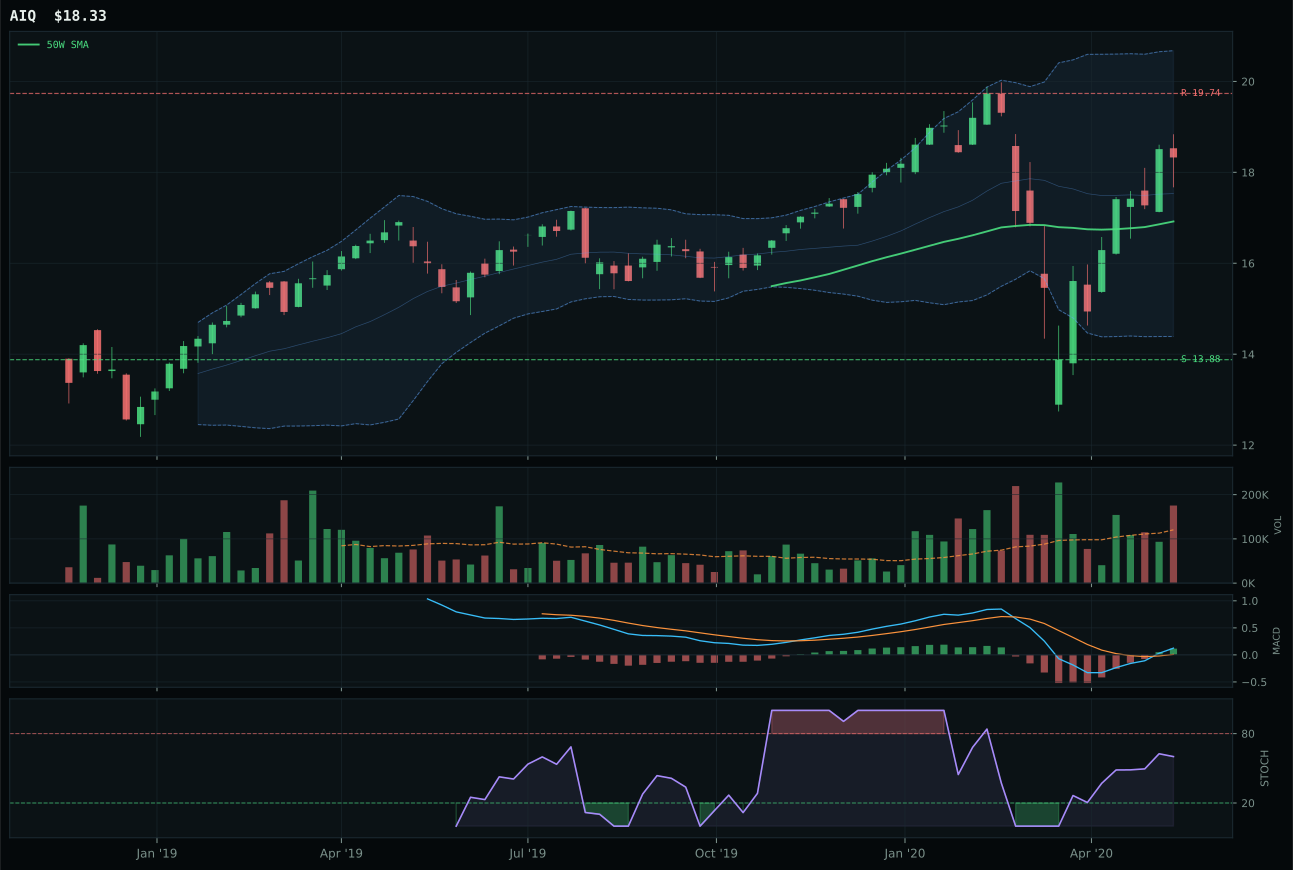
AIQ has a neutral structure profile with 8.1% 13-week relative strength versus SPY.
A failed hold above support would weaken the setup.
Tracked, but not top-2 eligible because: .
BOTZ won the category with a 7.8% SPY-relative return and cleaner structure (66.3 vs SMH's 59.0), despite SMH's superior raw trend (96 vs 90) and timing (98 vs 98). The difference lay in confirmation: BOTZ's bullish, improving MACD and neutral volume at 0.85x average created a setup where buying was rational but patient—neither panicked nor exhausted. SMH's bearish-but-improving MACD and -12.9% thirteen-week return telegraphed a chart that was being repaired from genuine damage, making it the weaker testimony even though its macro story (AI growth sponsorship at +14) was objectively stronger. The real issue was category-relative strength: BOTZ hit 0.0% while SMH registered -5.5%, proving that within the robotics-versus-semiconductors trade, capital was rotating away from chip volatility and toward the more measured physical automation thesis.
AI earned only 10% despite its 78.0 category macro fit and 58.4 composite score, which reveals the tension at the core of portfolio construction this week: strong macro narrative does not survive weak technicals at decision time. BOTZ's setup is genuinely recoverable—close to the 50W, stochastic overbought rolling over at 0.78, support sitting 36% below current levels—but the 13W return of -7.4% and category-relative stagnation mean this is a rehabilitation candidate, not an immediate conviction trade. Credit stress is active at -8 within the macro weighting, and momentum confirmation scored only 86.1 because the four-week return (9.7%) is outpacing the thirteen-week (-7.4%), a classic sign that mean reversion is being bought, not leadership. To ascend to top-2, AI would need either a confirmed breakout above the 50W with volume sponsorship or a sharp acceleration in category-relative strength; neither is in evidence.
Utilities & Infrastructure — IGF
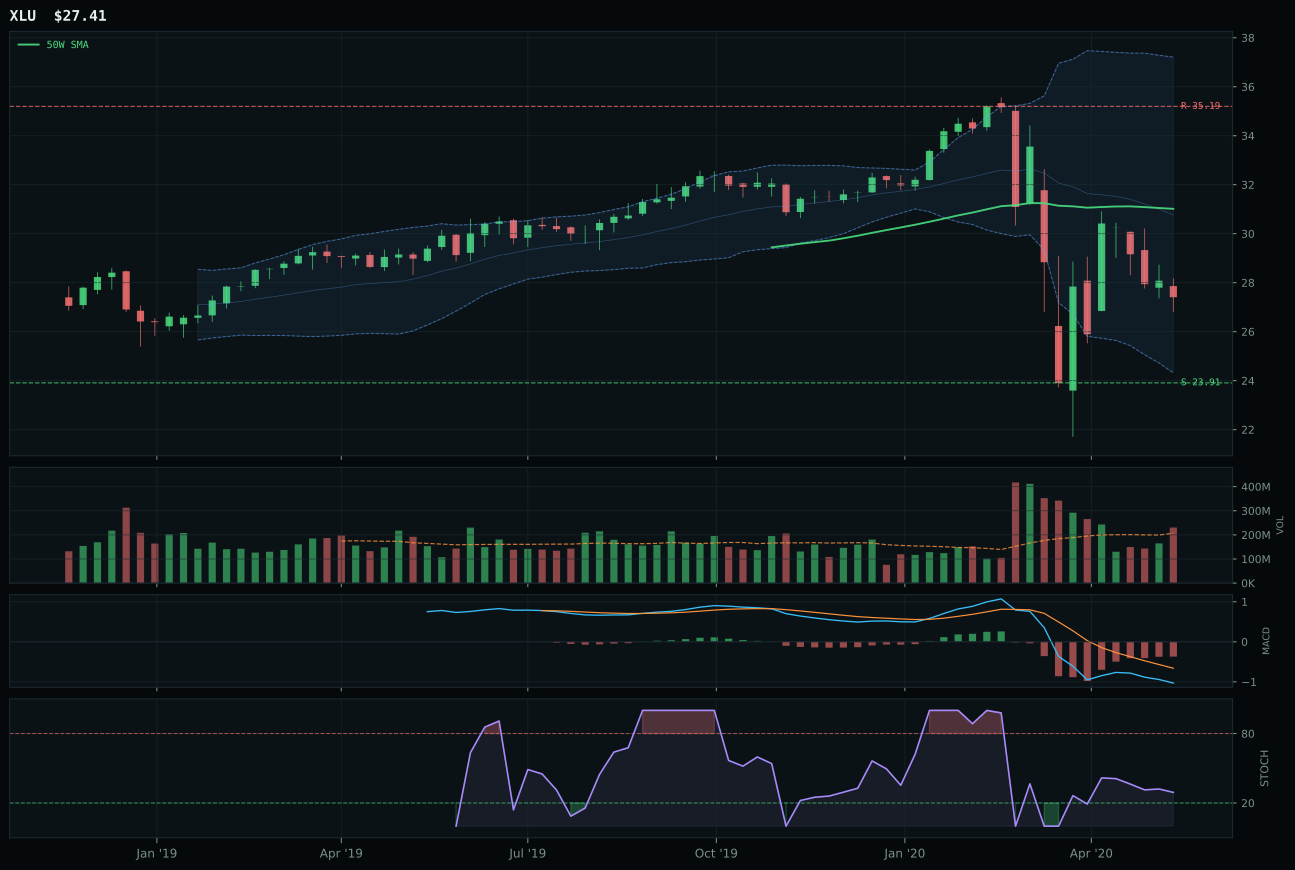
XLU has a neutral structure profile with -6.9% 13-week relative strength versus SPY.
A failed hold above support would weaken the setup.
Actionable but governed by invalidation levels.
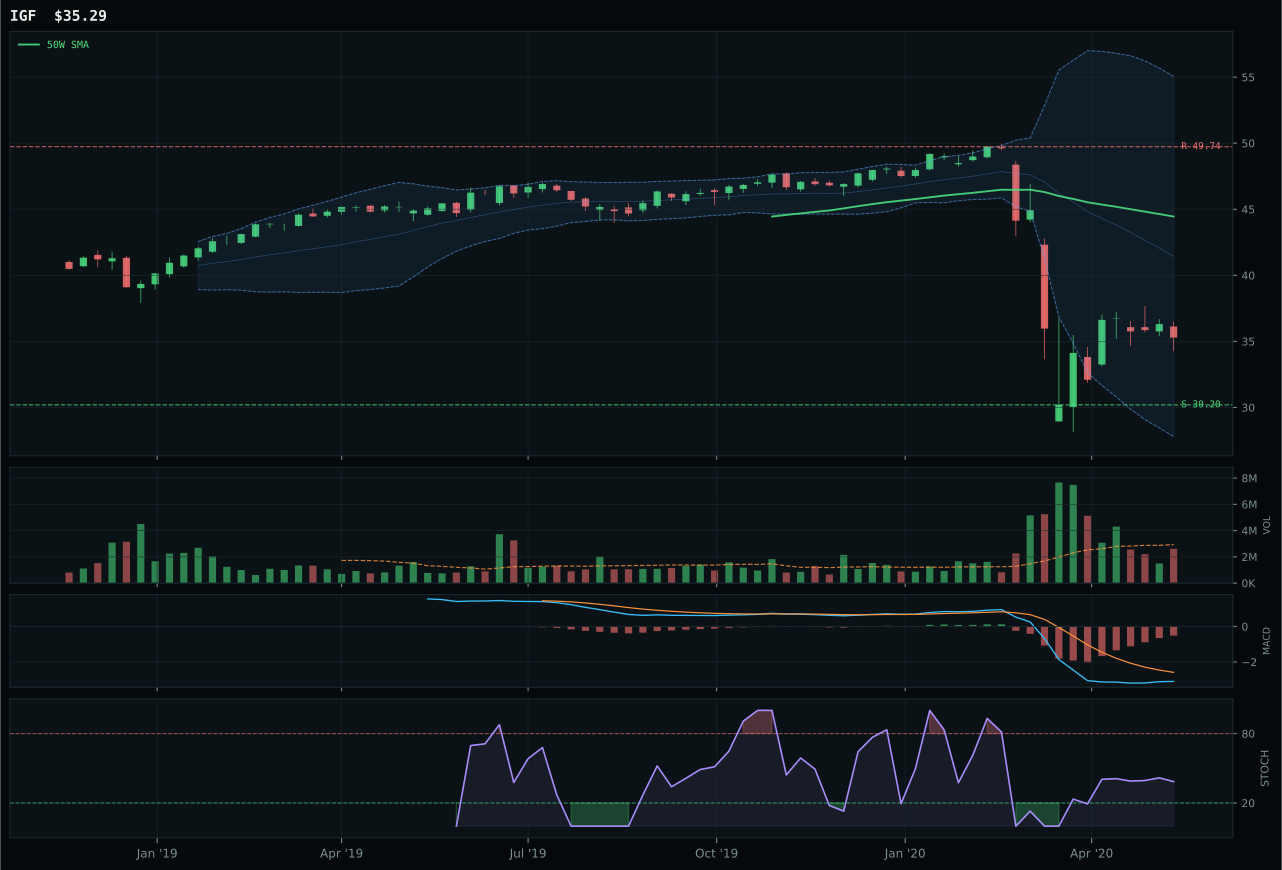
IGF has a neutral structure profile with -13.8% 13-week relative strength versus SPY.
A failed hold above support would weaken the setup.
Actionable but governed by invalidation levels.
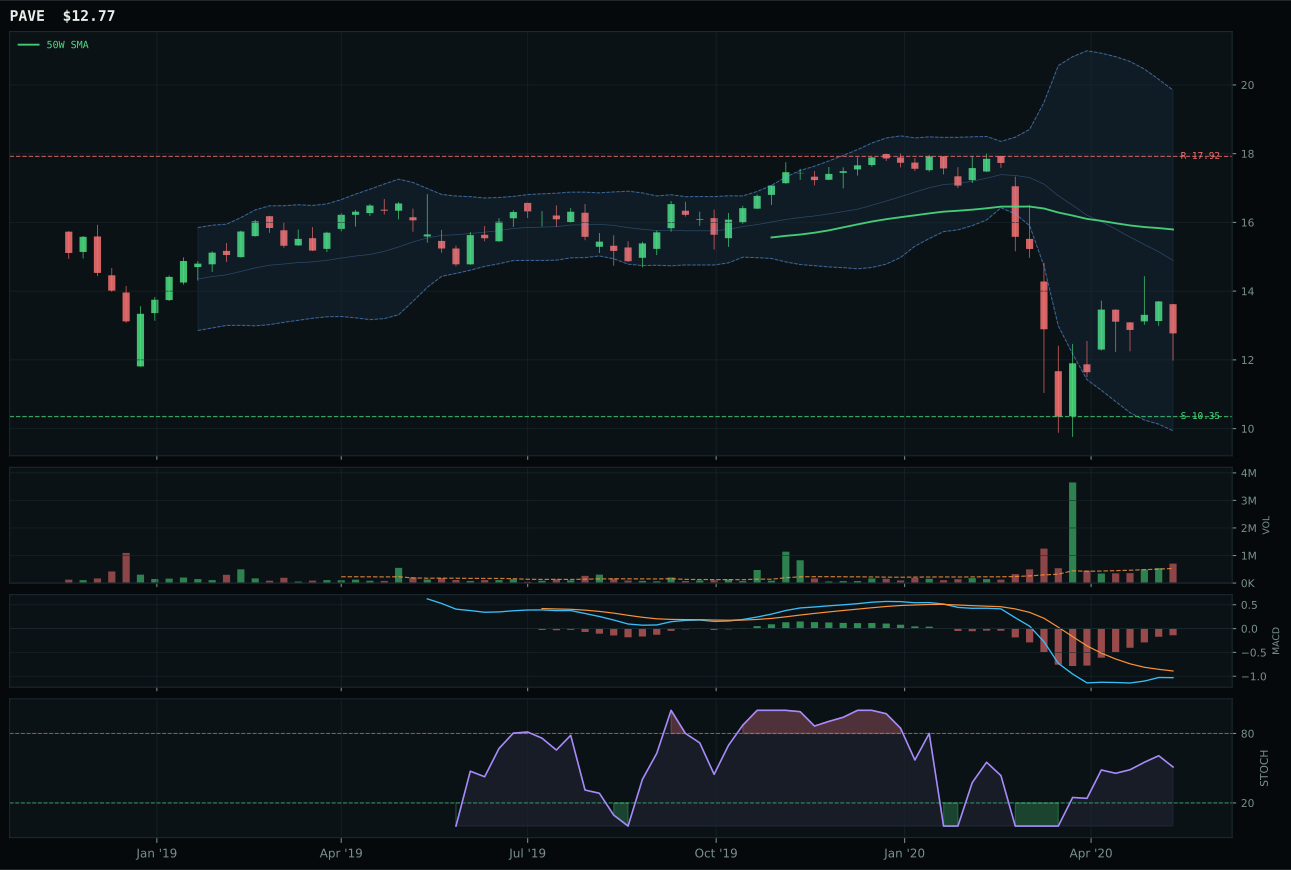
PAVE has a neutral structure profile with -13.3% 13-week relative strength versus SPY.
A failed hold above support would weaken the setup.
Tracked, but not top-2 eligible because: .
IGF won the category with 64.0 structure score (best in the trio) and identical timing to PAVE (both 55.0), beating XLU despite XLU's superior momentum confirmation (17 vs 0) and stronger macro narrative (69.0 fit versus IGF's 59.0). The victory was structural: IGF's cleanliness (50.0) and compression (45.4) outpaced XLU's higher but less clean positioning. IGF also captured neutral category-relative strength (0.0) versus XLU's positive 6.3%, which sounds backward until you realize XLU's strength came from index rebalancing into defensive names, not fresh capital conviction. Both sat deep in drawdown (-20.6% and -11.6% respectively from the 50W), both carried bearish-improving MACD and falling stochastic RSI, and both faced -29% and -22% thirteen-week headwinds. IGF's advantage was that its deeper drawdown (-20.6%) placed it in truer value territory; XLU was still in decay mode.
Utilities & Infrastructure earned the 10% tier at 32.9 despite scoring only 2.5 on technical evidence, a stark disconnect that reveals how fully macro is dominating this category's allocation. Macro fit at 74.0 is driven by active defensive rotation at +12, disinflation pressure at +6, and broad market bear at +4—the exact tailwinds that would normally justify top-2 weight. However, trend is catastrophic (23.0), momentum is zero, and volume-price confirmation is nearly nonexistent (15.2), which prevented eligibility from rising above True. This category is held for structural diversification and the possibility that defensive flows accelerate: if risk appetite pivots to actual protection rather than Goldilocks complacency, utilities rotate from laggards to leaders within weeks. Until that inflection, the 10% slot is a placeholder backed by the strongest defensive macro argument in the portfolio but undermined by charts that show active liquidation and no stabilization. A break above the 50W on real volume would justify a 20% rotation immediately.
Nuclear Energy — URA
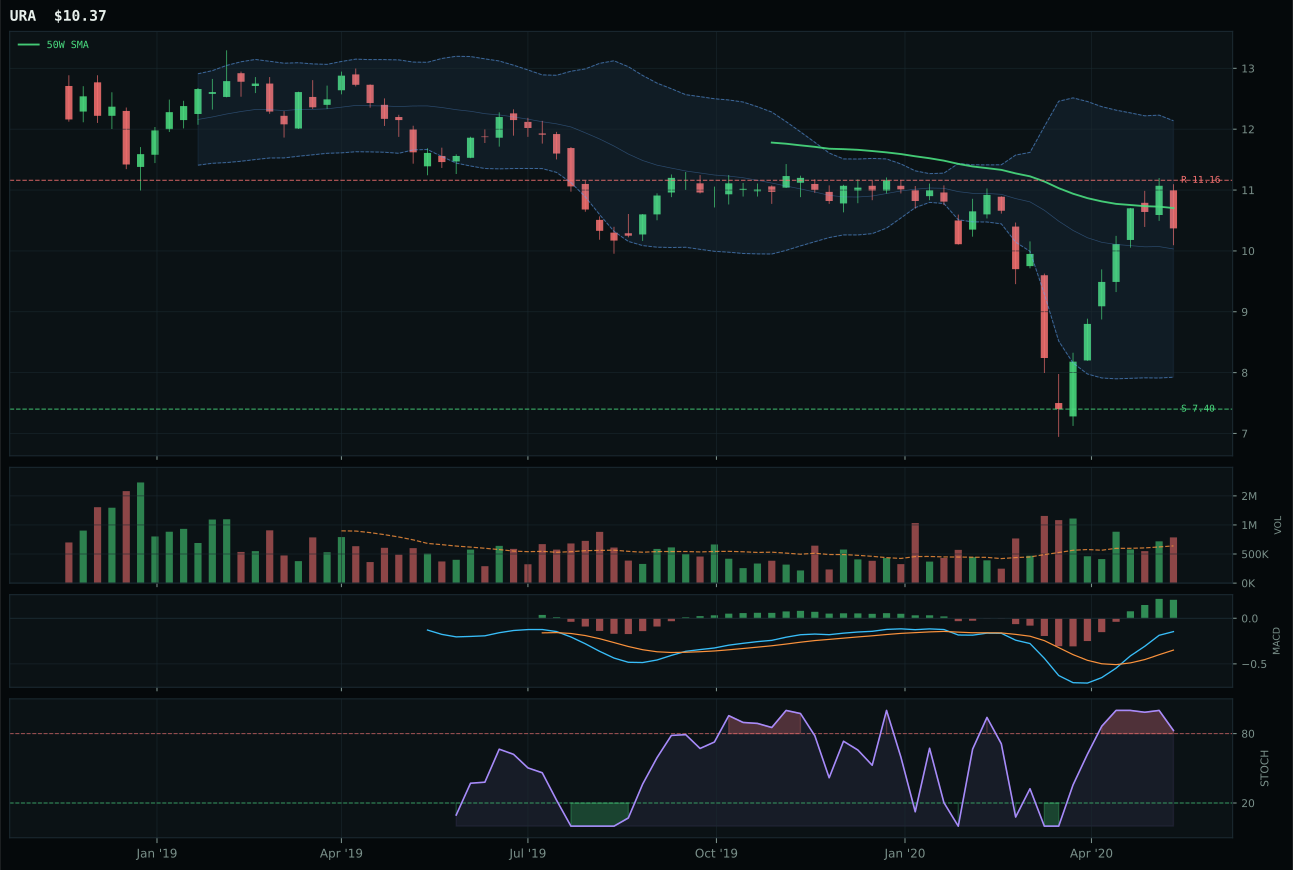
URA has a neutral structure profile with 10.2% 13-week relative strength versus SPY.
Extension and support failure are the main tactical risks.
Tracked, but not top-2 eligible because: structurally broken.
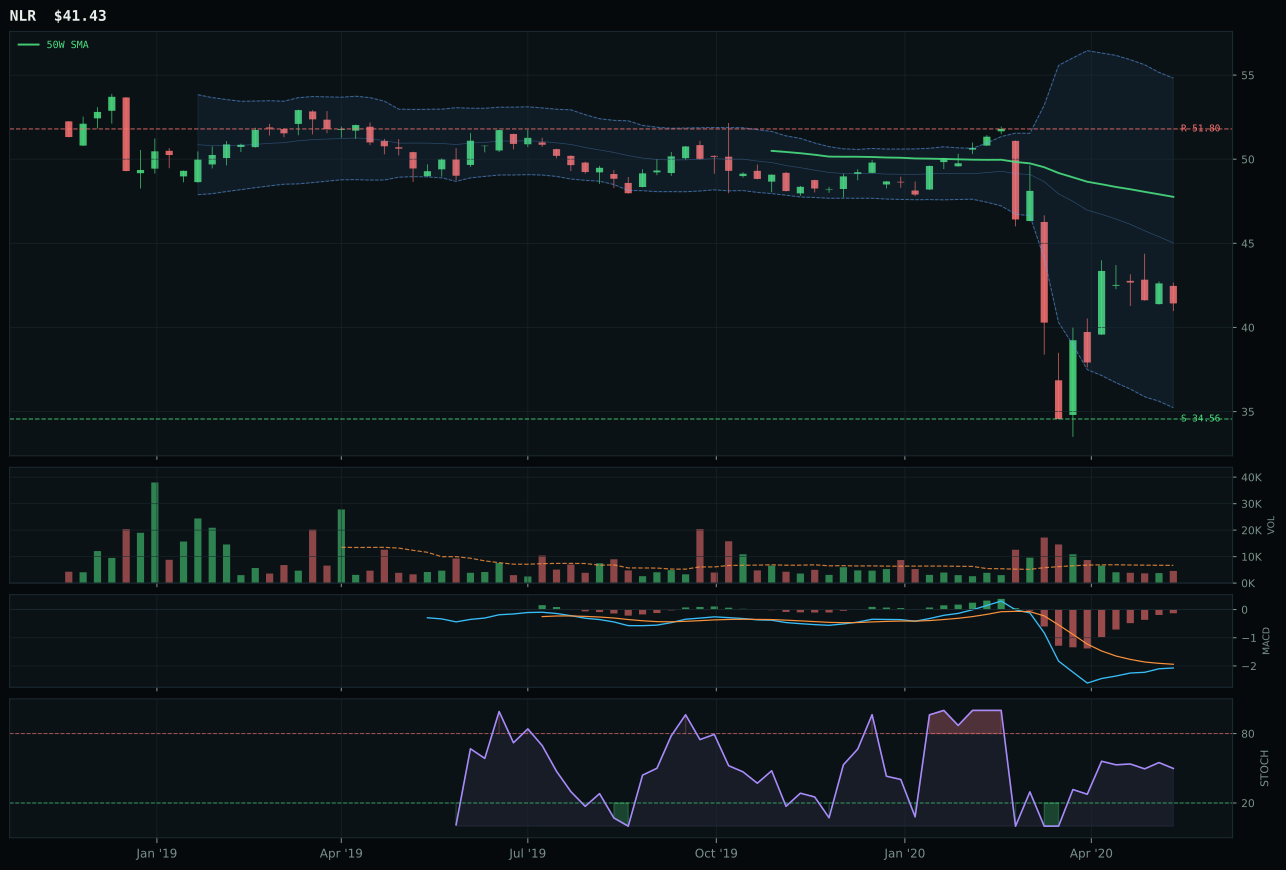
NLR has a neutral structure profile with -4.1% 13-week relative strength versus SPY.
Extension and support failure are the main tactical risks.
Tracked, but not top-2 eligible because: structurally broken.
URA beat NLR (flagged structurally broken) by capturing 7.1% category-relative strength and maintaining bullish-improving MACD, where NLR deteriorated to bearish confirmation. Both sat near the 50W (URA at -3.1%, NLR deeper), but URA's timing score (72.0 vs NLR's 55.0) reflected tighter structure and a stochastic RSI overbought rolling over in the momentum zone, versus NLR's falling-neutral position in indecision. Volume participation at 1.23x average gave URA above-average sponsorship into the move, whereas NLR's thin participation left it stranded. Momentum confirmation for URA (86.1) crushed NLR's (7) because the 4W return (2.6%) was positive and the category-relative edge was decisive. Neither scored above 42 on technical evidence, but URA's macro narrative (nuclear energy as non-carbon baseload in a Goldilocks regime) paired with stronger chart mechanics to claim the representative role.
Nuclear Energy earned 10% at 28.9 category score on the basis that URA holds 10.2% SPY-relative strength and sits within recovery distance of the 50W, making it the single least-broken chart in a macro-challenged category. However, eligibility is flagged as False, meaning the category failed hard filters despite passing other tests. Macro fit at 50.0 is neutral; AI growth sponsorship at +5 is interesting but weak, and there is no strong defensive rotation bid. The long-term thesis for nuclear is sound—baseload, carbon-free, energy independence—but this week's regime does not prioritize that narrative. URA is held as a recovery candidate and a structural long bet: if energy demand normalizes or carbon credits gain traction, this category could move to 15%; until then, it occupies the minimum slot because the technicals are simply too weak and the macro too neutral to justify conviction.
Defense & Aerospace — XAR
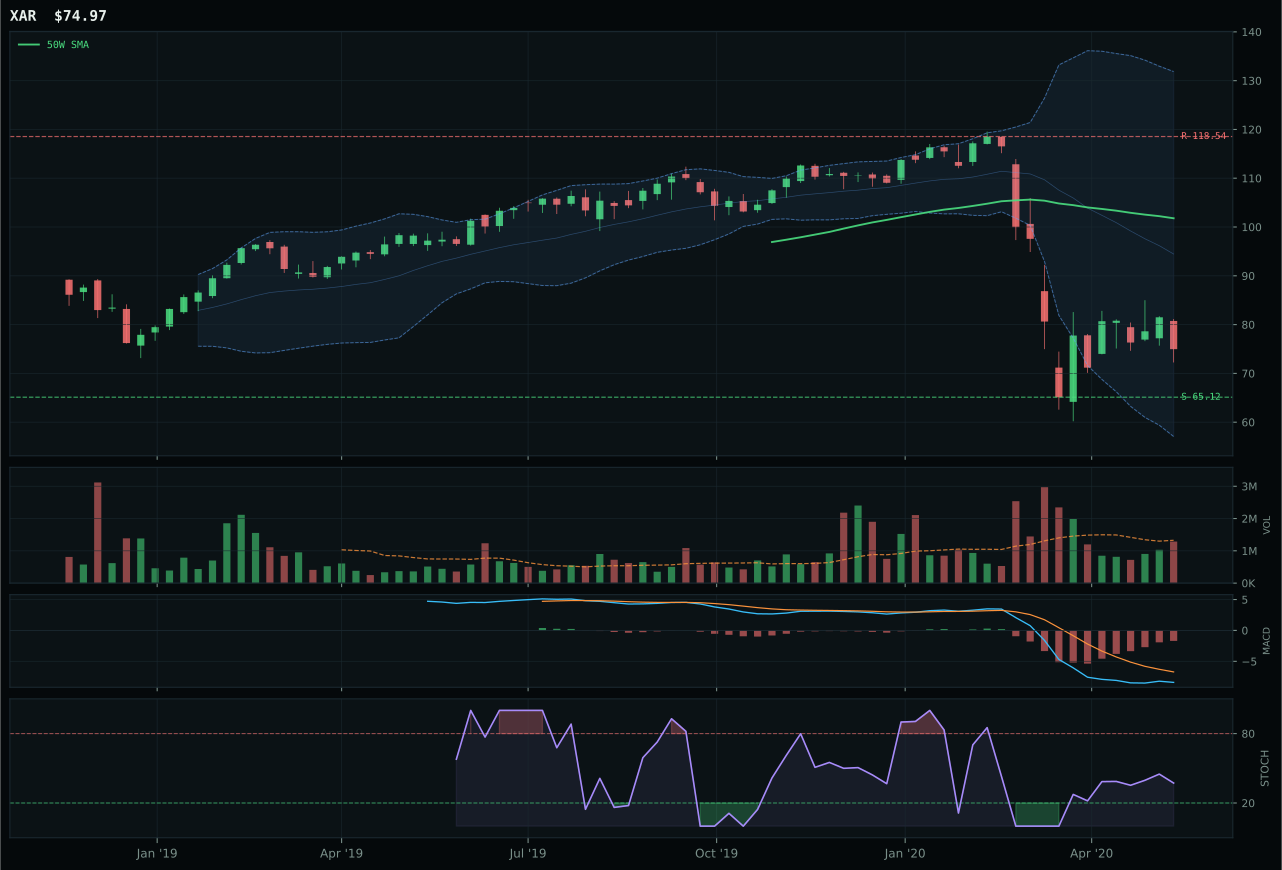
XAR has a neutral structure profile with -21.6% 13-week relative strength versus SPY.
A failed hold above support would weaken the setup.
Actionable but governed by invalidation levels.
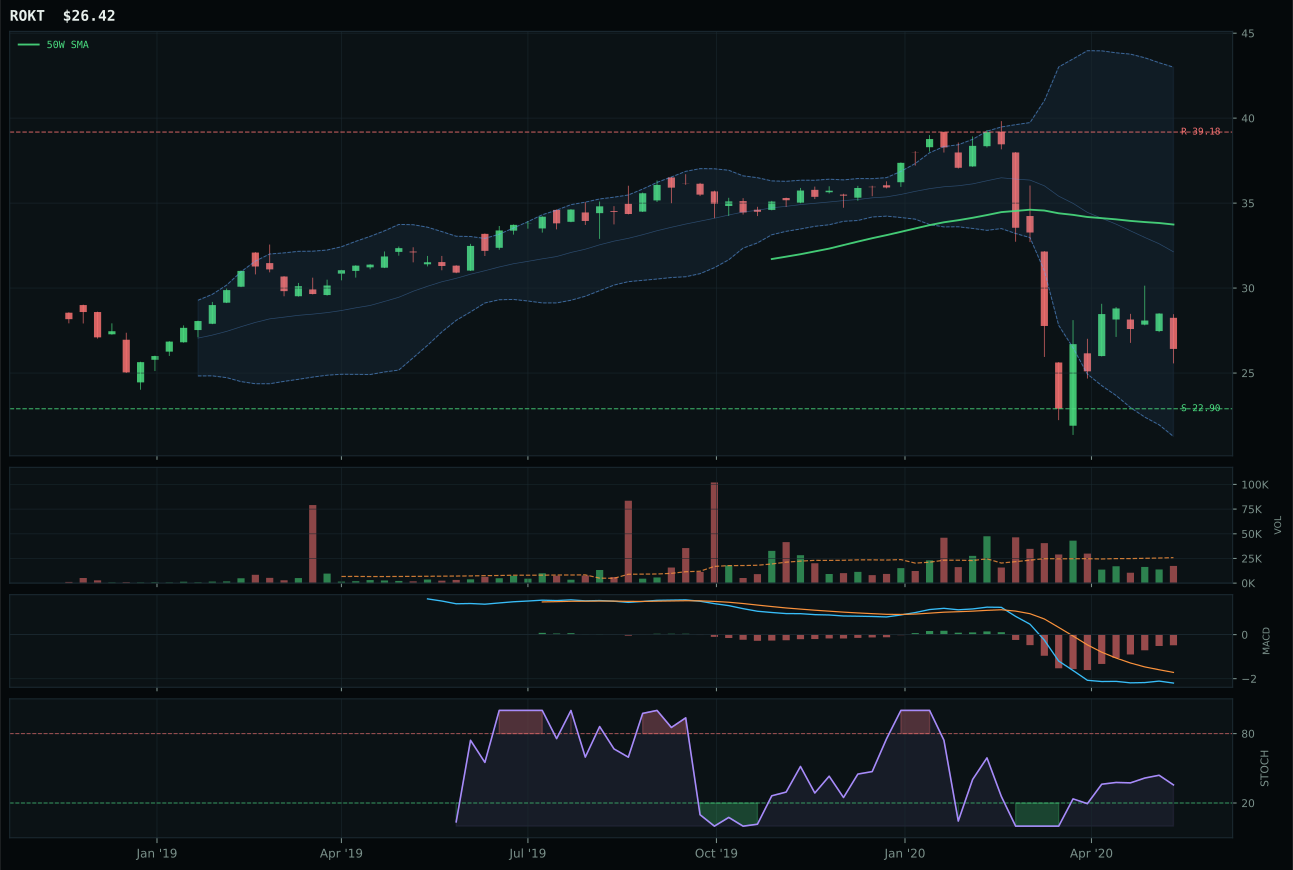
ROKT has a neutral structure profile with -17.4% 13-week relative strength versus SPY.
A failed hold above support would weaken the setup.
Tracked, but not top-2 eligible because: .
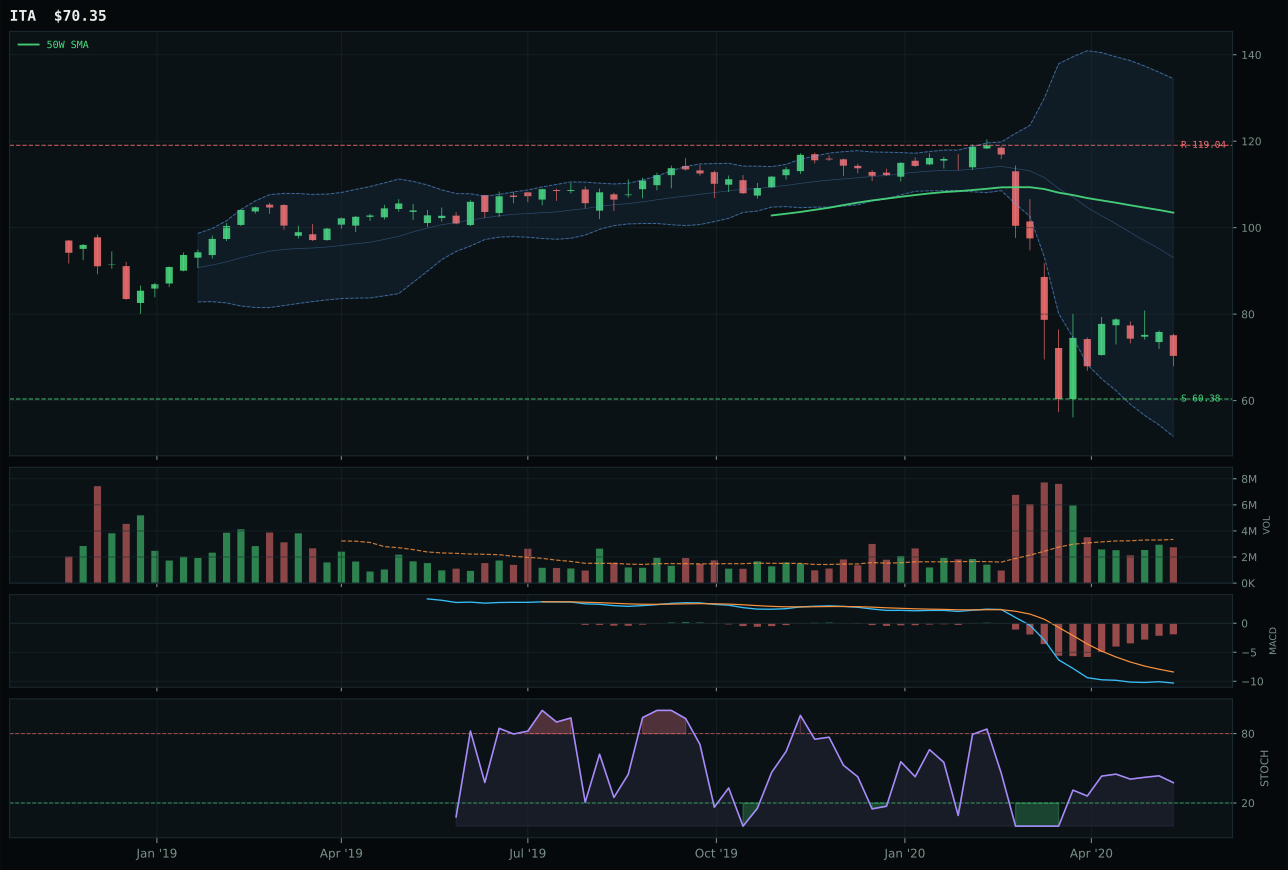
ITA has a neutral structure profile with -25.7% 13-week relative strength versus SPY.
A failed hold above support would weaken the setup.
Actionable but governed by invalidation levels.
XAR won because risk/reward tilted the hardest in its favor despite catastrophic trend deterioration: 81.7 on the risk-reward module versus ROKT's 68.1, reflecting 15.1% downside support proximity against 36.8% upside resistance distance. The Fib placement at 0.786 (deep value) and -26.4% distance from the 50W meant XAR had absorbed the maximum selloff the chart could structurally deliver, while stochastic RSI rising mid-zone and MACD bearish-but-improving provided the first technical footprint of recovery initiation. Momentum confirmation at 0.0 was identical to ROKT, but XAR's timing score (63.0) beat ROKT's (55.0) because the -26.4% gap to the 50W created genuine asymmetry: large downside has already been paid, and the next move offers more cents per dollar risked. ROKT's thin participation and falling stochastic RSI confirmed it was still in the liquidation phase, not the recovery phase.
Defense & Aerospace merged into the 10% allocation tier at 28.1 category score because its macro fit of 69.0 and reasonable risk/reward argument could not overcome the brutality of the technicals: defensive rotation is active at +8, broad market bear at +6, but trend scores in the 23–33 range leave no room for error. This category is held for structural value fishing, not momentum, and the Goldilocks regime does not reward that trade this week. Eligible but diminished rank, XAR survives the cut because its -36.8% thirteen-week return is so severe that any stabilization signal matters; new capital is sparse, so the few basis points of MACD improvement and stochastic RSI inflection warrant a sleeve. Conviction here is tactical value, not strategic recovery—the setup works only if credit stress begins to ease and the broad market bear descriptor cycles off.
Agriculture & Livestock — MOO
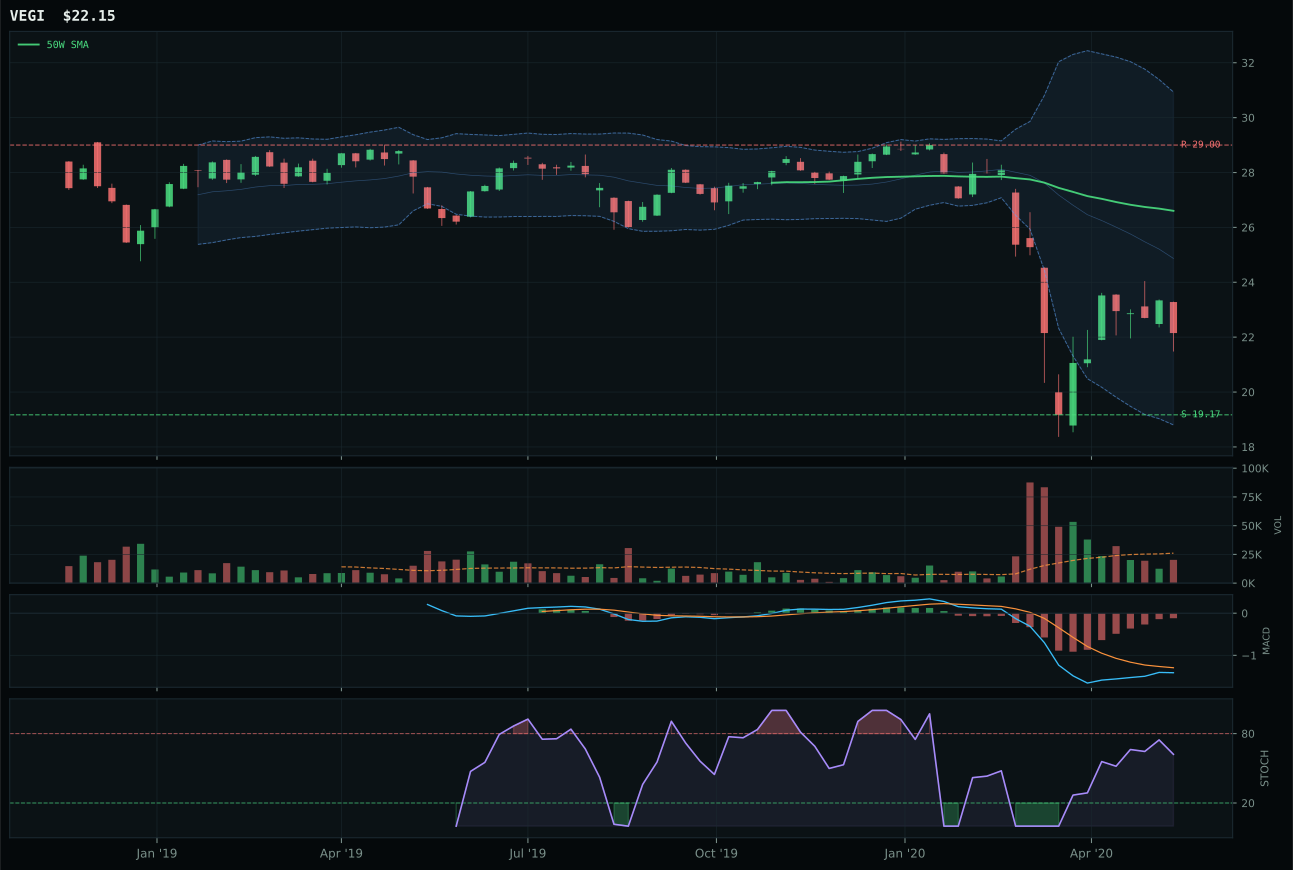
VEGI has a neutral structure profile with -5.6% 13-week relative strength versus SPY.
Extension and support failure are the main tactical risks.
Tracked, but not top-2 eligible because: structurally broken.
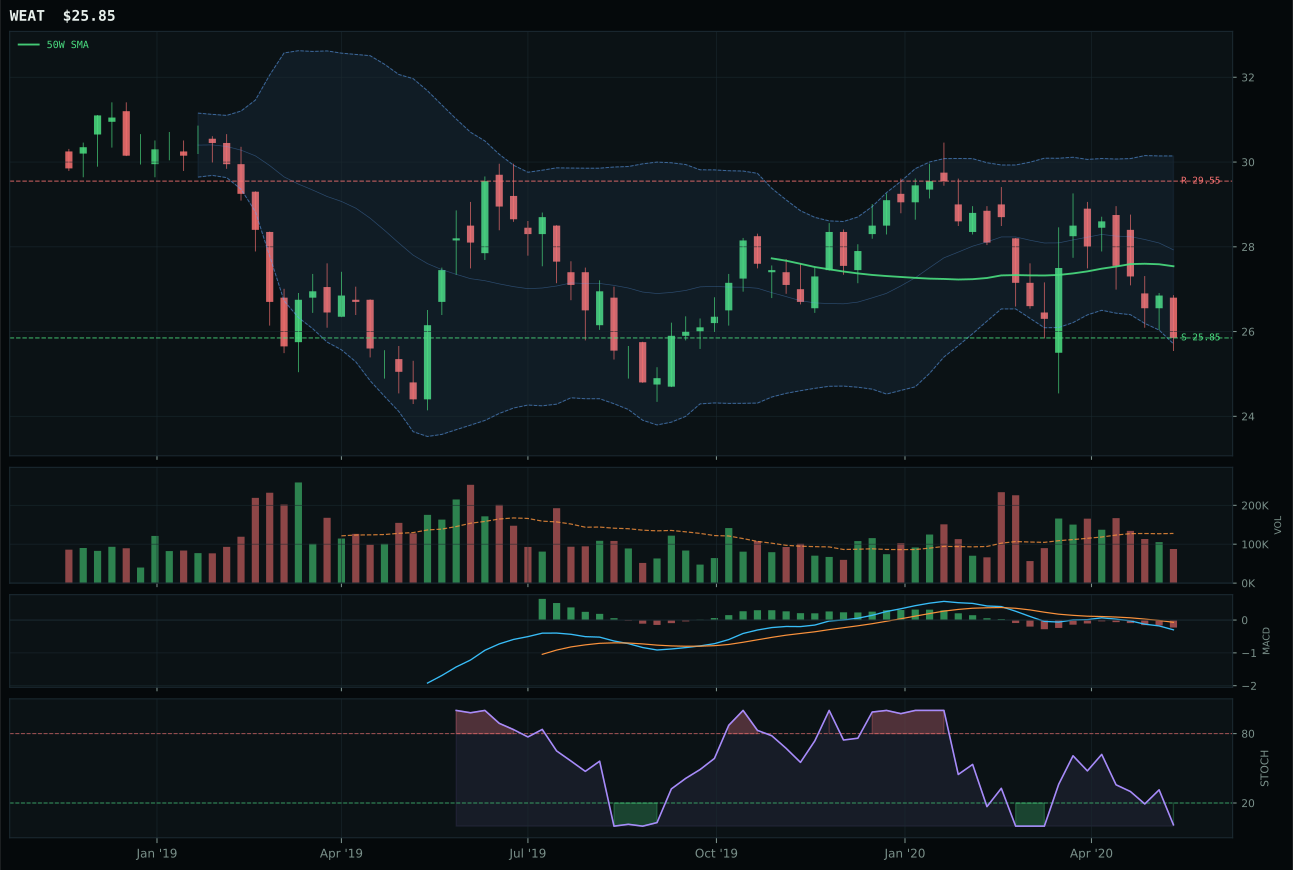
WEAT has a pullback into support profile with 7.2% 13-week relative strength versus SPY.
Extension and support failure are the main tactical risks.
Tracked, but not top-2 eligible because: structurally broken.
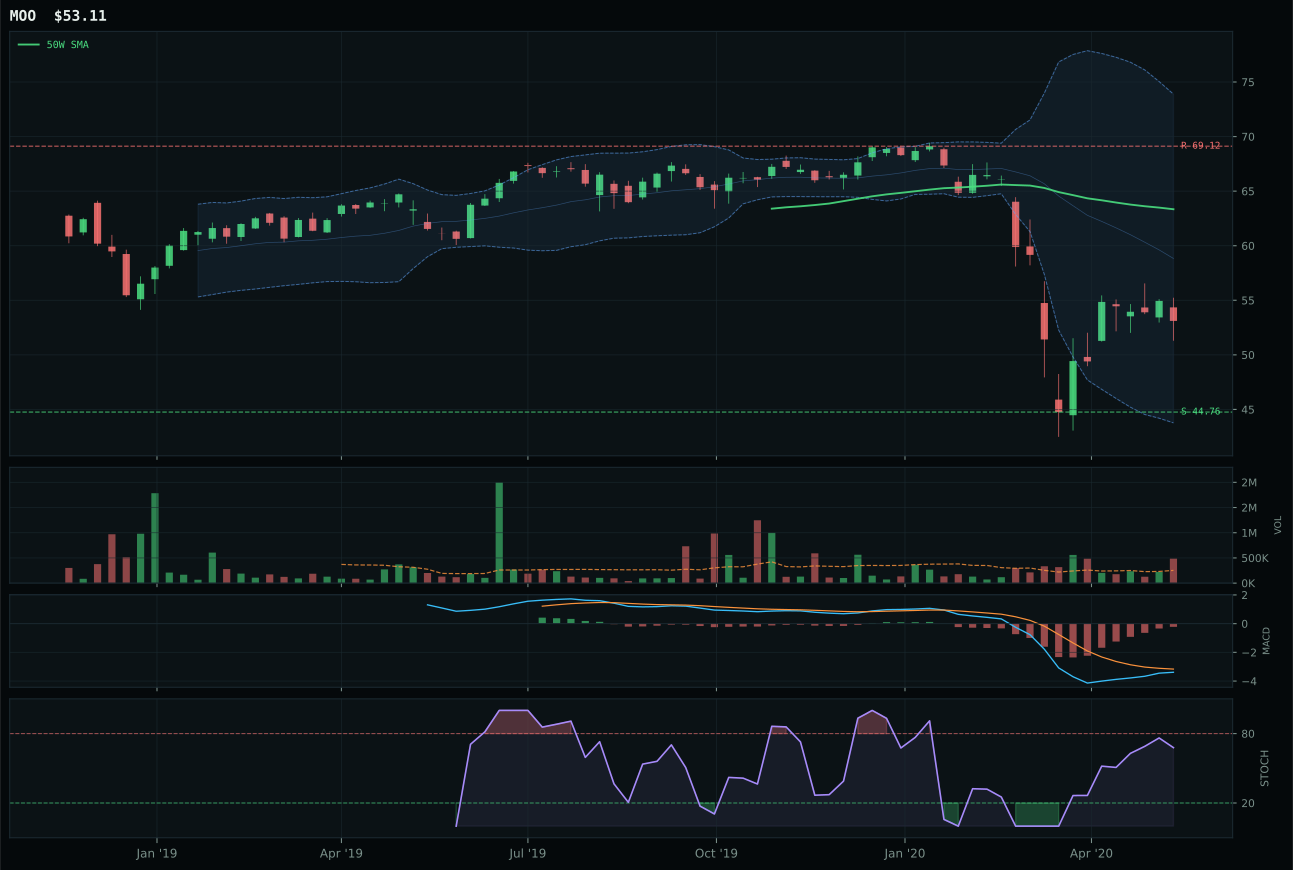
MOO has a neutral structure profile with -4.9% 13-week relative strength versus SPY.
A failed hold above support would weaken the setup.
Actionable but governed by invalidation levels.
MOO won a category that scored 0.0 composite, meaning it failed hard filters on volume-price confirmation and persistence, yet still claimed representative status because the runner-up VEGI was structurally broken and WEAT's bearish-weakening MACD disqualified it on signal quality. MOO's advantage was narrow: timing at 63.0 versus VEGI's 55.0, stochastic RSI rising mid-zone versus VEGI's falling position, and neutral structure versus VEGI's broken state. The 13W return of -20.1% is catastrophic, and momentum confirmation at 9.2 reveals this is a capitulation bounce, not accumulation. Distribution pressure at 1.93x average volume tells the story: sellers are finally exhausted, but buyers have not shown up yet. Risk/reward at 52.4 reflects a setup that will either stabilize or collapse; there is no middle ground.
Agriculture got the minimum 10% slot solely because it must be represented and MOO, despite its wreckage, offers the only non-broken chart for exposure. The category scored 0.0 after macro testing, driven by disinflation pressure at -8 and no compensating descriptors; a deflationary regime crushes commodity producers, and that macro headwind is too strong to overcome with hope. WEAT's thin participation and oversold stochastic are theoretically set up for a mean reversion washout, but its bearish-weakening MACD failed the filter. This is a hold for completeness and rebalancing, not conviction. Any stabilization in commodity prices or inflation expectations would immediately elevate this to 15–20%; until that happens, MOO is a hedge placeholder, not a return driver.
Traditional Energy — FCG
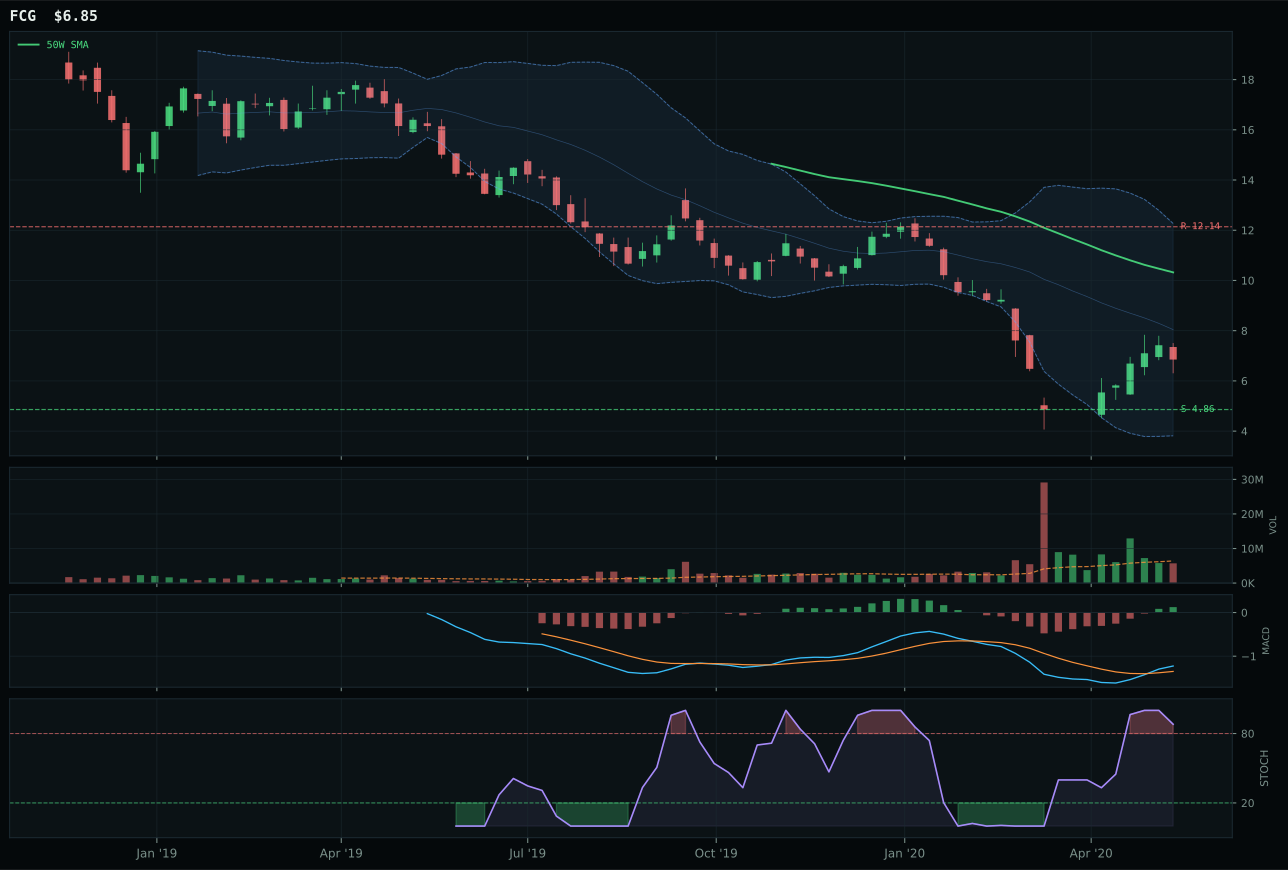
FCG has a neutral structure profile with -10.5% 13-week relative strength versus SPY.
Extension and support failure are the main tactical risks.
Tracked, but not top-2 eligible because: structurally broken.
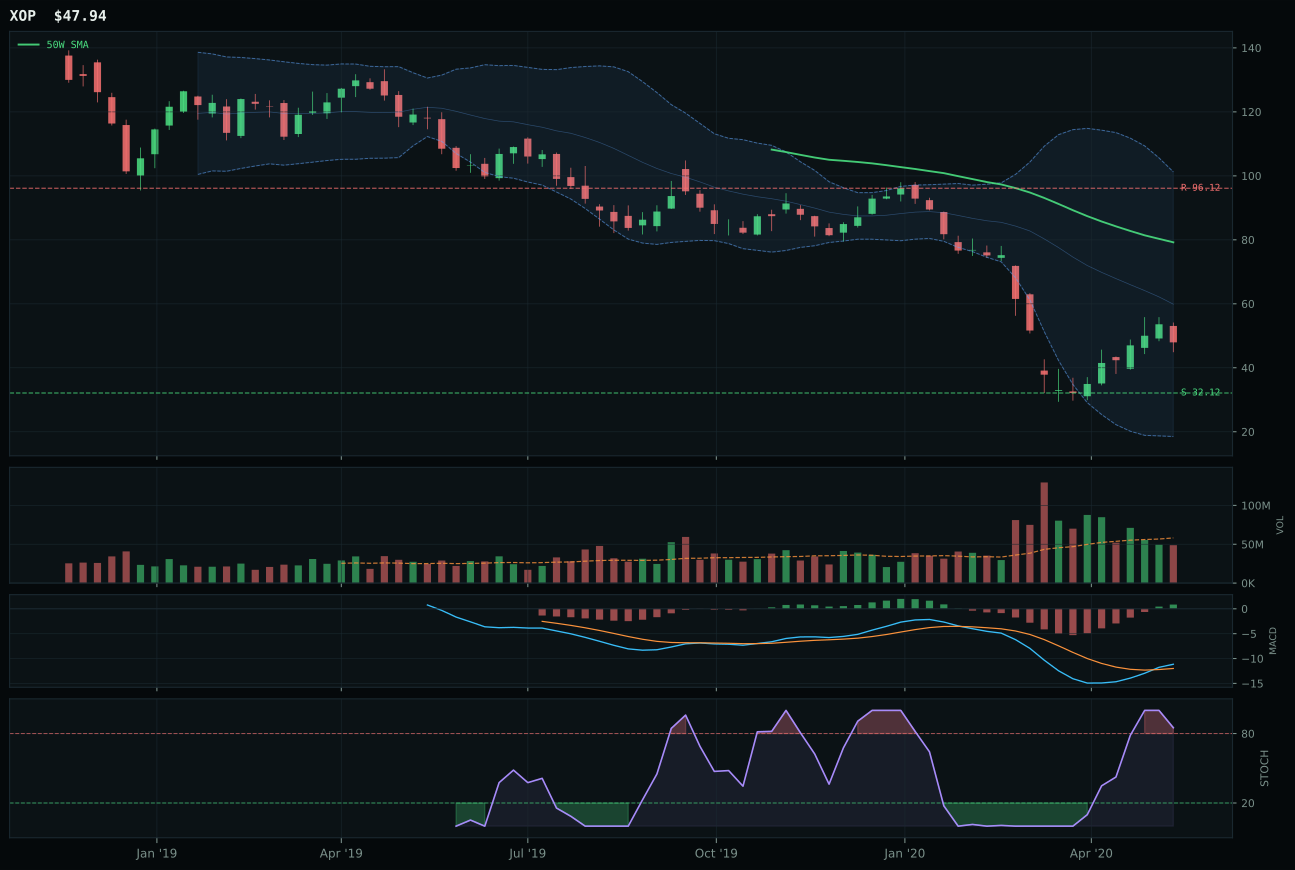
XOP has a neutral structure profile with -21.0% 13-week relative strength versus SPY.
Extension and support failure are the main tactical risks.
Tracked, but not top-2 eligible because: structurally broken.
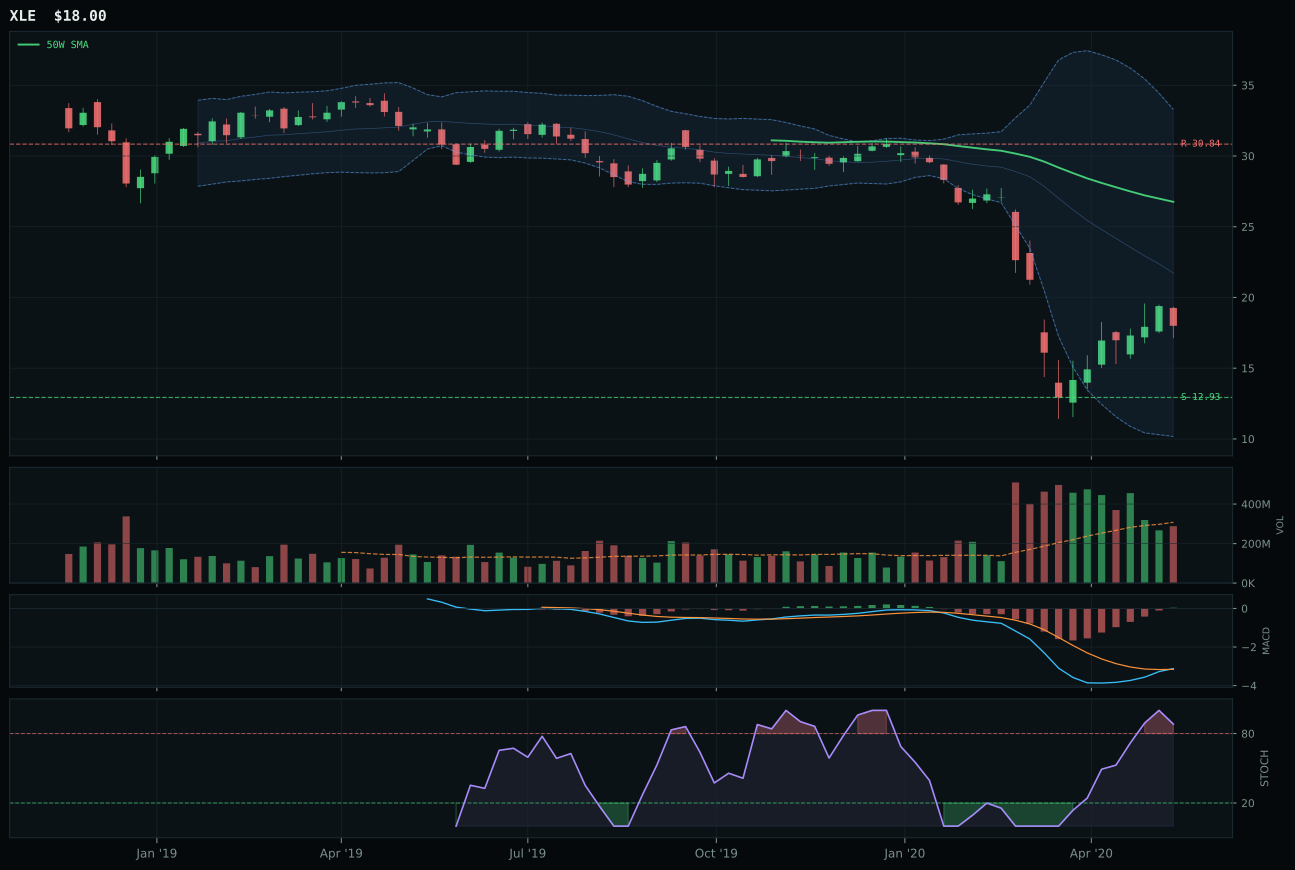
XLE has a neutral structure profile with -18.9% 13-week relative strength versus SPY.
Extension and support failure are the main tactical risks.
Tracked, but not top-2 eligible because: structurally broken.
FCG won with 29.6 technical evidence despite a 0.0 category score, surviving because it scored higher than XOP (7.5) and XLE (implied lower) on momentum confirmation (57.4 vs XOP's 14) and structure (26.0 vs XOP's implied). The four-week return of 17.7% created a positive momentum delta against the catastrophic 13W drawdown of -25.7%, proving that short-term oversold bounces were being captured even if the thesis remained broken. Stochastic RSI overbought rolling over at 0.89 telegraphed the reversal was already exhausting, yet category-relative strength at 8.4% gave FCG an edge over peers—sellers were choosing to exit XLE and XOP instead. The real story is macro failure: both credit stress at -7 and disinflation at -10 create a structural headwind that no short-term bounce can overcome. Macro fit at 50.0 is neutral, offering no support.
Traditional Energy hit 0.0 category score and 10% allocation floor purely because the portfolio must carry commodities exposure and FCG offers the least-destructive chart. This category fails hard filters on both technical evidence (29.6) and macro fit (50.0 neutral), with credit stress and disinflation working in active opposition. XOP's -36.2% thirteen-week return and -21.0% SPY-relative weakness prove the sector is being actively exited by systematic capital, and thin volume participation across the basket means any bid is fragile. The Goldilocks regime does not reward energy this week; risk appetite and growth sponsorship flow toward technology and artificial intelligence, while defensive capital chooses gold and bonds. Energy is held for diversification and rebalancing value only. A shock to the disinflation descriptor or a credit stress reversal would immediately elevate this from placeholder to meaningful allocation.
Emerging Markets — IEMG
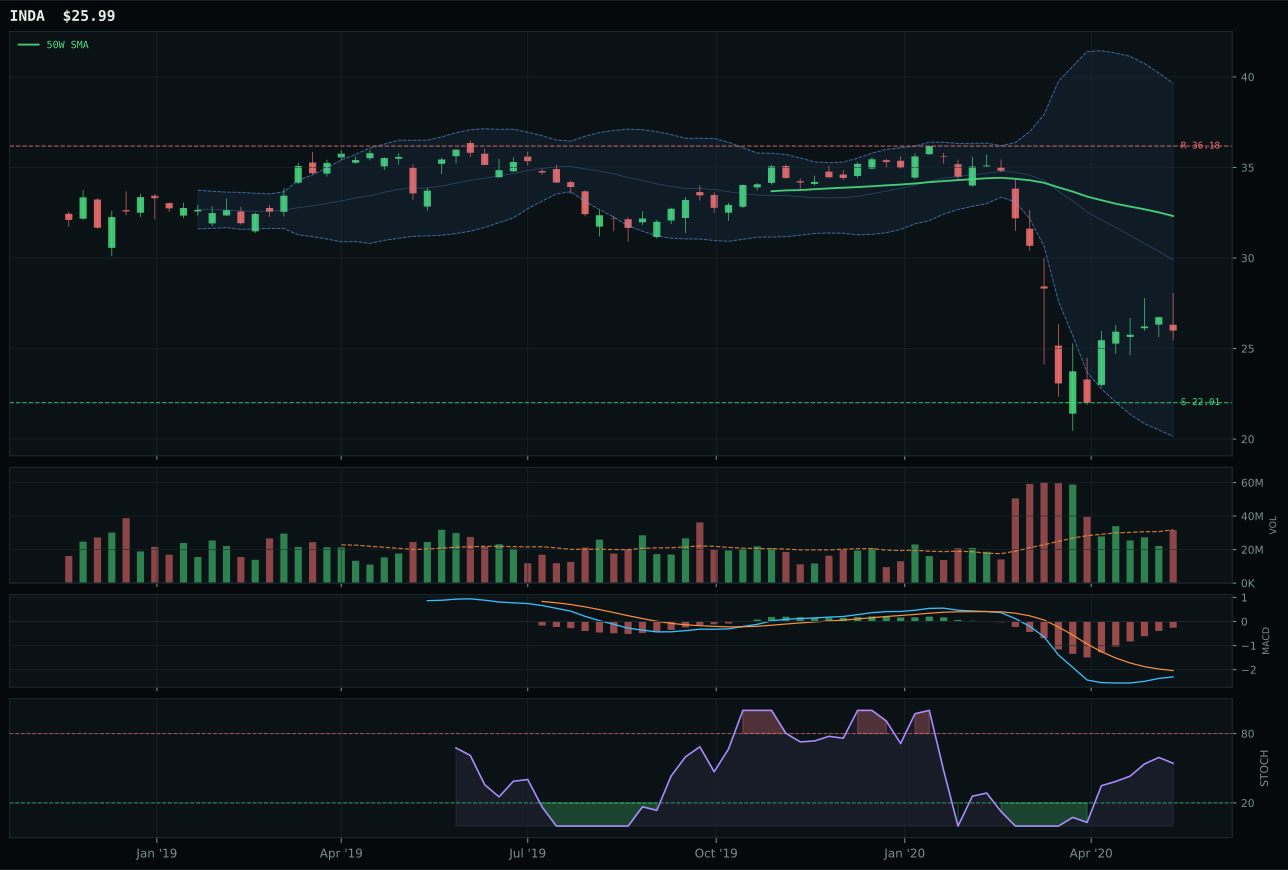
INDA has a neutral structure profile with -10.8% 13-week relative strength versus SPY.
Extension and support failure are the main tactical risks.
Tracked, but not top-2 eligible because: structurally broken.
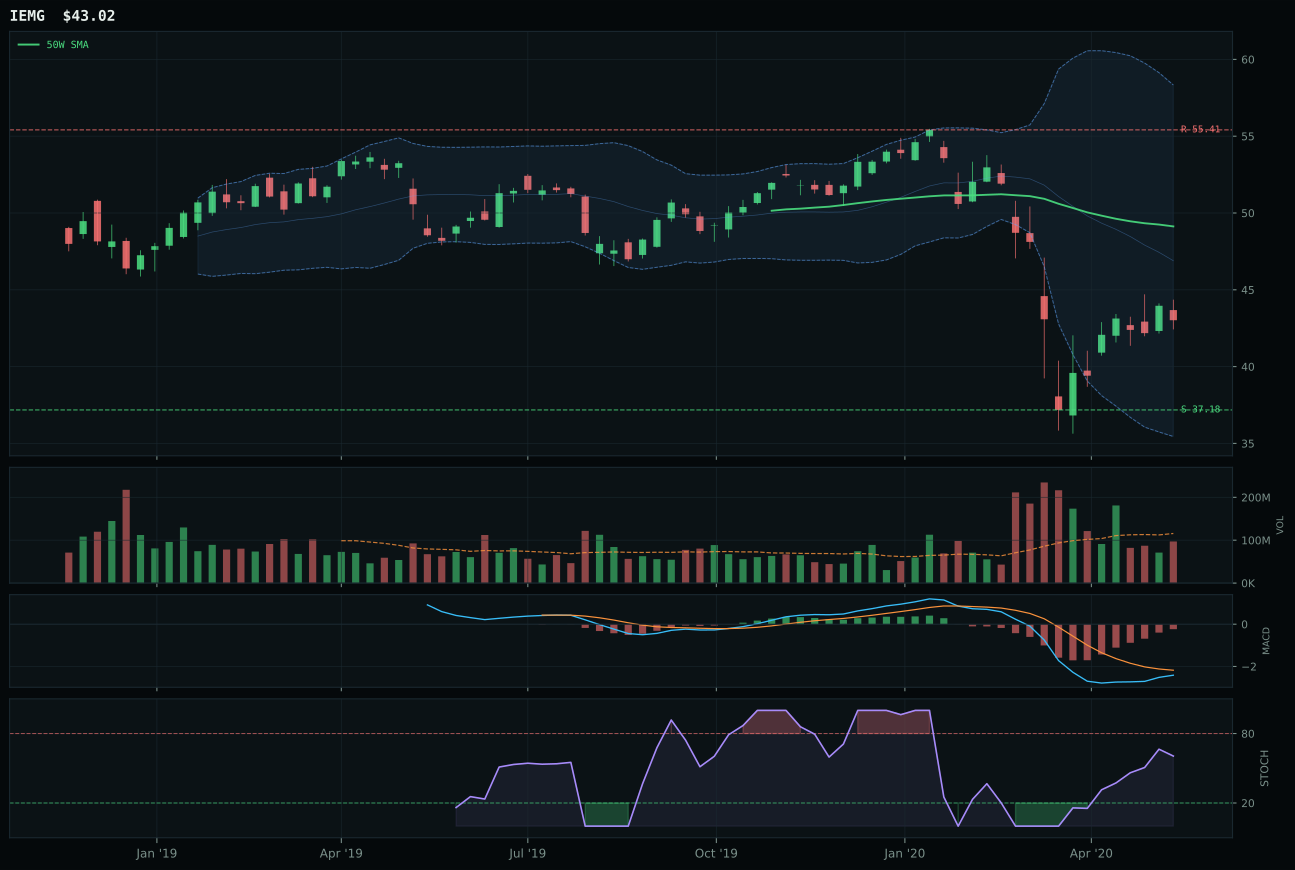
IEMG has a neutral structure profile with -3.6% 13-week relative strength versus SPY.
Extension and support failure are the main tactical risks.
Tracked, but not top-2 eligible because: structurally broken.
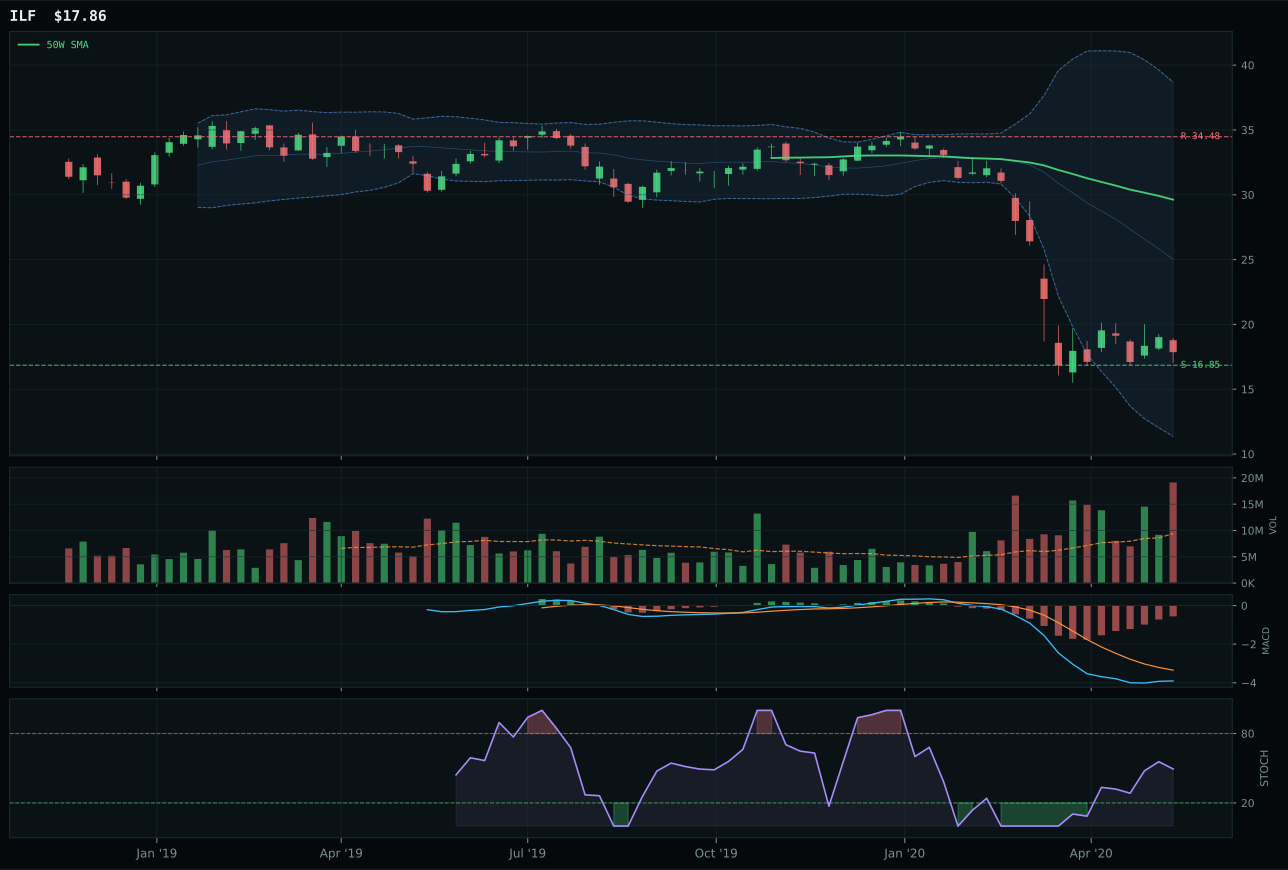
ILF has a neutral structure profile with -29.1% 13-week relative strength versus SPY.
Extension and support failure are the main tactical risks.
Tracked, but not top-2 eligible because: structurally broken.
IEMG won with 42.0 technical evidence by outscoring INDA (28.8) on momentum confirmation (39.3 vs 11) and capturing 7.2% category-relative strength where INDA registered 0.0%. Both charts sat in deep retracement value zones at Fib 0.618 with bearish-improving MACD and rising stochastic RSI, but IEMG's higher volume participation (44 vs 29 on the volume-price composite) and broader breadth translated into more credible accumulation. The 13W return of -18.8% for IEMG versus -26.0% for INDA proved the broad emerging-market proxy was outperforming the India-specific bet, and category-relative strength confirmed that within the EM basket, capital was rotating to the diversified play. Neither scored above 42 on technical evidence, reflecting how broken this category remains, but IEMG's momentum confirmation edge and volume sponsorship sealed the representative slot.
Emerging Markets scores 24.6 and merits 0% allocation, ranking 10th overall and outside the portfolio entirely. The category failed eligibility (eligible: False), eliminating IEMG from top-2 consideration despite moderate macro support. While EM liquidity support is active (+14), liquidity expansion (+8), and risk appetite positivity (+8) provide narrative tailwinds, the technical setup refuses to cooperate: trend scores in the low 30s, momentum confirmation near zero, and price trapped in the deep Fib 0.618 retracement zone signal that EM fund flows have dried up. The macro fit of 69.0 is misleading—it reflects policy and narrative support, not market technicals. Structure scores around 32 indicate unclean, choppy recovery attempts rather than accumulation bases. To earn allocation, Emerging Markets would need price above the 50W with volume confirmation, improving momentum confirmation above 50, and either category-relative strength leadership or SPY outperformance. Current state shows the opposite: underperformance, broken structure, and thin participation. Wait for EM currency and bond flows to stabilize before reconsidering; this is a second-derivative recovery play, not a core position.
Industrial Metals — PICK
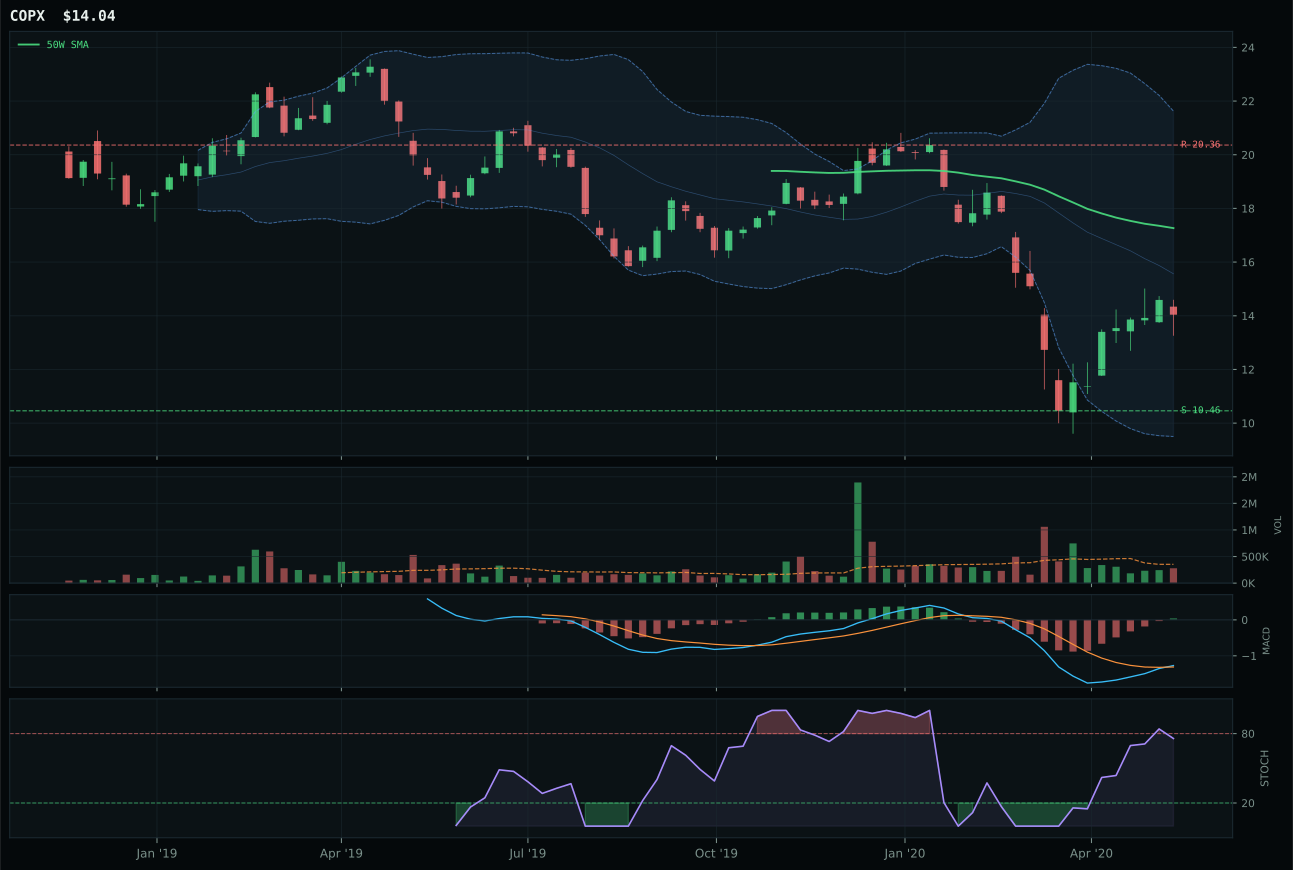
COPX has a neutral structure profile with -9.3% 13-week relative strength versus SPY.
Extension and support failure are the main tactical risks.
Tracked, but not top-2 eligible because: structurally broken.
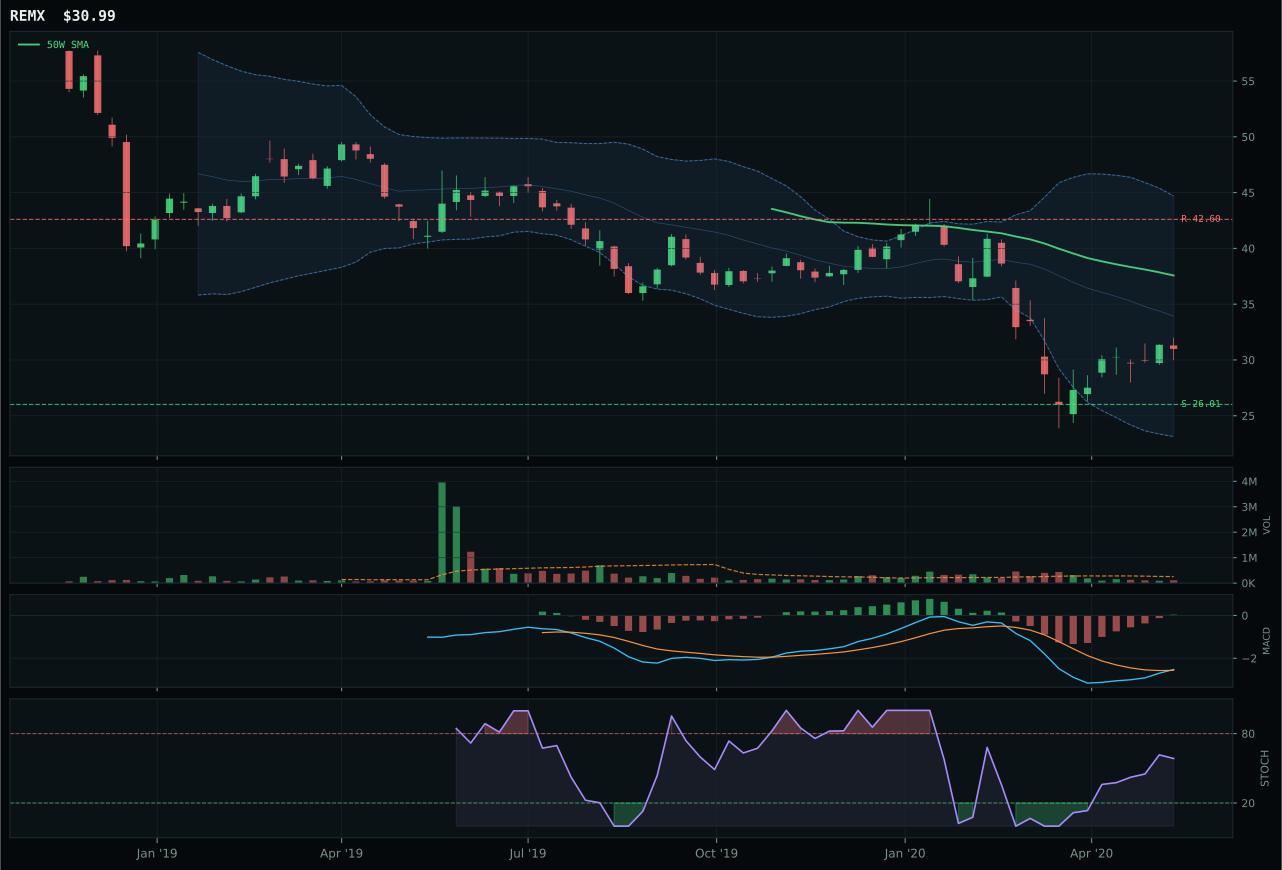
REMX has a neutral structure profile with -9.0% 13-week relative strength versus SPY.
Extension and support failure are the main tactical risks.
Tracked, but not top-2 eligible because: structurally broken.
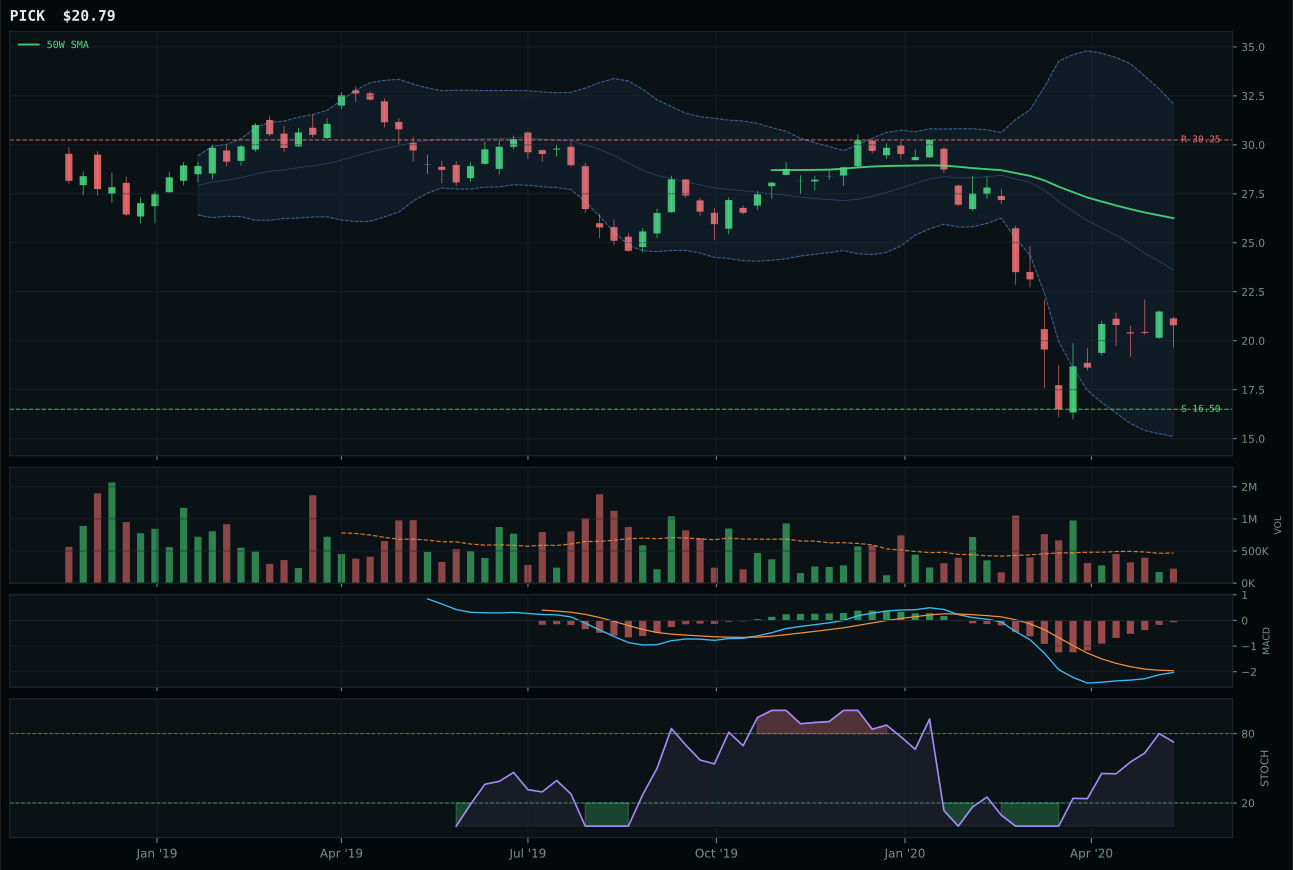
PICK has a neutral structure profile with -10.1% 13-week relative strength versus SPY.
Extension and support failure are the main tactical risks.
Tracked, but not top-2 eligible because: structurally broken.
PICK won a 15.4 score category by narrowly beating COPX (structurally broken) and REMX despite sharing identical risk/reward (51.6 vs 54.0 vs 56.0). The victory was technical survival, not execution: PICK's trend (23.0) was weaker than COPX (31) and REMX (32), but its MACD bearish-but-improving at least matched the narrative of deep value recovery initiation. Stochastic RSI rising mid-zone at 0.73 provided the one chart signal of stabilization, and timing at 63.0 was standard for this deep-retracement zone near Fib 0.618. The real problem is volume: PICK at 0.48x average and COPX at neutral both suffered from thin participation, meaning any move is fragile. Category-relative strength of -0.8% confirmed no internal leadership. This is not a category decision; it is a least-bad triage in a basket where all three are technically broken and macro headwinds are active.
Industrial Metals ranks 9th with a 15.4 score and 0% allocation because the category failed eligibility filters entirely—the representative (PICK) is structurally broken, and the category-level macro fit of only 49.0 provides no narrative support. Credit stress (-7) punishes industrial demand, while Goldilocks (+6) fails to compensate in a regime favoring defensive and monetary hedges over cyclical production. Volume-price confirmation (15.4) signals zero institutional sponsorship, and persistence (26.0) confirms the technical setup lacks self-sustaining momentum. Industrial Metals competes directly with Precious Metals for macro tailwinds, and Precious Metals wins decisively: gold hedges volatility and compresses real yields, while copper depends on cyclical demand recovery. To earn a 10% slot, Industrial Metals would need either a macro pivot toward reflation (disinflation pressure flipping positive) or a chart reversal above the 200W with volume confirmation into above-average participation. Neither is present. This category remains on the sidelines until a structural recovery forms—watch for MACD bullish reversal combined with price above the 50W and volume surge.