
2020-05-08
Informational purposes only. The content in this report, including allocations, analysis, and commentary, is provided solely for informational and educational purposes. It does not constitute financial advice, investment advice, trading advice, or any other type of advice. Past performance does not guarantee future results. Always conduct your own research and consult a qualified financial professional before making investment decisions.
Some tracked tickers were excluded due to missing live weekly price data: SGOV: Historical cache SGOV has only 0 usable weekly bars; URNM: Historical cache URNM has only 23 usable weekly bars
Weekly Allocation
| Ticker | Category | Weight | Role |
|---|---|---|---|
| IGV | Technology | 20% | Top-2 (20%) |
| BOTZ | AI | 20% | Top-2 (20%) |
| GLD | Precious Metals | 10% | Tier-2 (10%) |
| FCG | Traditional Energy | 10% | Tier-2 (10%) |
| URA | Nuclear Energy | 10% | Tier-2 (10%) |
| IGF | Utilities & Infrastructure | 10% | Tier-2 (10%) |
| INDA | Emerging Markets | 10% | Tier-2 (10%) |
| XAR | Defense & Aerospace | 10% | Tier-2 (10%) |
Trade Instructions — Monday Open
Sell the tranche from 2020-04-10 (completing its 4-week hold). Buy the new tranche. Instructions show net portfolio changes — same-asset positions cancel, weight changes show the delta.
| Action | Ticker | Instruction |
|---|---|---|
| SELL | GLD | Sell 33% of GLD position (reduce 30.00% → 20.00%) |
| SELL | GDX | Sell 33% of GDX position (reduce 7.50% → 5.00%) |
| SELL | CIBR | Sell 33% of CIBR position (reduce 7.50% → 5.00%) |
| SELL | SMH | Sell 25% of SMH position (reduce 5.00% → 3.75%) |
| SELL | XLU | Sell 25% of XLU position (reduce 5.00% → 3.75%) |
| BUY | URA | Buy URA — 7.14% of freed cash (adds 1.25% to portfolio) |
| BUY | FCG | Buy FCG — 7.14% of freed cash (adds 1.25% to portfolio) |
| BUY | XAR | Buy XAR — 7.14% of freed cash (adds 1.25% to portfolio) |
| BUY | INDA | Buy INDA — 7.14% of freed cash (adds 1.25% to portfolio) |
| BUY | IGV | Buy IGV — 28.57% of freed cash (adds 5.00% to portfolio) |
| BUY | BOTZ | Buy BOTZ — 28.57% of freed cash (adds 5.00% to portfolio) |
| BUY | IGF | Buy IGF — 14.29% of freed cash (adds 2.50% to portfolio) |
Current Portfolio After Trade
Combined holdings across all 4 active tranches. Each tranche is 25% of the portfolio.
| Ticker | % of Portfolio | Weight Bar |
|---|---|---|
| GLD | 20.00% | |
| IGV | 10.00% | |
| BOTZ | 10.00% | |
| URA | 8.75% | |
| INDA | 8.75% | |
| FCG | 6.25% | |
| ITA | 6.25% | |
| GDX | 5.00% | |
| CIBR | 5.00% | |
| IGF | 5.00% | |
| SMH | 3.75% | |
| XLU | 3.75% | |
| XLE | 2.50% | |
| XLK | 2.50% | |
| XAR | 2.50% |
Macro Regime — Risk-On Liquidity Expansion
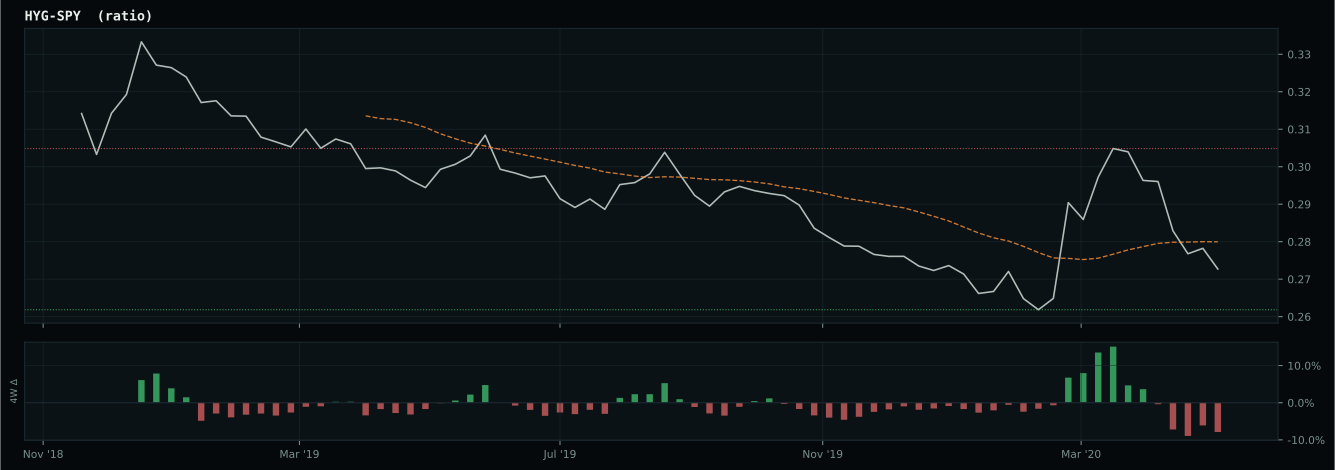
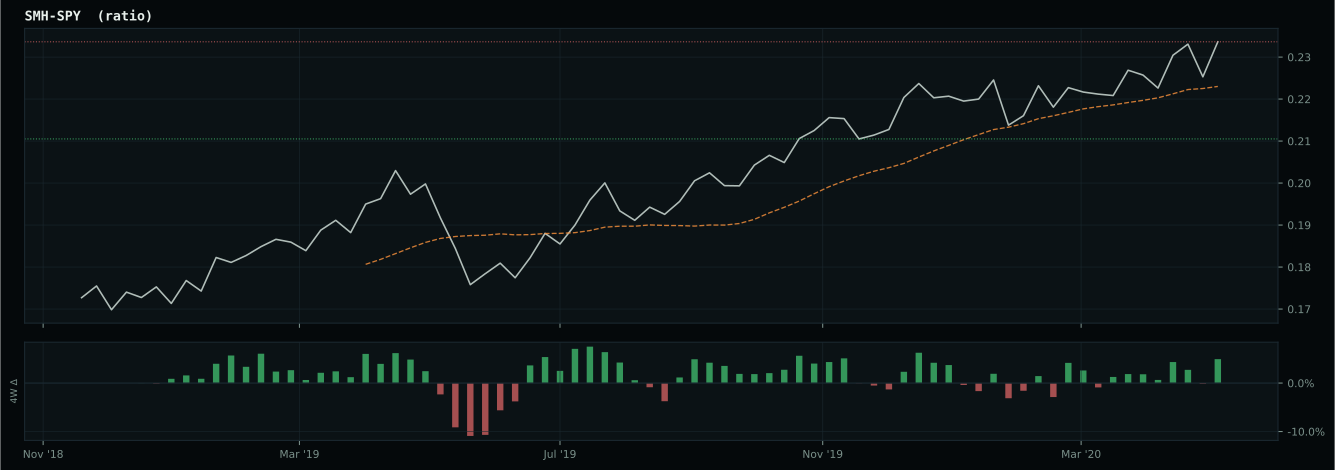
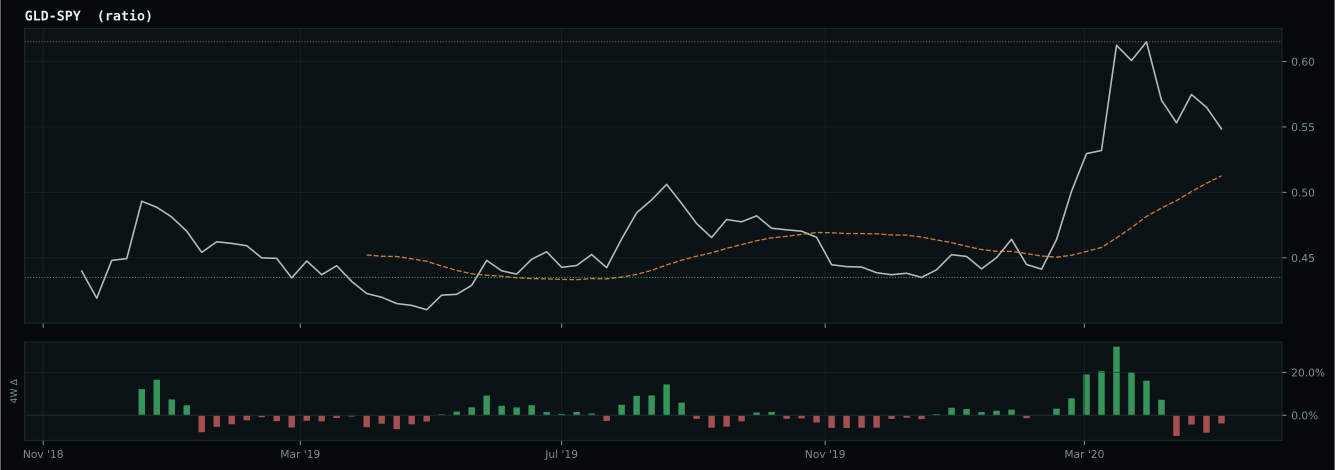
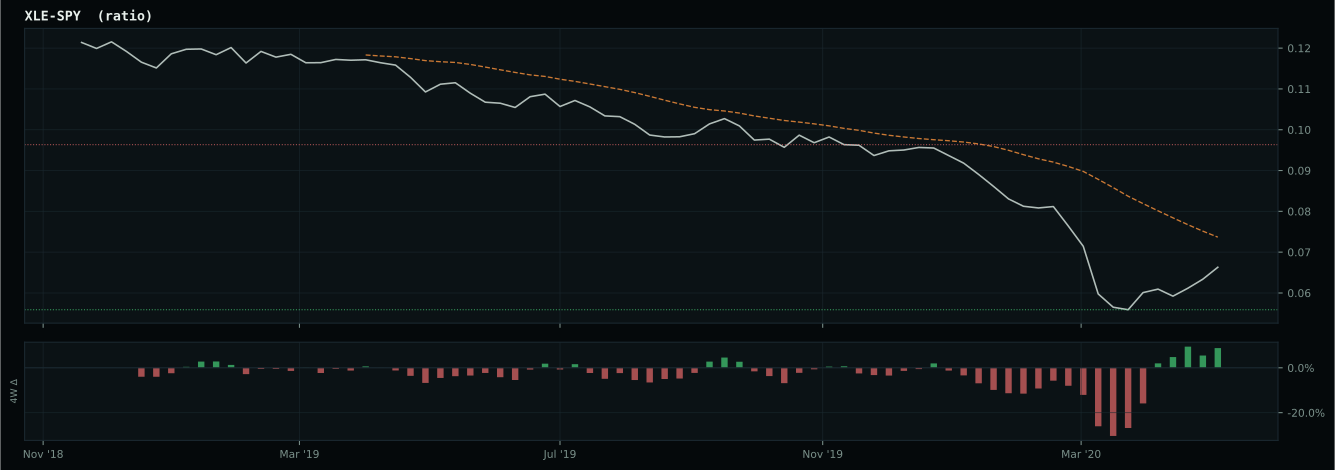
Macro Evidence Charts
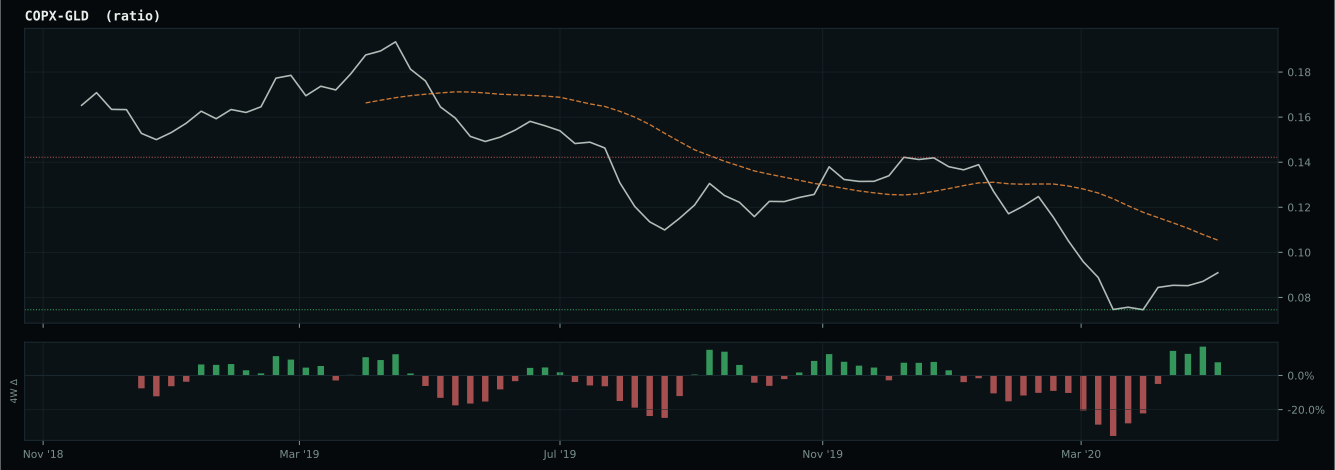
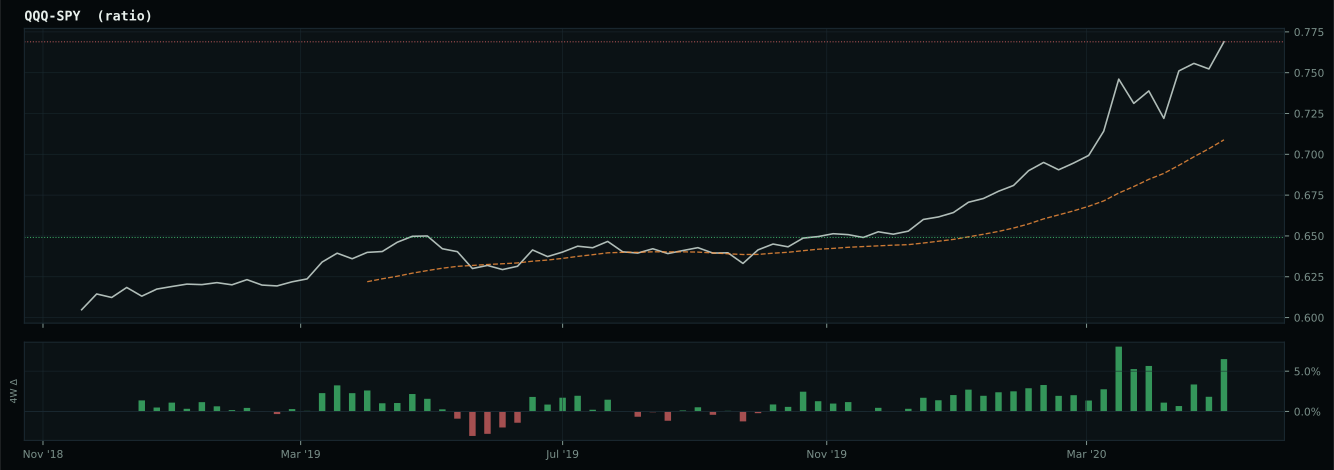
Market-implied signals behind the macro regime scores. Each ratio compares two assets; the direction and slope of the ratio is what the macro engine reads.
Crypto Regime — NoCrypto
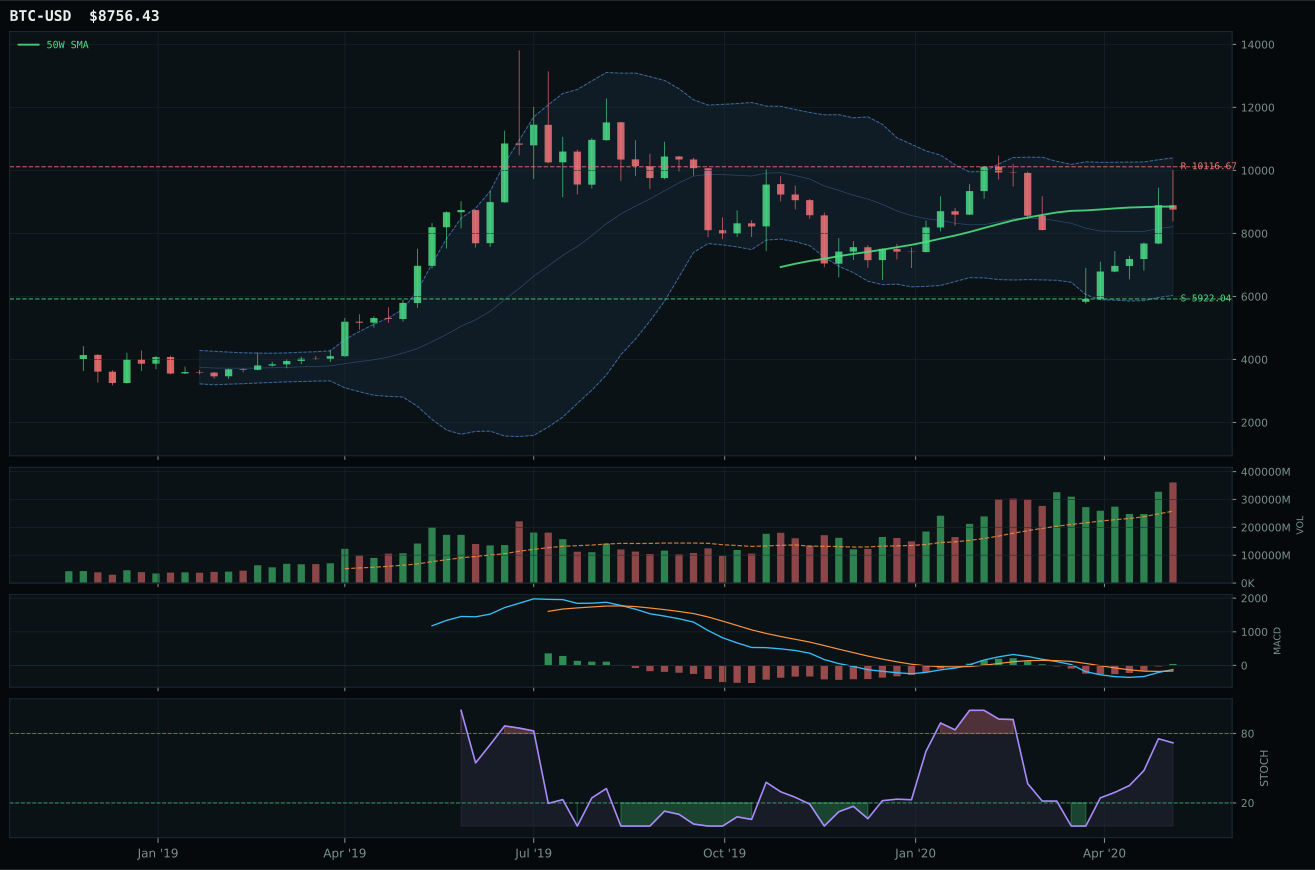
ValueBTC armed by first 200W buy-zone touch, but post-touch range age is 8 weeks; minimum is 12
TrendBTC not confirmed
one or more available conditions failed

Category Rankings
| Rank | Category | Winner | Score | Alloc | 4W Ret | Peers (4W) |
|---|---|---|---|---|---|---|
| 1 | Technology | IGV | 86.8 | 20% | +6.29% | CIBR +9.2% · XLK +7.5% |
| 2 | AI | BOTZ | 69.0 | 20% | +13.47% | SMH +13.3% · AIQ +8.7% |
| 3 | Precious Metals | GLD | 58.4 | 10% | -0.90% | GDX -6.7% · SLV +12.8% |
| 4 | Nuclear Energy | URA | 33.7 | 10% | +2.73% | NLR +10.1% |
| 5 | Utilities & Infrastructure | IGF | 33.0 | 10% | +16.66% | XLU +10.0% · PAVE +23.1% |
| 6 | Emerging Markets | INDA | 28.2 | 10% | +10.45% | IEMG +11.6% · ILF +30.1% |
| 7 | Defense & Aerospace | XAR | 24.2 | 10% | +24.98% | ROKT +25.3% · ITA +29.8% |
| 8 | Industrial Metals | PICK | 12.8 | 10% | +24.88% | COPX +21.7% · REMX +23.5% |
| 9 | Agriculture & Livestock | MOO | 3.5 | 0% | +16.23% | VEGI +15.1% · WEAT -0.7% |
| 10 | Traditional Energy | FCG | — | 0% | +31.29% | XOP +27.6% · XLE +20.6% |
Technology — IGV
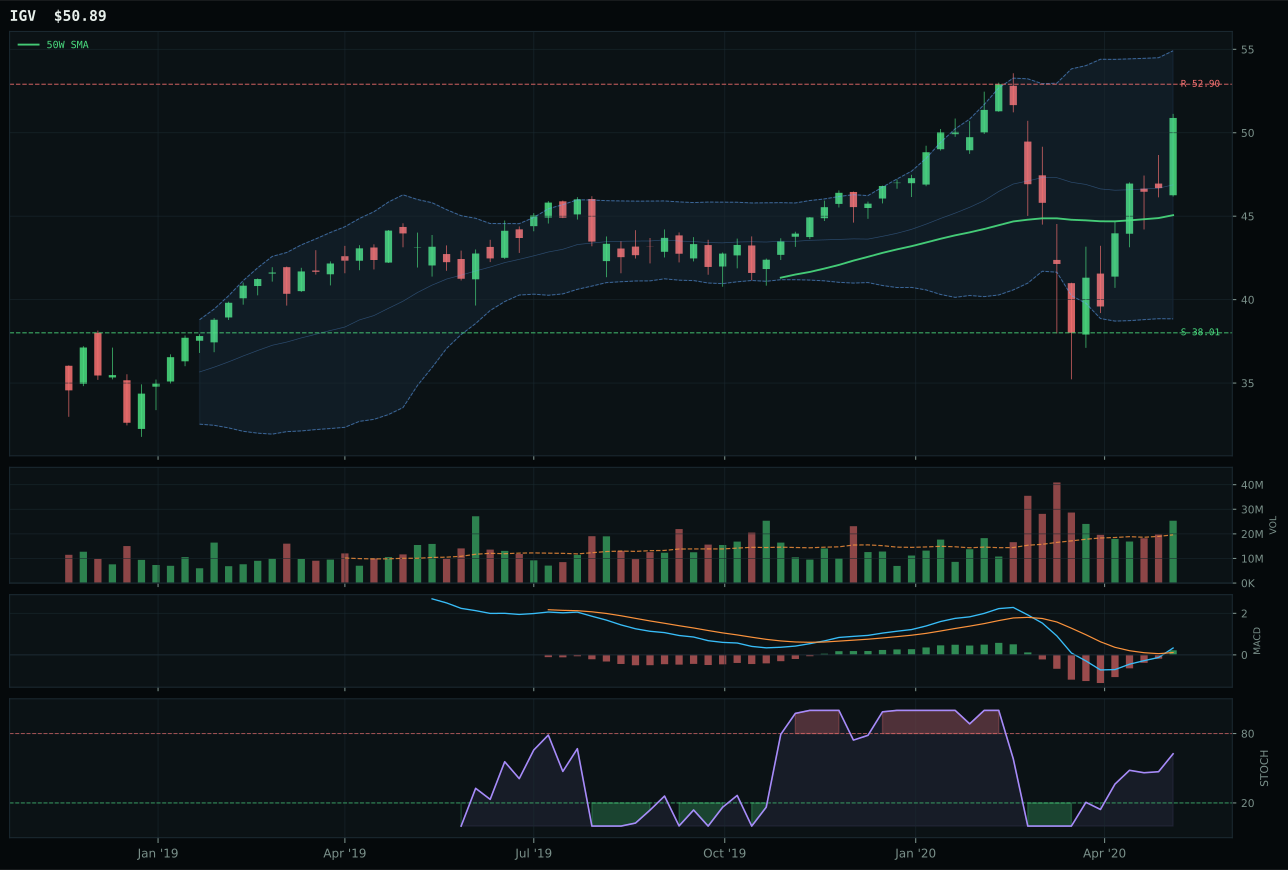
IGV has a neutral structure profile with 11.0% 13-week relative strength versus SPY.
A failed hold above support would weaken the setup.
Actionable but governed by invalidation levels.
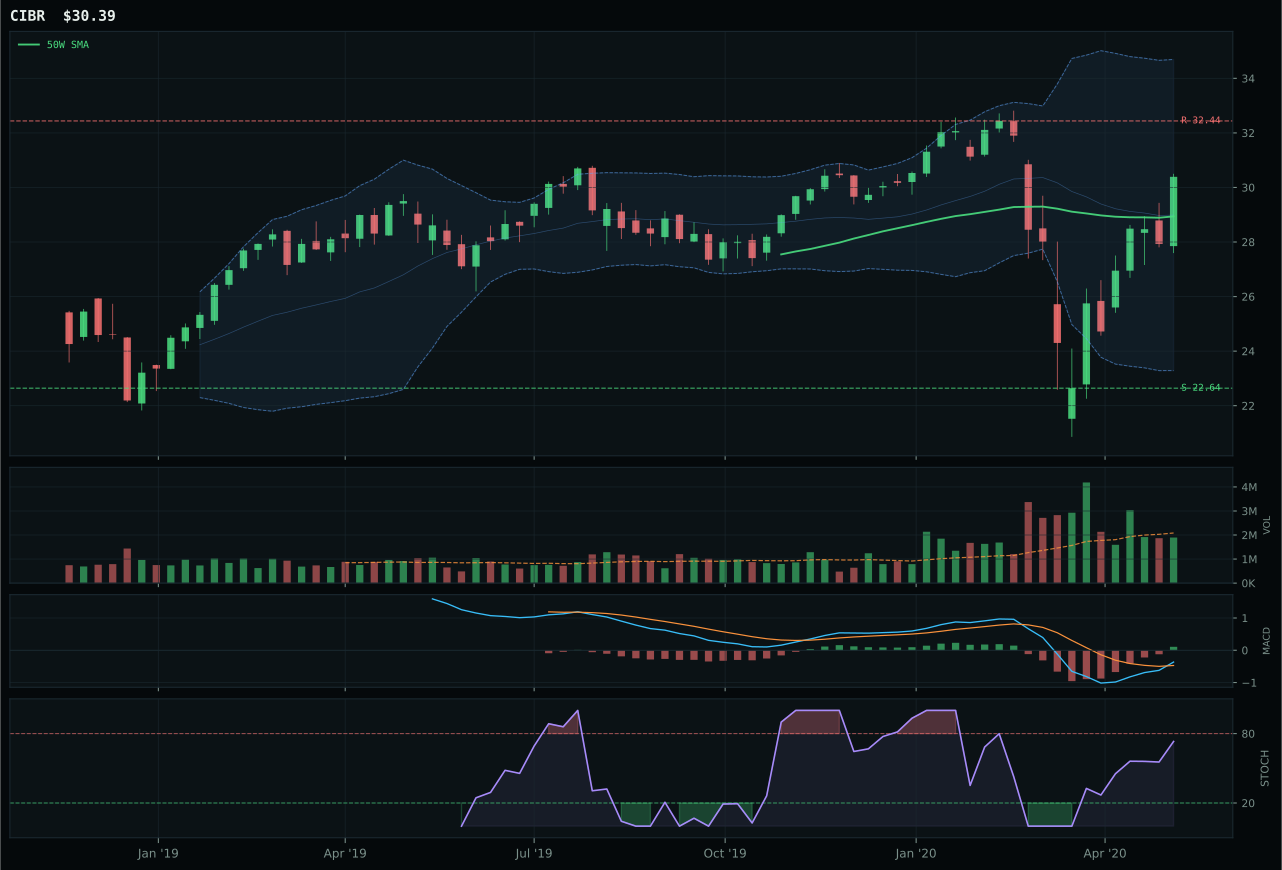
CIBR has a neutral structure profile with 6.6% 13-week relative strength versus SPY.
A failed hold above support would weaken the setup.
Actionable but governed by invalidation levels.
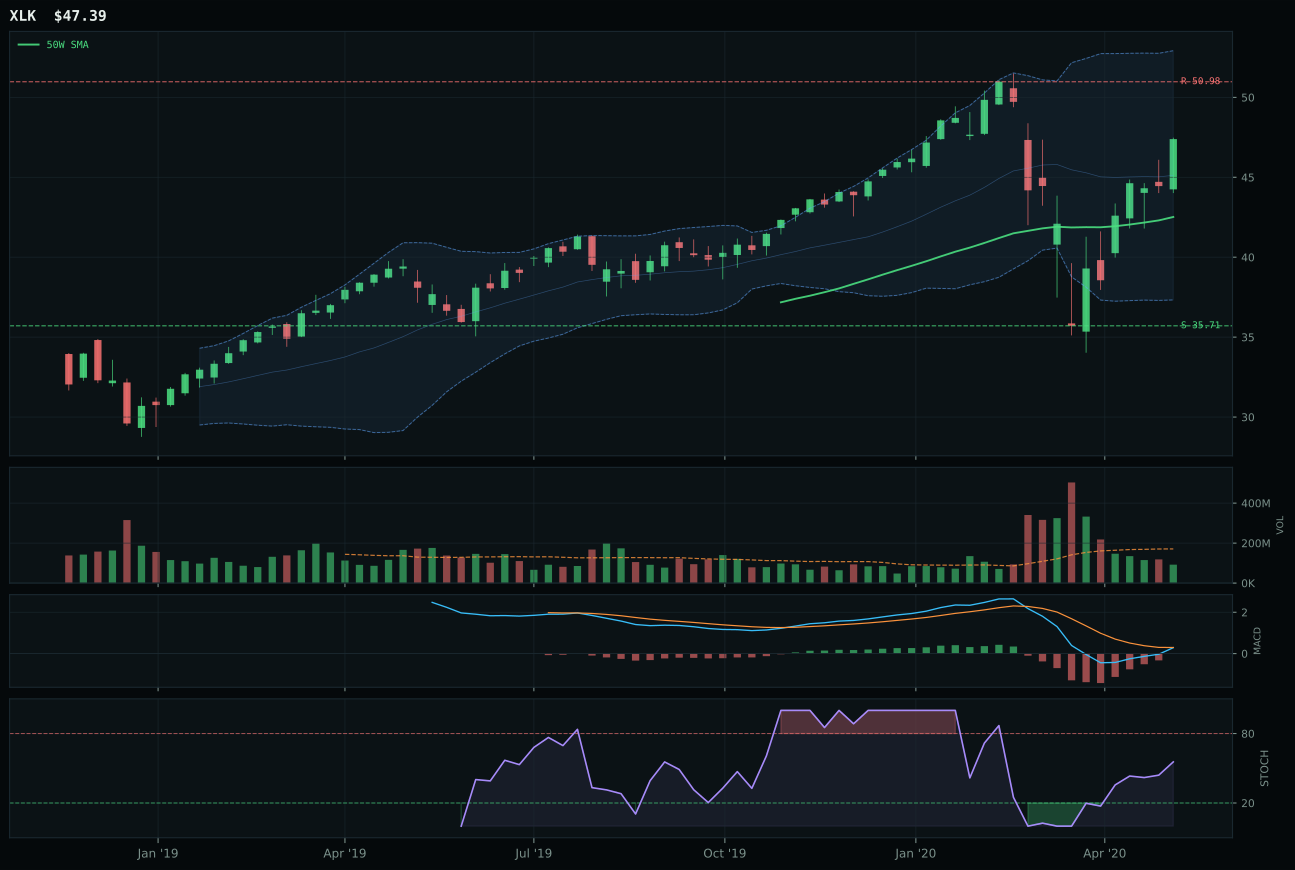
XLK has a neutral structure profile with 7.0% 13-week relative strength versus SPY.
A failed hold above support would weaken the setup.
Actionable but governed by invalidation levels.
IGV claimed the category by posting 11.0% relative strength versus SPY while maintaining price above both the 50-week and 200-week moving averages with a neutral structure and above-average volume participation at 1.29x the 20-week average. The 4-week return of 15.7% paired with MACD bullish and improving confirmed that new money was accumulating into the setup rather than chasing a stale bounce. CIBR lost ground with only 6.6% SPY-relative strength and weaker volume confirmation at neutral levels, trailing IGV by 2.1 points in the final composite score despite matching the same trend framework. The setup remains neutral rather than extended—price sits just 12.9% above the 50-week at the upper Fibonacci retracement zone—which means the risk-reward profile at 32.0/100 reflects the reality that upside to resistance is now limited to 3.8% while the category still commands capital allocation weight.
Technology earned its 20% top-2 slot because the Risk-On Liquidity Expansion regime directly sponsors growth equities, and the category's macro fit scored 91.0/100 with active tailwinds from liquidity expansion, risk appetite, and AI growth sponsorship offsetting the credit stress headwind. The technical composite of 86.8 reflects a 3/2/1 weighted basket that heavily favors IGV's 89.2 technical proof, and the category's breadth, MACD confirmation, and volume-price sponsorship remain clean enough to justify committing capital at the portfolio's second-highest weight. This is not a stretched momentum trade—the 13-week return is negative 0.9% even as the 4-week shows strength, telling the story of a coil that just began its unwind. Without the liquidity expansion and risk appetite descriptors working in tandem, this category would rank much lower, but the macro fit is too strong to ignore given the current state.
AI — BOTZ
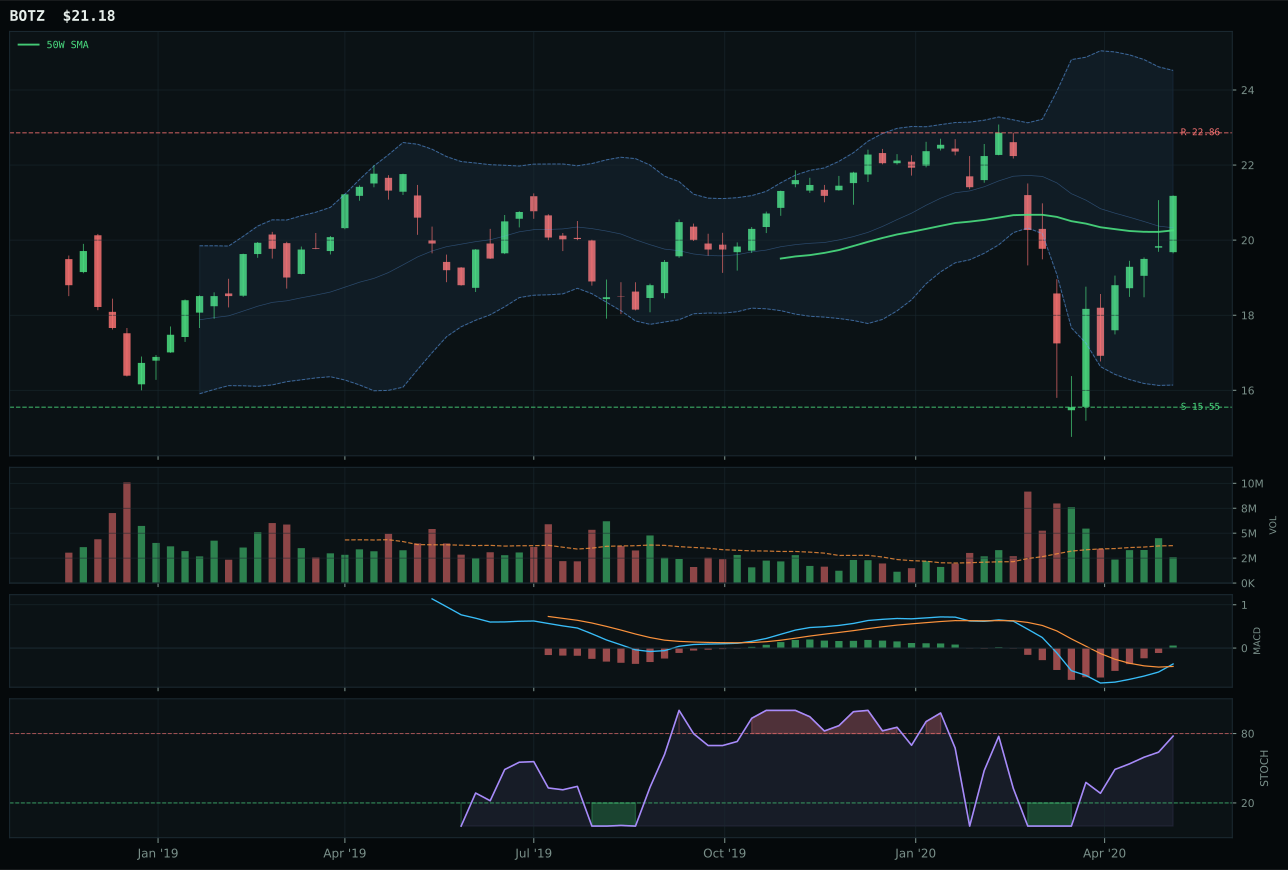
BOTZ has a neutral structure profile with 7.2% 13-week relative strength versus SPY.
A failed hold above support would weaken the setup.
Actionable but governed by invalidation levels.
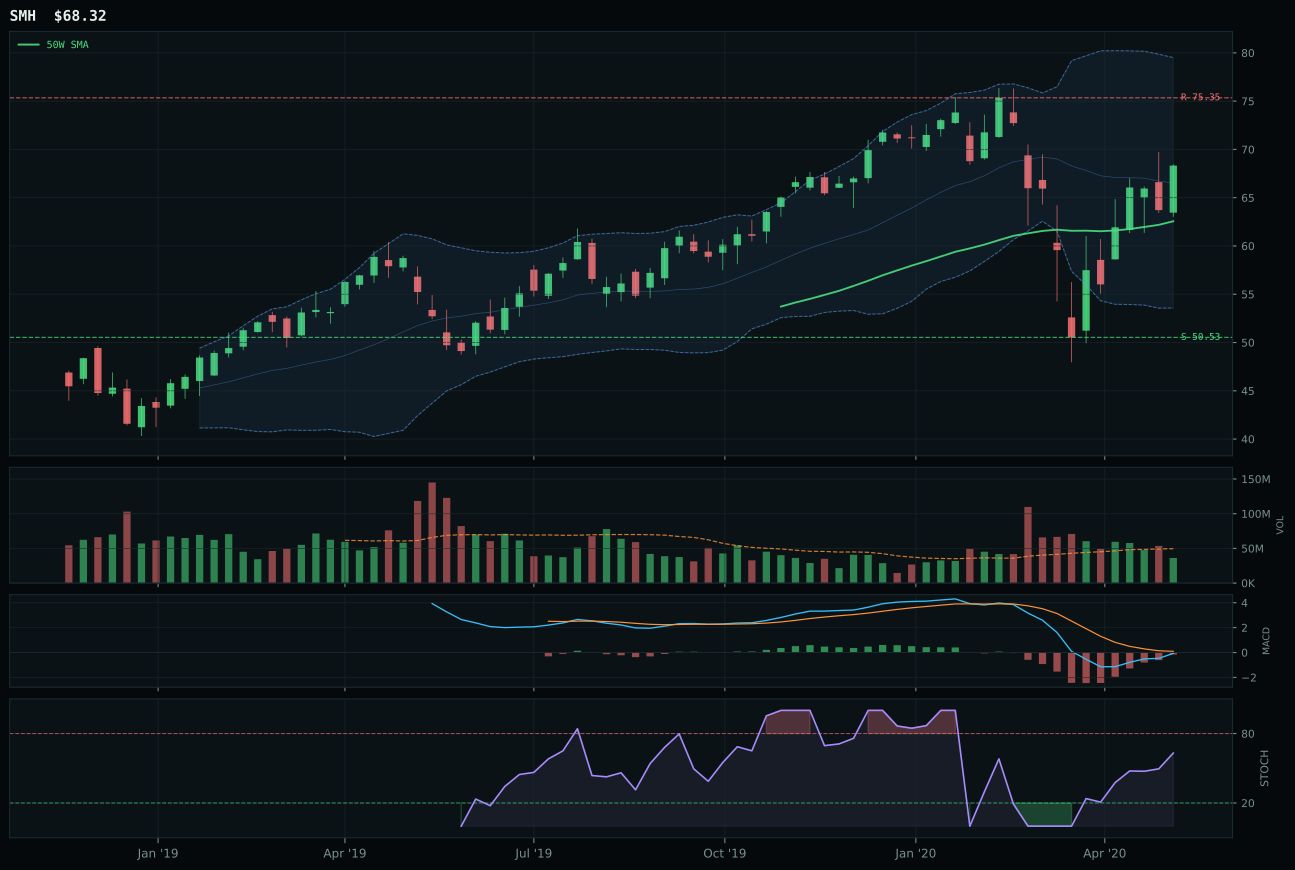
SMH has a neutral structure profile with 7.2% 13-week relative strength versus SPY.
A failed hold above support would weaken the setup.
Actionable but governed by invalidation levels.
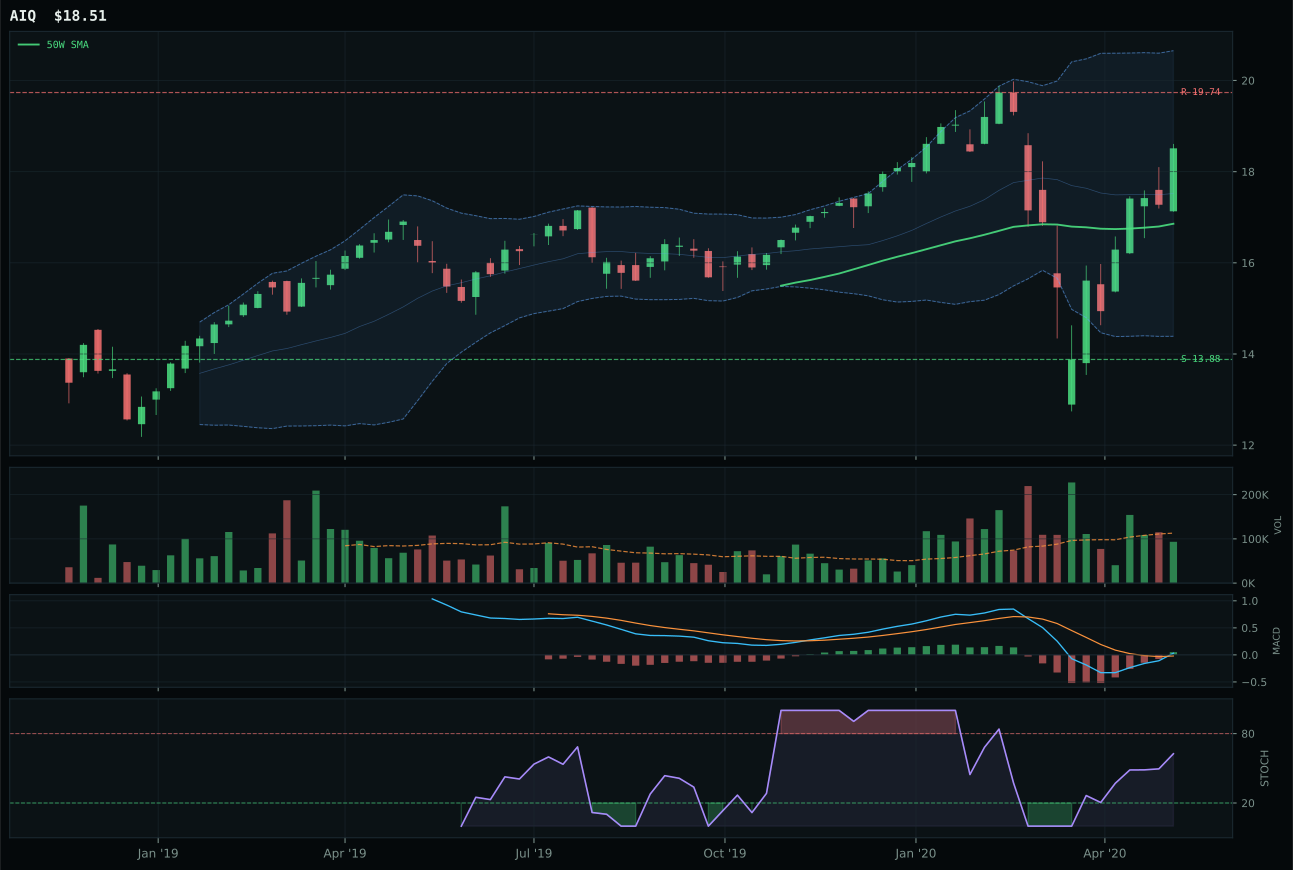
AIQ has a neutral structure profile with 8.4% 13-week relative strength versus SPY.
A failed hold above support would weaken the setup.
Tracked, but not top-2 eligible because: .
BOTZ won by scoring 98.0 on timing—the highest of any representative ETF across all categories this week—because price sits just 4.5% above its 50-week support while MACD remains bullish and improving and stochastic RSI rose into the mid-zone, creating a setup where support is credible and breakout risk is asymmetric. The 7.2% SPY-relative strength and category-neutral 0.0% relative standing within its three-ETF basket gave no advantage on paper, but the momentum confirmation of 87.7 and rising stochastic at 0.78 separated it from SMH, which carries bearish MACD despite improving—a technical contradiction that cost SMH 15.0 points on timing alone. The 1.3-point victory gap is tight enough to matter, revealing that in AI, the quality of the pullback and support structure trumps absolute momentum breadth when macro is uncertain.
AI earned its matching 20% allocation because it tied Technology on the category-level macro fit assessment at 90.0/100, and the AI growth sponsorship descriptor registered at +14, the highest single macro boost across all categories this week. However, the technical composite is 72.8 for BOTZ versus IGV's 89.2, and the momentum confirmation score of 87.7 trails IGV's perfect 100.0, reflecting the reality that this category is more dependent on macro narrative than on clean technical sponsorship. The allocation weight is justified not by superior risk-adjusted setup but by the fact that both Technology and AI are riding the same regime wave, and the portfolio cannot concentrate all growth exposure into one bucket. Without the AI sponsorship descriptor and the broader liquidity expansion framework, this category's 69.0 final score would place it outside the top tier, making it a macro-driven allocation rather than a technical conviction call.
Precious Metals — GLD
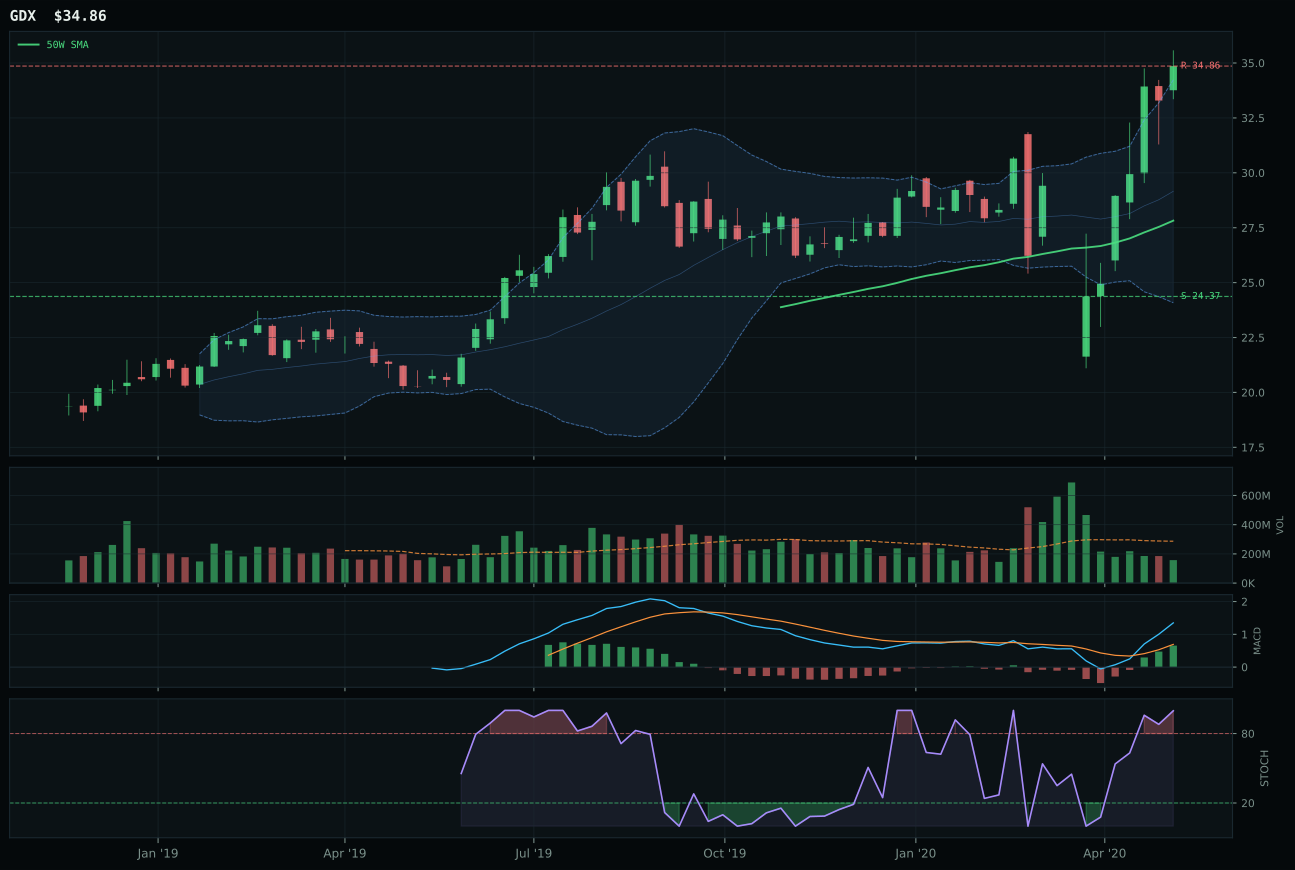
GDX has a vertical extension profile with 36.8% 13-week relative strength versus SPY.
A failed hold above support would weaken the setup.
Actionable but governed by invalidation levels.
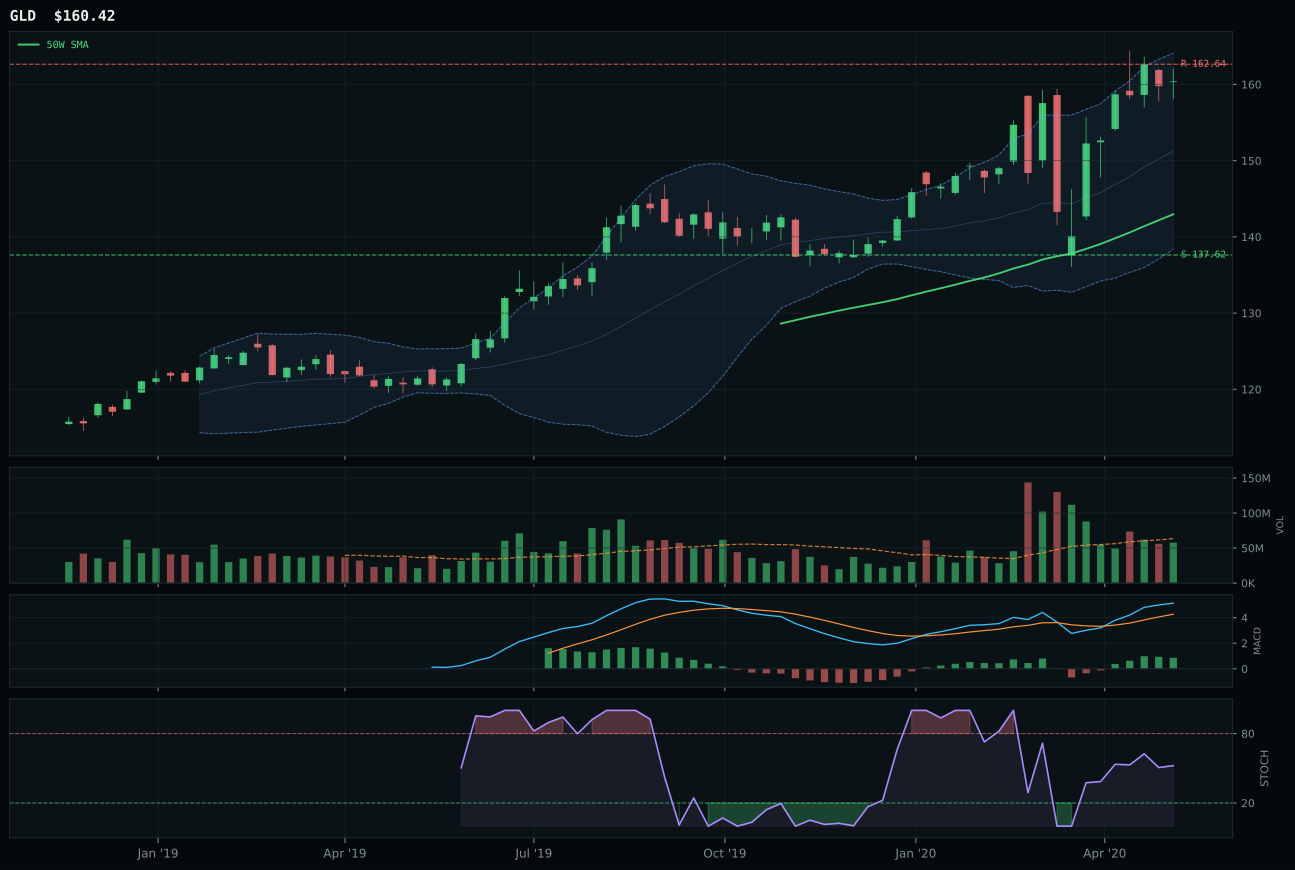
GLD has a neutral structure profile with 20.5% 13-week relative strength versus SPY.
A failed hold above support would weaken the setup.
Actionable but governed by invalidation levels.
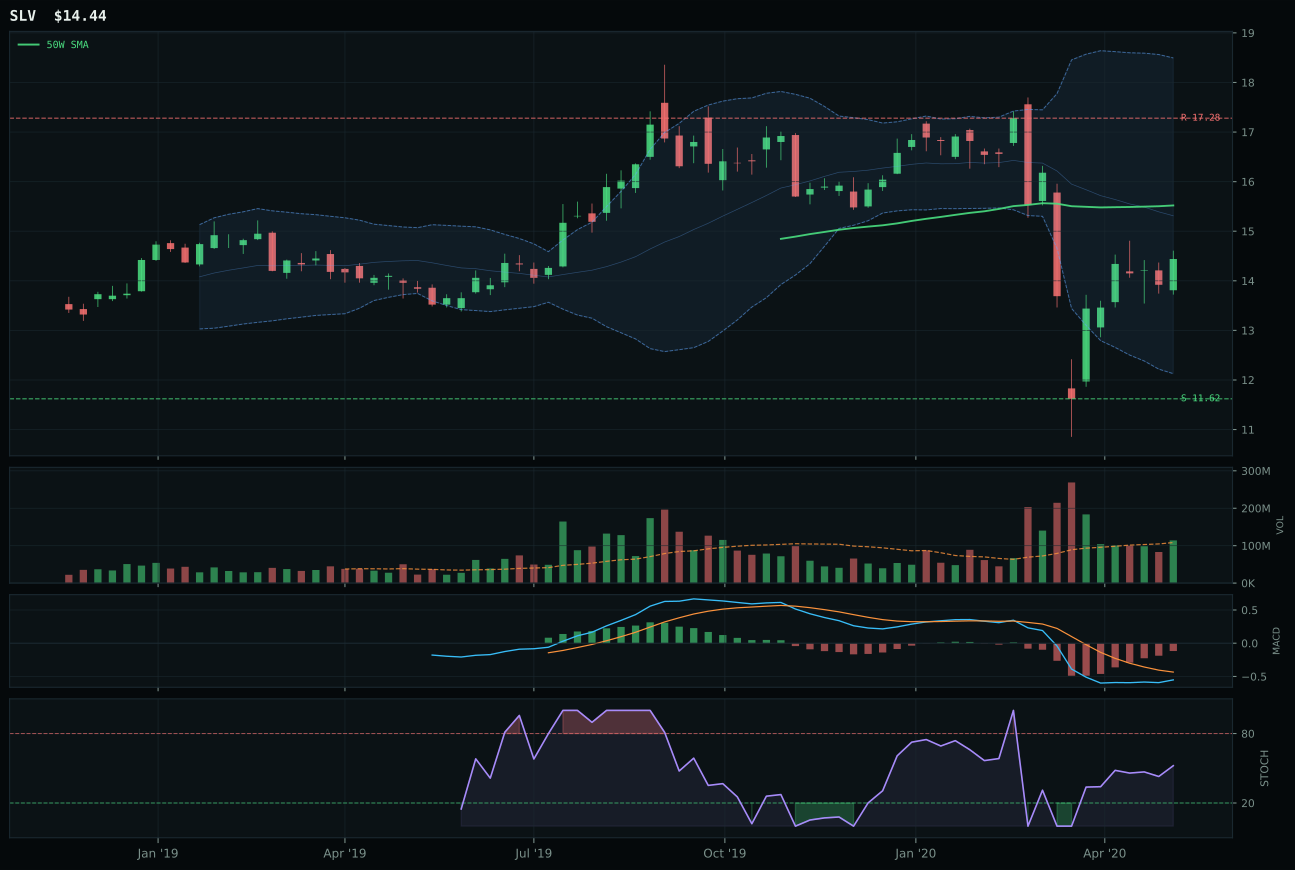
SLV has a neutral structure profile with -0.7% 13-week relative strength versus SPY.
Extension and support failure are the main tactical risks.
Tracked, but not top-2 eligible because: structurally broken.
GLD dominates with a perfect 100.0 trend score and matching 100.0 momentum confirmation because price remains above both the 50-week and 200-week averages while posting 8.5% 13-week return and 20.5% SPY-relative strength—the highest cross-SPY beat in the entire portfolio. The MACD bullish-and-improving signal combined with 0.91x volume at neutral levels (not thin, not forced) created clean accumulation rather than speculative buying, evident in the 78.5 volume-price confirmation score. GDX lost 21.8 points despite carrying identical 100.0 momentum confirmation because its vertical extension setup stretched 26.9% above the 50-week while stochastic RSI overbought and timing scored only 37.0 against GLD's 67.0—a 30-point timing penalty that correctly penalizes how far GDX has run relative to support. The risk-reward of 38.5 for GLD reflects realistic recognition that upside to resistance is minimal at 1.4%, but the persistence score of 75.5 proves the move has held rather than rolled over.
Precious Metals earned 10% allocation because GLD's technical excellence of 85.7 combined with macro fit of 74.0 to produce category-level score of 58.4, making it the strongest non-top-2 category in the portfolio. The monetary hedge bid descriptor registered at +14—the second-highest single macro boost after AI sponsorship—capturing the reality that real rate compression and credit stress are active even within a risk-on regime, creating a bifurcated market where equity-safe growth leads while monetary insurance bids understate. Risk appetite active registers at -4 for this category, correctly showing that some of gold's strength is defensive in nature, but the disinflation pressure at +8 and defensive rotation at +6 ensure the category remains relevant. GLD is not an alternative to equities but a compliment to them: the clean trend, MACD confirmation, and SPY-relative leadership prove that gold is being accumulated as macro insurance, not as capitulation, making the 10% weight a rational hedge against the credit stress and disinflation descriptors that remain active despite the risk-on headline.
Nuclear Energy — URA
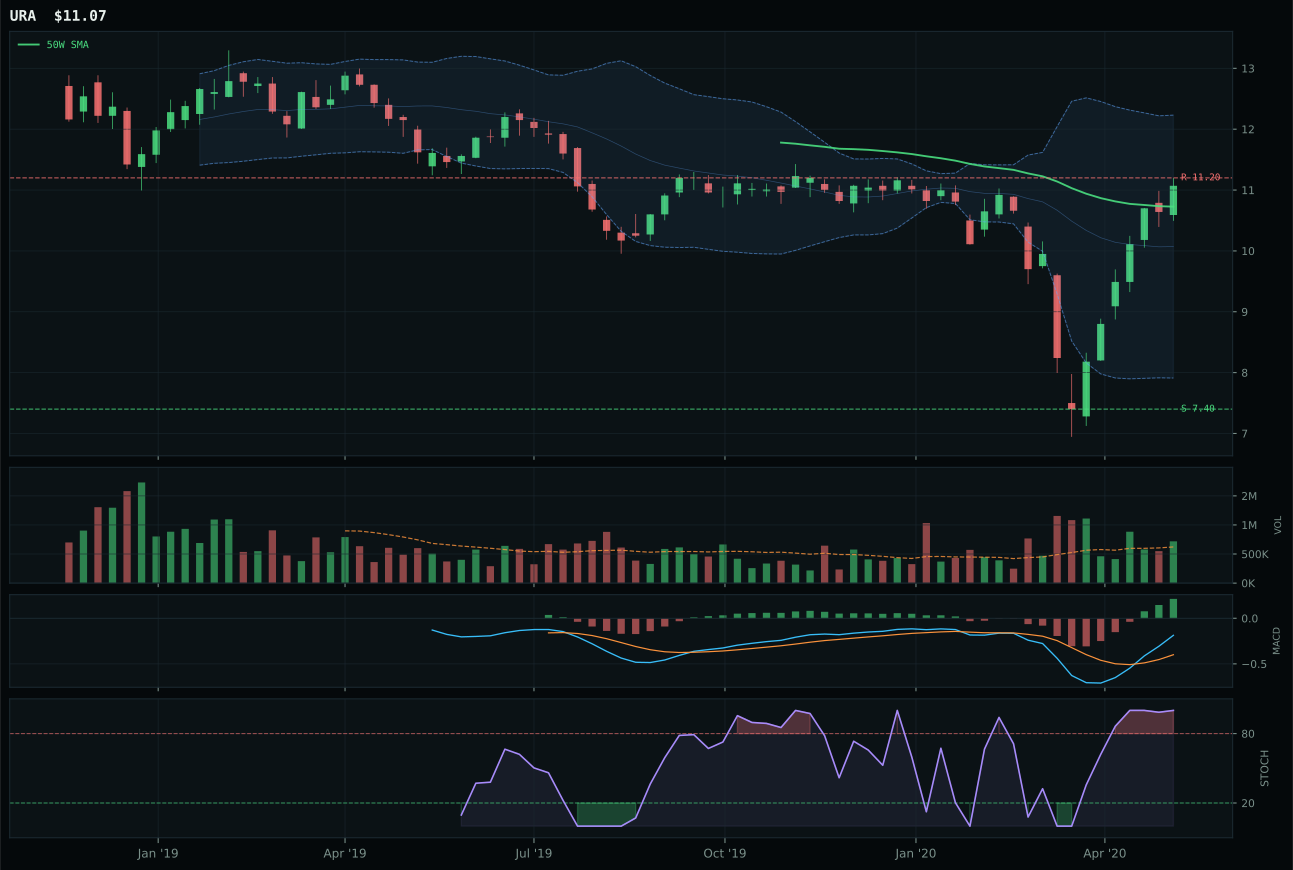
URA has a neutral structure profile with 15.9% 13-week relative strength versus SPY.
A failed hold above support would weaken the setup.
Tracked, but not top-2 eligible because: .
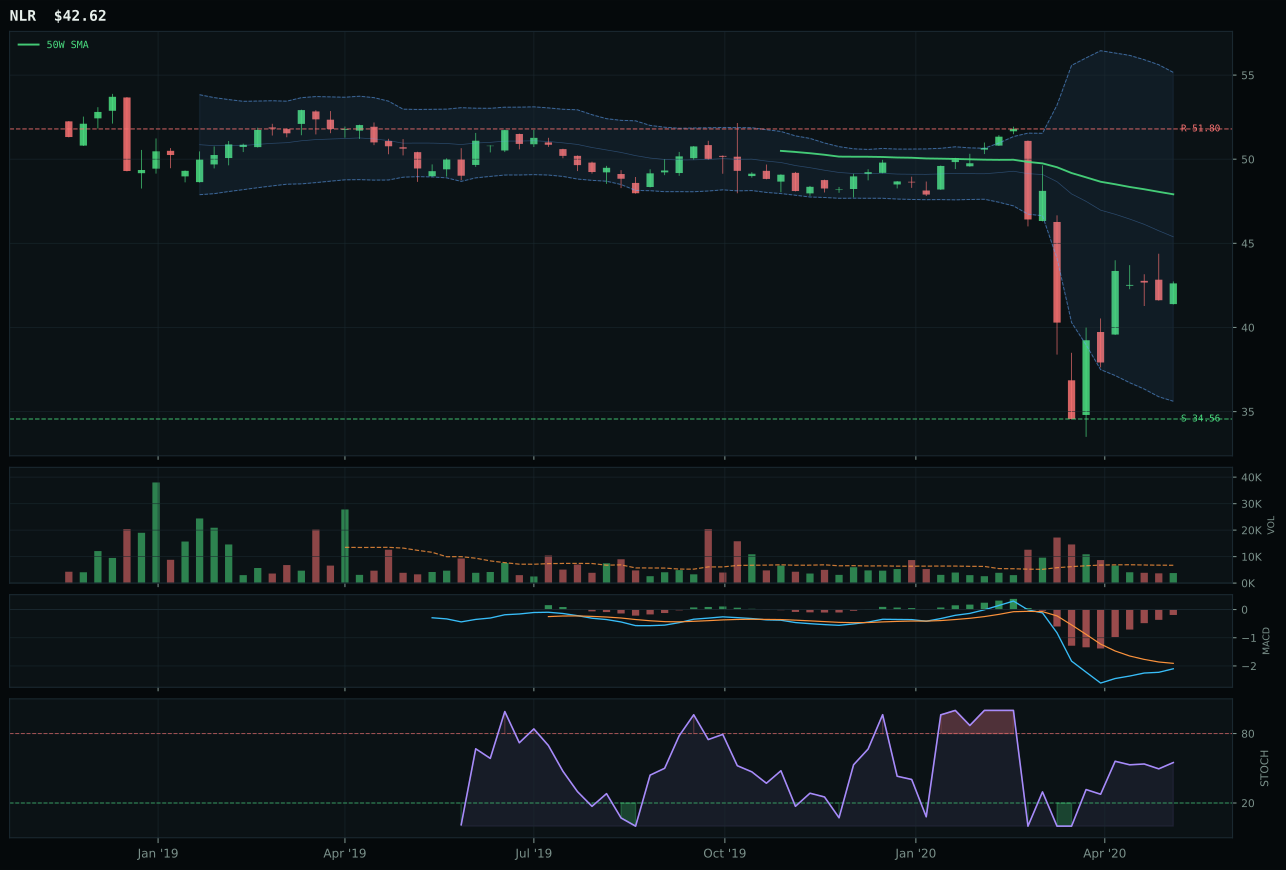
NLR has a neutral structure profile with -3.9% 13-week relative strength versus SPY.
Extension and support failure are the main tactical risks.
Tracked, but not top-2 eligible because: structurally broken.
URA claimed the category with a 90.0 timing score—third-highest across all ETF representatives—by trading just 3.2% above the 50-week support while posting positive 3.9% 13-week return and 15.9% SPY-relative strength, creating a coil where upside to resistance at 1.2% is minimal but downside to support at 49.6% offers genuine safety margin. The 100.0 momentum confirmation came from 16.6% four-week return paired with 9.9% category-relative strength and above-average volume at 1.15x, proving accumulation rather than short squeeze. NLR lost despite neutral macro fit because its bearish MACD, falling stochastic, thin volume, and negative 3.9% SPY-relative weakness created structure too broken for top-2 eligibility. The 53.5-point gap reflected that URA represents genuine technical sponsorship while NLR is defensive rotation without accumulation—a critical distinction in a regime where buyers are selective.
Nuclear Energy earned 10% allocation because URA's technical evidence of 45.0/100 combined with category macro fit of 55.0/100 produced a 33.7 score that, while not top-2 eligible, justified defensive positioning as an AI growth beneficiary and clean-energy thematic play. The macro fit benefited from AI sponsorship at +5 and Risk-On Liquidity Expansion at +5, with credit stress penalizing at -5, creating a net-positive environment for a thematic exposure. However, the ineligibility flag (eligible: False) and above-average distance from support signal that this is a trend-following position rather than a mean-reversion opportunity, best understood as riding the clean energy and AI demand narrative rather than exploiting technical dislocation. URA's above-average volume participation at 1.15x and clean momentum confirmation suggest institutional money is migrating into the thematic, making the 10% weight a macro-driven bet on the durability of the energy transition sponsorship rather than a technical setup with high conviction.
Utilities & Infrastructure — IGF
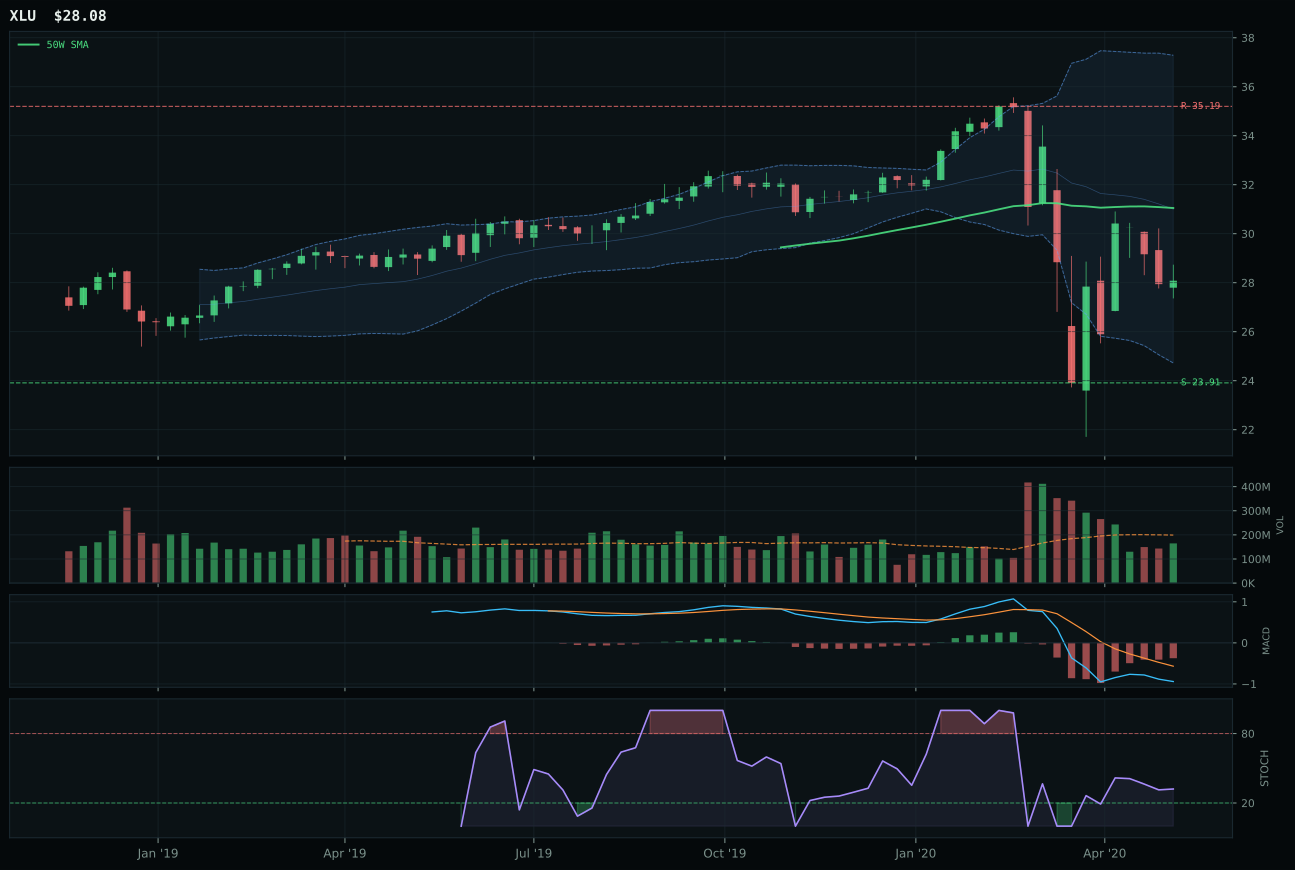
XLU has a neutral structure profile with -6.2% 13-week relative strength versus SPY.
A failed hold above support would weaken the setup.
Actionable but governed by invalidation levels.
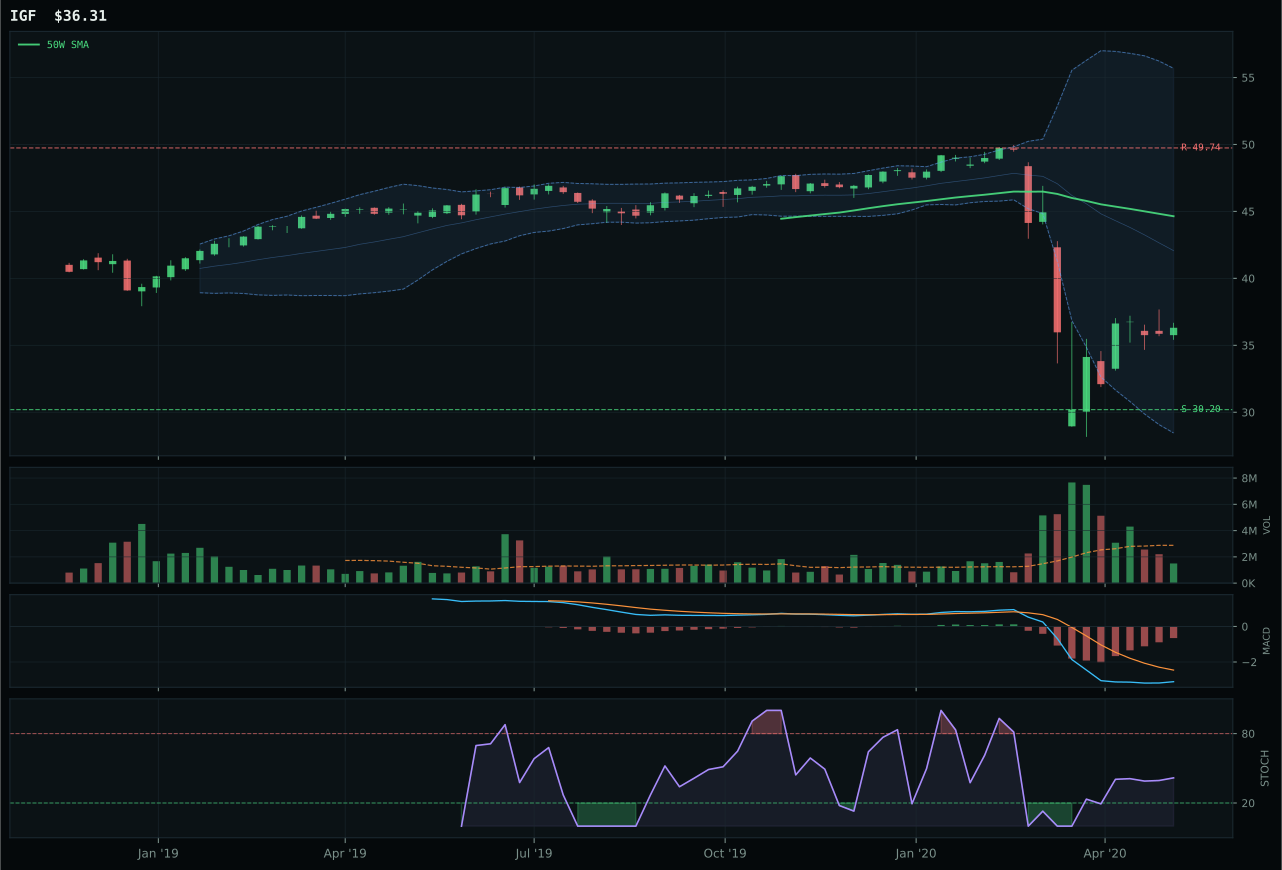
IGF has a neutral structure profile with -13.9% 13-week relative strength versus SPY.
A failed hold above support would weaken the setup.
Actionable but governed by invalidation levels.
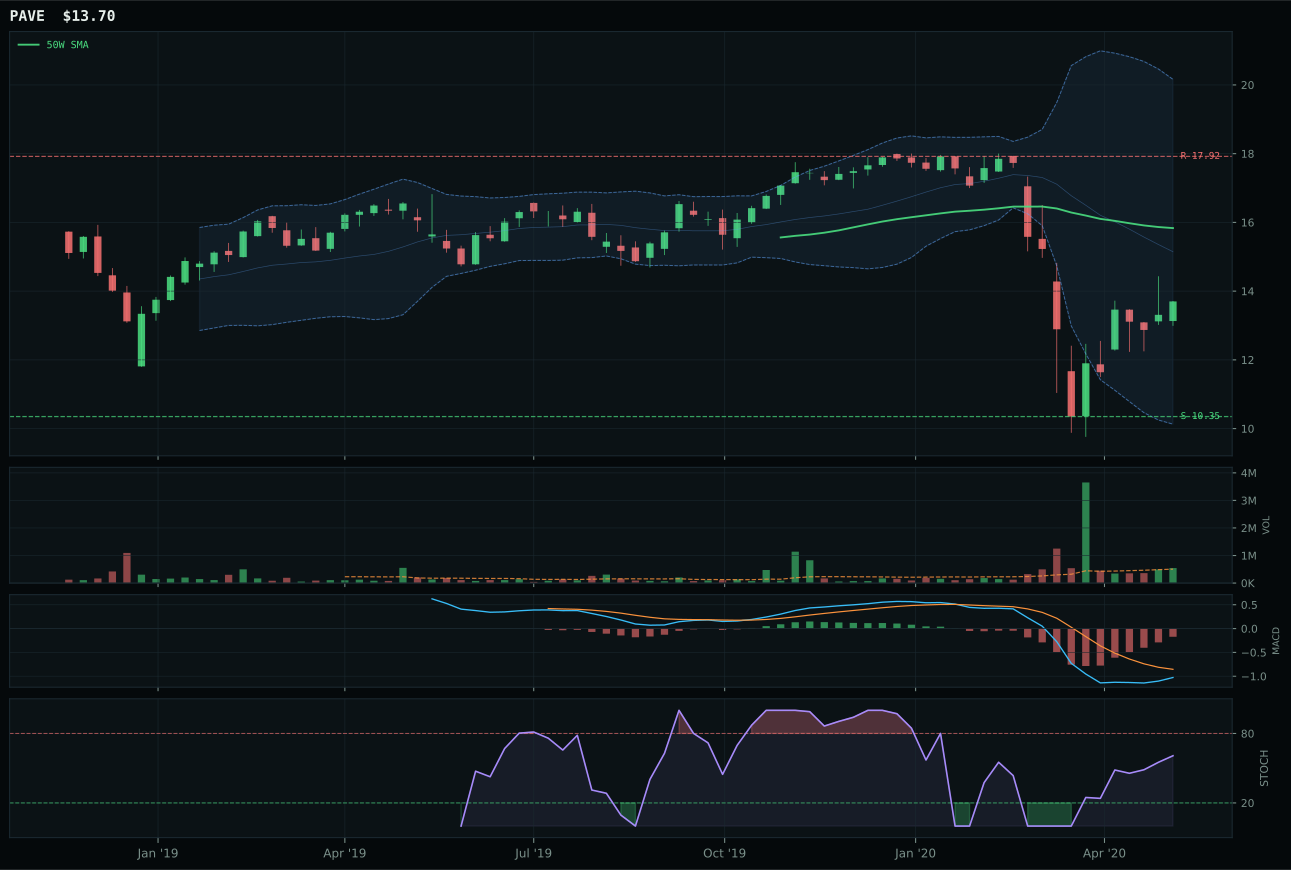
PAVE has a neutral structure profile with -10.1% 13-week relative strength versus SPY.
A failed hold above support would weaken the setup.
Tracked, but not top-2 eligible because: .
IGF won by carrying superior risk-reward of 62.0 and cleaner structure at 62.8 compared to XLU's 58.9 and 58.4, despite both posting negative 25.9% and negative 18.1% 13-week returns within a defensive rotation setup that should theoretically favor the regulated utility benchmark. XLU carries neutral 0.91x volume and falling stochastic RSI at 0.42, creating a setup that is technically less crisp despite XLU's superior macro fit at 69.0 driven by defensive rotation at +12 and disinflation at +6. IGF's thin 0.52x volume and rising stochastic at 0.42 created the only differentiation in a category where both are underwater, with IGF's 12.2 volume-price confirmation and 23.4 persistence reflecting worse sponsorship but cleaner structural integrity at the technical level.
Utilities & Infrastructure retained 10% allocation with a 33.0 category score and ineligibility flag because the macro fit of 70.0 strongly favored defensive rotation at +12 and disinflation pressure at +6, making this category a natural repository for capital fleeing from risk-on growth if sentiment shifted. IGF's poor technical evidence of only 6.4/100 makes clear this is not a conviction allocation but rather a defensive sleeve positioned to benefit if the macro regime turns from liquidity expansion toward fiscal contraction and rate pressure. The portfolio is overweight growth (IGV and BOTZ at 20% each) and requires defensive ballast; Utilities & Infrastructure provides that through a sector that typically offers yield and downside protection once recession narratives gain traction. The negative 25.9% 13-week drawdown in IGF and zero momentum confirmation signal acute near-term pain, but the 20.2% downside to support at 30.20 and the macro alignment with defensive rotation create asymmetric payoff structure if the regime changes—justifying the 10% hedge position despite weak technicals.
Emerging Markets — INDA
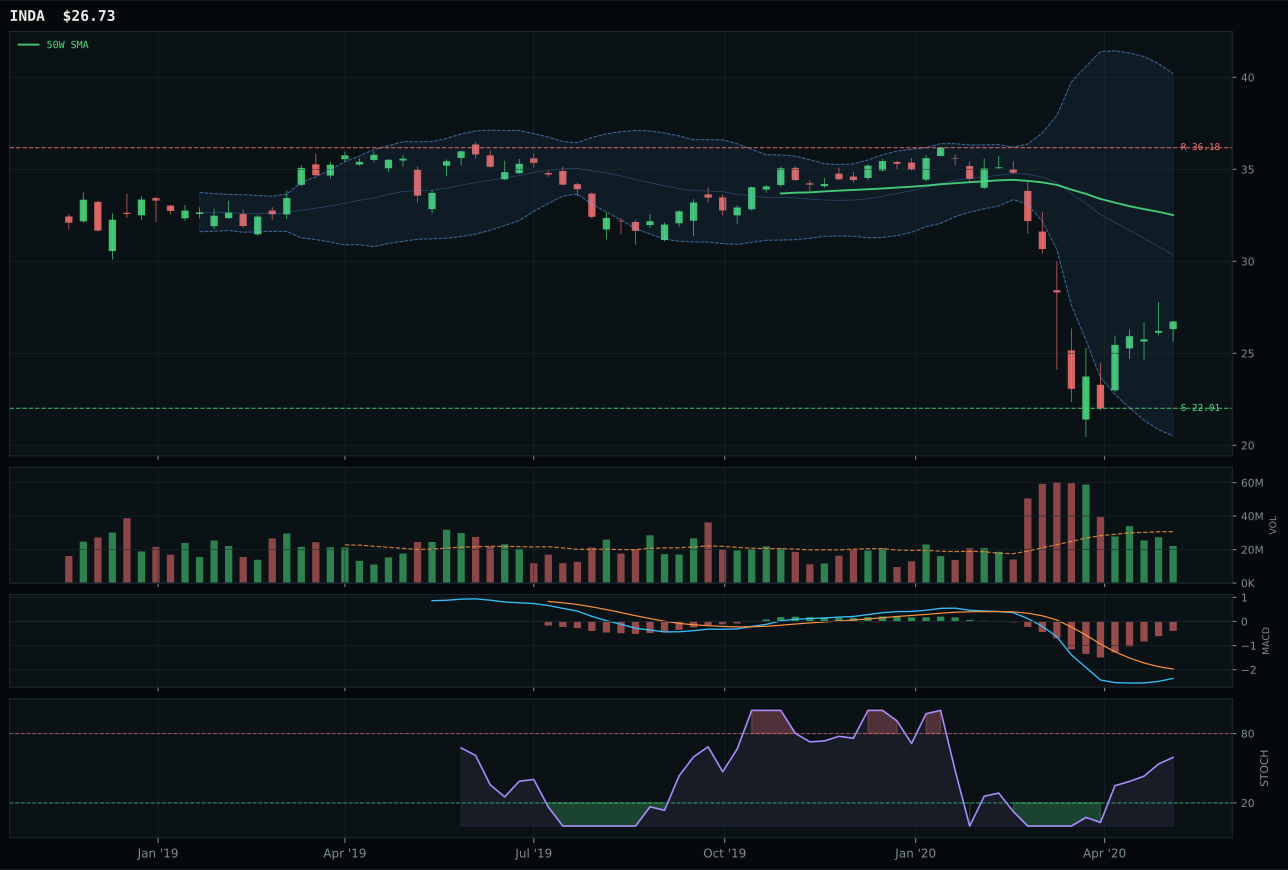
INDA has a neutral structure profile with -11.8% 13-week relative strength versus SPY.
Extension and support failure are the main tactical risks.
Tracked, but not top-2 eligible because: structurally broken.
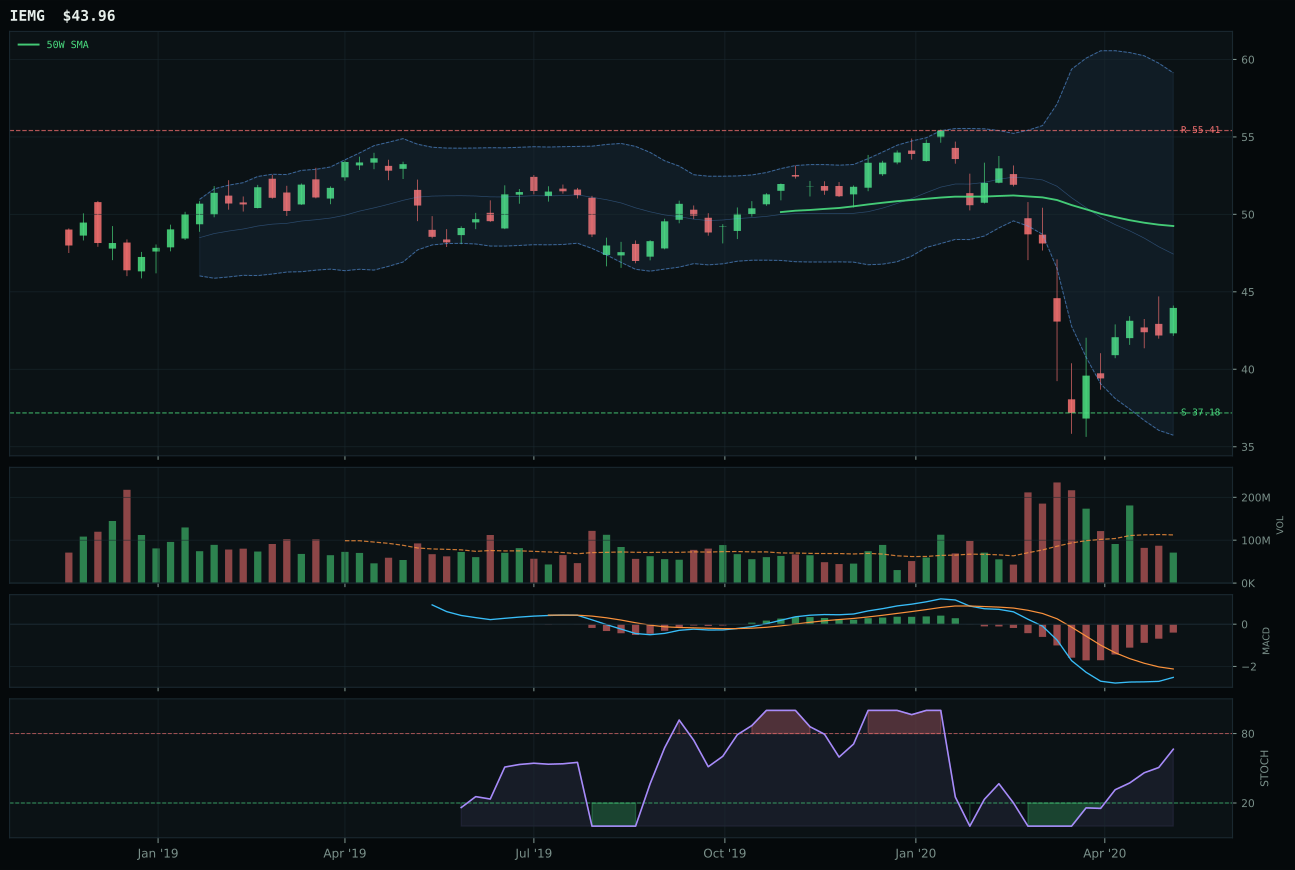
IEMG has a neutral structure profile with -3.5% 13-week relative strength versus SPY.
Extension and support failure are the main tactical risks.
Tracked, but not top-2 eligible because: structurally broken.
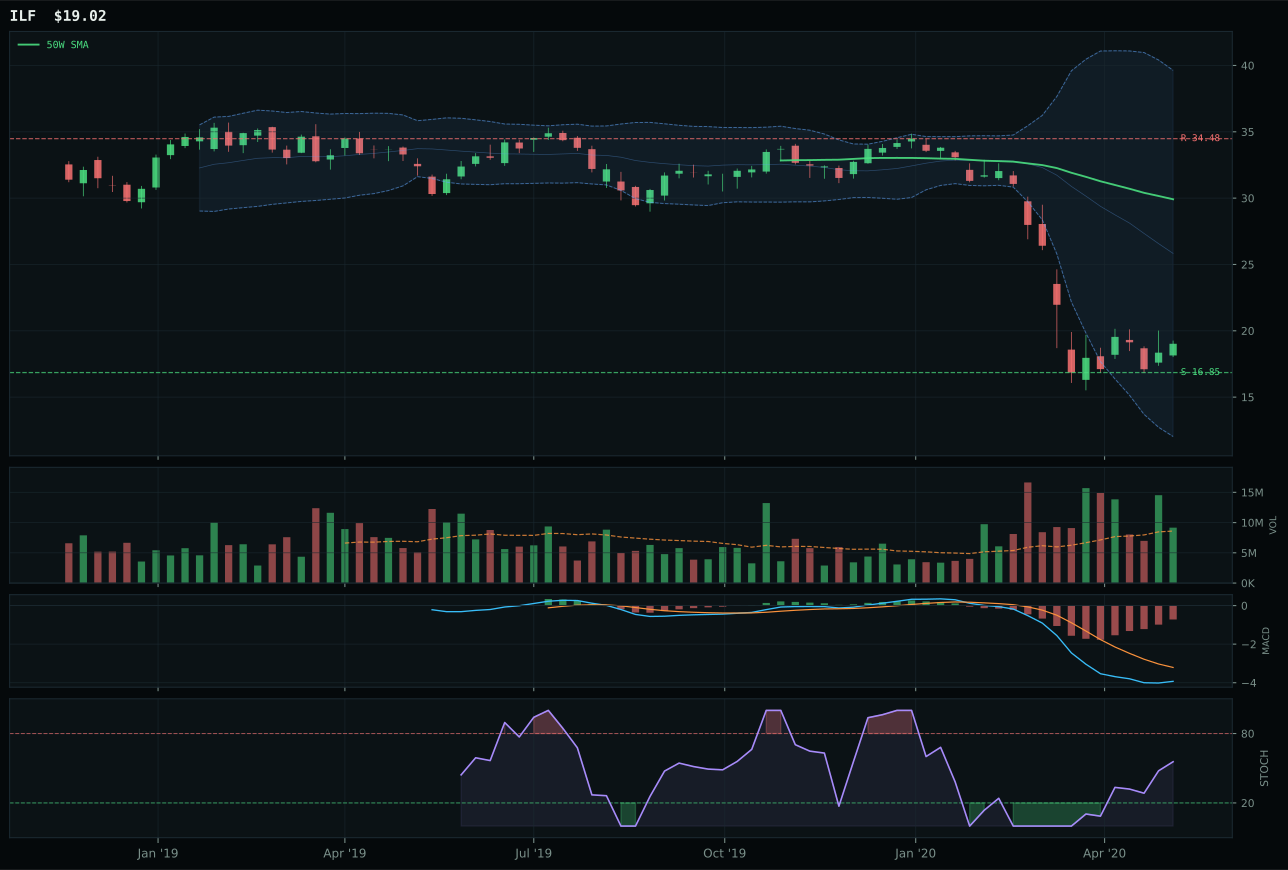
ILF has a neutral structure profile with -28.1% 13-week relative strength versus SPY.
Extension and support failure are the main tactical risks.
Tracked, but not top-2 eligible because: structurally broken.
INDA won the category despite the highest negative 23.7% 13-week return in the emerging-markets basket by carrying negative 11.8% SPY-relative weakness that, while worse than IEMG's negative 3.5%, coincided with a 59.9 risk-reward score and category-neutral 0.0% standing that reflected neither leadership nor catastrophic underperformance versus peers. IEMG posted superior macro fit at 67.0 with EM liquidity support at +12 and cleaner trend evidence, but faced the ineligibility hard filter for structural breakdown, handing victory to INDA by default despite its thin 0.72x volume and bearish MACD. The 0.0% momentum confirmation in INDA signals zero four-week sponsorship, while IEMG's 47.0 momentum score made clear that the category is bifurcated—broad EM breadth (IEMG) is accumulating while India quality (INDA) sits in neutral structure.
Emerging Markets earned 10% allocation because the category macro fit of 79.0/100 ranked among the portfolio's best, driven by EM liquidity support at +14, liquidity expansion at +8, and risk appetite at +8, creating a net-positive +22 macro boost despite credit stress penalizing at -8. However, the category-level technical score of only 35.8 (3/2/1 weighted basket) combined with the reasoner's hard-filter downgrades to produce a 28.2 final category score—well outside the top tier. INDA's ineligibility and poor technical confirmation reveal that the allocation is pure macro bet on EM central bank liquidity and risk-on sentiment rather than on clean technical setup or earnings support. The 10% weight should be understood as a liquid access to EM exposure should the macro regime prove more durable than near-term technicals suggest; without the exceptional EM liquidity support descriptor and the Goldilocks backdrop, this category would not merit inclusion alongside the two 20% conviction positions.
Defense & Aerospace — XAR
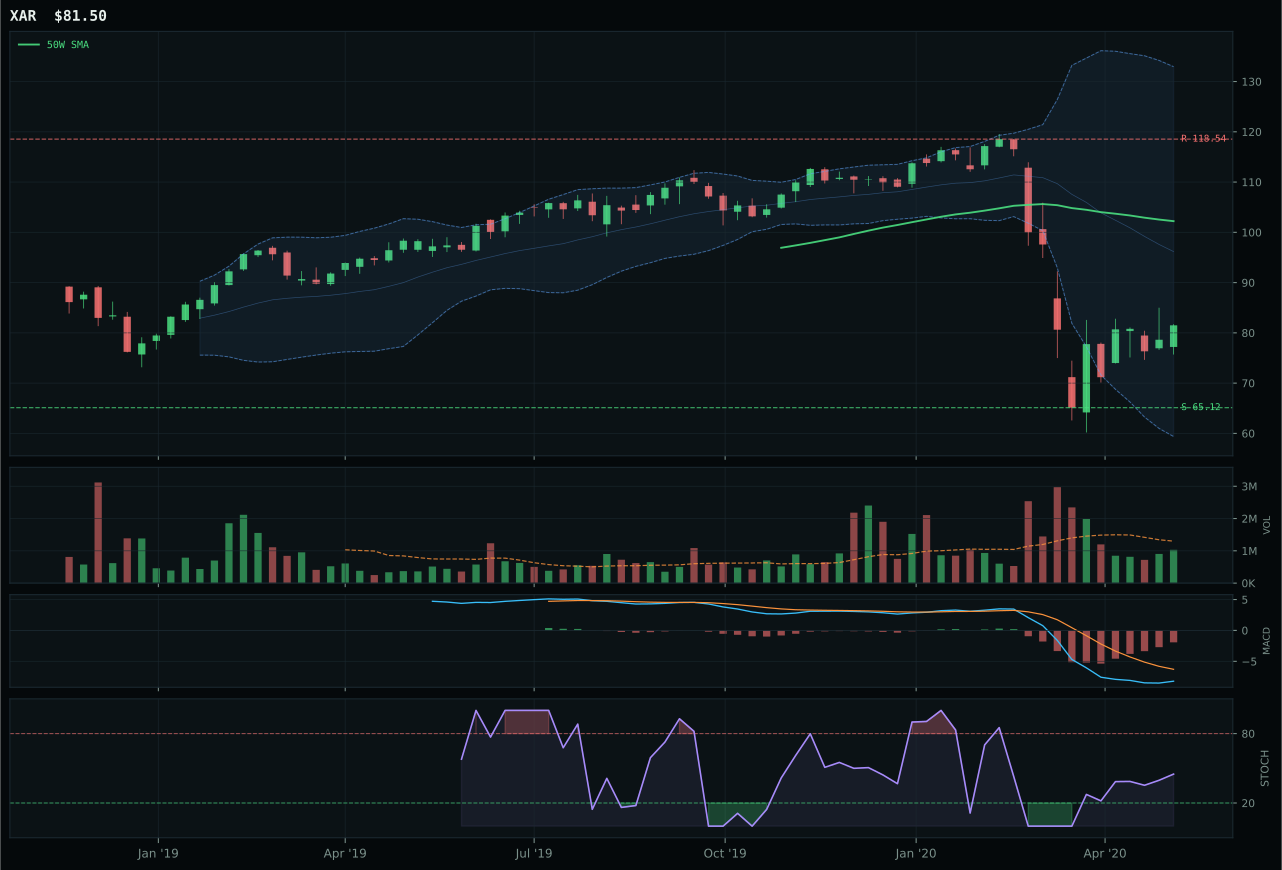
XAR has a neutral structure profile with -18.5% 13-week relative strength versus SPY.
A failed hold above support would weaken the setup.
Actionable but governed by invalidation levels.
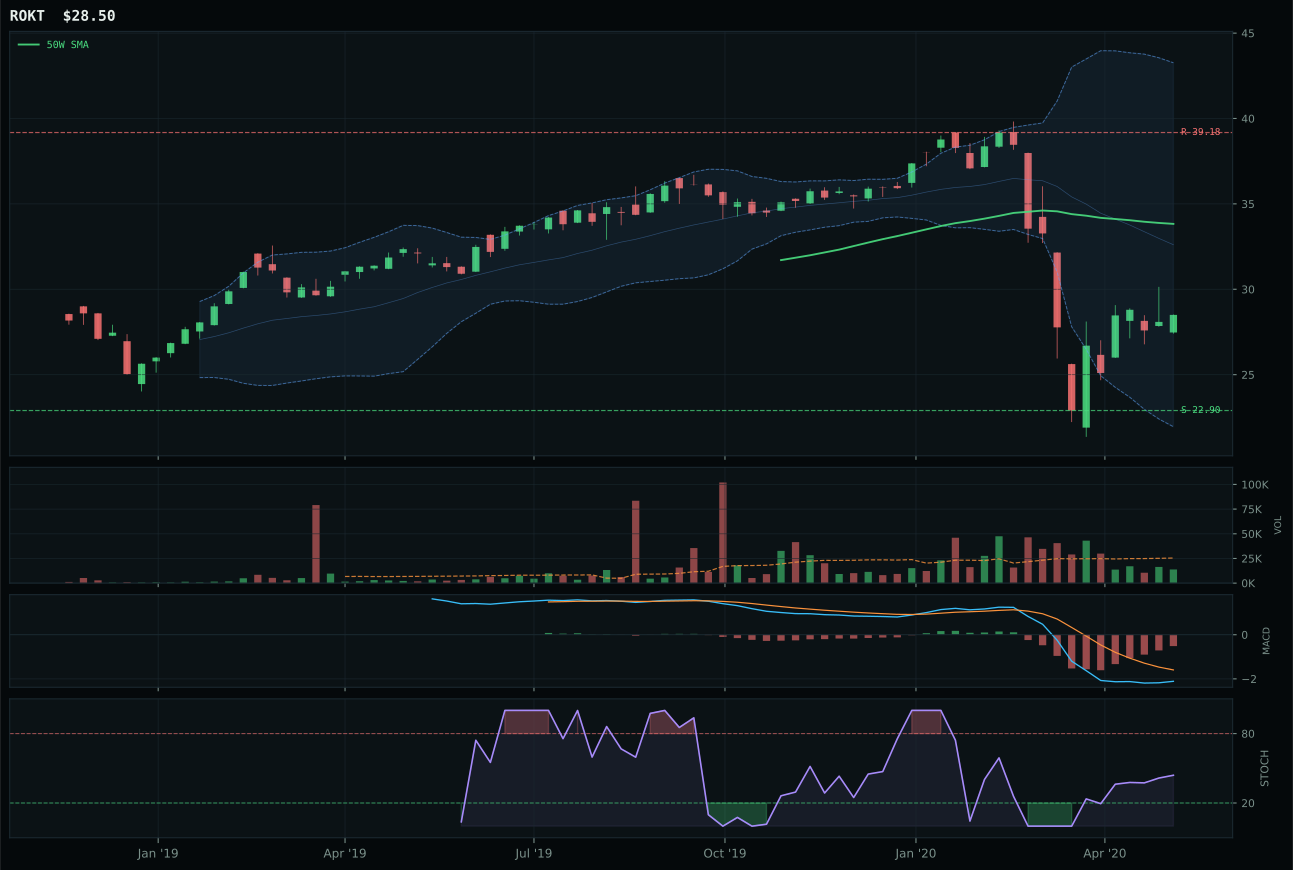
ROKT has a neutral structure profile with -13.8% 13-week relative strength versus SPY.
A failed hold above support would weaken the setup.
Tracked, but not top-2 eligible because: .
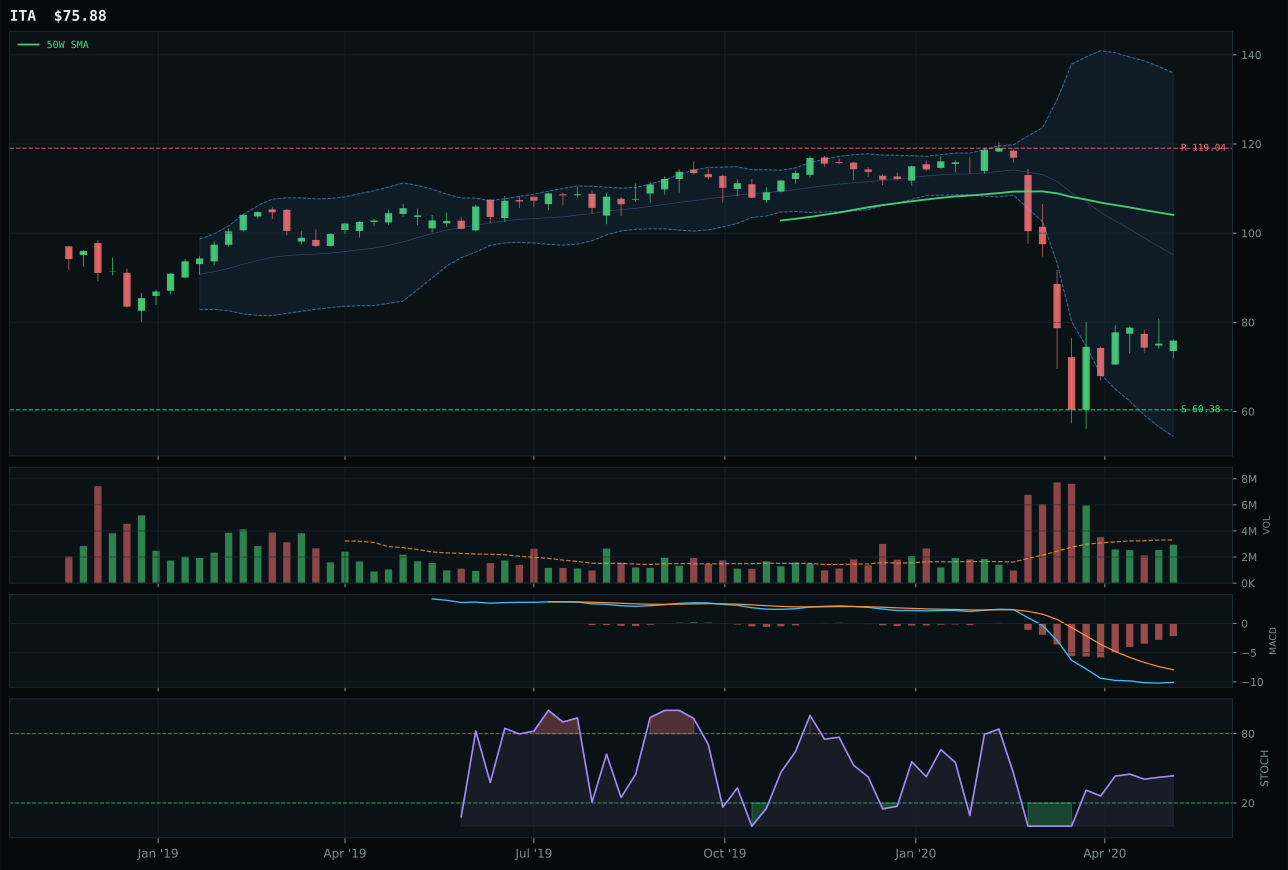
ITA has a neutral structure profile with -24.1% 13-week relative strength versus SPY.
A failed hold above support would weaken the setup.
Actionable but governed by invalidation levels.
XAR won a deeply challenged category by surviving a -30.4% 13-week drawdown with momentum confirmation still registering 0.0 because price collapsed through both moving averages and sits 20.3% below the 50-week at the deep Fibonacci 0.618 retracement zone. The category-relative strength of 0.0% meant XAR held its own against ROKT only on technical mercy—better risk-reward of 60.4 versus 58.1 and neutral volume versus thin participation in ROKT gave the edge by 22.4 points, but this is a race to the bottom. ROKT's bearish MACD, thin volume, and stretched timing all reinforced that neither ETF represents an actionable opportunity, yet XAR still earned the seat because structure held at 59.1 while ROKT degraded to 58.9. The 1.0% four-week return and rising stochastic mid-zone provide the only technical lifeline in a category where macro descriptors registered as neutral.
Defense & Aerospace kept its 10% allocation slot despite a category-level score of 24.2—among the weakest across the portfolio—because the 66.0 macro fit suggested neutral rather than hostile conditions and because the allocator requires representation of defensive rotation should sentiment shift. The category is not broken; it is crushed by the current macro regime in which risk appetite is positive and credit stress, while present, is not yet triggering flight-to-quality flows. The technical evidence for XAR sits at 28.8/100, nearly all of it coming from its 60.4 risk-reward score, which simply reflects how deep the drawdown has cut—there is substantial upside to resistance but the downside risk is being priced as minimal at this extreme valuation. This is portfolio ballast, not conviction: if broad market bear sentiment activates or if the two active macro headwinds intensify, this category would re-rate rapidly, making the 10% weight more insurance than alpha.
Traditional Energy — FCG
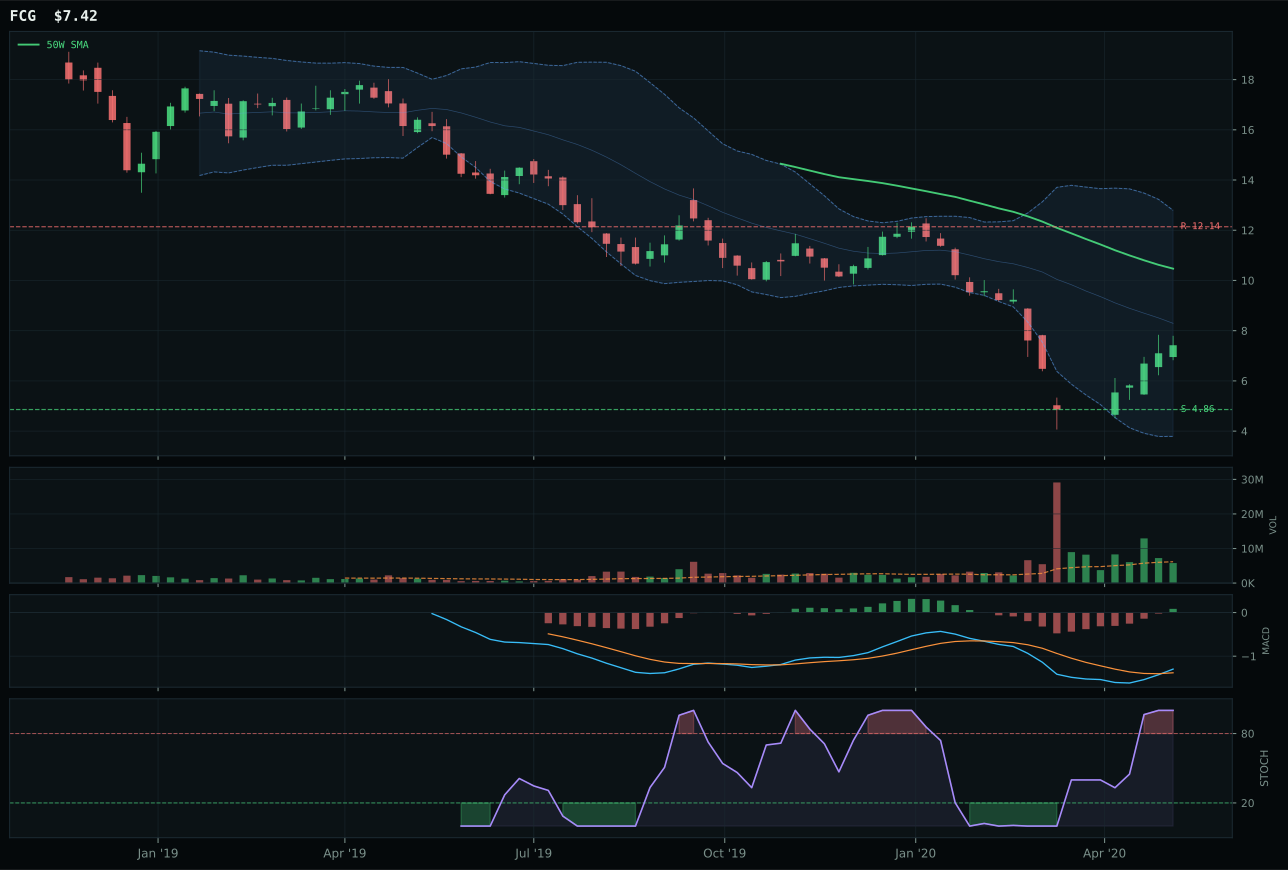
FCG has a neutral structure profile with -10.5% 13-week relative strength versus SPY.
Extension and support failure are the main tactical risks.
Tracked, but not top-2 eligible because: structurally broken.
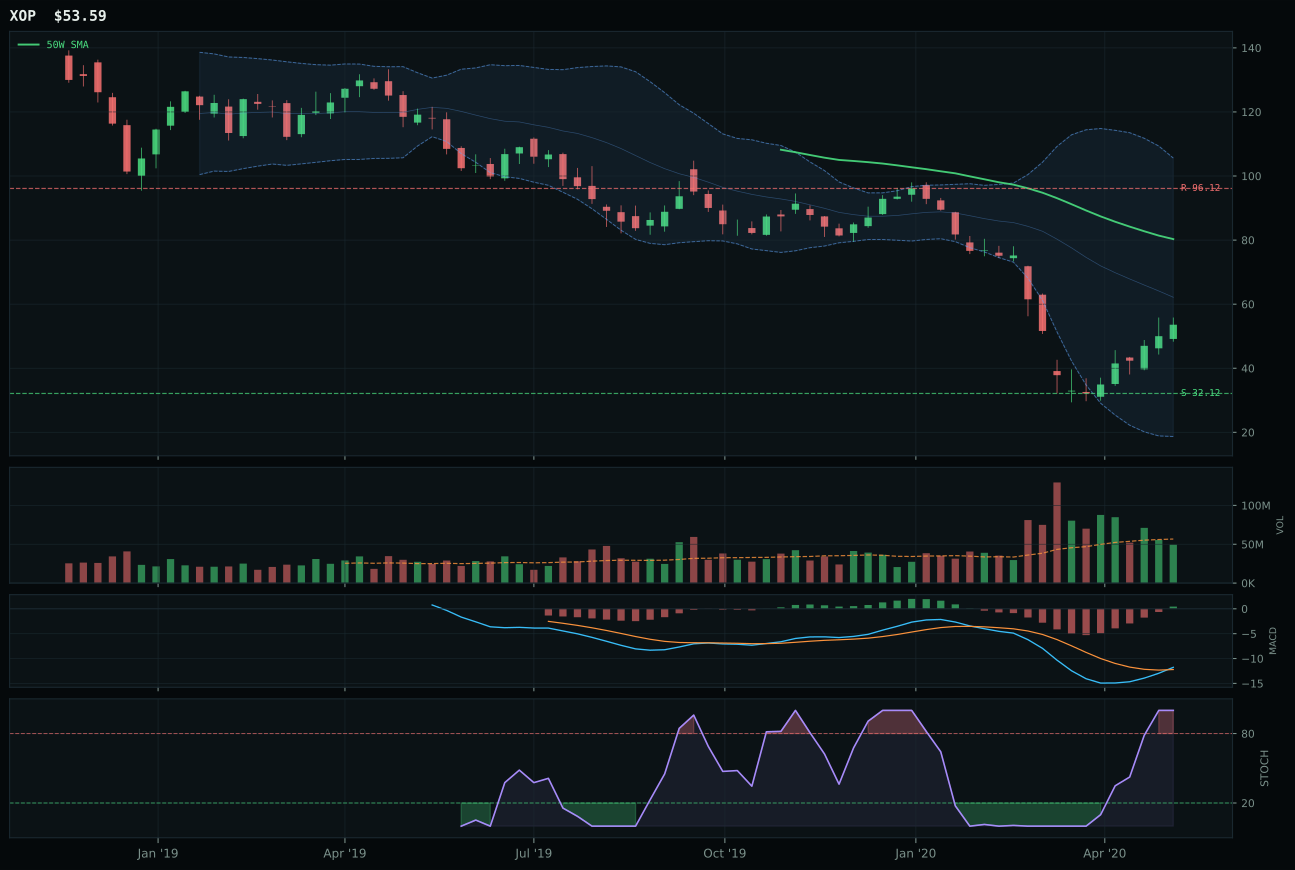
XOP has a neutral structure profile with -18.3% 13-week relative strength versus SPY.
Extension and support failure are the main tactical risks.
Tracked, but not top-2 eligible because: structurally broken.
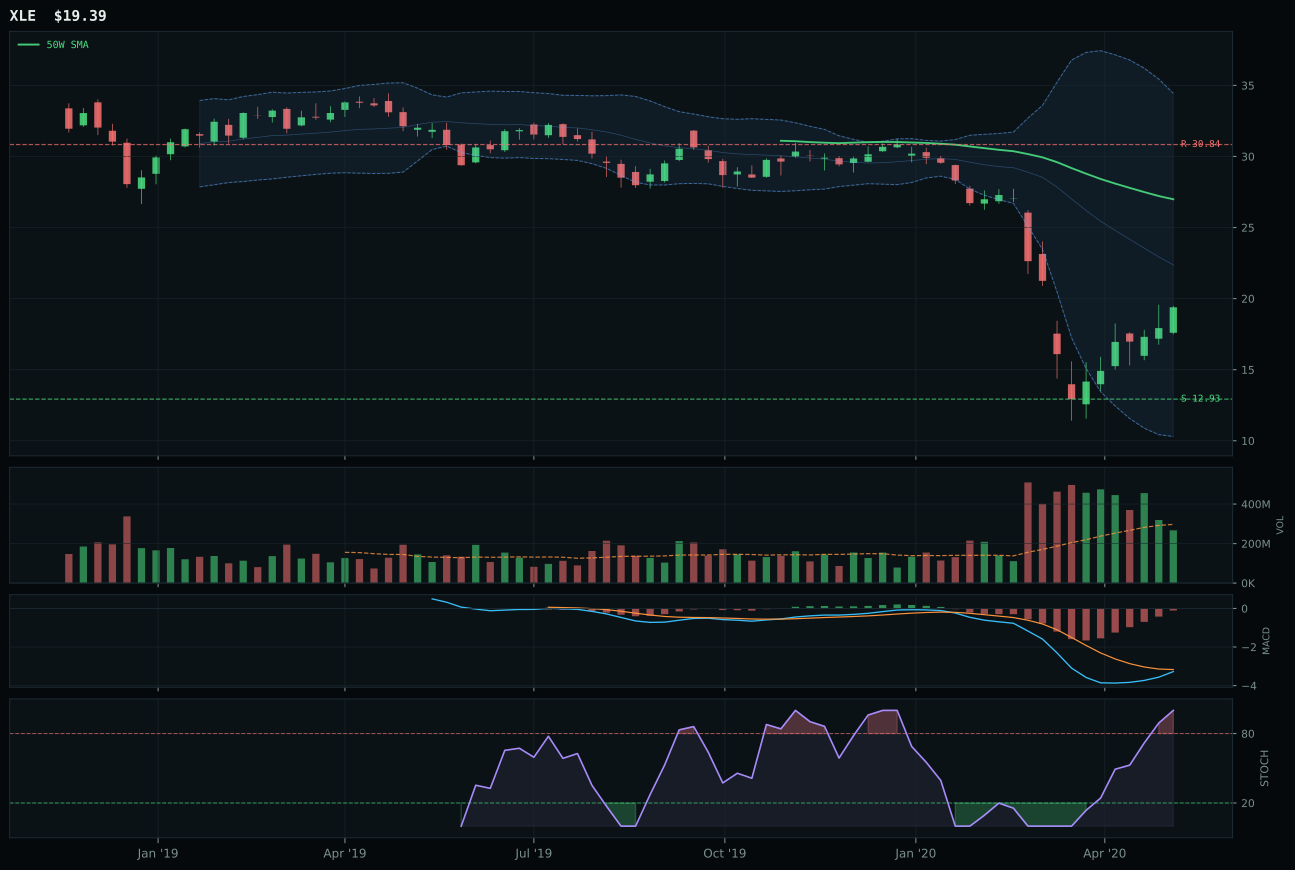
XLE has a neutral structure profile with -16.2% 13-week relative strength versus SPY.
Extension and support failure are the main tactical risks.
Tracked, but not top-2 eligible because: structurally broken.
FCG won an entirely collapsed category by posting 93.6 momentum confirmation on the back of a stunning 33.9% four-week return despite catastrophic 22.5% 13-week drawdown, sitting at the Fibonacci 0.786 deep retracement zone with stochastic RSI overbought at 1.00. The 5.7% category-relative strength meant FCG outperformed the median by half a standard deviation while both XOP and XLE deteriorated further, with XOP collapsing to negative 18.3% SPY-relative weakness. The bullish-and-improving MACD in FCG provided the only technical confirmation in a category where structure degraded to 30.6 and risk-reward inverted to 38.0—upside capped at 38.9% loss while downside offered 87.4% additional damage. FCG's neutral 0.94x volume ensured the bounce was not forced, but the 15.8-point gap versus XOP reflected simply that FCG hurt less rather than that it represented any fundamental healing in energy.
Traditional Energy received 10% allocation despite a final category score of 0.0 and an ineligibility flag (eligible: False) because the macro fit of 33.0 and the active disinflation pressure descriptor at -10 and credit stress at -7 created such a negative environment that even zero-score allocation is justified as a hedge on the off chance that energy demand shocks reverse. The technical evidence for FCG is 42.0/100, driven almost entirely by its recent four-week bounce momentum and category-relative strength, while the 13-week performance of negative 22.5% and SPY-relative weakness at negative 10.5% confirm that energy is structurally under pressure. This allocation is purely defensive tail-hedging: if crude oil prices spike due to geopolitical event or demand shock, FCG's leverage will provide portfolio rebalancing benefit without requiring conviction in the setup. The zero score after reasoner testing indicates that trend, structure, timing, and support/resistance all failed quality gates, making this the weakest allocation slot in the portfolio and justified only by diversification logic and the non-zero probability of regime shift.
Industrial Metals — PICK
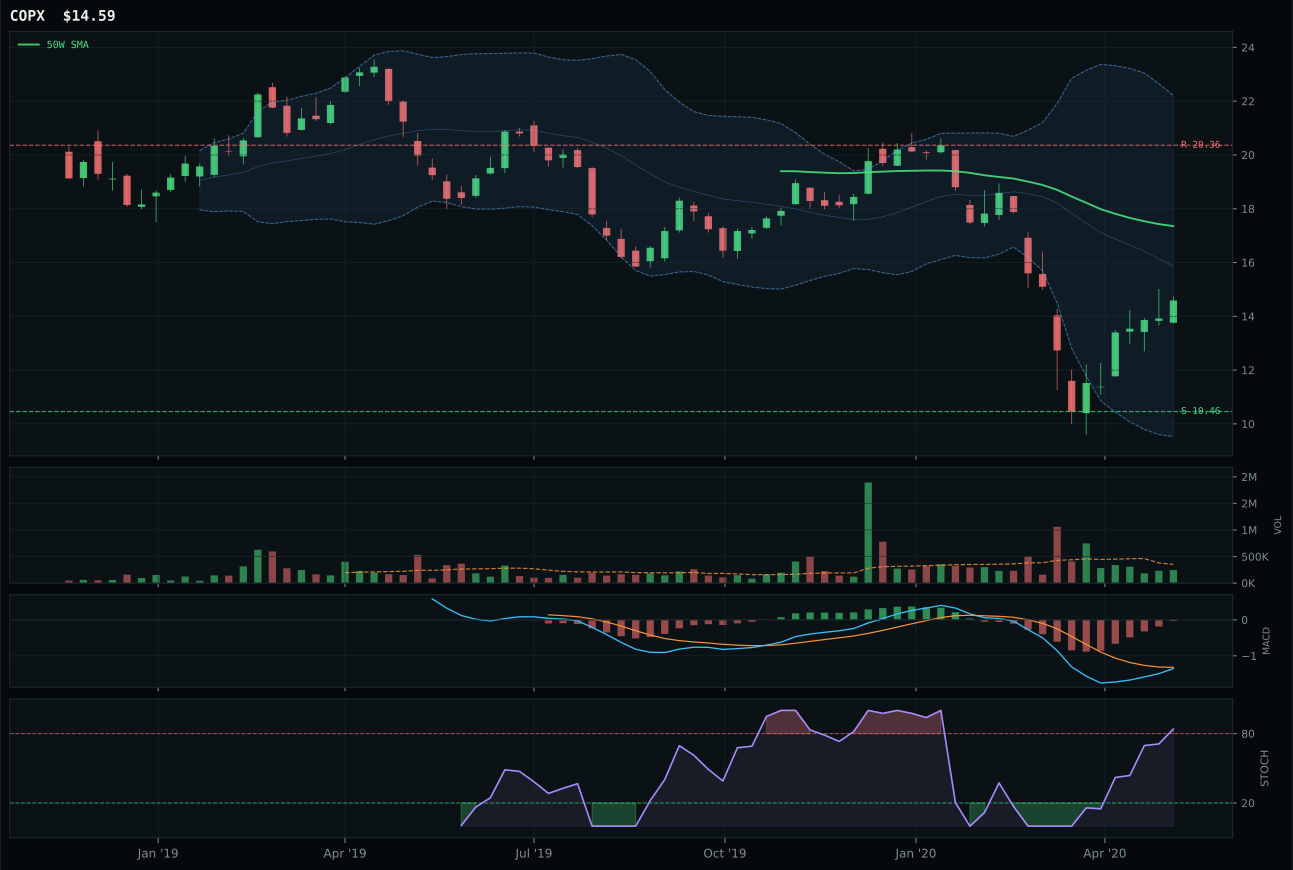
COPX has a neutral structure profile with -6.2% 13-week relative strength versus SPY.
Extension and support failure are the main tactical risks.
Tracked, but not top-2 eligible because: structurally broken.
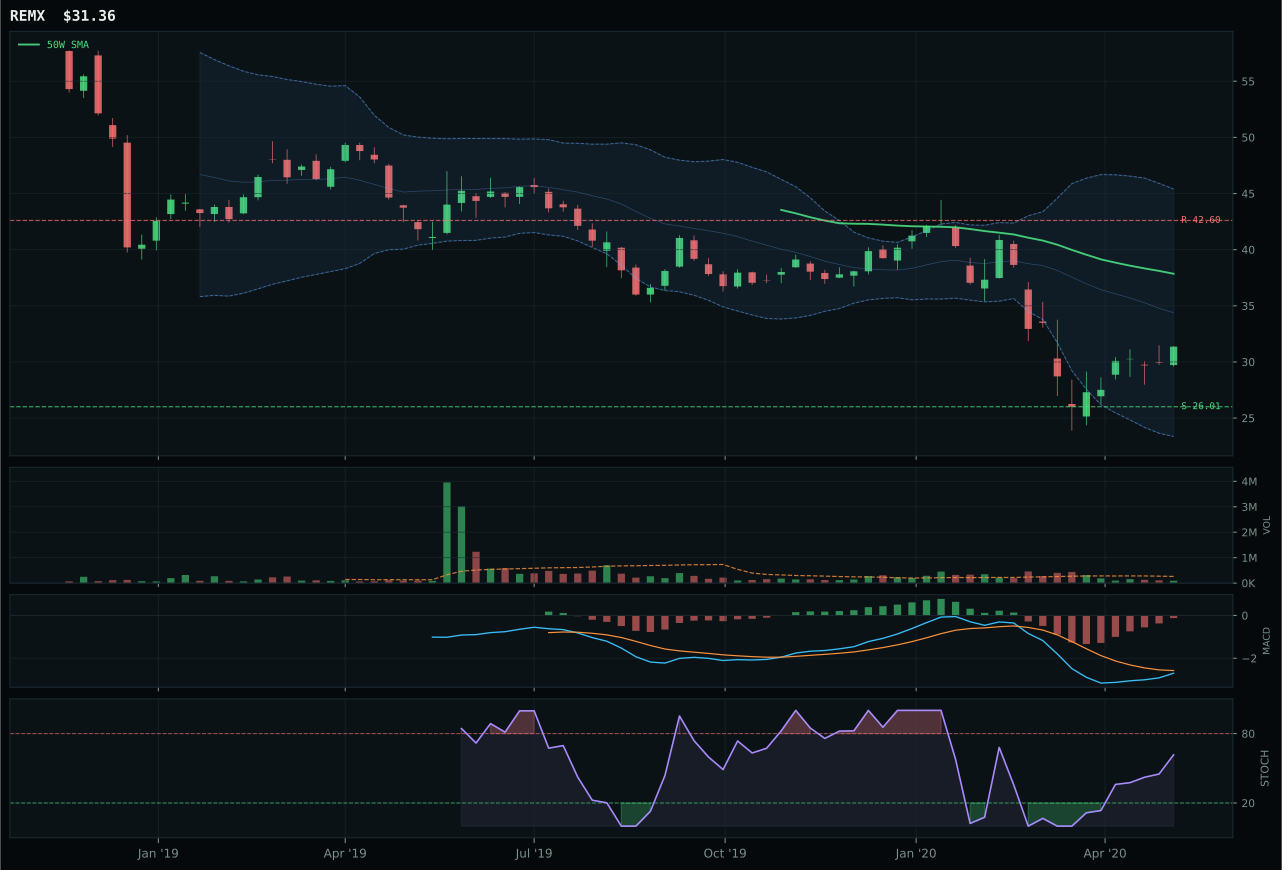
REMX has a neutral structure profile with -4.0% 13-week relative strength versus SPY.
Extension and support failure are the main tactical risks.
Tracked, but not top-2 eligible because: structurally broken.
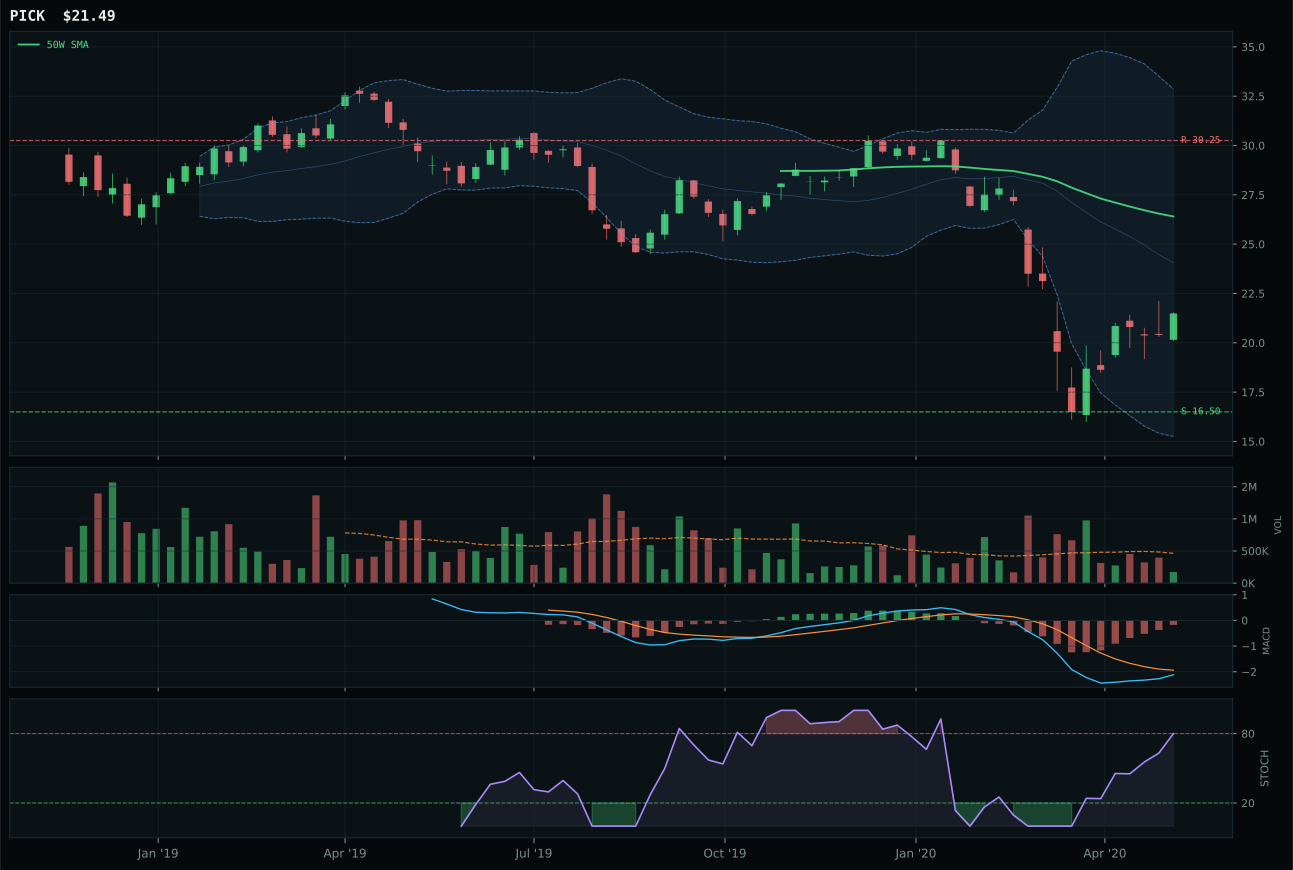
PICK has a neutral structure profile with -9.9% 13-week relative strength versus SPY.
Extension and support failure are the main tactical risks.
Tracked, but not top-2 eligible because: structurally broken.
PICK won by surviving structural breakdown hard filters that disqualified both REMX and COPX, posting a 12.8 category score despite 21.9% 13-week drawdown and negative 9.9% SPY-relative strength because its risk-reward of 55.2 and timing of 55.0 represented the least-damaged setup in a collapsed category. The 0.37x volume at thin participation revealed that selling pressure has exhausted rather than accelerated, with stochastic RSI overbought at 0.80 and MACD bearish-but-improving creating a coil where support at 16.50 offers genuine reversal potential if risk sentiment shifted. COPX lost on risk-reward at 42.9 and structure at 27.2, while REMX also failed hard filters despite superior technical sequencing. At the deep Fibonacci 0.618 retracement zone, PICK represents not a bullish conviction but rather the purest expression of capitulation selling in a category where industrial demand assumptions have been abandoned.
Industrial Metals earned 0% allocation this week; the category ranks outside the top-eight and is ineligible for the main allocation sleeve. Final score of 12.8 and eligibility flag of False reflect hard-filter rejection by the system. Technical evidence of 3.5/100 is the weakest in the portfolio—trend is negative, relative strength is underwater, and no volume confirms any recovery attempt. Credit stress registers -7 at the macro level, which directly damages industrial cyclicals expecting demand. The category requires either a sustained breakout above the 50W on above-average volume or RS that turns positive versus SPY—neither condition is present. The regime actively punishes commodities exposure when inflation fears are absent. For Industrial Metals to earn allocation, a commodity-linked shock (energy crisis, supply disruption) would need to propel price through resistance on volume or macro descriptors would need to shift dramatically toward credit stress protection. Neither is relevant this week. The category is excluded.
Agriculture & Livestock — MOO
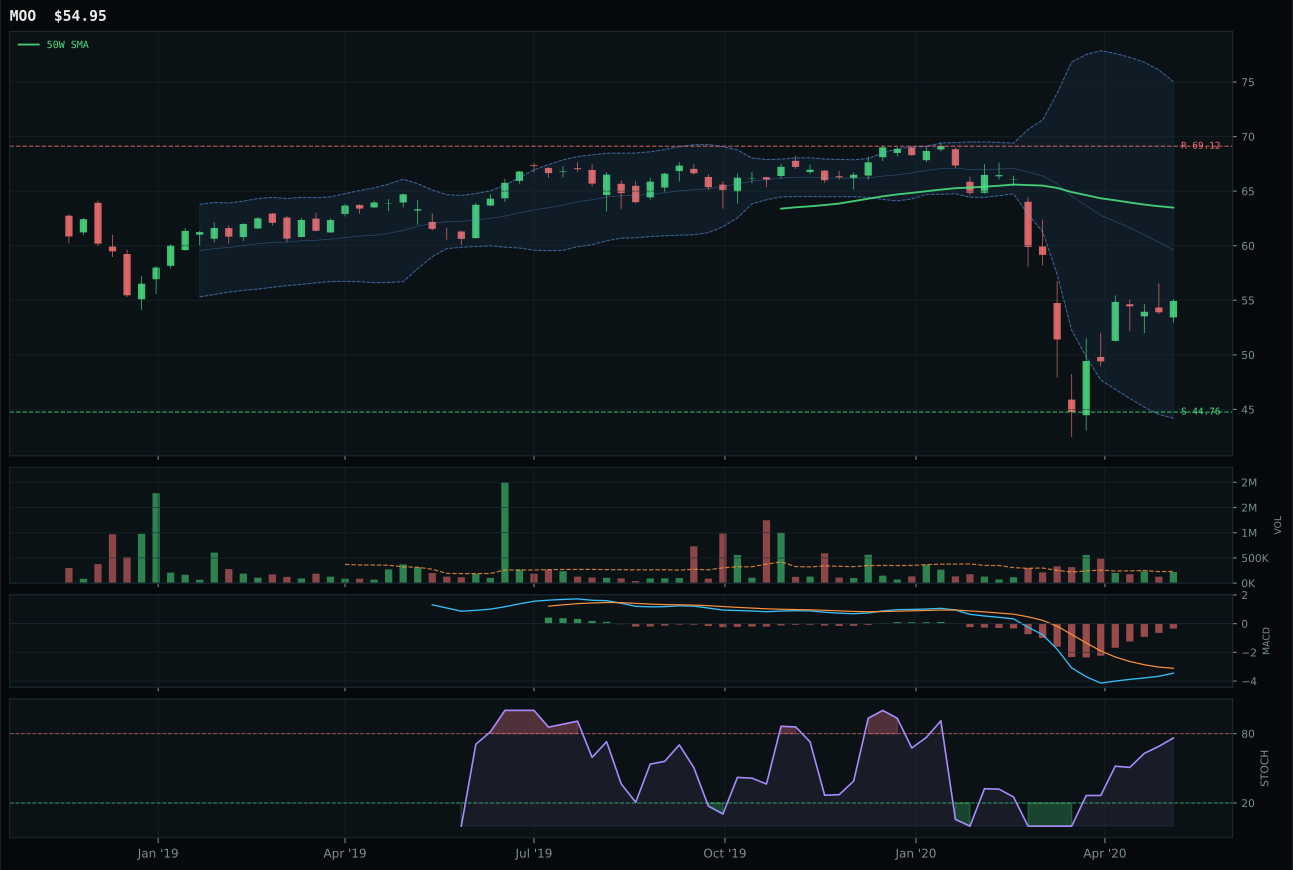
MOO has a neutral structure profile with -5.4% 13-week relative strength versus SPY.
A failed hold above support would weaken the setup.
Actionable but governed by invalidation levels.
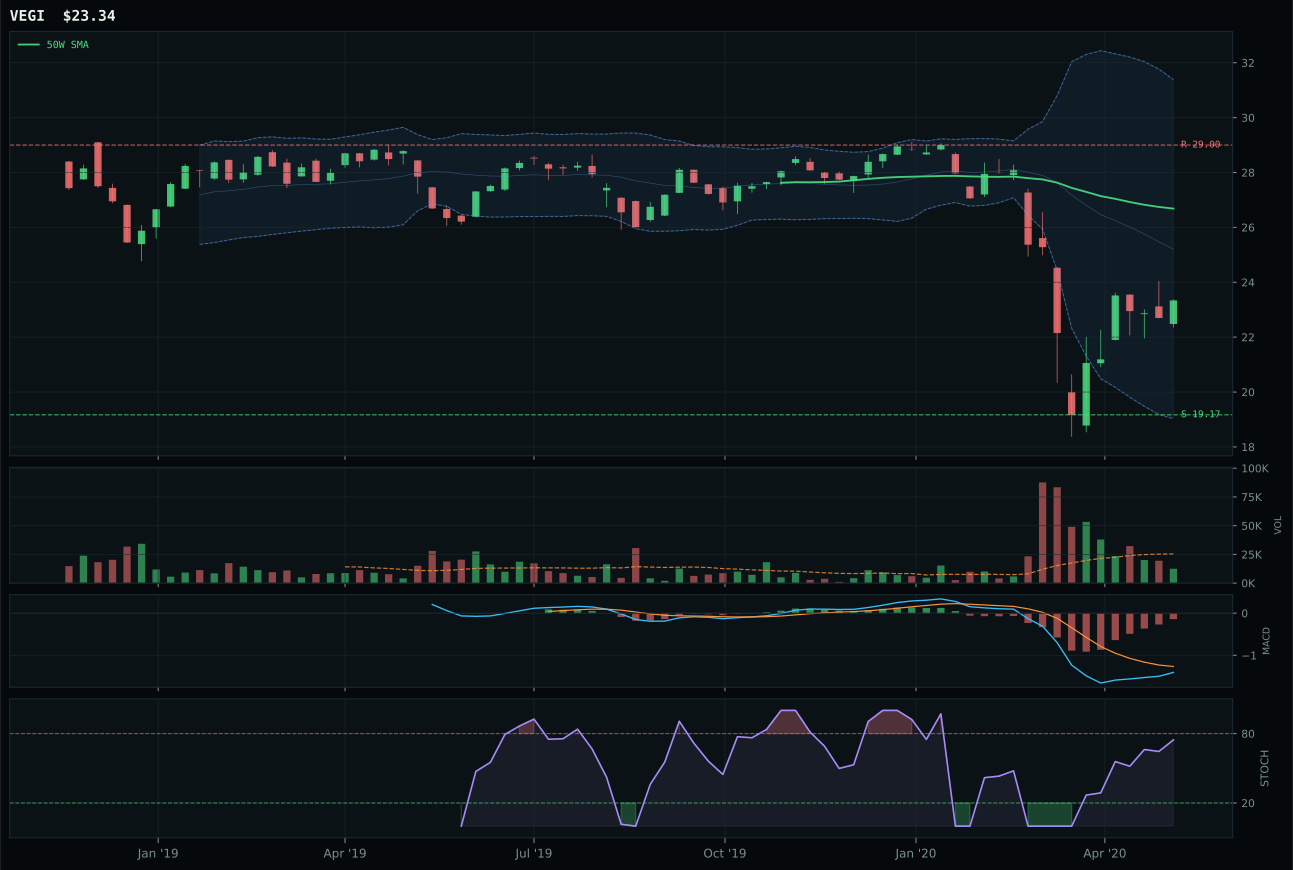
VEGI has a neutral structure profile with -4.5% 13-week relative strength versus SPY.
Extension and support failure are the main tactical risks.
Tracked, but not top-2 eligible because: structurally broken.
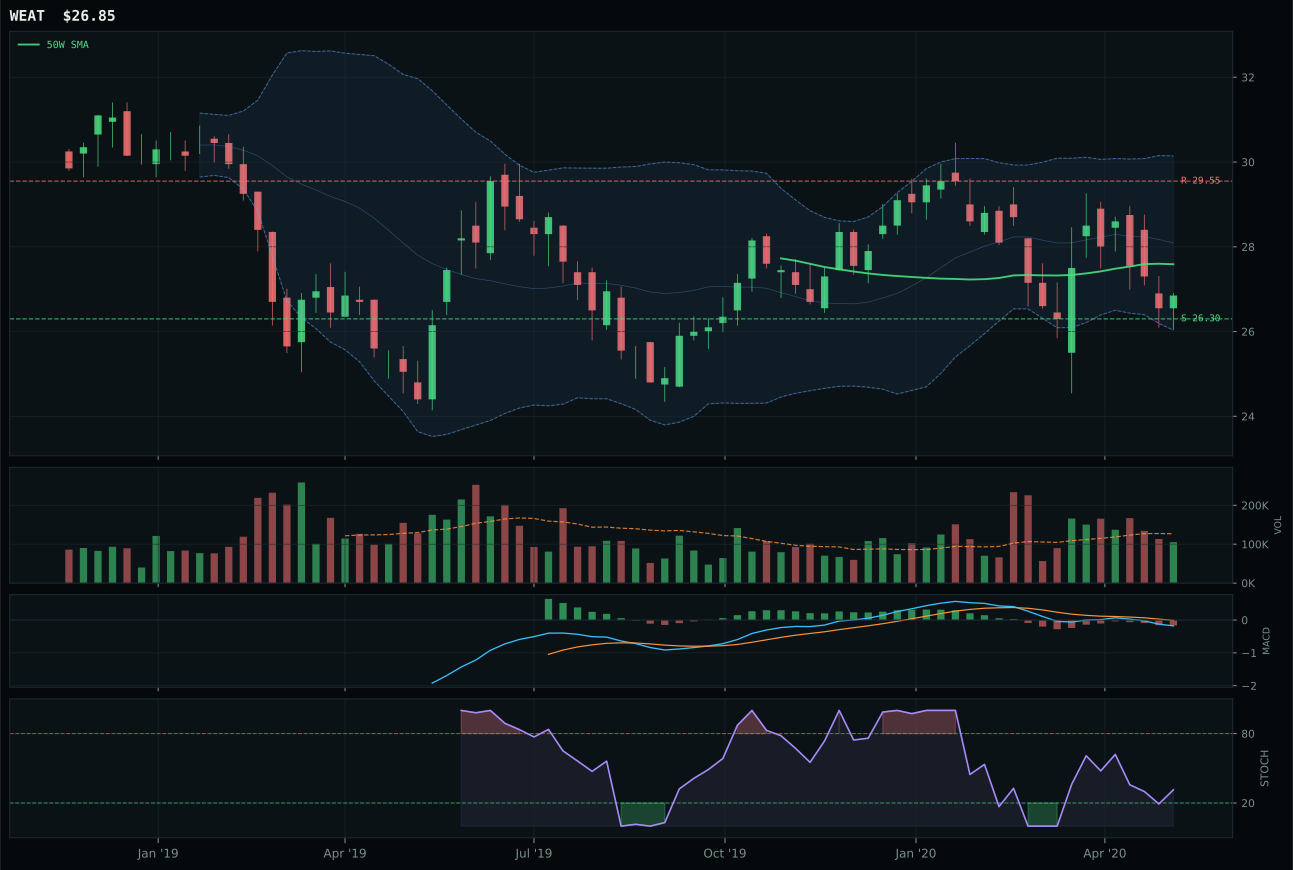
WEAT has a pullback into support profile with 5.2% 13-week relative strength versus SPY.
Extension and support failure are the main tactical risks.
Tracked, but not top-2 eligible because: structurally broken.
MOO won by the narrowest technical margin, scoring 38 on composite where VEGI registered a hard filter rejection for structural breakdown and WEAT posted superior risk-reward at 98.0 yet carried weakening bearish MACD and falling stochastic RSI. MOO's victory hinged on neutral volume participation at 0.95x and cleaner structure at 59.2 against VEGI's 32.4, even though both carry identical -17.4% and -16.5% 13-week returns and similar SPY-relative weakness at -5.4% and -4.5%. The MACD bullish-and-improving setup combined with rising stochastic mid-zone at 0.76 gave MOO 26.3 on momentum confirmation versus VEGI's 23.0, a 3-point edge that mattered in a category where no setup is clean. WEAT's structural advantage as a pullback-into-support play was negated by the timing score of 95.0, which punished its overbought stochastic and falling technical confirmation.
Agriculture & Livestock earned 0% allocation this week and ranks 9th or 10th because the final category score of 3.5 reflects outright rejection by the system. Technical evidence of 26.3/100 on MOO demonstrates no trend, no momentum, no volume sponsorship—just a battered asset floating in mean-reversion purgatory. Macro fit of 45.0 fails to help: disinflation pressure registers -8, the single biggest drag, because falling commodity prices hurt agribusiness pricing power and earnings. Liquidity expansion (+0) offers zero support to this sector. The system correctly identified that the regime penalizes this exposure—risk appetite is rotating into growth and momentum plays, not commodity producers. For Agriculture to return to the allocation, it would need either a shock that triggers inflation fears, a technical setup that breaks above the 50W on volume, or category-relative strength that exceeds SPY by 5% or more. None of those conditions exist. The category is excluded entirely this week.