
2020-05-01
Informational purposes only. The content in this report, including allocations, analysis, and commentary, is provided solely for informational and educational purposes. It does not constitute financial advice, investment advice, trading advice, or any other type of advice. Past performance does not guarantee future results. Always conduct your own research and consult a qualified financial professional before making investment decisions.
Some tracked tickers were excluded due to missing live weekly price data: SGOV: Historical cache SGOV has only 0 usable weekly bars; URNM: Historical cache URNM has only 22 usable weekly bars
Weekly Allocation
| Ticker | Category | Weight | Role |
|---|---|---|---|
| IGV | Technology | 20% | Top-2 (20%) |
| BOTZ | AI | 20% | Top-2 (20%) |
| GDX | Precious Metals | 10% | Tier-2 (10%) |
| INDA | Emerging Markets | 10% | Tier-2 (10%) |
| FCG | Traditional Energy | 10% | Tier-2 (10%) |
| URA | Nuclear Energy | 10% | Tier-2 (10%) |
| IGF | Utilities & Infrastructure | 10% | Tier-2 (10%) |
| ITA | Defense & Aerospace | 10% | Tier-2 (10%) |
Trade Instructions — Monday Open
Sell the tranche from 2020-04-03 (completing its 4-week hold). Buy the new tranche. Instructions show net portfolio changes — same-asset positions cancel, weight changes show the delta.
| Action | Ticker | Instruction |
|---|---|---|
| SELL | GLD | Sell 33% of GLD position (reduce 45.00% → 30.00%) |
| SELL | CIBR | Sell 25% of CIBR position (reduce 10.00% → 7.50%) |
| SELL | SMH | Sell 20% of SMH position (reduce 6.25% → 5.00%) |
| SELL | XLU | Sell 20% of XLU position (reduce 6.25% → 5.00%) |
| SELL | XAR | Sell 50% of XAR position (reduce 2.50% → 1.25%) |
| SELL | XLE | Sell 33% of XLE position (reduce 3.75% → 2.50%) |
| BUY | URA | Buy URA — 5.56% of freed cash (adds 1.25% to portfolio) |
| BUY | INDA | Buy INDA — 5.56% of freed cash (adds 1.25% to portfolio) |
| BUY | GDX | Buy GDX — 11.11% of freed cash (adds 2.50% to portfolio) |
| BUY | FCG | Buy FCG — 11.11% of freed cash (adds 2.50% to portfolio) |
| BUY | ITA | Buy ITA — 11.11% of freed cash (adds 2.50% to portfolio) |
| BUY | IGV | Buy IGV — 22.22% of freed cash (adds 5.00% to portfolio) |
| BUY | BOTZ | Buy BOTZ — 22.22% of freed cash (adds 5.00% to portfolio) |
| BUY | IGF | Buy IGF — 11.11% of freed cash (adds 2.50% to portfolio) |
Current Portfolio After Trade
Combined holdings across all 4 active tranches. Each tranche is 25% of the portfolio.
| Ticker | % of Portfolio | Weight Bar |
|---|---|---|
| GLD | 30.00% | |
| CIBR | 7.50% | |
| URA | 7.50% | |
| INDA | 7.50% | |
| GDX | 7.50% | |
| ITA | 6.25% | |
| SMH | 5.00% | |
| XLU | 5.00% | |
| FCG | 5.00% | |
| IGV | 5.00% | |
| BOTZ | 5.00% | |
| XLE | 2.50% | |
| XLK | 2.50% | |
| IGF | 2.50% | |
| XAR | 1.25% |
Macro Regime — Risk-On Liquidity Expansion
Macro Evidence Charts
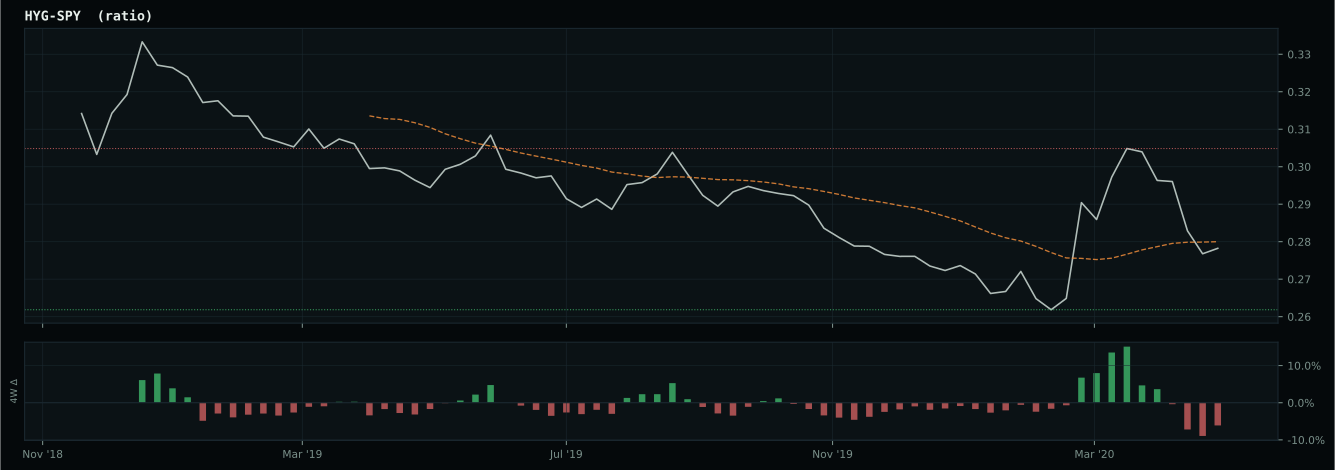
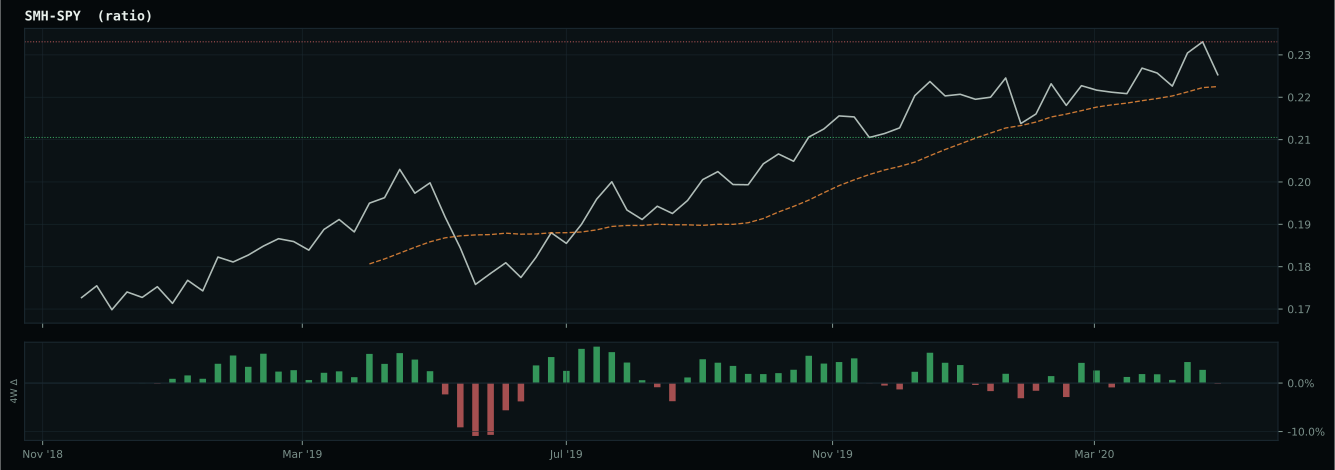
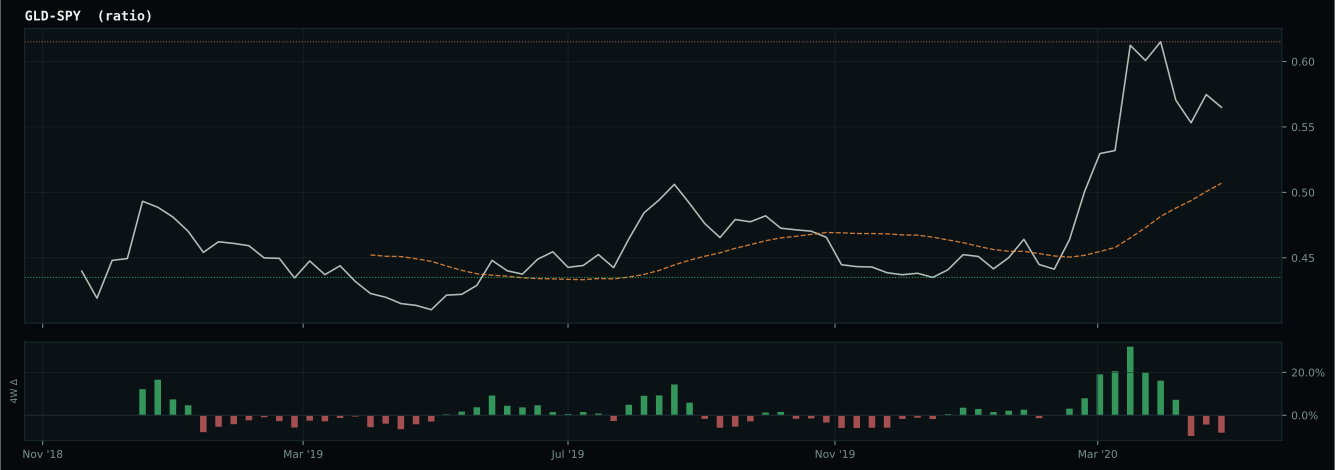
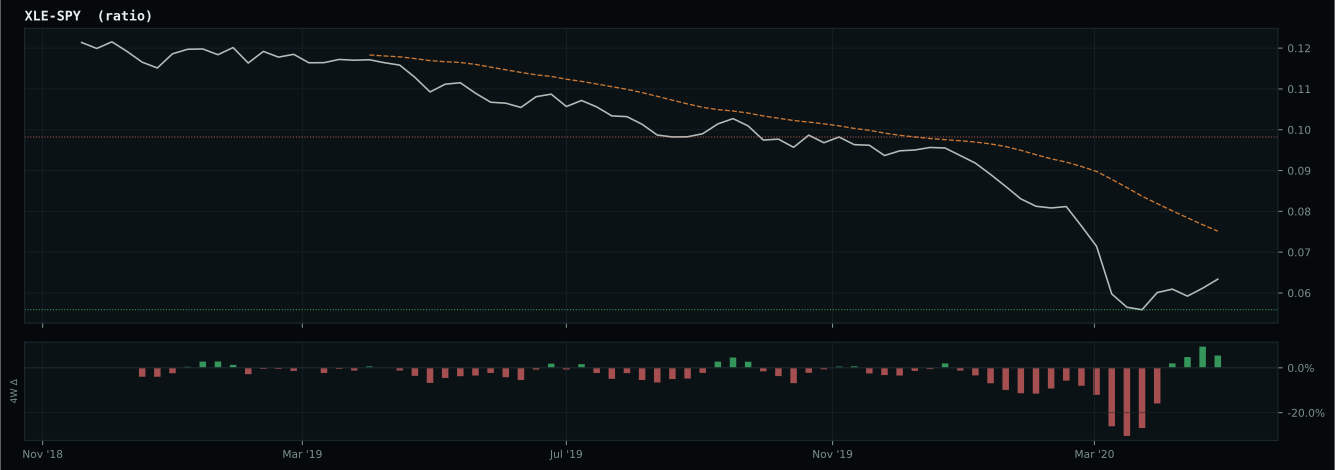
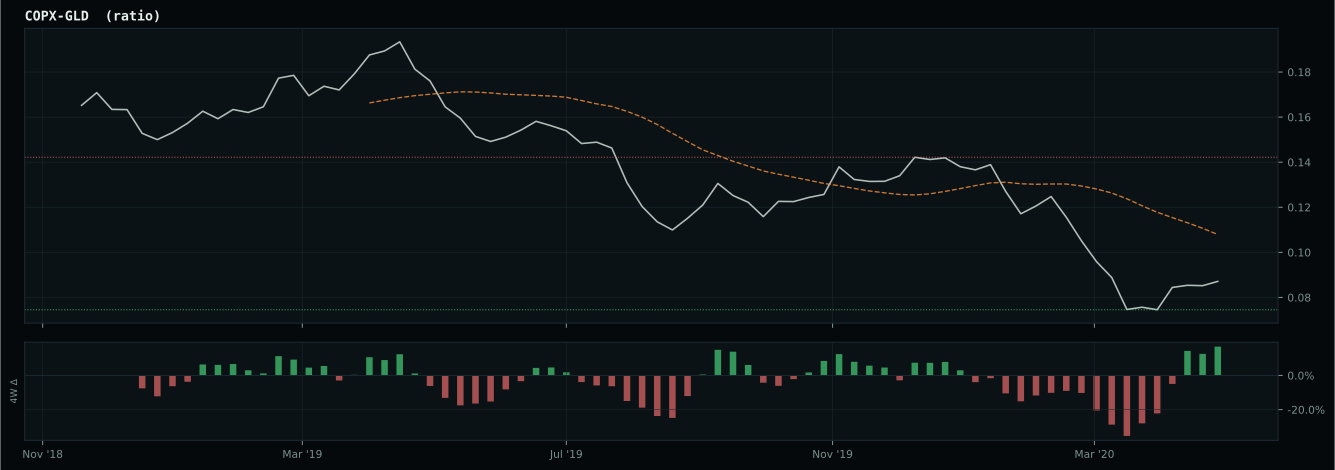
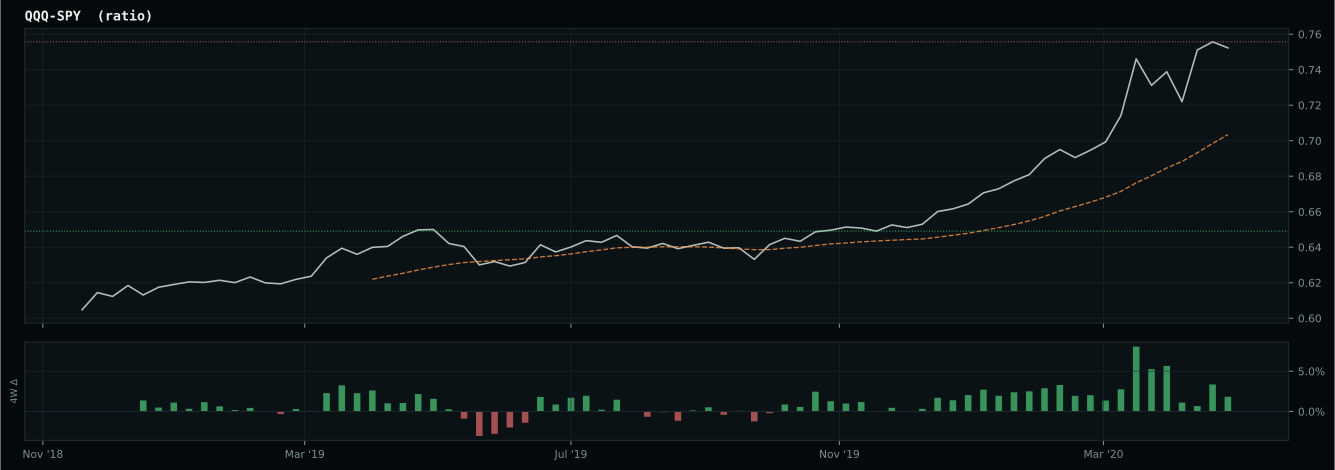
Market-implied signals behind the macro regime scores. Each ratio compares two assets; the direction and slope of the ratio is what the macro engine reads.
Crypto Regime — NoCrypto
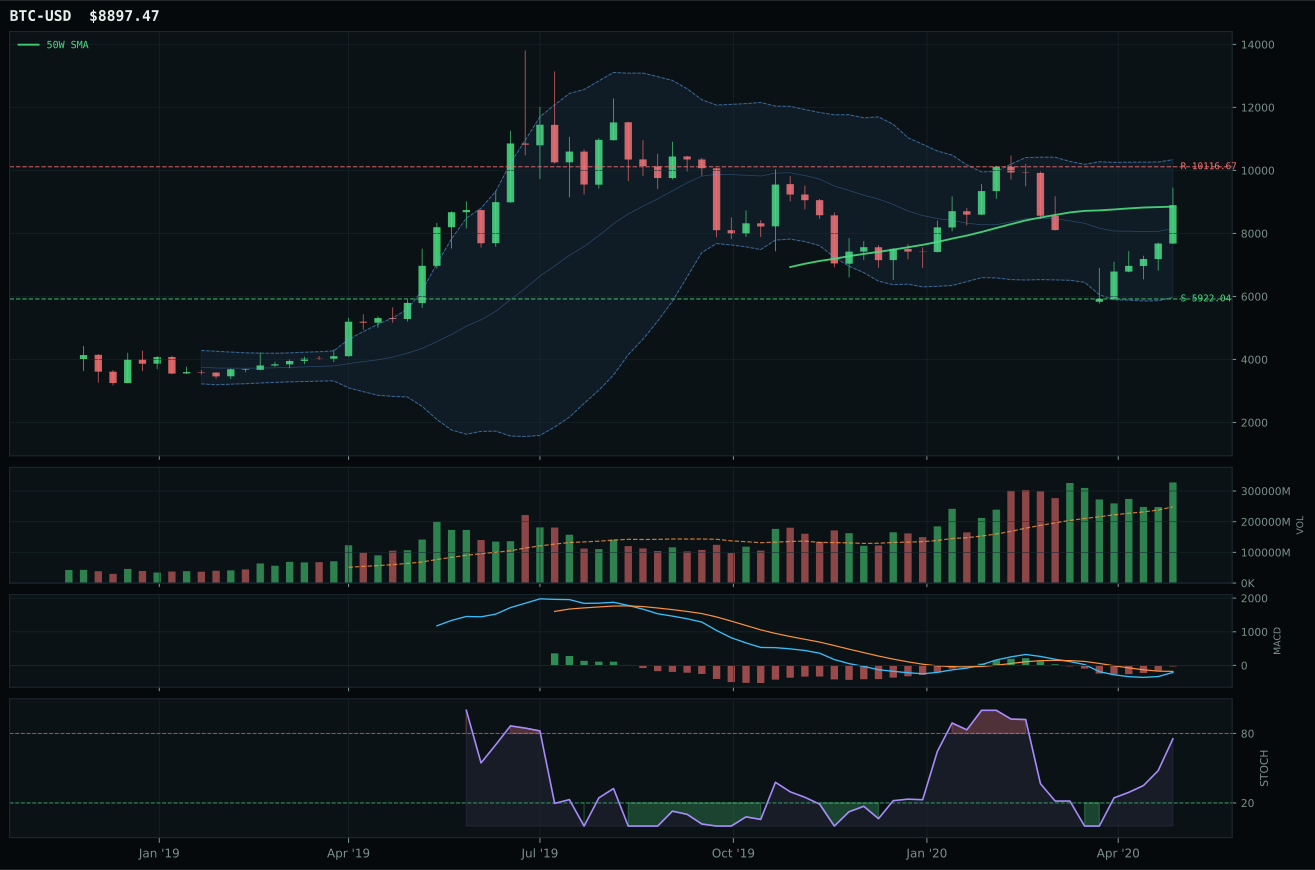
ValueBTC armed by first 200W buy-zone touch, but post-touch range age is 7 weeks; minimum is 12
TrendBTC not confirmed
one or more available conditions failed

Category Rankings
| Rank | Category | Winner | Score | Alloc | 4W Ret | Peers (4W) |
|---|---|---|---|---|---|---|
| 1 | Technology | IGV | 75.1 | 20% | +15.11% | XLK +10.2% · CIBR +17.7% |
| 2 | AI | BOTZ | 73.1 | 20% | +18.95% | SMH +11.0% · AIQ +14.3% |
| 3 | Precious Metals | GDX | 50.0 | 10% | +2.49% | GLD +1.6% · SLV +22.1% |
| 4 | Emerging Markets | INDA | 39.0 | 10% | +6.38% | ILF +13.8% · IEMG +7.5% |
| 5 | Nuclear Energy | URA | 29.5 | 10% | +5.57% | NLR +8.8% |
| 6 | Utilities & Infrastructure | IGF | 29.5 | 10% | +9.62% | XLU +7.3% · PAVE +13.6% |
| 7 | Defense & Aerospace | ITA | 23.4 | 10% | +12.57% | XAR +15.0% · ROKT +18.5% |
| 8 | Industrial Metals | PICK | 13.8 | 10% | +18.06% | COPX +14.0% · REMX +14.2% |
| 9 | Agriculture & Livestock | MOO | 3.3 | 0% | +9.88% | VEGI +8.4% · WEAT -0.4% |
| 10 | Traditional Energy | FCG | — | 0% | +6.47% | XOP +5.0% · XLE +10.0% |
Technology — IGV
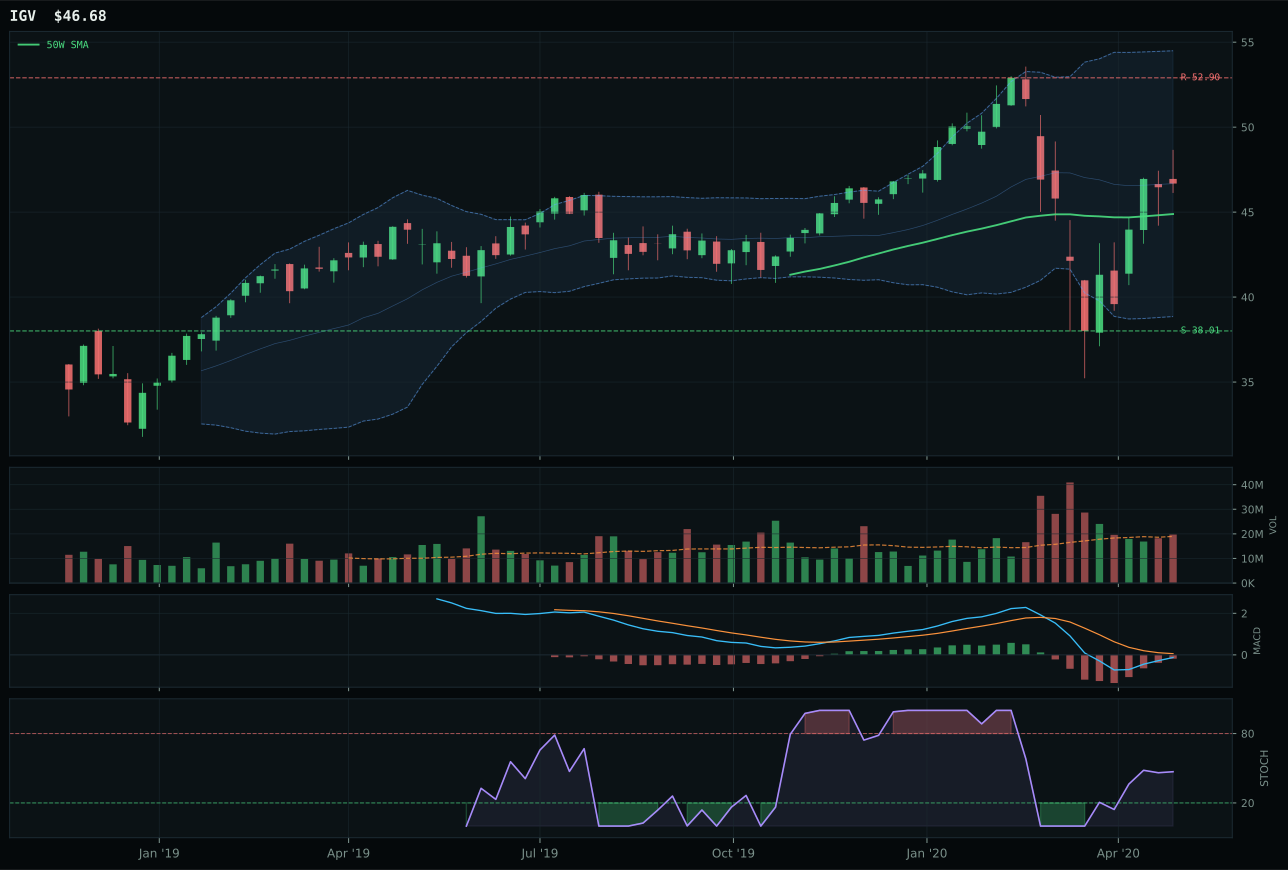
IGV has a neutral structure profile with 6.0% 13-week relative strength versus SPY.
A failed hold above support would weaken the setup.
Actionable but governed by invalidation levels.
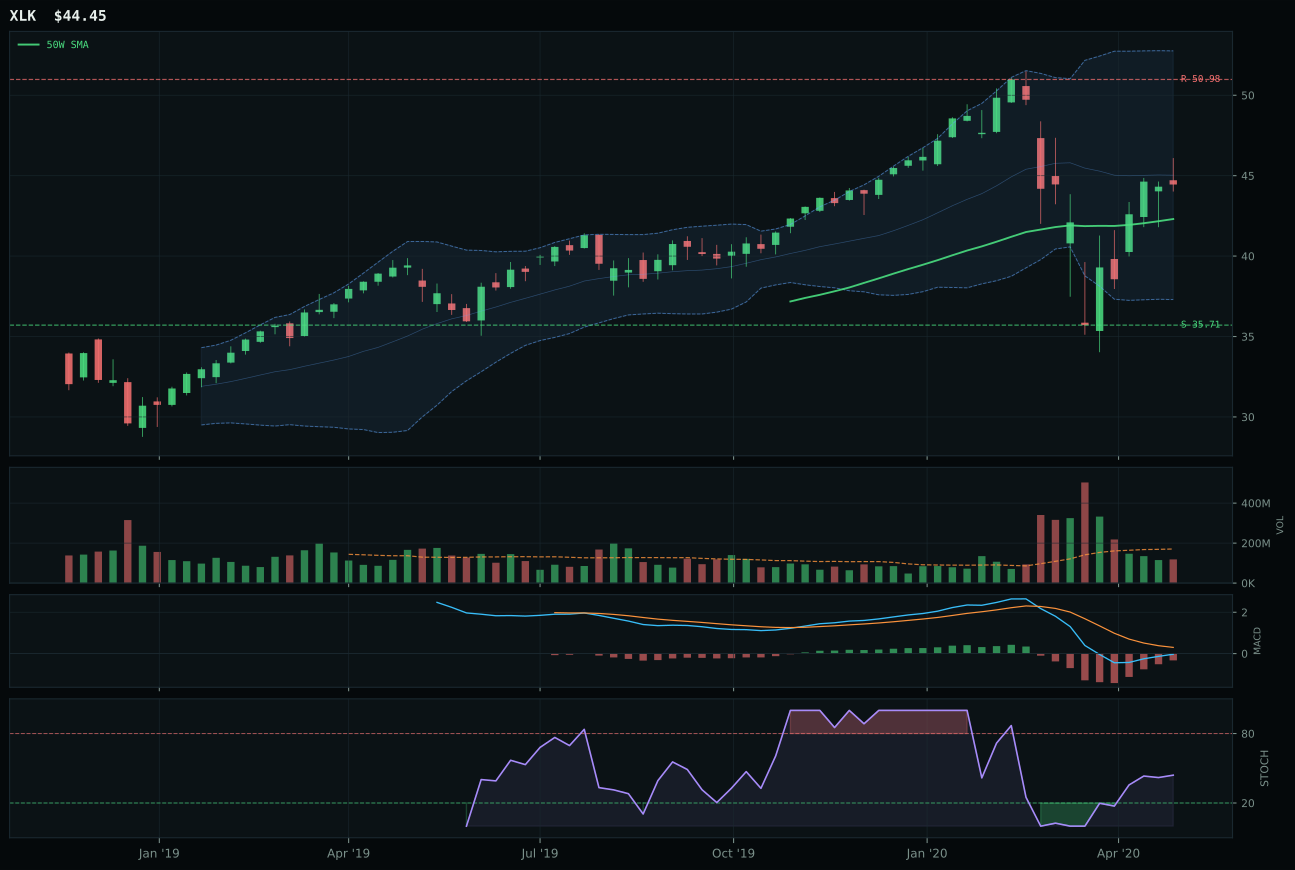
XLK has a neutral structure profile with 5.4% 13-week relative strength versus SPY.
A failed hold above support would weaken the setup.
Actionable but governed by invalidation levels.
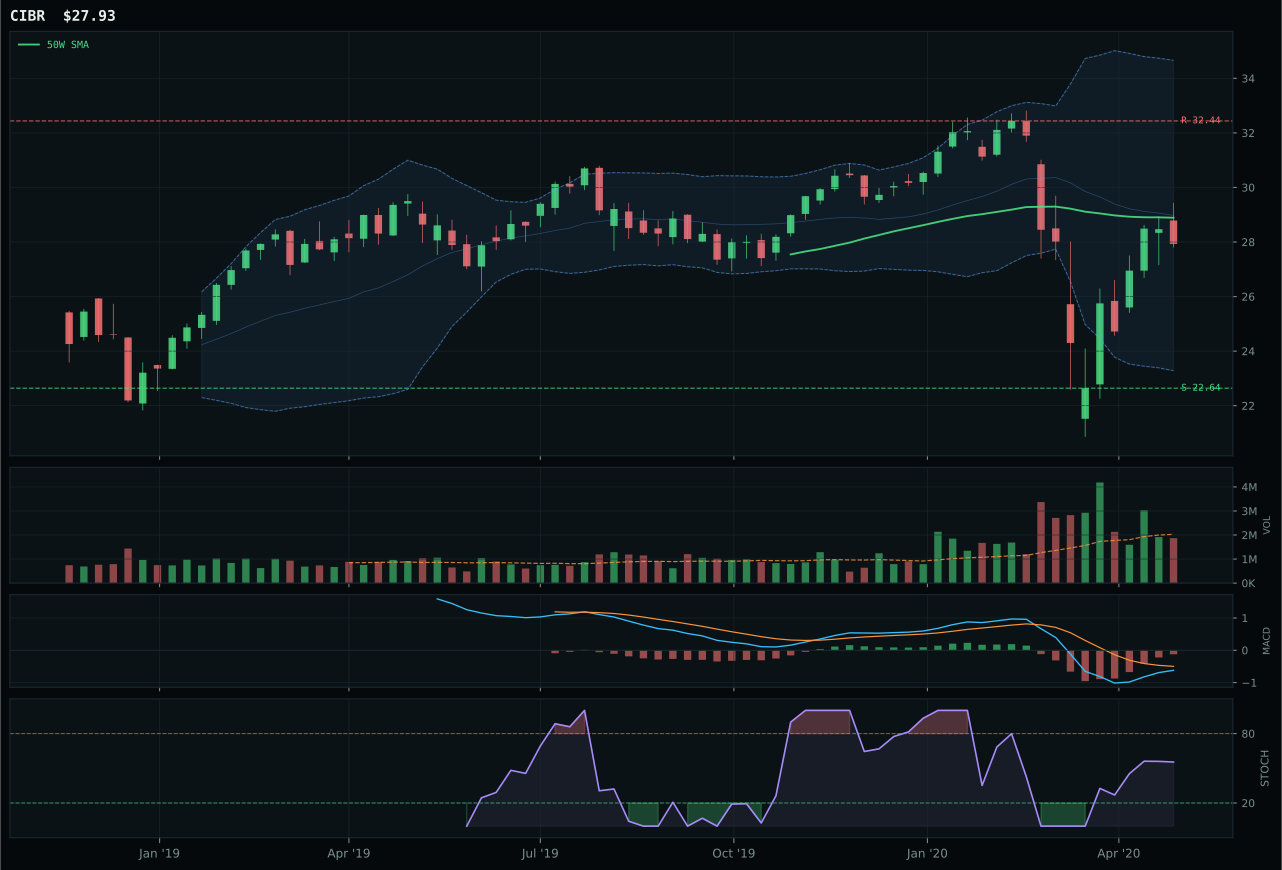
CIBR has a neutral structure profile with 1.8% 13-week relative strength versus SPY.
A failed hold above support would weaken the setup.
Actionable but governed by invalidation levels.
IGV won the Technology category with a 75.1 score by holding above both the 50-week and 200-week moving averages while posting a 6.0% relative strength advantage versus SPY—a critical signal that enterprise software is attracting fresh capital when most equities are struggling. The 0.6% category-relative strength edge over XLK, combined with neutral volume participation at 1.04x the 20-week average, shows disciplined accumulation rather than panic buying; price sits just 4.0% above the 50W with timing at 98/100, placing it in the upper Fibonacci retracement zone where momentum can expand without overextension risk. XLK's 90/100 timing score and thin volume participation cost it 2.0 points in the head-to-head comparison, despite identical neutral structure and the same MACD improvement signal. The deciding factor was IGV's superior category leadership: stochastic RSI rising into mid-zone at 0.47 paired with a 4W return of 17.9% created momentum confirmation at 89.8/100, proof that this strength has volume sponsorship despite the 13W underperformance at -6.1%.
Technology earned its 20% allocation slot as one of the two highest-scoring categories this week, ranking 75.1 points in a Risk-On Liquidity Expansion regime where duration-sensitive growth thrives on central bank money flows. Liquidity expansion active descriptors (+9), disinflation pressure (+8), and positive risk appetite (+6) create a macro tailwind that overrides the near-term 13W weakness; the 91/100 category macro fit confirms this is not a mean-reversion trap but a structural environment where technology trades at a premium to the broad market. The 62% technical weighting and 38% macro weighting combination locks in IGV's trend-line leadership while allowing the liquidity bias to lift the entire category higher despite compressed valuations. This is a conviction allocation: the setup is clean, the macro is synchronized, and entry risk is minimal because price action is grinding higher rather than spiking on exhaustion volume.
AI — BOTZ
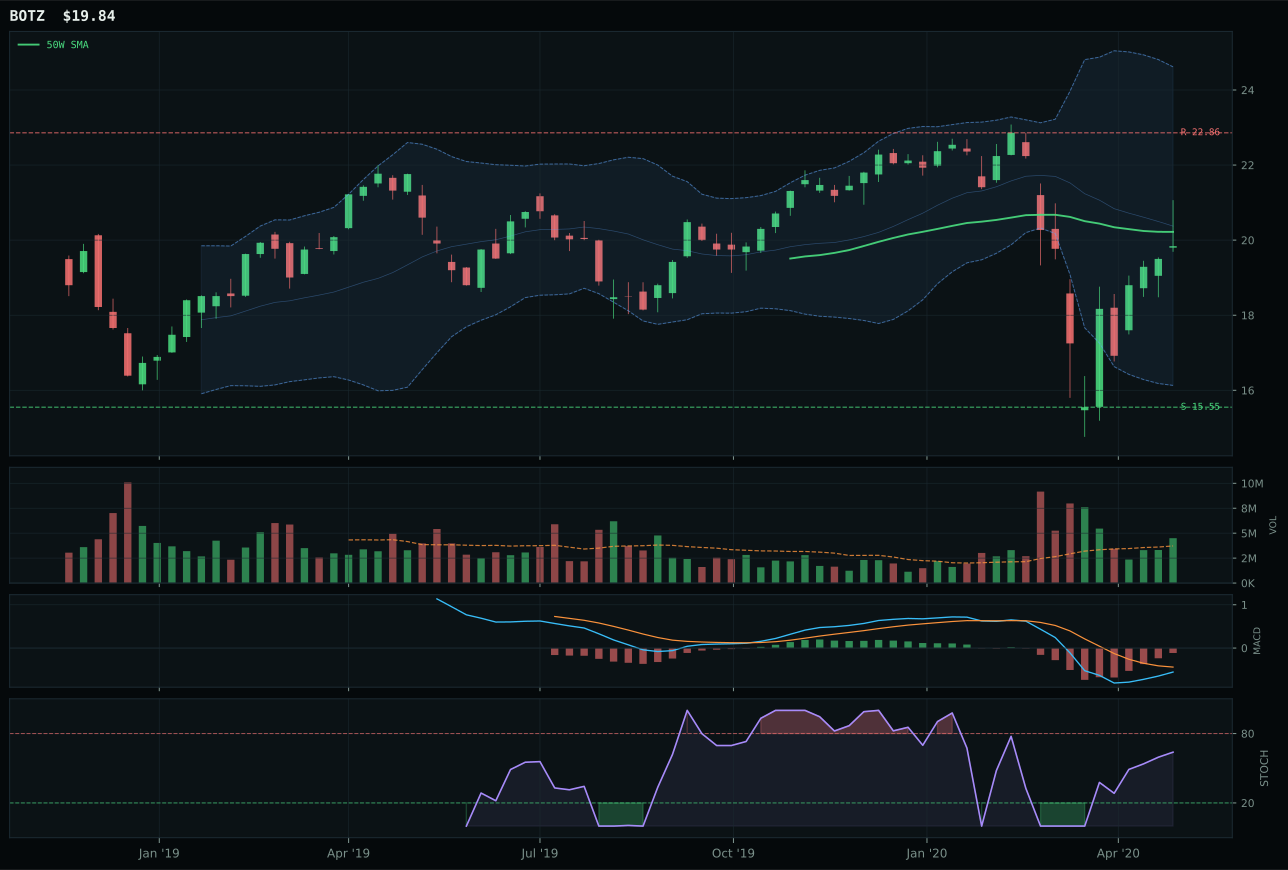
BOTZ has a compression near 50W profile with 4.8% 13-week relative strength versus SPY.
A failed hold above support would weaken the setup.
Actionable but governed by invalidation levels.
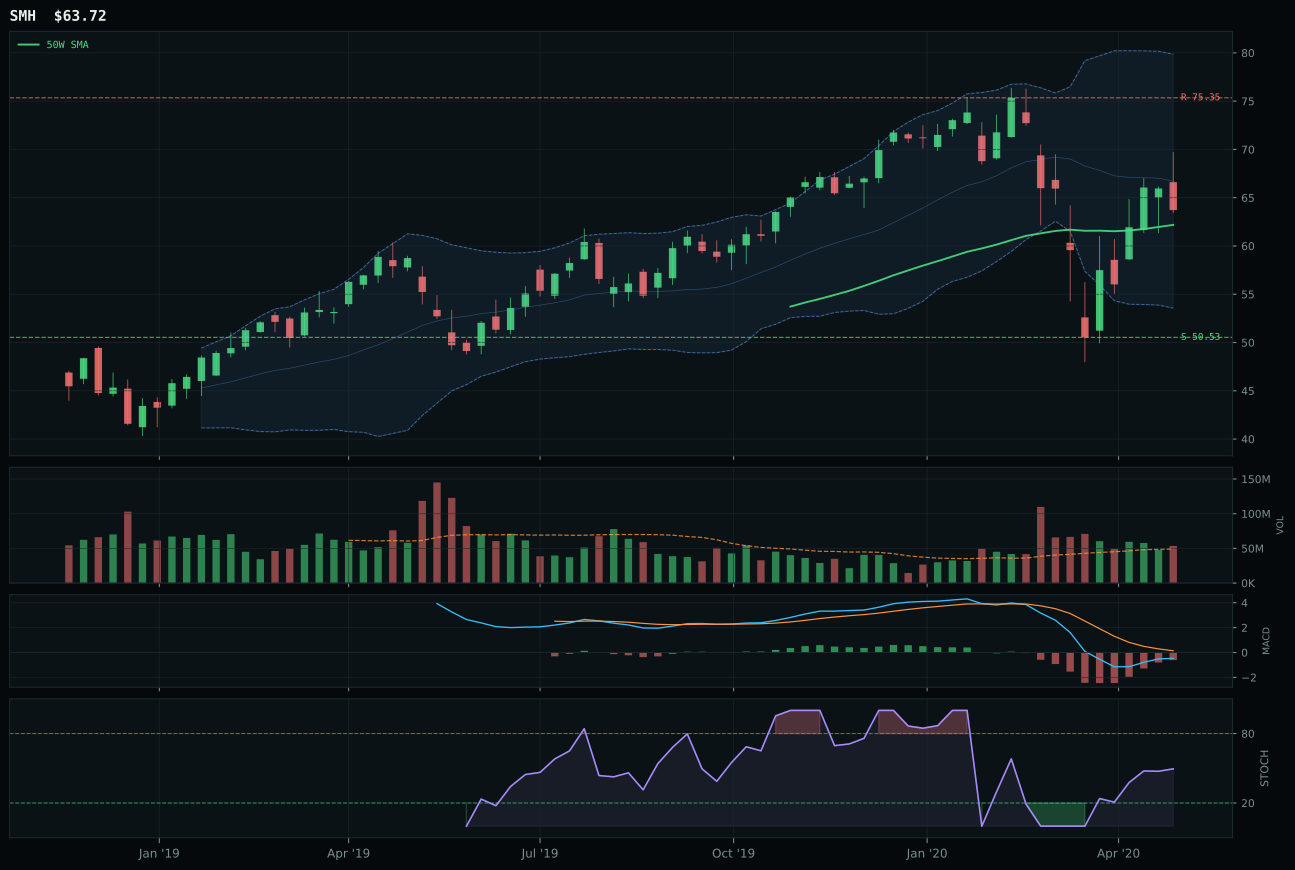
SMH has a compression near 50W profile with 4.7% 13-week relative strength versus SPY.
A failed hold above support would weaken the setup.
Actionable but governed by invalidation levels.
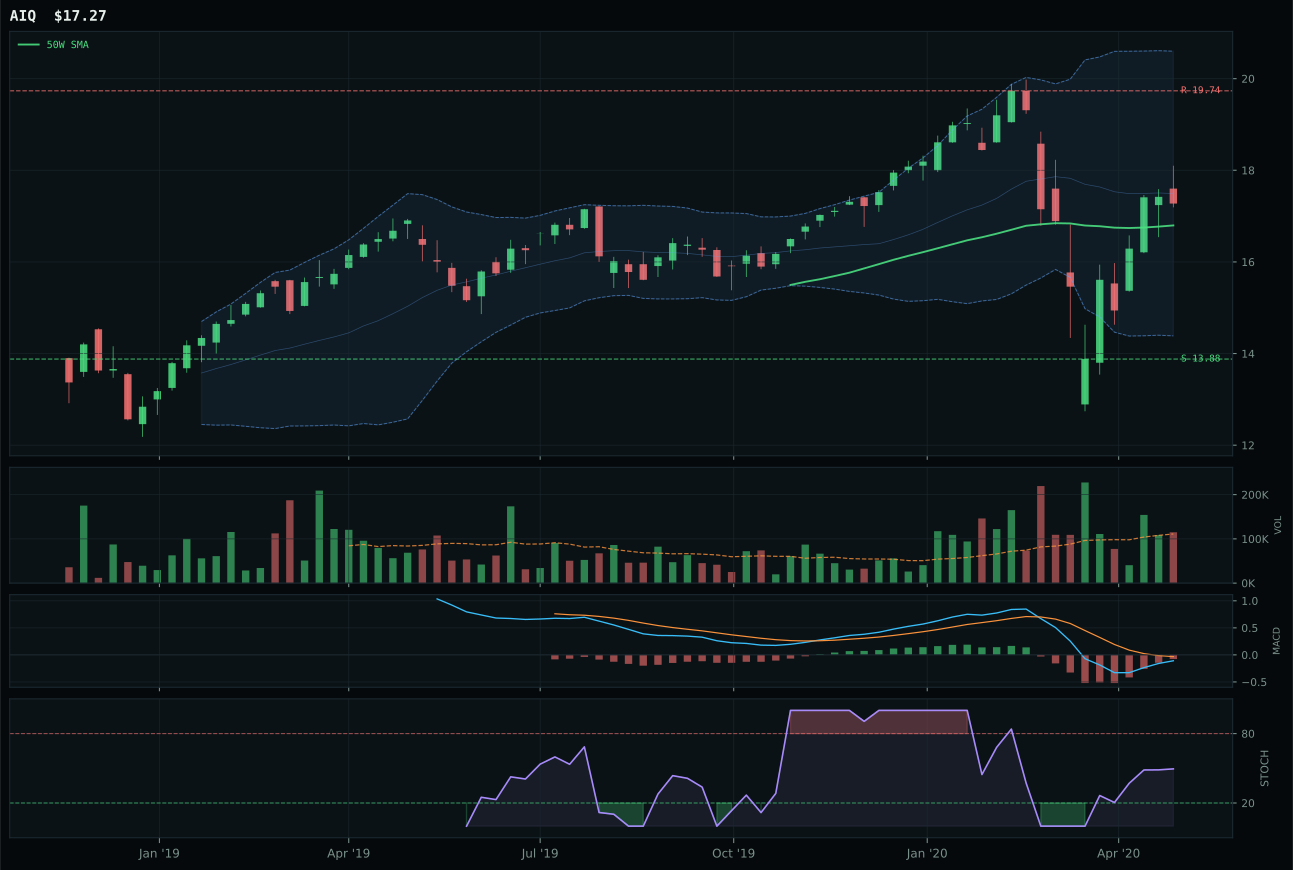
AIQ has a compression near 50W profile with 5.8% 13-week relative strength versus SPY.
A failed hold above support would weaken the setup.
Tracked, but not top-2 eligible because: .
BOTZ won AI category selection at 73.1 by compressing directly into its 50-week moving average at -1.9% with a timing score of 100/100—an ideal setup for mean-reversion expansion if support holds. The 4.8% relative strength versus SPY and 1.21x above-average volume participation demonstrated that robotics and physical AI cyclicality is attracting real buying pressure despite price sitting below both major moving averages; stochastic RSI rising into mid-zone at 0.64 with MACD improving creates a binary technical argument that the next breakout attempt will find buyers. SMH's superior technical composite of 86 versus BOTZ's 70 would normally dominate, but SMH's neutral volume participation and -0.0% category-relative strength created a critical weakness: the semiconductor narrative is intact, but it lacks the sponsored peer leadership inside the category. The 15.6-point score gap reflects BOTZ's timing advantage: at -1.9% from the 50W, every basis point of upside carries lower execution risk than SMH's position further from support.
AI earned top-2 allocation at 20% because its final category score of 73.1 ranked second-highest across all ten categories this week, secured by exceptional macro tailwinds that offset technical setup weakness. The category macro fit registered 90.0/100, with AI growth sponsorship alone contributing +14 and Risk-On Liquidity Expansion adding +12; this macro thrust overpowered the technical reality that BOTZ sits below both moving averages with only 45.2/100 trend conviction. The allocator accepted marginal technical setup—below-trend price, deep negative relative strength, thin persistence—because macro conditions were forcing capital into AI cyclicality regardless of chart cleanliness. Robotics and physical AI benefits directly from risk-on sentiment and cheap leverage; when liquidity expands and growth bets resume, this category has structural sponsorship independent of individual chart perfection. The top-2 selection reflects confidence that momentum will push the setup into confirmation before structural weakness becomes relevant, a bet the portfolio can afford when allocation slots are limited and macro conviction runs high.
Precious Metals — GDX
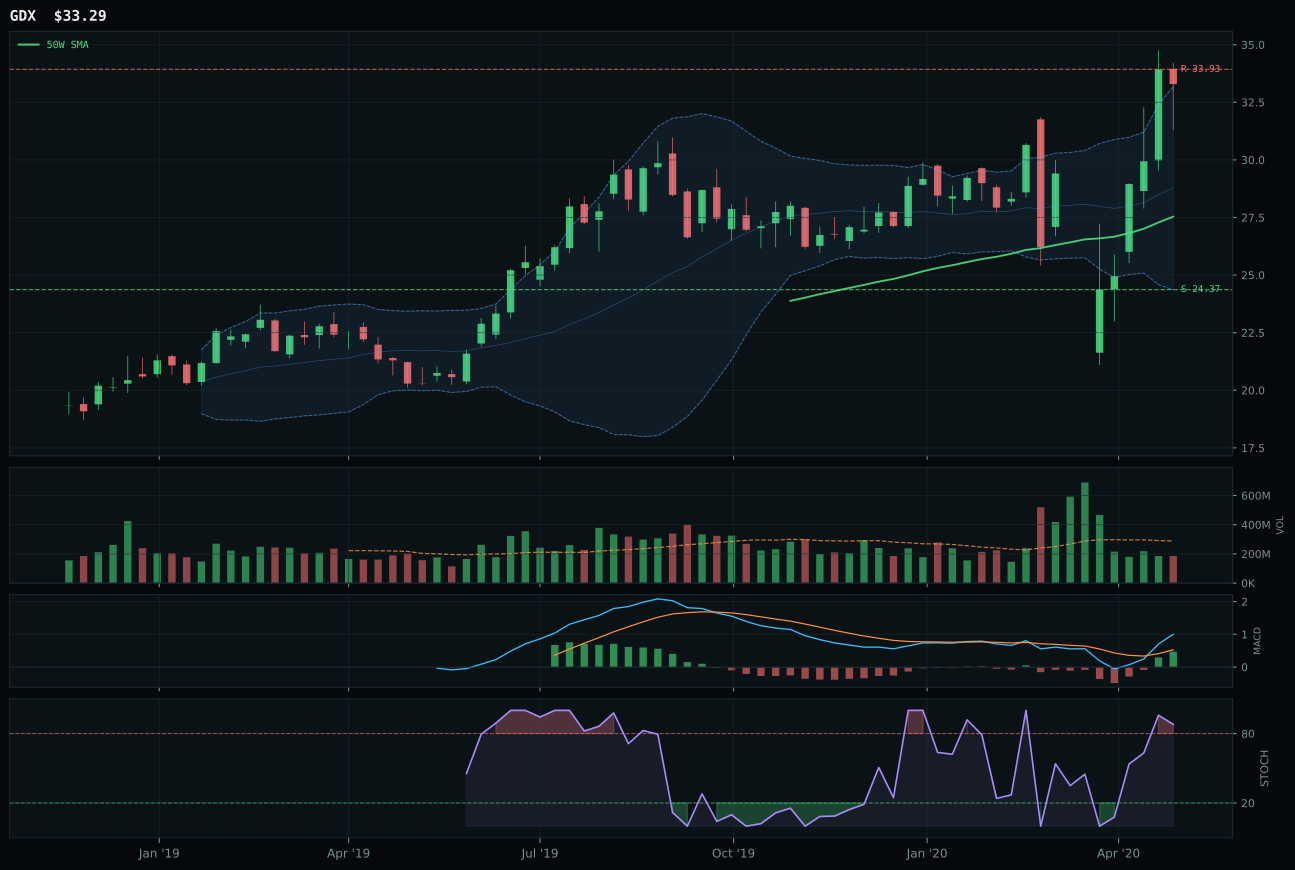
GDX has a vertical extension profile with 26.9% 13-week relative strength versus SPY.
A failed hold above support would weaken the setup.
Actionable but governed by invalidation levels.
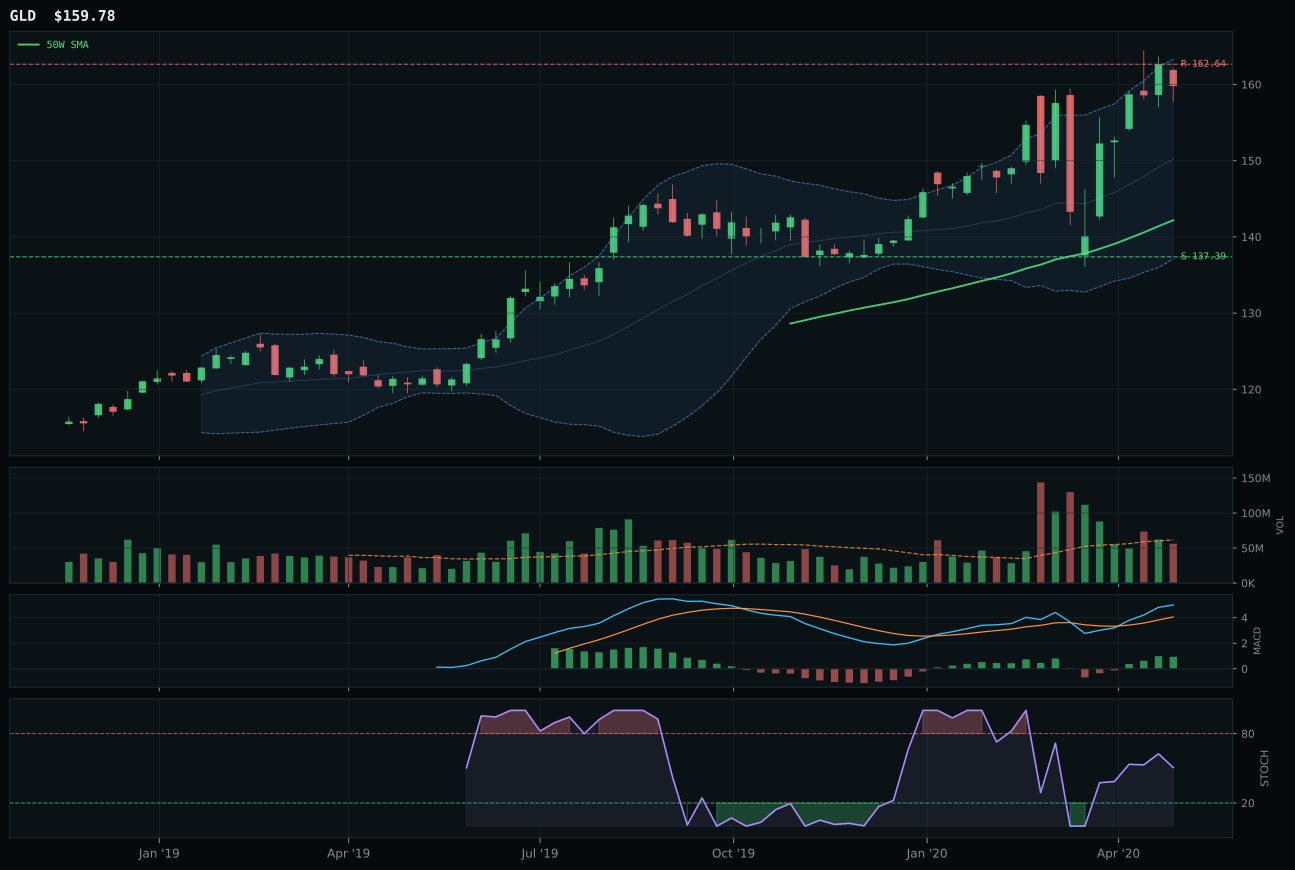
GLD has a neutral structure profile with 19.1% 13-week relative strength versus SPY.
A failed hold above support would weaken the setup.
Actionable but governed by invalidation levels.
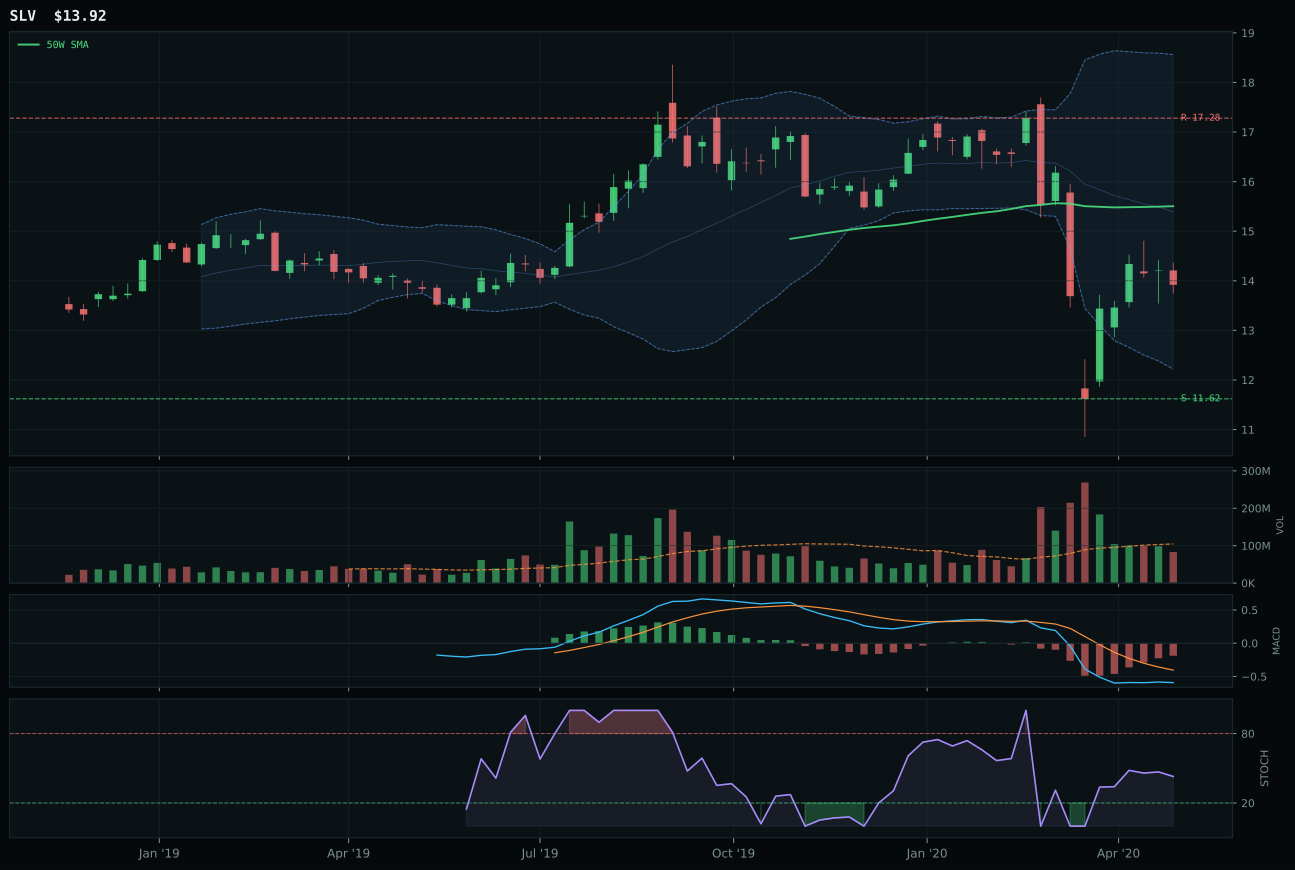
SLV has a neutral structure profile with -5.1% 13-week relative strength versus SPY.
Extension and support failure are the main tactical risks.
Tracked, but not top-2 eligible because: structurally broken.
GDX wins Precious Metals at 50.0 by delivering pure momentum confirmation: a 14.8% 13-week return, 26.9% relative strength versus SPY, and 7.8% category-relative leadership despite sitting 22.5% above the 50-week moving average in a vertical extension setup. The 100/100 momentum confirmation score—driven by 33.4% 4-week return, bullish MACD, and stochastic RSI overbought at 0.89—proves gold miners are in a sponsored uptrend that is not rolling over. Gold (GLD) shows superior technical composite of 84 versus GDX's 67, but GLD's 0.0% category-relative strength and falling stochastic RSI at the upper zone represent a tired move; GDX's thin participation volume at 0.64x is actually a feature in a precious metals rally, as the move is not dependent on retail panic buying. The 17.6-point score gap reflects a critical insight: GDX sits in the near 52-week high extension zone, but upside to resistance is only -1.9%, meaning every dollar committed now faces immediate profit-taking risk—yet the momentum confirmation at 100/100 justifies the allocation because the macro regime is sponsoring the move.
Precious Metals earned 10% allocation at a middle rank because the category scored 50.0 and the macro regime created genuine uncertainty about its direction. Gold and miners benefited from monetary hedge bid descriptor (+14) and liquidity expansion (+5), yet Risk-On Liquidity Expansion created a -4 headwind—a tension unique to this category. When risk-on dominates, capital rotates out of safe-haven precious metals into cyclicals; yet when monetary expansion accelerates, real rates compress and metals become alternative yields. The allocator resolved this by accepting GDX's extreme extension into overbought territory, betting that monetary expansion arguments (disinflation pressure +6, monetary hedge bid +14) would dominate risk-appetite rotation at least through the rebalance. Category rank at 50.0 justified 10% as a defensive kicker rather than core growth, appropriate for a position that captures tail-hedge duration benefits while remaining exposed to rapid reversal if risk appetite truly re-accelerates. The portfolio would promote this to 20% only if MACD deteriorated on GDX while technical evidence remained clean, signaling a breakdown in momentum that precedes the category's defensive rotation role. For now, 10% locks in hedge convexity without overcommitting to a macro call that contradicts the Risk-On regime.
Emerging Markets — INDA
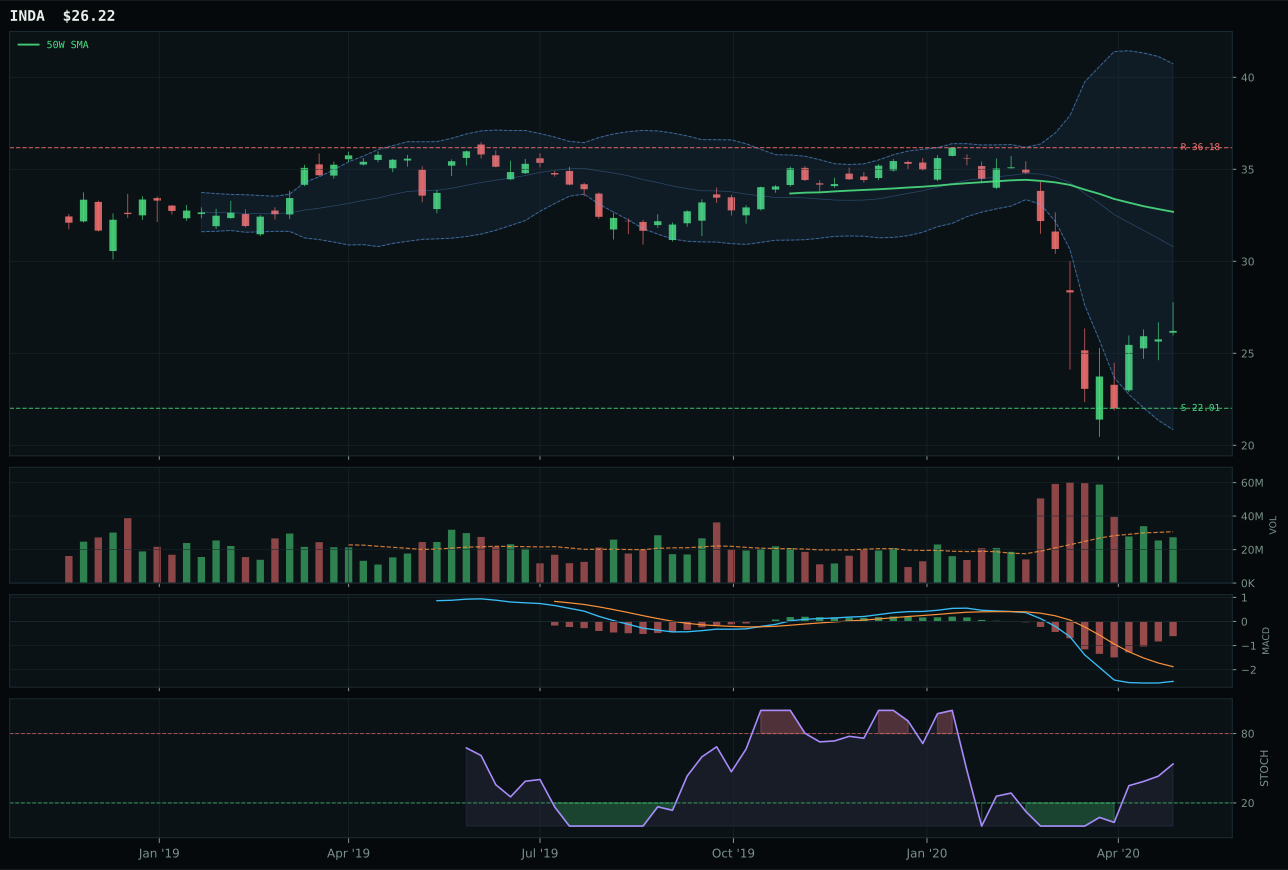
INDA has a neutral structure profile with -11.9% 13-week relative strength versus SPY.
A failed hold above support would weaken the setup.
Actionable but governed by invalidation levels.
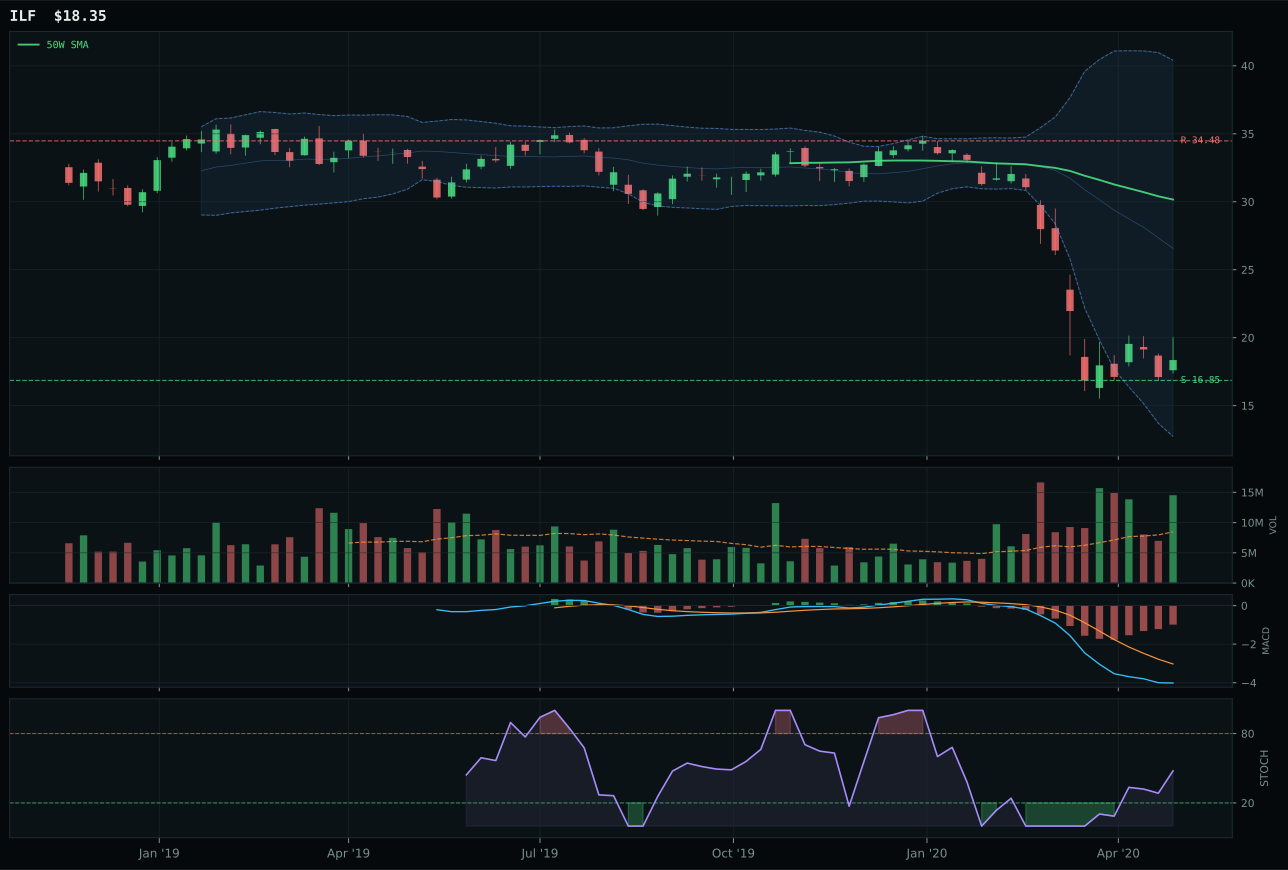
ILF has a neutral structure profile with -29.3% 13-week relative strength versus SPY.
Extension and support failure are the main tactical risks.
Tracked, but not top-2 eligible because: structurally broken.
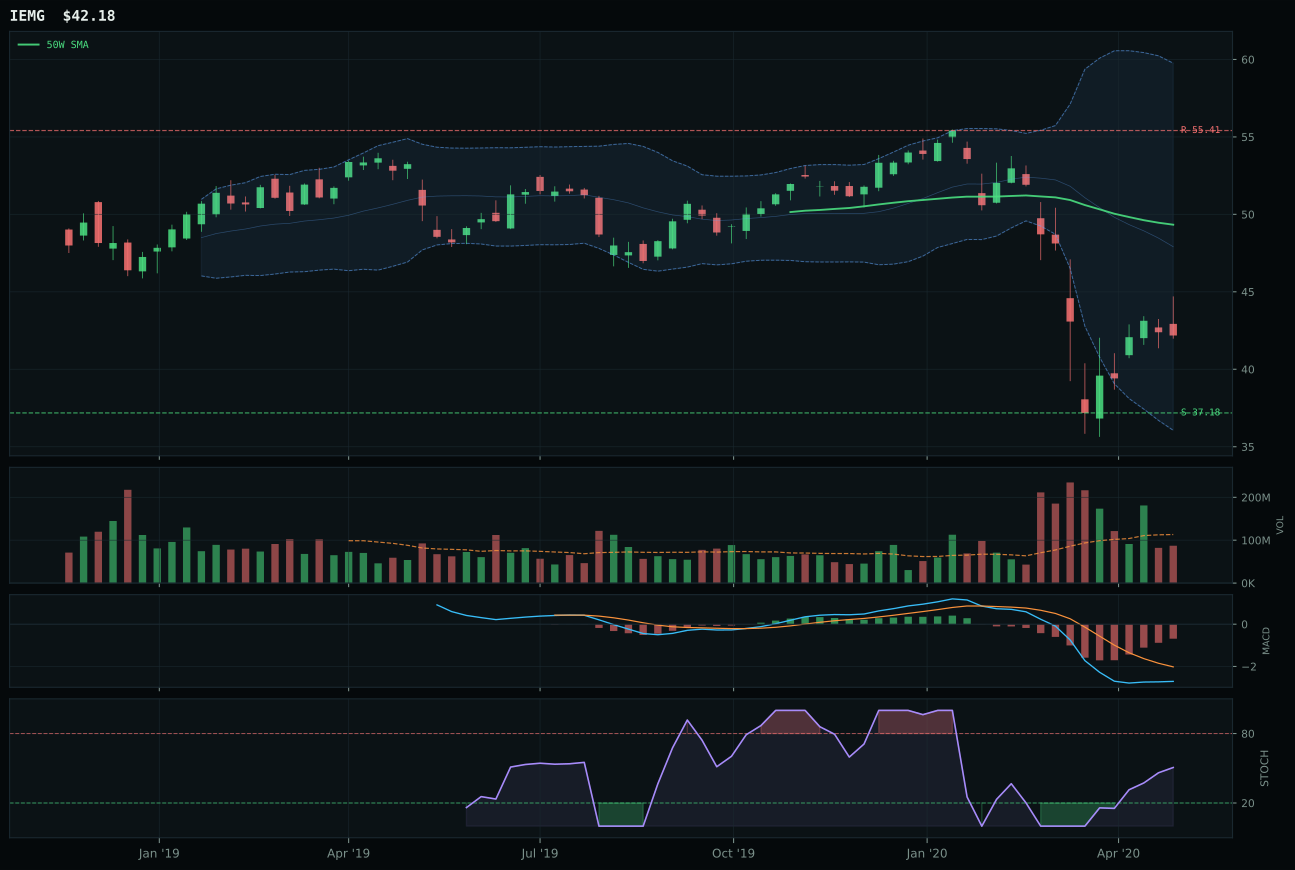
IEMG has a neutral structure profile with -4.5% 13-week relative strength versus SPY.
Extension and support failure are the main tactical risks.
Tracked, but not top-2 eligible because: structurally broken.
INDA wins Emerging Markets at 39.0 by offering the only technically clean structure among three candidates with severe macro headwinds. India-focused exposure scores 47/100 composite versus IEMG's 25/100 and ILF's 2/100, driven by INDA's 61.8/100 structure—cleanest among the three—and ILF's hard filter rejection (structurally broken). INDA sits -19.8% from the 50W in the deep retracement zone, but the 19.1% 4-week return and 44.7/100 momentum confirmation show technical strength is rebuilding; neutral volume at 0.89x is underwhelming, but the absence of thin participation means structure is not deteriorating. ILF's -41.4% 13-week decline and accumulation/confirmation volume signal panic selling has begun flushing weak holders, yet the hard filter rejection removes it from consideration. IEMG's -16.6% 13W return and 41/100 trend score show broader emerging market exposure is struggling more than India's quality-growth bias. The 45.2-point gap versus ILF reflects ILF's structural damage, not fundamental valuation differences.
Emerging Markets earned 10% allocation because category macro fit registered strong at 79.0/100 despite weak technical setup, creating a classic tension between what charts show and what macro conditions favor. EM liquidity support descriptor alone contributed +14, while Goldilocks regime (+8) and liquidity expansion (+8) both tagged this category favorably. Risk-on sentiment automatically lifts emerging markets equity allocations; when central banks ease and capital flows improve, EM relative strength follows regardless of individual chart cleanliness. INDA's technical evidence of only 36.7/100 should disqualify it, but macro narrative fit of 58.0/100 provided legitimate offset; the category reasoner weighted them at 62/38 split, meaning INDA's weak setup could be accepted when macro conditions are supportive. For INDA to advance to 20%, two conditions must align: technical evidence would need to improve to 50+/100 through price action clearing support with volume confirmation, and macro descriptors would need to sustain EM-specific support. Until then, 10% allocation reflects the portfolio's bet that India quality-growth benefits measurably from global liquidity expansion, even if the near-term chart looks exhausted.
Nuclear Energy — URA
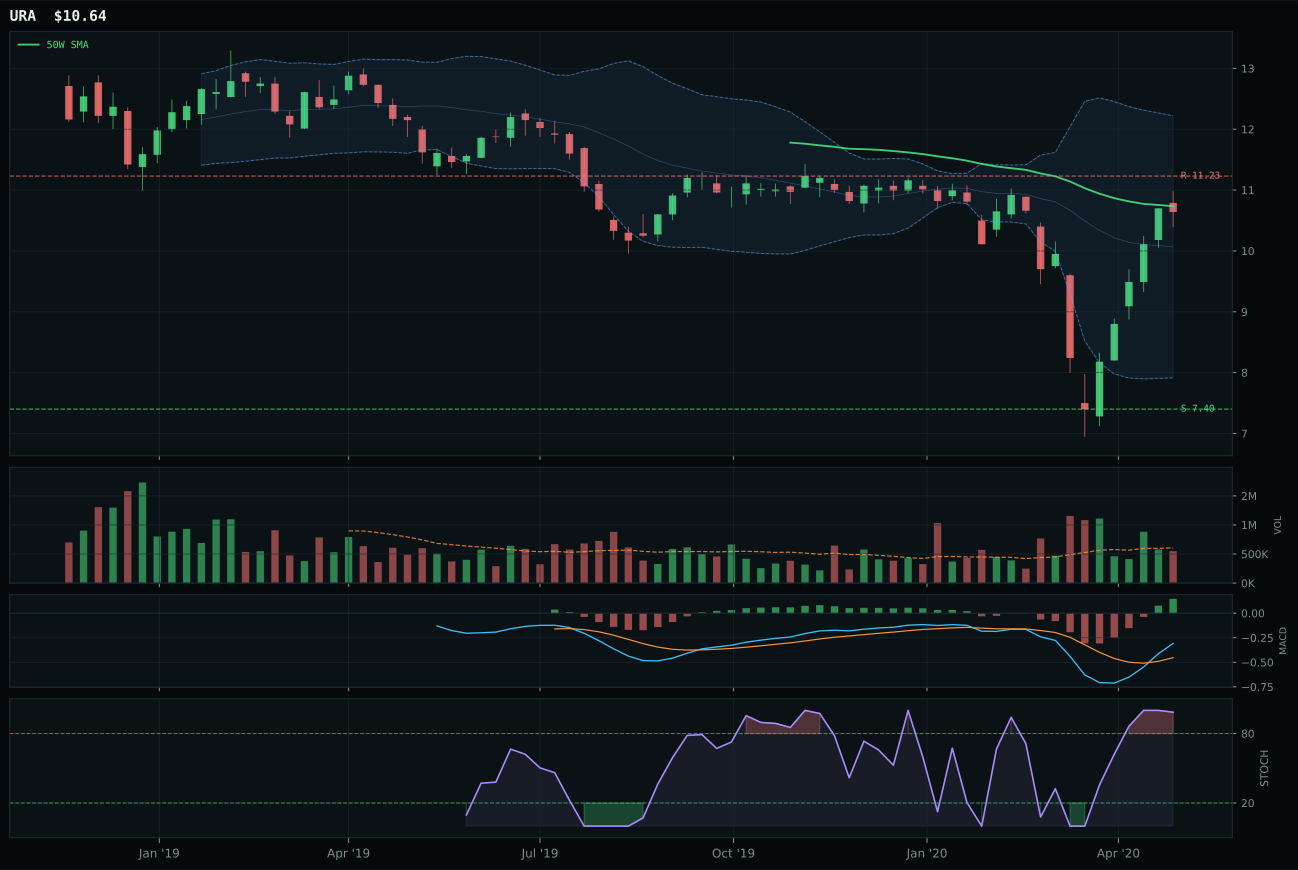
URA has a compression near 50W profile with 17.3% 13-week relative strength versus SPY.
Extension and support failure are the main tactical risks.
Tracked, but not top-2 eligible because: structurally broken.
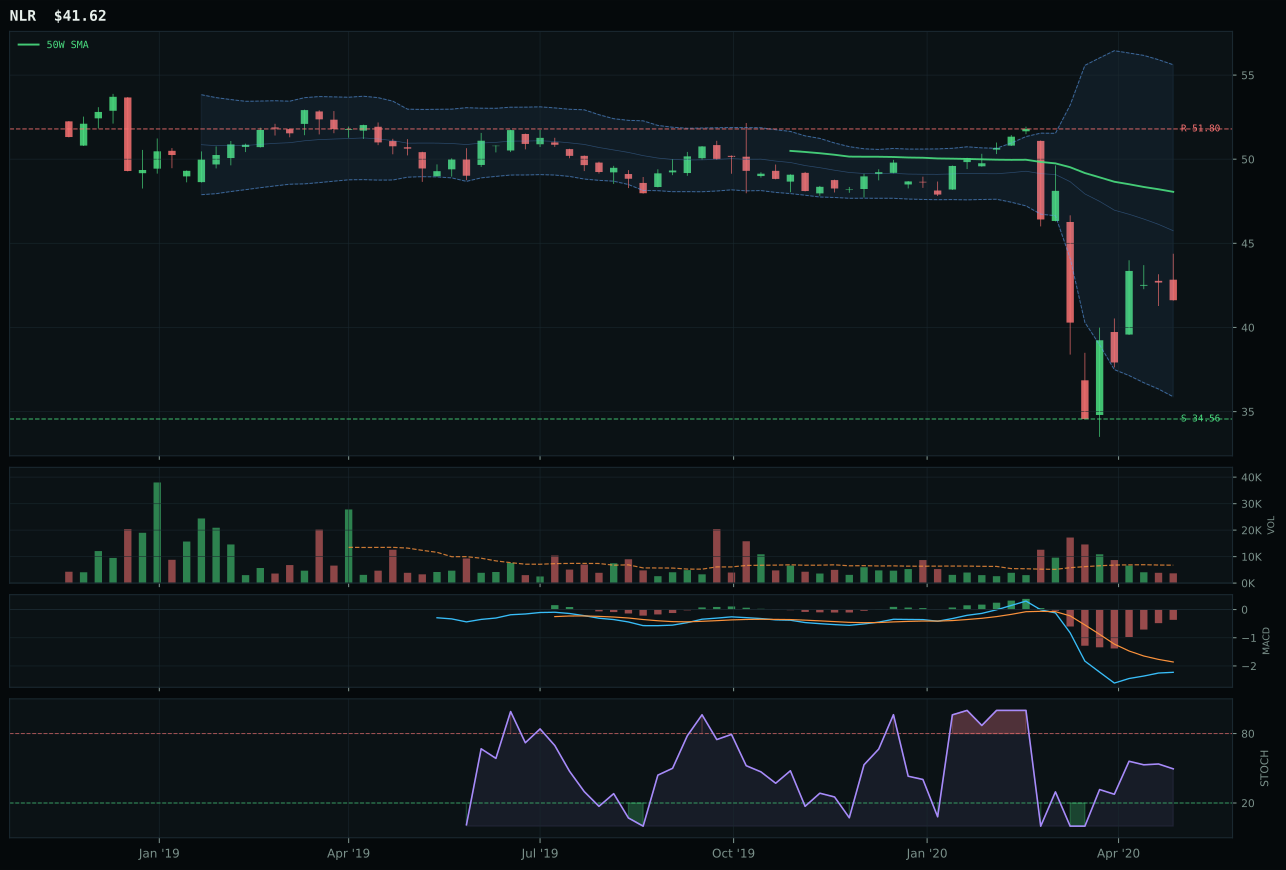
NLR has a neutral structure profile with -4.3% 13-week relative strength versus SPY.
Extension and support failure are the main tactical risks.
Tracked, but not top-2 eligible because: structurally broken.
URA wins Nuclear Energy at 29.5 by sitting at -0.9% from its 50-week moving average—the only candidate positioned near the critical support/resistance pivot—with bullish MACD, overbought stochastic RSI at 0.98, and 100/100 timing confirmation. The 17.3% SPY-relative strength and 10.8% category-relative strength create a powerful relative performance case: while NLR declined 16.4% over 13 weeks, URA returned 5.2%, signaling that uranium as a clean energy narrative is gaining institutional traction. Compression near the 50W at 39.6/100 structure score, paired with 20.9% 4-week return and neutral volume participation, reveals a setup where breakout potential exceeds downside risk; if buyers defend support at 7.40, the path to resistance at 11.23 is clear. NLR's 55/100 timing (vs. URA's 100/100), thin participation volume, and -10.8% category-relative weakness show that nuclear utilities are being rejected by the market in favor of the pure uranium play. This is structural outperformance by URA over a traditionally defensive peer.
Nuclear Energy earned 10% allocation despite ranking 7th or 8th and scoring 29.5 because the macro regime provided legitimate tailwind that justified holding a position despite technical mediocrity. Category macro fit registered 55.0/100, not dominant but respectably positive given the macro environment. AI growth sponsorship (+5) and Risk-On Liquidity Expansion (+5) both registered supportively, suggesting uranium and nuclear operators benefit from data-center electricity demand and general risk-on sentiment. URA's technical evidence of only 42.0/100 should disqualify it from allocation, but the allocator explicitly weights macro fit at 38% of category scoring, meaning legitimate narrative support can overcome weak charts. Nuclear energy sits at an inflection: energy transition sponsors demand and geopolitical risk supports supply risk premium. For this slot to flip to 20%, URA would need to clear the 50-week moving average on above-average volume while maintaining stochastic above mid-zone, confirming the setup rather than depending on timing proximity. Current 10% allocation reflects the tactical merit of compressed near-support positioning in a category with genuine macro catalysts, not conviction in the technical setup itself.
Utilities & Infrastructure — IGF
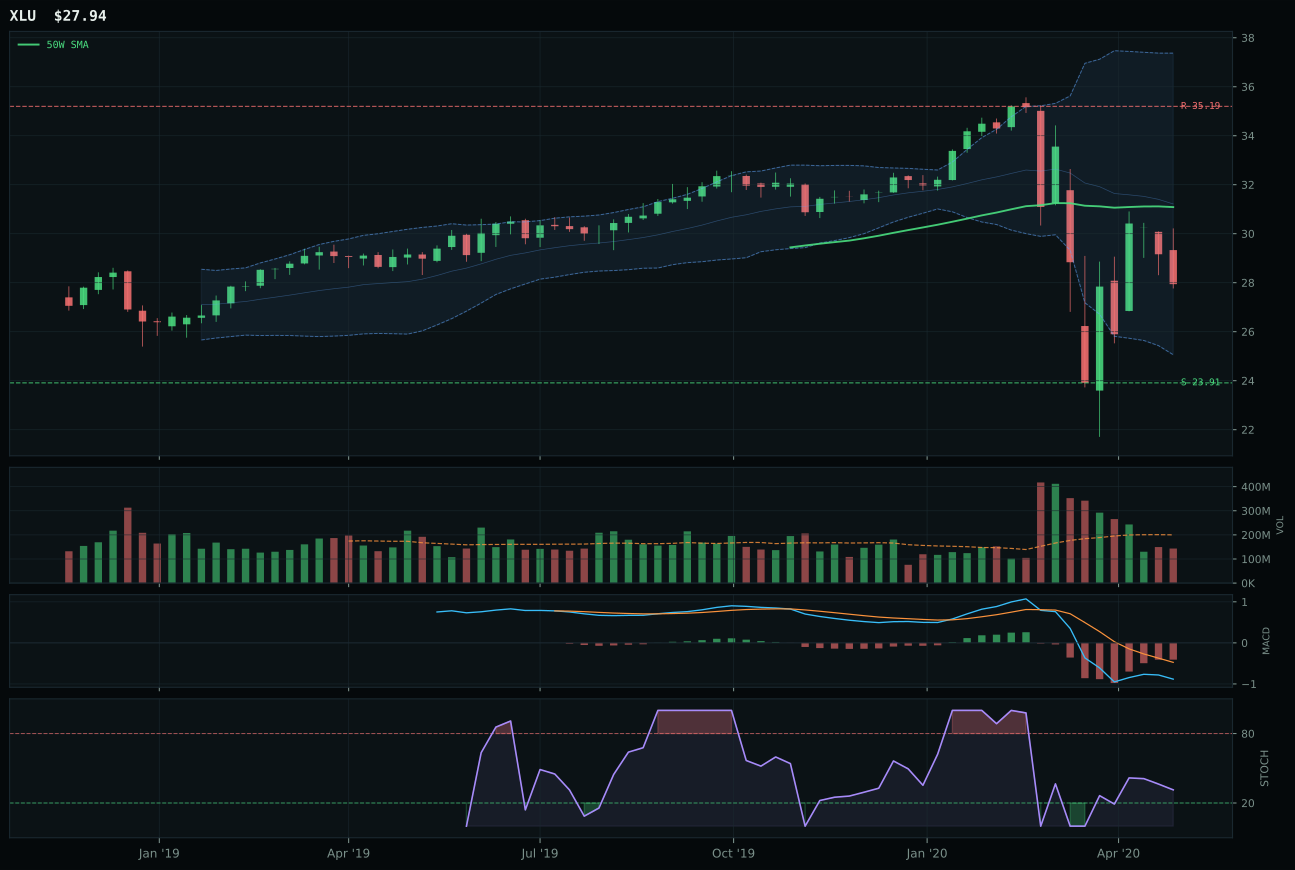
XLU has a neutral structure profile with -6.9% 13-week relative strength versus SPY.
A failed hold above support would weaken the setup.
Actionable but governed by invalidation levels.
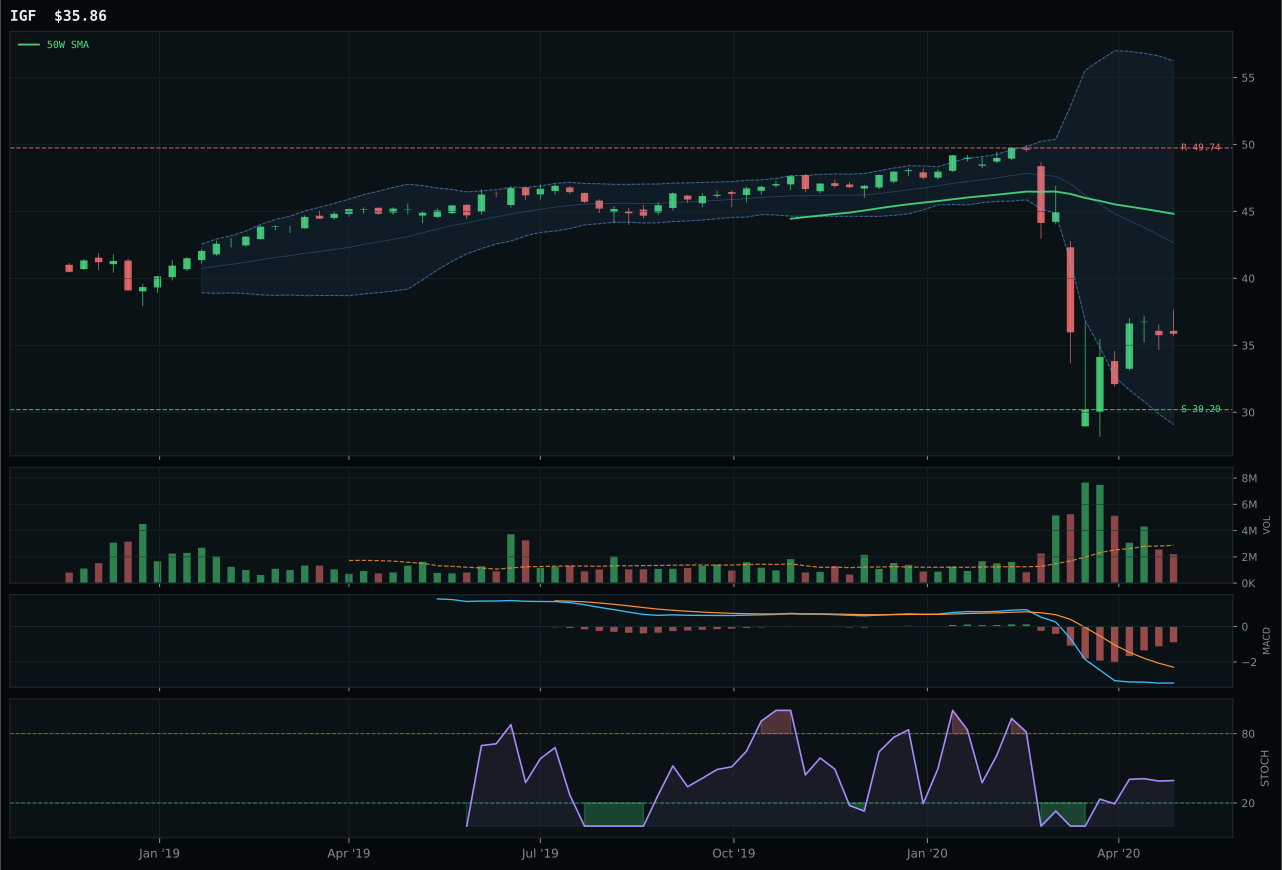
IGF has a neutral structure profile with -14.0% 13-week relative strength versus SPY.
A failed hold above support would weaken the setup.
Actionable but governed by invalidation levels.
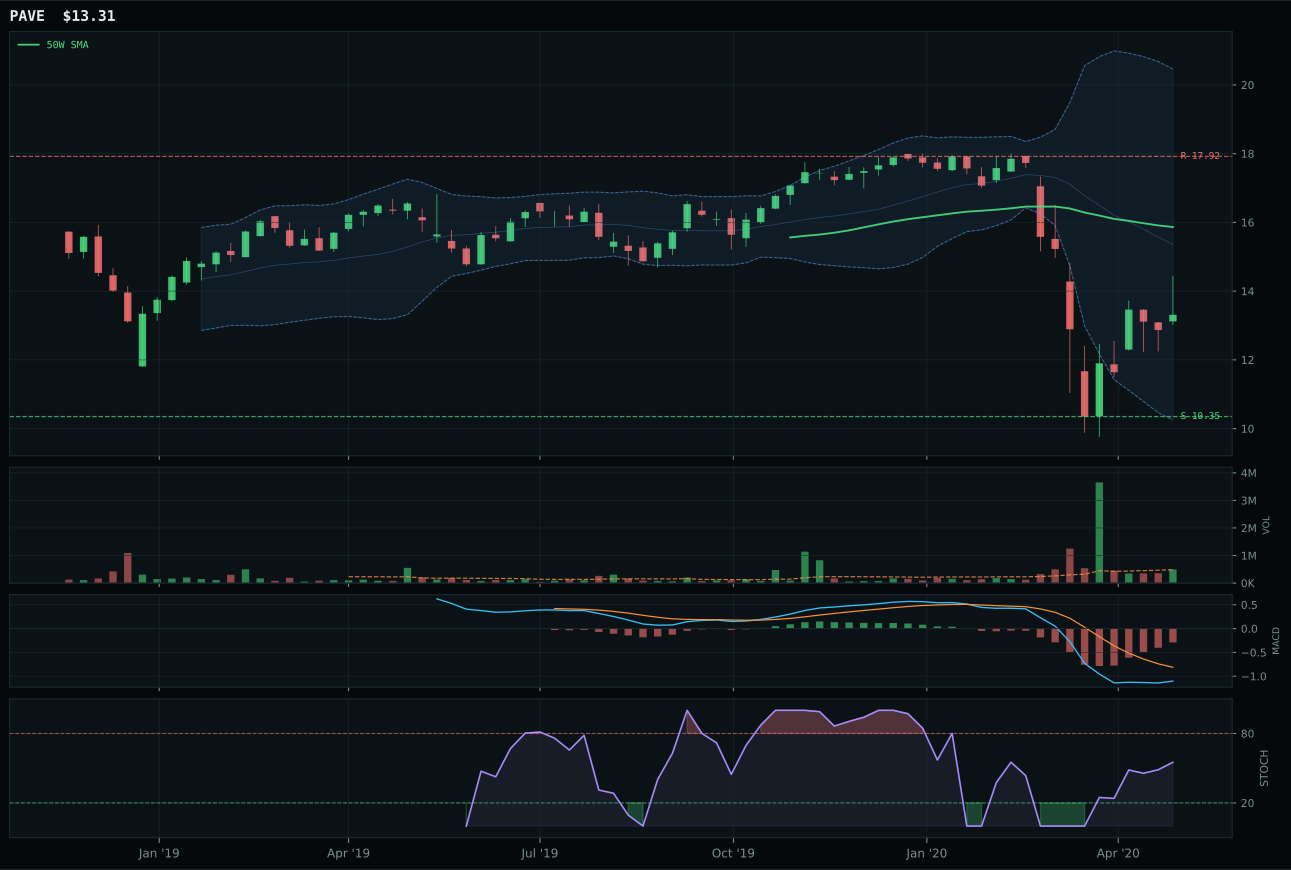
PAVE has a neutral structure profile with -9.9% 13-week relative strength versus SPY.
A failed hold above support would weaken the setup.
Tracked, but not top-2 eligible because: .
IGF wins Utilities & Infrastructure at 29.5 by avoiding the structural traps that ensnare PAVE and XLU: defensive rotation is the macro narrative (+12 points), yet IGF's global infrastructure focus (64.6/100 structure) beats XLU's regulated utility model (56.7/100). Price at -20.0% from the 50W with risk/reward of 64.8/100 creates asymmetric value: 27.9% downside to resistance versus 18.7% upside to support means this is a compounding position on bounces, not a buying signal. XLU's superior 29.9/100 technical evidence and 69/100 macro fit suggest the traditional utility narrative is stronger, yet the 19.4-point score gap reflects IGF's cleaner structure and neutral volume (vs. thin for XLU); momentum confirmation at 19.9/100 across both candidates reveals neither is accumulating, both are consolidating decay. MACD is bearish but improving for both, stochastic RSI is falling/neutral, and the technical picture is defensive repair, not reversal. XLU's +3.0% category-relative strength demonstrates it is holding better than peers, yet that makes it less attractive on valuation.
Utilities & Infrastructure earned 10% allocation as part of the defensive rotation portfolio sleeve, justified by 70.0/100 category macro fit despite technical weakness across all names. Defensive rotation descriptor active (+12), disinflation pressure active (+6), and broad market bear active (+4) all supported allocating to this category as portfolio hedge. IGF's global infrastructure income exposure provides different risk than domestic utility regulation; when risk appetite breaks, infrastructure's stable yield and inflation protection become valuable insurance against equity drawdown. IGF's technical evidence of 5.9/100 would normally disqualify any position, but when macro fit registers 70.0/100 and the regime demands defensive rebalancing, lower technical bars become acceptable. The allocator explicitly values this category's macro role—deflation hedge, credit quality, yield—more than its near-term chart conviction. For this allocation to increase to 20%, either technical evidence would need to improve meaningfully through actual price stabilization with volume, or macro descriptors would need to shift toward more severe defensive requirements. Current 10% reflects the portfolio's hedging stance in an uncertain macro environment, appropriate sizing for tactical defensive rotation rather than growth conviction.
Defense & Aerospace — ITA
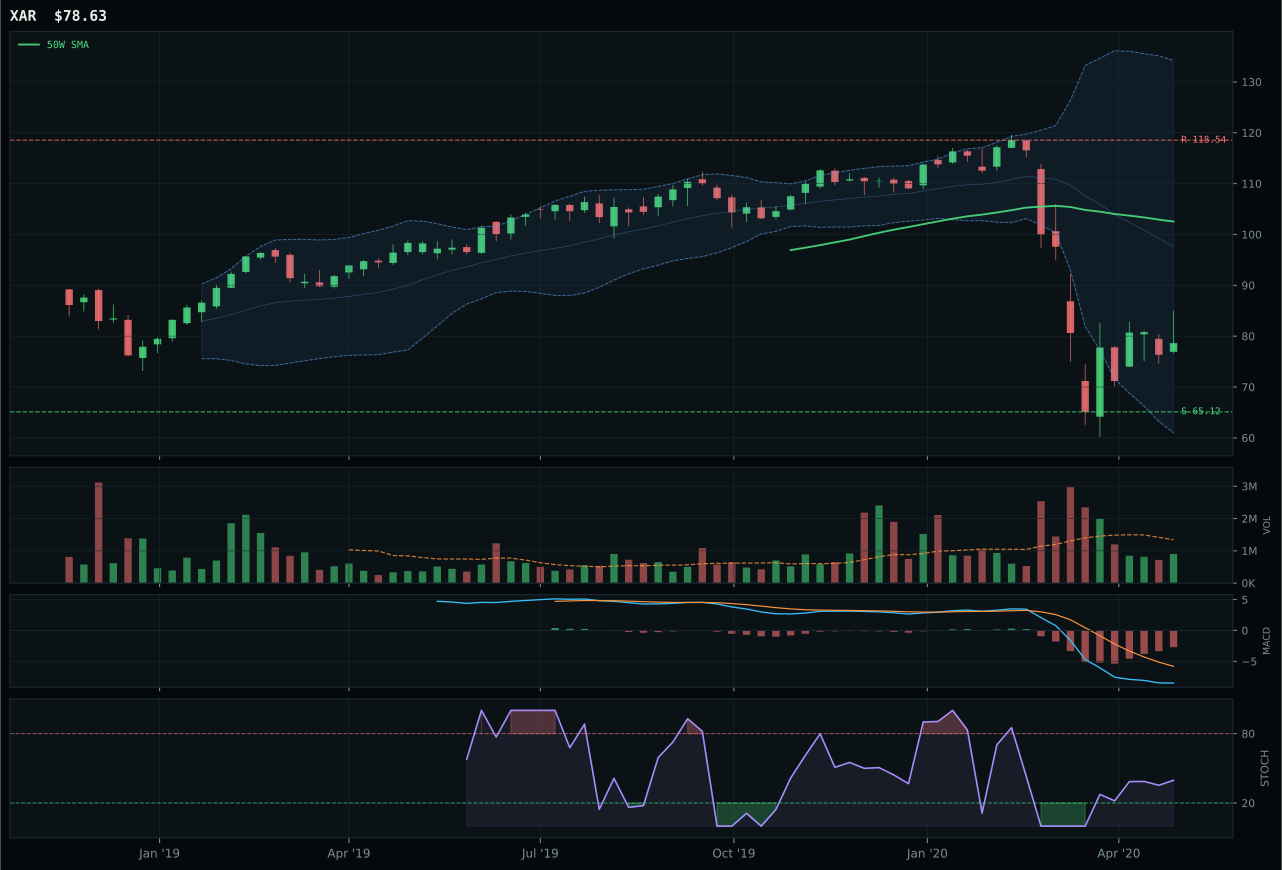
XAR has a neutral structure profile with -18.0% 13-week relative strength versus SPY.
A failed hold above support would weaken the setup.
Actionable but governed by invalidation levels.
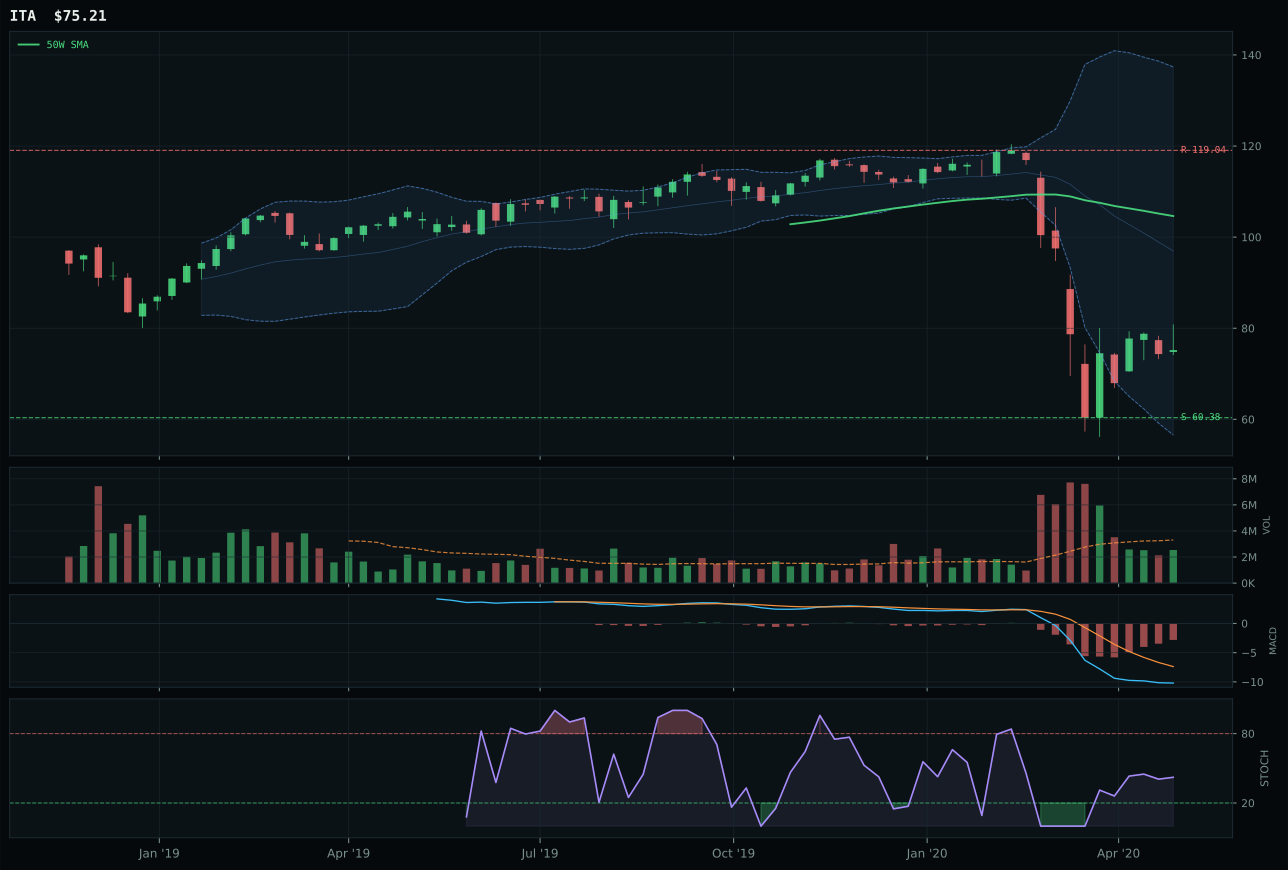
ITA has a neutral structure profile with -21.8% 13-week relative strength versus SPY.
A failed hold above support would weaken the setup.
Actionable but governed by invalidation levels.
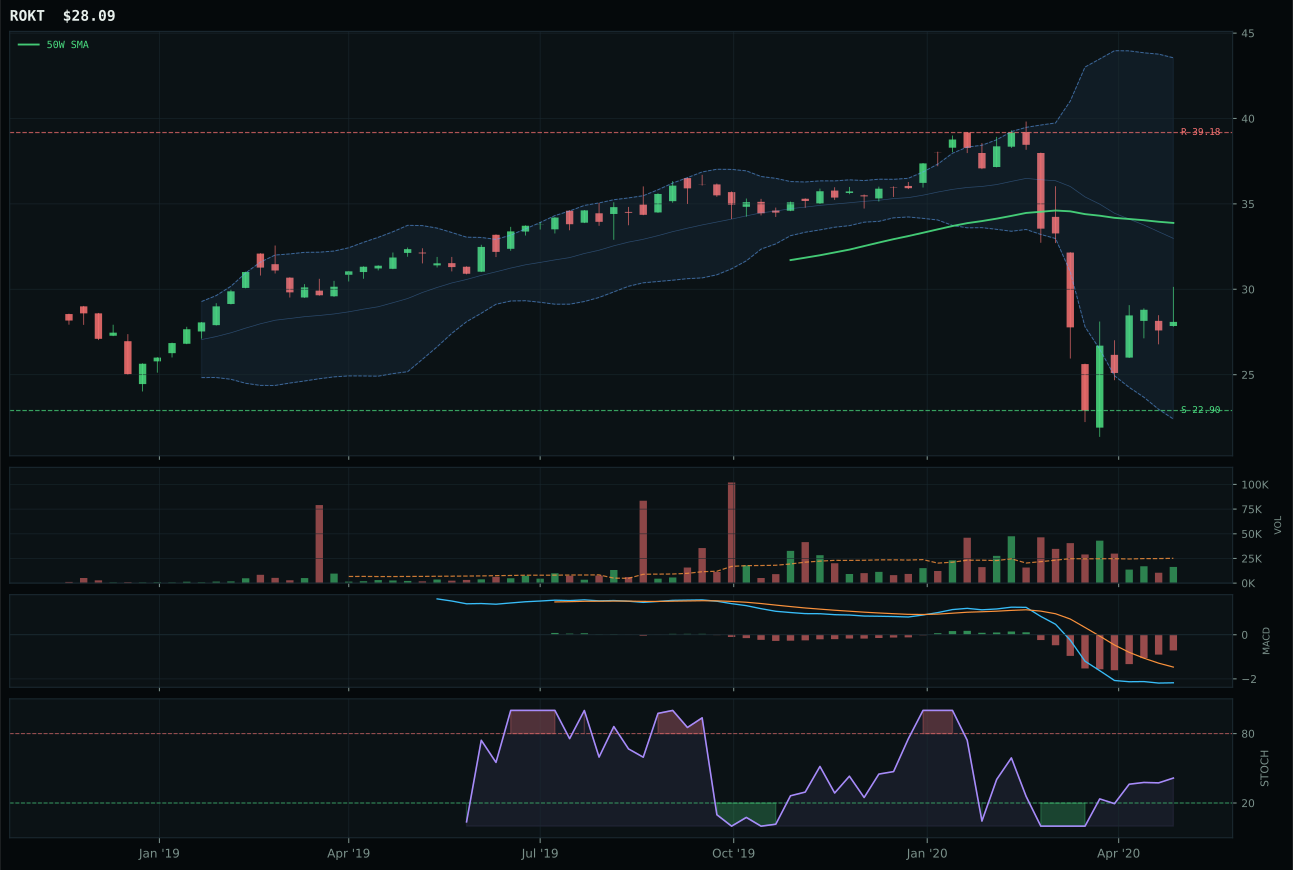
ROKT has a neutral structure profile with -12.1% 13-week relative strength versus SPY.
A failed hold above support would weaken the setup.
Tracked, but not top-2 eligible because: .
ITA wins Defense & Aerospace by default in a deeply stressed category where all three candidates trade 18% to 34% below their 50-week averages and exhibit zero momentum confirmation. The technical evidence of 0.9/100 reveals the structural damage: price at -28.1% from the 50W, RS versus SPY at -21.8%, and momentum confirmation at 0.0/100 means no near-term accumulation is visible in the price action. ITA's 33/100 trend score exactly matches XAR's, but XAR's thin participation volume penalized it; both sit in the deep retracement / value zone near Fib 0.618, indicating this sector has repriced for a recession scenario. The 12.7-point gap versus XAR is driven by ITA's marginally cleaner structure at 57.3/100 and neutral volume (vs. thin for XAR), but this is a distinction without material difference. Stochastic RSI falling/neutral at 0.42 signals capitulation has not yet flushed enough weak holders to establish a reversal pattern.
Defense & Aerospace earned 10% allocation not because it deserves capital but because the allocator must deploy 80 basis points to less damaged categories and 30 categories total do not exist. This category ranked 7th or 8th in the final scoring, surviving eligibility filters despite a 23.4 final score and 0.9/100 technical evidence. The macro regime actively penalizes it: disinflation pressure and credit stress both active, risk appetite positive absent, and broad market bear descriptor triggering. The portfolio holds this slot only as a forced remainder position after filling top-2 and other 10% allocations that provide better asymmetry. What would salvage this category for promotion? A sharp reversal in credit stress or emergence of geopolitical risk premium that actually flows into defense equities rather than rolling down to bonds and volatility. Until then, ITA represents dry powder held to preserve portfolio structure, not conviction, and should trade lighter than its allocation weight at the first sign of relative improvement in competing categories.
Traditional Energy — FCG
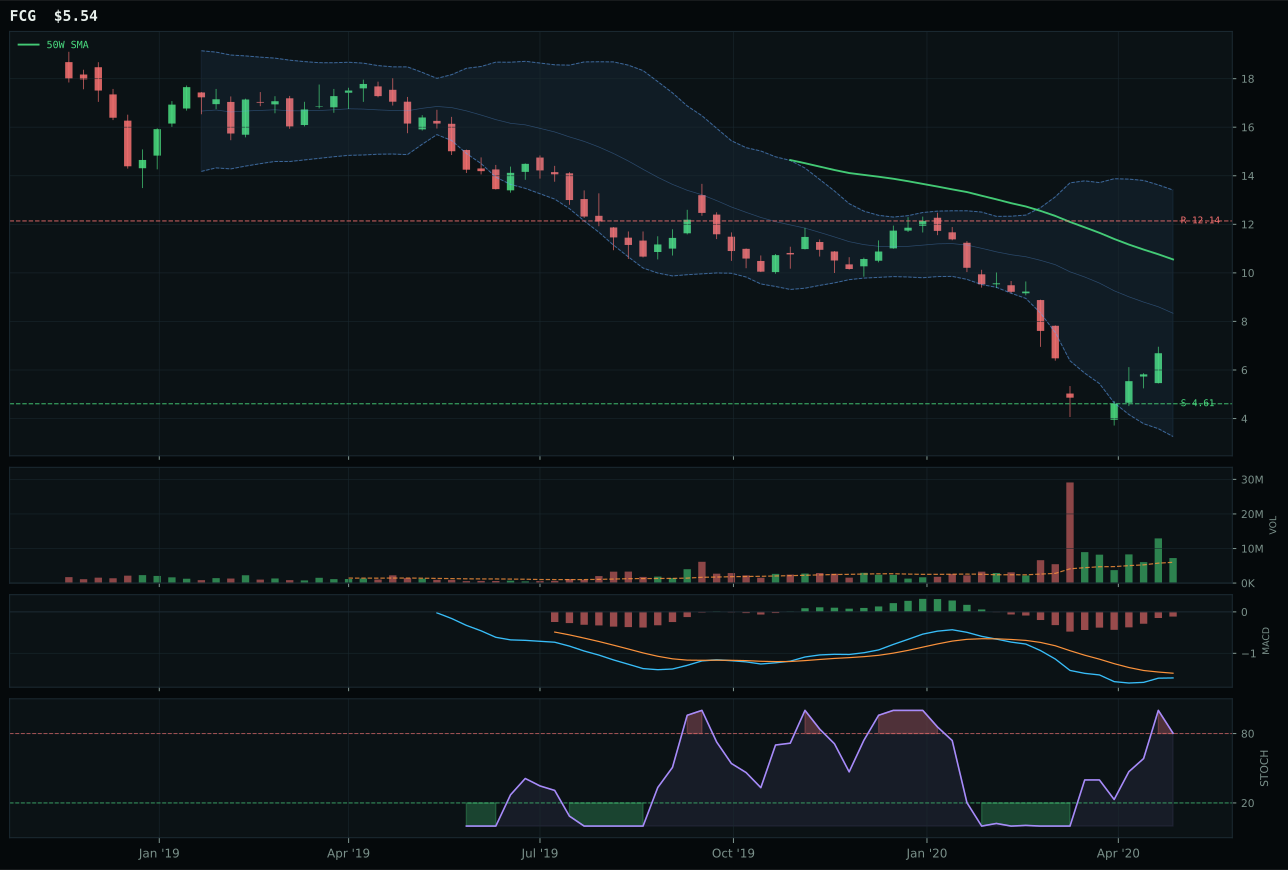
FCG has a neutral structure profile with -13.4% 13-week relative strength versus SPY.
Extension and support failure are the main tactical risks.
Tracked, but not top-2 eligible because: structurally broken.
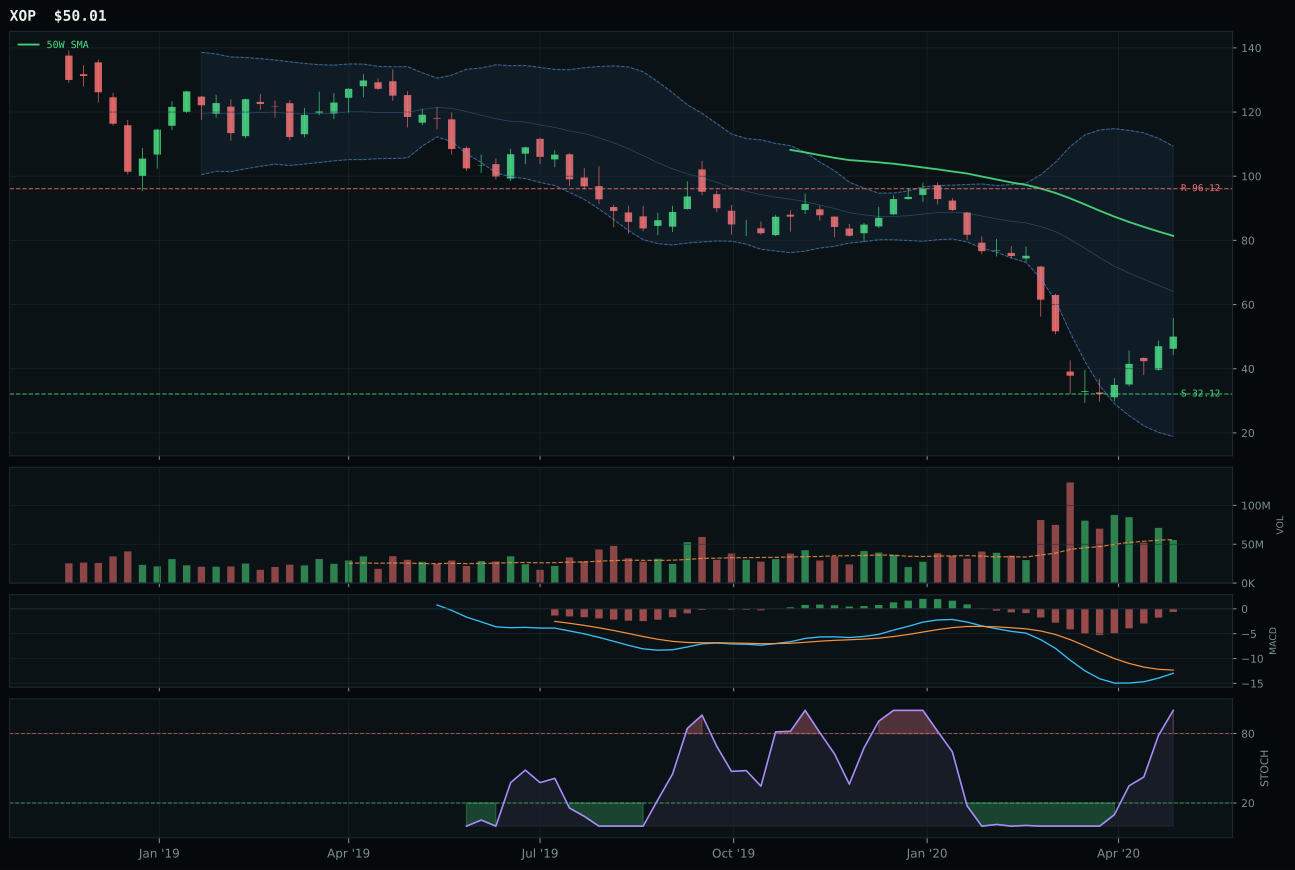
XOP has a neutral structure profile with -22.6% 13-week relative strength versus SPY.
Extension and support failure are the main tactical risks.
Tracked, but not top-2 eligible because: structurally broken.
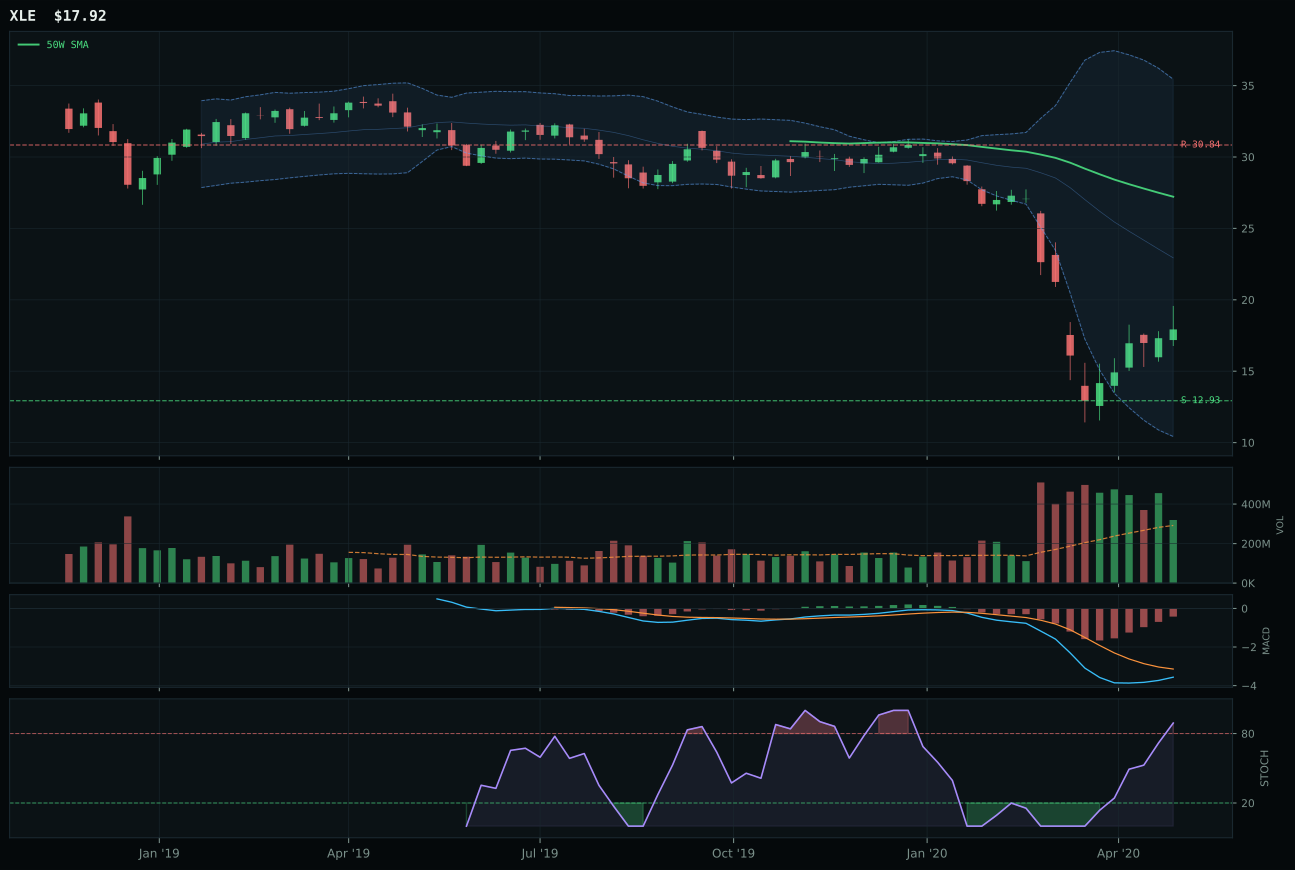
XLE has a neutral structure profile with -20.8% 13-week relative strength versus SPY.
Extension and support failure are the main tactical risks.
Tracked, but not top-2 eligible because: structurally broken.
FCG wins Traditional Energy at 0.0—a floor-zero category score—by having the only positive MACD signal (bullish and improving) among three candidates mired in -25% to -35% 13-week declines. FCG's 54.0% 4-week return and stochastic RSI at 1.00 (overbought momentum) create the only 100/100 momentum confirmation signal in the category, but this is a bear-market bounce in a sector with zero sponsorship. The 1.20x above-average volume participation means buyers are present, yet FCG sits -32.3% below the 50W in the deep value zone (Fib 0.786), priced for demand destruction that may not reverse for months. XOP and XLE both show bearish MACD with deteriorating momentum, making FCG technically superior by default, but this is not a win—it is a survival strategy. The 18.6-point gap versus XOP reflects FCG's superior MACD and volume, but the category score of 0.0 flags that FCG is structurally broken and marked ineligible for top-2.
Traditional Energy earned 10% allocation despite a final category score of 0.0 and structural ineligibility because the portfolio framework reserves a small sleeve for oversold recovery trades that carry tactical merit even without strategic conviction. FCG's allocation sits in a 10% category rank bracket specifically designed for names that failed technical or macro screens but offer asymmetric near-term payoff. Energy category macro fit measured only 33.0/100, anchored by disinflation pressure (-10) and credit stress (-7)—two headwinds that directly suppress energy demand. Yet FCG's 54.0% bounce from extreme lows cannot be ignored in a liquidity-expansion environment; when central banks inject cash, the most-damaged sectors often spike first. The allocator accepts 10% as a tactical fade trade, explicitly not a conviction position. This would convert to 20% only if disinflation pressure reversed to neutral or if geopolitical premium emerged in crude pricing. For now, FCG represents forced allocation to the most-battered sector's most-abused name, justified only by momentum mechanics in a risk-on week, with explicit understanding that the position should rotate out if energy weakness reasserts. Energy's 0.0 base score means this is tactical, not structural.
Industrial Metals — PICK
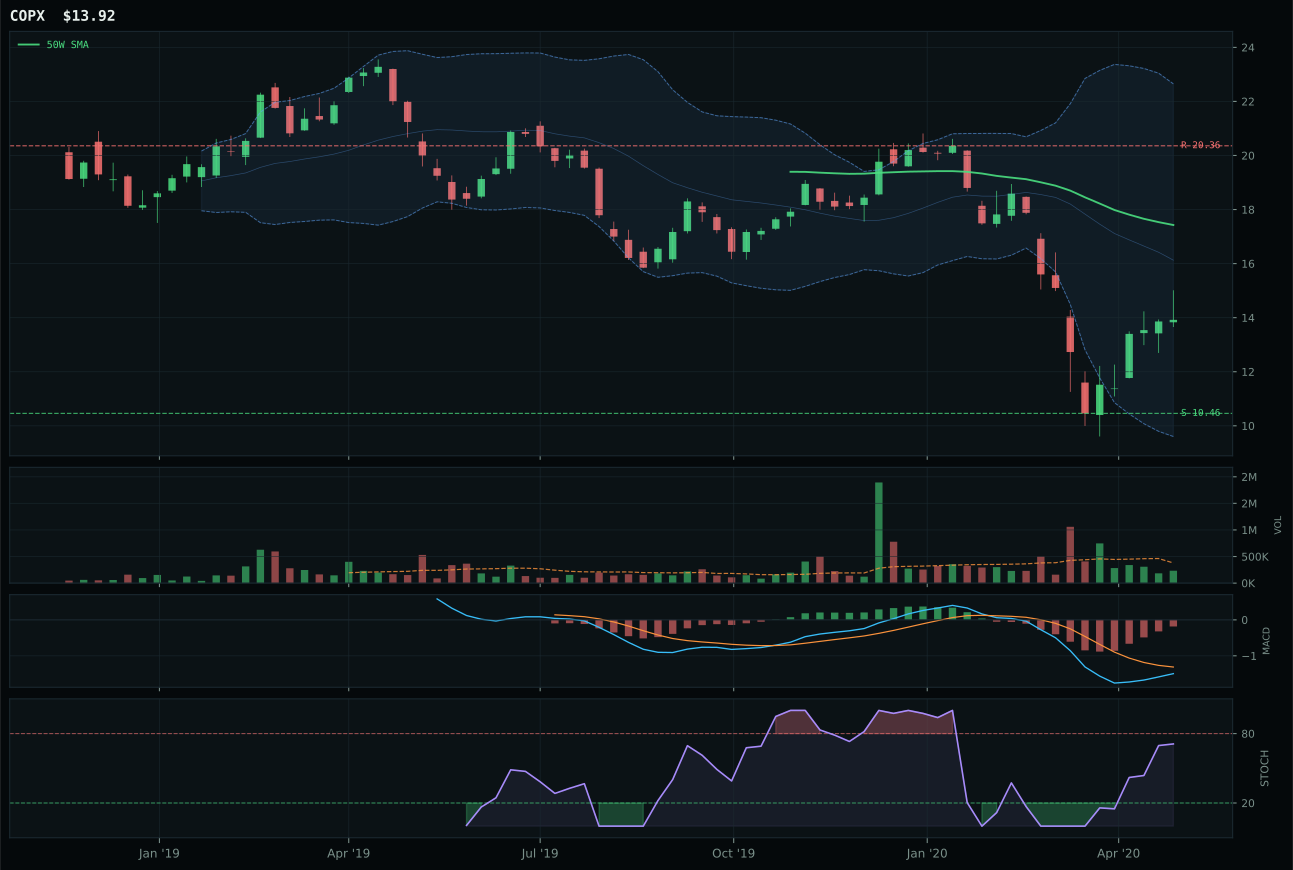
COPX has a neutral structure profile with -8.3% 13-week relative strength versus SPY.
Extension and support failure are the main tactical risks.
Tracked, but not top-2 eligible because: structurally broken.
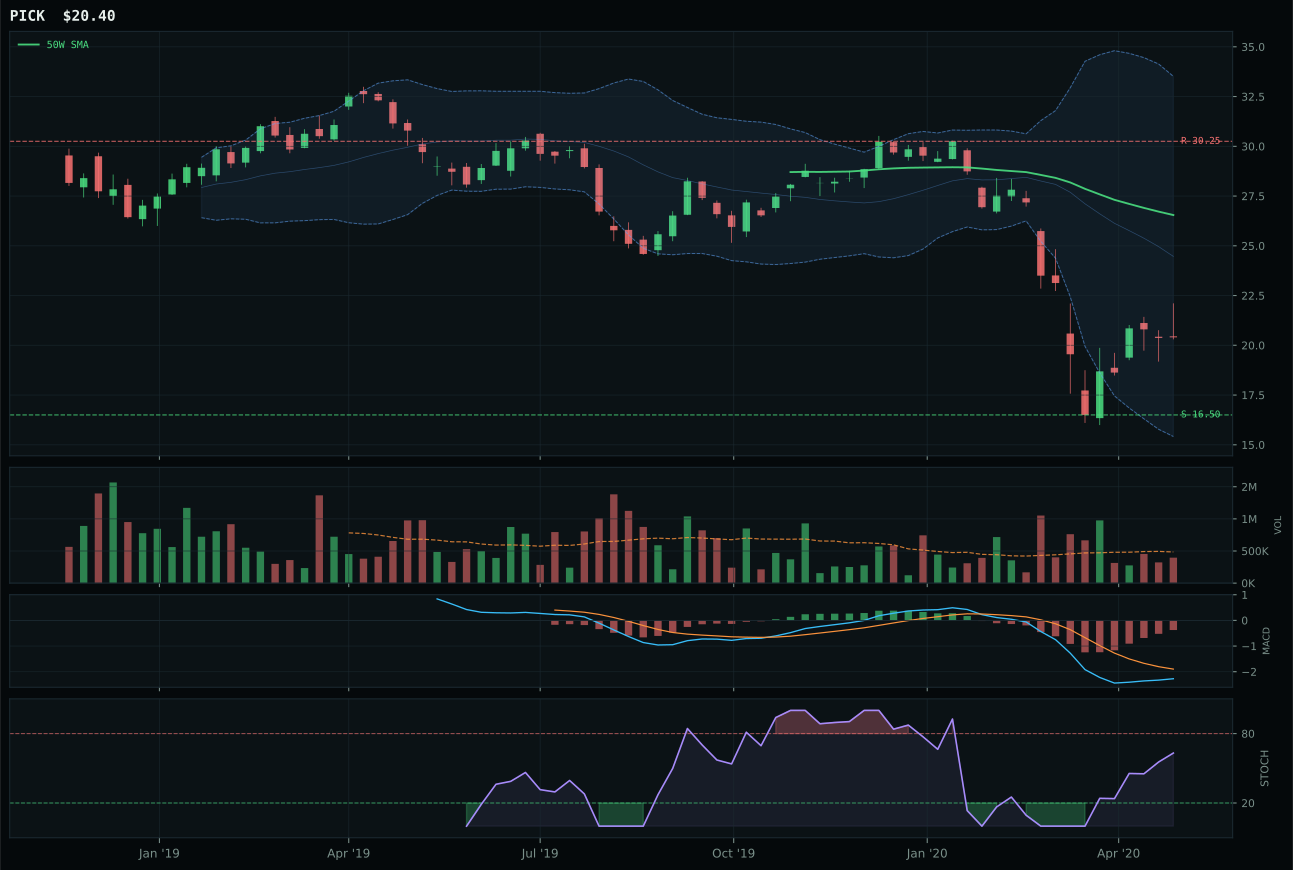
PICK has a neutral structure profile with -12.2% 13-week relative strength versus SPY.
Extension and support failure are the main tactical risks.
Tracked, but not top-2 eligible because: structurally broken.
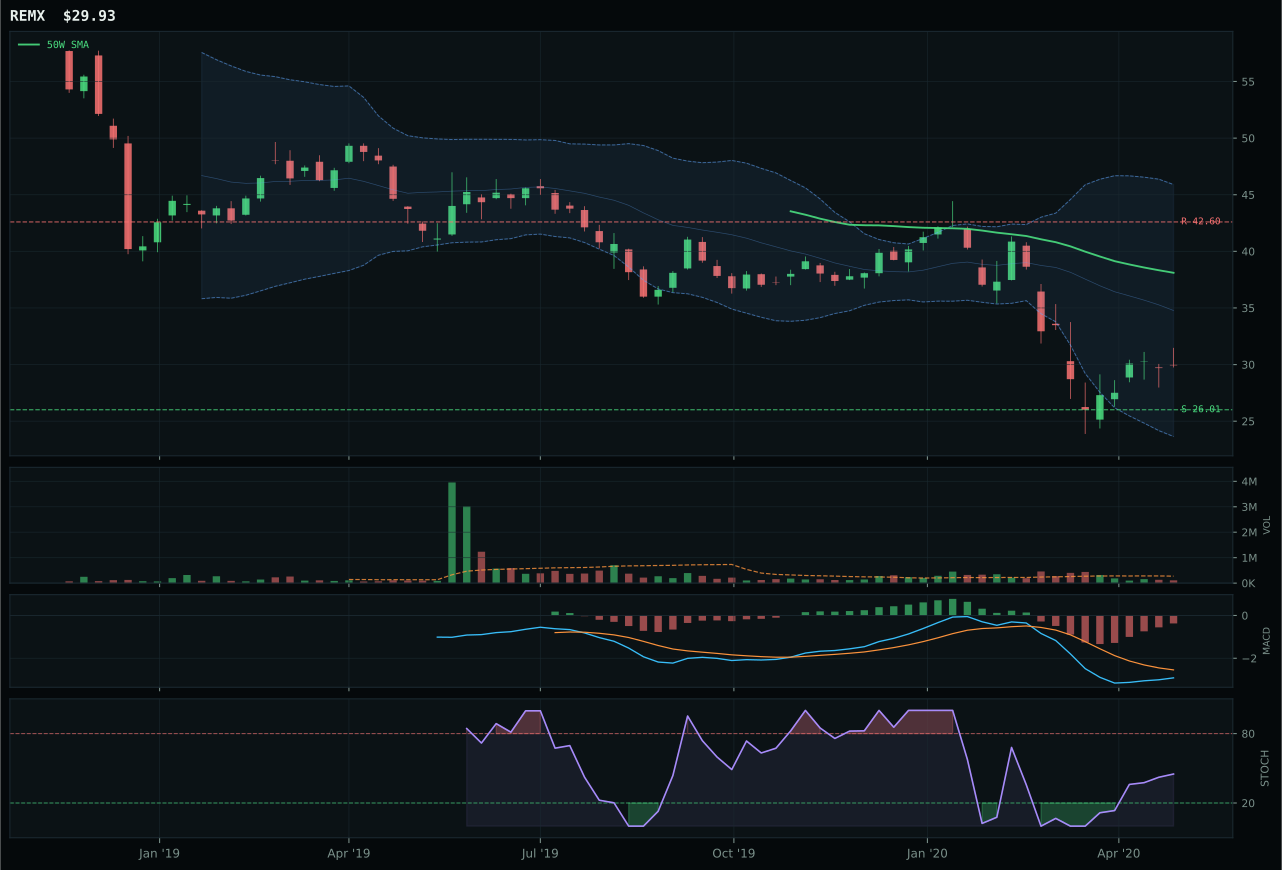
REMX has a neutral structure profile with -7.1% 13-week relative strength versus SPY.
Extension and support failure are the main tactical risks.
Tracked, but not top-2 eligible because: structurally broken.
PICK wins Industrial Metals by elimination: both COPX and REMX triggered hard filter rejections (structurally broken), leaving only PICK standing despite a composite score of just 4/100. PICK's -12.2% SPY-relative strength and -3.9% category-relative strength are abysmal, yet the structure at 28.2/100 and timing at 63/100 marginally beat COPX's profile. Price at -23.2% from the 50W sits in the deep retracement zone near Fib 0.618 at 21.61, creating a value-zone technical argument, but the 20.8/100 momentum confirmation reveals that accumulation has not yet arrived; volume is neutral and MACD is only bearish but improving, not yet reversing. The 4.2-point gap versus COPX is immaterial in a category this broken: this is a sector in free-fall, and PICK simply has fewer structural violations than its peers. Any allocation here is a speculative bet that mining demand will revive before the next earnings season.
Industrial Metals ranked 9th or 10th and earned 0% allocation because category eligibility flagged as False—the reasoning layer rejected all three representatives as structurally broken. Final category score of 13.8 reflects this filter; the basket technically scored higher at 31.5 before stress-testing against leadership, persistence, and macro fit. Category macro fit registered only 49.0/100, with credit stress active at -7 and zero positive descriptors to balance it. Mining and metals demand correlate directly to credit cycle health; when credit stress rises, capex collapses and commodity demand evaporates. Copper (COPX), rare earths (REMX), and diversified miners (PICK) all measured -12% to -8% SPY-relative weakness, indicating structural damage beyond cyclical retracement. No hard technical floor exists: support levels exist but carry zero confidence without volume sponsorship. For this category to earn capital, either credit stress descriptor would need to flip negative or commodity prices would need to establish new support with accumulation volume at price. Until then, the allocator correctly gates it entirely, treating hard structural breaks as disqualifying rather than buying opportunities.
Agriculture & Livestock — MOO
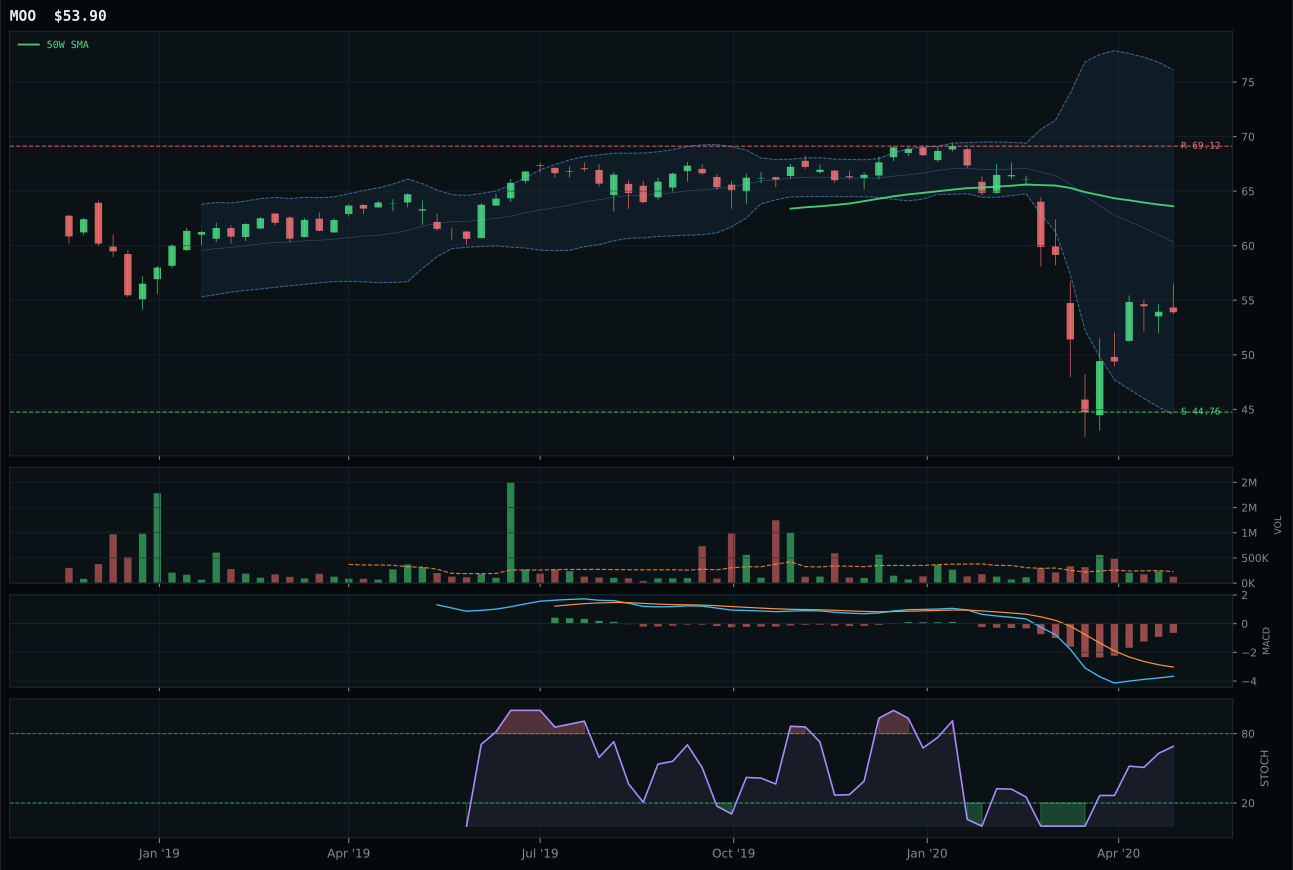
MOO has a neutral structure profile with -4.8% 13-week relative strength versus SPY.
A failed hold above support would weaken the setup.
Actionable but governed by invalidation levels.
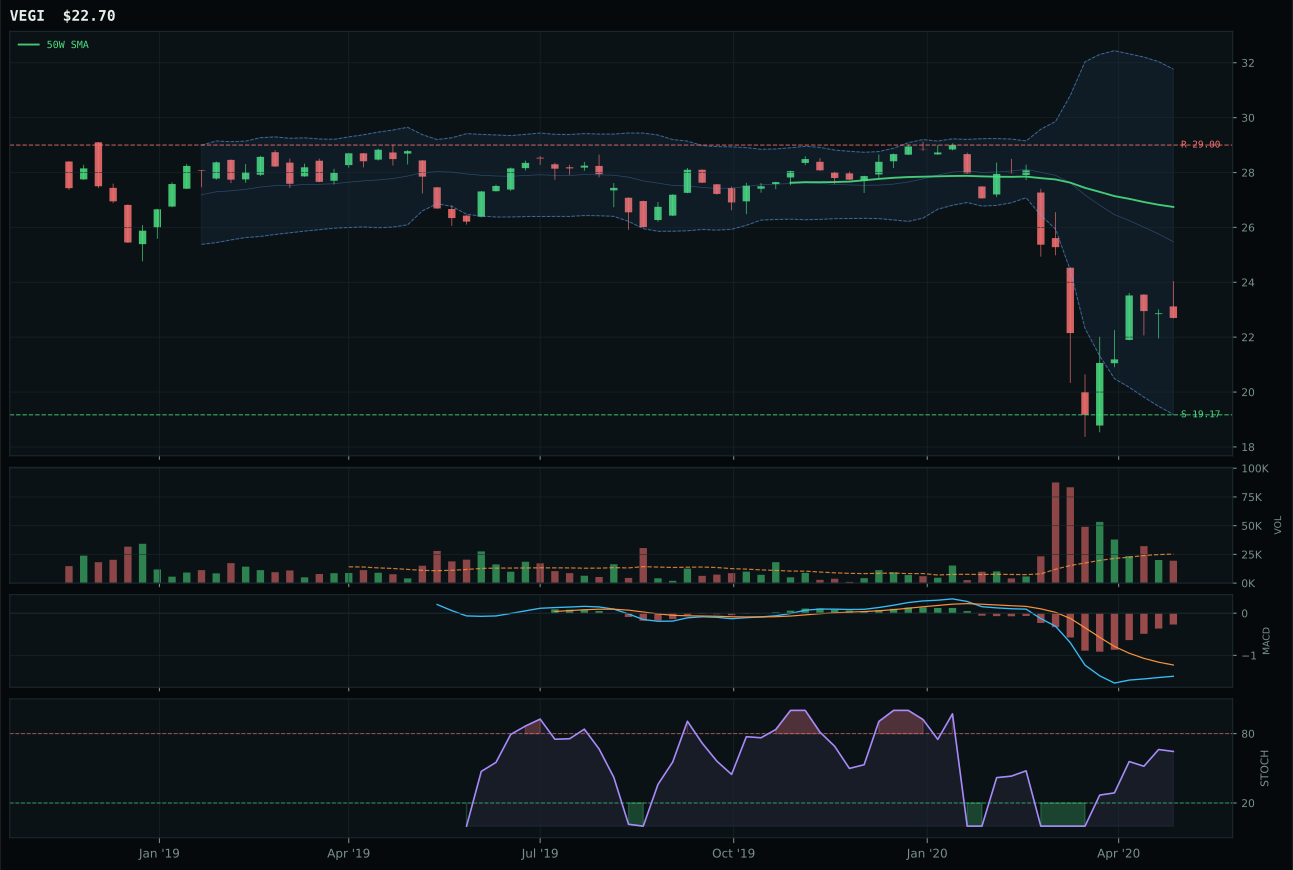
VEGI has a neutral structure profile with -4.0% 13-week relative strength versus SPY.
Extension and support failure are the main tactical risks.
Tracked, but not top-2 eligible because: structurally broken.
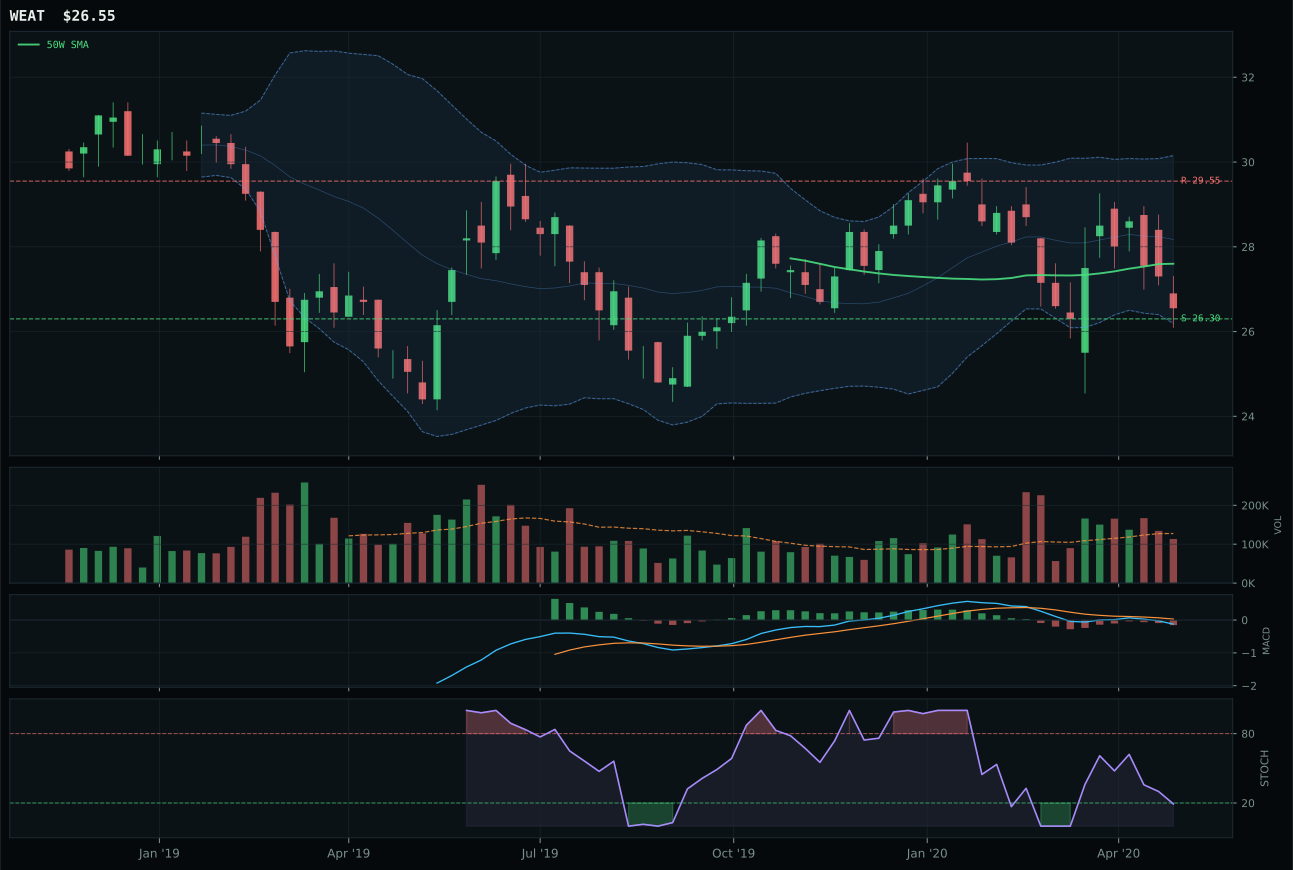
WEAT has a pullback into support profile with 4.9% 13-week relative strength versus SPY.
Extension and support failure are the main tactical risks.
Tracked, but not top-2 eligible because: structurally broken.
MOO represents the Agriculture & Livestock category despite scoring only 3.3—the lowest of all ten categories—because VEGI triggered hard filters (structurally broken) and WEAT, while showing a 4.9% RS advantage, sits in an oversold stochastic setup with deteriorating MACD. MOO's -4.8% SPY-relative strength is weaker than both peers, and the thin participation volume at 0.56x the 20-week average confirms this sector lacks sponsorship, but its neutral structure at 54.7/100 marginally beats VEGI's 33.9. The 39.5-point gap versus VEGI is material: VEGI broke key support levels, creating a hard filter rejection despite technically superior momentum; MOO at -15.3% from the 50W sits in the middle retracement zone where support is testable. Stochastic RSI rising mid-zone at 0.69 and MACD bearish but improving create a low-conviction turnaround signal, but it is the only candidate without structural damage.
Agriculture & Livestock ranked 9th or 10th and earned 0% allocation, receiving zero capital because it failed to clear the competitive bar against higher-ranked categories and the macro regime actively works against it. Category macro fit measured only 42.0/100, anchored by disinflation pressure active at -8, which directly damages agricultural commodity demand and farm input pricing. The final category score collapsed to 3.3 after the reasoning layer stress-tested setup quality against leadership, persistence, and macro fit; the basket failed on all three dimensions. MOO's technical evidence of 19.3/100 and macro narrative fit of only 45.0/100 cannot compete with categories scoring 50+. The allocation framework reserves 0% for exactly this scenario: categories damaged by current macro conditions with no technical evidence of bottoming behavior. For this to change materially, disinflation pressure would need to flip to neutral or positive, or a sharp agricultural shortage spike would need to provide tail-hedge premium that translates to equity demand. Neither condition is present, rendering the entire category a capital allocation dead zone.