
2020-04-24
Informational purposes only. The content in this report, including allocations, analysis, and commentary, is provided solely for informational and educational purposes. It does not constitute financial advice, investment advice, trading advice, or any other type of advice. Past performance does not guarantee future results. Always conduct your own research and consult a qualified financial professional before making investment decisions.
Some tracked tickers were excluded due to missing live weekly price data: SGOV: Historical cache SGOV has only 0 usable weekly bars; URNM: Historical cache URNM has only 21 usable weekly bars
Macro risk engine requires the 50% Defensive overlay for this run; payload selected by cause: Monetary Defense.
Weekly Allocation
| Ticker | Category | Weight | Role |
|---|---|---|---|
| GLD | 50% | Overlay | |
| XLK | Technology | 10% | Top-2 (10%) |
| GDX | Precious Metals | 10% | Top-2 (10%) |
| SMH | AI | 5% | Tier-2 (5%) |
| XLU | Utilities & Infrastructure | 5% | Tier-2 (5%) |
| FCG | Traditional Energy | 5% | Tier-2 (5%) |
| INDA | Emerging Markets | 5% | Tier-2 (5%) |
| URA | Nuclear Energy | 5% | Tier-2 (5%) |
| ITA | Defense & Aerospace | 5% | Tier-2 (5%) |
Trade Instructions — Monday Open
Sell the tranche from 2020-03-27 (completing its 4-week hold). Buy the new tranche. Instructions show net portfolio changes — same-asset positions cancel, weight changes show the delta.
| Action | Ticker | Instruction |
|---|---|---|
| SELL | GLD | Sell 3% of GLD position (reduce 46.25% → 45.00%) |
| SELL | CIBR | Sell 20% of CIBR position (reduce 12.50% → 10.00%) |
| SELL | SMH | Sell 17% of SMH position (reduce 7.50% → 6.25%) |
| SELL | NLR | Sell entire NLR position (1.25% of portfolio) |
| SELL | XAR | Sell 33% of XAR position (reduce 3.75% → 2.50%) |
| SELL | XLE | Sell 25% of XLE position (reduce 5.00% → 3.75%) |
| BUY | URA | Buy URA — 14.29% of freed cash (adds 1.25% to portfolio) |
| BUY | GDX | Buy GDX — 28.57% of freed cash (adds 2.50% to portfolio) |
| BUY | FCG | Buy FCG — 14.29% of freed cash (adds 1.25% to portfolio) |
| BUY | ITA | Buy ITA — 14.29% of freed cash (adds 1.25% to portfolio) |
| BUY | XLK | Buy XLK — 28.57% of freed cash (adds 2.50% to portfolio) |
Current Portfolio After Trade
Combined holdings across all 4 active tranches. Each tranche is 25% of the portfolio.
| Ticker | % of Portfolio | Weight Bar |
|---|---|---|
| GLD | 45.00% | |
| CIBR | 10.00% | |
| SMH | 6.25% | |
| XLU | 6.25% | |
| INDA | 6.25% | |
| URA | 6.25% | |
| GDX | 5.00% | |
| XLE | 3.75% | |
| ITA | 3.75% | |
| XAR | 2.50% | |
| FCG | 2.50% | |
| XLK | 2.50% |
Macro Regime — Goldilocks
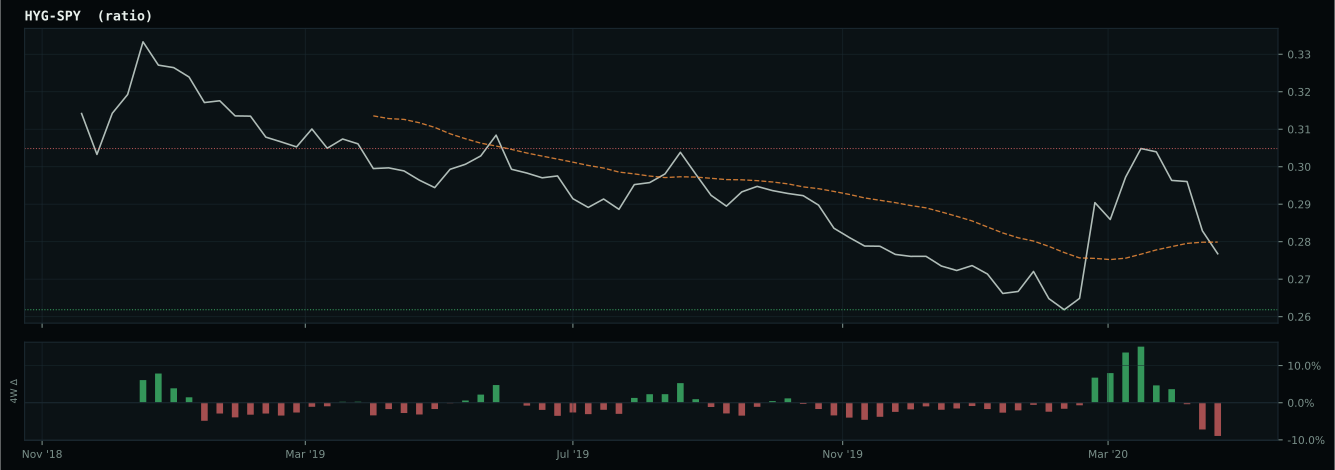
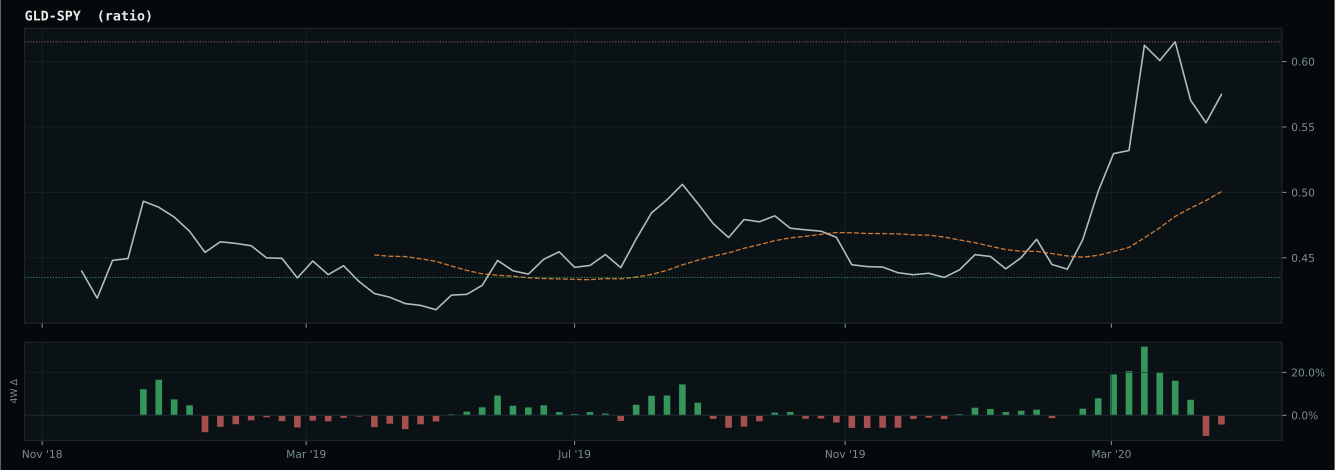
Defensive overlay cause is falling-growth or disinflation stress: gold is favored because falling real-yield pressure and monetary hedging are more relevant than cyclical commodity demand. GLD has been confirmed above its 8W SMA and is eligible.
Macro Evidence Charts
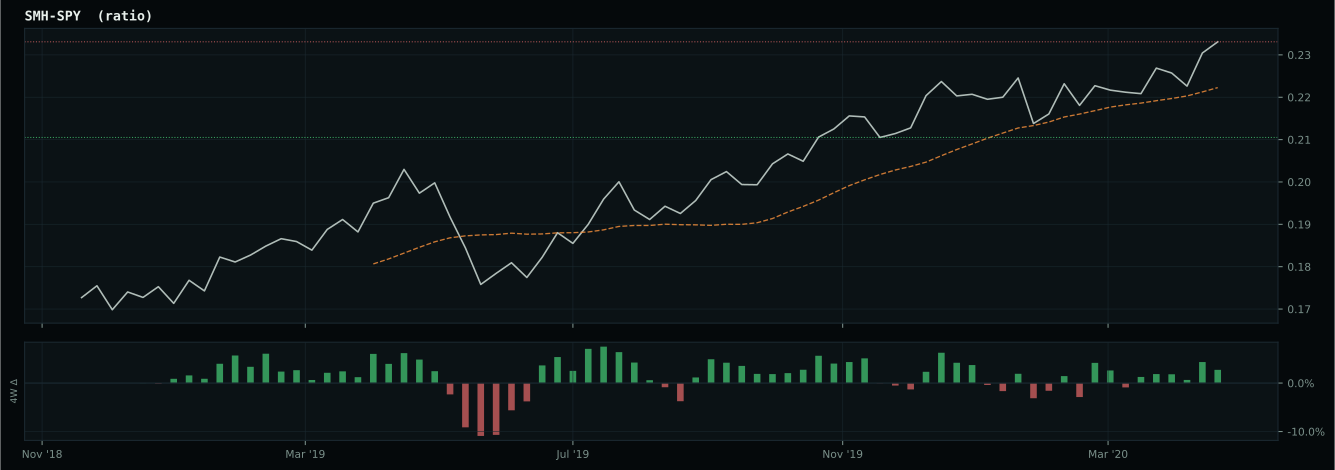
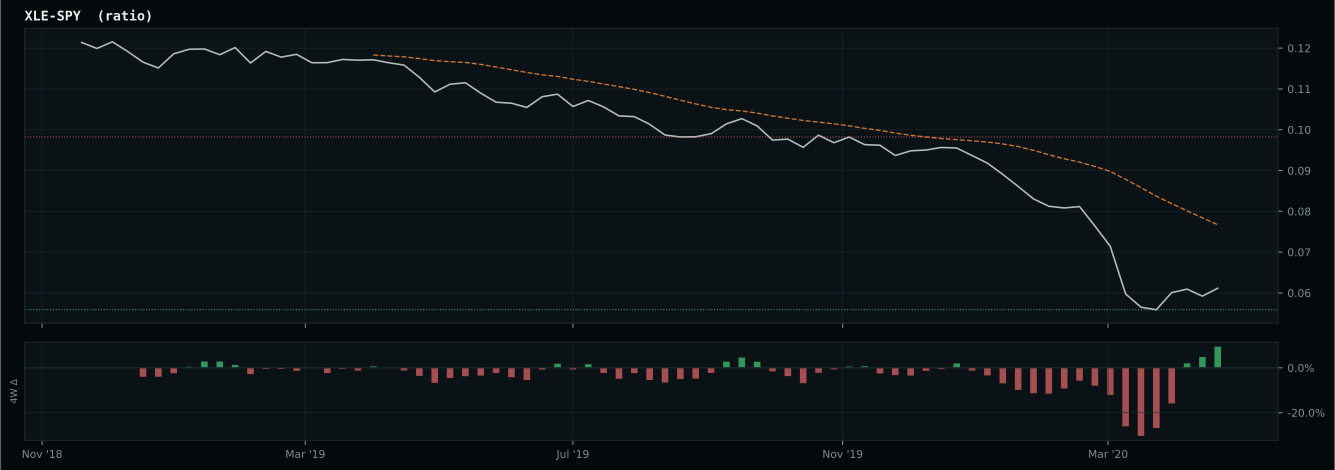
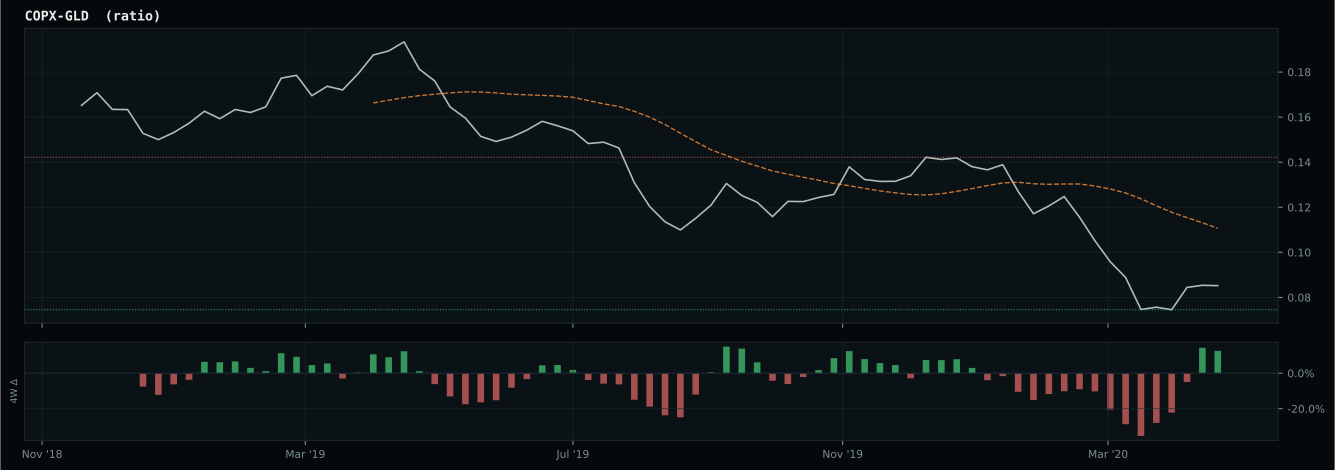
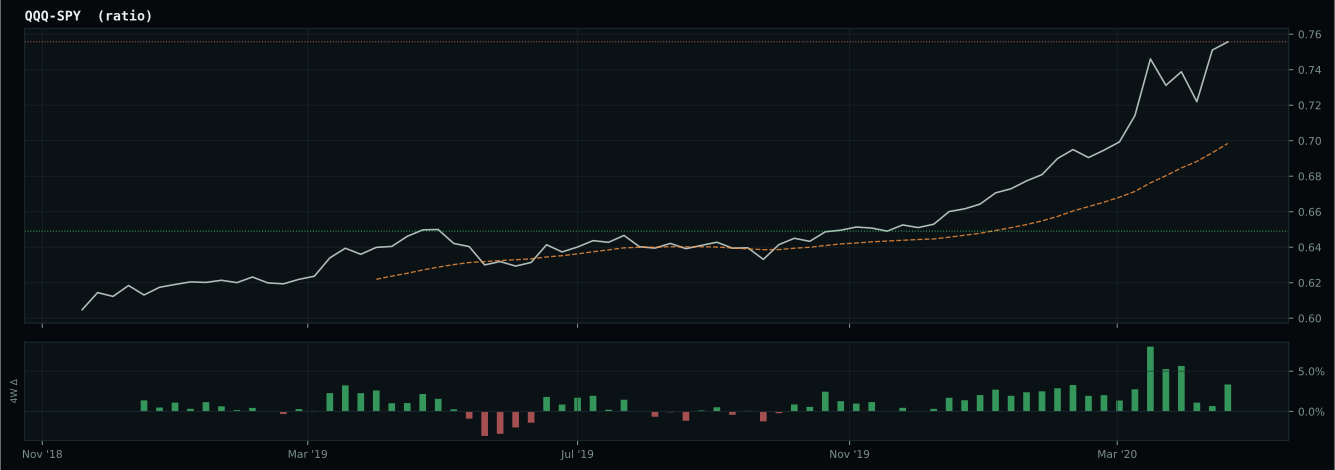
Market-implied signals behind the macro regime scores. Each ratio compares two assets; the direction and slope of the ratio is what the macro engine reads.
Crypto Regime — NoCrypto
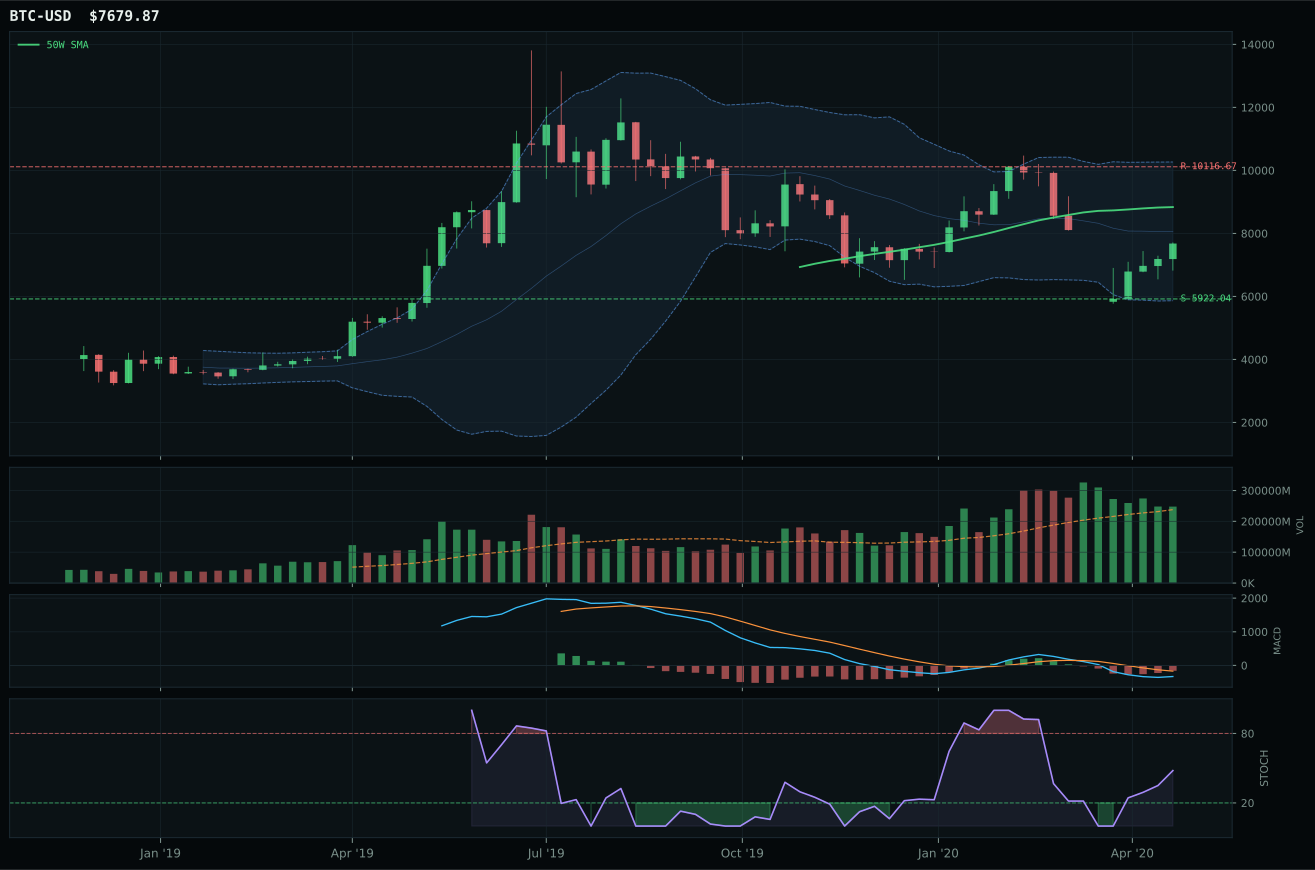
ValueBTC armed by first 200W buy-zone touch, but post-touch range age is 6 weeks; minimum is 12
TrendBTC not confirmed
one or more available conditions failed

Category Rankings
| Rank | Category | Winner | Score | Alloc | 4W Ret | Peers (4W) |
|---|---|---|---|---|---|---|
| 1 | Technology | XLK | 63.8 | 20% | +10.05% | IGV +13.2% · CIBR +10.7% |
| 2 | Precious Metals | GDX | 48.7 | 20% | +4.21% | GLD +0.4% · SLV +14.6% |
| 3 | AI | SMH | 47.2 | 10% | +6.04% | BOTZ +16.8% · AIQ +11.6% |
| 4 | Utilities & Infrastructure | XLU | 38.1 | 10% | -1.98% | IGF +5.6% · PAVE +9.6% |
| 5 | Nuclear Energy | URA | 31.4 | 10% | -0.83% | NLR +1.0% |
| 6 | Defense & Aerospace | ITA | 27.4 | 10% | +5.67% | XAR +8.9% · ROKT +6.2% |
| 7 | Agriculture & Livestock | MOO | 4.6 | 10% | +4.49% | VEGI +2.1% · WEAT -3.3% |
| 8 | Industrial Metals | PICK | — | 10% | +13.11% | COPX +10.2% · REMX +10.7% |
| 9 | Traditional Energy | FCG | — | 0% | +19.08% | XOP +17.6% · XLE +15.6% |
| 10 | Emerging Markets | INDA | — | 0% | +0.50% | IEMG +4.6% · ILF +17.3% |
Technology — XLK
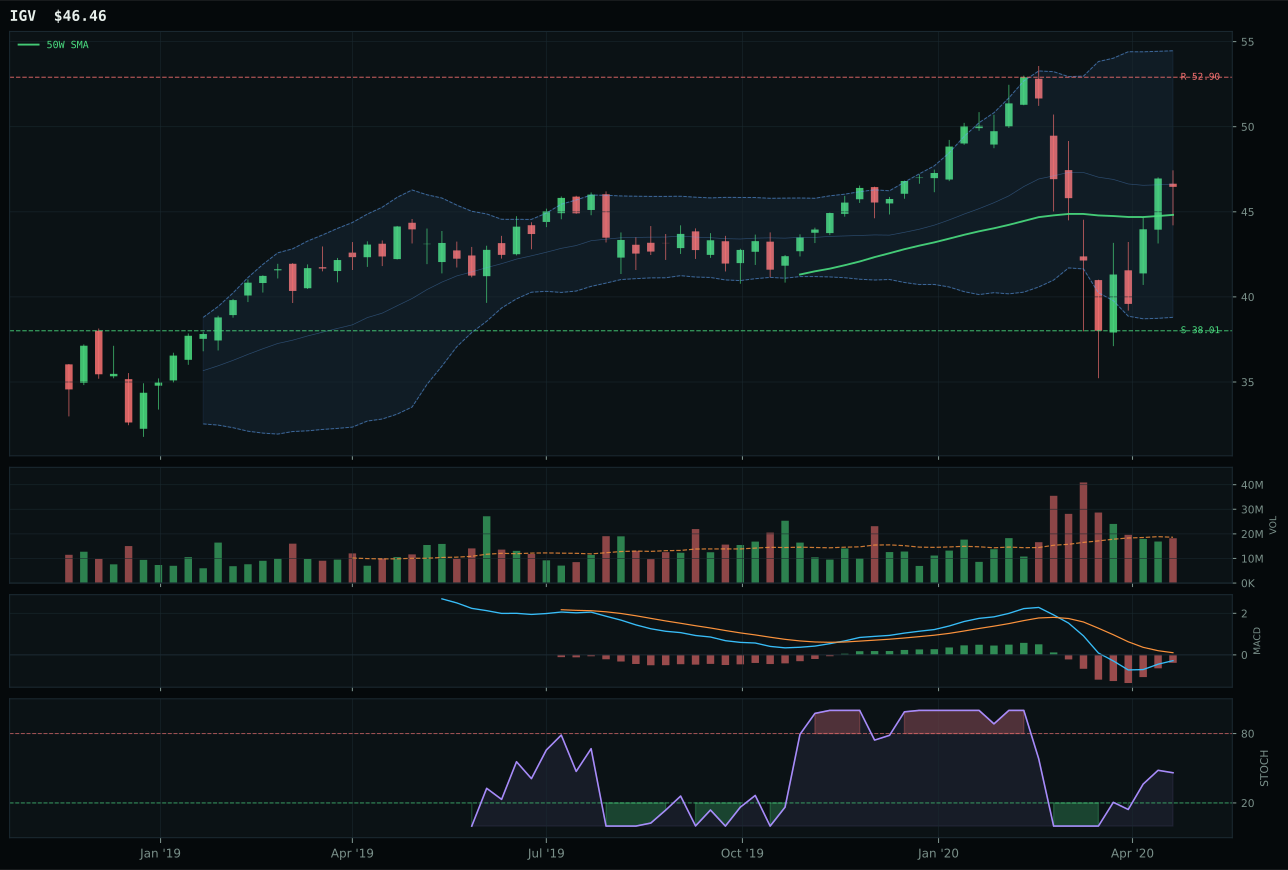
IGV has a neutral structure profile with 6.8% 13-week relative strength versus SPY.
A failed hold above support would weaken the setup.
Actionable but governed by invalidation levels.
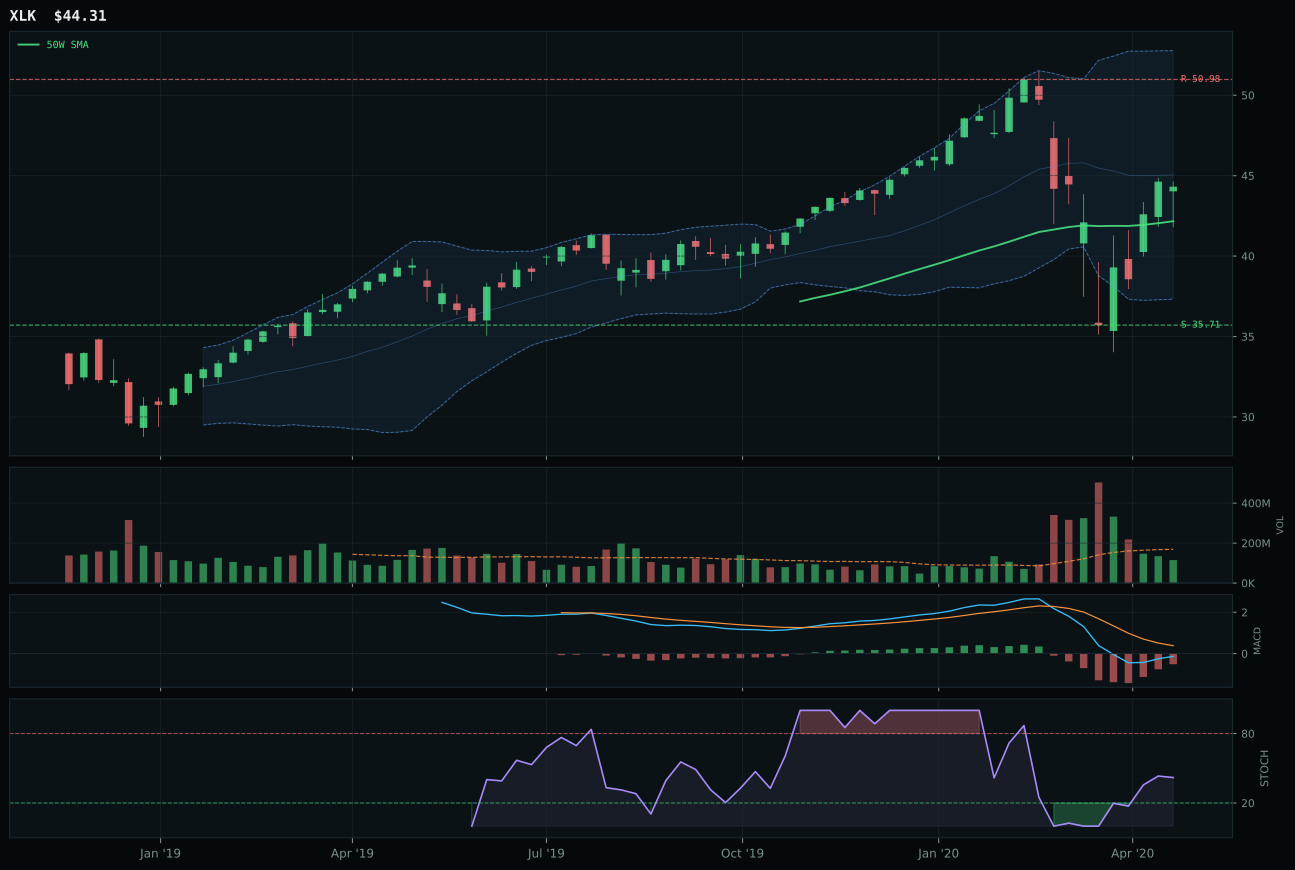
XLK has a neutral structure profile with 4.9% 13-week relative strength versus SPY.
A failed hold above support would weaken the setup.
Actionable but governed by invalidation levels.
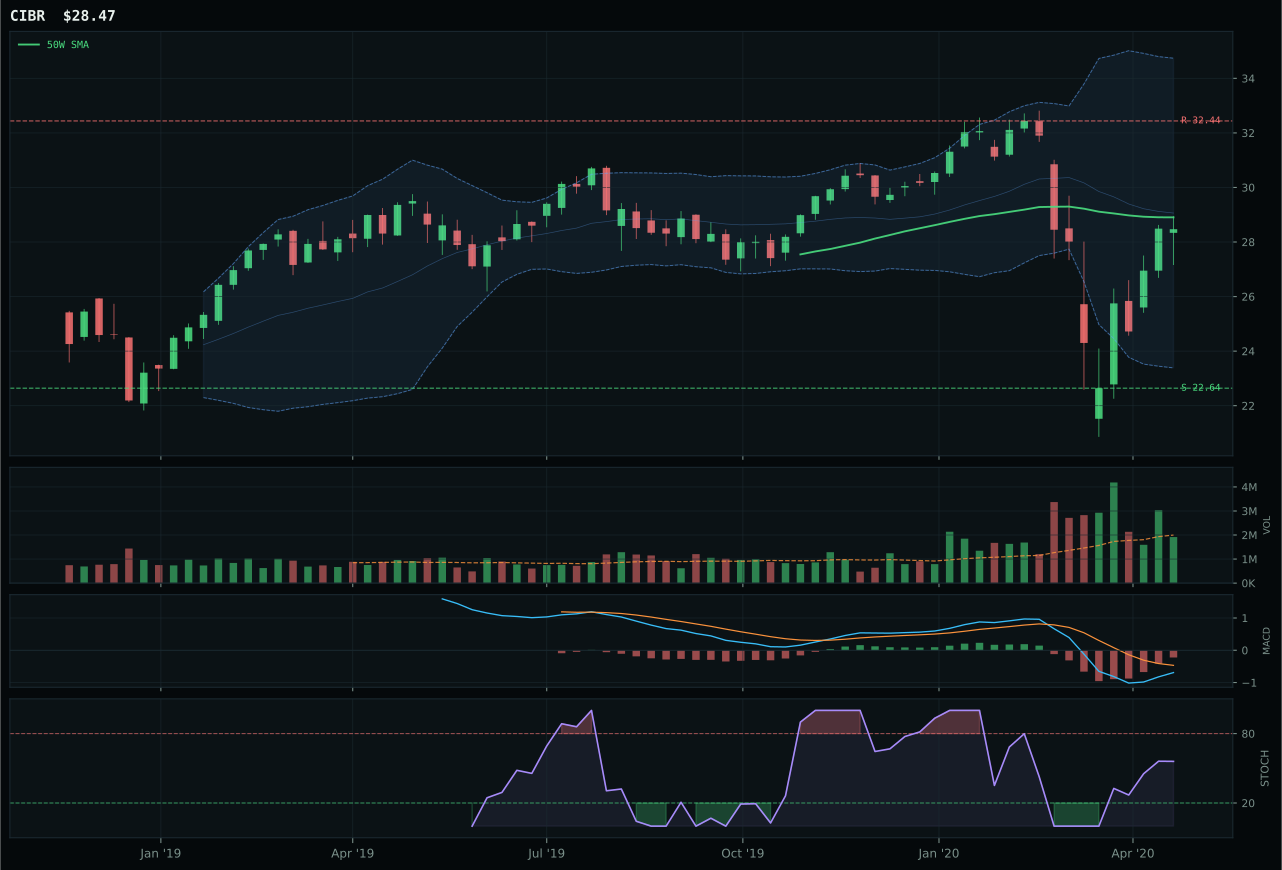
CIBR has a compression near 50W profile with 2.7% 13-week relative strength versus SPY.
A failed hold above support would weaken the setup.
Actionable but governed by invalidation levels.
XLK prevails in the Technology category because it commands a cleaner technical setup than IGV despite sitting in a neutral structural pattern. Price remains above both the 50W and 200W with a gentle 0.3% slope, and the 4.9% relative strength versus SPY justifies the selection even though category-relative strength reads flat at 0.0%. IGV's superior MACD and stochastic positioning (rising mid-zone) failed to overcome its weaker structure score of 63.8 versus XLK's 64.2, a marginal but decisive edge in a crowded field. Volume participation at 0.68x the 20W average sits thin across the board, meaning this is a leadership decision driven by trend persistence and relative strength sponsorship rather than broad accumulation. With the price sitting 5.1% above the 50W in a middle Fibonacci retracement zone, XLK offers the best risk-adjusted path forward for profitable technology exposure in this regime.
Technology secures a 10% allocation as a top-2 category, reflecting its status as one of the two highest-scoring opportunities available to the portfolio. The 63.8 final score emerged from deterministic technical evidence weighted at 62% against a 58.0% macro/narrative fit score, with liquidity expansion and AI growth sponsorship providing tailwinds despite ongoing credit stress headwinds. Goldilocks macro conditions deliver a modest +9 boost, and the active descriptor checklist shows monetary hedge bid interest alongside disinflation pressure, creating a mixed but ultimately supportive backdrop. This category's inclusion in the top tier is not a function of mean reversion or value hunting—it reflects genuine technical leadership where profitable businesses are being accumulated by informed capital despite a volatile macro environment. The allocation speaks to relative strength within the eligible basket rather than any absolute conviction about direction.
Precious Metals — GDX
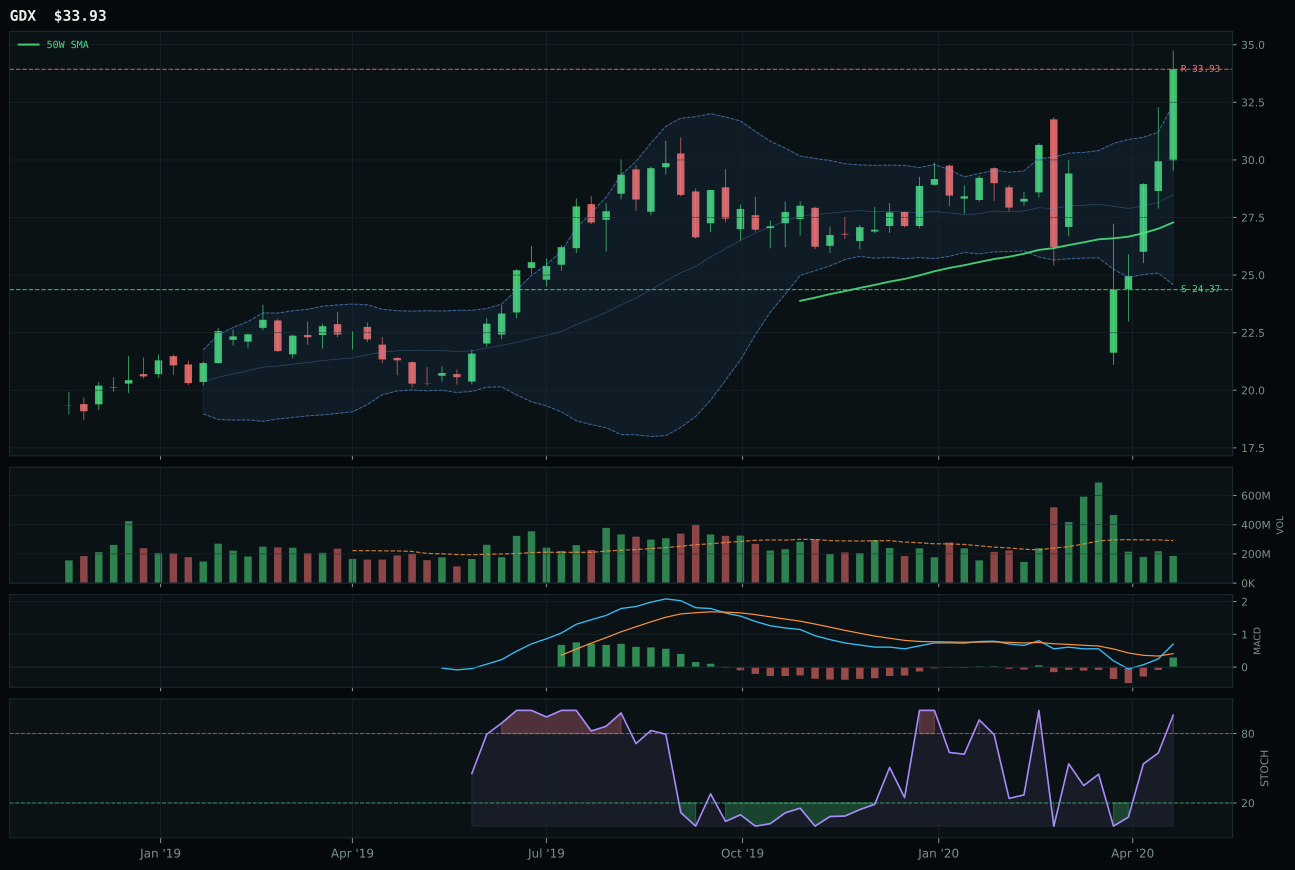
GDX has a vertical extension profile with 30.0% 13-week relative strength versus SPY.
A failed hold above support would weaken the setup.
Actionable but governed by invalidation levels.
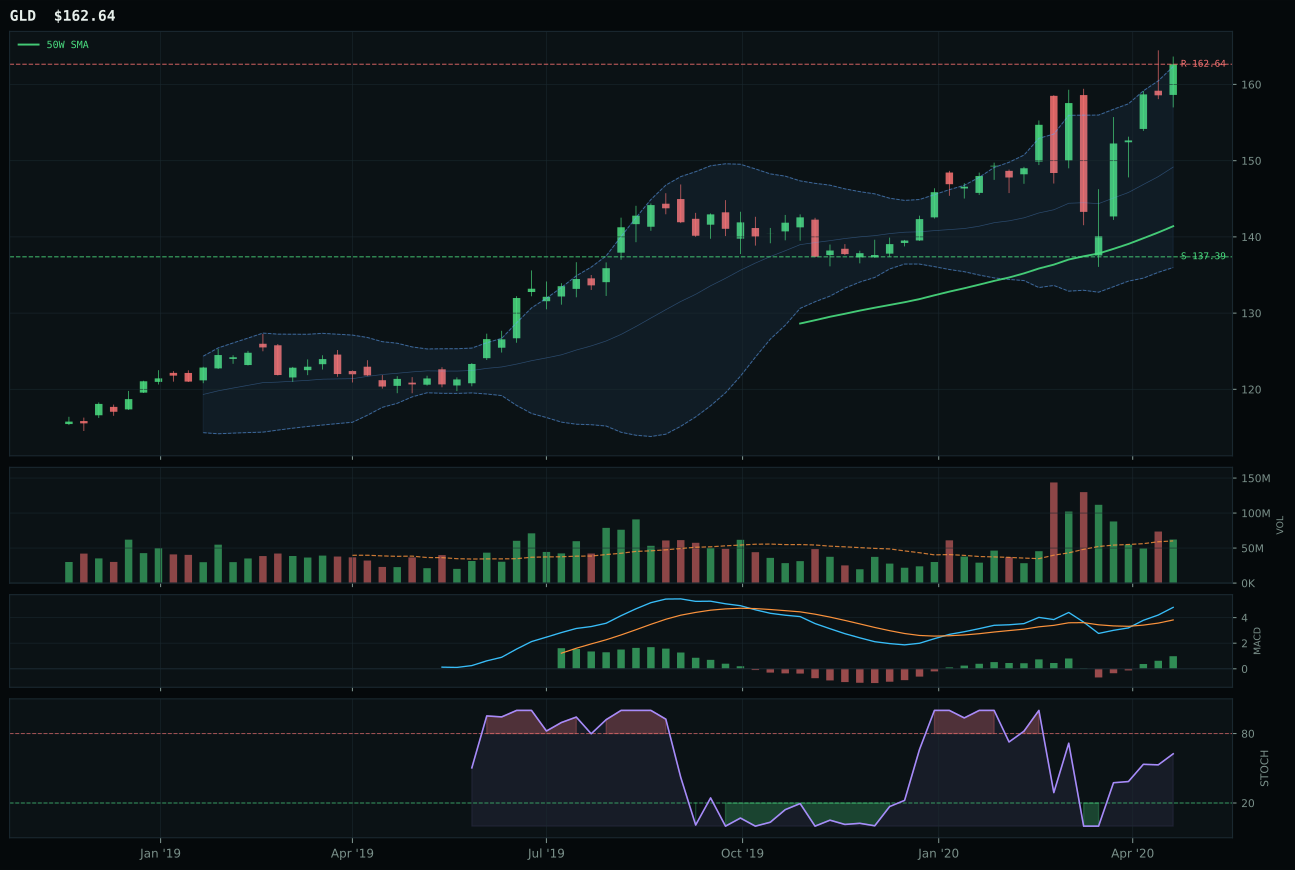
GLD has a vertical extension profile with 23.8% 13-week relative strength versus SPY.
A failed hold above support would weaken the setup.
Actionable but governed by invalidation levels.
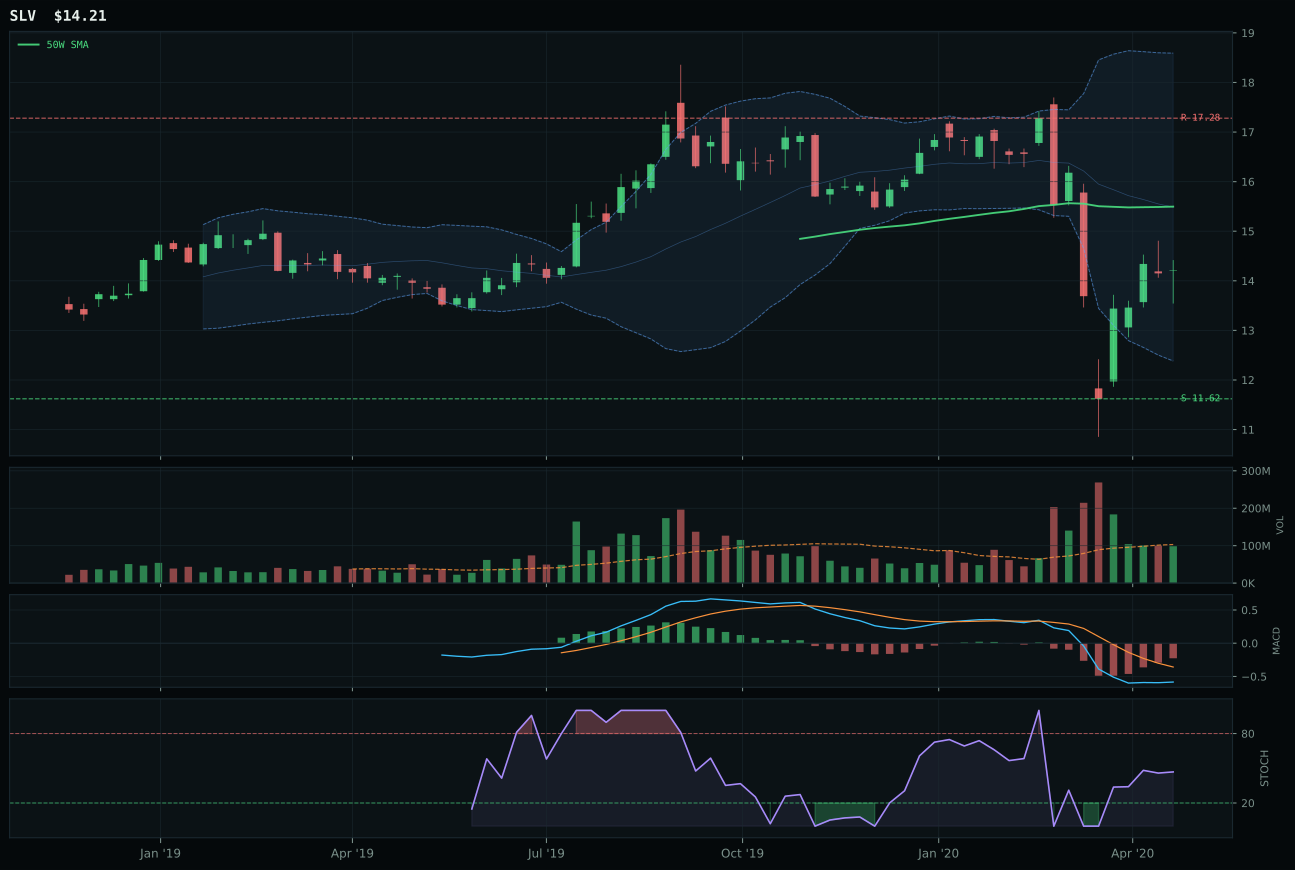
SLV has a neutral structure profile with -2.0% 13-week relative strength versus SPY.
Extension and support failure are the main tactical risks.
Tracked, but not top-2 eligible because: structurally broken.
GDX captures Precious Metals with bullish technical proof that overpowers GLD's superior macro fit and cleaner structure. GDX trades 26.0% above the 50W at 100.0/100 trend strength, and the stochastic RSI at 0.93 overbought momentum combined with improving MACD creates a momentum confirmation score of 100.0/100—the cleanest in the universe. Category-relative strength of 6.2% versus SPY's 30.0% outperformance shows GDX as the leveraged miner expression of the monetary hedge, capturing 6.2% of alpha within a category that is working hard. GLD's runner-up status reflects superior macro credentials and more stable structure, but the relative strength differential (0.0% versus category 6.2%) and timing cost (53/100 versus GDX's 37/100) create a preference for the riskier asset when trend is this strong. Price sits within 3.6% of the 52W high, validating the extension setup. Volume at 0.64x the 20W average is thin, but the 39.2% 4W return shows sufficient sponsor commitment to justify entry into an already-extended setup.
Precious Metals is selected as a top-2 category at 10% allocation, securing its place through a final score of 48.7 combined with the most powerful macro descriptor support in the entire portfolio. The category-level macro fit of 78.0/100 is driven by monetary hedge bid (active at +14), defensive rotation (+7), and disinflation pressure (+6)—a convergence of three major regime themes. Goldilocks conditions provide minimal uplift (+3 only), yet the macro tailwinds more than compensate. Technical evidence at 62% weight comes primarily from GLD's superior 80.4/100 technicals, but GDX's momentum strength and relative leadership within the category earn it representative status and drive the allocation decision. The 23.8% versus 48.7% SPY outperformance for both GLD and GDX respectively shows that monetary theme participation is already priced. Entry into GDX at 26% extension above the 50W is aggressive; the allocation assumes continued credit stress and disinflation fears justify the premium. This is a top-2 allocation built on macro conviction, not technical purity—a choice to ride the monetary hedge bid while it remains active.
AI — SMH
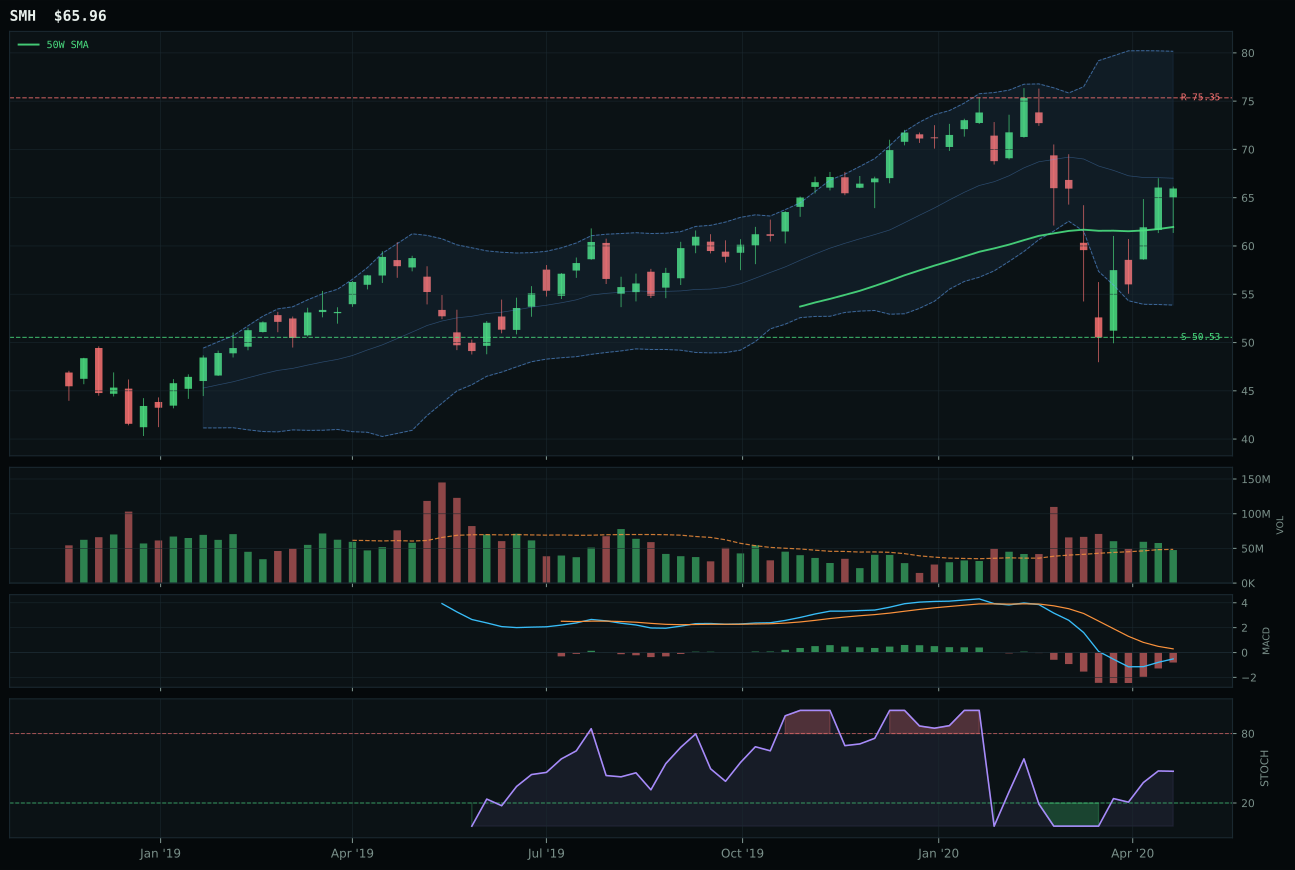
SMH has a neutral structure profile with 3.3% 13-week relative strength versus SPY.
A failed hold above support would weaken the setup.
Actionable but governed by invalidation levels.
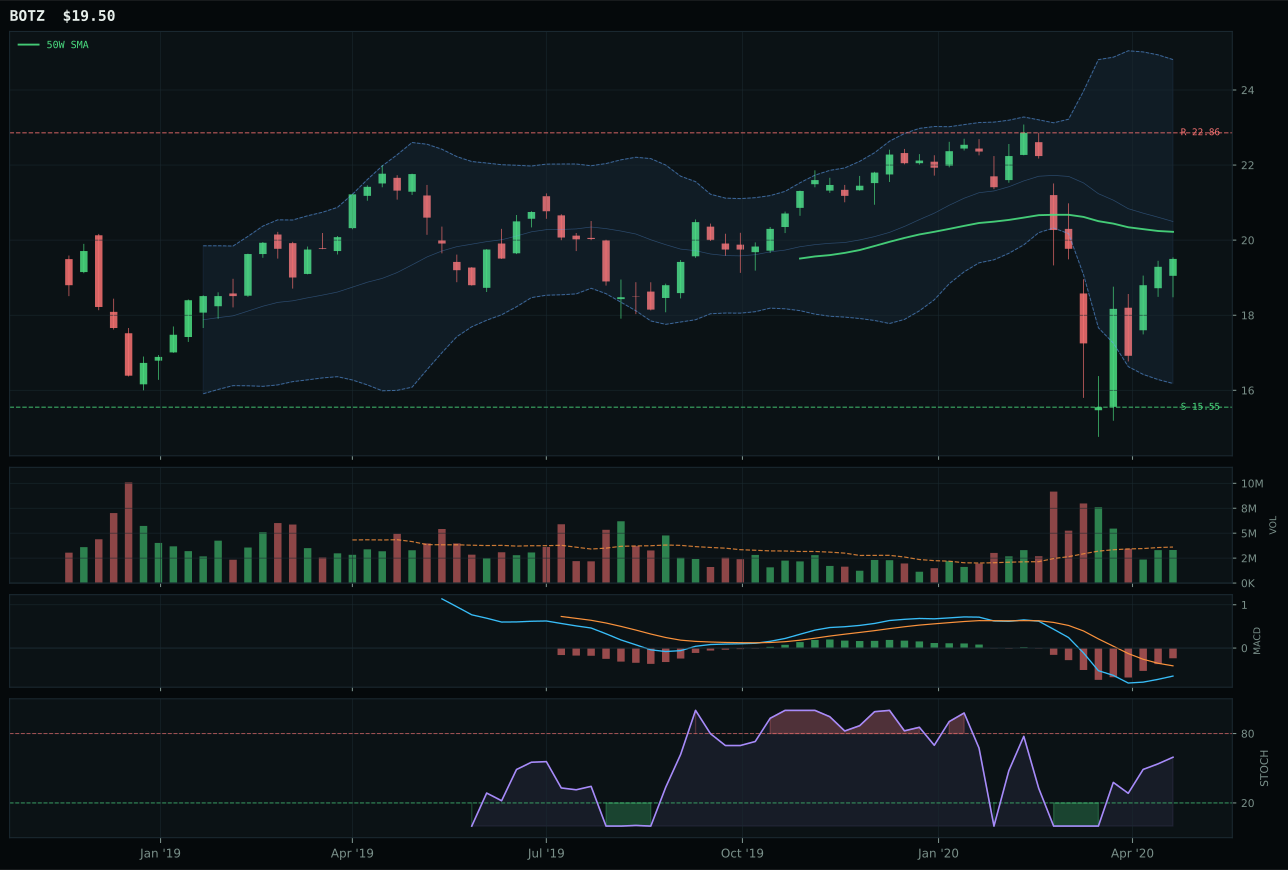
BOTZ has a neutral structure profile with 1.1% 13-week relative strength versus SPY.
A failed hold above support would weaken the setup.
Actionable but governed by invalidation levels.
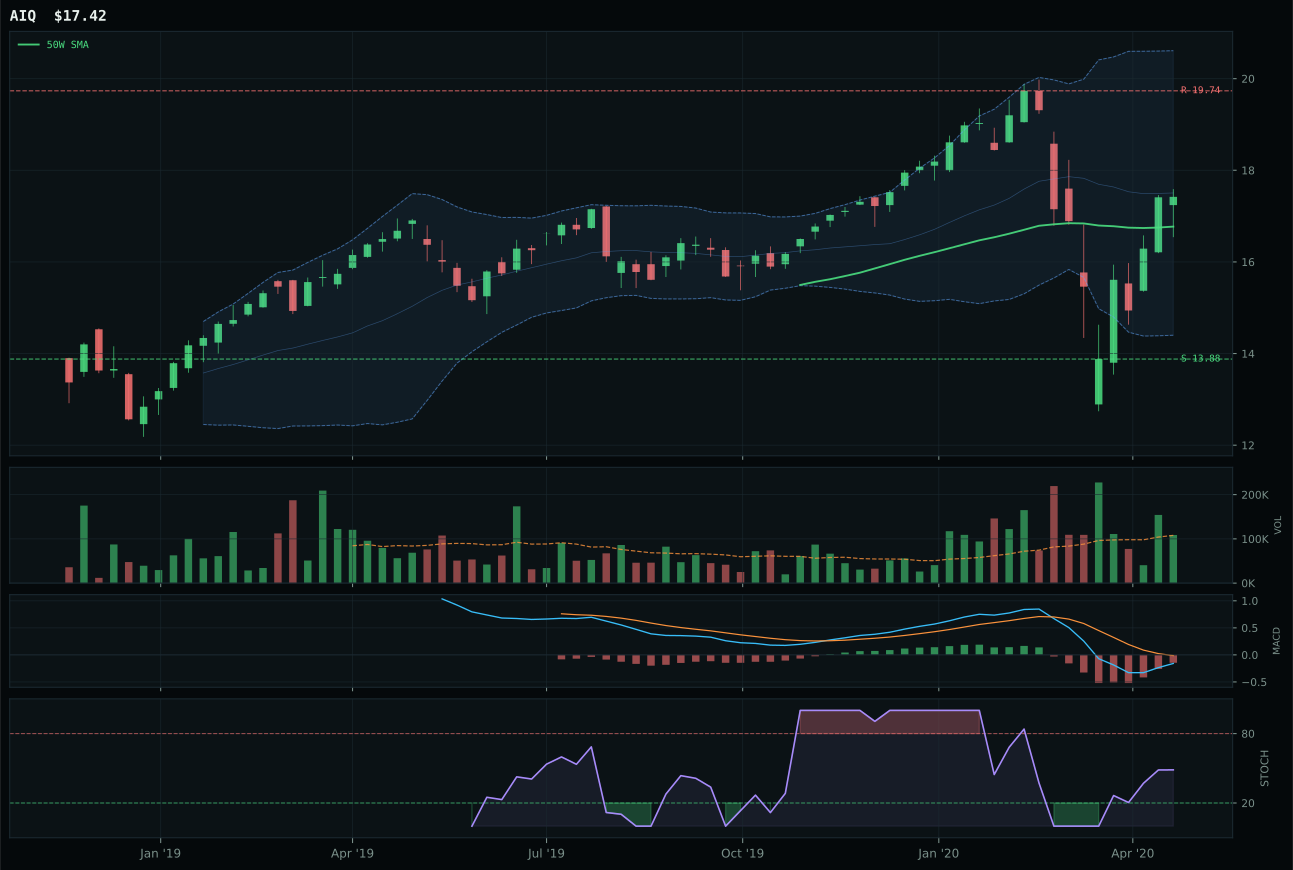
AIQ has a neutral structure profile with 5.5% 13-week relative strength versus SPY.
A failed hold above support would weaken the setup.
Tracked, but not top-2 eligible because: .
SMH wins the AI category with superior trend strength of 97.9/100 and the only category-relative strength reading at parity (0.0% versus median), while BOTZ stumbles with negative relative strength of -2.1% and a trend component of just 40/100. SMH's 3.3% SPY outperformance, combined with neutral volume participation, creates a setup where the 6.4% distance to the 50W represents a reasonable entry point rather than extended exhaustion. Timing scores diverge sharply: SMH earns 83/100 for its upper-zone Fibonacci positioning and improving MACD, while BOTZ scores just 98/100 on timing but fails across trend, momentum (52 versus SMH's 74), and volume (35 versus 66). The 27.3-point gap between winners tells a stark story—this is not a subtle preference but a clear divergence in technical quality. SMH's 4W return of 14.7% against a flat 13W return suggests accumulation into weakness, the kind of sponsor behavior that justifies commitment.
AI receives 5% allocation as a tier-2 category, significantly outranked by Technology and Precious Metals but still earning capital because SMH's technical evidence and the active AI growth sponsorship descriptor (+14) create a defensible case. The category score of 47.2 is depressed by weak macro fit (64.0%) and the presence of true structural damage in BOTZ and AIQ, yet the representative remains eligible for deployment. AI growth is an active macro theme even within a Goldilocks regime, and SMH's 12.9% relative strength versus category median reflects genuine leadership within a damaged group. The allocation threshold reflects reality: this is not a top-conviction trade, but the combination of technical merit in the winner and persistent macro interest in AI compute justifies maintaining exposure rather than zeroing the category entirely. To elevate AI to top-2 status would require sustained momentum confirmation and broader field improvement—neither currently present.
Utilities & Infrastructure — XLU
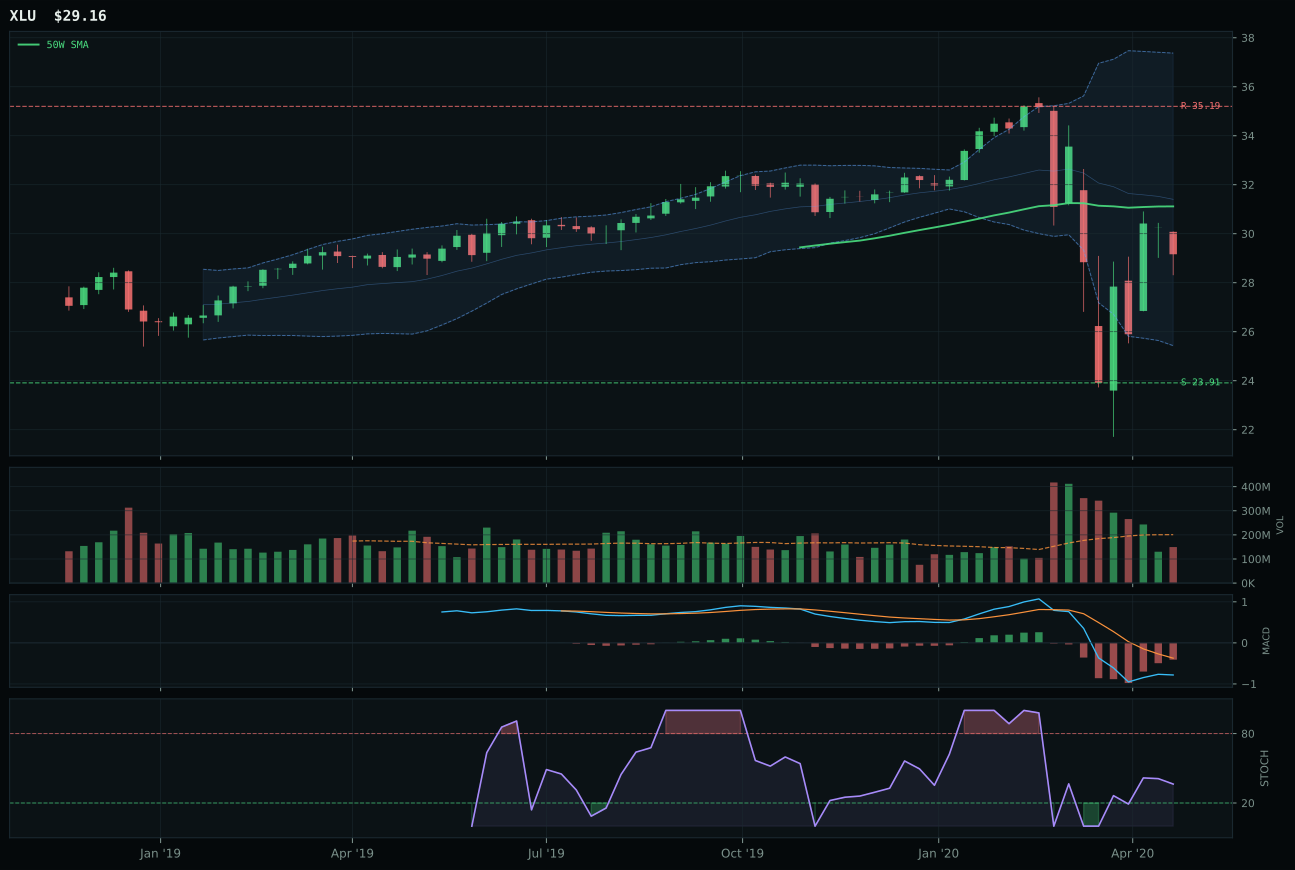
XLU has a neutral structure profile with -0.8% 13-week relative strength versus SPY.
A failed hold above support would weaken the setup.
Actionable but governed by invalidation levels.
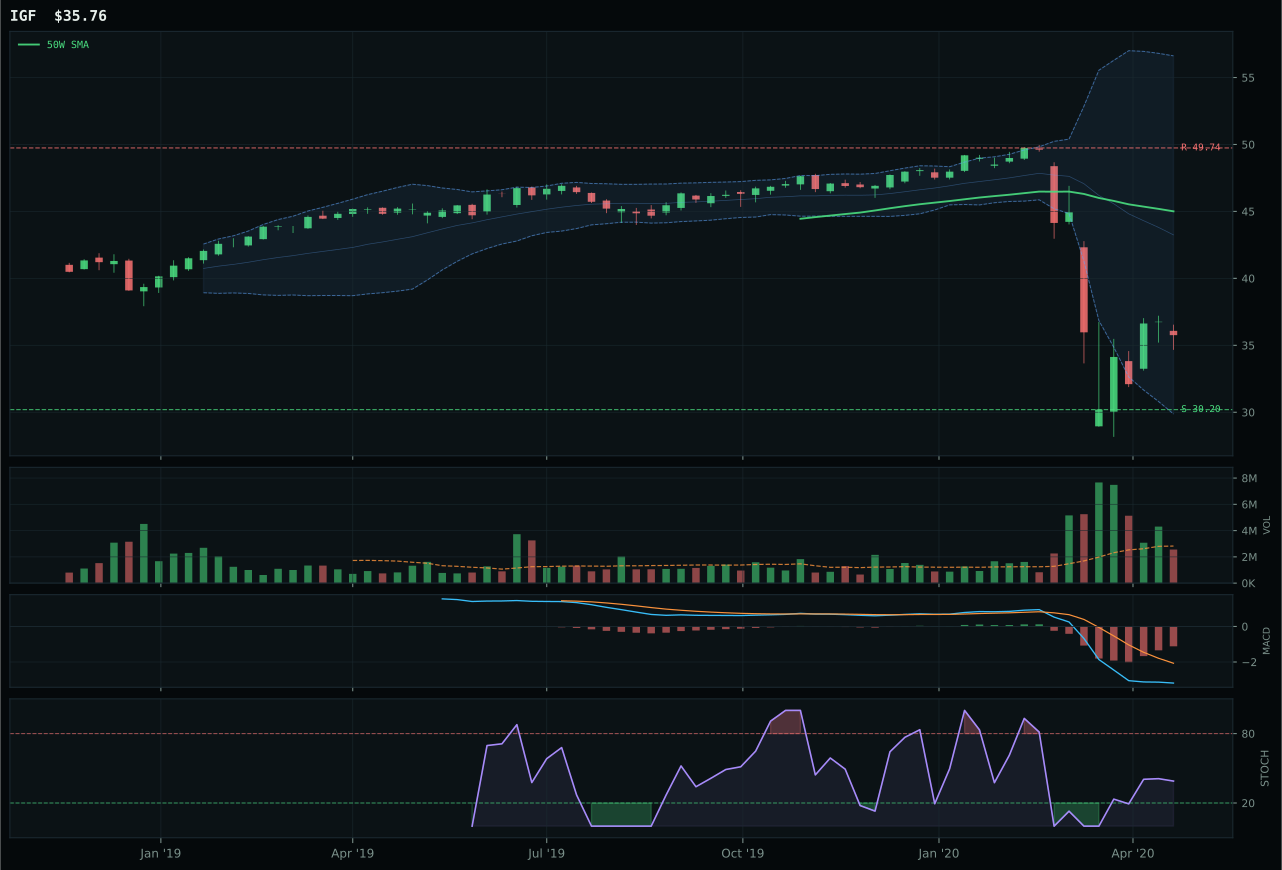
IGF has a neutral structure profile with -13.1% 13-week relative strength versus SPY.
A failed hold above support would weaken the setup.
Actionable but governed by invalidation levels.
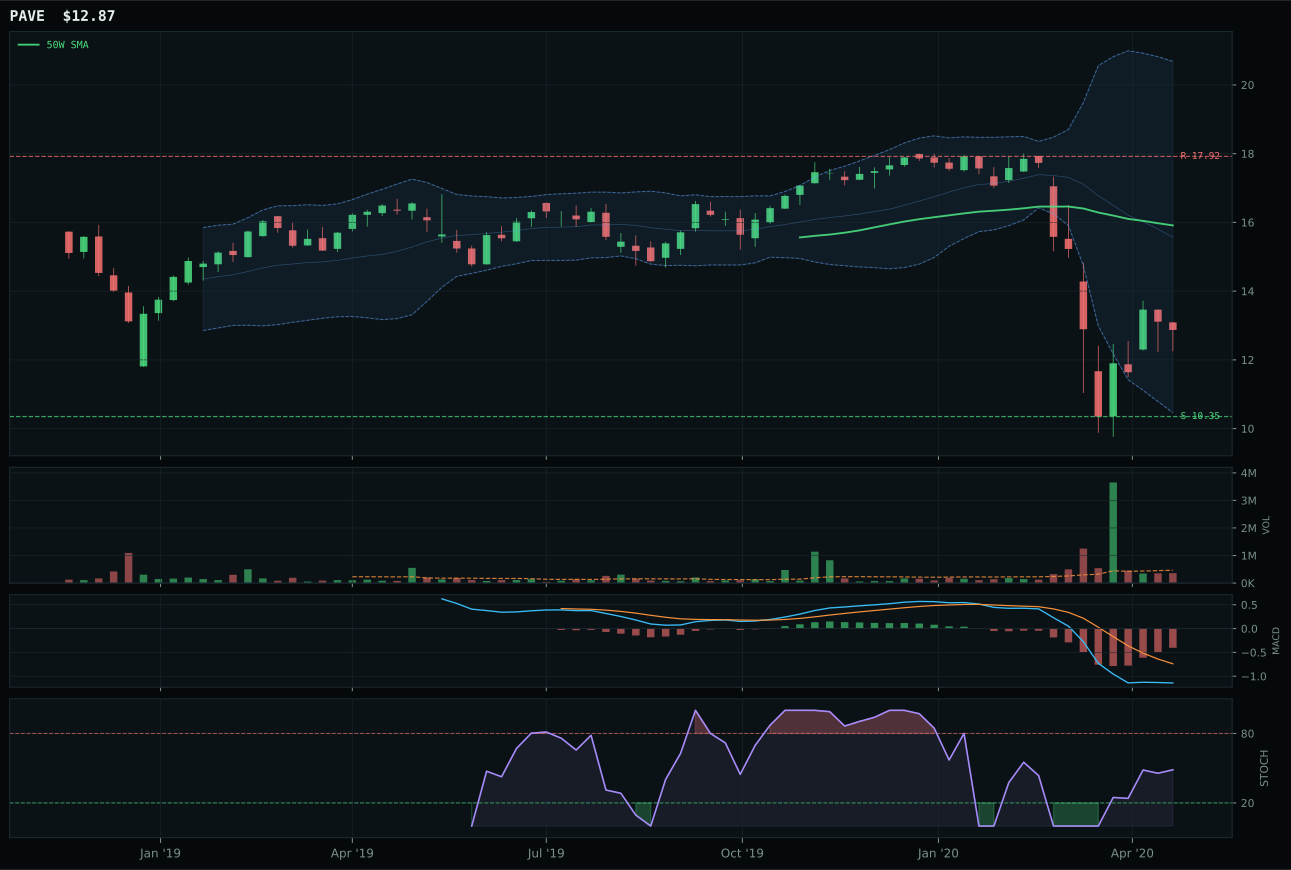
PAVE has a neutral structure profile with -12.8% 13-week relative strength versus SPY.
A failed hold above support would weaken the setup.
Tracked, but not top-2 eligible because: .
XLU wins Utilities & Infrastructure with timing precision: price sits 6.3% below the 50W at the 0.500 Fibonacci midpoint, a classic pullback into support that scores 90.0/100 for timing. MACD bearish but improving and stochastic RSI rising mid-zone create ideal conditions for mean-reversion accumulation. Category-relative strength of 12.1% lifts XLU above IGF's -0.3%, positioning the sector ETF as the leadership vehicle within a defensive cohort. IGV's timing score of just 63/100 and deeper 27W drawdown make it a laggard; PAVE's weakness in trend (23/100) and structure (neutral) eliminate it from consideration. XLU's trend score of 66.9/100 reflects price above the 200W even if below the 50W—a reset setup rather than a breakdown. Volume at 0.74x is thin, consistent with a defensive hold, and risk/reward at 52.1/100 balances modest upside to resistance (-17.1%) against reasonable downside support (-22.0%).
Utilities & Infrastructure secures 5% allocation as a tier-2 category with a score of 38.1, ranking above Nuclear Energy but well below the top-two leaders. The category earns its slot through powerful defensive macro support: defensive rotation (+12) and disinflation pressure (+6) combine with broad market bear (+4) to deliver a 76.0% category-level macro fit—the second-highest in the portfolio after Precious Metals. Technical evidence at 50.4/100 is moderate, meaning this allocation is driven by macro fit more than technical conviction. XLU's 90/100 timing score and 12.1% category-relative strength provide the technical case for holding, yet the overall category score of 38.1 reflects muted momentum and modest structure quality. The allocation is defensive in character: it provides diversification against risk-off scenarios where disinflation accelerates and equity weakness persists. To upgrade Utilities to top-2 would require sustained price recovery above the 50W and momentum confirmation—neither currently evident. This 5% represents insurance against tail scenarios, justified by the convergence of three defensive descriptors firing simultaneously.
Nuclear Energy — URA
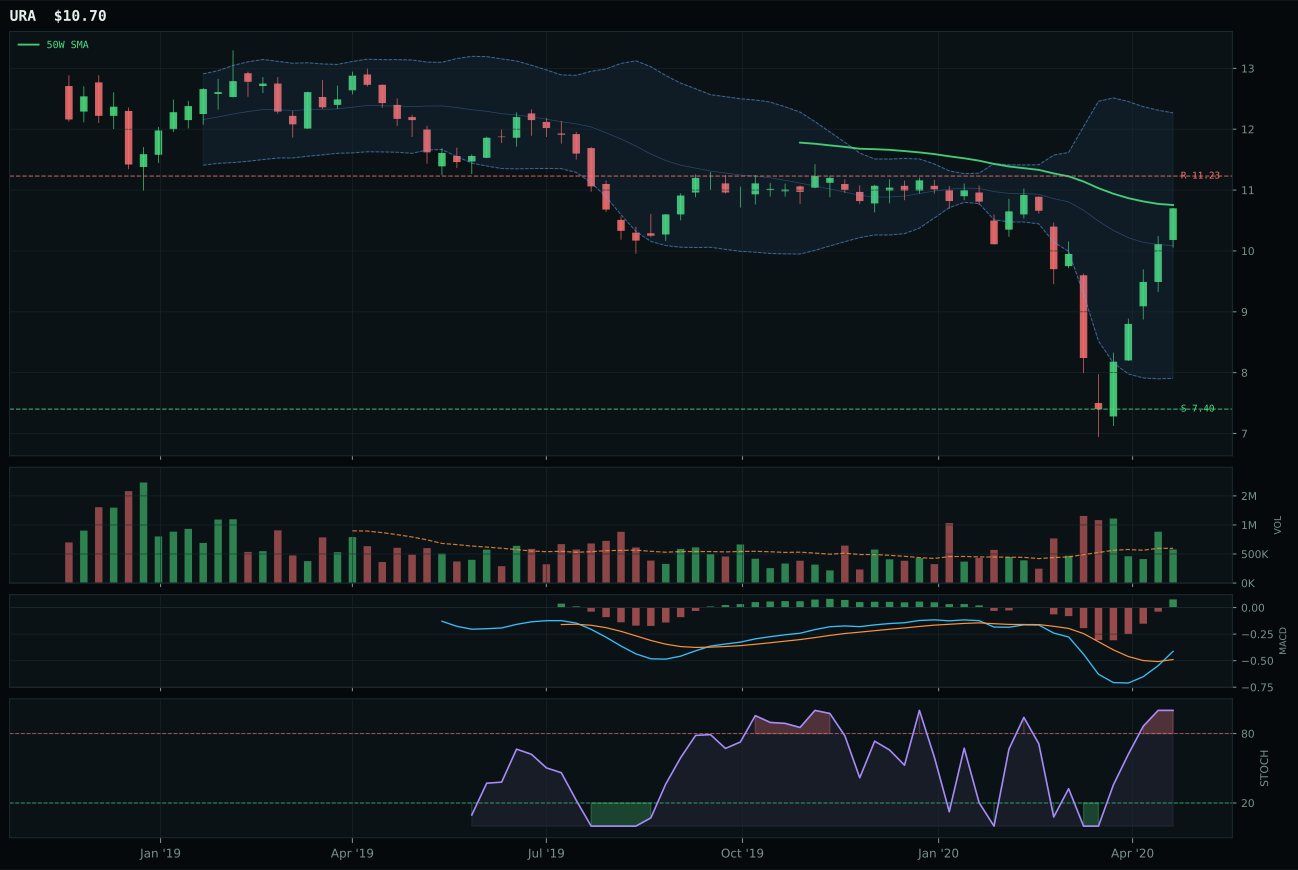
URA has a compression near 50W profile with 12.9% 13-week relative strength versus SPY.
Extension and support failure are the main tactical risks.
Tracked, but not top-2 eligible because: structurally broken.
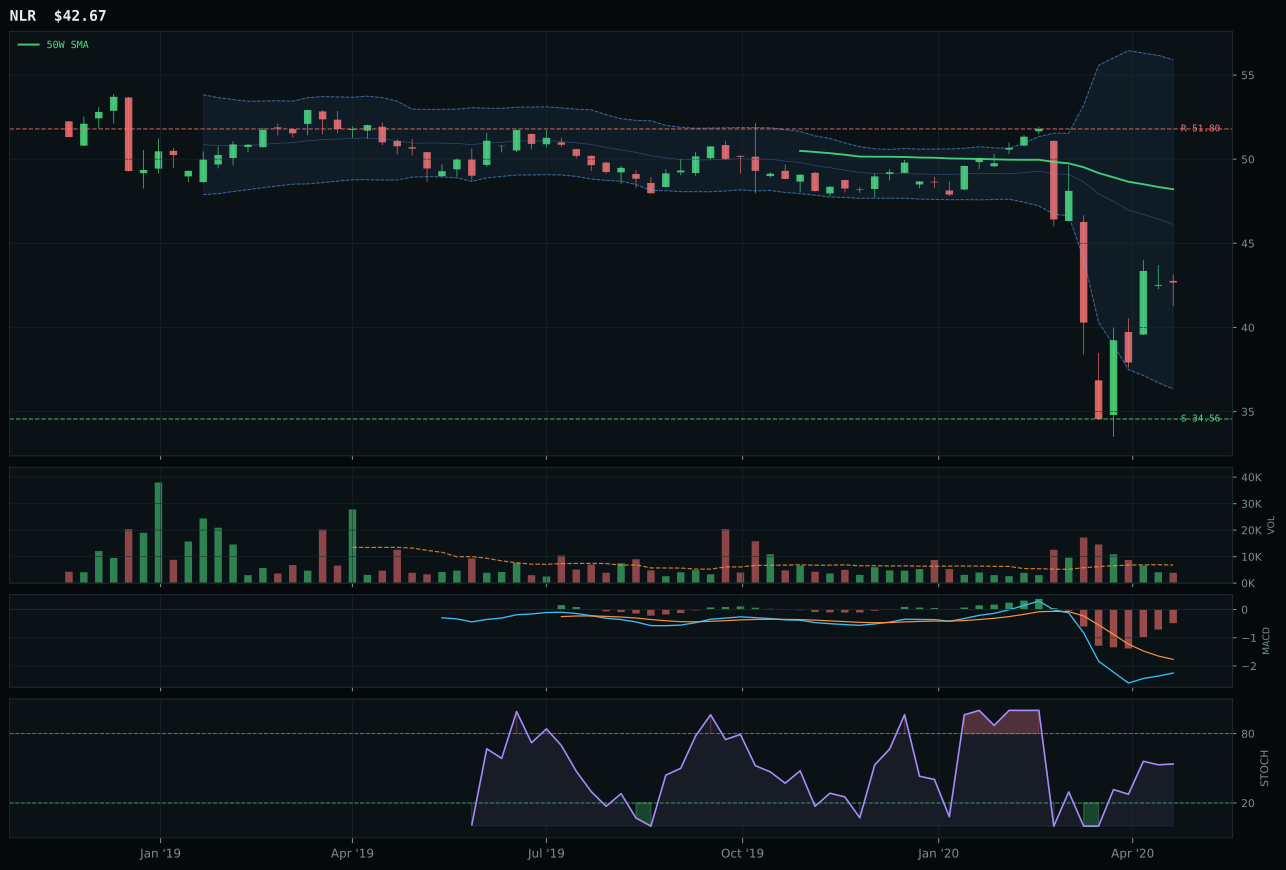
NLR has a neutral structure profile with -0.8% 13-week relative strength versus SPY.
Extension and support failure are the main tactical risks.
Tracked, but not top-2 eligible because: structurally broken.
URA wins Nuclear Energy by delivering perfect timing—price compresses within 0.5% of the 50W near the upper Fibonacci retracement at 0.236, while MACD turns bullish and stochastic RSI reaches overbought 1.00, earning a 100.0/100 timing score and 100.0/100 momentum confirmation. The 4W return of 30.8% against a near-flat 13W return of -1.0% shows pure recent accumulation into a coiled spring. Category-relative strength of 6.9% places URA as the strongest performer in a two-horse race, and SPY relative strength of 12.9% confirms genuine sponsor interest. NLR's structural collapse (setup neutral structure with thin volume at 0.97x) and bearish MACD position it as a defensive utility play trailing the nuclear story. URA's compression setup near the 50W creates meaningful upside potential if buyers defend the level; the coil is real and the technicals are clean. Volume at 0.97x is neutral, avoiding false breakout risk.
Nuclear Energy receives 5% allocation as a tier-2 category with a final score of 31.4, ranking above several damaged groups but below the top two. The category is marked ineligible despite positive technical attributes, meaning the allocation is conditional and structural fragility remains a concern. URA's perfect timing score (100/100) and momentum confirmation (100/100) are offset by weak trend (55/100) since price still sits below the 50W even if compressed. AI growth sponsorship (+5) provides modest macro support, but credit stress (-5) offsets it. Category-level macro fit of 50.0/100 is neutral, neither attractive nor repulsive. The allocation choice reflects URA's unique combination of bullish technicals (MACD turning, stochastic at overbought, compression at the 50W) within a category that lacks conviction. To upgrade Nuclear Energy to top-2 would require price to break above the 50W with volume confirmation and the macro descriptors to shift from neutral to supportive. This is a 5% bet on a coiled setup that could translate into breakout momentum if the regime cooperates.
Defense & Aerospace — ITA
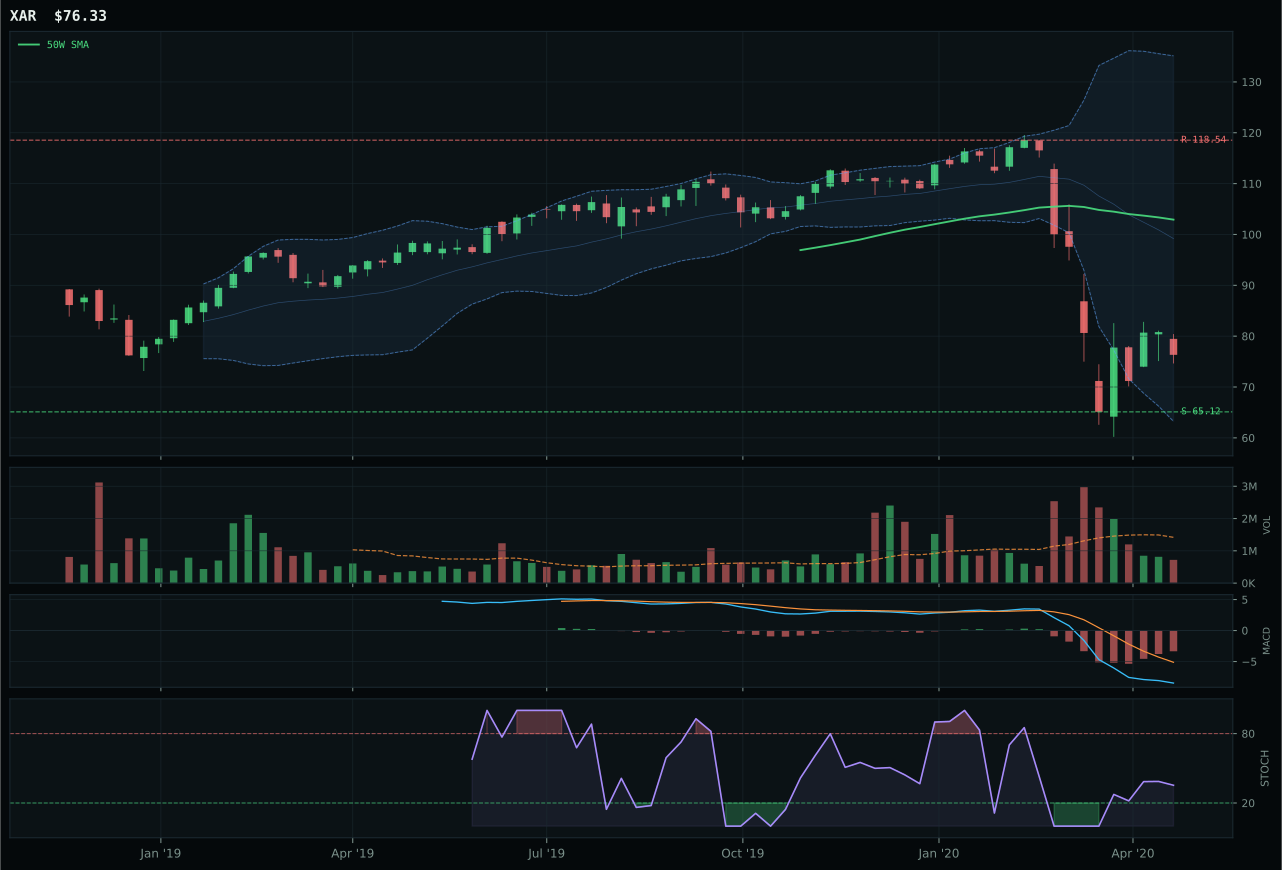
XAR has a neutral structure profile with -20.0% 13-week relative strength versus SPY.
A failed hold above support would weaken the setup.
Actionable but governed by invalidation levels.
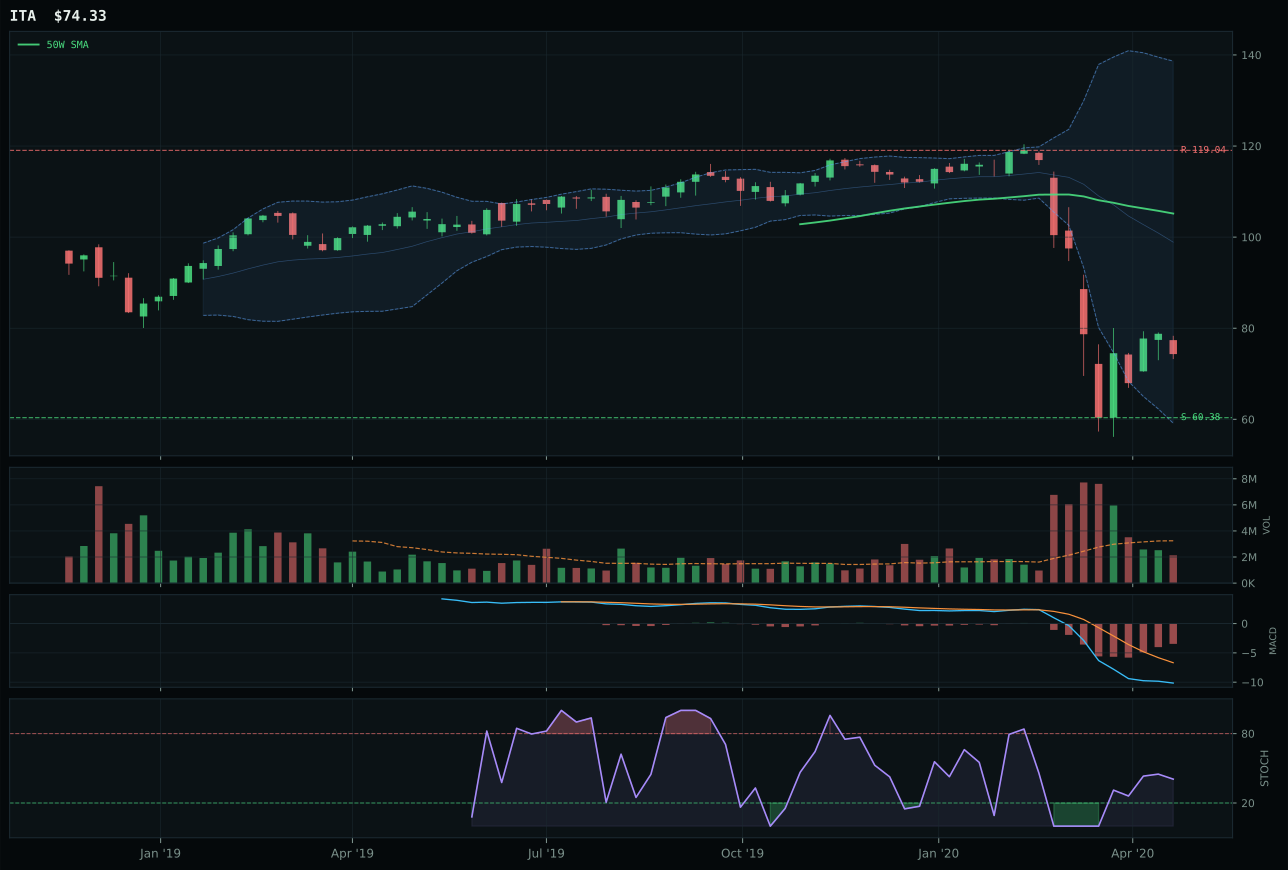
ITA has a neutral structure profile with -21.9% 13-week relative strength versus SPY.
A failed hold above support would weaken the setup.
Actionable but governed by invalidation levels.
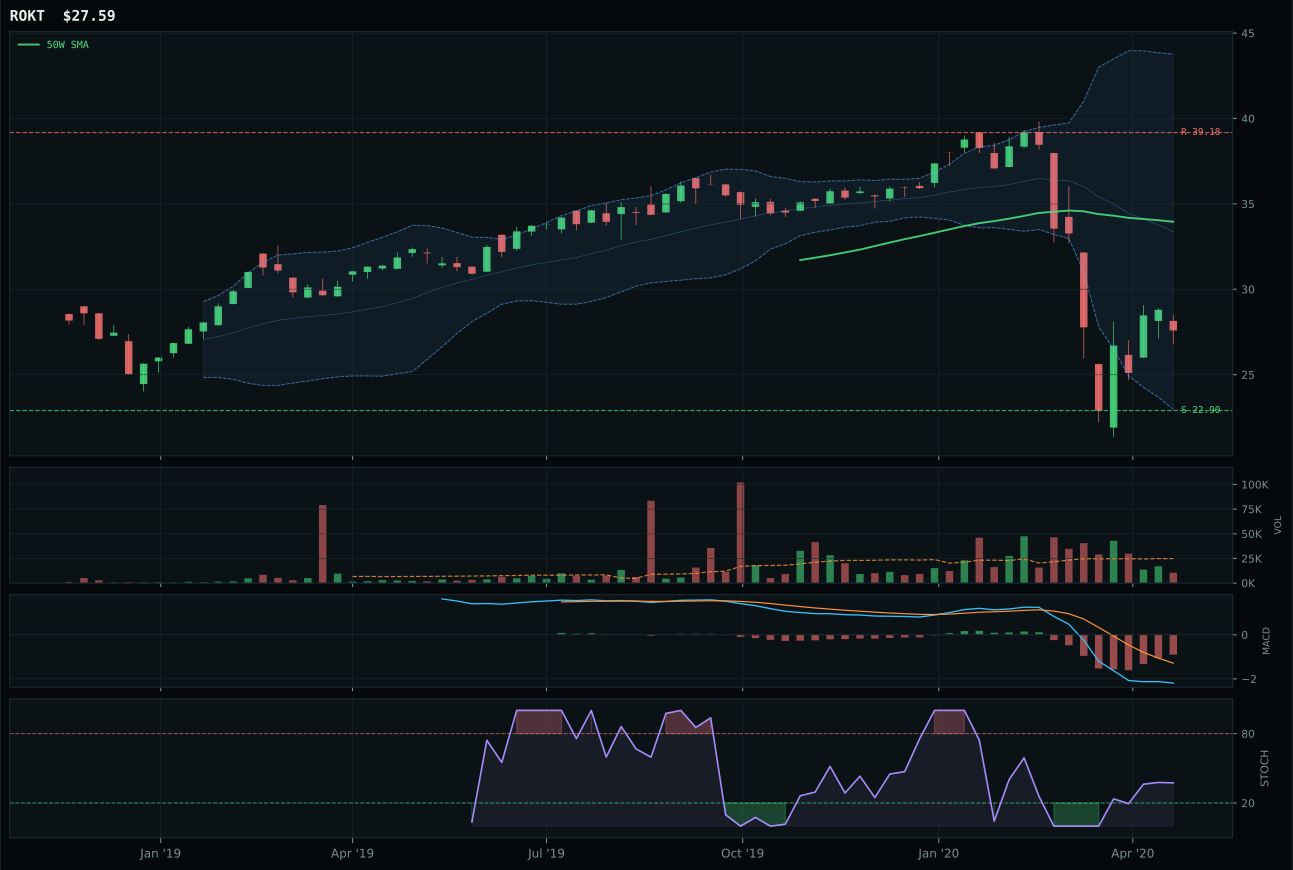
ROKT has a neutral structure profile with -14.0% 13-week relative strength versus SPY.
A failed hold above support would weaken the setup.
Tracked, but not top-2 eligible because: .
ITA wins Defense & Aerospace, but this is a category where winning means losing less. Price sits 29.3% below the 50W and 35.9% down over 13 weeks, delivering a trend score of just 33.0/100 against SPY's -21.9% relative weakness. ITA's edge over XAR comes not from positive technical proof but from a marginally superior blend: structure scores 55.8 versus XAR's neutral, and the risk/reward calculation (59.2 versus 67) slightly favors the ITA setup despite both trading in deep value territory near the 0.786 Fibonacci level. Volume at 0.66x the 20W average is thin participation across both names, and the MACD is bearish but improving in both cases. Momentum confirmation sits at an anemic 0.0/100 for ITA; the 4W return of -0.2% shows no bounce sponsorship. This is a category held because defensive rotation is active and broad market bear conditions provide a macro bid, not because the technical setup inspires confidence.
Defense & Aerospace holds a 5% allocation despite earning only 27.4 points and ranking outside the top tier. The decision to include this category rests entirely on macro descriptor support: defensive rotation is active (+8), broad market bear status provides +6, and dollar pressure adds +3. Technical evidence rates at a threadbare 5.8/100 for the representative, meaning the allocation is a pure macro hedge rather than a technical conviction trade. ITA's structural breakdown and zero momentum confirmation would ordinarily disqualify this category entirely, yet the 72.0% macro fit score at the category level—driven by three defensive descriptors firing simultaneously—justifies holding the 5% sleeve as portfolio insurance. Goldilocks conditions offer little support (+3 only), and credit stress actively penalizes this exposure. The allocation is conditional: if defensive rotation weakens or the market reprices risk-off trades, this category becomes first in line for reallocation. It exists because macro warrant it, not because technicals invite it.
Traditional Energy — FCG
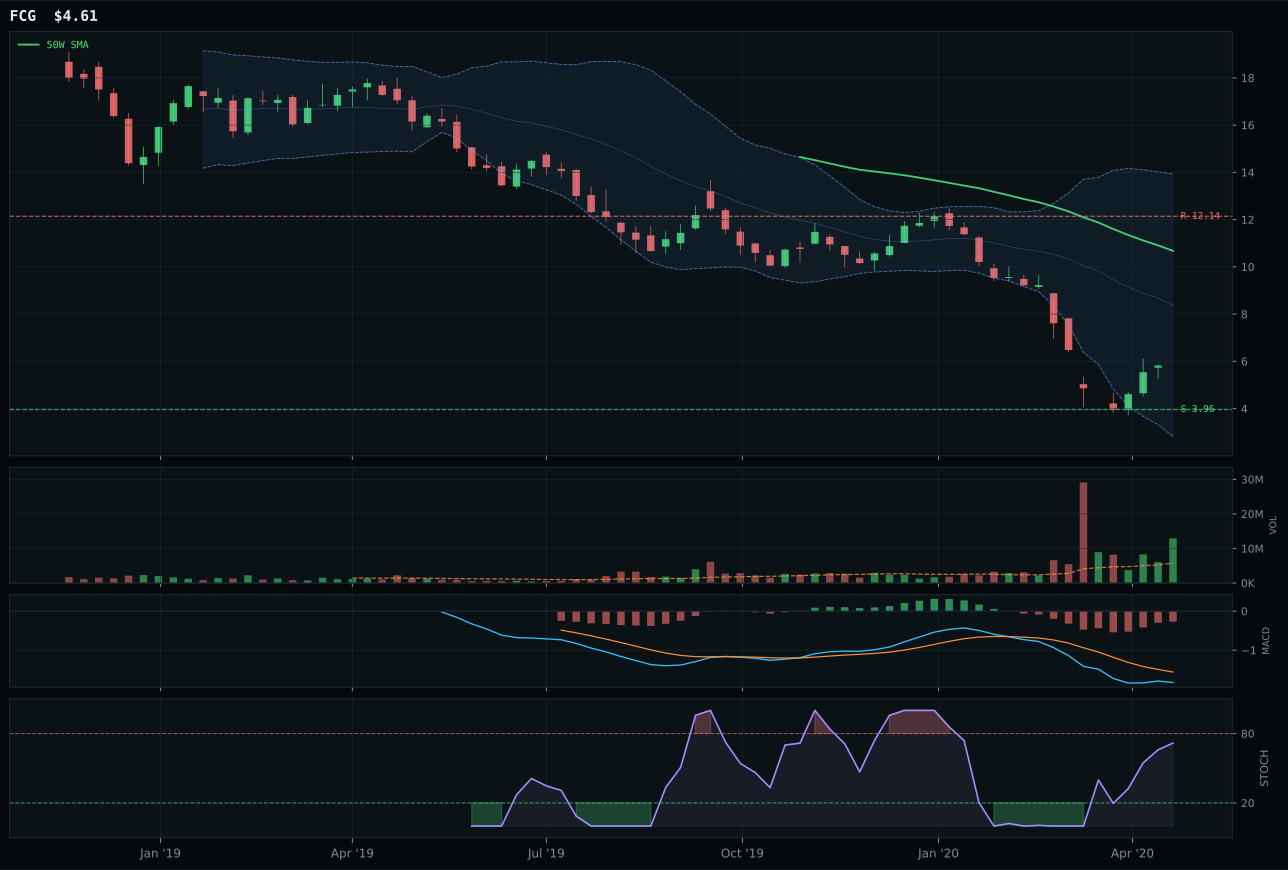
FCG has a neutral structure profile with -20.5% 13-week relative strength versus SPY.
Extension and support failure are the main tactical risks.
Tracked, but not top-2 eligible because: structurally broken.
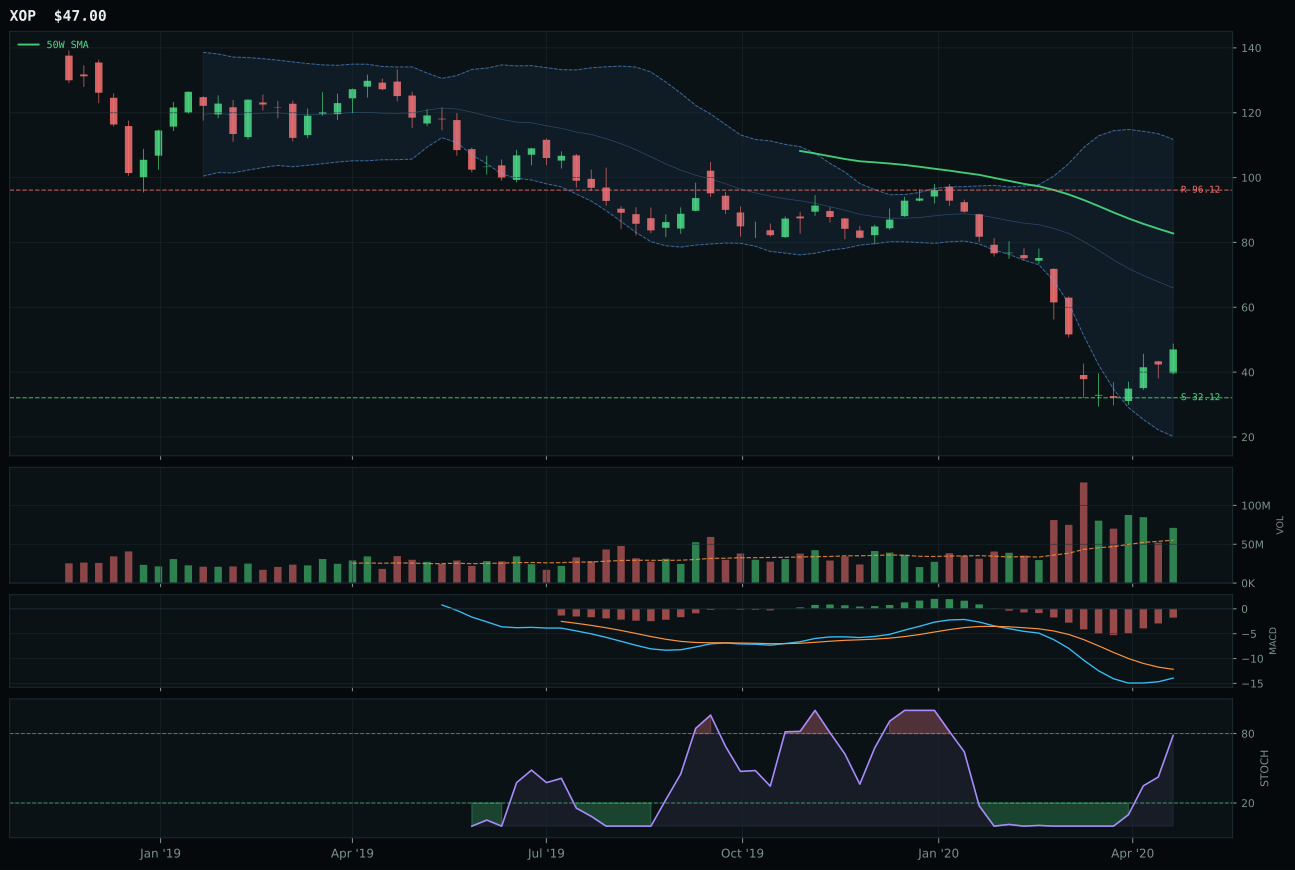
XOP has a neutral structure profile with -28.6% 13-week relative strength versus SPY.
Extension and support failure are the main tactical risks.
Tracked, but not top-2 eligible because: structurally broken.
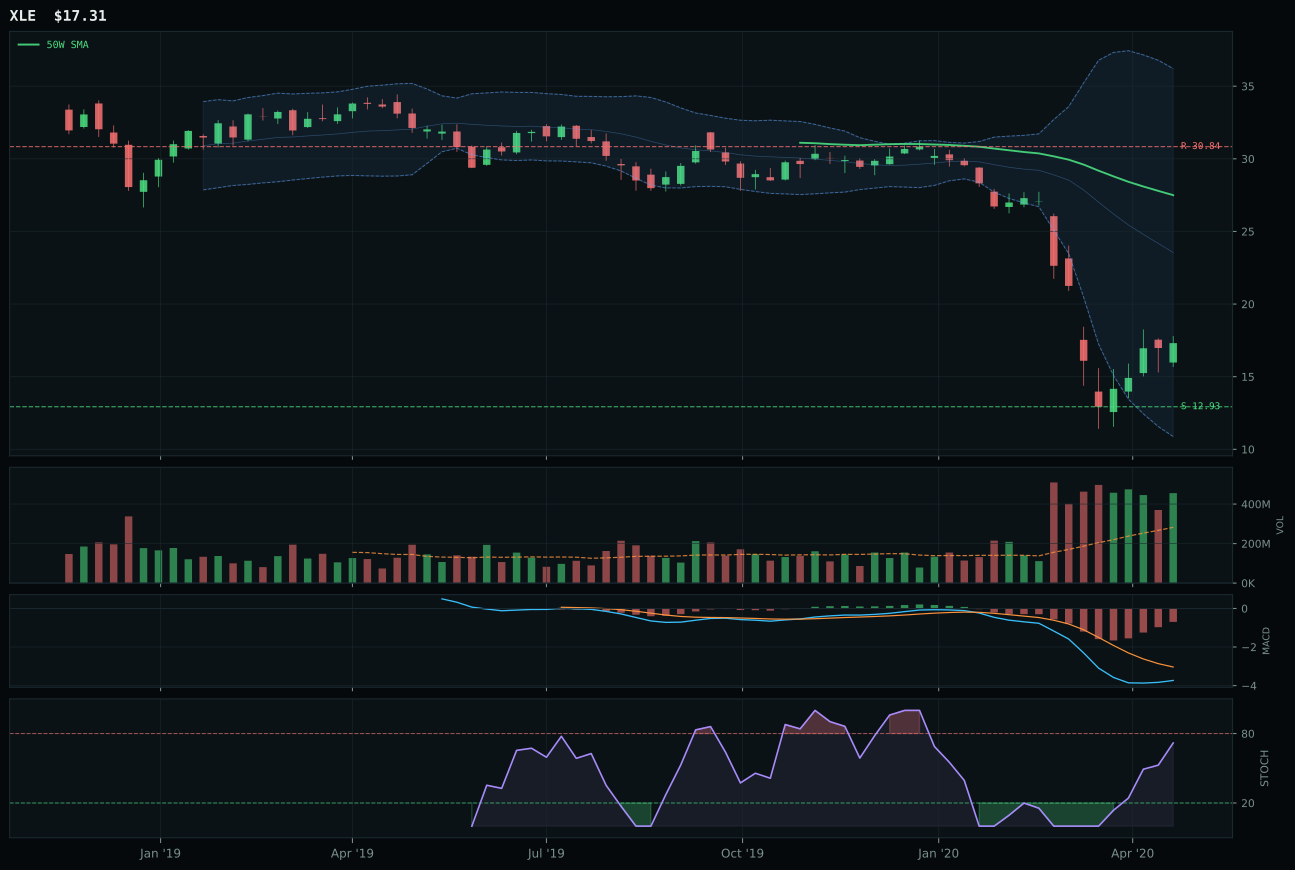
XLE has a neutral structure profile with -24.9% 13-week relative strength versus SPY.
Extension and support failure are the main tactical risks.
Tracked, but not top-2 eligible because: structurally broken.
FCG wins Traditional Energy as the category representative, but the final score of 0.0 and ineligible status mean this is a leadership role with zero capital attached. Price sits 37.3% below the 50W with -34.5% 13W return and -20.5% SPY relative weakness, yet FCG earns selection because volume explodes to 2.24x the 20W average—strong accumulation/confirmation at capitulation lows near the 0.786 Fibonacci level. The 4W return of 68.9% and stochastic RSI at overbought 1.00 create a 100.0/100 momentum confirmation score, the strongest signal in the broken category. Structure at 32.9/100 is still mediocre, and risk/reward at 46.7/100 leaves 44.9% downside to resistance. XOP's weakness in volume confirmation (above-average participation versus accumulation/confirmation) and category-relative strength (-3.7% versus +4.4%) explains the loss. This is a capitulation spike into deep value with sponsor accumulation, but the underlying trend remains broken.
Traditional Energy is excluded at 5% allocation despite a tier-2 rank that would otherwise deliver 5%. The category scores 0.0 and is marked ineligible due to structural damage, a consequence of disinflation pressure (-10) and credit stress (-7) creating a -17 combined headwind that no macro offset can overcome. Goldilocks conditions provide no category-specific descriptor boost; the macro regime is simply hostile to energy. FCG's recent spike in volume to 2.24x the 20W average and overbought stochastic suggest contrarian accumulation at panic lows, yet this is not enough to overcome the technical unwinding and macro headwinds. Technical evidence at 41.2/100 is poor, and the category-level macro fit of 33.0/100 is the second-worst in the portfolio. Traditional Energy remains a zero until one of two conditions emerge: either credit stress and disinflation expectations reverse, or price stabilizes above the 50W with renewed volume participation at higher levels. FCG's current bounce into overbought territory is a potential warning flag rather than a buy signal—a last capitulation before further weakness.
Emerging Markets — INDA
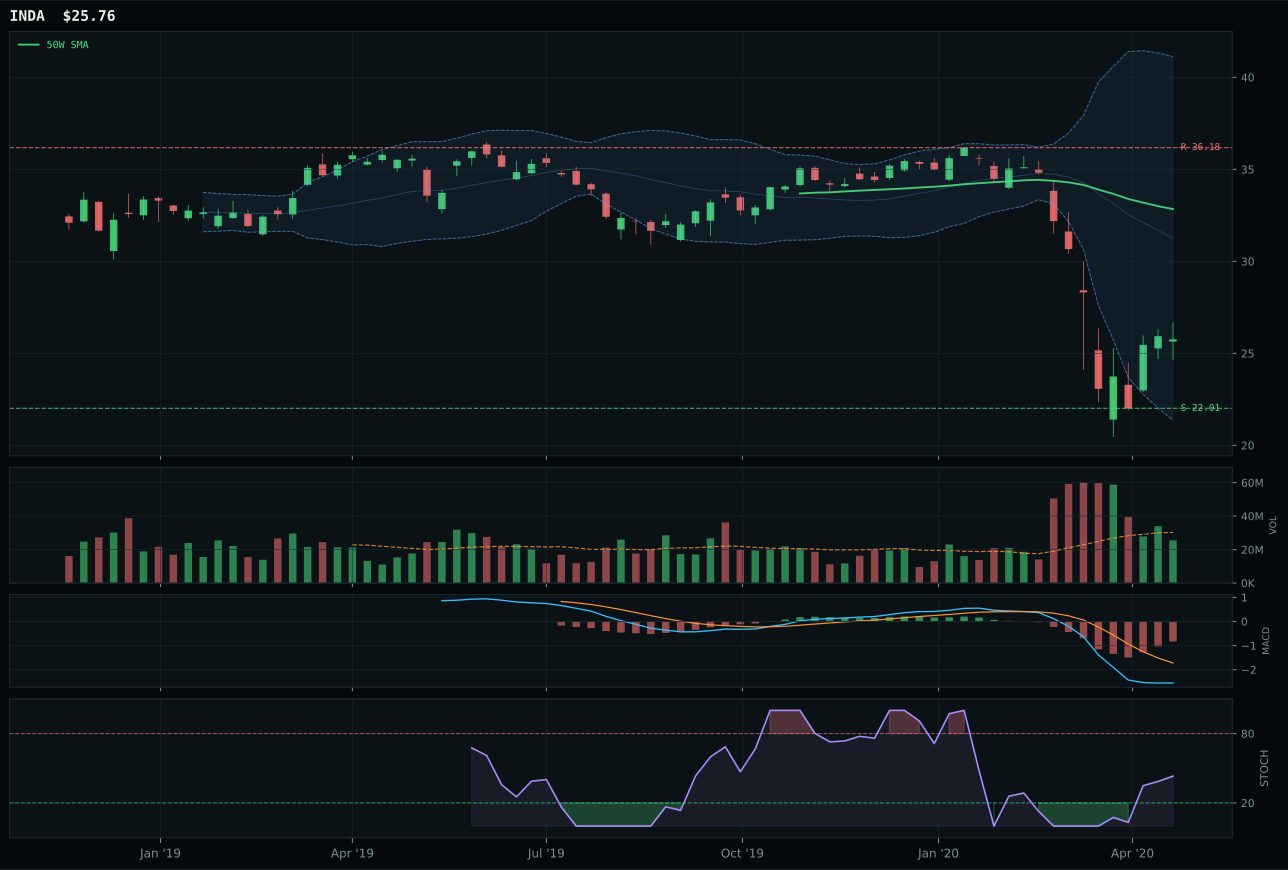
INDA has a neutral structure profile with -13.7% 13-week relative strength versus SPY.
A failed hold above support would weaken the setup.
Actionable but governed by invalidation levels.
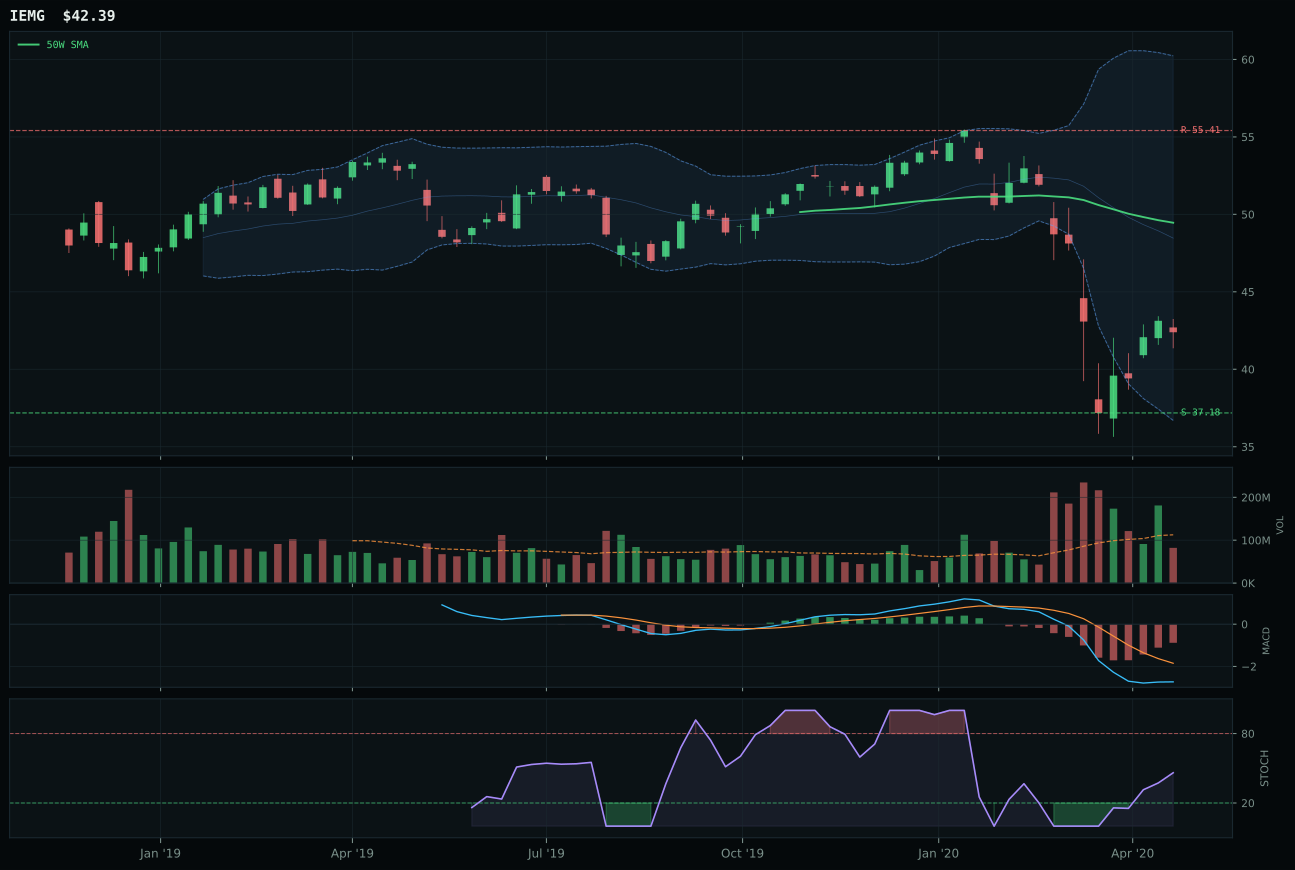
IEMG has a neutral structure profile with -6.9% 13-week relative strength versus SPY.
Extension and support failure are the main tactical risks.
Tracked, but not top-2 eligible because: structurally broken.
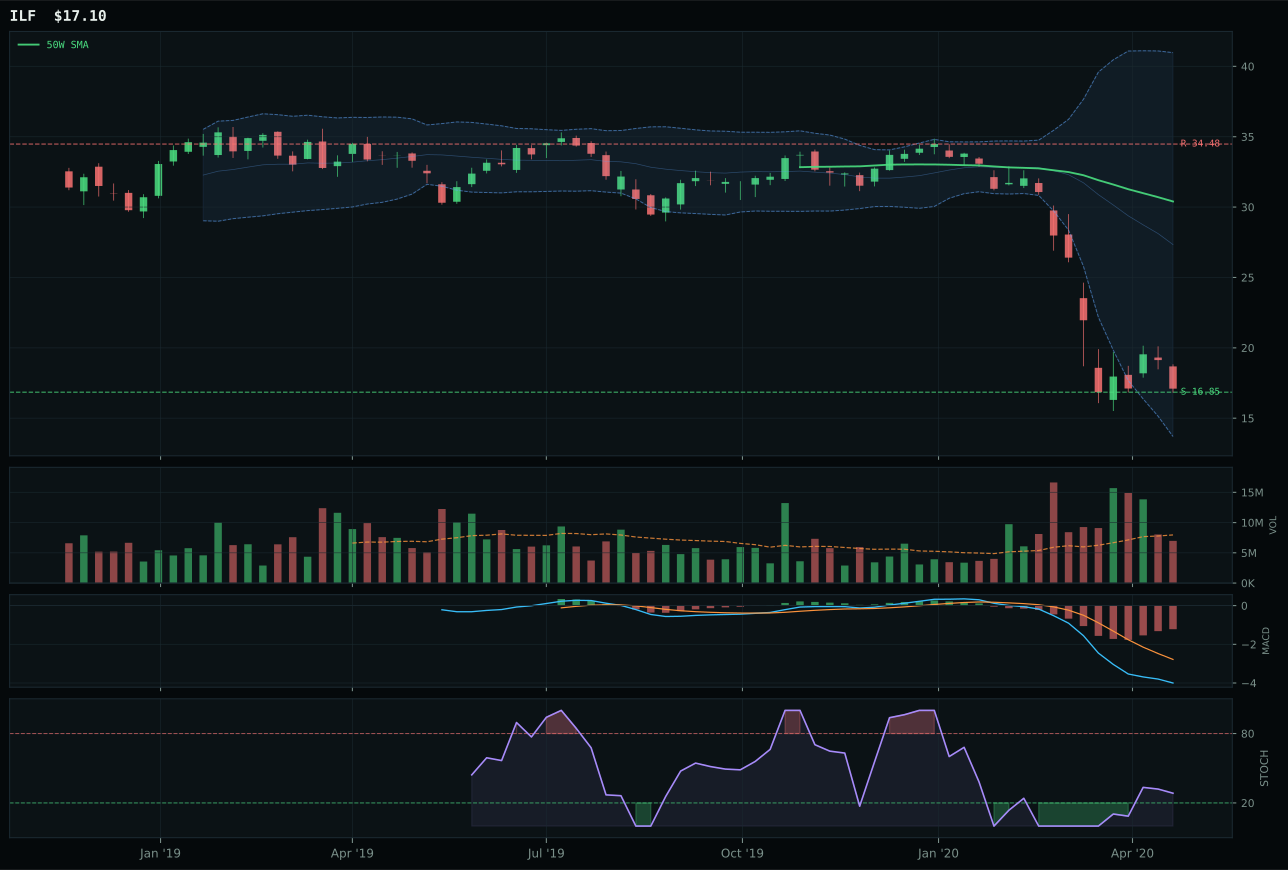
ILF has a pullback into support profile with -34.4% 13-week relative strength versus SPY.
Extension and support failure are the main tactical risks.
Tracked, but not top-2 eligible because: structurally broken.
INDA prevails over IEMG despite lower absolute technical evidence (31.4 versus 40.2) because structure integrity is preserved at 61.9/100 versus IEMG's 32.3/100, triggering hard filters that mark IEMG as structurally broken. INDA sits 21.6% below the 50W with -27.6% 13W return and -13.7% SPY relative weakness, yet cleanliness of 41.7 and compression of 47.4 maintain enough setup coherence to represent the category. Volume at 0.84x the 20W average is neutral versus IEMG's thin participation at 0.83x—a marginal advantage but meaningful in the context of structural filters. Risk/reward at 60.4/100 for INDA versus 68/100 for IEMG reflects INDA's deeper drawdown, yet the structural penalty overrides the return profile. Category-relative strength at 0.0% for INDA versus 6.8% for IEMG shows IEMG holding relative strength, but structural damage is disqualifying. This is a category where the winner is selected on technical integrity, not promise.
Emerging Markets is excluded at 5% allocation with an ineligible status and 0.0 final score, marking it alongside Industrial Metals and Traditional Energy as a structurally broken category. Dollar pressure (-14) and credit stress (-10) create a -24 combined macro headwind that dominates; broad market bear adds another -9. Goldilocks conditions offer modest uplift (+8), and liquidity expansion adds +8, but neither overcomes the headwinds. Category-level macro fit registers at 33.0/100, and technical evidence across the three-ETF basket is weak across the board. INDA's selection as representative does not elevate the category because it too is marked ineligible—the structural damage is that severe. To earn reallocation, Emerging Markets would need synchronized relief: dollar weakness, credit stress easing, and broad market bear conditions lifting. As it stands, the category is a zero in an environment where dollar strength and credit concerns dominate global sentiment. Capital redirection to Precious Metals and other categories offers superior risk-adjusted returns in the current regime.
Agriculture & Livestock — MOO
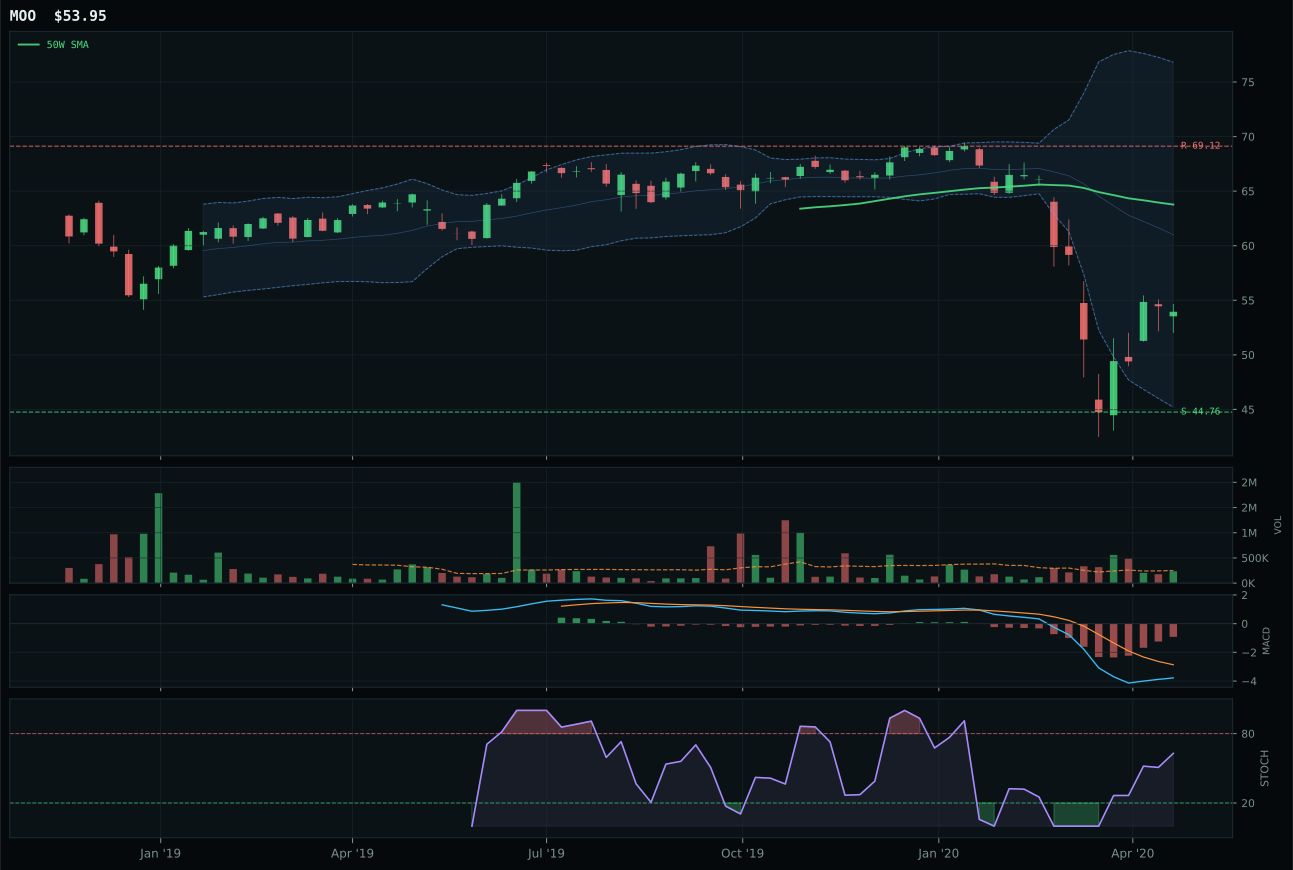
MOO has a neutral structure profile with -6.0% 13-week relative strength versus SPY.
A failed hold above support would weaken the setup.
Actionable but governed by invalidation levels.
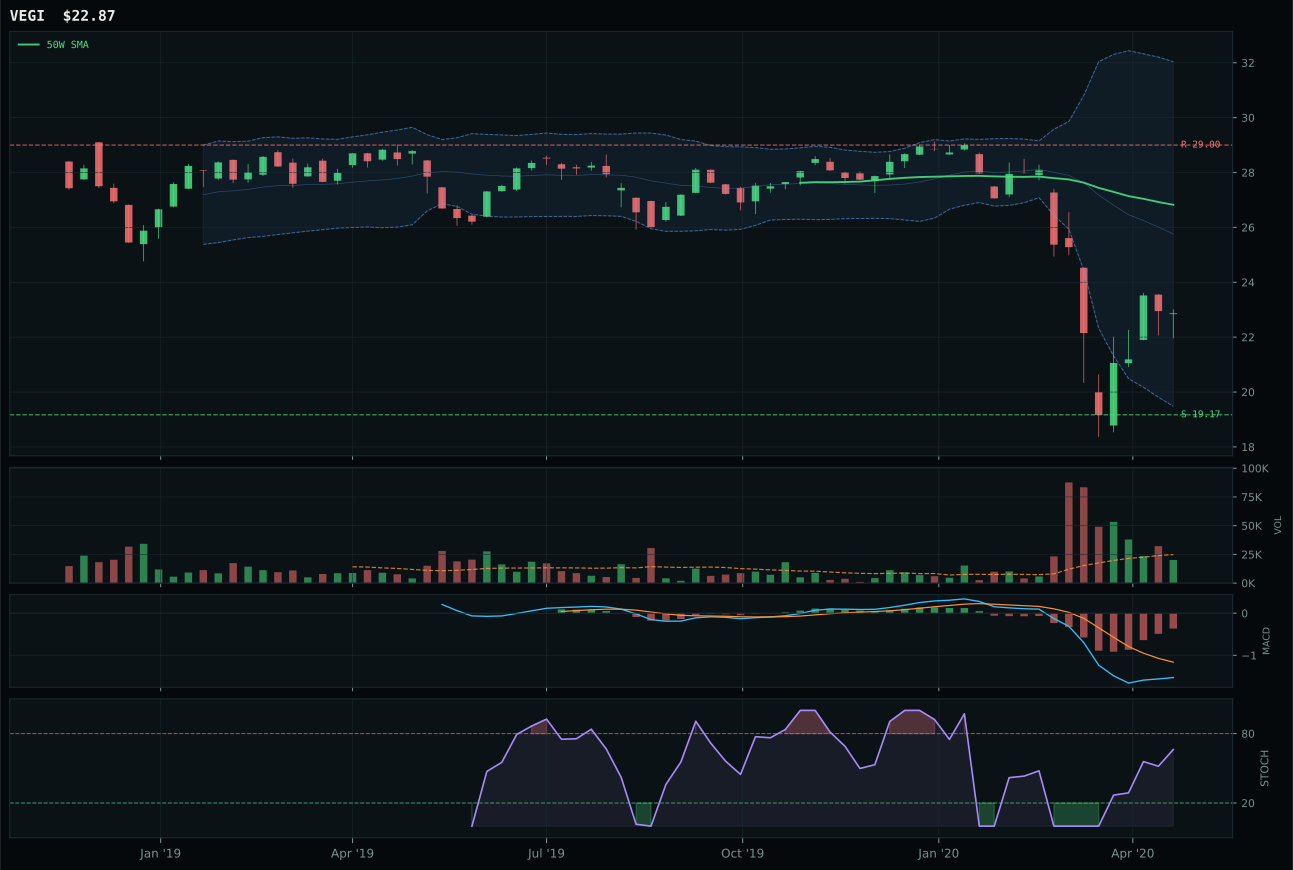
VEGI has a neutral structure profile with -4.3% 13-week relative strength versus SPY.
Extension and support failure are the main tactical risks.
Tracked, but not top-2 eligible because: structurally broken.
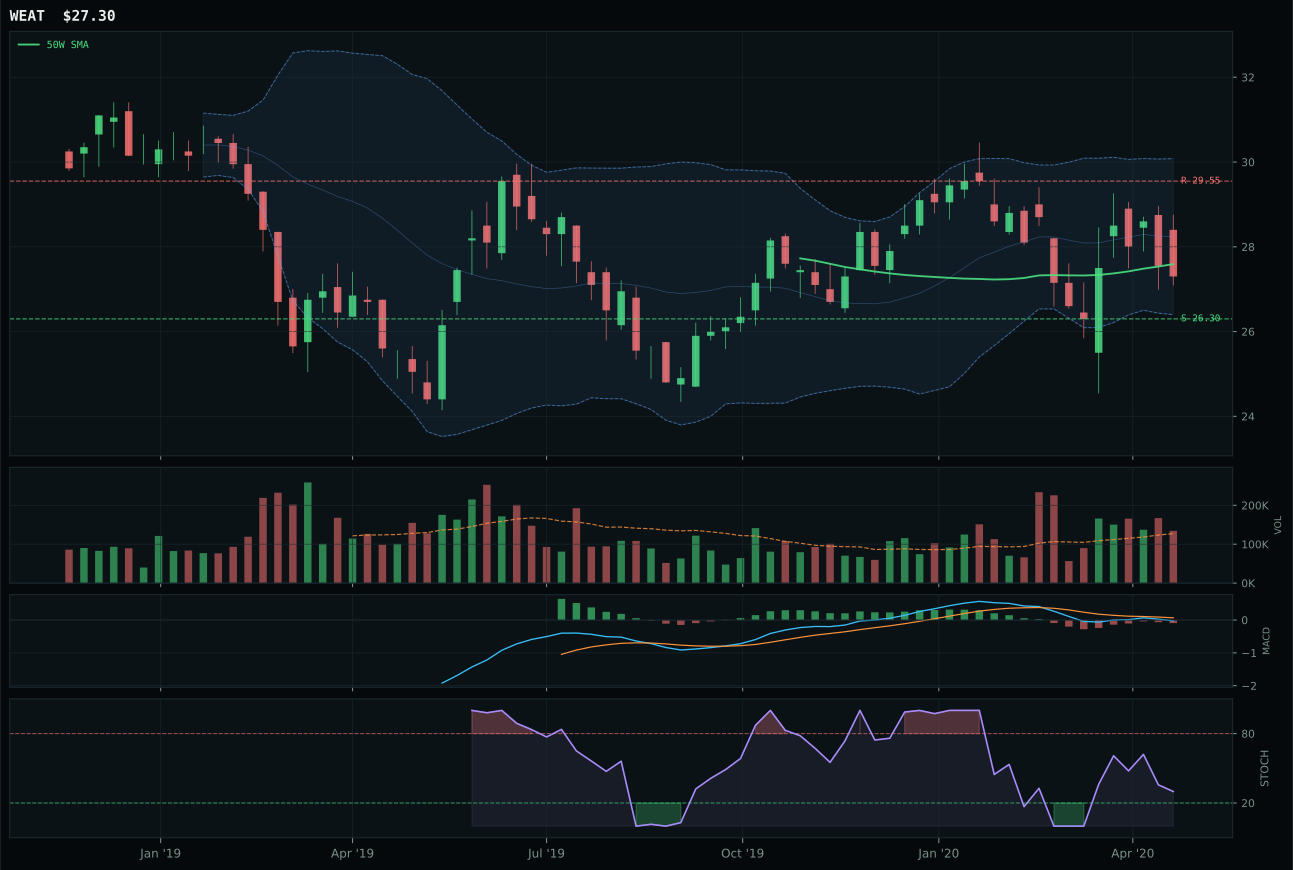
WEAT has a pullback into support profile with 6.3% 13-week relative strength versus SPY.
Extension and support failure are the main tactical risks.
Tracked, but not top-2 eligible because: structurally broken.
MOO survives as the category representative despite a final score of 4.6, the lowest in the universe, because VEGI's structural cleanliness collapsed to 36.6/100 versus MOO's 59.1/100 and triggered hard filters marking VEGI as structurally broken. MOO's trend of 39.0/100 is weak—price sits 15.4% below the 50W with -19.9% 13W return and -6.0% SPY relative weakness—but the setup at least maintains compression and support structure. Volume at 0.94x the 20W average offers neutral confirmation, and the stochastic RSI sits at 0.63 mid-zone, suggesting some coil. The score gap versus VEGI is 39.6 points, reflecting VEGI's structural damage rather than MOO's strength. This category's ultra-low score signals complete exclusion from the portfolio, and the winner status is almost academic—it defines which name would theoretically lead if the category earned allocation, but that condition does not hold.
Agriculture & Livestock is excluded entirely from the portfolio at 0% allocation, a direct consequence of its 4.6 final score ranking in the bottom tier. Disinflation pressure is the only active macro descriptor, and it delivers a -8 headwind to the category. Goldilocks conditions offer no support, and the technical decay across all three ETFs in the basket is severe—VEGI's structural collapse, MOO's 15.4% gap to the 50W, and WEAT's lack of broad sponsorship all conspire to create a category with no margin of safety. Category-level macro fit registers at just 42.0%, and the 3/2/1 weighted basket starts at 40.4 before adjustment, then collapses to 4.6 after the reasoner tests against persistence, setup quality, and eligibility filters. To earn reallocation, Agriculture would need technical stabilization (price recovery to the 50W), a shift in disinflation expectations, or an explicit macro catalyst. As it stands, the category's weak technicals combined with deflationary bias make it a clear zero in an environment where capital deployment must compete for finite allocation slots.
Industrial Metals — PICK
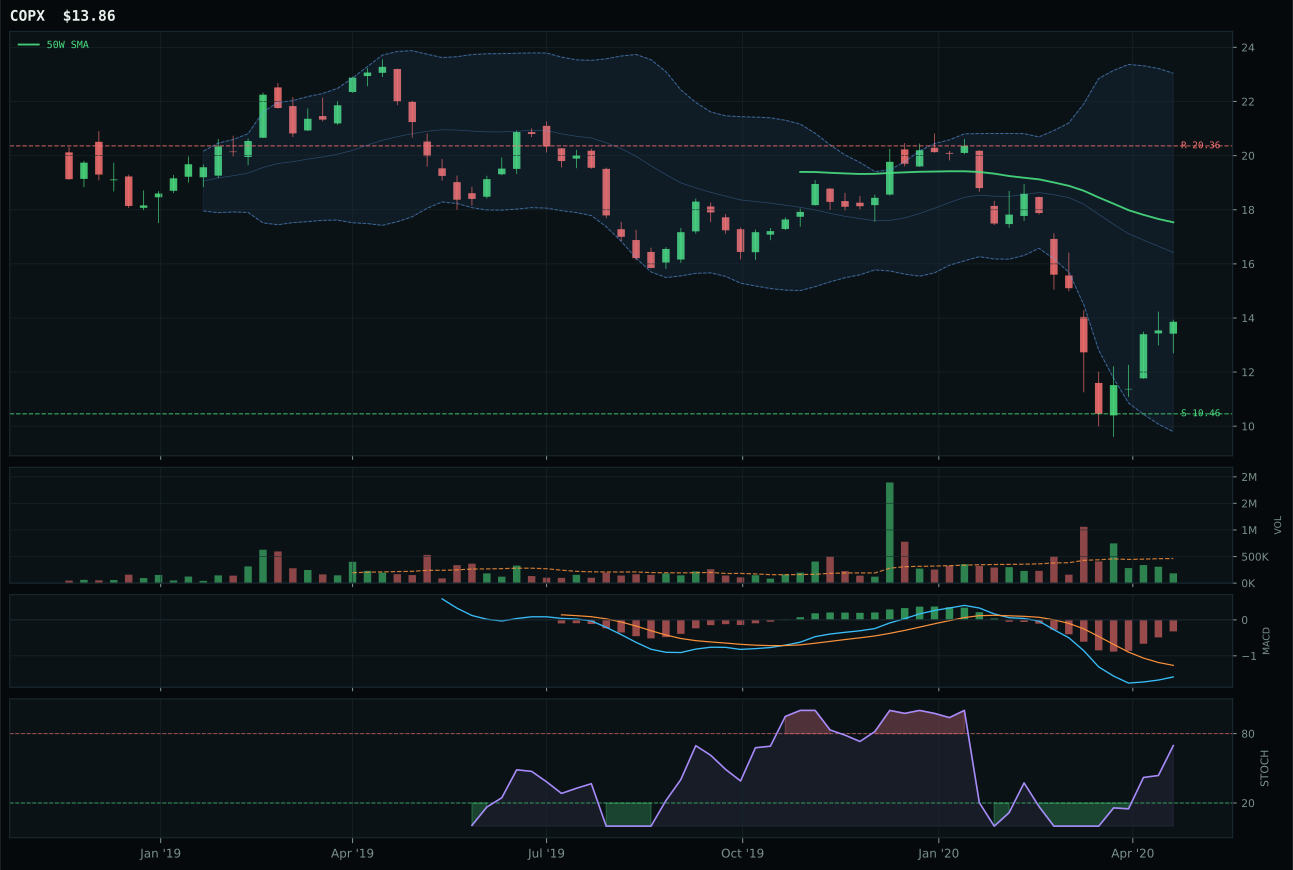
COPX has a neutral structure profile with -12.3% 13-week relative strength versus SPY.
Extension and support failure are the main tactical risks.
Tracked, but not top-2 eligible because: structurally broken.
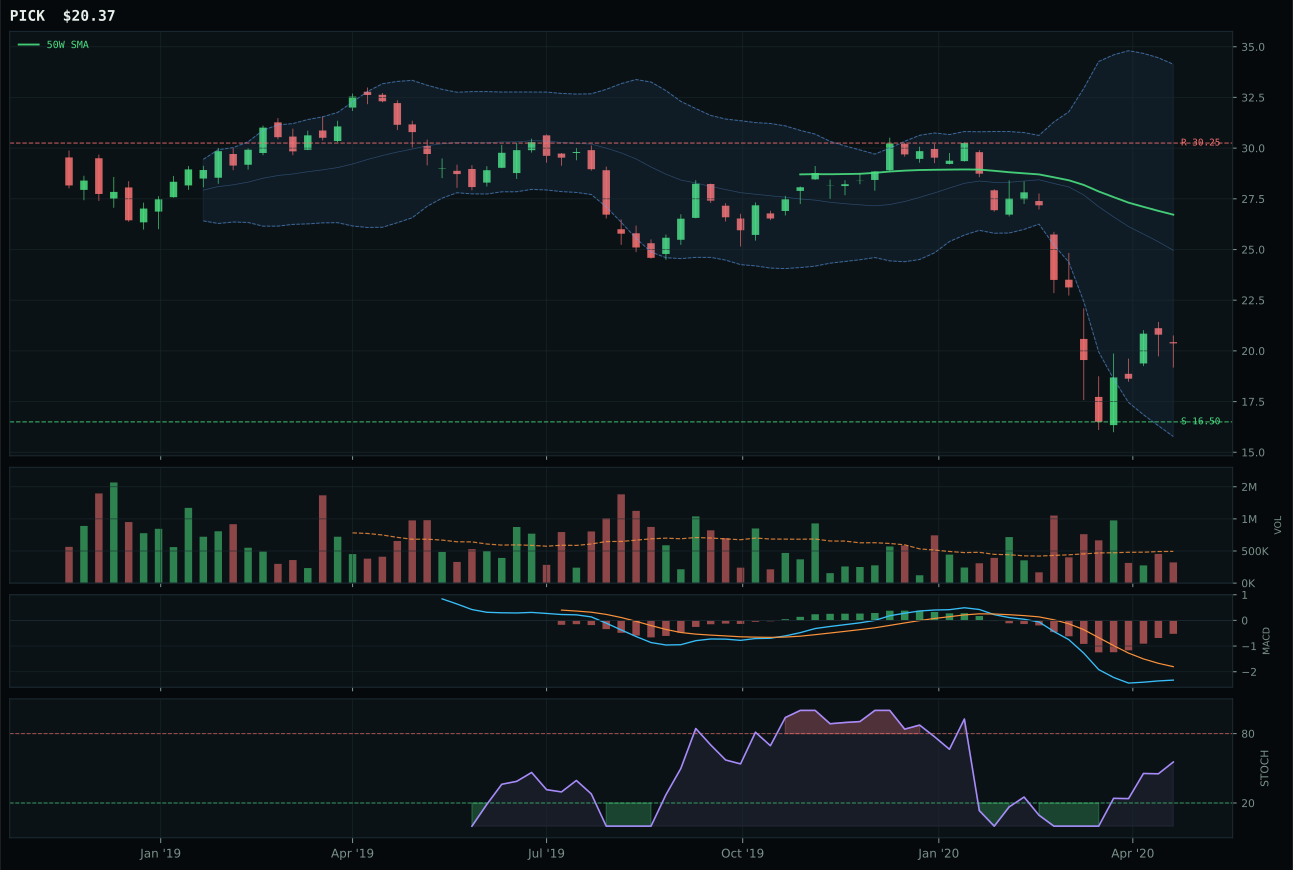
PICK has a neutral structure profile with -15.2% 13-week relative strength versus SPY.
Extension and support failure are the main tactical risks.
Tracked, but not top-2 eligible because: structurally broken.
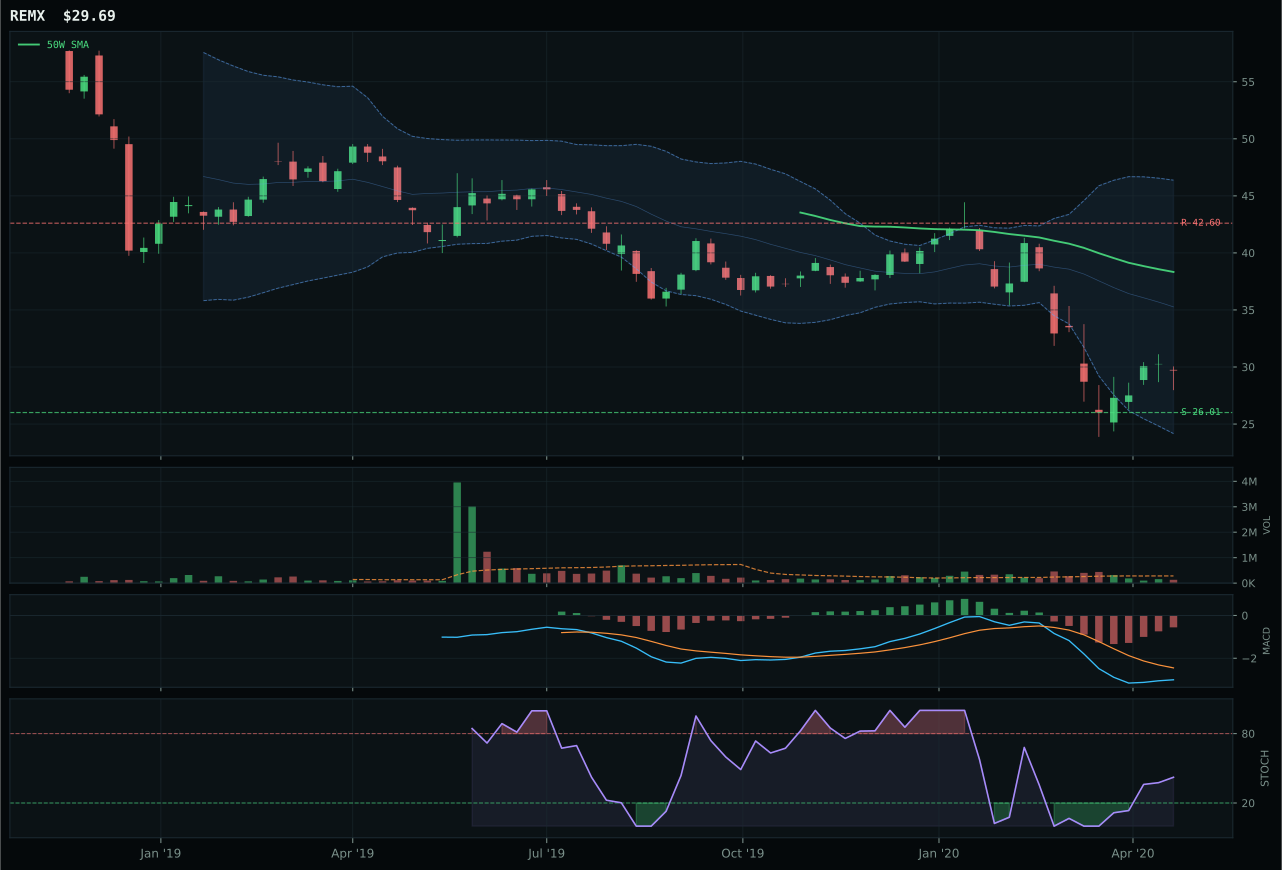
REMX has a neutral structure profile with -12.4% 13-week relative strength versus SPY.
Extension and support failure are the main tactical risks.
Tracked, but not top-2 eligible because: structurally broken.
PICK wins by default within a category that scores 0.0 and is marked ineligible, meaning no allocation flows and the winner designation is technical only. Price sits 23.8% below the 50W with -29.1% 13W return and -15.2% SPY relative weakness, delivering a trend score of 33.0/100 and a momentum confirmation of just 7.0/100. The 4W return of 9.0% shows some late-stage bounce, but category-relative strength of -2.8% places PICK as a laggard even within a broken peer set. COPX's risk/reward of 47.7 versus PICK's 55.1 was the deciding factor, though this margin reflects the selection of the least-bad option in a deteriorated group. Volume at 0.65x the 20W average is thin, and the deep value positioning near Fib 0.786 implies significant downside risk persists. Structure scores of 26.4/100 for PICK flag compression damage and poor cleanliness, confirming this is a category without integrity.
Industrial Metals is excluded entirely at 0% allocation with an ineligible status and 0.0 final score, the mathematical expression of complete structural breakdown. Dollar pressure (-7) and credit stress (-7) deliver symmetric headwinds, while Goldilocks conditions offer only +6 support—a weak net. Technical evidence across all three miners collapsed to 0.0/100 for the representative after the reasoner applied hard filters marking the entire category as structurally broken. Persistence and setup quality scores sank to 22.8/100 and 11.4/100 respectively, confirming that volume-price sponsorship has completely evaporated. To earn reallocation, Industrial Metals would need the price to recover above the 50W, credit stress to ease, and dollar weakness to reverse—a near-term unlikely scenario. The category's exclusion reflects not cyclical weakness but structural disqualification: the technicals are so damaged that even a favorable macro turn would take weeks to rebuild proof. Capital is better deployed elsewhere until COPX, PICK, or REMX demonstrate price recovery and renewed volume confirmation.