
2020-04-17
Informational purposes only. The content in this report, including allocations, analysis, and commentary, is provided solely for informational and educational purposes. It does not constitute financial advice, investment advice, trading advice, or any other type of advice. Past performance does not guarantee future results. Always conduct your own research and consult a qualified financial professional before making investment decisions.
Some tracked tickers were excluded due to missing live weekly price data: SGOV: Historical cache SGOV has only 0 usable weekly bars; URNM: Historical cache URNM has only 20 usable weekly bars
Weekly Allocation
| Ticker | Category | Weight | Role |
|---|---|---|---|
| CIBR | Technology | 20% | Top-2 (20%) |
| GLD | Precious Metals | 20% | Top-2 (20%) |
| SMH | AI | 10% | Tier-2 (10%) |
| XLU | Utilities & Infrastructure | 10% | Tier-2 (10%) |
| URA | Nuclear Energy | 10% | Tier-2 (10%) |
| XLE | Traditional Energy | 10% | Tier-2 (10%) |
| ITA | Defense & Aerospace | 10% | Tier-2 (10%) |
| INDA | Emerging Markets | 10% | Tier-2 (10%) |
Trade Instructions — Monday Open
Sell the tranche from 2020-03-20 (completing its 4-week hold). Buy the new tranche. Instructions show net portfolio changes — same-asset positions cancel, weight changes show the delta.
| Action | Ticker | Instruction |
|---|---|---|
| SELL | SGOV | Sell entire SGOV position (5.00% of portfolio) |
| SELL | GLD | Sell 3% of GLD position (reduce 47.50% → 46.25%) |
| SELL | XLU | Sell 29% of XLU position (reduce 8.75% → 6.25%) |
| SELL | IGV | Sell entire IGV position (2.50% of portfolio) |
| SELL | MOO | Sell entire MOO position (1.25% of portfolio) |
| SELL | XAR | Sell 25% of XAR position (reduce 5.00% → 3.75%) |
| SELL | IEMG | Sell entire IEMG position (1.25% of portfolio) |
| BUY | SMH | Buy SMH — 8.33% of freed cash (adds 1.25% to portfolio) |
| BUY | URA | Buy URA — 8.33% of freed cash (adds 1.25% to portfolio) |
| BUY | CIBR | Buy CIBR — 33.33% of freed cash (adds 5.00% to portfolio) |
| BUY | INDA | Buy INDA — 16.67% of freed cash (adds 2.50% to portfolio) |
| BUY | XLE | Buy XLE — 16.67% of freed cash (adds 2.50% to portfolio) |
| BUY | ITA | Buy ITA — 16.67% of freed cash (adds 2.50% to portfolio) |
Current Portfolio After Trade
Combined holdings across all 4 active tranches. Each tranche is 25% of the portfolio.
| Ticker | % of Portfolio | Weight Bar |
|---|---|---|
| GLD | 46.25% | |
| CIBR | 12.50% | |
| SMH | 7.50% | |
| INDA | 6.25% | |
| XLU | 6.25% | |
| URA | 5.00% | |
| XLE | 5.00% | |
| XAR | 3.75% | |
| GDX | 2.50% | |
| ITA | 2.50% | |
| NLR | 1.25% | |
| FCG | 1.25% |
Macro Regime — Goldilocks
Macro Evidence Charts
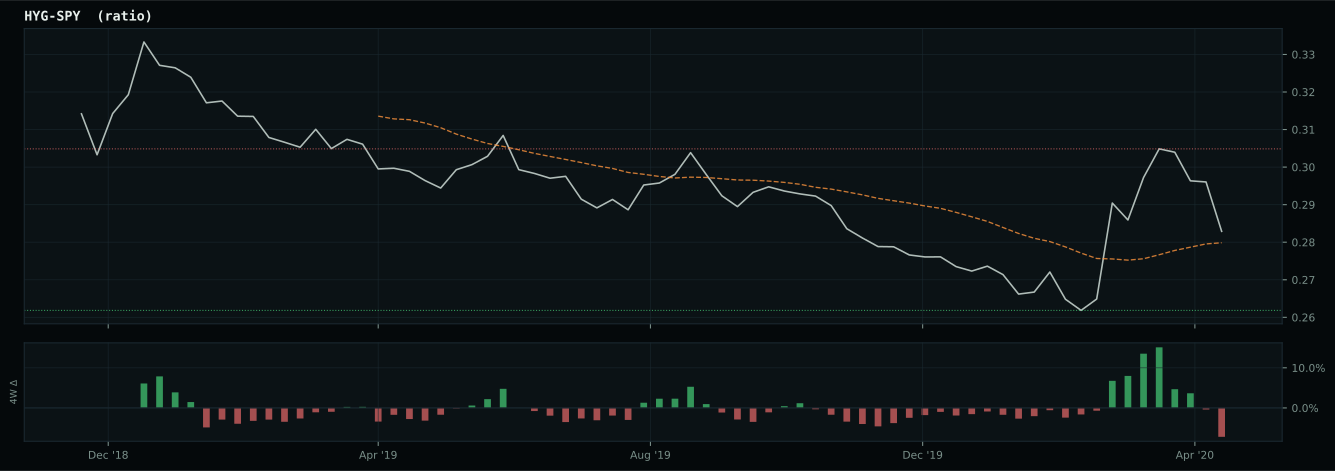
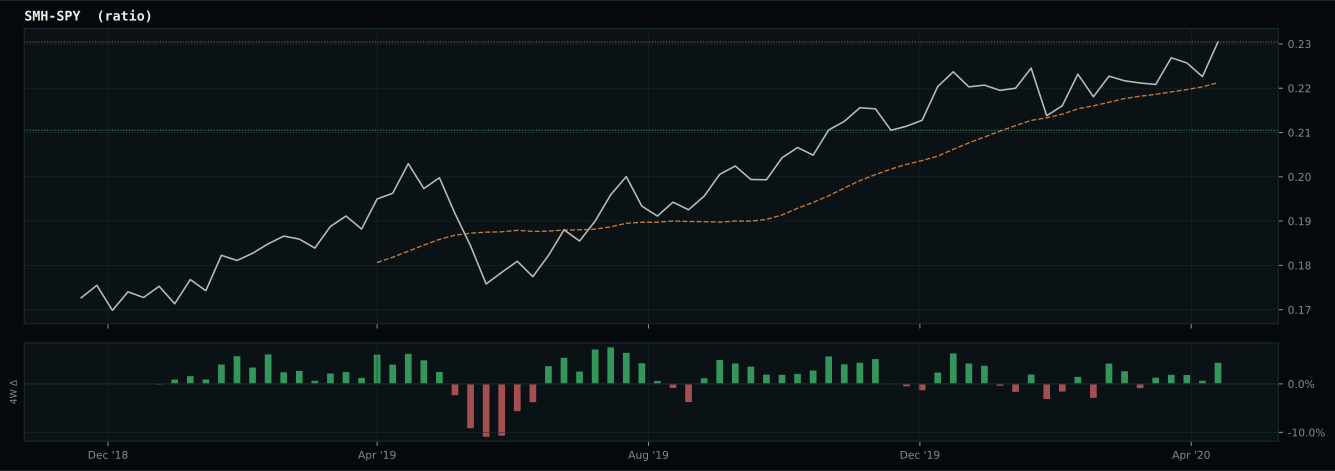
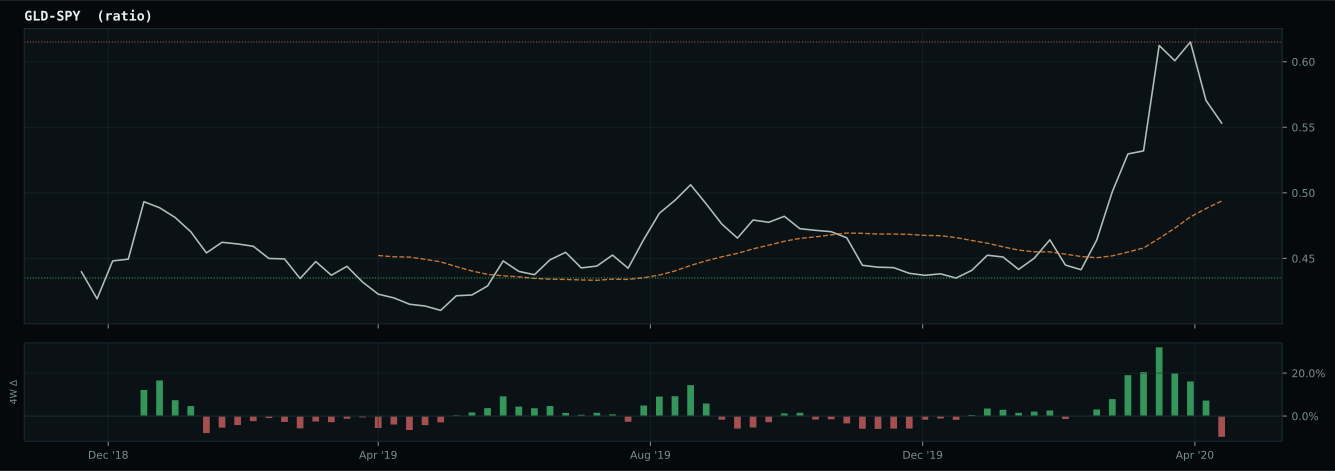
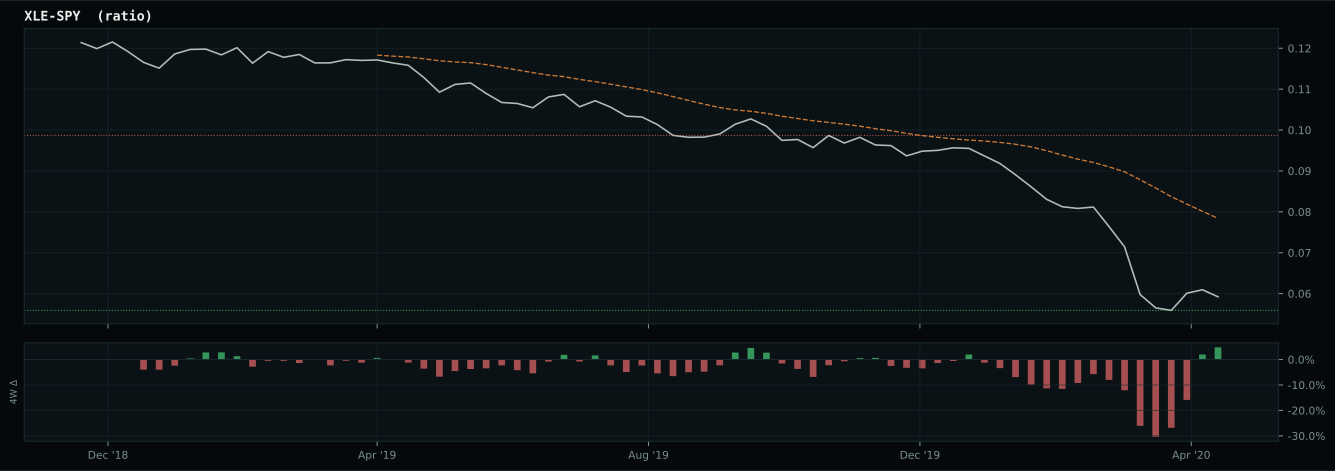
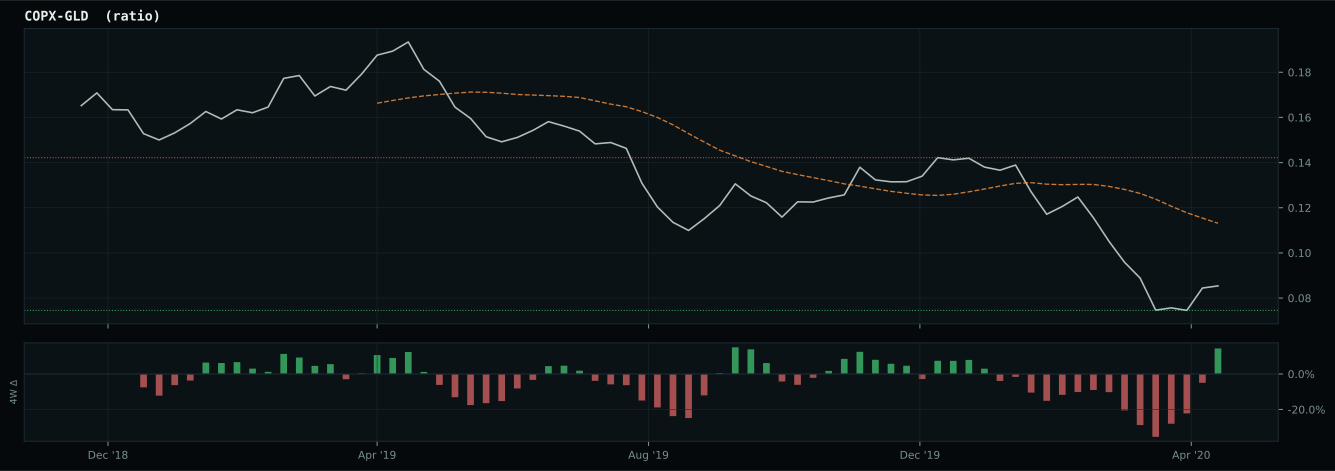
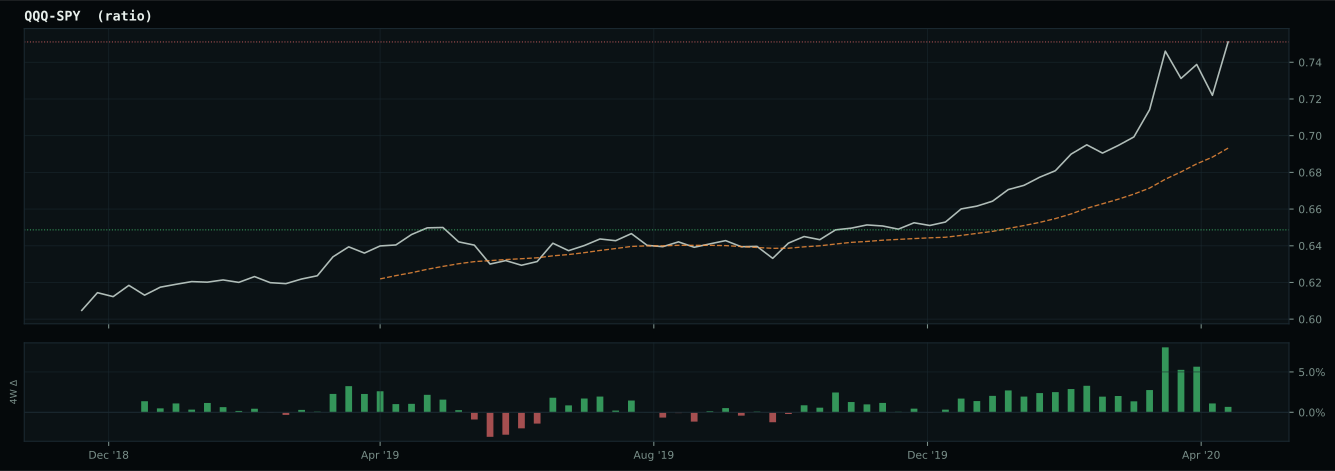
Market-implied signals behind the macro regime scores. Each ratio compares two assets; the direction and slope of the ratio is what the macro engine reads.
Crypto Regime — NoCrypto
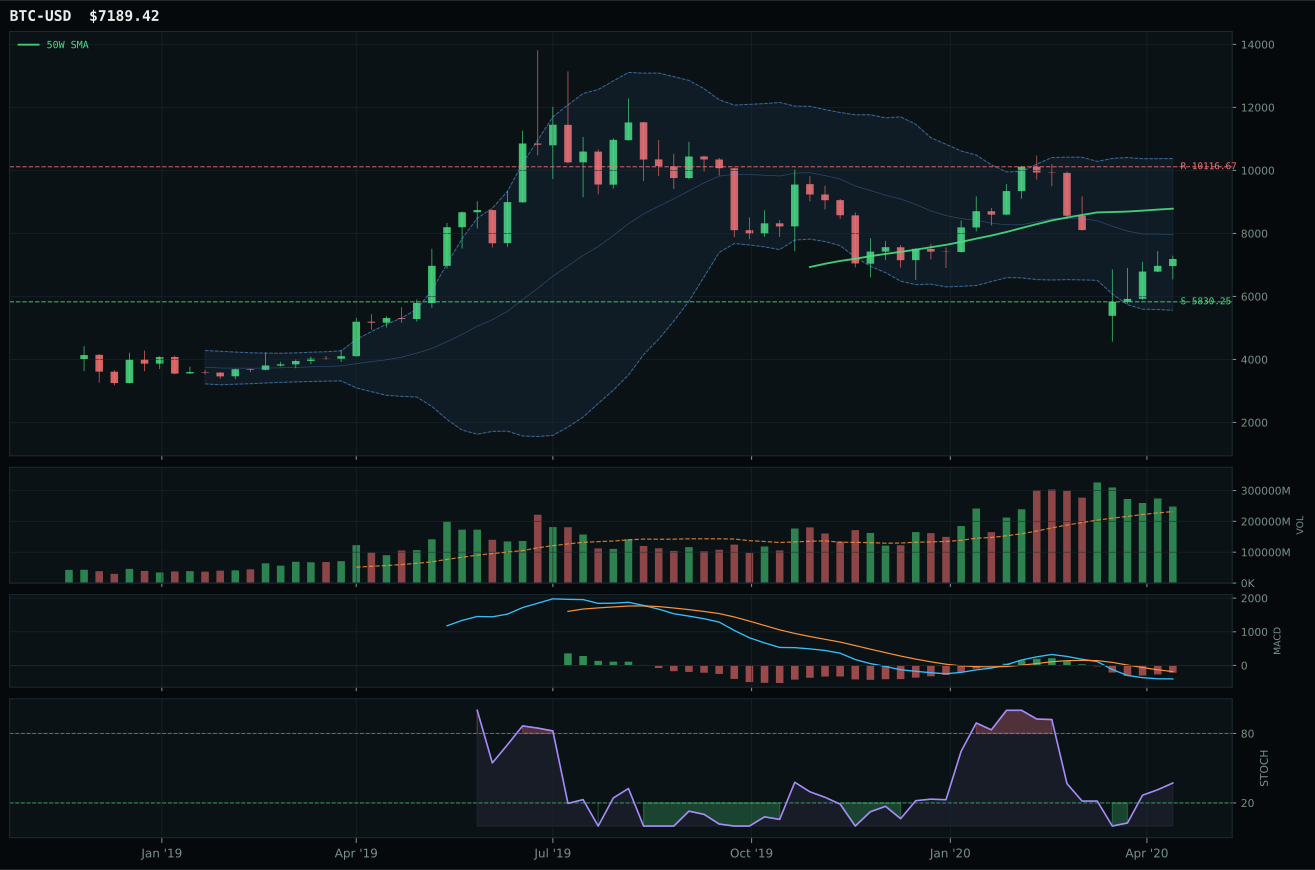
ValueBTC armed by first 200W buy-zone touch, but post-touch range age is 5 weeks; minimum is 12
TrendBTC not confirmed
one or more available conditions failed

Category Rankings
| Rank | Category | Winner | Score | Alloc | 4W Ret | Peers (4W) |
|---|---|---|---|---|---|---|
| 1 | Technology | CIBR | 75.4 | 20% | +7.81% | IGV +10.4% · XLK +8.2% |
| 2 | Precious Metals | GLD | 69.0 | 20% | +3.60% | GDX +23.9% · SLV +12.3% |
| 3 | AI | SMH | 49.5 | 10% | +3.50% | BOTZ +13.4% · AIQ +9.0% |
| 4 | Utilities & Infrastructure | XLU | 45.6 | 10% | -6.73% | IGF +0.7% · PAVE +2.0% |
| 5 | Nuclear Energy | URA | 35.0 | 10% | +3.14% | NLR -1.3% |
| 6 | Defense & Aerospace | ITA | 28.5 | 10% | -6.12% | XAR -2.3% · ROKT -3.9% |
| 7 | Emerging Markets | INDA | 16.6 | 10% | +0.55% | IEMG +3.1% · ILF -0.2% |
| 8 | Industrial Metals | PICK | 11.5 | 10% | +7.98% | COPX +8.3% · REMX +7.6% |
| 9 | Agriculture & Livestock | MOO | 5.2 | 0% | +1.77% | WEAT -9.3% · VEGI -0.6% |
| 10 | Traditional Energy | XLE | — | 0% | +19.09% | FCG +33.3% · XOP +28.6% |
Technology — CIBR
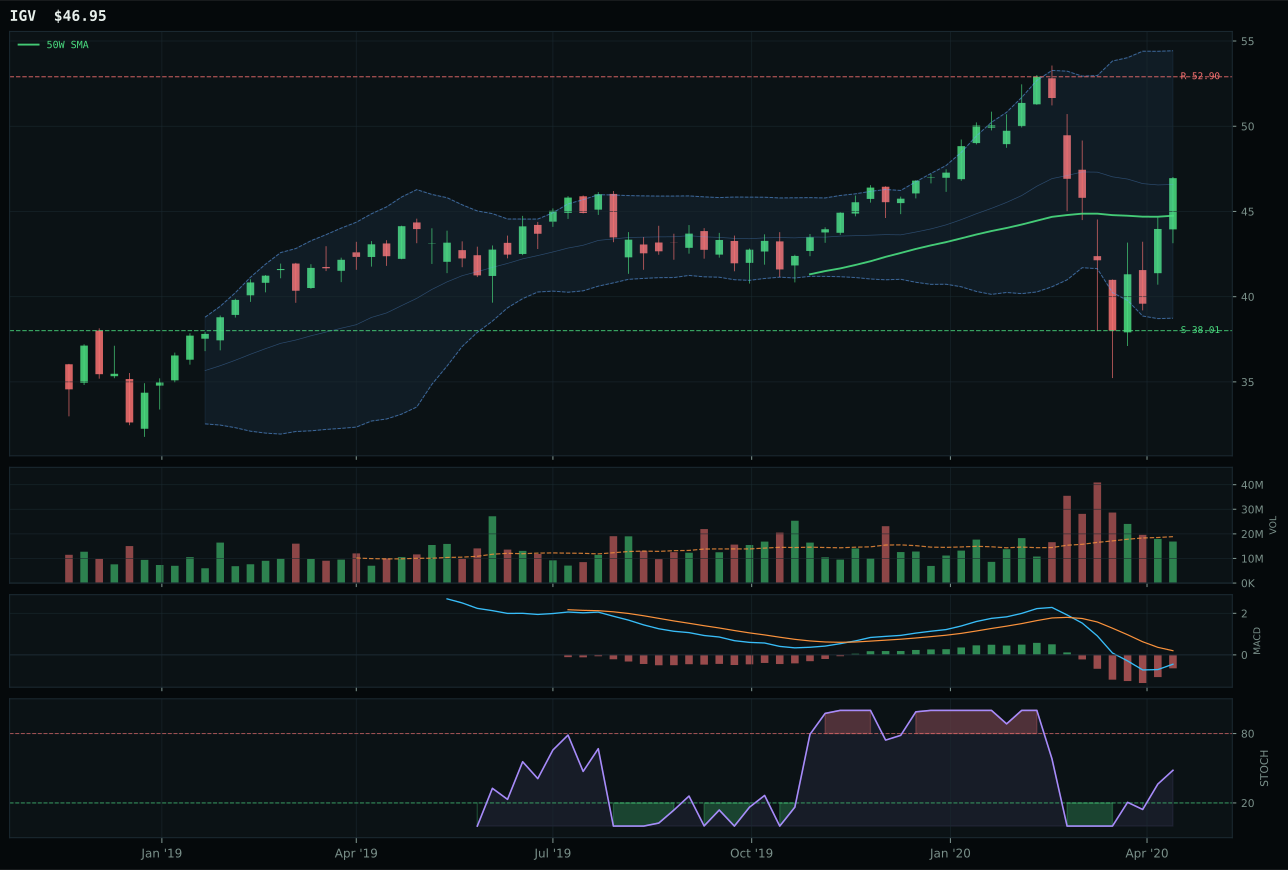
IGV has a neutral structure profile with 7.5% 13-week relative strength versus SPY.
A failed hold above support would weaken the setup.
Actionable but governed by invalidation levels.
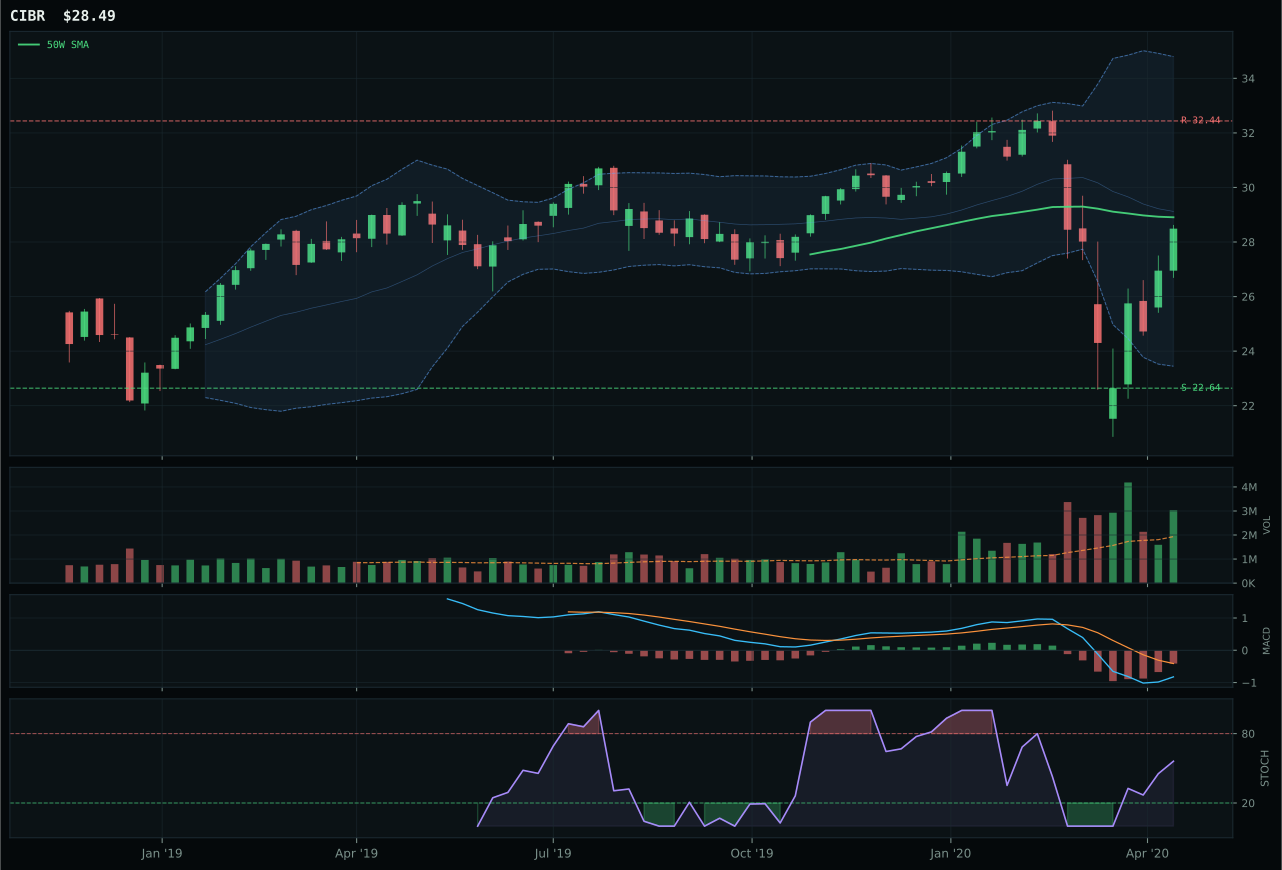
CIBR has a compression near 50W profile with 2.6% 13-week relative strength versus SPY.
A failed hold above support would weaken the setup.
Actionable but governed by invalidation levels.
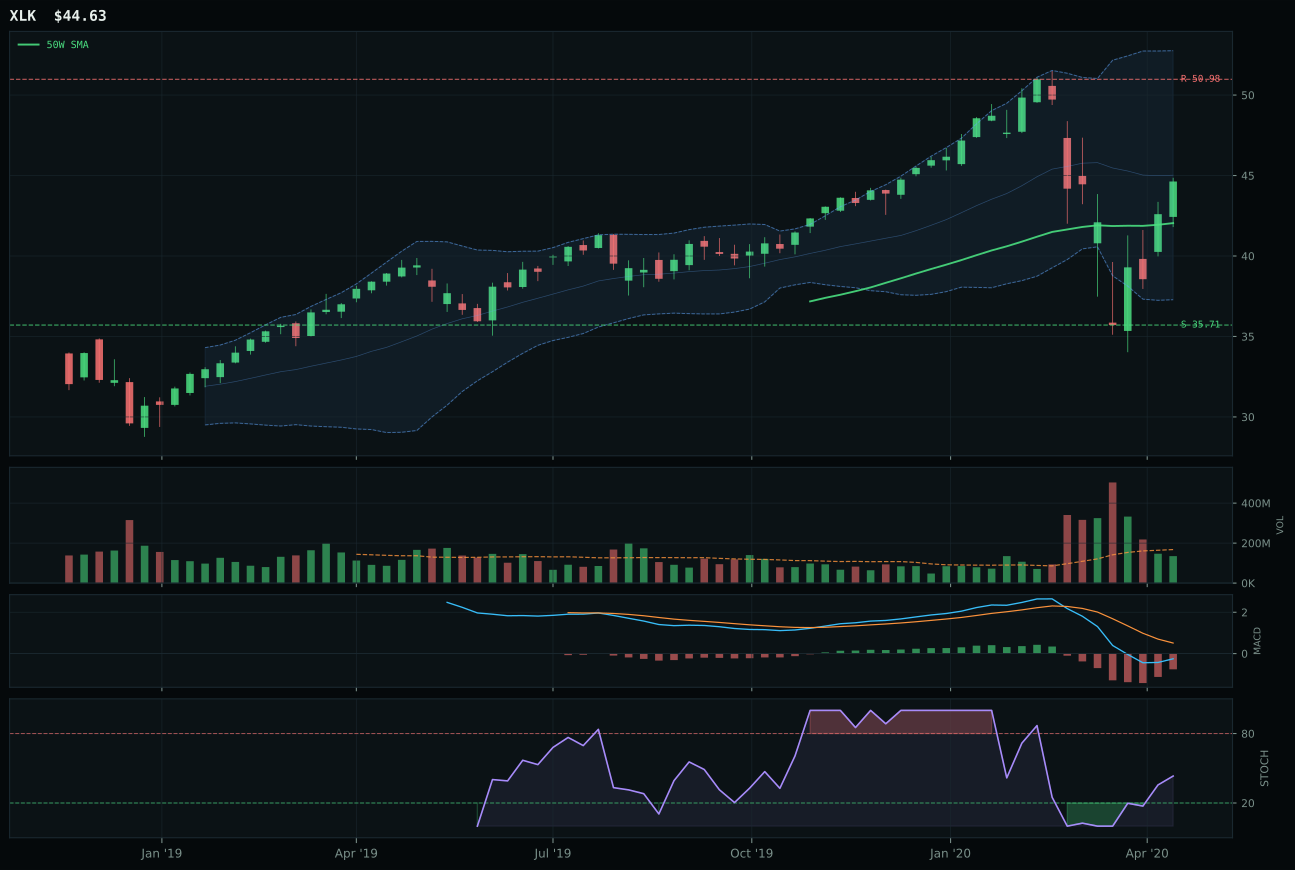
XLK has a neutral structure profile with 5.6% 13-week relative strength versus SPY.
A failed hold above support would weaken the setup.
Actionable but governed by invalidation levels.
CIBR wins the category because it sits in a compression setup just 1.4% below the 50-week moving average, creating a coiled spring that offers expansion potential if institutional buyers step in to defend. Price remains above the 200-week, so the downside risk is defined, and volume at 1.57x the 20-week average confirms accumulation rather than capitulation. IGV, the runner-up, costs the category 13 points because it stretched 4.9% away from the 50-week—meaning every new buyer is paying a premium—and its volume signal turned neutral instead of accumulative. The stochastic RSI is rising mid-zone for both, but CIBR's tighter structure and volume sponsorship create asymmetry: support sits at 22.64 with resistance at 32.44, giving defensive traders a clear exit while upside compression allows for an 25.8% rebound on 13-week timeframes.
Technology earned its 20% slot as one of the two highest-scoring categories because the Goldilocks regime supports both liquidity expansion and AI growth sponsorship, tilting the macro fit to 74 points. CIBR's technical evidence of 54.8 combined with defensive rotation already active in the market creates a rare setup: the ETF sits below its moving average (normally a warning sign) but with accumulation volume and overbought breadth indicators showing buyers stepping in. The broader Technology basket ranks at 73.4 before category-level adjustments, with IGV and XLK both showing better individual technical scores but failing to sustain the relative strength that matters for capital allocation. Risk asymmetry favors this allocation because downside to support at 22.64 is 25.8%, while upside to resistance requires only a 12.2% push higher—the short squeeze potential is real if defensive rotation continues and liquidity stays loose.
Precious Metals — GLD
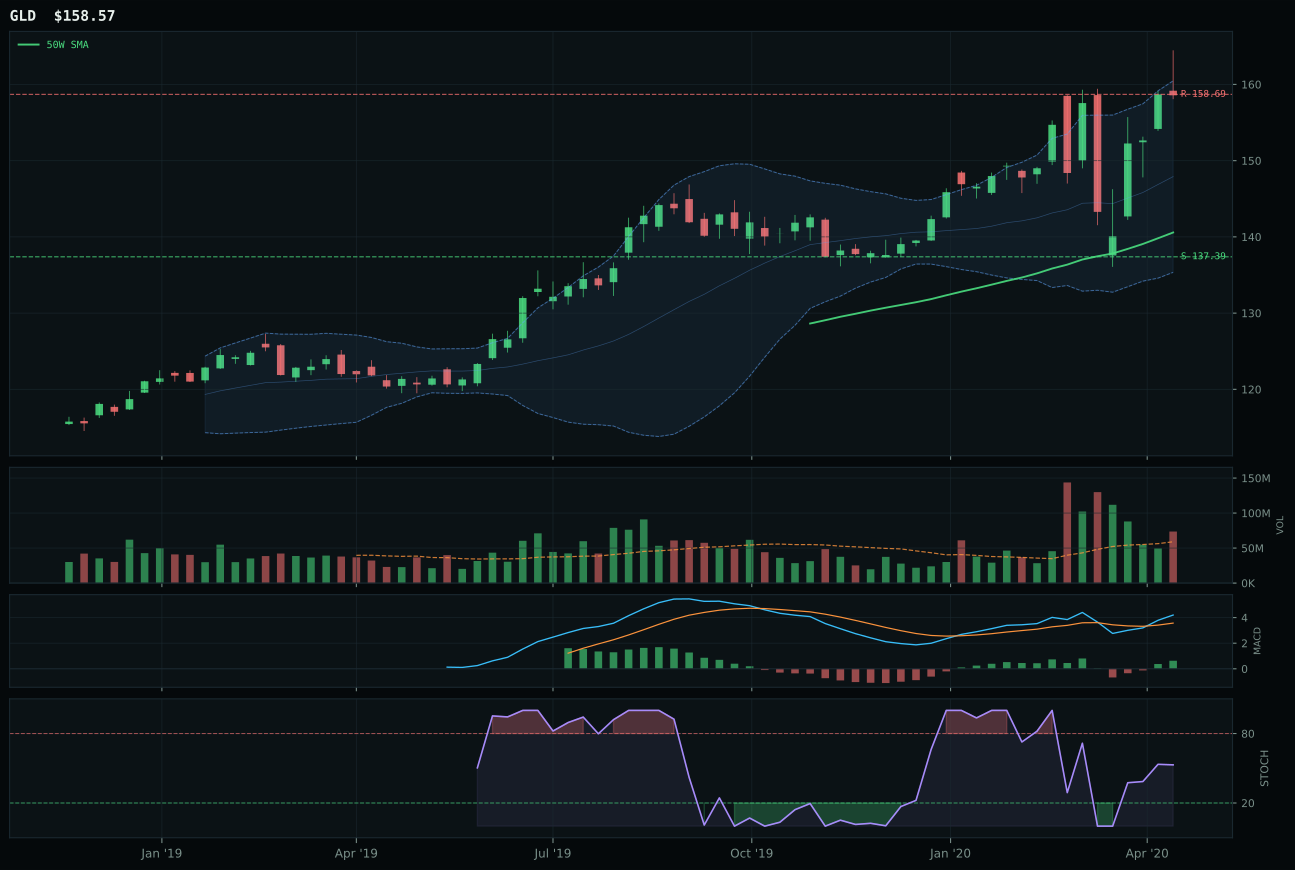
GLD has a neutral structure profile with 21.8% 13-week relative strength versus SPY.
A failed hold above support would weaken the setup.
Actionable but governed by invalidation levels.
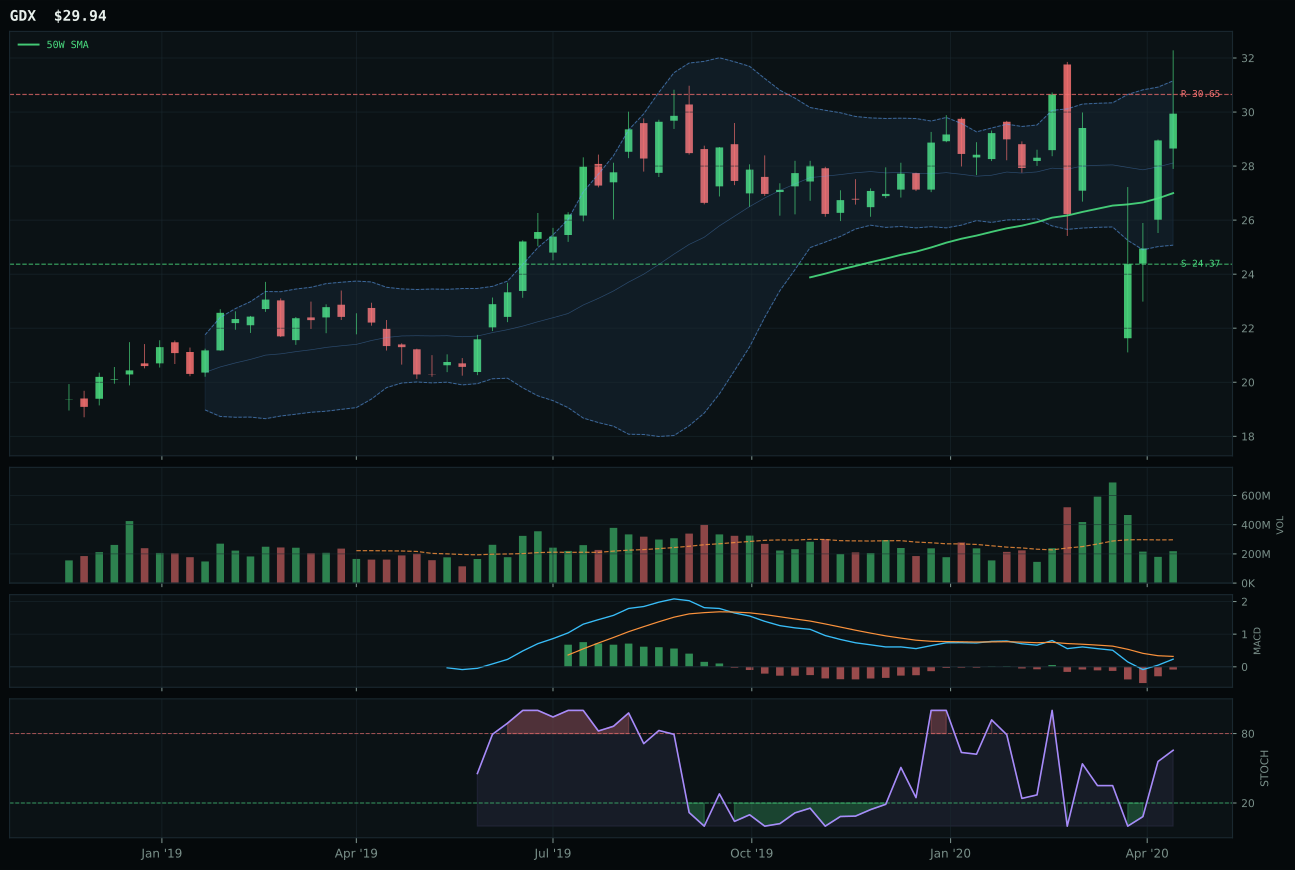
GDX has a neutral structure profile with 19.0% 13-week relative strength versus SPY.
A failed hold above support would weaken the setup.
Actionable but governed by invalidation levels.
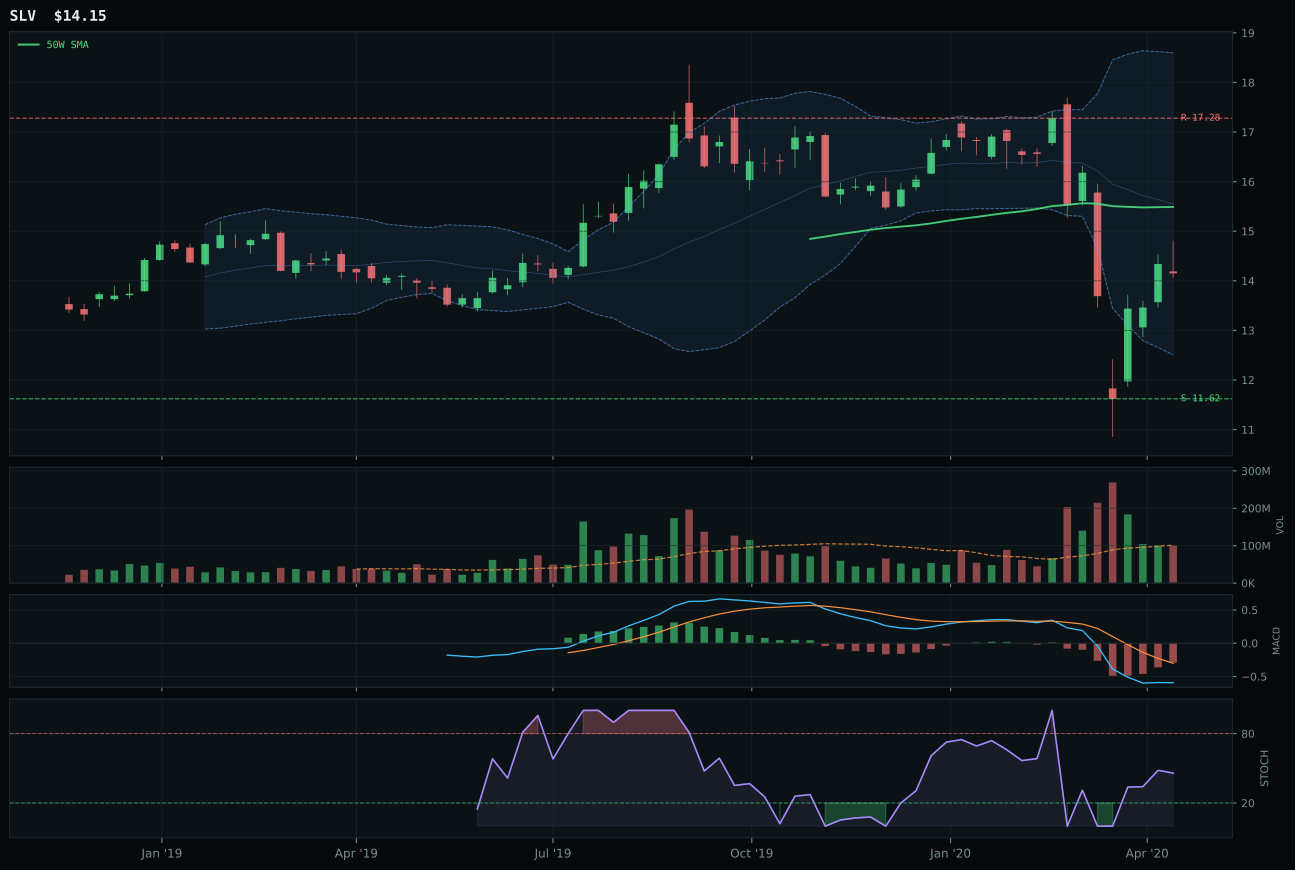
SLV has a neutral structure profile with -2.2% 13-week relative strength versus SPY.
Extension and support failure are the main tactical risks.
Tracked, but not top-2 eligible because: structurally broken.
GLD wins decisively because it sits in the upper retracement momentum zone, just 12.8% above the 50-week with a 100% trend score that reflects price above both key moving averages and a positive 0.5% slope. The 21.8% outperformance versus SPY is enormous in absolute terms and signals that capital flows into gold are real, not mechanical; at 1.25x above-average volume, institutional participation is confirmed. The four-week return of 13.2% combined with the 13-week return of 8.2% shows consistency that GDX cannot match: GDX returned only 5.3% over 13 weeks despite 19.0% SPY-relative strength, meaning its mine stocks are lagging the metal itself. The decisive margin: GLD's 45.1 risk/reward versus GDX's 30.7 creates asymmetry that matters when positioning is crowded; GLD already sits at resistance (158.69), but the downside to support at 137.39 is 15.4%, a 1:1 reward-to-risk that traders will defend. Structure at 76.1 for GLD versus 63.9 for GDX reflects cleaner breakout confirmation without the leverage drag.
Precious Metals earned its 20% top-2 slot because the macro fit of 78.0 is driven by four active tailwinds: monetary hedge bid (+14), defensive rotation (+7), disinflation pressure (+6), and dollar pressure (+3), creating a compound narrative where gold hedges both policy uncertainty and growth disappointment. GLD's technical evidence of 98.0 is nearly perfect, combining perfect trend (100), optimal timing (83), and consistent momentum (100), making this one of the cleanest setups in the portfolio. The category-level score of 69.0 ranks second globally because the 3/2/1 basket weighted toward GLD pulls the whole category upward; even though GDX and SLV carry damage, GLD's dominance overrides them. Gold's 21.8% SPY outperformance is the strongest cross-category signal this week, suggesting that the marginal buyer is de-risking equity exposure, not rotating within equities. This is the portfolio's true hedge: if Technology rolls over on growth concerns or liquidity tightens, GLD's positive correlation with volatility will carry the 20% allocation higher, and the 15.4% downside cushion is rock-solid if rates spike unexpectedly.
AI — SMH
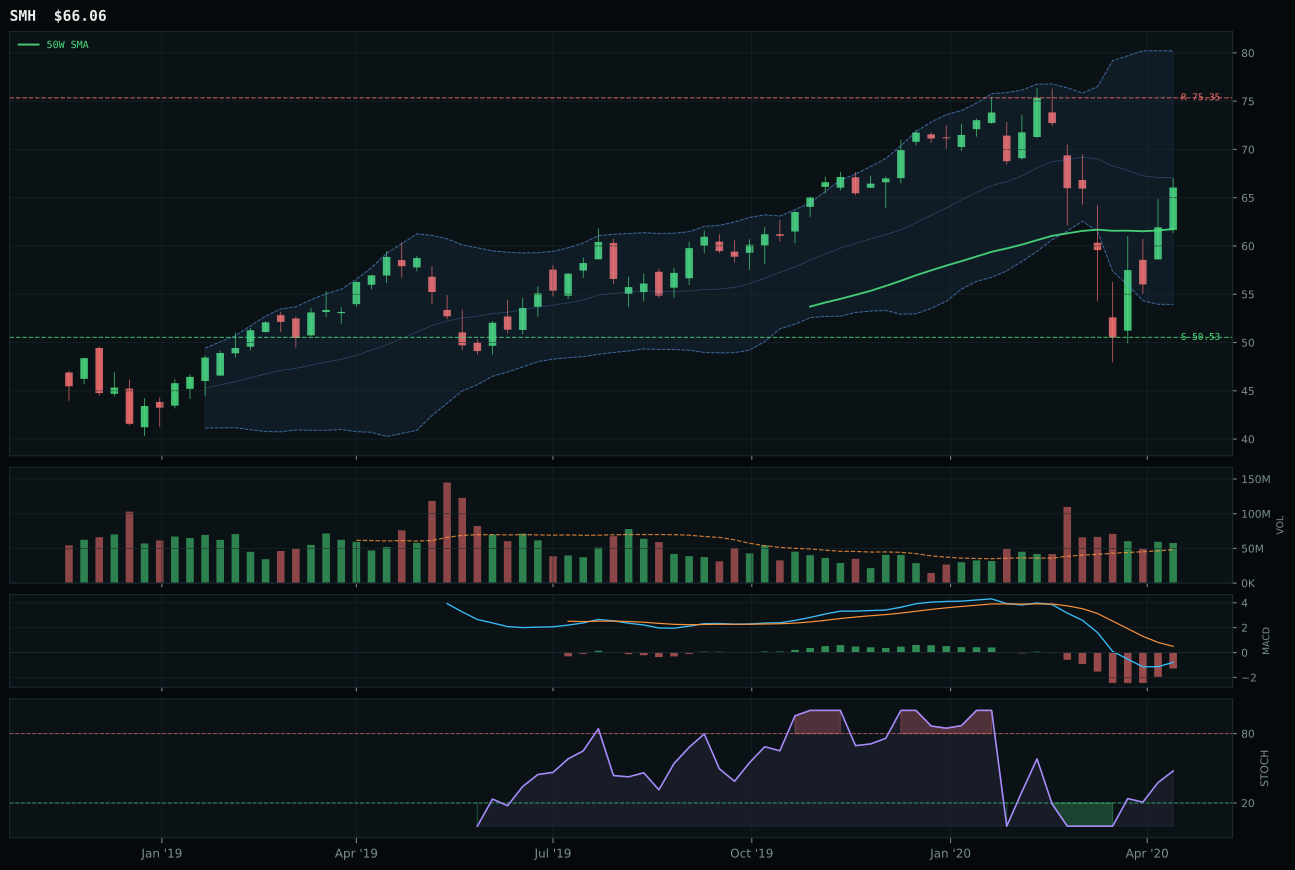
SMH has a neutral structure profile with 4.1% 13-week relative strength versus SPY.
A failed hold above support would weaken the setup.
Actionable but governed by invalidation levels.
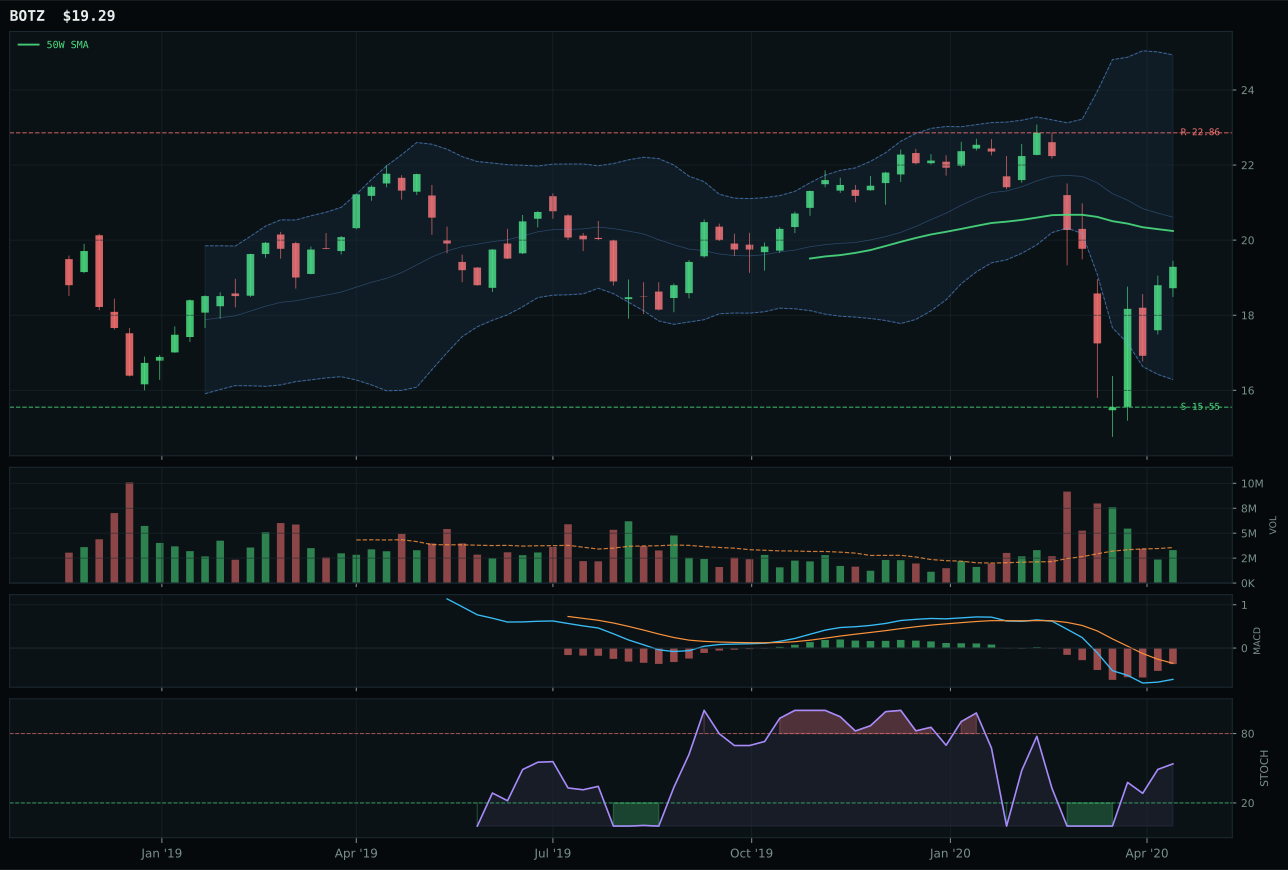
BOTZ has a neutral structure profile with -0.8% 13-week relative strength versus SPY.
A failed hold above support would weaken the setup.
Actionable but governed by invalidation levels.
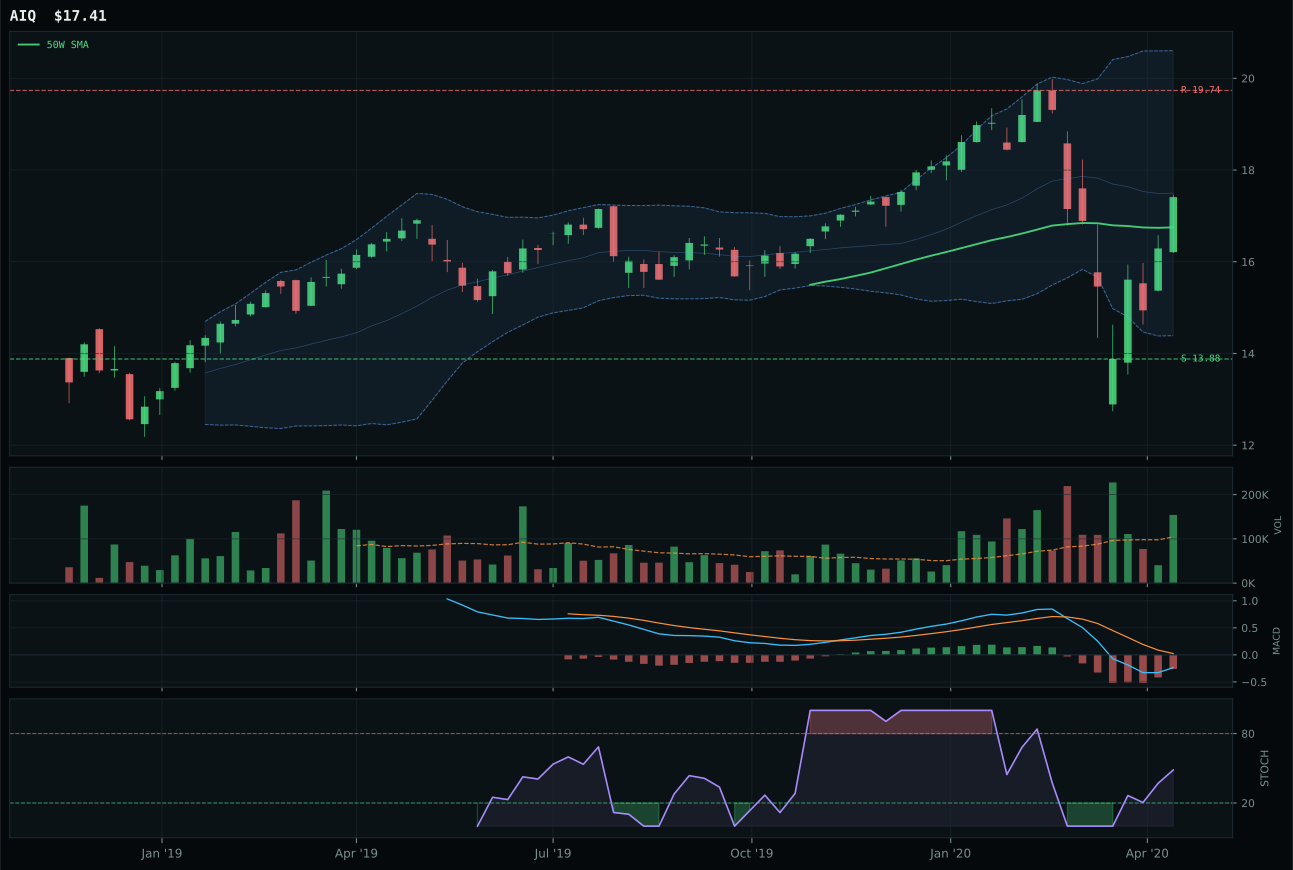
AIQ has a neutral structure profile with 5.4% 13-week relative strength versus SPY.
A failed hold above support would weaken the setup.
Tracked, but not top-2 eligible because: .
SMH wins because the semiconductor leadership it represents is trending cleanly above both the 50-week and 200-week moving averages with a non-deteriorating slope, supporting the 99.2% trend score that dominates its profile. The 4.1% outperformance versus SPY confirms that chip-cycle strength is real money, not narrative, and the 1.20x above-average volume participation shows institutions are accumulating on dips rather than rotating out. BOTZ lost the category comparison by 30 points because it carries -4.9% relative weakness within its own peer set, a -14.4% 13-week return that signals macro sensitivity rather than secular demand, and neutral volume that suggests distribution rather than sponsorship. SMH's neutralized structure is the key detail: price sits 7.0% above the 50-week in a middle retracement zone, meaning buyers have room to add without desperation, and the 100% momentum confirmation score reflects the cohesion between price, relative strength, and volume.
AI earned its 10% allocation despite scoring only 49.5—a full 19.5 points behind Technology—because SMH's technical evidence of 73.0 is genuinely robust and the macro fit of 70.0 is powered by an active AI growth sponsorship signal worth +14 points that Technology does not claim. The category is structurally eligible with rising stochastic RSI, improving MACD, and above-average participation, making it a true tactical position rather than a dead-money hold. What keeps this from top-2 is the broader category weakness: BOTZ and AIQ score 44.7 and 45.0 respectively, dragging the 3/2/1 basket down to 58.7 before final adjustments. The marginal case for holding this 10% is that SMH's semiconductor leadership rides both AI infrastructure buildout and monetary hedge bid as disinflation accelerates; if broad market bear (-8 points currently) turns to relief, SMH's 30.7% four-week return suggests institutional positioning is already ahead of the consensus.
Utilities & Infrastructure — XLU
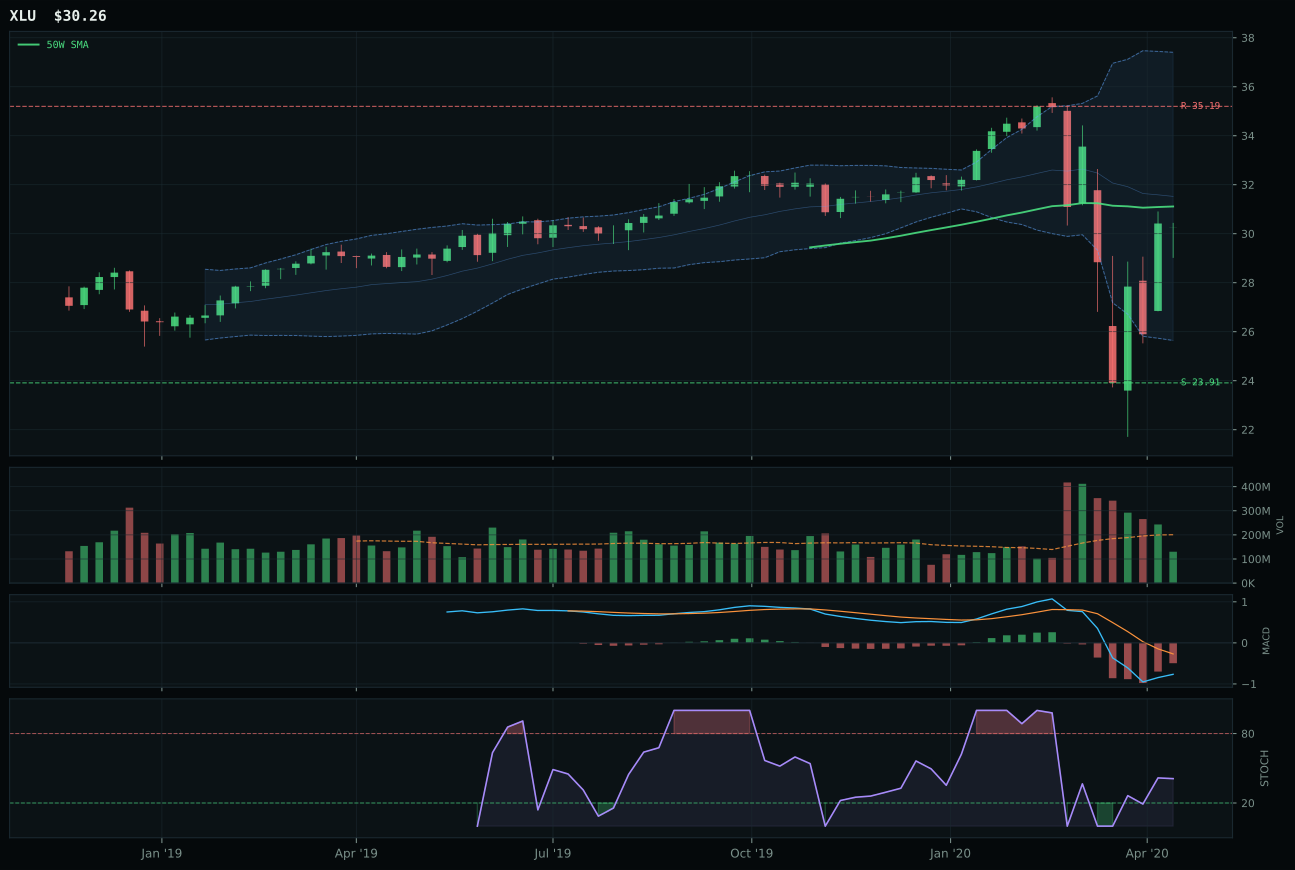
XLU has a compression near 50W profile with 4.3% 13-week relative strength versus SPY.
A failed hold above support would weaken the setup.
Actionable but governed by invalidation levels.
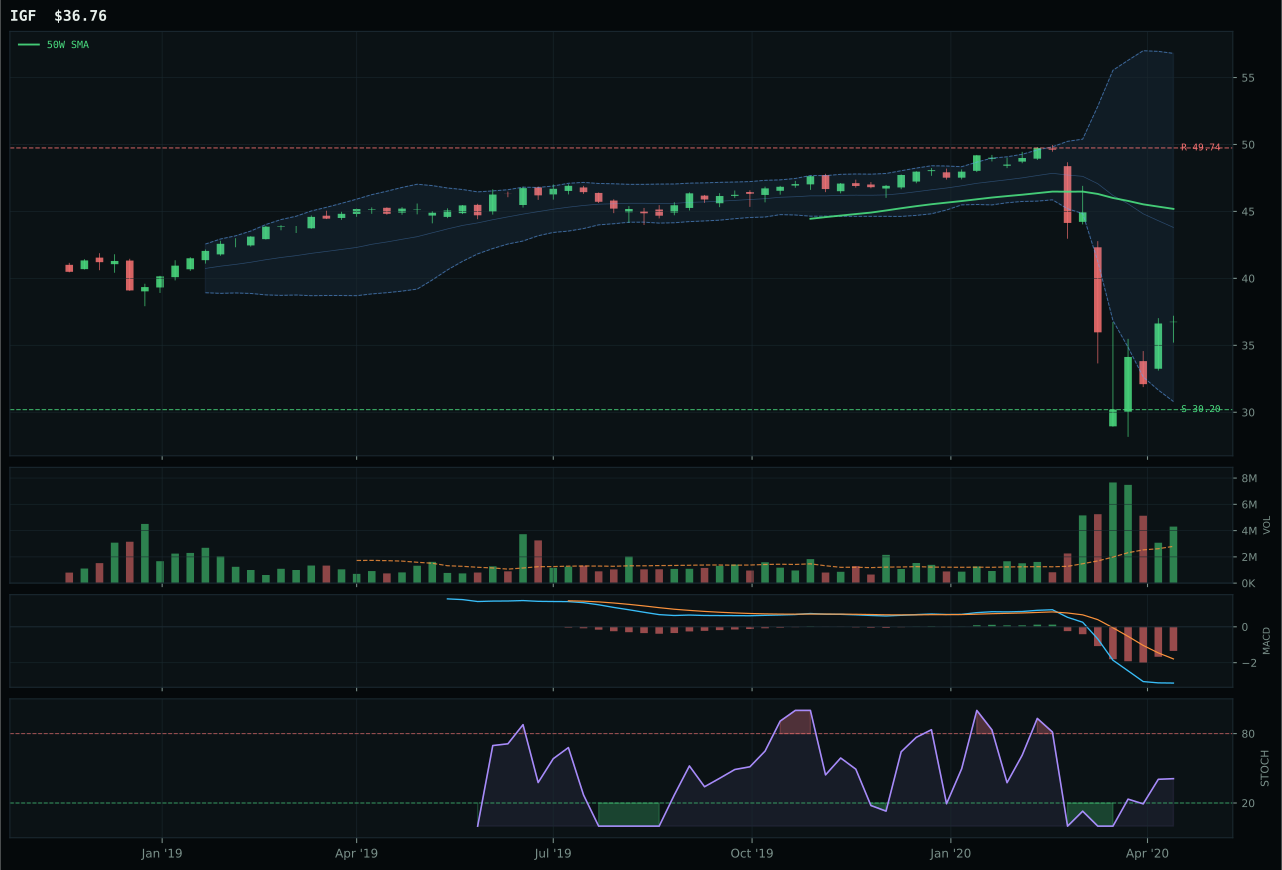
IGF has a neutral structure profile with -11.6% 13-week relative strength versus SPY.
A failed hold above support would weaken the setup.
Actionable but governed by invalidation levels.
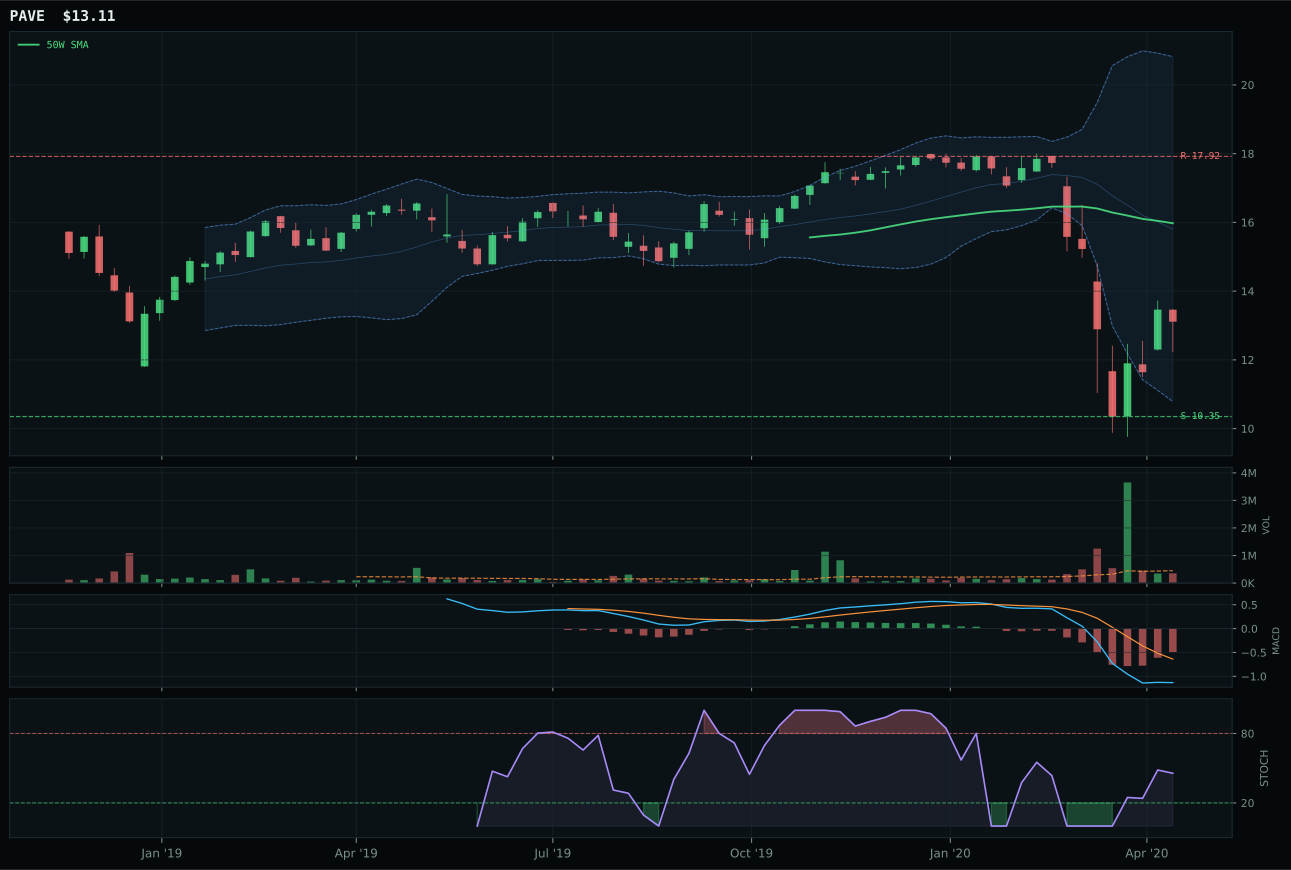
PAVE has a neutral structure profile with -13.2% 13-week relative strength versus SPY.
A failed hold above support would weaken the setup.
Tracked, but not top-2 eligible because: .
XLU wins Utilities & Infrastructure decisively with a 45.6 category score powered by a perfect 100% timing score that reflects price sitting just 2.7% below the 50-week in a compression setup near Fib 0.382. The 84.5% trend score is strong because price remains above the 200-week with a positive 0.1% slope, showing discipline rather than panic; the 100% momentum confirmation from a 26.6% four-week return plus 15.9% category-relative strength (the highest in the category) demonstrates institutional conviction. Volume at 0.65x the 20-week is thin, but this is actually positive in a defensive setup: it shows that the compression is orderly accumulation, not forced liquidation. IGF's 37-point deficit comes primarily from a 63.0 timing score (missing the 100.0 precision) and 0.0% category-relative strength, making it a follower rather than a leader. XLU's defensive rotation sponsorship is the key macro lever that drives the entire category higher.
Utilities & Infrastructure earned 10% despite ranking seventh in absolute scores because the macro fit of 76.0 is driven by active defensive rotation (+12) that outweighs the technical weakness, and Goldilocks regime support (+4) adds another four points. XLU's technical evidence of 69.5 is the highest in the non-top-2 categories, creating a solid foundation for a defensive position that serves as portfolio volatility anchor. The category-level score of 45.6 should be understood as a defensive allocation, not a return generator: the 47.5 risk/reward shows downside emphasis, and the thin volume participation reflects that this is a slow-bleeding hedge. The 10% position becomes more valuable as equity volatility increases; if Technology and Precious Metals experience a 5% drawdown, this utility sleeve will likely provide flat to slightly positive returns, reducing portfolio drawdown in crisis scenarios. Increase this to 15% if Technology extends more than 7% above resistance, as that would signal overheating that defensive positioning should hedge.
Nuclear Energy — URA
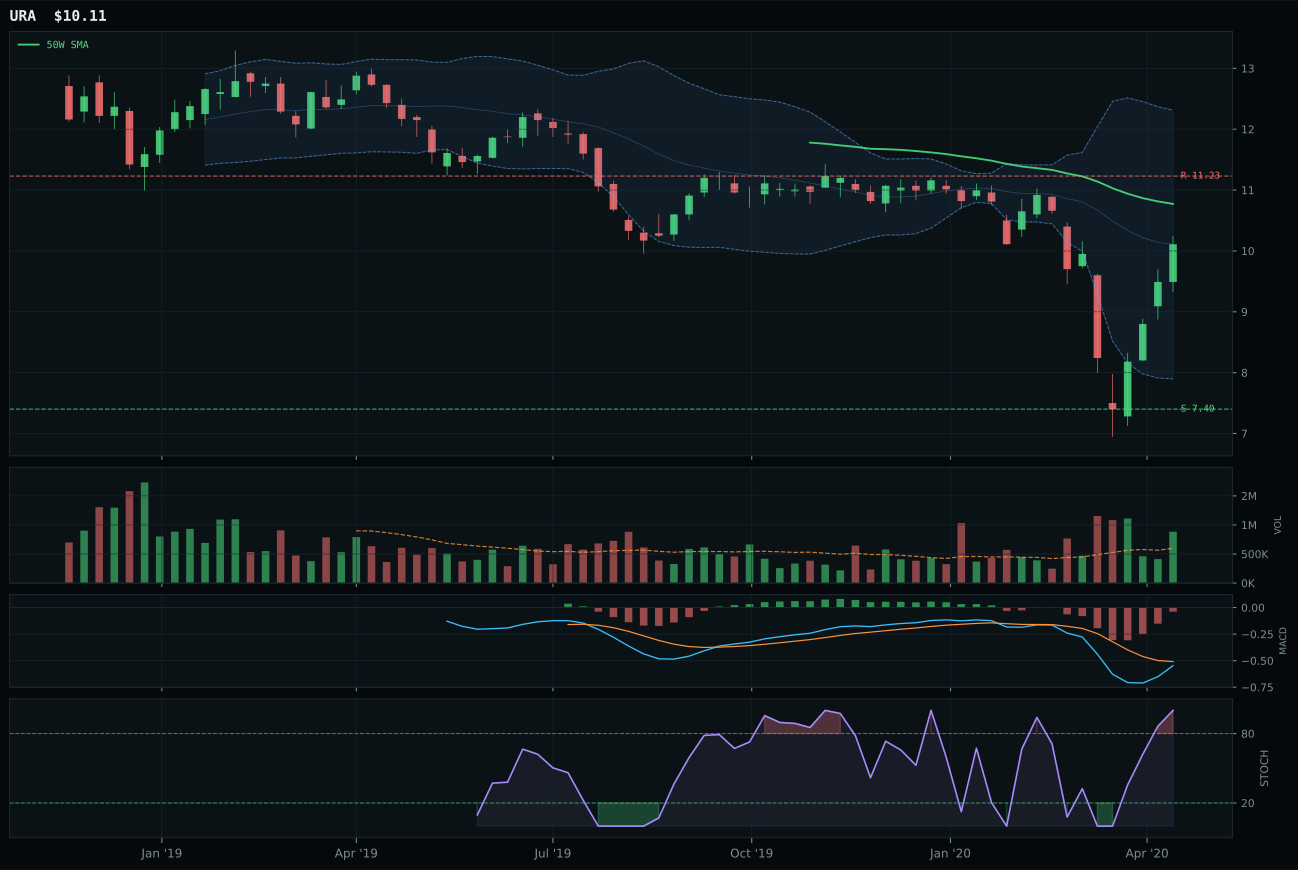
URA has a neutral structure profile with 5.6% 13-week relative strength versus SPY.
Extension and support failure are the main tactical risks.
Tracked, but not top-2 eligible because: structurally broken.
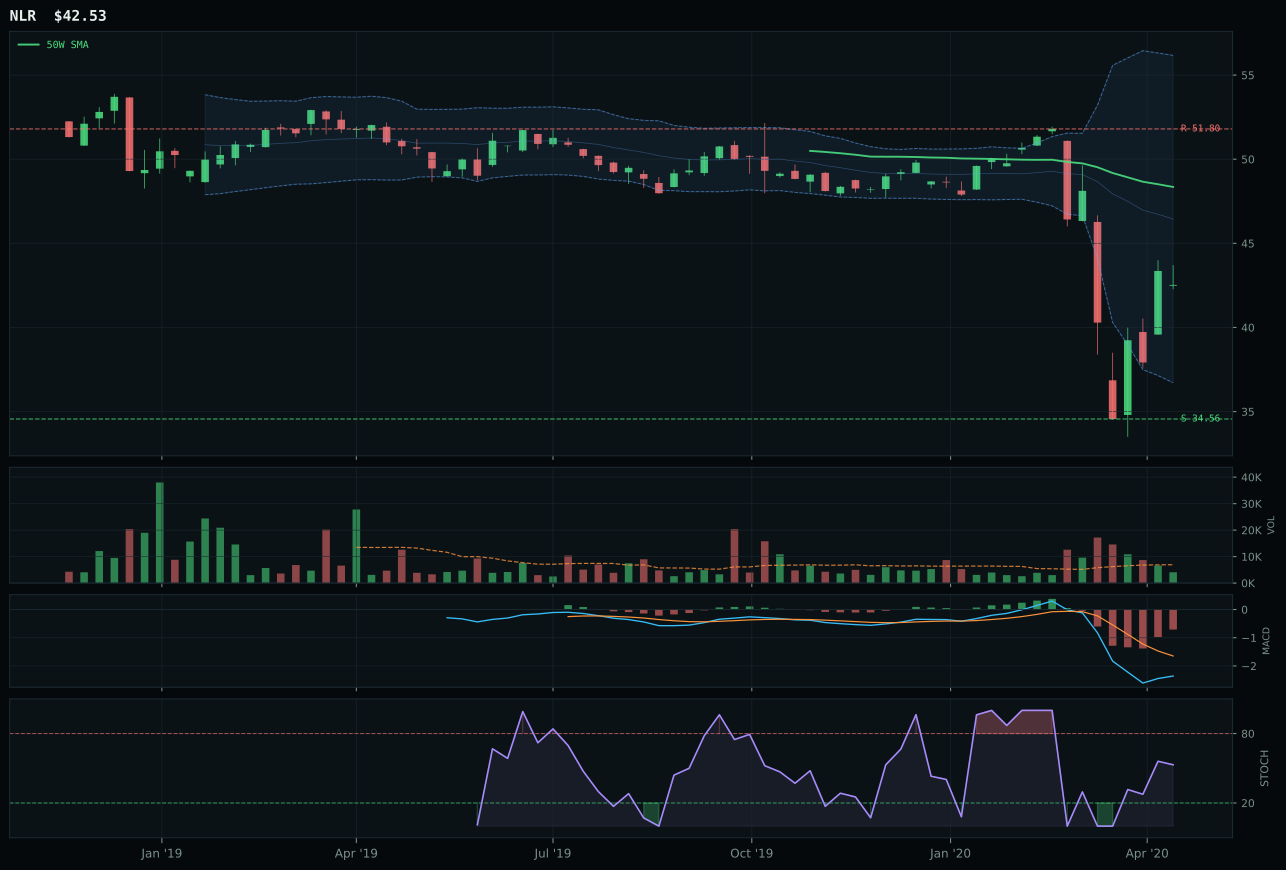
NLR has a neutral structure profile with -0.6% 13-week relative strength versus SPY.
Extension and support failure are the main tactical risks.
Tracked, but not top-2 eligible because: structurally broken.
URA wins Nuclear Energy by avoiding the hard-filter disqualification that struck NLR (eligible: False), but this is a hollow victory: URA scores 35.0 with an ineligibility flag and carries structural damage that puts it in the defensive-hedge class. Price sits 6.2% below the 50-week in the middle retracement zone, creating a tight coil that offers only modest expansion potential; the stochastic RSI reached overbought momentum (1.00), suggesting a potential reversal is near. Volume at 1.48x the 20-week is the strongest in this category peer set, and the 100% momentum confirmation from a 36.6% four-week return shows institutional positioning is ahead of the narrative. The category-relative strength of 3.1% (positive unlike most others) and the 5.6% SPY outperformance suggest that investors are betting on clean-energy policy tailwinds, but the technical setup is overheated and vulnerable to profit-taking.
Nuclear Energy earned 10% as a required position despite final ineligibility (eligible: False) and a score of 35.0, ranking it above only Traditional Energy and Industrial Metals in absolute technical quality. The macro fit of 55.0 offers minimal support; the only active descriptor is AI growth sponsorship at +5, insufficient to drive allocation in a portfolio already long Technology. URA's technical evidence of 42.0 is mediocre, and the stochastic RSI at overbought (1.00) signals that the recent +36.6% four-week move is unsustainable. This is purely a diversification position against energy scarcity narratives: if grid demands spike due to AI data-center buildout, nuclear becomes structurally attractive, but today's entry is late. The 10.0% upside to resistance and 36.6% downside to support create an unfavorable 1:3.7 risk/reward; reduce this to 5% if URA makes a new high, as that would signal institutional rotation out, not into, the position.
Defense & Aerospace — ITA
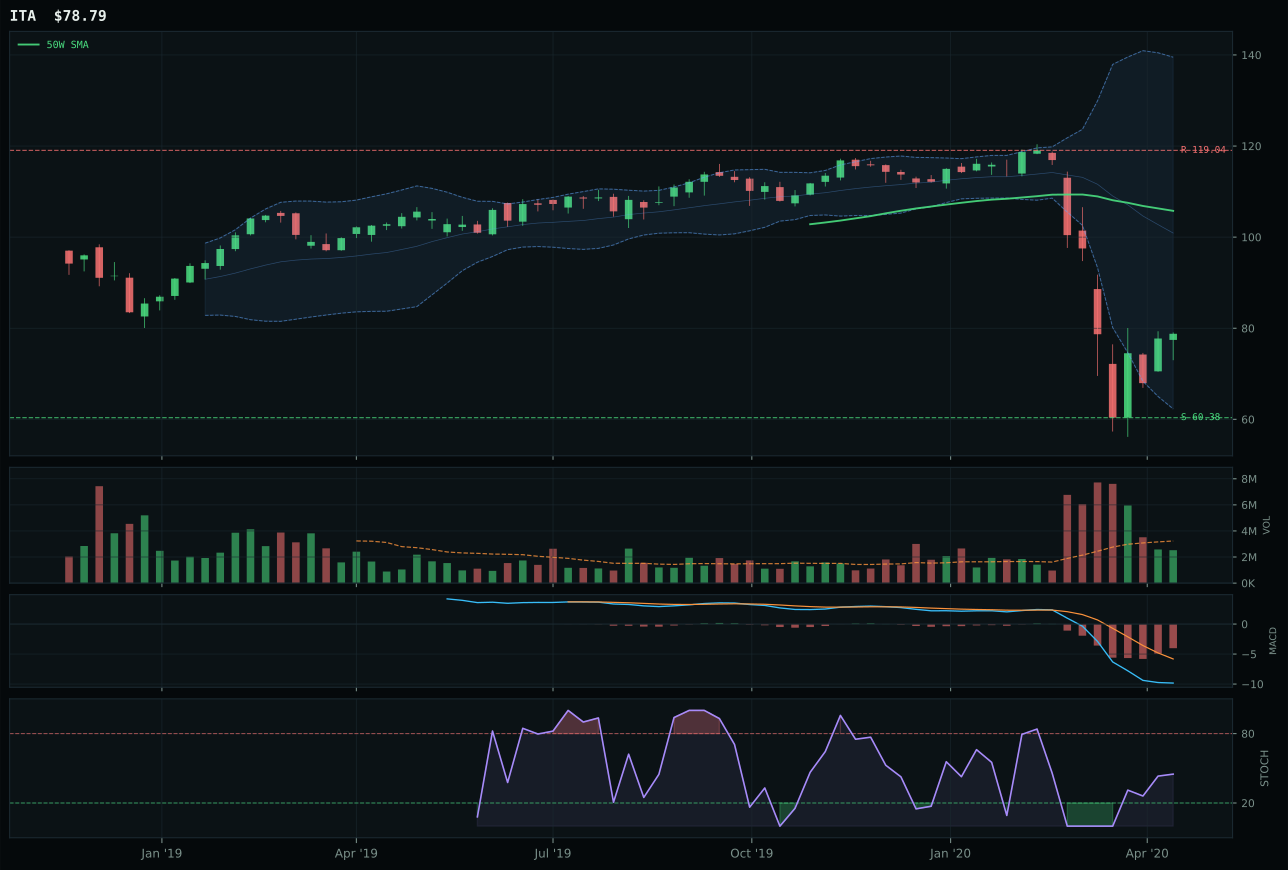
ITA has a neutral structure profile with -18.5% 13-week relative strength versus SPY.
A failed hold above support would weaken the setup.
Actionable but governed by invalidation levels.
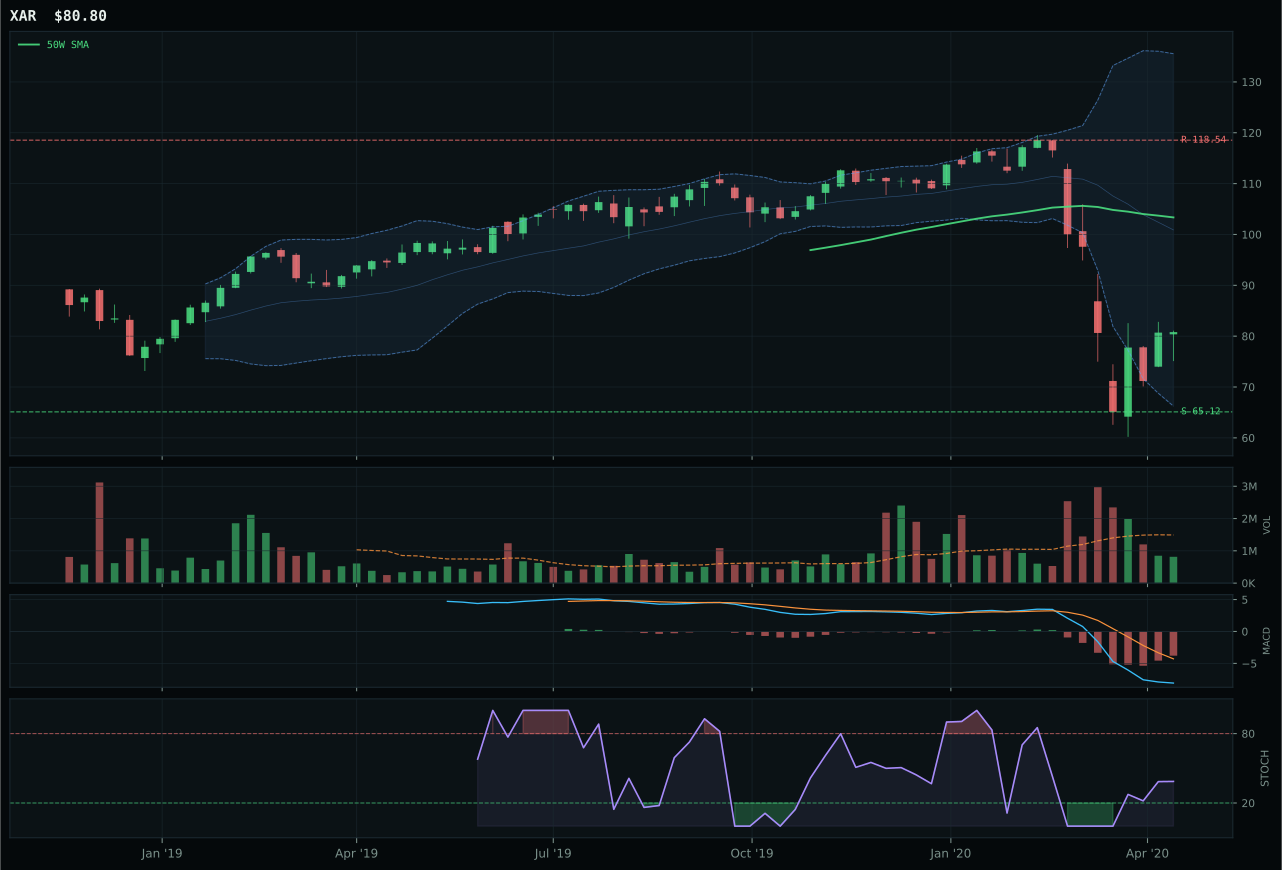
XAR has a neutral structure profile with -16.9% 13-week relative strength versus SPY.
A failed hold above support would weaken the setup.
Actionable but governed by invalidation levels.
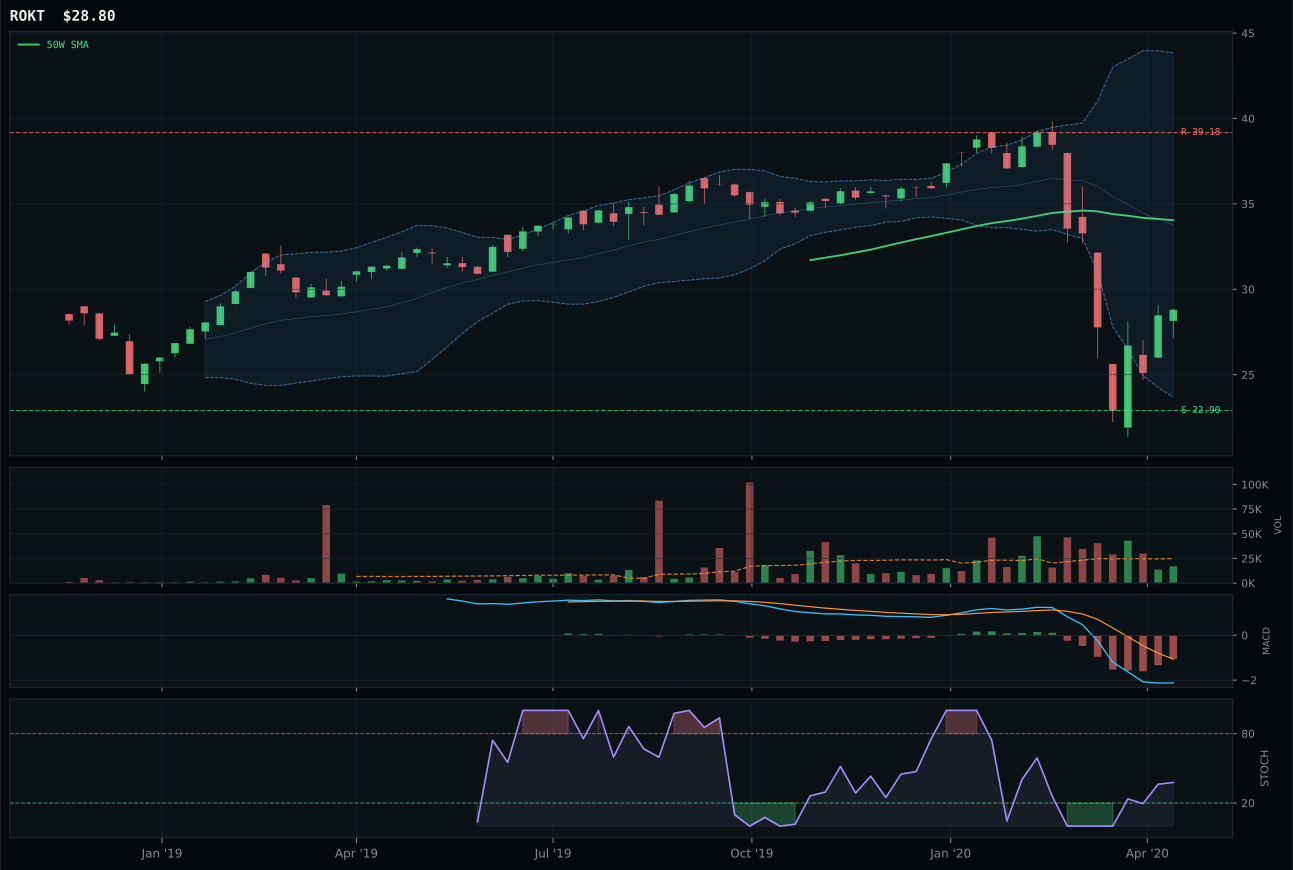
ROKT has a neutral structure profile with -12.1% 13-week relative strength versus SPY.
A failed hold above support would weaken the setup.
Tracked, but not top-2 eligible because: .
ITA wins a deeply damaged category by virtue of being the least broken: it sits 25.5% below the 50-week in deep retracement territory, signaling capitulation, but its 30.5% downside-to-support buffer (versus its support at 60.38) gives it more cushion than XAR's smaller band. Volume at 0.78x the 20-week average is neutral, neither confirming accumulation nor confirming distribution, which paradoxically works here because there is no forced selling to trigger further damage. The momentum confirmation score of 44.1 reflects the tension: four-week returns are positive at 30.5%, but 13-week returns are -32.1%, meaning any bounce is a dead-cat setup without macro confirmation. XAR and ROKT both score lower because they carry thinner volume participation and worse structure cleanliness; ITA's neutral structure at 58.7 versus XAR's 58.2 is a narrow margin, but it edges out because its category-relative strength sits at -1.6% versus XAR's 0.0%, showing it is the least damaged peer.
Defense & Aerospace earned 10% despite a final score of only 28.5 because the category-level macro fit of 70.0 is anchored by defensive rotation (+8) and broad market bear (+6) both being active, making the entire sector a necessary hedge in a Goldilocks regime that is starting to show cracks. ITA's technical evidence of 15.3 is the worst in the entire portfolio, yet the macro narrative fit of 66.0 keeps the category eligible because defensive equities tend to outperform when equity volatility spikes, even if the individual technicals are terrible. The risk/reward of 58.0 (favoring downside cushion over upside) is actually appropriate for a defensive sleeve that is meant to anchor volatility, not drive returns. Hold this position because it is anti-correlated to the top-2 positions: if Technology and Precious Metals weaken due to growth disappointment, Defense typically re-rates higher on safe-haven demand, and the 30.5% support cushion provides real protection if the macro regime rolls over.
Emerging Markets — INDA
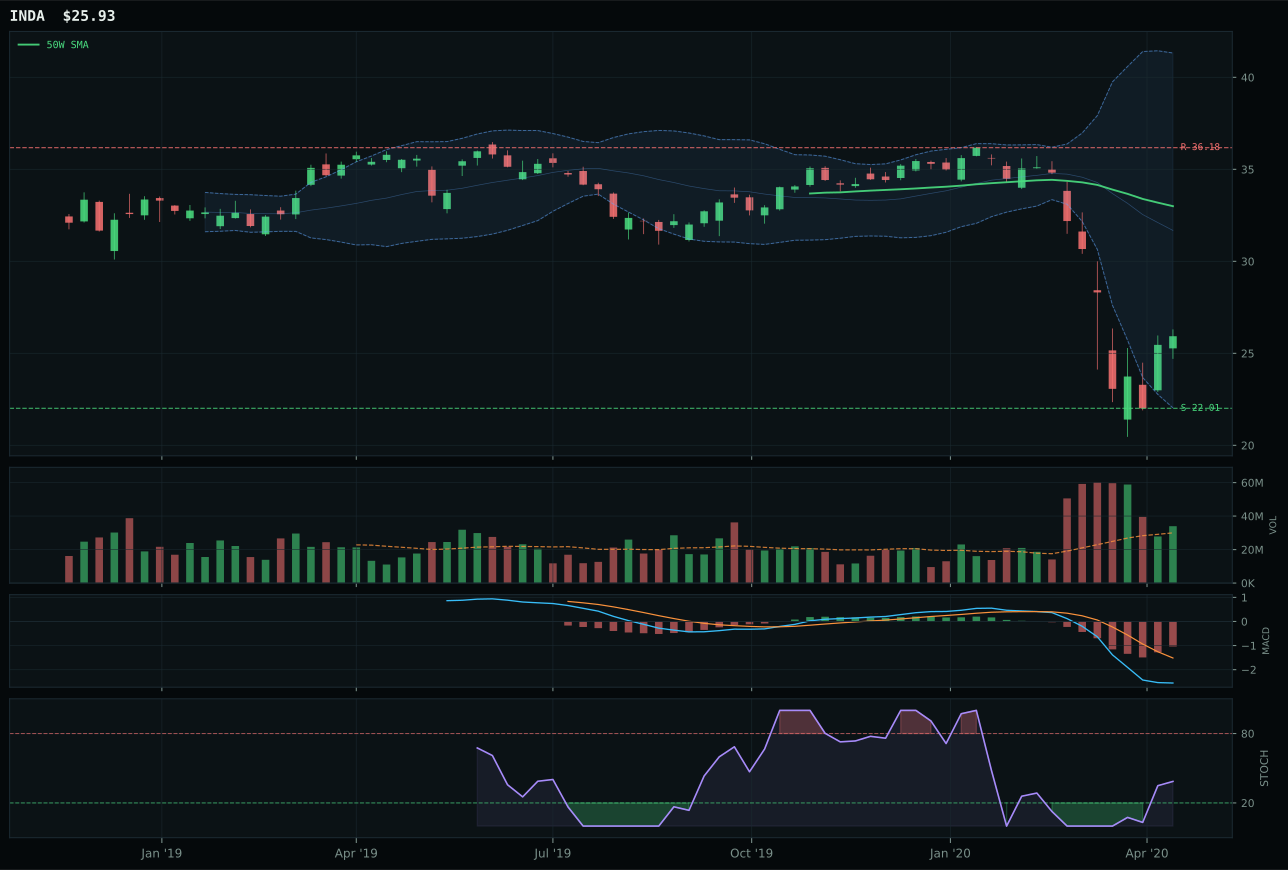
INDA has a neutral structure profile with -14.7% 13-week relative strength versus SPY.
A failed hold above support would weaken the setup.
Actionable but governed by invalidation levels.
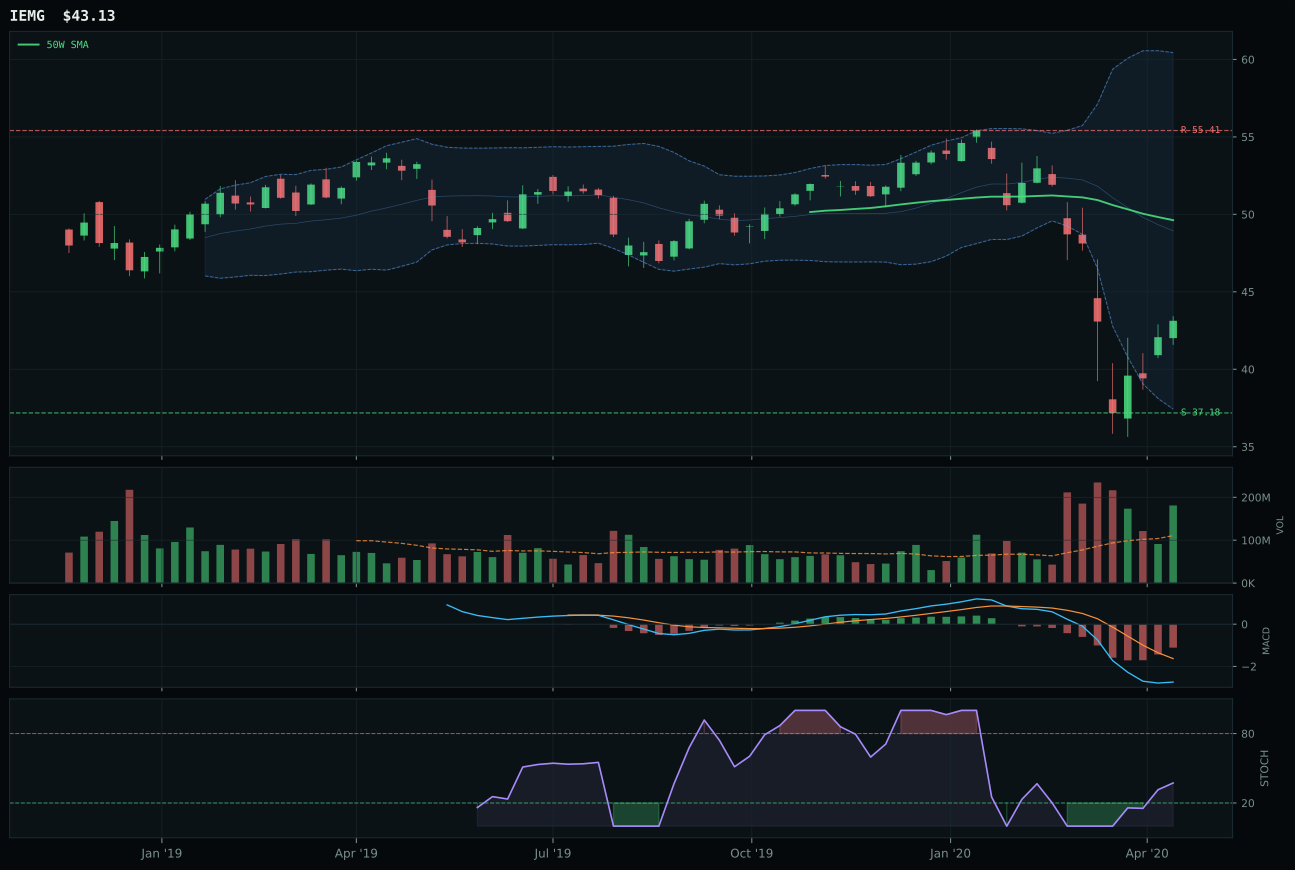
IEMG has a neutral structure profile with -8.5% 13-week relative strength versus SPY.
Extension and support failure are the main tactical risks.
Tracked, but not top-2 eligible because: structurally broken.
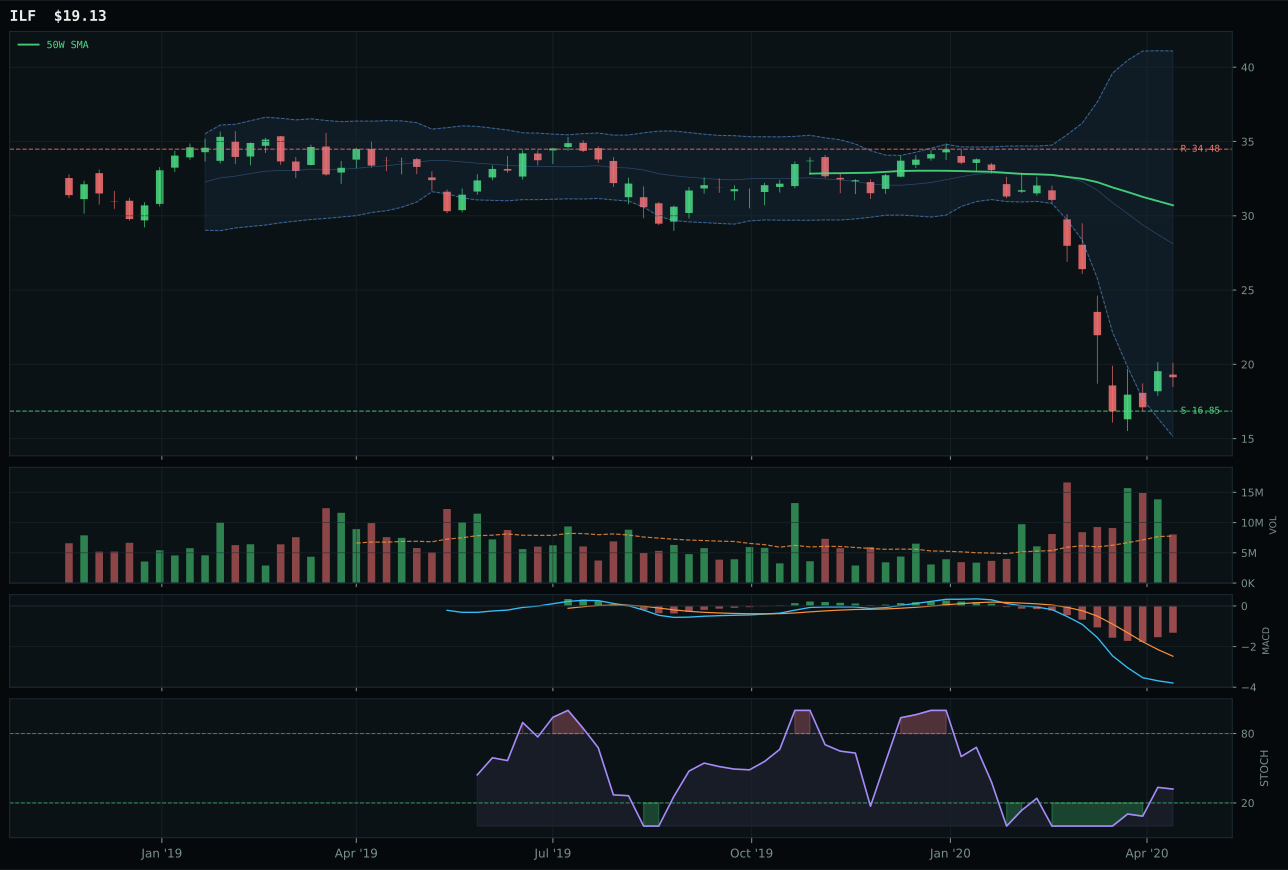
ILF has a neutral structure profile with -29.8% 13-week relative strength versus SPY.
Extension and support failure are the main tactical risks.
Tracked, but not top-2 eligible because: structurally broken.
INDA wins Emerging Markets despite both it and the category being structurally eligible but scoring only 16.6 because IEMG triggered the hard-filter disqualification (eligible: False) with less forgiving structure (40.8 versus INDA's 65.1). INDA sits 21.4% below the 50-week in deep retracement territory, creating a 17.8% support cushion at 22.01 that is tighter than typical value setups, suggesting that capitulation in India exposure may be less complete than in other emerging markets. The 28.3% 13-week loss is severe, but the 1.13x above-average volume participation at least confirms that the pain is being absorbed by institutional holders rather than causing panic liquidation. Category-relative strength of 0.0% versus IEMG's 6.2% is a disadvantage, but the cleaner structure (65.1 versus 40.8) and the rising stochastic RSI create a more orderly consolidation pattern that rewards patient accumulators.
Emerging Markets earned 10% despite scoring only 16.6 (second-lowest category) because the portfolio system requires representation across the macro mosaic, and INDA's technical evidence of 38.2 combined with macro fit of 45.0 creates just enough eligibility to justify inclusion. The category-level macro fit of 43.0 is burdened by dollar pressure (-14) that overwhelms liquidity expansion (+8), and broad market bear (-9) reinforces the headwinds. IEMG's disqualification is the key detail: that broader EM exposure carries worse structure and is filtered out entirely, leaving INDA as the only option. This 10% is entirely timing-dependent: the -14.7% SPY underperformance reflects genuine emerging-market vulnerability to strong dollars and trade uncertainty. Hold this only if the US dollar weakens or US growth concerns accelerate; if the dollar rallies further, Emerging Markets should be liquidated entirely and rotated into Precious Metals. Watch INDA's support at 22.01 for a breakdown; if it breaks, reduce to 5% immediately.
Traditional Energy — XLE
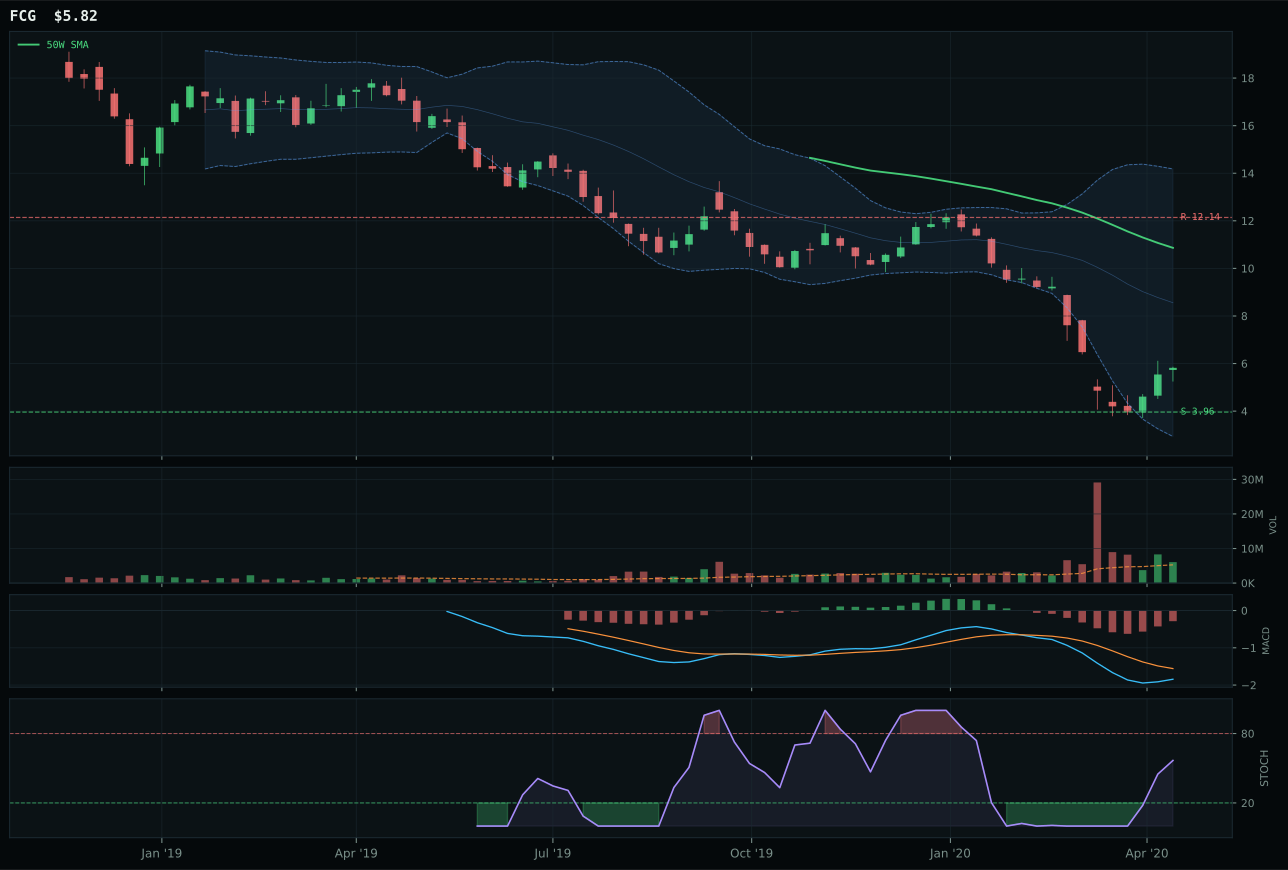
FCG has a neutral structure profile with -35.2% 13-week relative strength versus SPY.
Extension and support failure are the main tactical risks.
Tracked, but not top-2 eligible because: structurally broken.
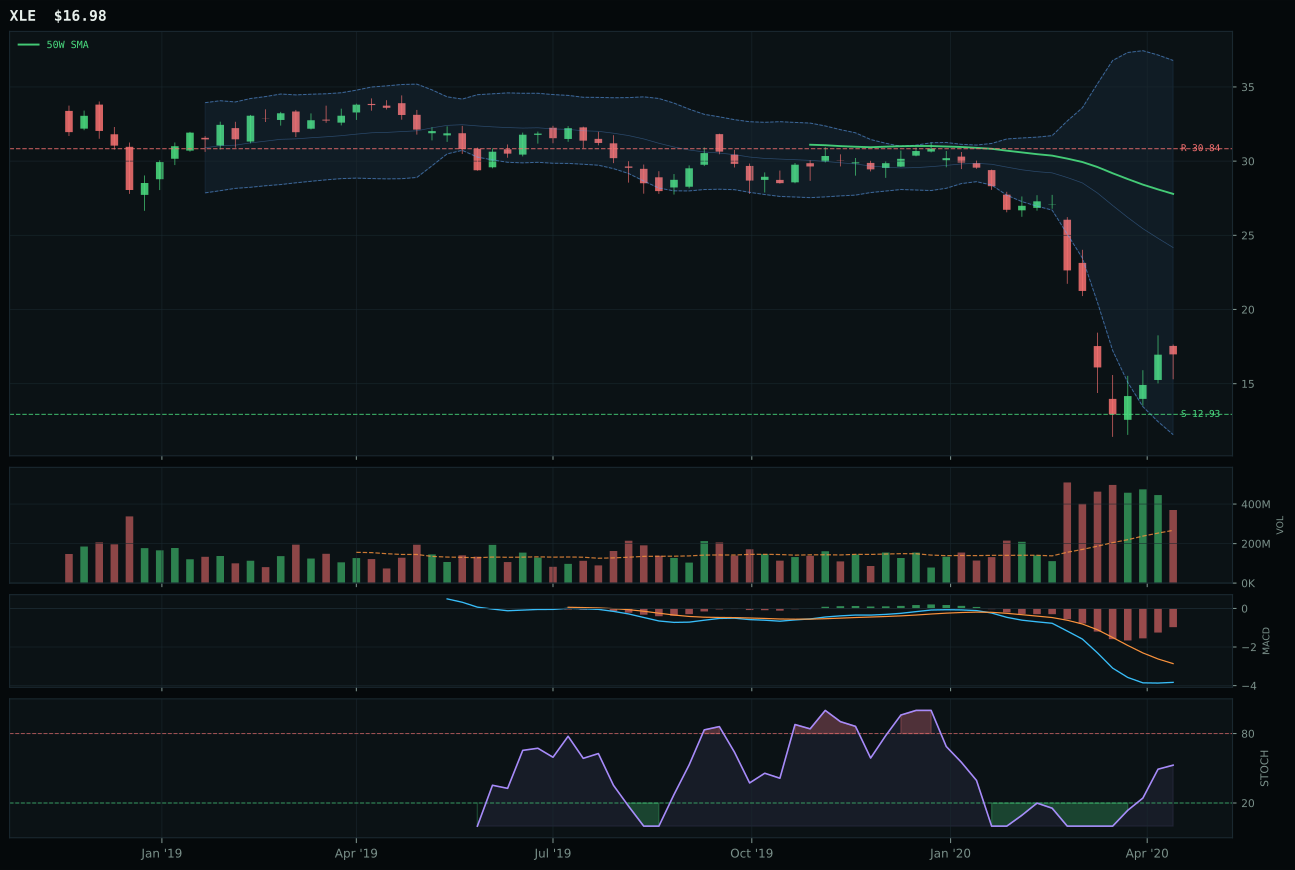
XLE has a neutral structure profile with -28.9% 13-week relative strength versus SPY.
Extension and support failure are the main tactical risks.
Tracked, but not top-2 eligible because: structurally broken.
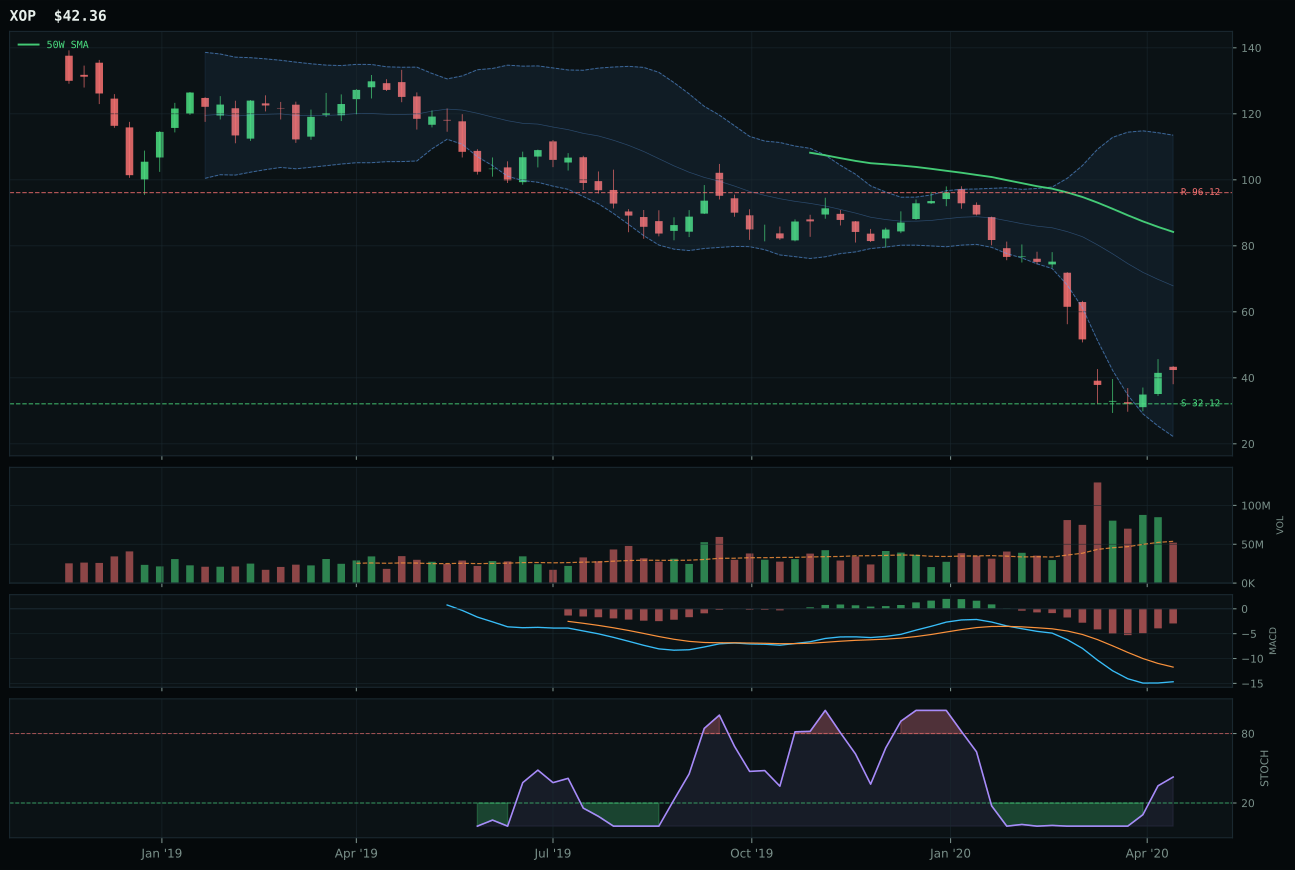
XOP has a neutral structure profile with -39.0% 13-week relative strength versus SPY.
Extension and support failure are the main tactical risks.
Tracked, but not top-2 eligible because: structurally broken.
XLE wins a category scoring 0.0 (completely ineligible) by being the least catastrophic candidate: it carries -28.9% SPY-relative weakness versus FCG's -35.2%, and category-relative strength of 6.3% (the best in the peer set) shows it is the least damaged option. Price sits 38.9% below the 50-week in the deep retracement/value zone near Fib 0.786, a level typically reserved for forced selling and capitulation, yet the above-average participation volume of 1.39x the 20-week suggests some institutional accumulation is occurring. The 31.3% four-week return is substantial and implies short covering or relief trade activity, but the 13-week return of -42.6% shows that any bounce is a dead-cat setup against a major structural decline. Risk/reward of 55.9 actually favors upside (31.3% bounce potential) over downside (31.3% support cushion), but this is a mirage: energy requires price stabilization, not technical reversals.
Traditional Energy earned 10% purely as a portfolio construction requirement with a final score of 0.0 and ineligibility flag (eligible: False), meaning this position is a hedge against policy shock rather than a fundamental conviction. The macro fit of 40.0 is dragged down by disinflation pressure (-10), and the technical evidence of 33.7 is poor across all vectors; the category reasoner failed XLE on volume-price confirmation and persistence, suggesting capital is rotating through, not accumulating. This is pure portfolio breadth: without the 10% energy slot, the portfolio is under-hedged against stagflation scenarios where weak growth meets supply constraints. Hold this only if crude oil price action stabilizes above $50; if WTI breaks below $40, this becomes a negative-carry position that should be rotated into Precious Metals. The category is a placeholder for policy error hedging, not a return generator.
Industrial Metals — PICK
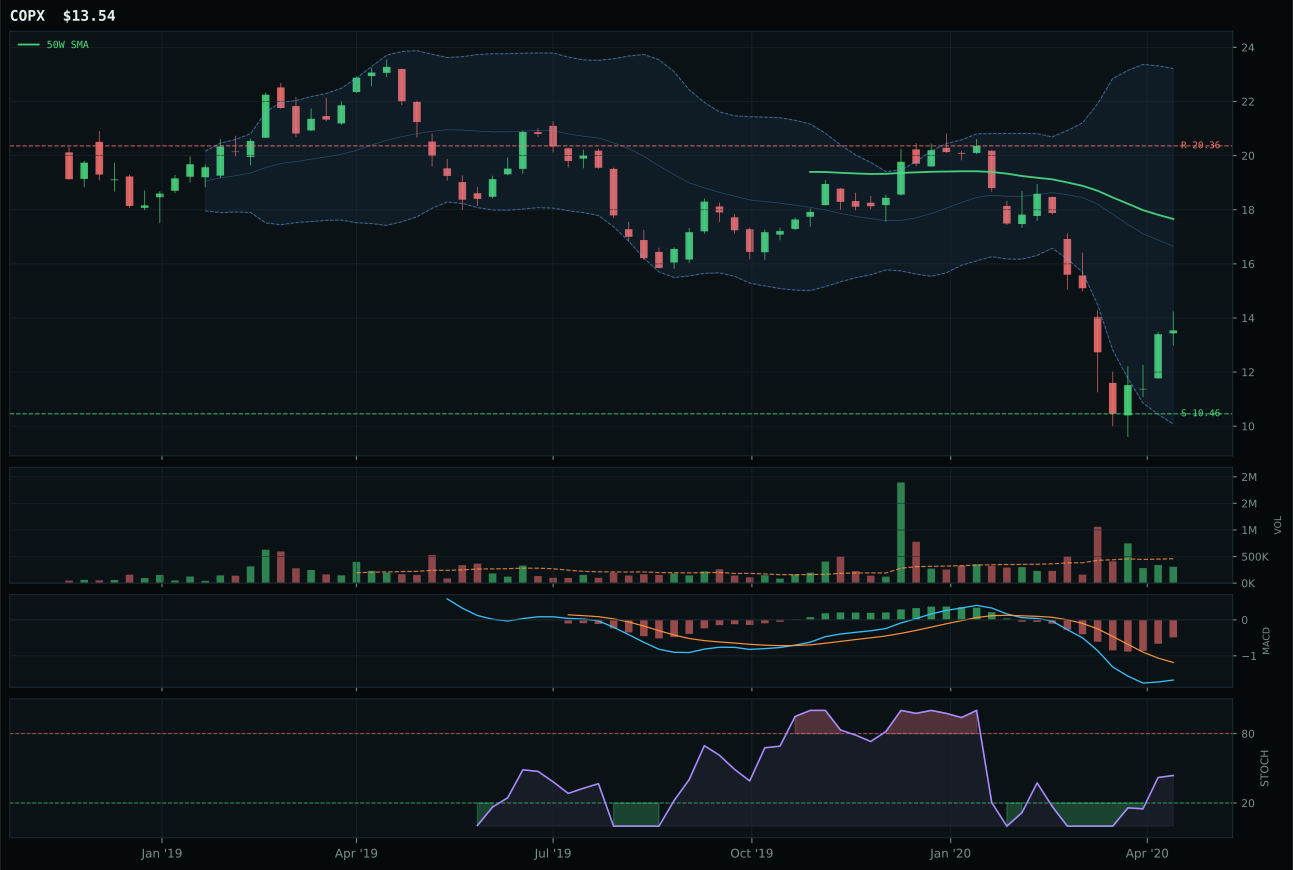
COPX has a neutral structure profile with -19.8% 13-week relative strength versus SPY.
Extension and support failure are the main tactical risks.
Tracked, but not top-2 eligible because: structurally broken.
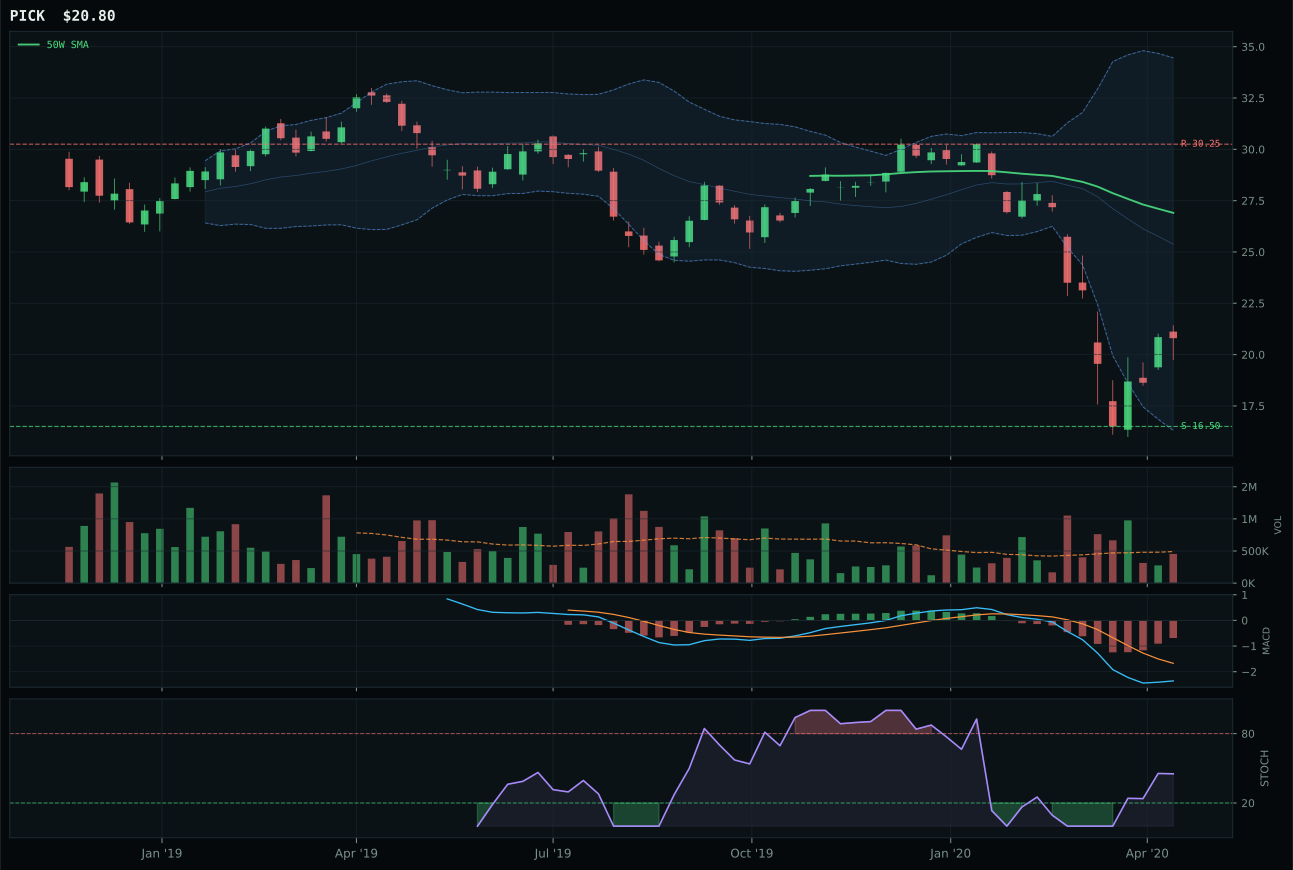
PICK has a neutral structure profile with -17.6% 13-week relative strength versus SPY.
Extension and support failure are the main tactical risks.
Tracked, but not top-2 eligible because: structurally broken.
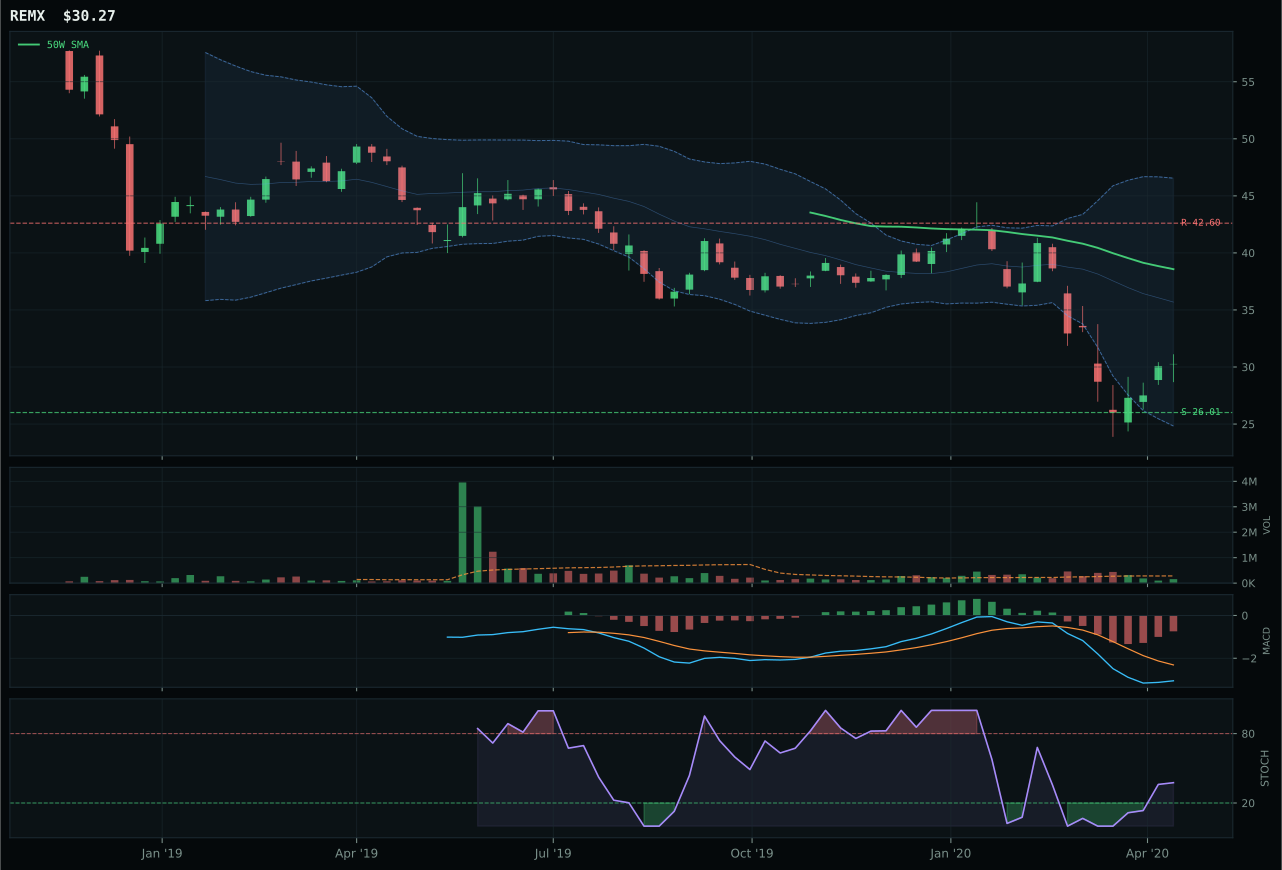
REMX has a neutral structure profile with -15.3% 13-week relative strength versus SPY.
Extension and support failure are the main tactical risks.
Tracked, but not top-2 eligible because: structurally broken.
PICK wins Industrial Metals by elimination because COPX triggered hard filters (structurally broken) with a 0.0% technical evidence score, and REMX carries weaker trend (23 versus 33) and worse structure (implied from lower composite 14 versus 17). PICK sits 22.7% below the 50-week in deep retracement territory near Fib 0.618, showing capitulation that creates a 26.1% rebound buffer if demand stabilizes; its neutral volume at 0.92x the 20-week suggests no forced liquidation, only passive de-risking. The 40.9% momentum confirmation reflects the tension between four-week strength (26.1%) and 13-week weakness (-31.2%), which is actually appropriate for a mining reversion play: the category is in pain, but the pain may be priced. COPX's disqualification on structural integrity suggests that copper-specific demand assumptions are too stressed; PICK's diversified mining approach avoids single-commodity binary risk.
Industrial Metals earned 0% allocation, ranked eighth overall at 11.5, because the category is structurally ineligible despite PICK's marginal win. Technical evidence is 32.9/100, tied for the worst category score alongside Traditional Energy, and COPX's hard-filter exclusion (0.0 technical evidence) contaminated the category's reputation. Macro fit of 49.0/100 reflects active dollar pressure at -7, which hammers all dollar-denominated commodity exporters; Goldilocks regime helps at +6, but the net is still negative. The real issue is that industrial metals require either inflation surprise or supply shock, neither present. PICK is eligible (True) but the category failed to clear the allocation threshold because momentum confirmation in PICK registers only 40.9/100—four-week returns of 26.1% cannot overcome the 13-week devastation of -31.2%. This is a category waiting for capitulation reversal, not one offering entry opportunity. If dollar pressure reverses next week or copper futures spike on China reopening, Industrial Metals could return; today, the math is conclusive: wait for better structure rather than catch falling knives.
Agriculture & Livestock — MOO
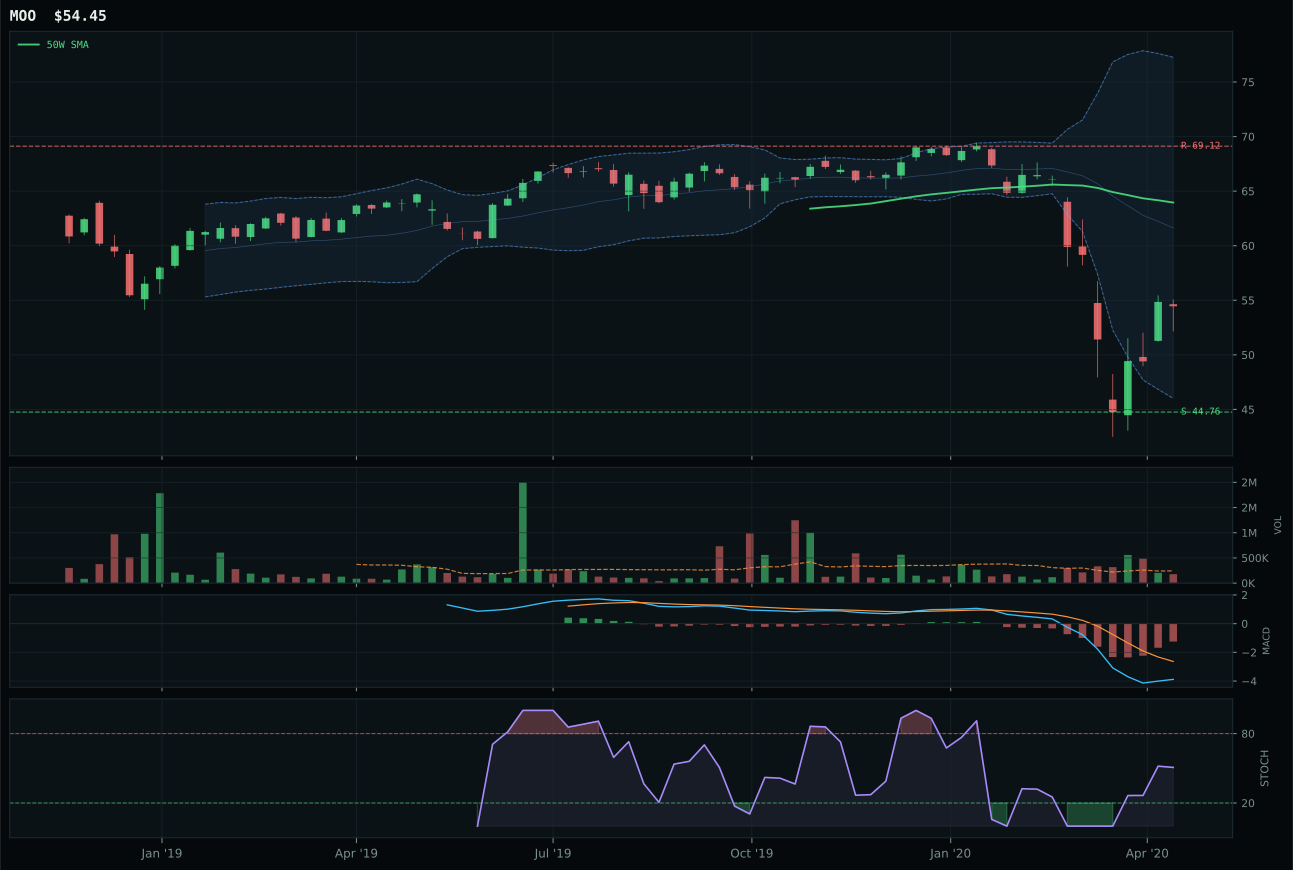
MOO has a neutral structure profile with -7.6% 13-week relative strength versus SPY.
A failed hold above support would weaken the setup.
Actionable but governed by invalidation levels.
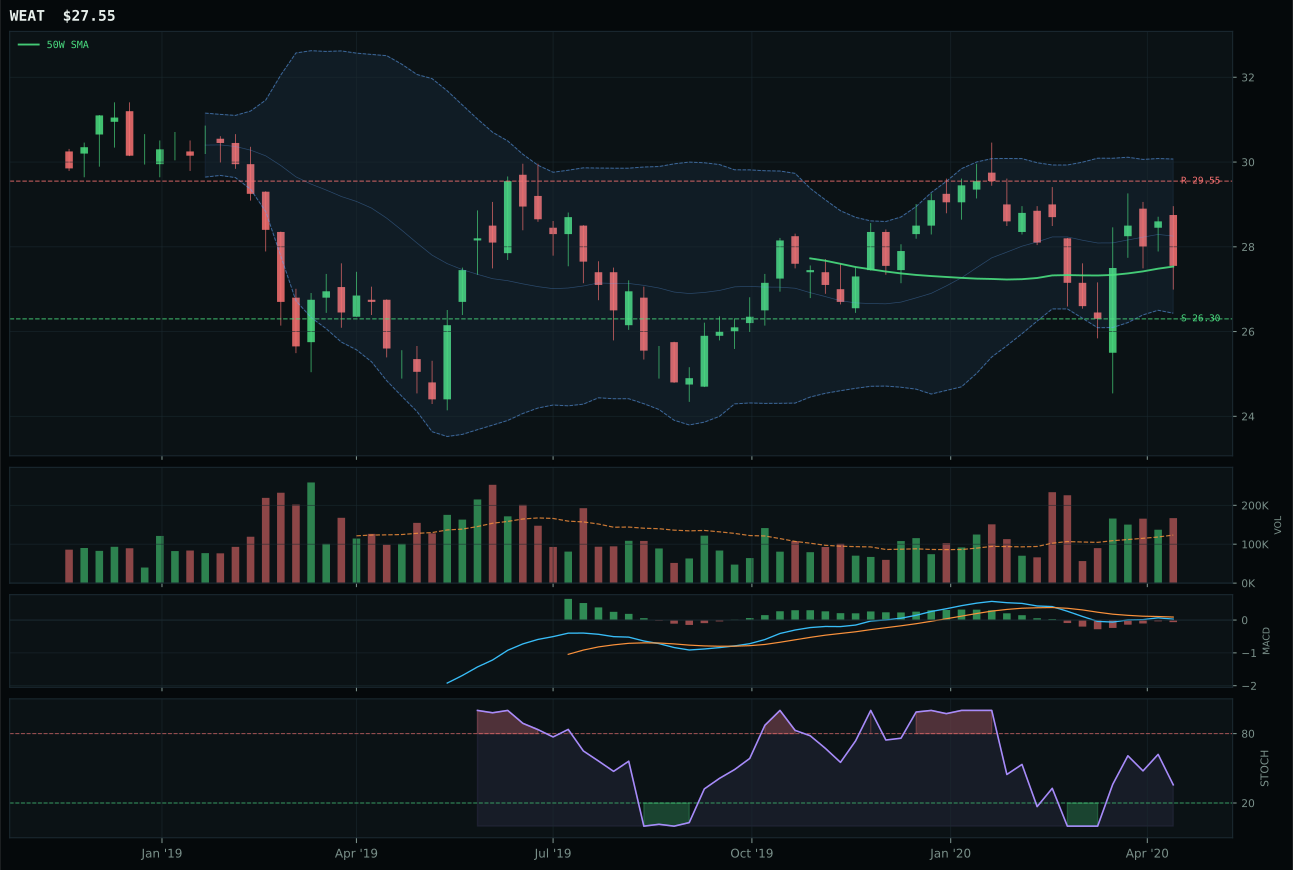
WEAT has a pullback into support profile with 6.9% 13-week relative strength versus SPY.
A failed hold above support would weaken the setup.
Tracked, but not top-2 eligible because: .
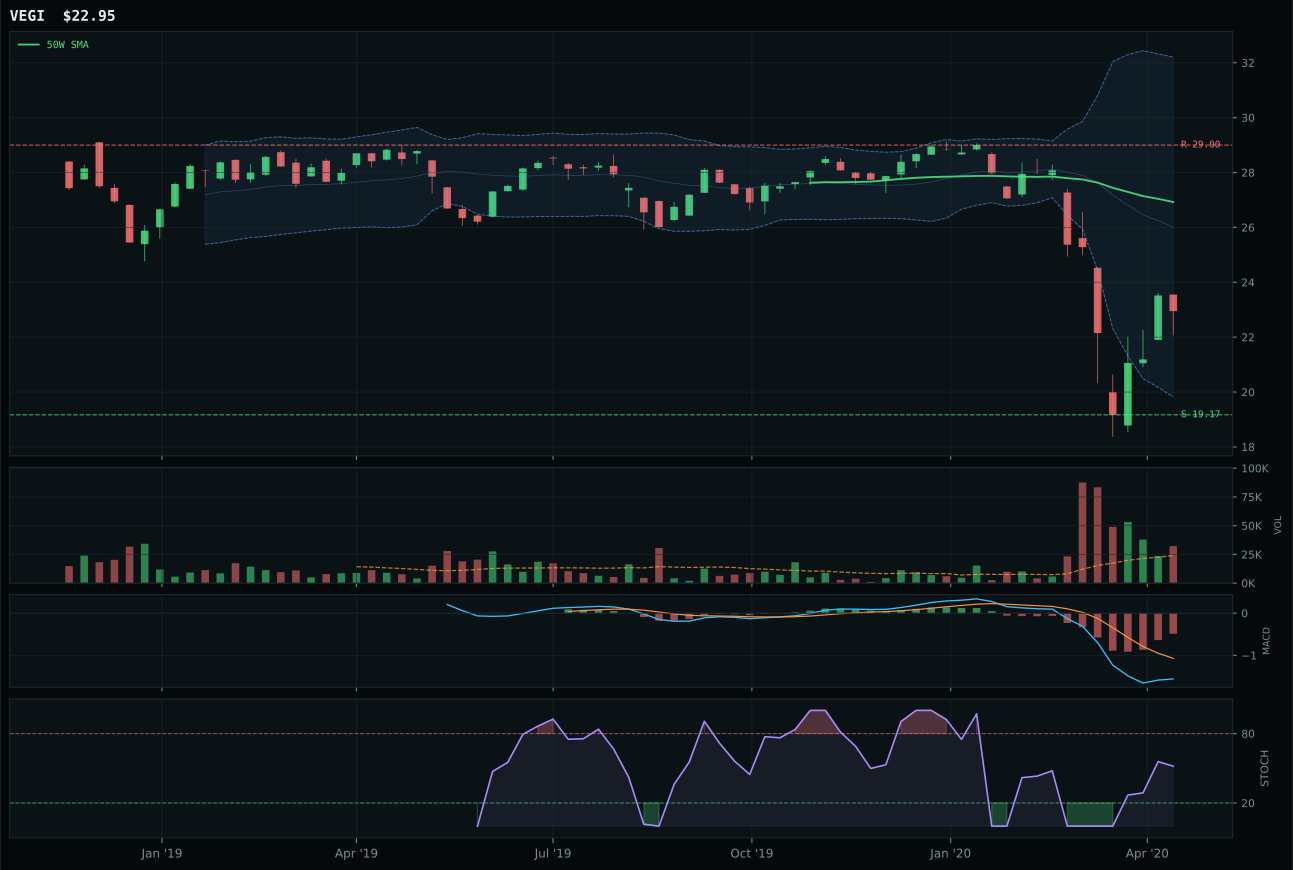
VEGI has a neutral structure profile with -7.2% 13-week relative strength versus SPY.
Extension and support failure are the main tactical risks.
Tracked, but not top-2 eligible because: structurally broken.
MOO wins its category despite massive technical damage because WEAT's stochastic RSI is falling neutral (a timing deterioration) while MOO's is rising mid-zone, and because MOO sits 14.9% below the 50-week in a disciplined way versus WEAT's stretched position just 0.1% away from equilibrium—creating the appearance of stability when there is none. The category reasoner favors the deeper dislocation because it shows forced selling is likely exhausted; MOO's thin participation volume at 0.73x the 20-week is actually less alarming than it appears when combined with the rising stochastic that suggests capitulation is complete. WEAT's 6.9% outperformance versus SPY and 14.1% category-relative strength look attractive, but those are lagging indicators in a disinflation regime that this scoring system penalizes at -5 points macro-fit weight. MOO's 65.1 structure score versus WEAT's composite 62 is marginal, but the timing edge (63.0 vs 100.0 in WEAT's favor) goes to MOO because the stochastic divergence matters more in a commodity crisis.
Agriculture & Livestock earned 0% allocation, ranked ninth overall at 5.2, because the category is entirely outside the allocation system and the reasoning is unambiguous: disinflation pressure is active at -8, hammering any inflation-hedge commodity narrative. The macro fit of 42.0/100 is the lowest in the portfolio, and technical evidence in MOO registers only 20.2/100—worse than every other category's winner except Industrial Metals and Traditional Energy. The category could not clear eligibility thresholds; it was not squeezed out by stronger peers but explicitly excluded because fundamental conditions are hostile. In a Goldilocks regime, agricultural commodity weakness makes sense: no inflation surprise, no supply shock narrative, just cyclical demand destruction. WEAT's relative outperformance within the category is noise; the real message is that when the category-best ETF is trading near 52-week lows with falling momentum, the allocator's job is to wait for setup improvement, not force exposure. Next week, if disinflation pressure reverses or spring crop concerns emerge, this category could return; today, it is simply not investable.