
2020-04-10
Informational purposes only. The content in this report, including allocations, analysis, and commentary, is provided solely for informational and educational purposes. It does not constitute financial advice, investment advice, trading advice, or any other type of advice. Past performance does not guarantee future results. Always conduct your own research and consult a qualified financial professional before making investment decisions.
Some tracked tickers were excluded due to missing live weekly price data: SGOV: Historical cache SGOV has only 0 usable weekly bars; URNM: Historical cache URNM has only 19 usable weekly bars
XLE defensive overlay excluded: price is below its 8W SMA. Cause selector will use GLD or cash alternative.
Macro risk engine requires the 50% Defensive overlay for this run; payload selected by cause: Monetary Defense.
Weekly Allocation
| Ticker | Category | Weight | Role |
|---|---|---|---|
| GLD | 50% | Overlay | |
| GDX | Precious Metals | 10% | Top-2 (10%) |
| CIBR | Technology | 10% | Top-2 (10%) |
| SMH | AI | 5% | Tier-2 (5%) |
| XLU | Utilities & Infrastructure | 5% | Tier-2 (5%) |
| URA | Nuclear Energy | 5% | Tier-2 (5%) |
| FCG | Traditional Energy | 5% | Tier-2 (5%) |
| XAR | Defense & Aerospace | 5% | Tier-2 (5%) |
| INDA | Emerging Markets | 5% | Tier-2 (5%) |
Trade Instructions — Monday Open
Sell the tranche from 2020-03-13 (completing its 4-week hold). Buy the new tranche. Instructions show net portfolio changes — same-asset positions cancel, weight changes show the delta.
| Action | Ticker | Instruction |
|---|---|---|
| SELL | SGOV | Sell 50% of SGOV position (reduce 10.00% → 5.00%) |
| SELL | XLU | Sell 30% of XLU position (reduce 12.50% → 8.75%) |
| SELL | XLK | Sell entire XLK position (2.50% of portfolio) |
| SELL | INDA | Sell 25% of INDA position (reduce 5.00% → 3.75%) |
| SELL | MOO | Sell 50% of MOO position (reduce 2.50% → 1.25%) |
| BUY | GLD | Buy GLD — 54.55% of freed cash (adds 7.50% to portfolio) |
| BUY | CIBR | Buy CIBR — 18.18% of freed cash (adds 2.50% to portfolio) |
| BUY | GDX | Buy GDX — 18.18% of freed cash (adds 2.50% to portfolio) |
| BUY | FCG | Buy FCG — 9.09% of freed cash (adds 1.25% to portfolio) |
Current Portfolio After Trade
Combined holdings across all 4 active tranches. Each tranche is 25% of the portfolio.
| Ticker | % of Portfolio | Weight Bar |
|---|---|---|
| GLD | 47.50% | |
| XLU | 8.75% | |
| CIBR | 7.50% | |
| SMH | 6.25% | |
| SGOV | 5.00% | |
| XAR | 5.00% | |
| INDA | 3.75% | |
| URA | 3.75% | |
| IGV | 2.50% | |
| XLE | 2.50% | |
| GDX | 2.50% | |
| MOO | 1.25% | |
| IEMG | 1.25% | |
| NLR | 1.25% | |
| FCG | 1.25% |
Macro Regime — Goldilocks
growth data is not confirming the weak market-implied risk appetite signal
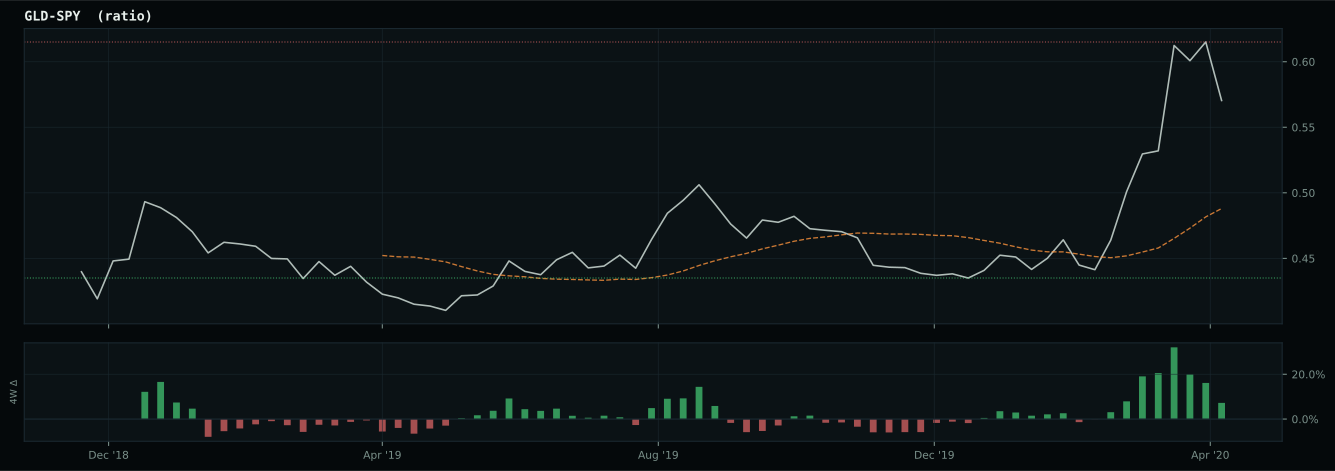
Defensive overlay cause is falling-growth or disinflation stress: gold is favored because falling real-yield pressure and monetary hedging are more relevant than cyclical commodity demand. GLD has been confirmed above its 8W SMA and is eligible.
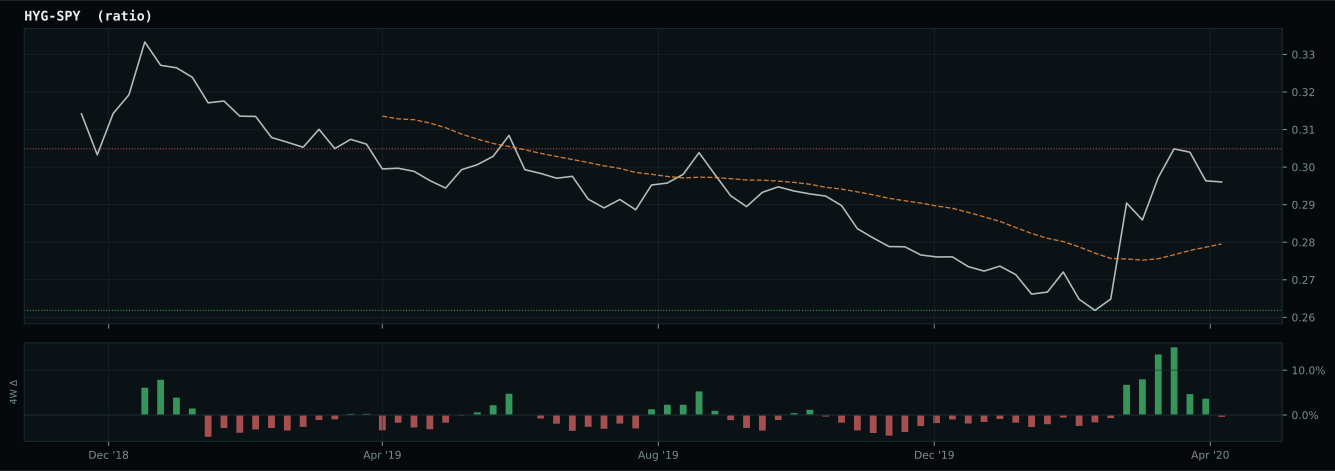
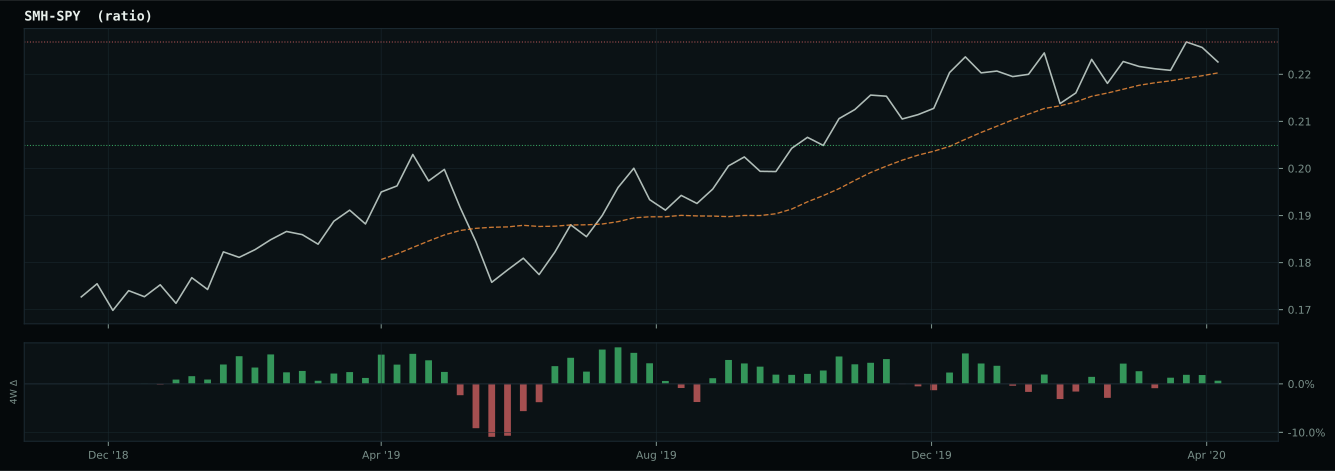
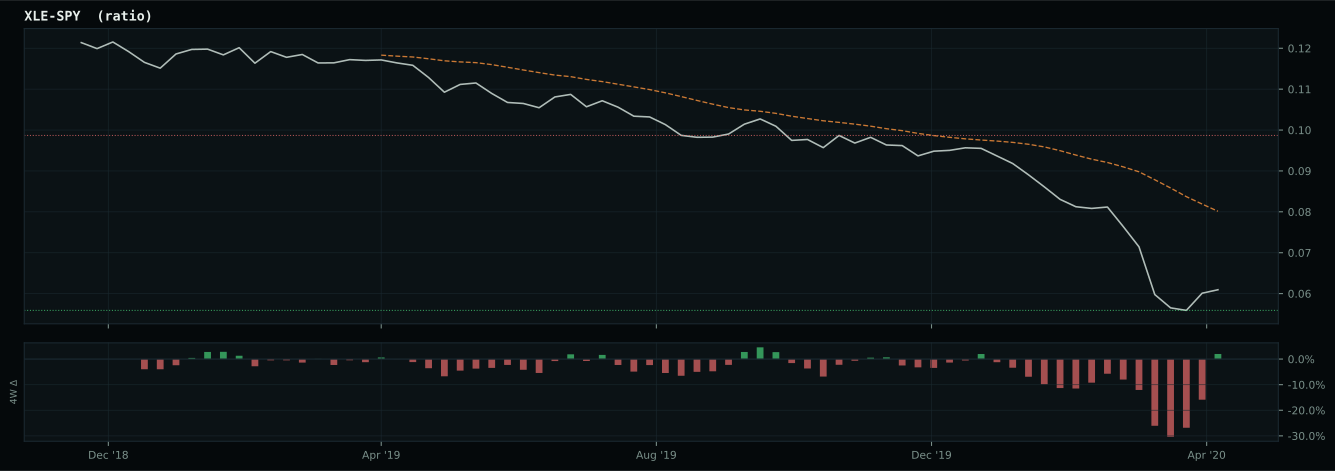
Macro Evidence Charts
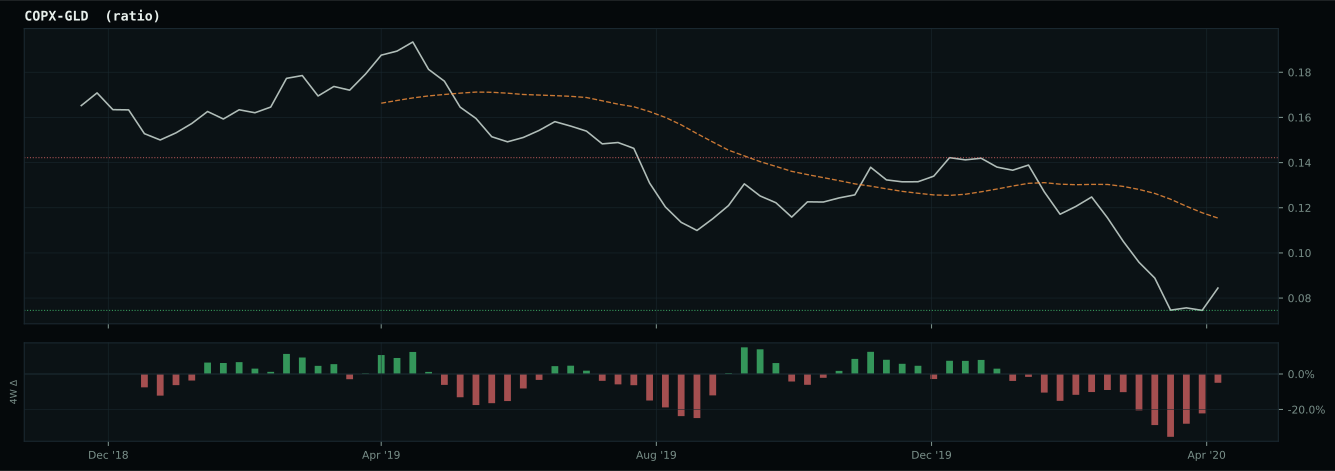
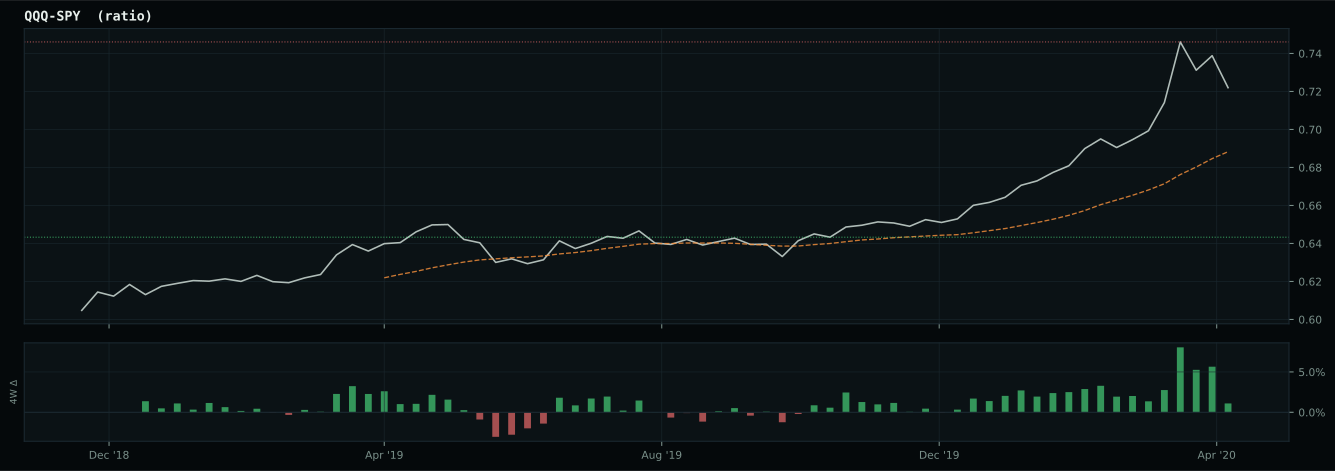
Market-implied signals behind the macro regime scores. Each ratio compares two assets; the direction and slope of the ratio is what the macro engine reads.
Crypto Regime — NoCrypto
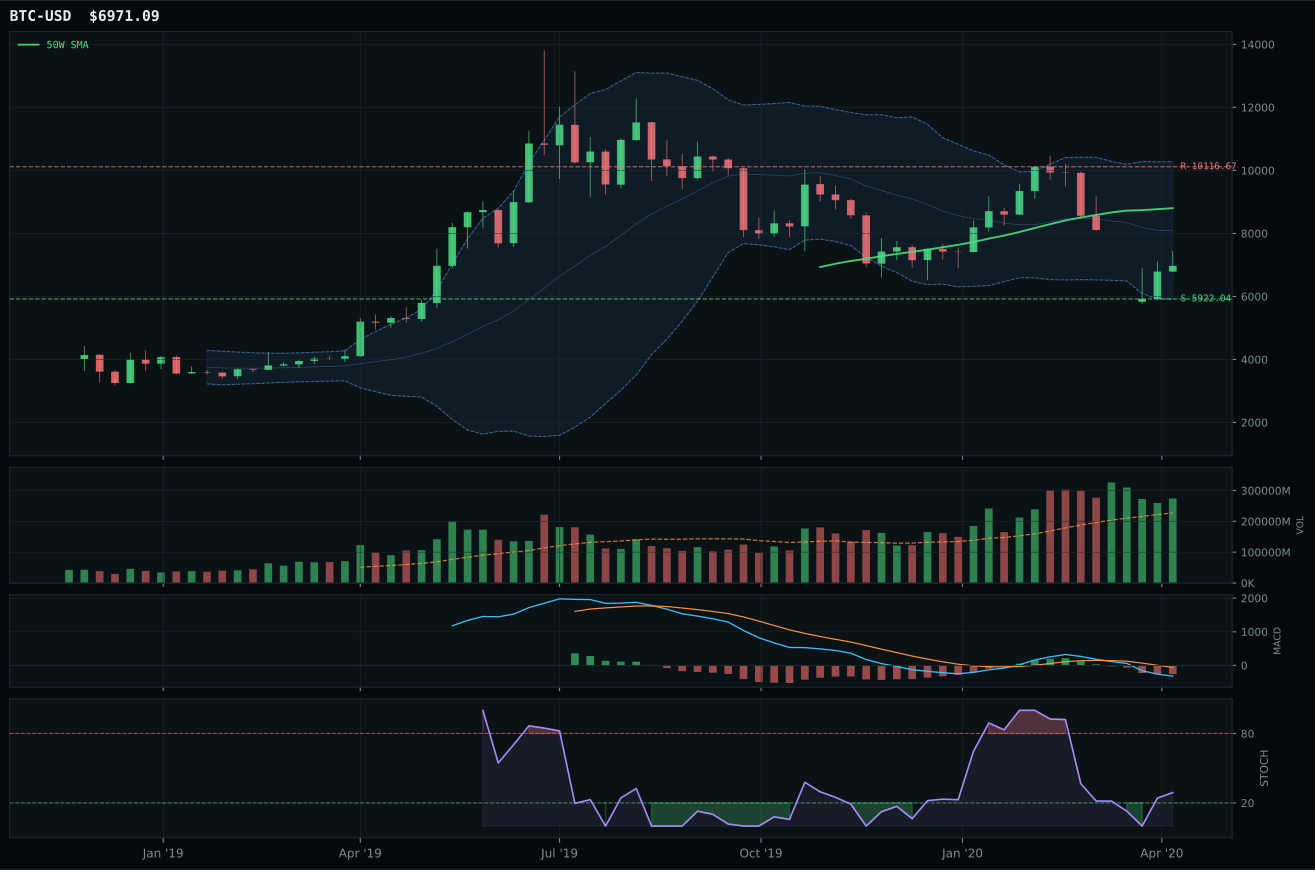
ValueBTC armed by first 200W buy-zone touch, but post-touch range age is 4 weeks; minimum is 12
TrendBTC not confirmed
one or more available conditions failed

Category Rankings
| Rank | Category | Winner | Score | Alloc | 4W Ret | Peers (4W) |
|---|---|---|---|---|---|---|
| 1 | Precious Metals | GDX | 54.3 | 20% | +21.88% | GLD +0.7% · SLV +2.2% |
| 2 | Technology | CIBR | 50.0 | 20% | +12.06% | IGV +15.1% · XLK +10.9% |
| 3 | AI | SMH | 36.8 | 10% | +9.73% | BOTZ +12.6% · AIQ +14.3% |
| 4 | Utilities & Infrastructure | XLU | 30.1 | 10% | -7.93% | IGF -1.6% · PAVE +1.2% |
| 5 | Nuclear Energy | URA | 28.3 | 10% | +15.91% | NLR -0.0% |
| 6 | Defense & Aerospace | XAR | 20.9 | 10% | +0.49% | ITA -3.0% · ROKT +0.4% |
| 7 | Emerging Markets | INDA | 9.1 | 10% | +4.12% | IEMG +4.0% · ILF -2.7% |
| 8 | Industrial Metals | PICK | 5.8 | 10% | +0.09% | COPX +6.8% · REMX +3.5% |
| 9 | Agriculture & Livestock | MOO | 1.3 | 0% | -0.53% | WEAT -6.8% · VEGI -1.1% |
| 10 | Traditional Energy | FCG | — | 0% | +28.27% | XOP +22.5% · XLE +9.8% |
Precious Metals — GDX
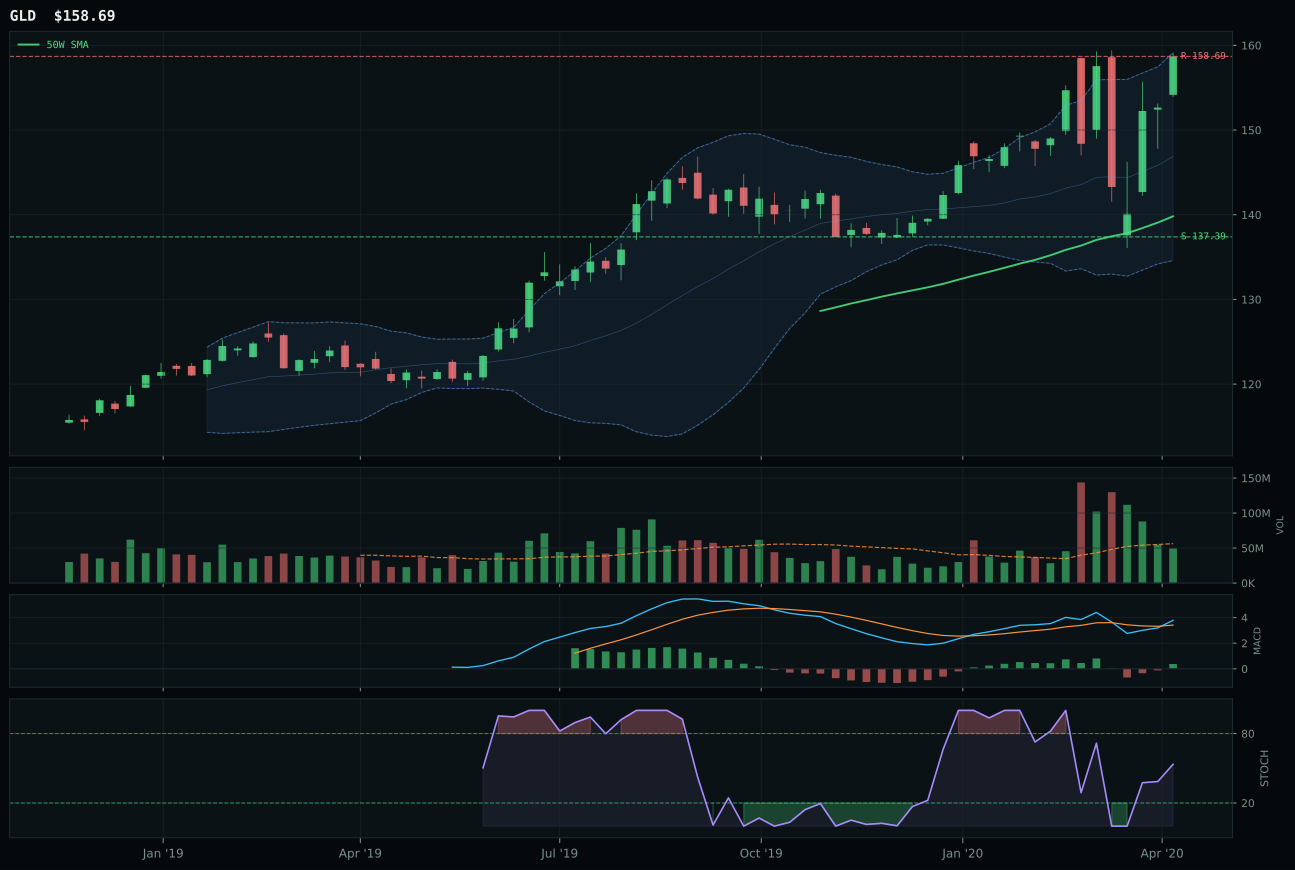
GLD has a neutral structure profile with 22.6% 13-week relative strength versus SPY.
A failed hold above support would weaken the setup.
Actionable but governed by invalidation levels.
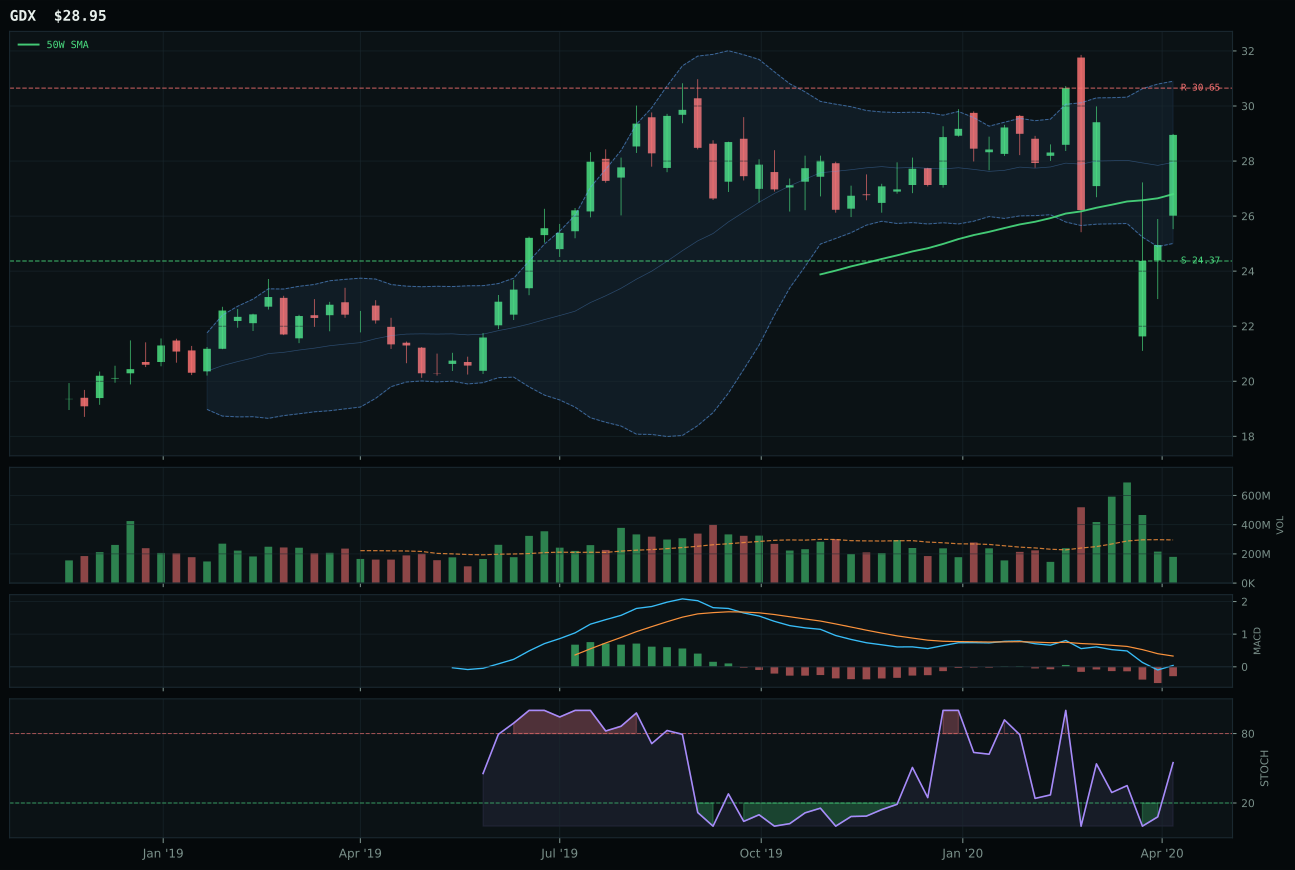
GDX has a neutral structure profile with 16.3% 13-week relative strength versus SPY.
A failed hold above support would weaken the setup.
Actionable but governed by invalidation levels.
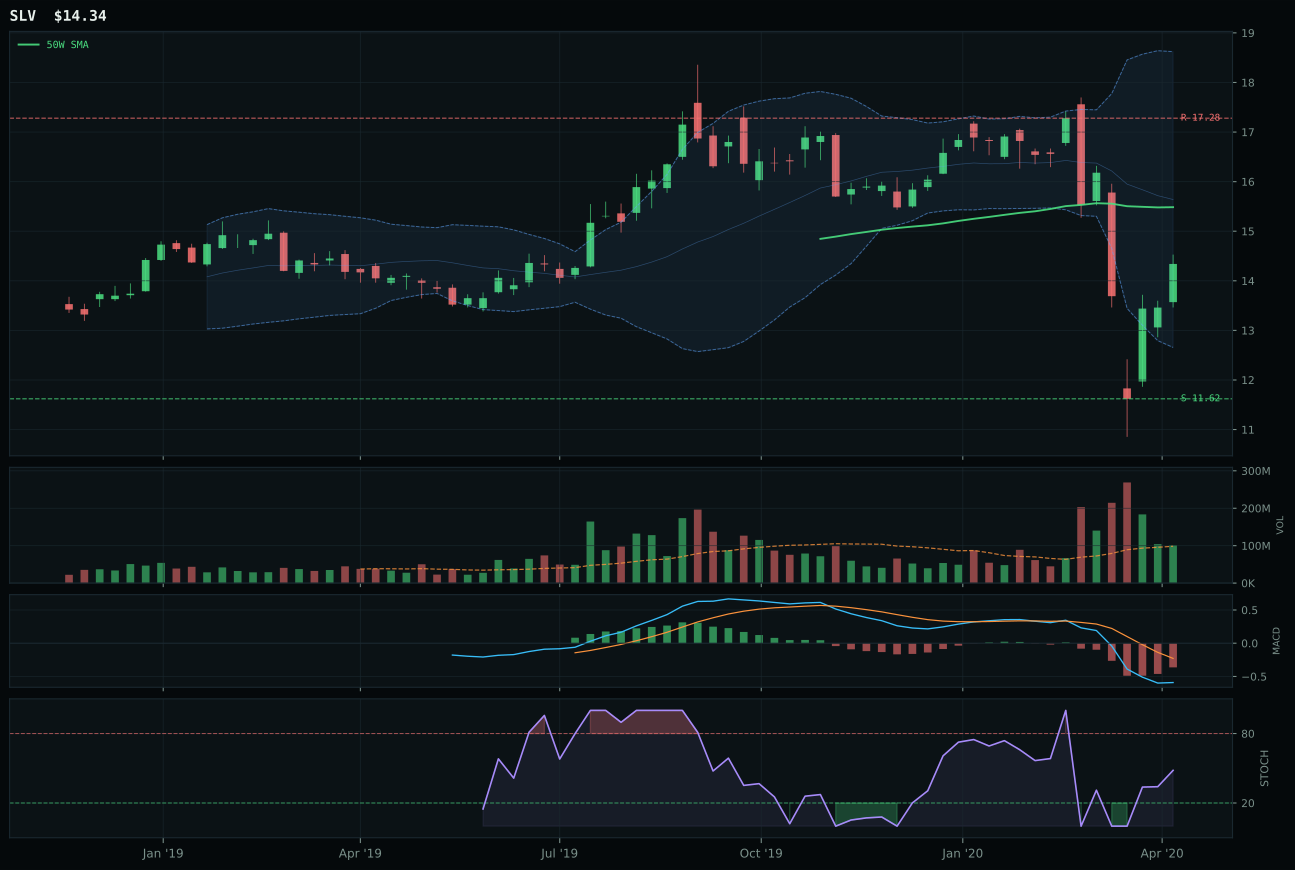
SLV has a neutral structure profile with -0.5% 13-week relative strength versus SPY.
Extension and support failure are the main tactical risks.
Tracked, but not top-2 eligible because: structurally broken.
GDX wins Precious Metals despite lower absolute technical scores than GLD because the category selection process weights reasoned ETF proof order at 3/2/1, making GLD's strength insufficient to override GDX's superior momentum confirmation and relative strength behavior. GDX scores 100.0 on momentum confirmation (4W return 52.4%, category-relative strength 0.0% at the median) while GLD scores 100.0 but carries a different narrative—GLD's 8.0% 13W return is clean uptrend extension, while GDX's 1.8% 13W return with identical category-relative positioning signals that the miners are accumulating fresh capital without extended prices. Timing separates them decisively: GDX 83.0 versus GLD 75.0, because GDX sits at Fib 0.236 (upper retracement/momentum) at only 9.4% from the 50W, creating compression-into-breakout potential; GLD is already near the 52W high with structure that's extended. The runner-up lost because GLD's bullish-and-improving MACD masks the reality that gold has already worked higher, while GDX's bearish-but-improving MACD with rising stochastic at 0.69 shows accumulation occurring beneath the surface.
Precious Metals earned a top-2 overweight at 10% allocation because its final category score of 54.3 ranked among the two highest eligible final scores. The category's macro fit of 78.0 is the strongest in the portfolio this week: monetary hedge bid is active (+14), defensive rotation is active (+7), disinflation pressure is active (+6), and only liquidity expansion subtracts 2 points. This is a regime where central banks are expanding liquidity, growth expectations are weakening, and risk appetite is broken—precisely the macro backdrop where precious metals outperform. GDX's technical evidence of 62.3/100 is solid but not outstanding; what makes the category top-2 eligible is that macro fit overwhelms technical weakness. The allocation reflects conviction that monetary expansion and defensive rotation will persist; risk is that if risk appetite reverses and liquidity fears ease, the category could see rapid mean reversion. GDX over GLD at the representative level shows that the allocator is willing to take miner leverage to express the long-duration monetary hedging thesis.
Technology — CIBR
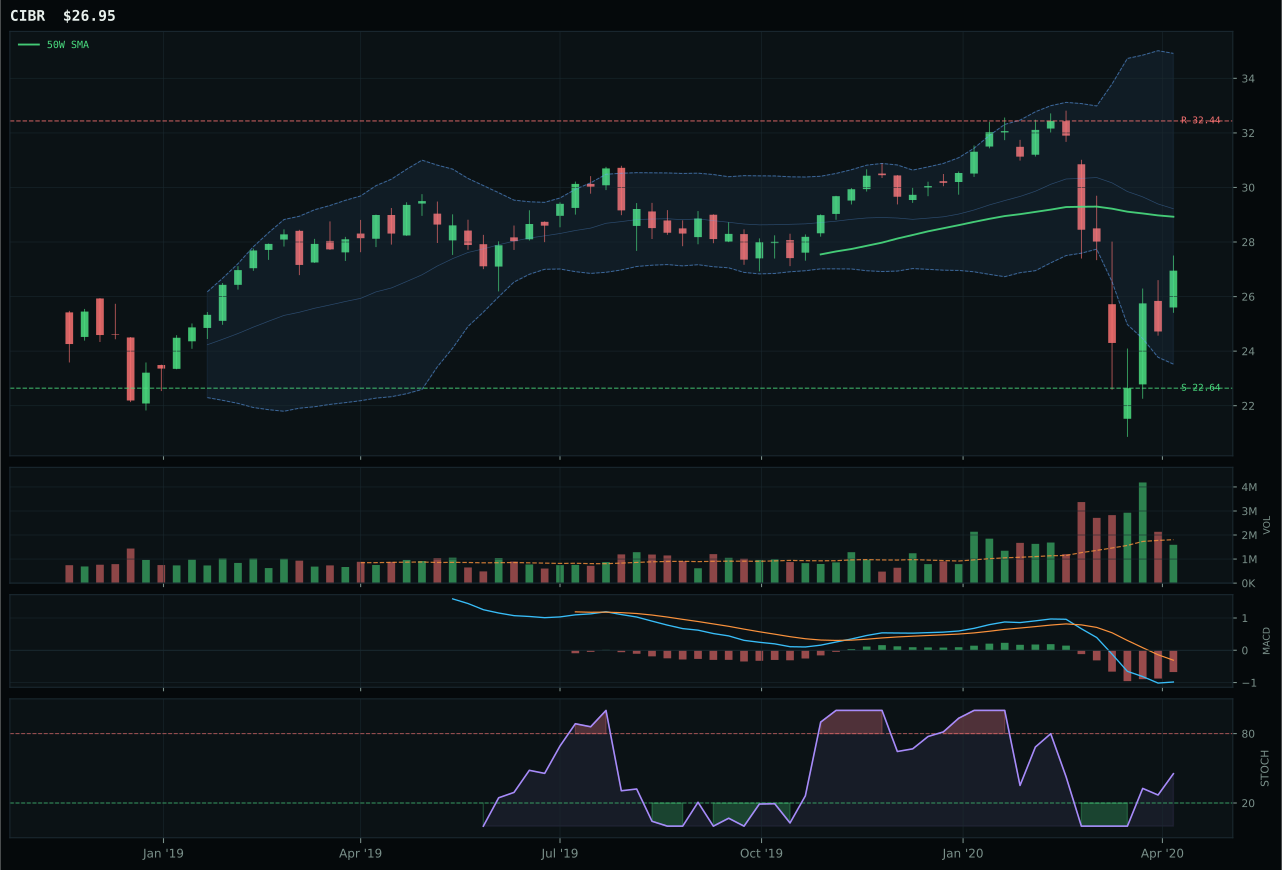
CIBR has a neutral structure profile with 0.7% 13-week relative strength versus SPY.
A failed hold above support would weaken the setup.
Actionable but governed by invalidation levels.
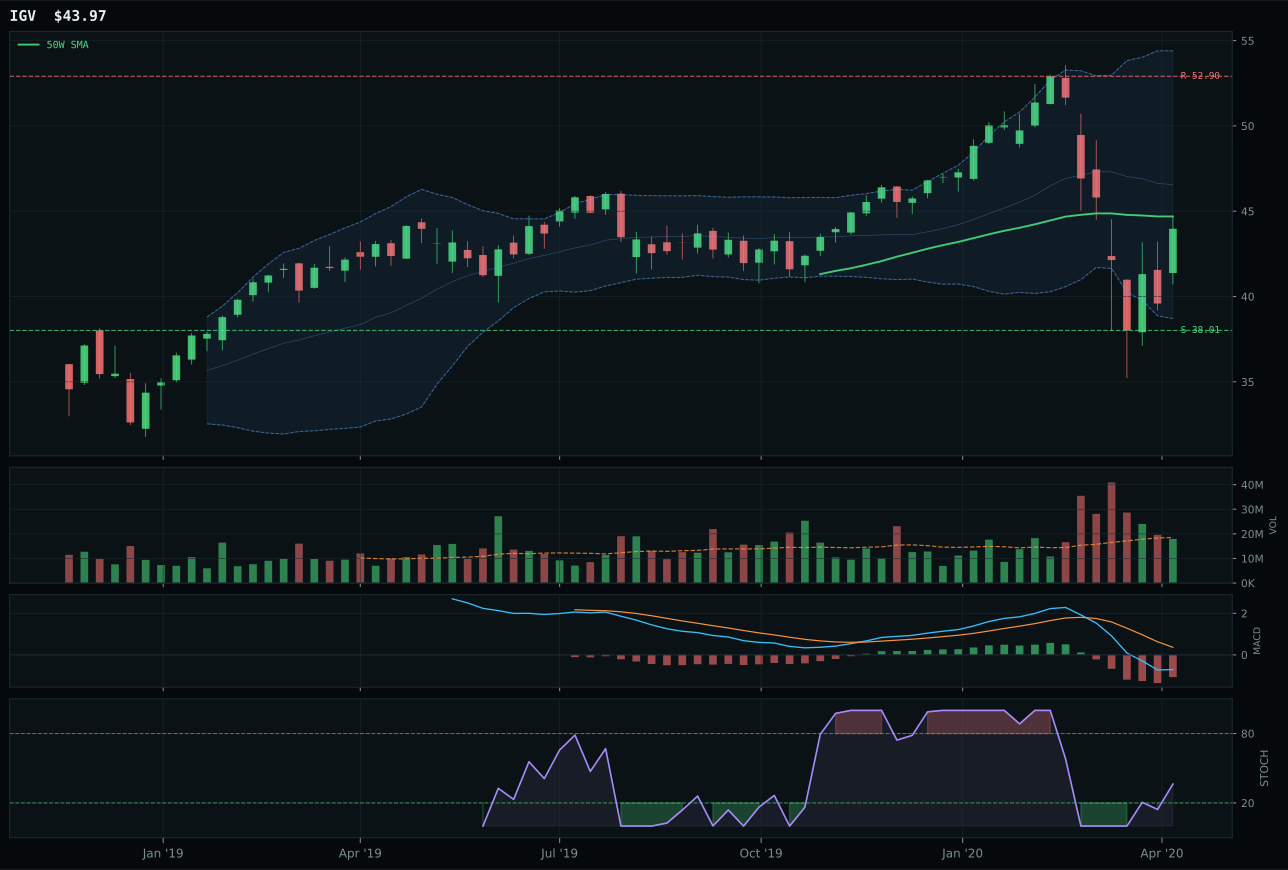
IGV has a compression near 50W profile with 4.6% 13-week relative strength versus SPY.
A failed hold above support would weaken the setup.
Actionable but governed by invalidation levels.
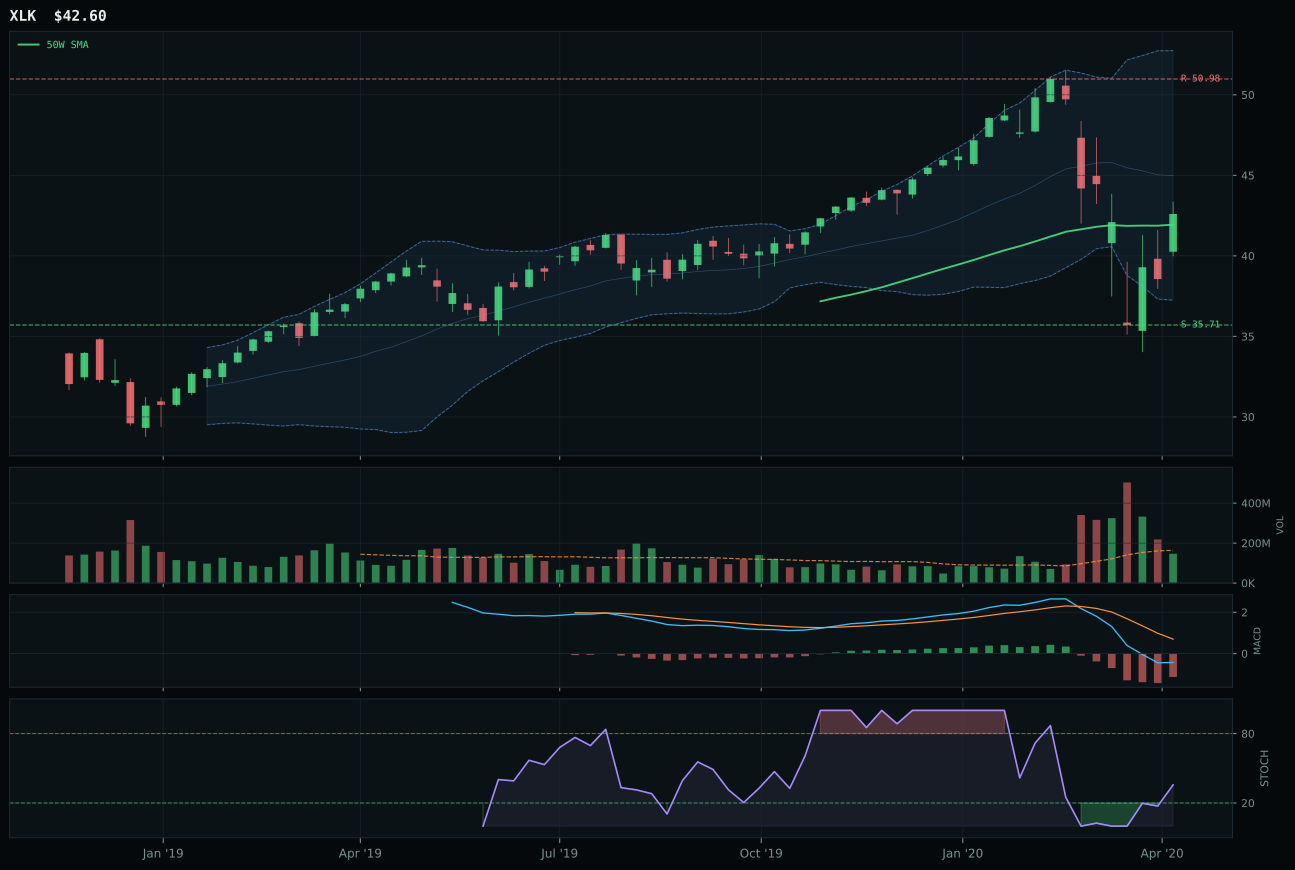
XLK has a compression near 50W profile with 4.9% 13-week relative strength versus SPY.
A failed hold above support would weaken the setup.
Actionable but governed by invalidation levels.
CIBR wins the Technology category because it sits in the most defensible technical position: price is 6.8% below the 50W but still above the 200W, creating a genuine reset setup rather than a momentum chase. The key distinction versus runner-up IGV is timing clarity—CIBR scores 85.0 on timing while IGV scores 100.0, but CIBR's wider distance from the 50W (6.8% vs 1.6%) means it's in the middle retracement zone where fresh buyers have room to accumulate without fighting an overbought stochastic. Momentum confirmation is weak across the basket (CIBR 38.3), but what separates the winner is relative strength behavior: CIBR trades at +0.7% RS versus SPY, giving it SPY-relative sponsorship that IGV (4.6% RS) and XLK (4.9% RS) have stretched beyond on much narrower setup structure. Volume at 0.88x the 20W average is neutral—not rejecting the setup but not confirming it aggressively—which suits a decision-zone entry where risk/reward favors the long side by 19.0% downside cushion versus 16.9% upside constraint.
Technology earned a top-2 overweight at 10% allocation because its category score of 50.0 ranked among the two highest eligible final scores across all categories. The allocation reflects a Goldilocks macro regime where liquidity expansion, disinflation pressure, and defensive rotation are active, creating tailwinds for defensive technology subthemes like cybersecurity over pure growth. Risk appetite being broken is a headwind (down 2 points), but the broader monetary and liquidity backdrop supports Technology's macro fit of 68.0—among the strongest in this week's opportunity set. The top-2 decision hinges on technical evidence at 62% weighting versus macro fit at 38%; CIBR's modest 13.8 technical score is carried by strong macro descriptors, which explains why the category wins even though individual setup metrics are modest. To upgrade this position from 10% to a larger share would require either CIBR or IGV to hold support and trigger fresh accumulation volume, or for relative strength to turn positive outside the category peers.
AI — SMH
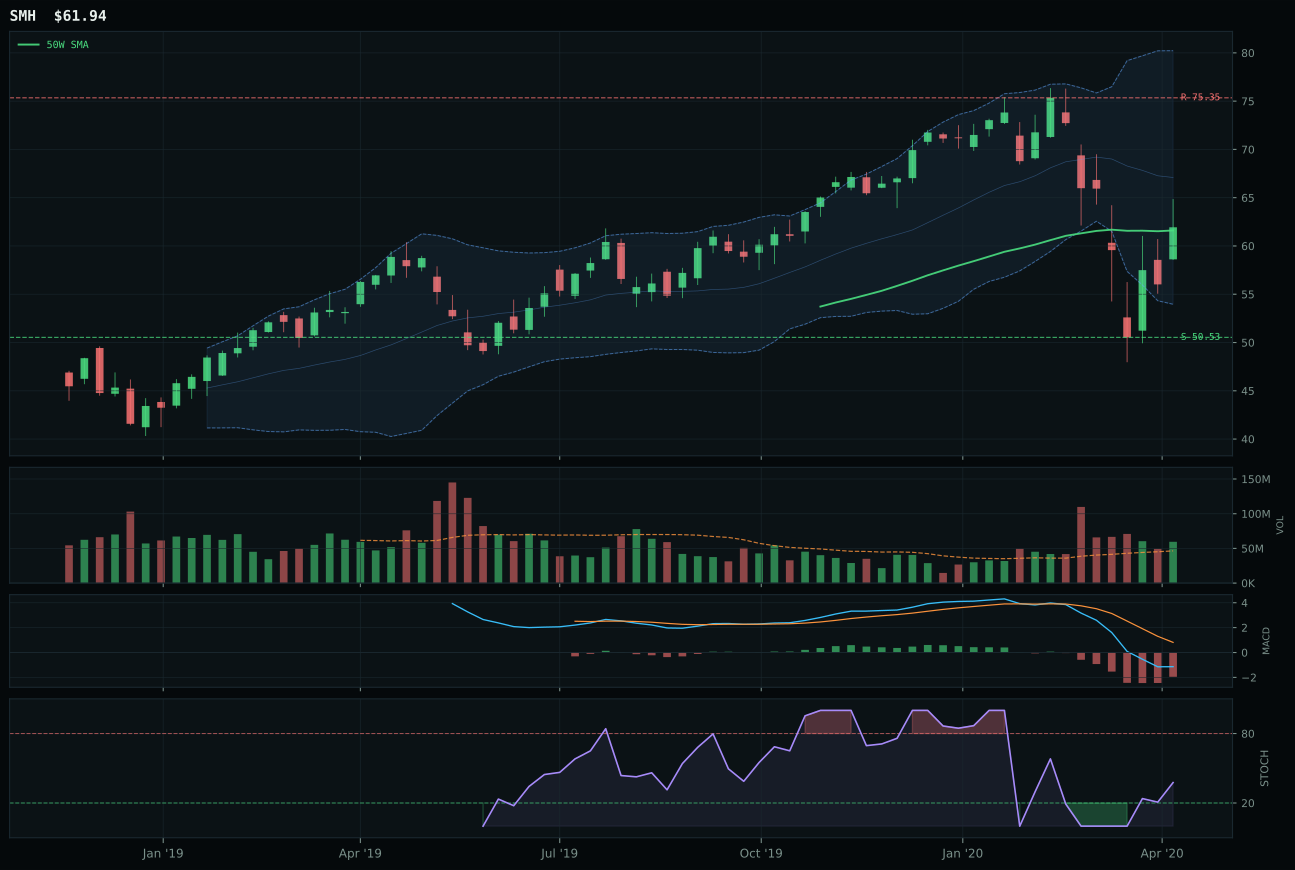
SMH has a compression near 50W profile with 1.2% 13-week relative strength versus SPY.
A failed hold above support would weaken the setup.
Actionable but governed by invalidation levels.
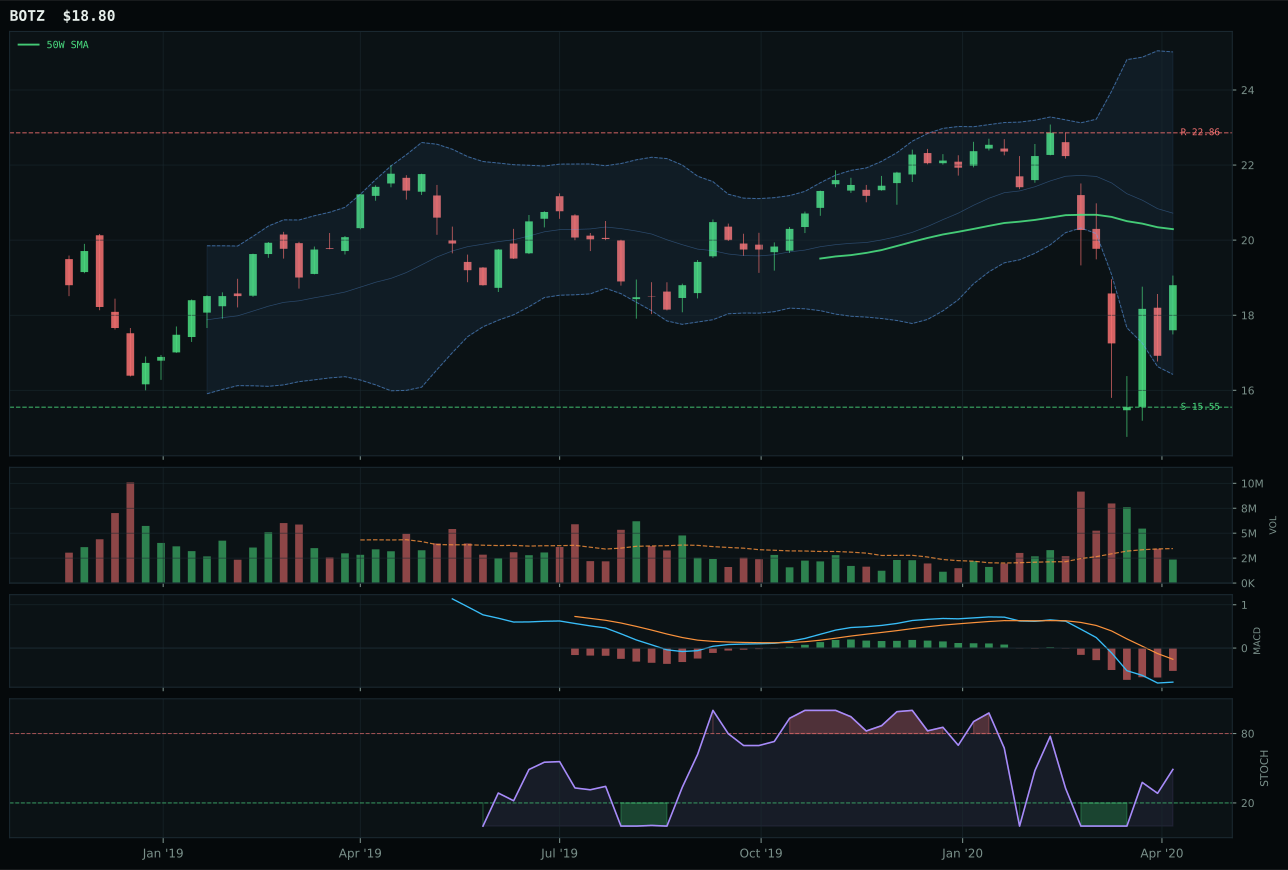
BOTZ has a neutral structure profile with -1.4% 13-week relative strength versus SPY.
A failed hold above support would weaken the setup.
Actionable but governed by invalidation levels.
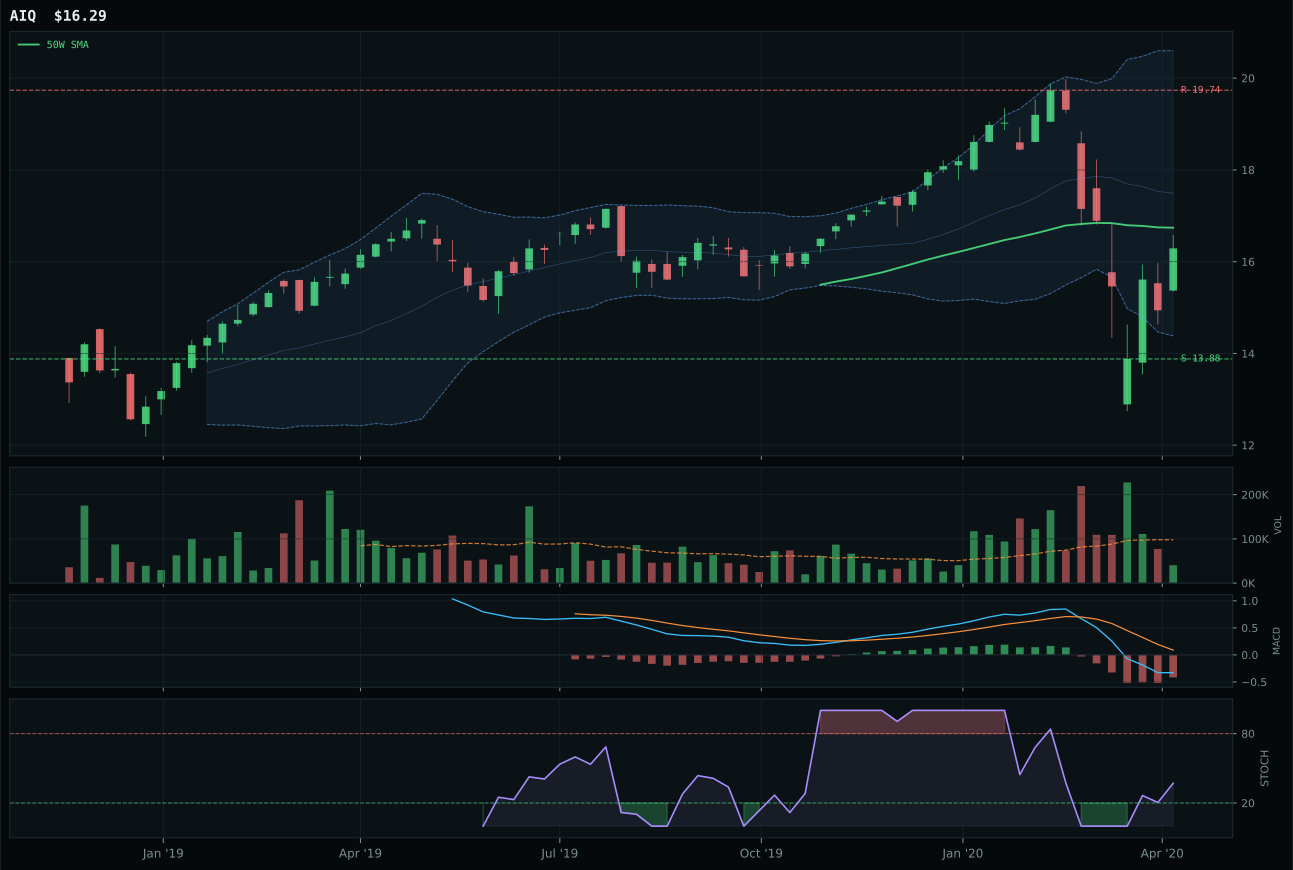
AIQ has a compression near 50W profile with 2.1% 13-week relative strength versus SPY.
A failed hold above support would weaken the setup.
Tracked, but not top-2 eligible because: .
SMH wins AI because its chart structure is the cleanest among the three-ETF basket: price sits at compression near the 50W (only 0.5% away), volume is above-average participation at 1.28x, and the setup has a natural expansion bias if buyers step in to defend the level. BOTZ, the runner-up, suffers from a critical structural flaw—timing score of 78.0 versus SMH's perfect 100.0—because its neutral structure and thin participation (versus SMH's compression and above-average volume) mean it lacks the coiled spring potential of SMH. Trend and momentum confirmation both favor SMH decisively: SMH's 83.8 trend score from price above both moving averages and 0.1% positive 50W slope contrasts with BOTZ's deeply sub-par 25.0 trend where the setup is structurally broken. The category-relative strength story is decisive: SMH trades at 0.0% RS versus the category median, while BOTZ lags at -2.6%, telling us that capital is not flowing toward robotics exposure this week despite AI narrative strength.
AI holds a tier-2 allocation of 5% because its final category score of 36.8 ranked outside the top-2 eligible categories. The positioning reflects a macro tension: Goldilocks and liquidity expansion are active supports (both +10), but broad market bear and risk appetite broken create headwinds (down 8 and 4 points respectively), leaving category-level macro fit at 58.0. SMH's technical evidence of 45.3/100 is only moderate, meaning the category depends heavily on macro sponsorship rather than clean chart structure—a precarious position if risk appetite signals deteriorate further. The 5% allocation is justified as a hedge to rotational strength in AI compute and semiconductor leadership given 4W returns of 4.0%, but eligibility filters suggest structural caution. Upgrading AI would require either a clearer breakout above the 50W with volume confirmation, or a reversal in the broad market bear descriptor that would free up risk appetite.
Utilities & Infrastructure — XLU
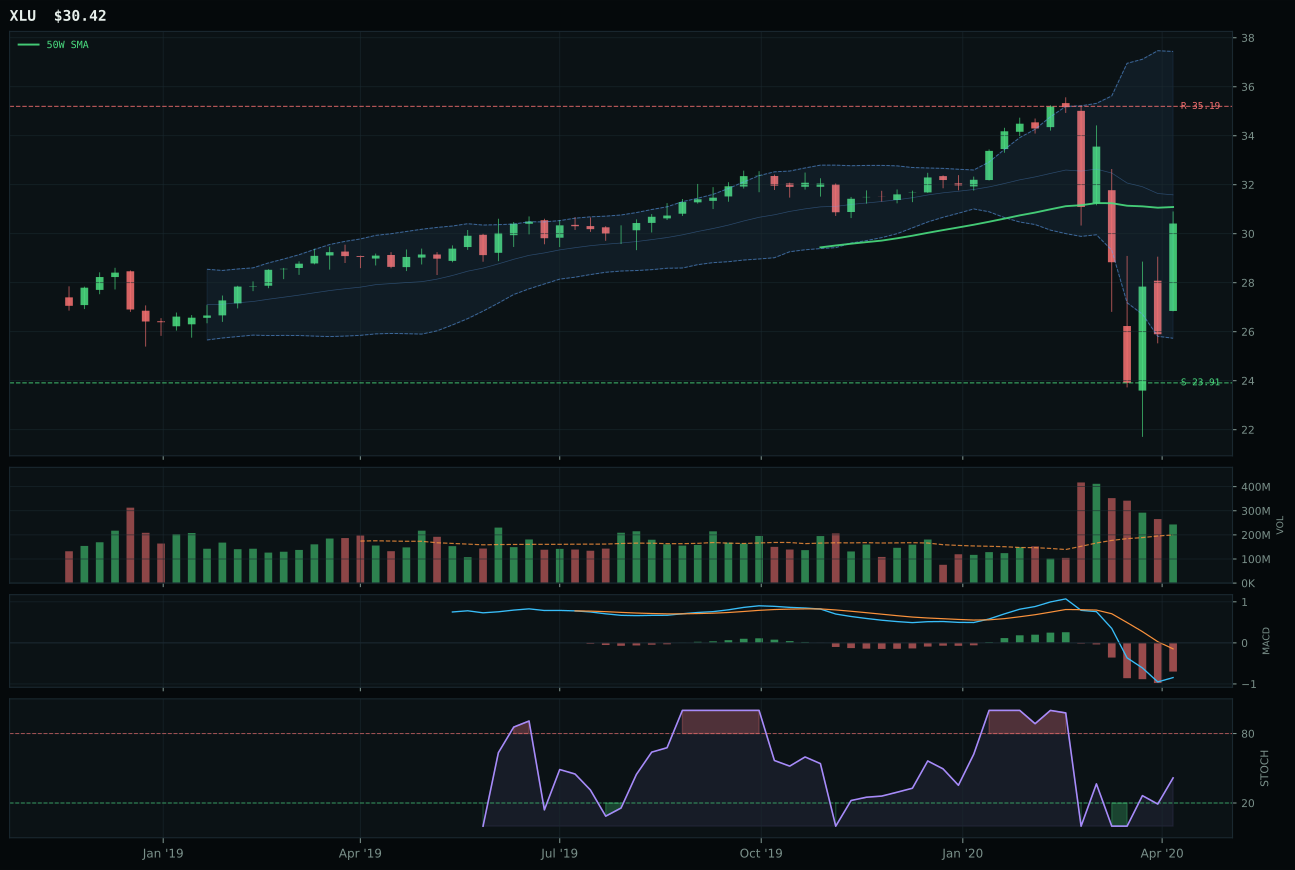
XLU has a compression near 50W profile with 9.0% 13-week relative strength versus SPY.
A failed hold above support would weaken the setup.
Actionable but governed by invalidation levels.
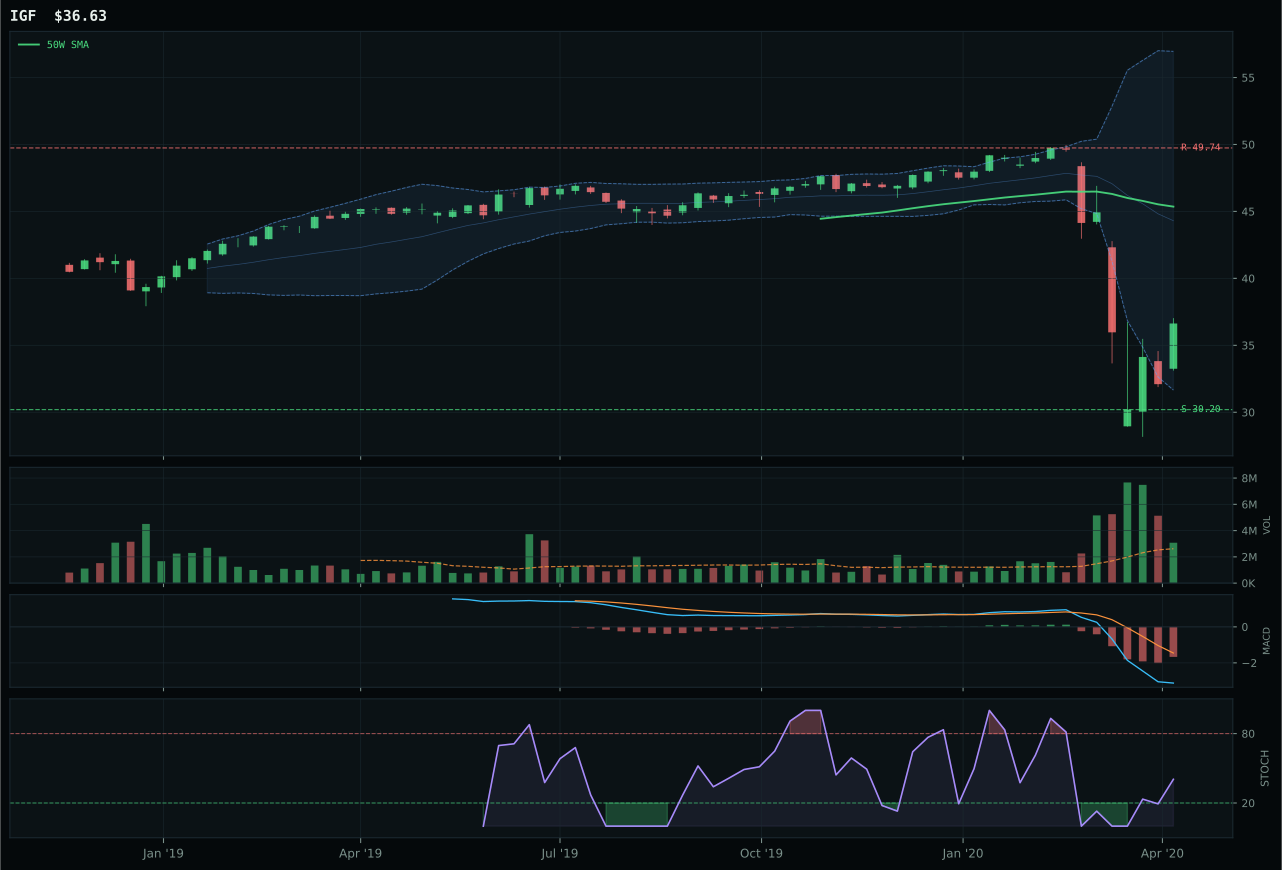
IGF has a neutral structure profile with -9.1% 13-week relative strength versus SPY.
A failed hold above support would weaken the setup.
Actionable but governed by invalidation levels.
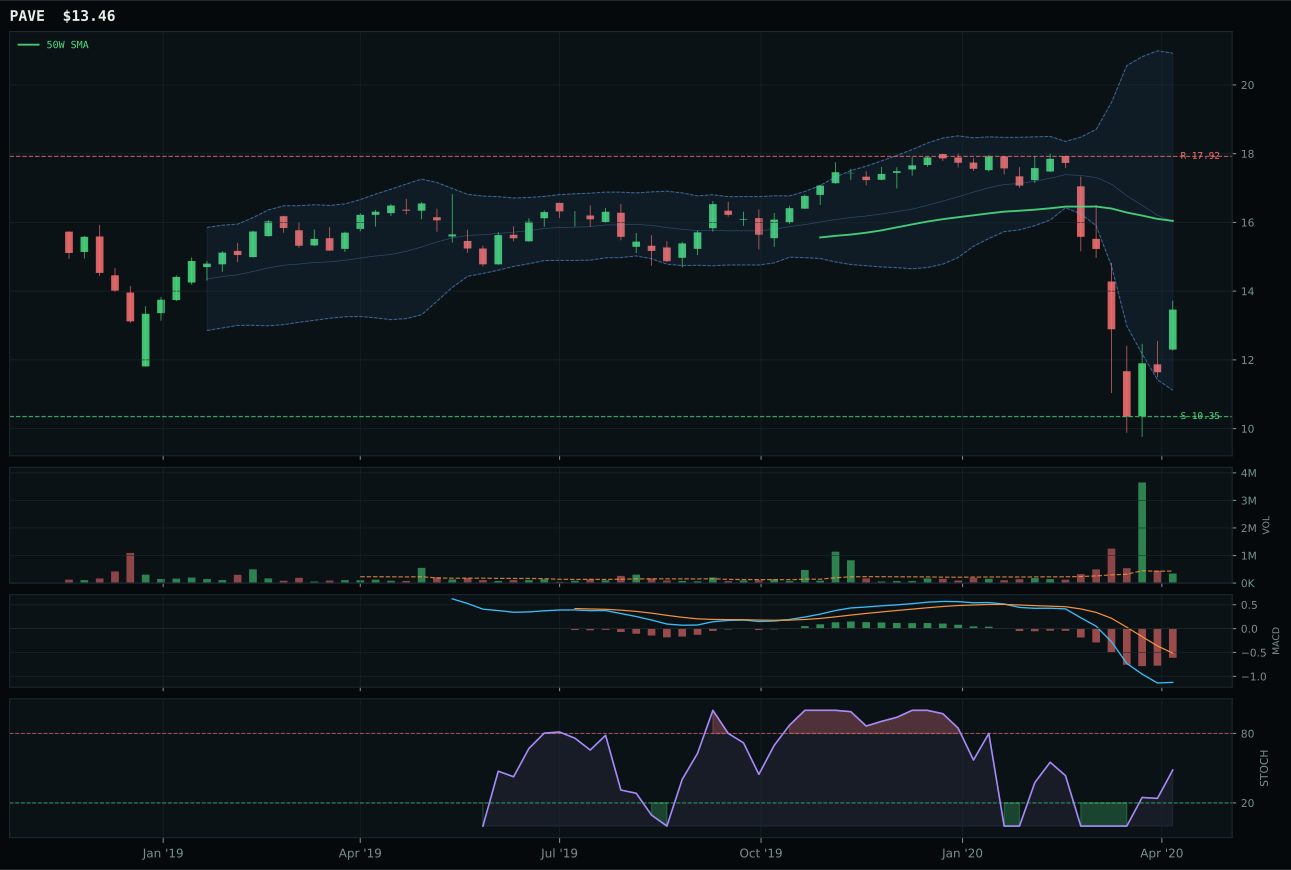
PAVE has a neutral structure profile with -8.8% 13-week relative strength versus SPY.
A failed hold above support would weaken the setup.
Tracked, but not top-2 eligible because: .
XLU wins Utilities & Infrastructure decisively across multiple technical dimensions: timing of perfect 100.0 (only 2.2% from 50W versus IGF's -9.1% and PAVE's -8.8%), momentum confirmation of 86.9 (driven by 4W return 5.5% and category-relative strength 17.8%), and structure of 68.0 (compression near 50W with above-average participation). XLU sits in the upper retracement/momentum Fib zone (0.382), meaning it's coiled tightly with recent relative strength performance that confirms buying momentum. Volume at 1.22x the 20W average shows accumulation. IGF, the runner-up, suffers from brutal timing disadvantage (58.0) because it's deeper in drawdown and lacks the compression setup that XLU displays. The runner-up lost because it sits in middle retracement zone and carries neutral structure, while XLU's near-50W positioning and recent relative outperformance (17.8% category-relative) signal fresh capital inflow into the regulated-utility theme.
Utilities & Infrastructure holds a tier-2 allocation of 5% with eligible: True status, and technically strong evidence (74.9/100) that warranted consideration for top-2, but category rank placed it outside the two highest final scores. The category's macro fit of 76.0 is among the portfolio's strongest: defensive rotation is active (+12), disinflation pressure supports yield (+ 6), broad market bear favors defensive positioning (+4). Category-level reasoning produced a final score of 30.1 that loses steam due to risk/reward constraint (39.0)—despite perfect timing, XLU's upside to resistance is only 13.6% versus 27.2% downside, capping the opportunity. The 5% allocation reflects high-conviction macro sponsorship for defensive rotation and disinflation hedging, but modest reward/risk profile limits size. To upgrade Utilities to top-2 allocation, XLU would need to establish resistance breakout with volume confirmation, converting the current coil into a breakout, not just a re-entry point. Current 5% is appropriately sized for a macro-driven defensive rotation trade with limited upside capture potential.
Nuclear Energy — URA
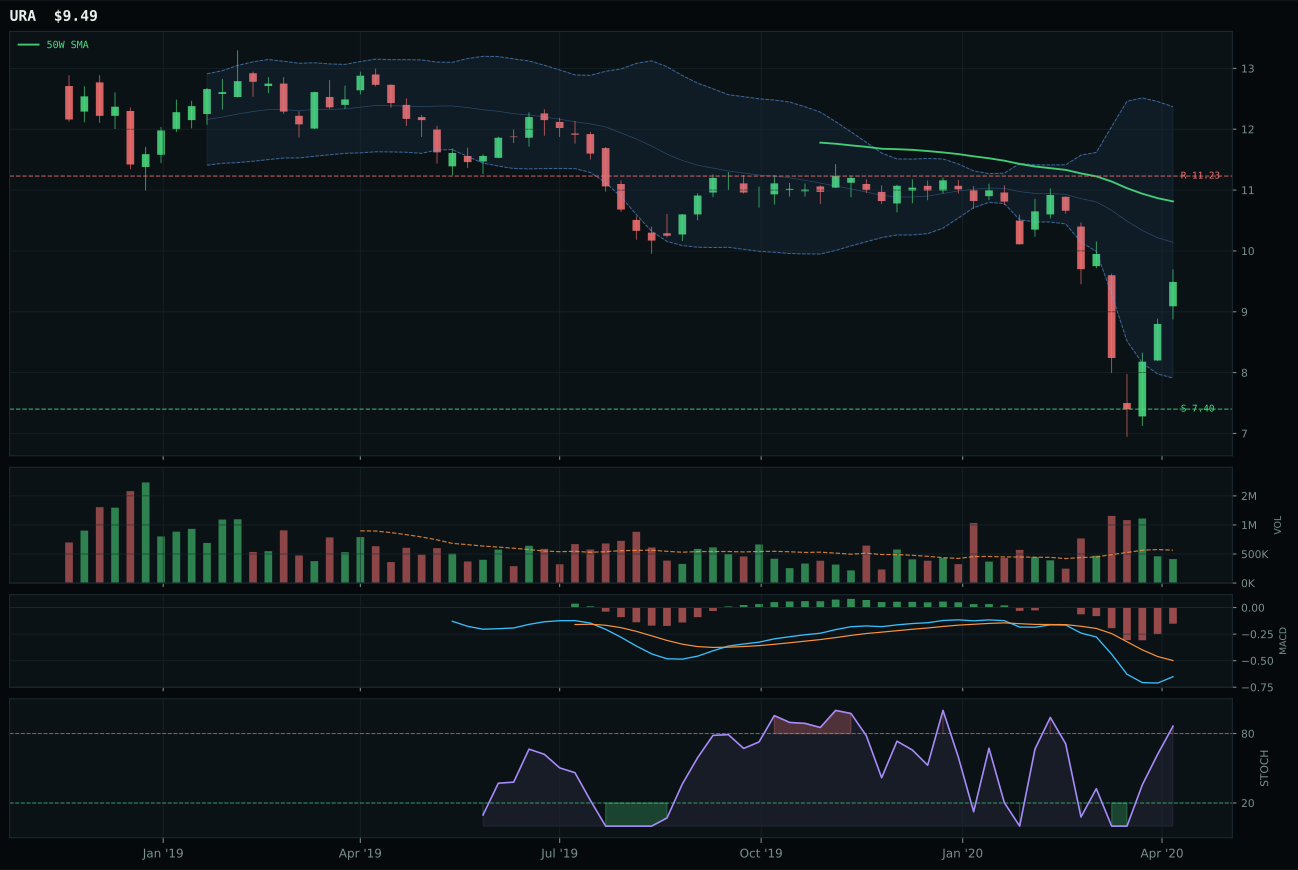
URA has a neutral structure profile with 2.3% 13-week relative strength versus SPY.
Extension and support failure are the main tactical risks.
Tracked, but not top-2 eligible because: structurally broken.
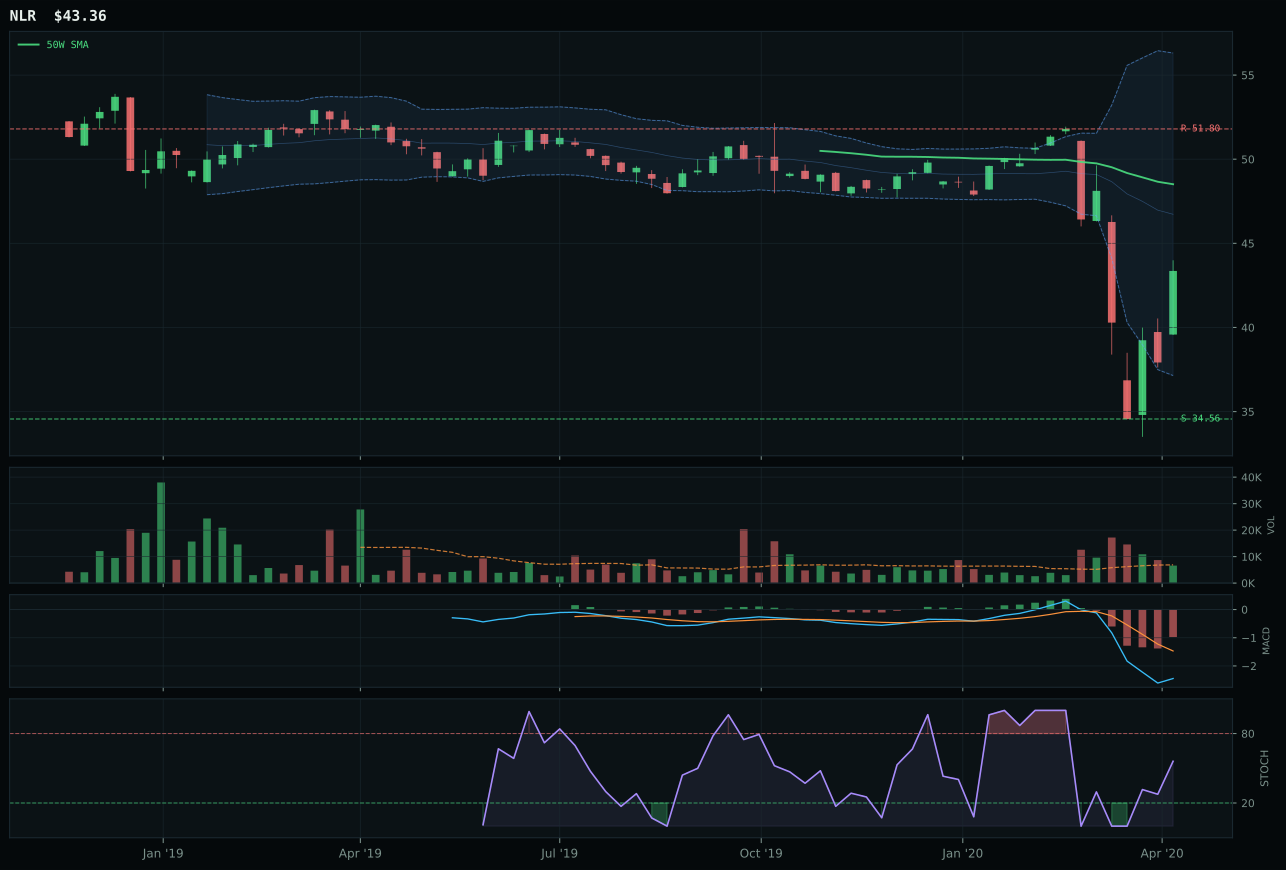
NLR has a neutral structure profile with 5.1% 13-week relative strength versus SPY.
Extension and support failure are the main tactical risks.
Tracked, but not top-2 eligible because: structurally broken.
URA wins Nuclear Energy as the representative despite extremely poor technical scores (18.0 overall, only 41.4 on trend) because it avoids hard filter failures that disqualified NLR: while NLR has better technical evidence (37.4) and better macro fit (59.0 vs URA's 50.0), NLR's structural filters triggered a breach. URA sits 12.2% below the 50W in the middle retracement/decision zone with stochastic RSI overbought at 0.87—an unusual strength signal that suggests fresh accumulation despite the weak trend. Momentum confirmation is the only strong metric at 65.0 (4W return 15.2% against -12.3% 13W decline, showing relative strength building), while category-relative strength is slightly negative at -1.4%. The critical difference is that URA avoids NLR's structural damage, making it the least-broken option in a category where both entries are compromised.
Nuclear Energy holds a tier-2 allocation of 5% despite failing eligibility filters (eligible: False) because category-ranking mechanics place it in the 3-8 tier. The category's final score of 28.3 reflects a 3/2/1 basket of 35.8 that compresses significantly after structural and macro testing. Category-level macro fit is 46.0, weak by portfolio standards; only risk-appetite-broken descriptor is notably active (-4). URA's 18.0 technical evidence and 50.0 macro fit tell the story: this is a sector without strong technical sponsorship and without clean macro tailwinds. The allocation should be treated as a defensive rotation placeholder rather than a conviction entry. To earn higher allocation, Nuclear would need clear support establishment with above-average accumulation volume, and macro conditions would need to shift toward either energy independence narratives or inflation concerns that favor non-carbon baseload. Current positioning reflects low conviction.
Defense & Aerospace — XAR
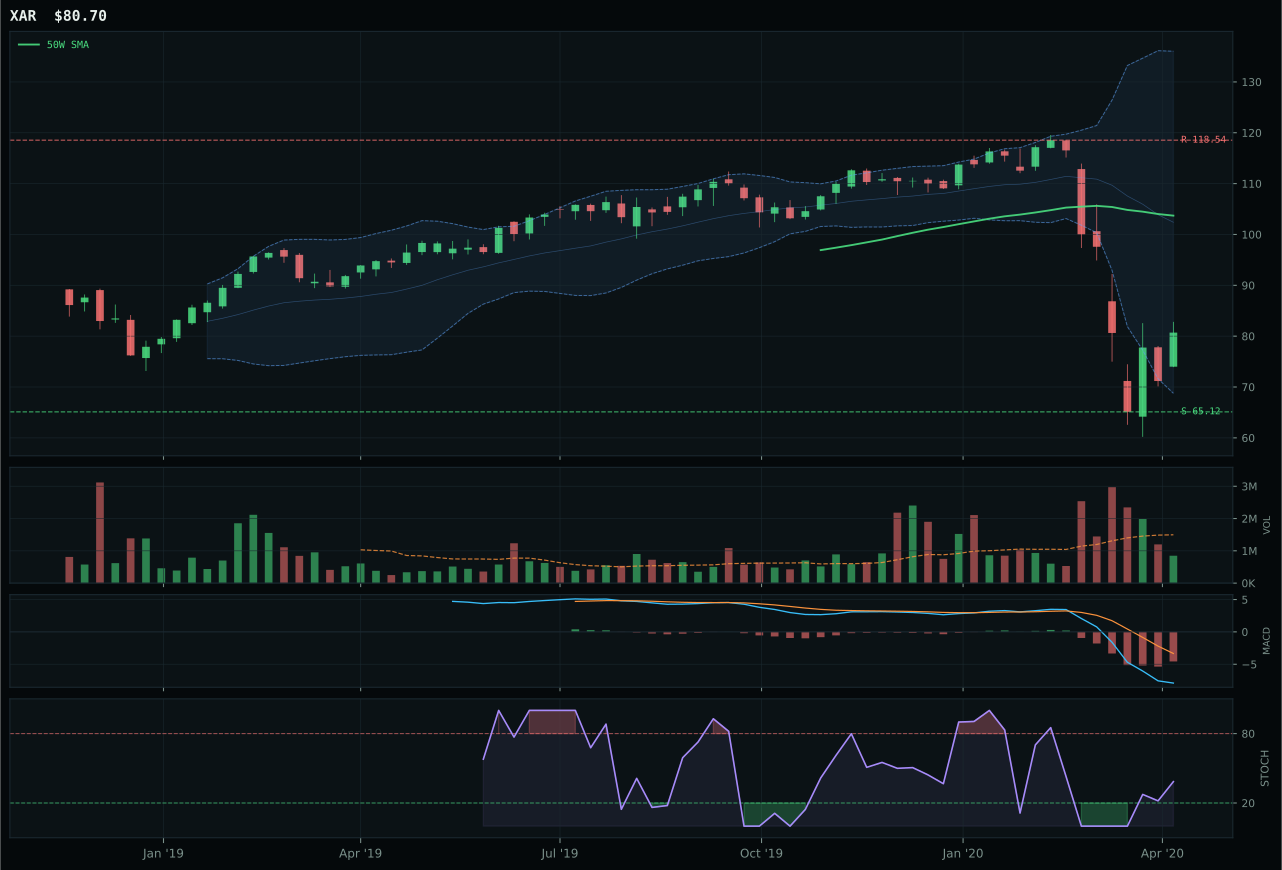
XAR has a neutral structure profile with -14.5% 13-week relative strength versus SPY.
A failed hold above support would weaken the setup.
Actionable but governed by invalidation levels.
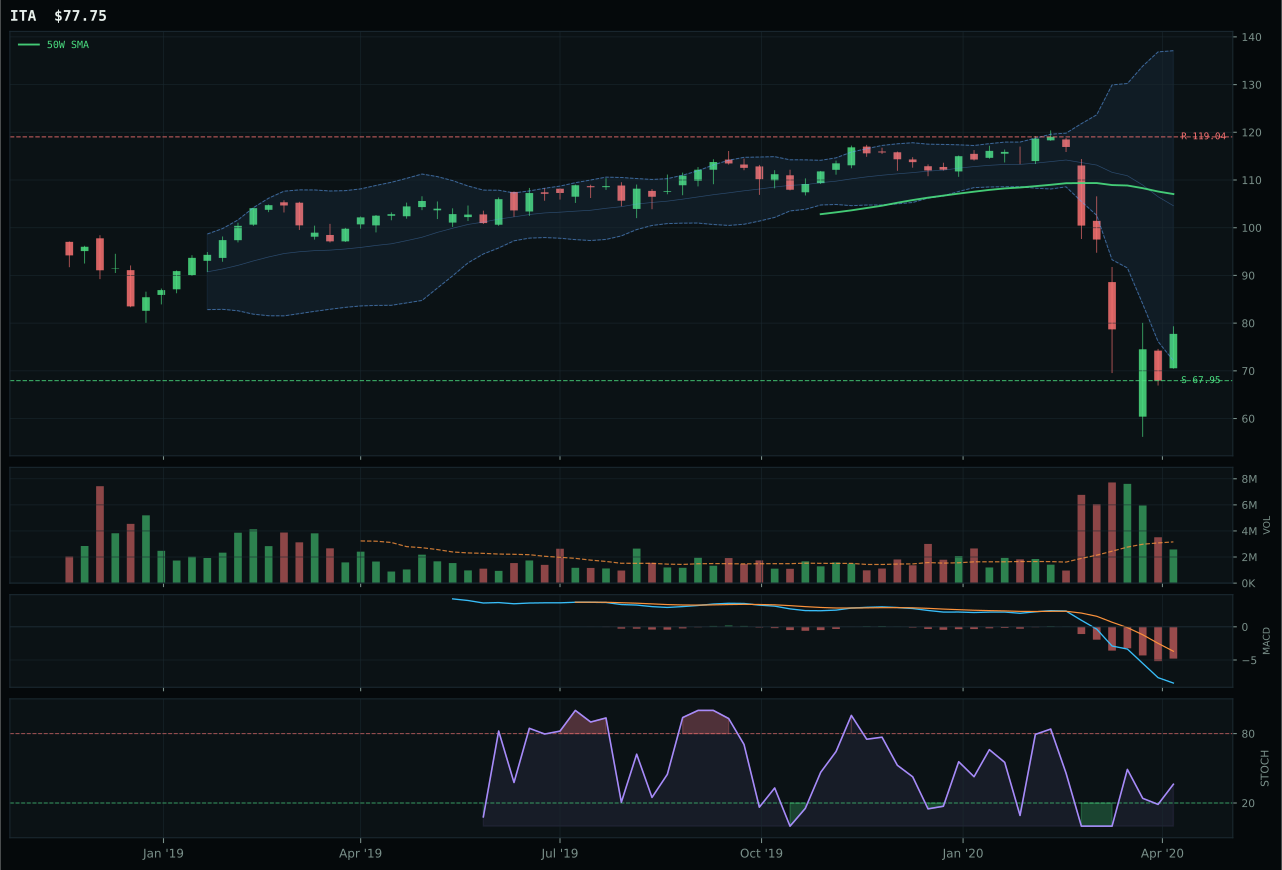
ITA has a neutral structure profile with -17.4% 13-week relative strength versus SPY.
A failed hold above support would weaken the setup.
Actionable but governed by invalidation levels.
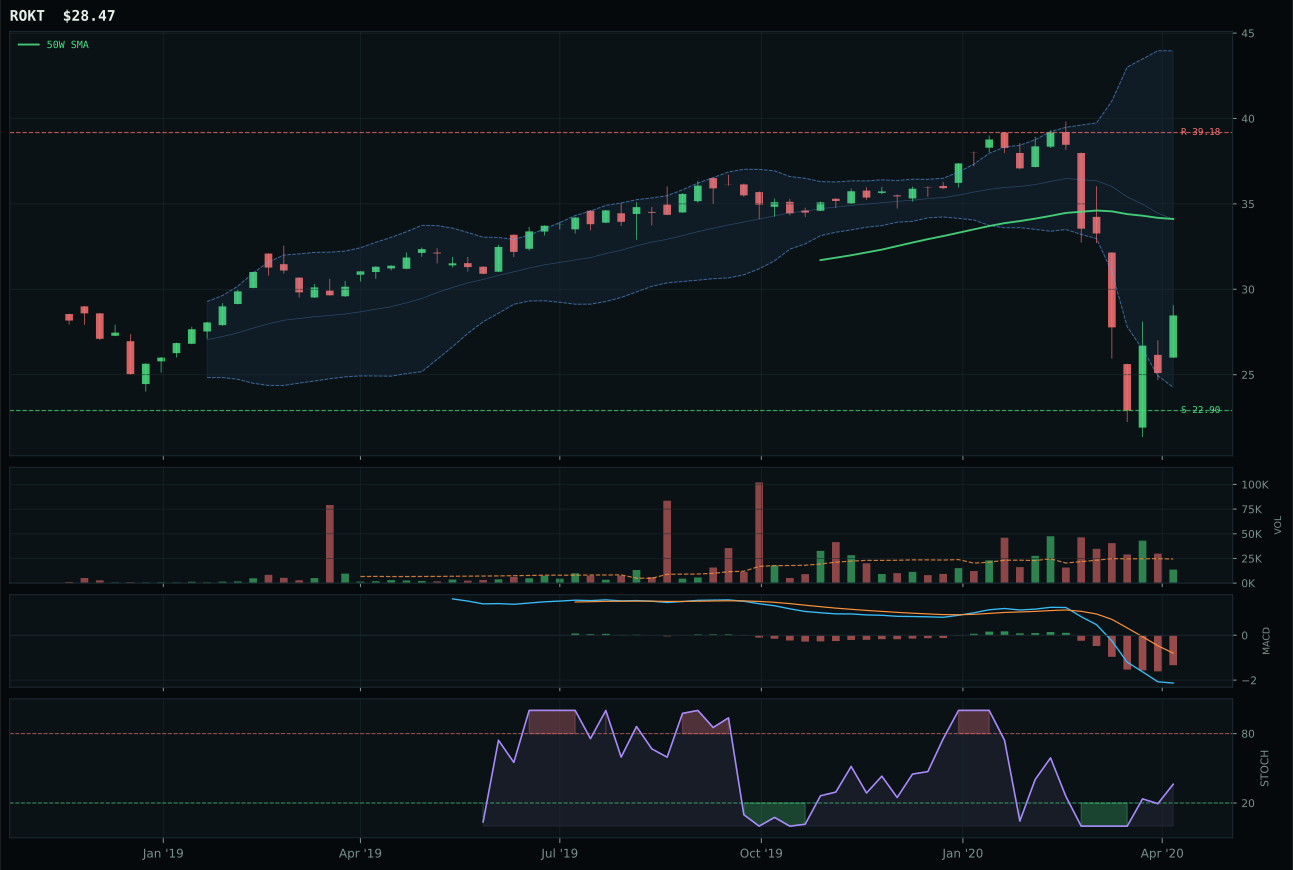
ROKT has a neutral structure profile with -10.5% 13-week relative strength versus SPY.
A failed hold above support would weaken the setup.
Tracked, but not top-2 eligible because: .
XAR wins Defense & Aerospace despite deeply challenged technicals because it edges ITA on risk/reward (62.0 versus 51.7) and category-relative strength (0.0% versus -2.9%). The setup is weak: price is 22.2% below the 50W, 200W is negative, MACD is bearish/weakening, and momentum confirmation is zero—XAR's 13W return of -29.1% tells the full story of a sector in free-fall. The difference between winner and runner-up is marginal: both sit in deep retracement/value zones (Fib 0.618 and deeper), both have neutral structure, both depend on support holding rather than momentum. XAR's value-zone positioning (upside 31.9% to resistance, downside only 23.9% to support) is technically superior to ITA's, and thin participation at 0.57x suggests whatever volume is here is neutral rather than panicked liquidation. Volume-price confirmation is weak (15.3), but that's true across the category—this is a choice between damaged goods, and XAR is slightly less damaged.
Defense & Aerospace holds a tier-2 allocation of 5% despite significant technical weakness because category-level macro fit of 68.0 is strong: defensive rotation is active (+8), broad market bear supports defensive positioning (+6), and dollar pressure adds a small benefit (+3). The final category score of 20.9 ranks outside top-2 because technical evidence of 11.3/100 for the representative is very poor—this is purely a macro-driven allocation, not a setup conviction. XAR's ineligibility for higher allocation (marked False) reflects that structural filters detected deterioration below key support levels and weak volume sponsorship. The 5% position represents a defensive rotation trade, not a technical opportunity; risk appetite breaking further could increase the macro case, but the category would need to rebuild support structure to earn higher allocation. This is defensive beta for a bear-market hedge, not a reversal candidate.
Emerging Markets — INDA
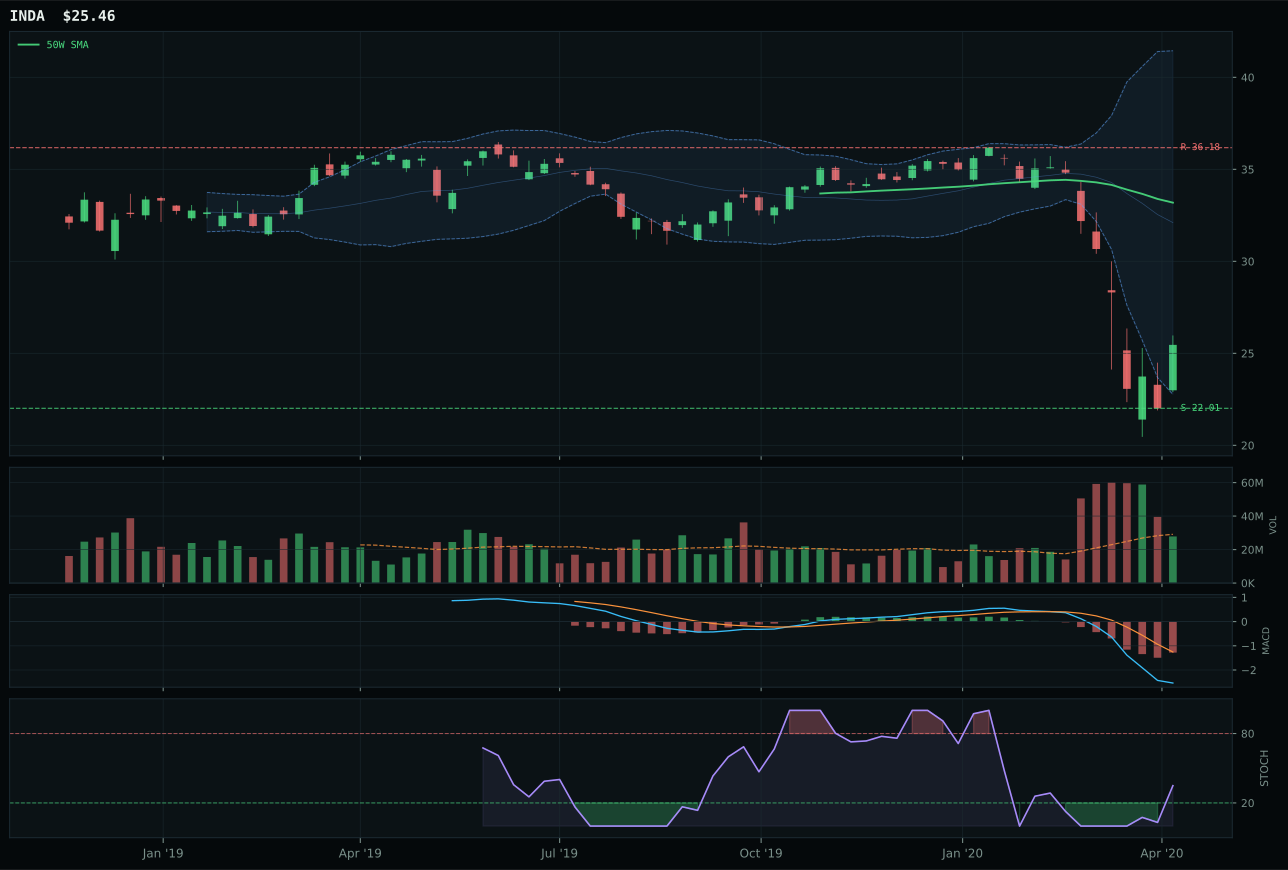
INDA has a neutral structure profile with -13.9% 13-week relative strength versus SPY.
A failed hold above support would weaken the setup.
Actionable but governed by invalidation levels.
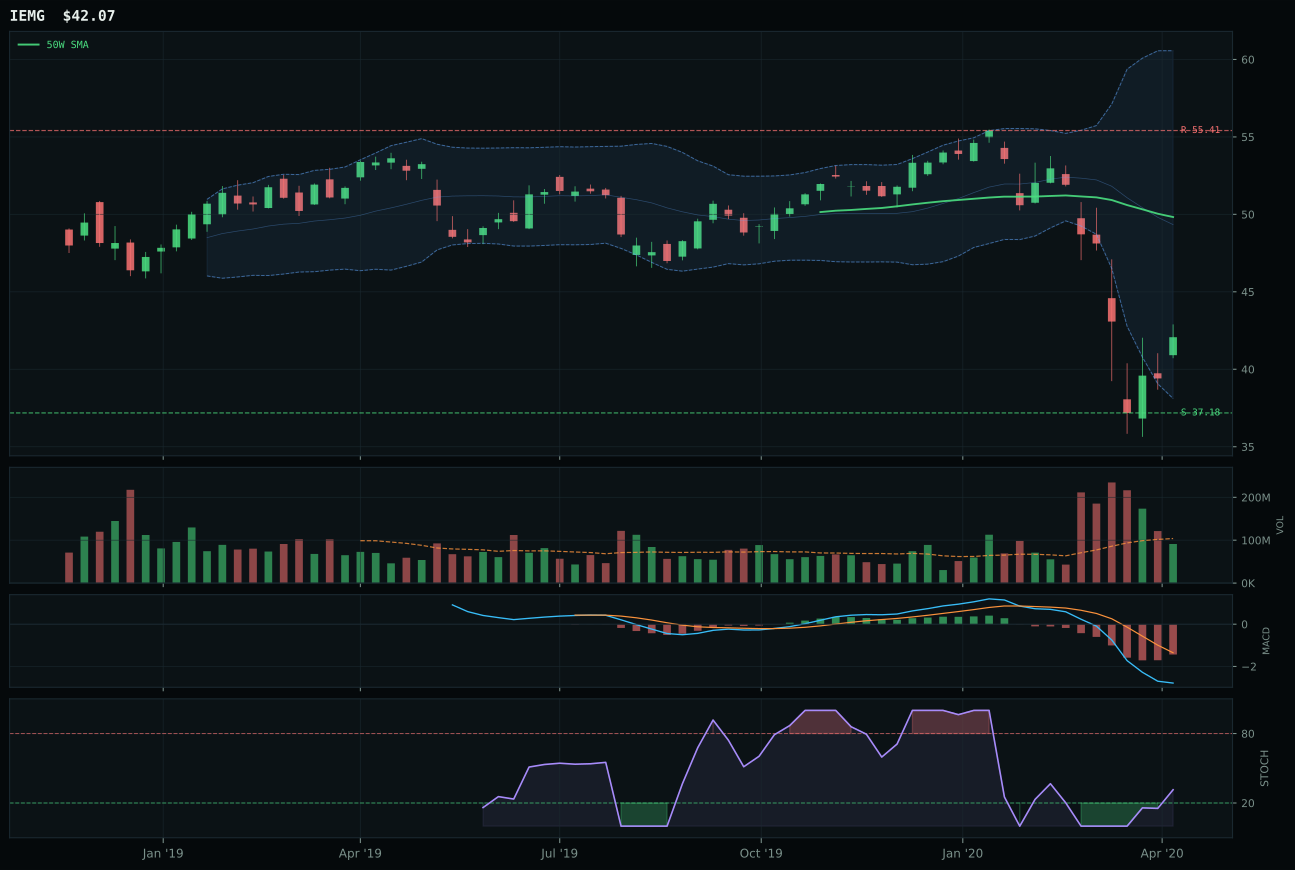
IEMG has a neutral structure profile with -8.4% 13-week relative strength versus SPY.
Extension and support failure are the main tactical risks.
Tracked, but not top-2 eligible because: structurally broken.
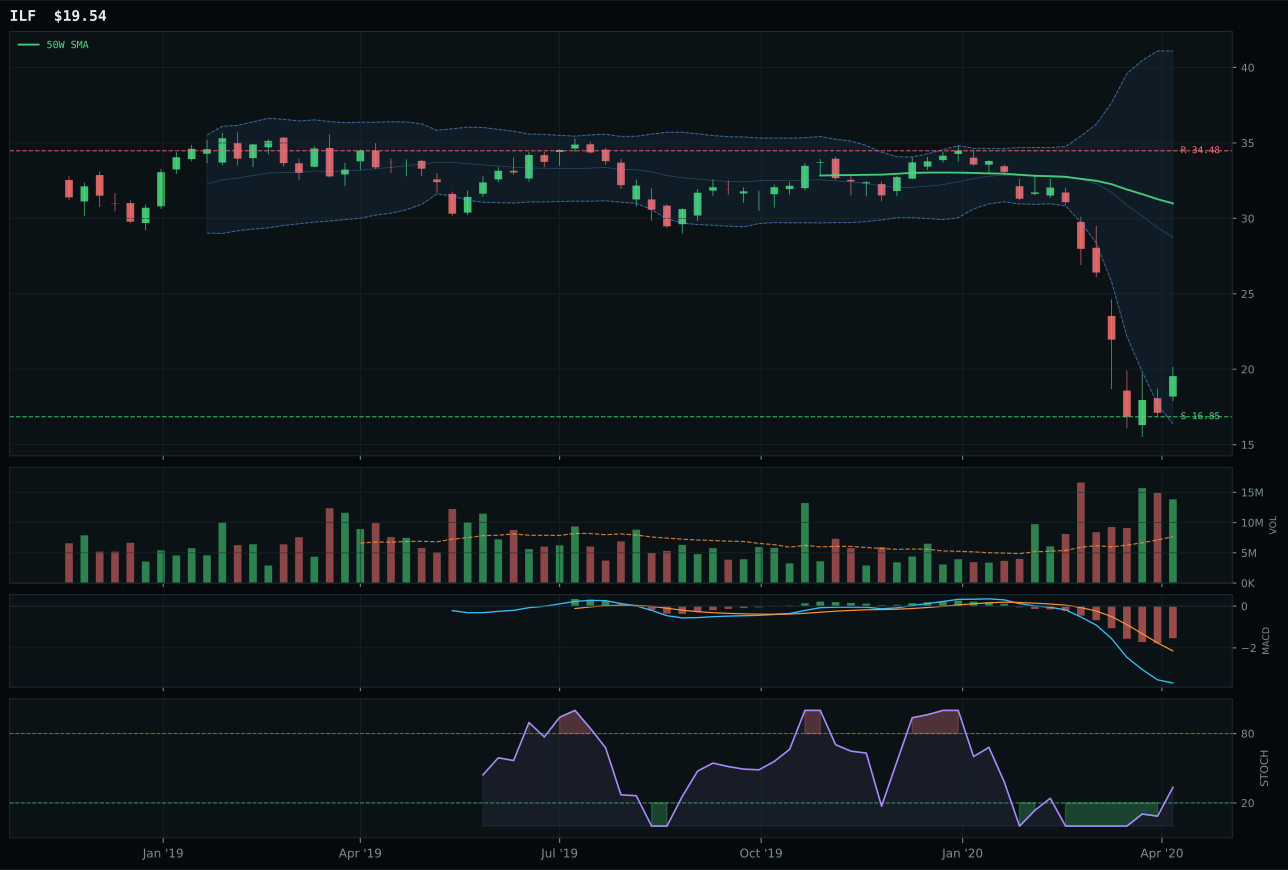
ILF has a neutral structure profile with -27.2% 13-week relative strength versus SPY.
Extension and support failure are the main tactical risks.
Tracked, but not top-2 eligible because: structurally broken.
INDA wins Emerging Markets as the representative despite abysmal technical evidence (9.4/100, only 12.0 on trend) because IEMG failed hard structural filters that disqualified it from higher ranking. INDA is 23.3% below the 50W in the deep retracement/value zone, with 13W return of -28.5% and momentum confirmation of zero—this is a capitulation entry, not a recovery setup. The only advantage versus IEMG (30.7 technical proof score) is structure: INDA's structure scores 59.8 versus IEMG's 31.8, giving it a cleaner technical foundation even though both are deeply damaged. Category-relative strength is 0.0% for INDA versus +5.5% for IEMG, which should favor IEMG, but hard filters flagged IEMG as structurally broken despite better trend metrics. Risk/reward of 64.0 is the only respectable INDA metric—22.5% downside support versus 29.6% upside resistance—creating an honest value-zone entry point.
Emerging Markets holds a tier-2 allocation of 5% with eligible: True status, indicating it qualified for the tier-2 sleeve without hard filter failures but ranked outside top-2. The category's final score of 9.1 reflects macro conditions that actively work against emerging-market beta: dollar pressure is a significant -14 headwind, broad market bear subtracts 9 points, while Goldilocks and liquidity expansion provide only +8 each, for a net macro fit of 43.0. INDA's technical evidence of 9.4/100 is extremely weak; the allocation is entirely macro-driven and contingent on the dollar pressure descriptor reversing. The 5% position represents a defensive carry trade into value—not a growth or momentum conviction. Emerging Markets would require either a decisive dollar weakness reversal or a technical support establishment with accumulation volume to justify higher allocation. Current positioning reflects minimal conviction and is best viewed as a diversification placeholder.
Traditional Energy — FCG
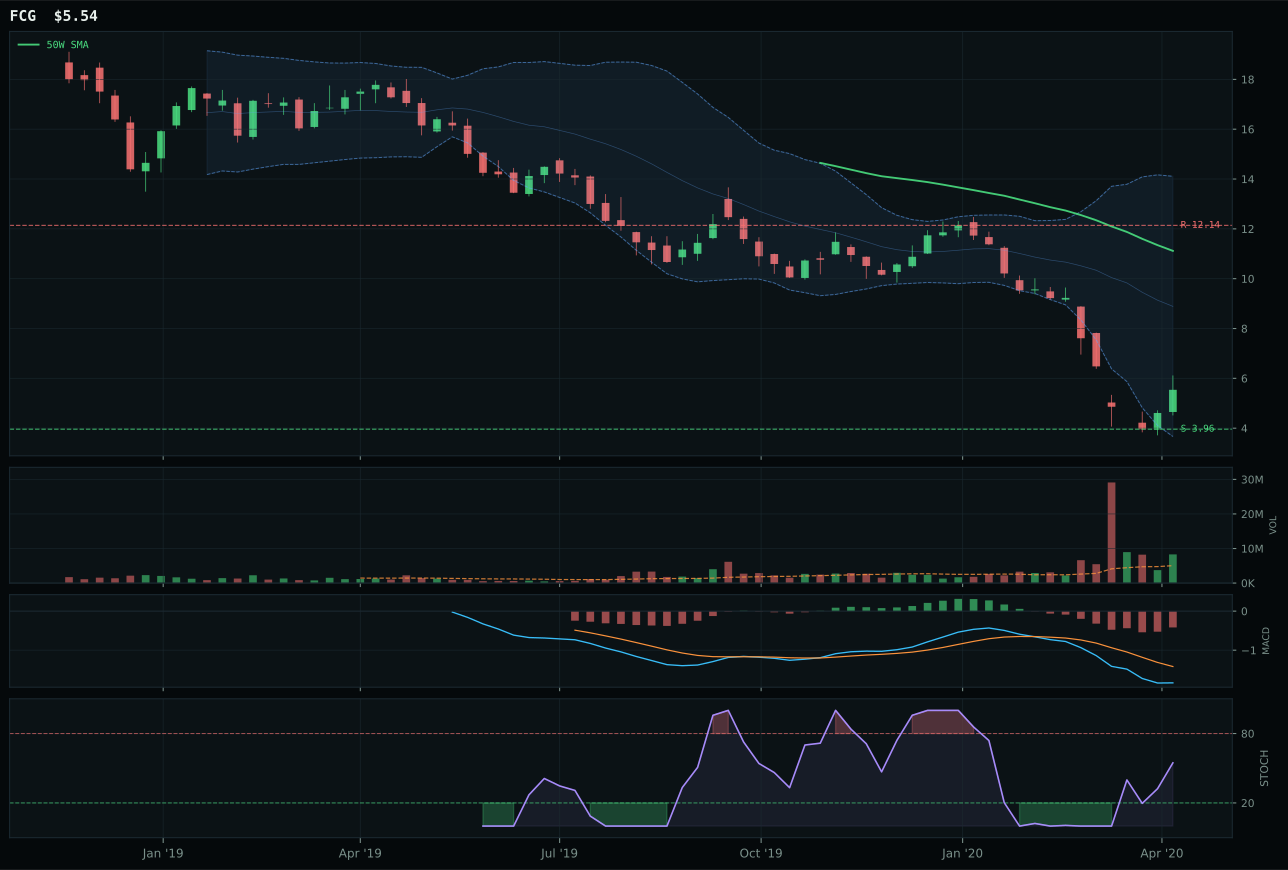
FCG has a neutral structure profile with -38.2% 13-week relative strength versus SPY.
Extension and support failure are the main tactical risks.
Tracked, but not top-2 eligible because: structurally broken.
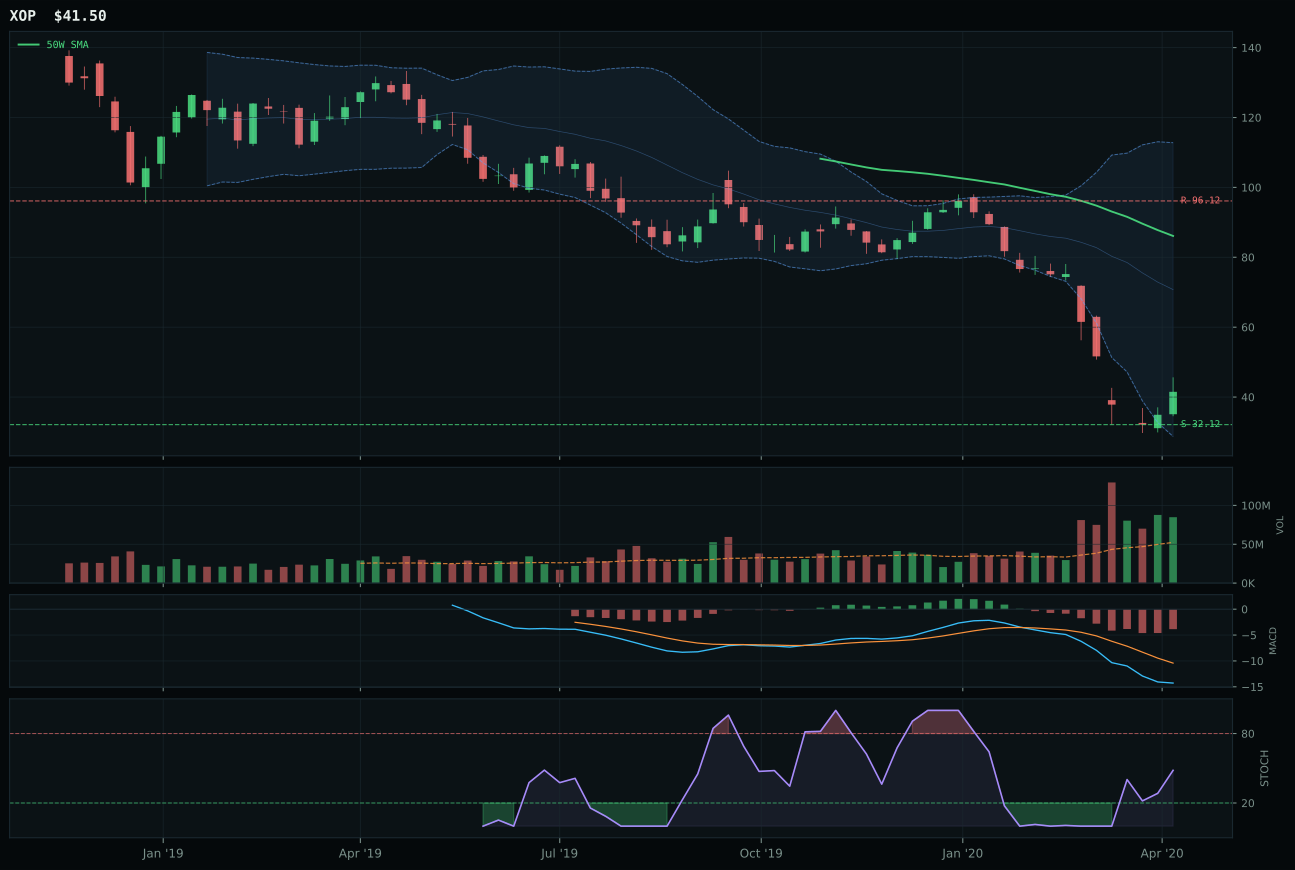
XOP has a neutral structure profile with -40.7% 13-week relative strength versus SPY.
Extension and support failure are the main tactical risks.
Tracked, but not top-2 eligible because: structurally broken.
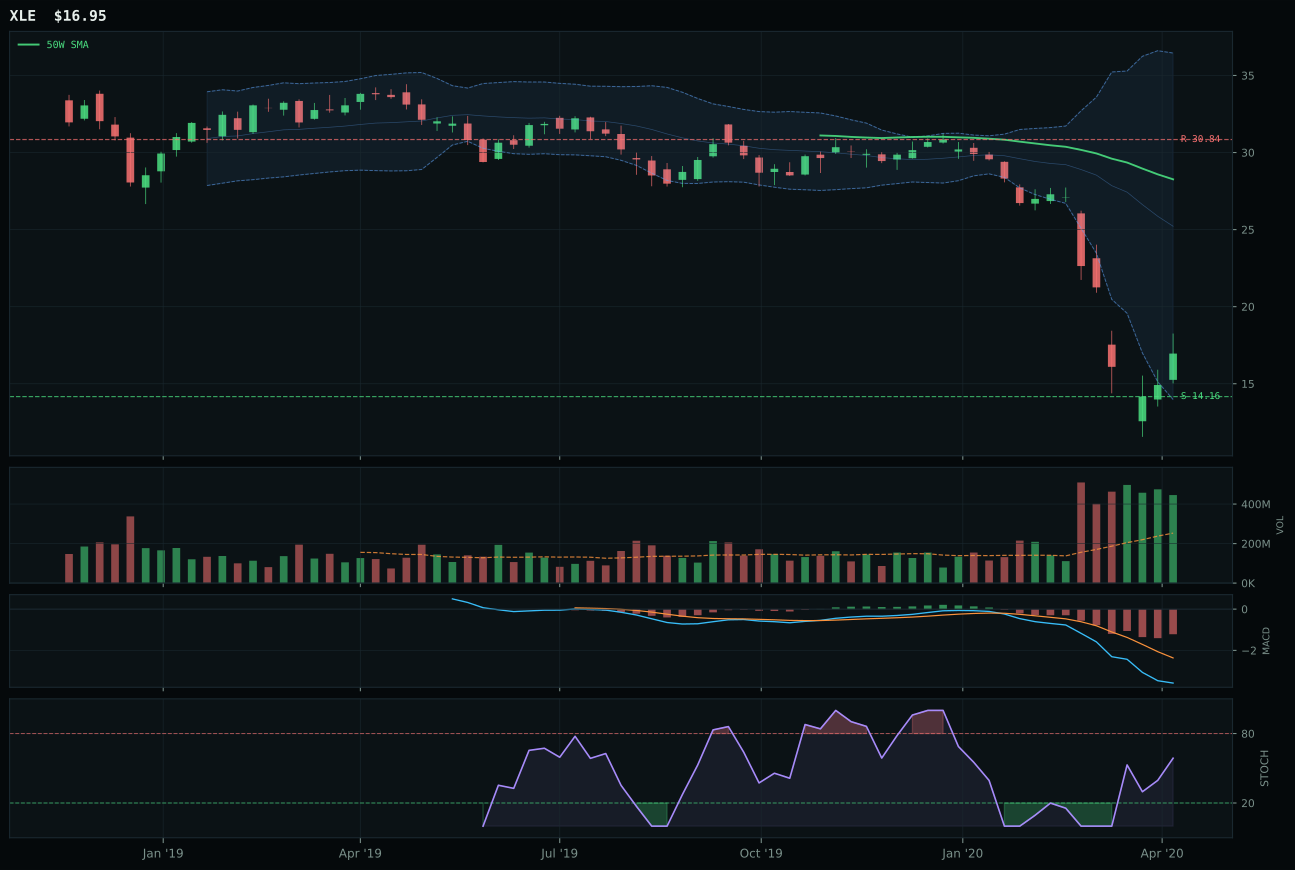
XLE has a neutral structure profile with -28.7% 13-week relative strength versus SPY.
Extension and support failure are the main tactical risks.
Tracked, but not top-2 eligible because: structurally broken.
FCG wins Traditional Energy by default, not by strength: it scores 21.5 on technical evidence while XOP scores 0.4, and its timing of 63.0 matches the category. FCG is 50% below the 50W in the near-52W-low/repair zone, with MACD bearish but improving and volume at 1.64x showing accumulation confirmation—this is the most honest entry point in a destroyed sector. The momentum confirmation score is zero (13W return -52.8%, 4W return 14.0% showing only a dead-cat bounce), and category-relative strength is neutral at 0.0%, meaning no peer leadership. Risk/reward at 59.5 is the best in the category because FCG offers 39.9% downside support, but that's cold comfort when upside to resistance is only 54.4%. This is not a winner in any traditional sense; FCG simply avoids XOP's harder structural filters (category-relative strength -2.5%) by staying neutral. The category itself is in survival mode, not recovery mode.
Traditional Energy holds a tier-2 allocation of 5% despite a final category score of 0.0 because allocation rules specify that tier-2 slots (ranks 3-8) receive 5% each, even when a category representative scores zero. The allocation is a dead-weight holding: FCG's technical evidence of 21.5/100 is poor, macro fit of 50.0 is neutral, and eligibility filtered to False due to structural breakage. The category-level macro fit of 40.0 reflects that disinflation pressure is the only descriptor active, and it works against energy (-10). This is allocation based on category-ranking mechanics, not conviction: Energy ranked 8th or lower among the 10 categories, making it tier-2 by default. The 5% position should be viewed as a placeholder and near-term hedge, not a conviction bet. To earn higher allocation, Traditional Energy would need a stabilization setup with volume confirmation, and the macro environment would need to reverse its disinflation bias toward inflation concerns or dollar weakness.
Industrial Metals — PICK
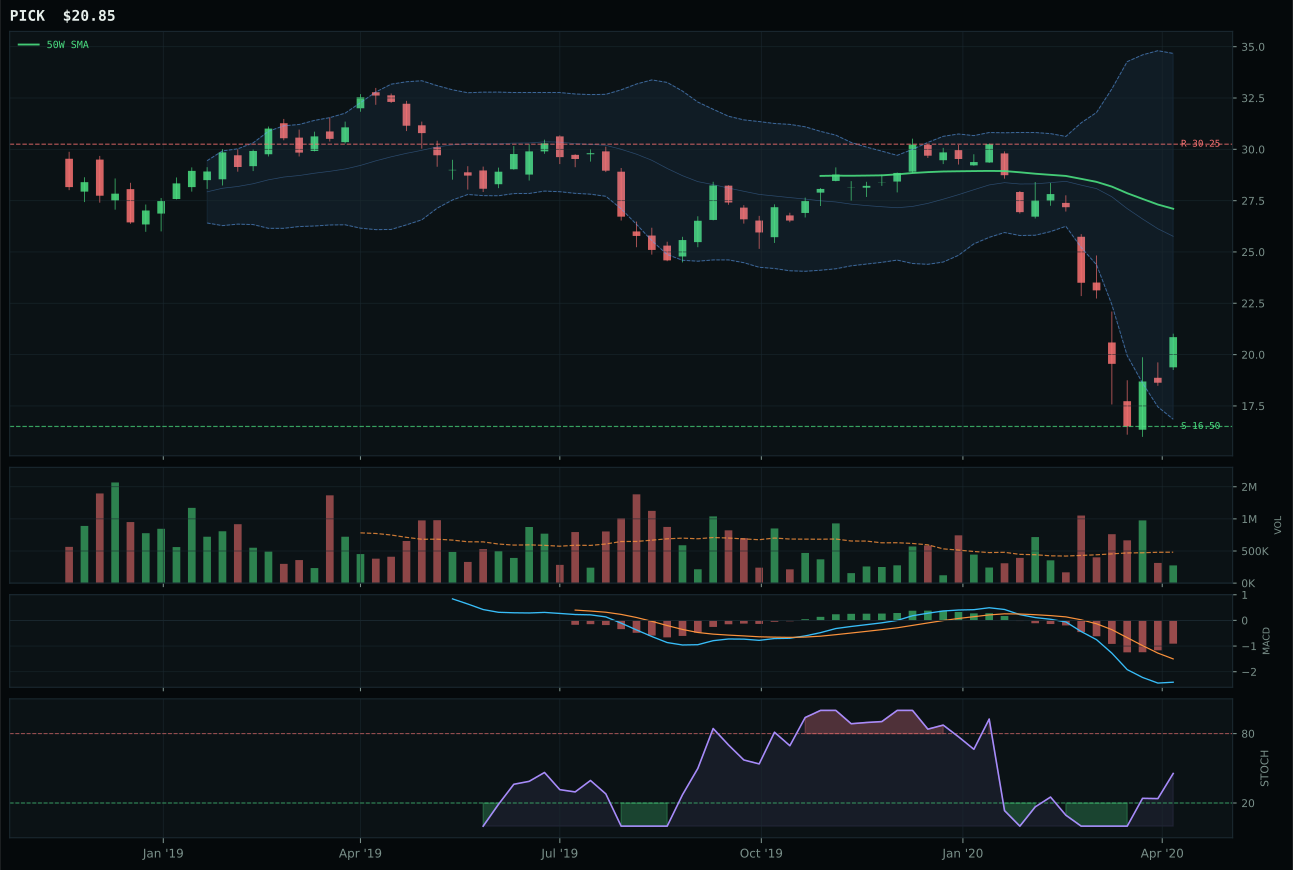
PICK has a neutral structure profile with -14.4% 13-week relative strength versus SPY.
Extension and support failure are the main tactical risks.
Tracked, but not top-2 eligible because: structurally broken.
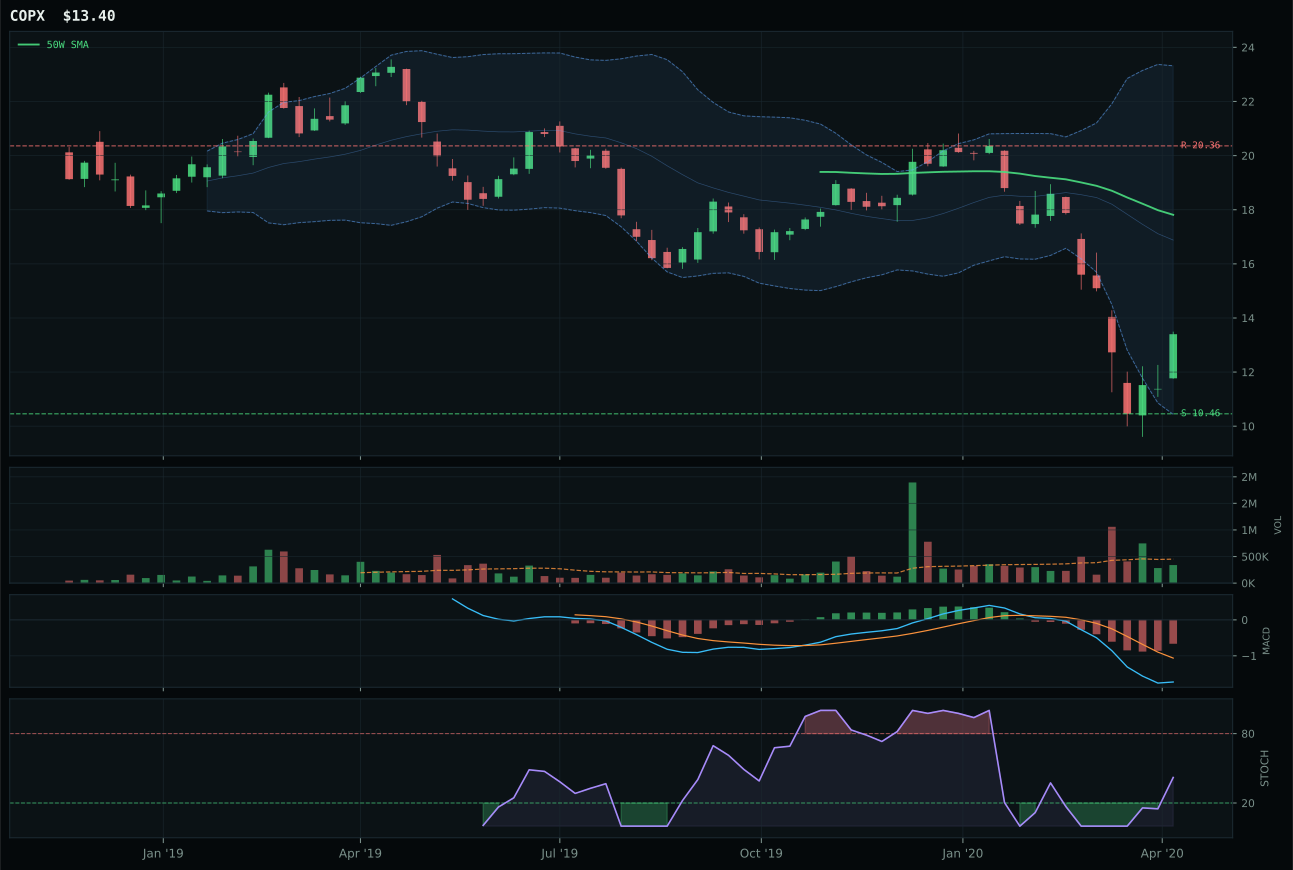
COPX has a neutral structure profile with -18.6% 13-week relative strength versus SPY.
Extension and support failure are the main tactical risks.
Tracked, but not top-2 eligible because: structurally broken.
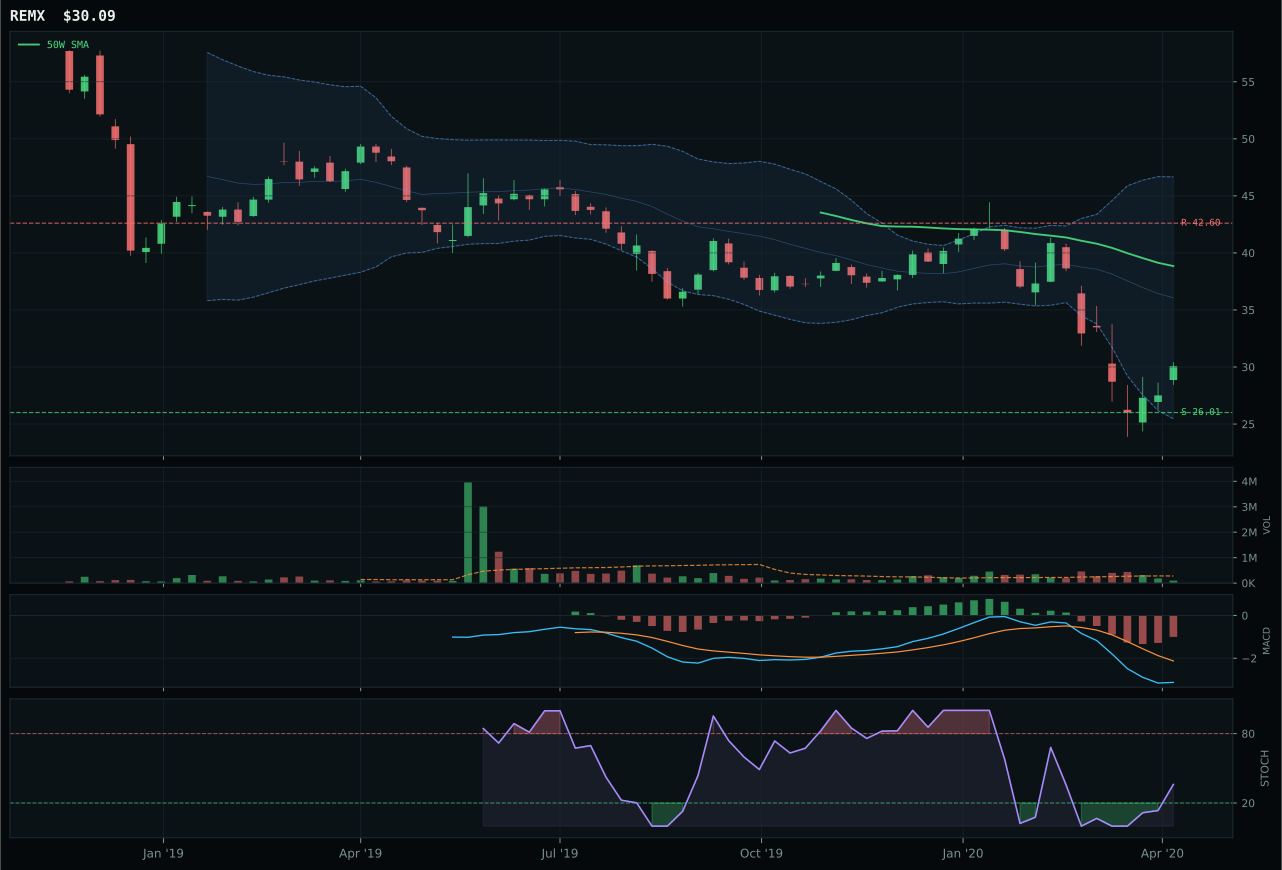
REMX has a neutral structure profile with -13.9% 13-week relative strength versus SPY.
Extension and support failure are the main tactical risks.
Tracked, but not top-2 eligible because: structurally broken.
PICK wins Industrial Metals by the narrowest technical margin but only because COPX and REMX are worse: timing of 63.0 versus COPX's 58.0 and REMX's 58.0, and structure cleanness of 33.3 that matches the category median. PICK is 23.1% below the 50W, well below the 200W, with MACD bearish but improving and stochastic RSI rising mid-zone—the setup is in the deep retracement/value zone (Fib 0.786), which scores well on risk/reward (51.2) but poorly on momentum confirmation (8.3). The critical truth is that all three ETFs in this category are structurally broken: PICK's 13W return is -29.0% with zero momentum confirmation, COPX's -33.2%, and REMX's -28.5%. PICK wins by default because it avoids COPX's harder filtering failures and REMX's identical weakness. The margin between them is so small (PICK 27.1, REMX 14.3, COPX 14.0 in proof order) that the category decision is one of least-bad choices, not conviction.
Industrial Metals earned 0% allocation this week because the category failed eligibility filters with a final score of 5.8 and eligible: False status. The category's macro fit of 49.0 is neutral; Goldilocks is a small help (+6), but dollar pressure is a significant headwind (-7), leaving no macro advantage. PICK's technical evidence of 18.6/100 is poor, and more critically, hard filters detected structural damage—the 3/2/1 basket score of 20.7 compresses to just 5.8 after the category reasoner tests for leadership, volume-price sponsorship, persistence, and setup quality. This is a category where neither the technical foundation nor the macro backdrop supports allocation. Copper and mining breadth would need to establish support with fresh accumulation volume, and disinflation pressure would need to reverse its -7 macro penalty. Until both conditions occur, Industrial Metals remains entirely outside the portfolio.
Agriculture & Livestock — MOO
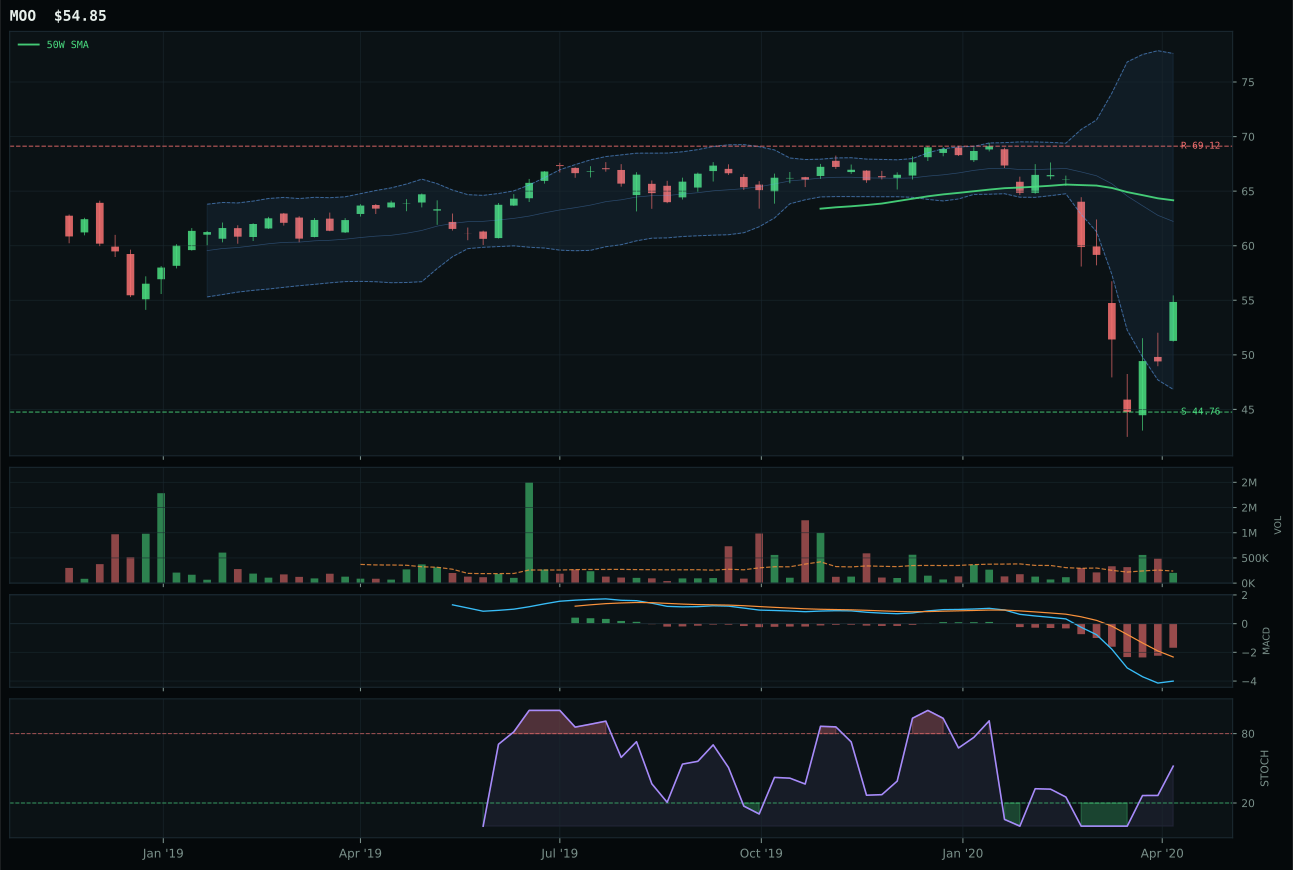
MOO has a neutral structure profile with -5.6% 13-week relative strength versus SPY.
A failed hold above support would weaken the setup.
Actionable but governed by invalidation levels.
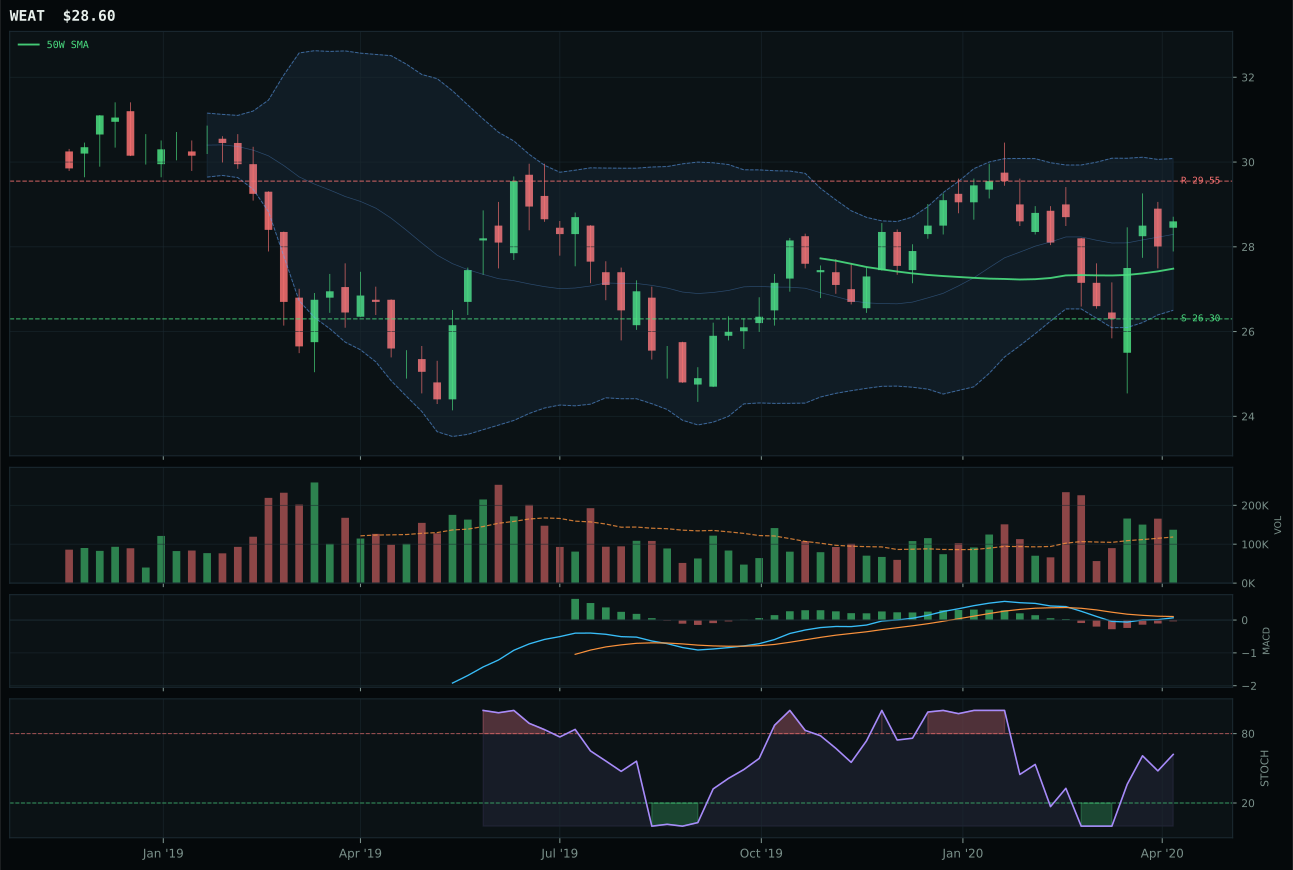
WEAT has a neutral structure profile with 11.7% 13-week relative strength versus SPY.
A failed hold above support would weaken the setup.
Tracked, but not top-2 eligible because: .
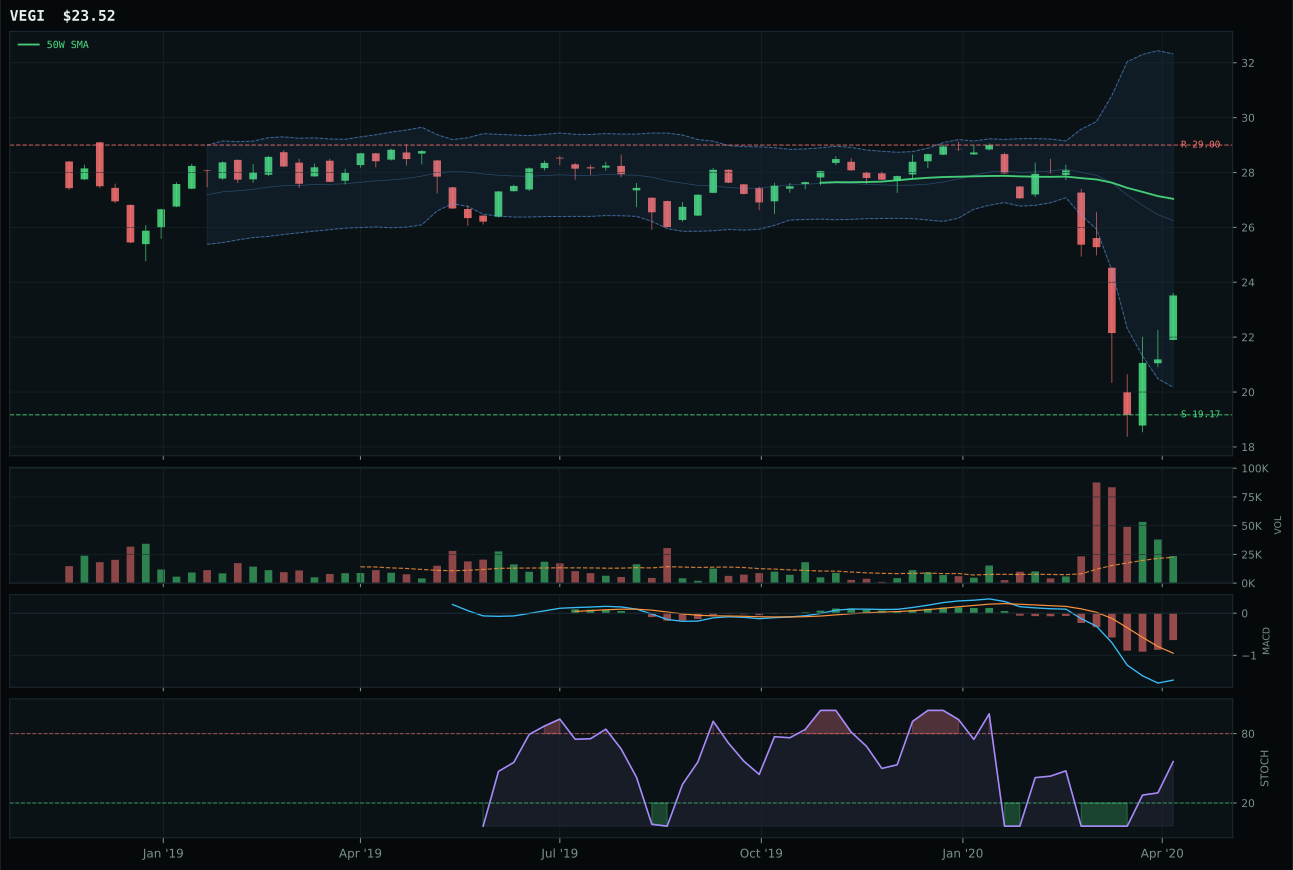
VEGI has a neutral structure profile with -3.5% 13-week relative strength versus SPY.
Extension and support failure are the main tactical risks.
Tracked, but not top-2 eligible because: structurally broken.
MOO wins Agriculture & Livestock by virtue of superior risk/reward (69.5 versus WEAT's 51.6) despite having dramatically weaker momentum and trend. MOO is 14.5% below the 50W in the middle retracement zone, while WEAT is above the 50W and up 11.7% RS versus SPY—WEAT looks technically superior in nearly every measure. The critical difference is that WEAT is overextended: it sits in the upper retracement/momentum Fib zone at +4.1% from the 50W, making it a stretched short-term performer with limited upside cushion (only 20.6% to resistance) and heavy downside risk (22.5%). MOO, conversely, offers 22.5% downside support protection and still retains 20.6% upside to resistance, creating a far better risk/reward profile for capital-preservation mode. WEAT's 13W performance of -2.9% and strong 4W return of 6.7% mark it as a momentum play that has run its course; MOO's -20.1% 13W drawdown is real damage, but the value-zone entry point is more honest about entry timing.
Agriculture & Livestock earned 0% allocation this week because the final category score of 1.3 ranked 9th or 10th and failed eligibility filters. The category's macro fit of 42.0 is weak—disinflation pressure is the only active descriptor, and it hurts commodities by 8 points—leaving no macro tailwind to support a technical setup that is already damaged. MOO's 13W return of -20.1% and negative RS of 5.6% versus SPY reflect a sector with no sponsorship in the current regime. The reasoned ETF proof order (WEAT 45.0, VEGI 31.6, MOO 15.4) shows that WEAT carries the category's best case, but even WEAT's 45.0 technical score fails to lift the category above the eligibility threshold. To earn allocation, Agriculture would need either disinflation pressure to reverse (currently a headwind), or a decisive test of support with volume confirmation that would rebuild the technical foundation. No position here; this category is outside the portfolio entirely.