
2020-04-03
Informational purposes only. The content in this report, including allocations, analysis, and commentary, is provided solely for informational and educational purposes. It does not constitute financial advice, investment advice, trading advice, or any other type of advice. Past performance does not guarantee future results. Always conduct your own research and consult a qualified financial professional before making investment decisions.
Some tracked tickers were excluded due to missing live weekly price data: SGOV: Historical cache SGOV has only 0 usable weekly bars; URNM: Historical cache URNM has only 18 usable weekly bars
XLE defensive overlay excluded: price is below its 8W SMA. Cause selector will use GLD or cash alternative.
Fast-crash circuit breaker triggered: SPY dropped more than 8% from its 4-week high this week. Defensive overlay activated immediately.
Macro risk engine requires the 50% Defensive overlay for this run; payload selected by cause: Monetary Defense.
Weekly Allocation
| Ticker | Category | Weight | Role |
|---|---|---|---|
| GLD | Precious Metals | 60% | Overlay |
| CIBR | Technology | 10% | Top-2 (10%) |
| SMH | AI | 5% | Tier-2 (5%) |
| XLU | Utilities & Infrastructure | 5% | Tier-2 (5%) |
| XAR | Defense & Aerospace | 5% | Tier-2 (5%) |
| URA | Nuclear Energy | 5% | Tier-2 (5%) |
| XLE | Traditional Energy | 5% | Tier-2 (5%) |
| INDA | Emerging Markets | 5% | Tier-2 (5%) |
Trade Instructions — Monday Open
Sell the tranche from 2020-03-06 (completing its 4-week hold). Buy the new tranche. Instructions show net portfolio changes — same-asset positions cancel, weight changes show the delta.
| Action | Ticker | Instruction |
|---|---|---|
| SELL | FBTC | Sell entire FBTC position (12.50% of portfolio) |
| SELL | XLK | Sell 50% of XLK position (reduce 5.00% → 2.50%) |
| SELL | IEMG | Sell 50% of IEMG position (reduce 2.50% → 1.25%) |
| SELL | MOO | Sell 33% of MOO position (reduce 3.75% → 2.50%) |
| SELL | NLR | Sell 50% of NLR position (reduce 2.50% → 1.25%) |
| BUY | GLD | Buy GLD — 66.67% of freed cash (adds 12.50% to portfolio) |
| BUY | INDA | Buy INDA — 6.67% of freed cash (adds 1.25% to portfolio) |
| BUY | URA | Buy URA — 6.67% of freed cash (adds 1.25% to portfolio) |
| BUY | CIBR | Buy CIBR — 13.33% of freed cash (adds 2.50% to portfolio) |
| BUY | XLE | Buy XLE — 6.67% of freed cash (adds 1.25% to portfolio) |
Current Portfolio After Trade
Combined holdings across all 4 active tranches. Each tranche is 25% of the portfolio.
| Ticker | % of Portfolio | Weight Bar |
|---|---|---|
| GLD | 40.00% | |
| XLU | 12.50% | |
| SGOV | 10.00% | |
| SMH | 6.25% | |
| XAR | 5.00% | |
| INDA | 5.00% | |
| CIBR | 5.00% | |
| URA | 3.75% | |
| MOO | 2.50% | |
| XLK | 2.50% | |
| IGV | 2.50% | |
| XLE | 2.50% | |
| IEMG | 1.25% | |
| NLR | 1.25% |
Macro Regime — Goldilocks
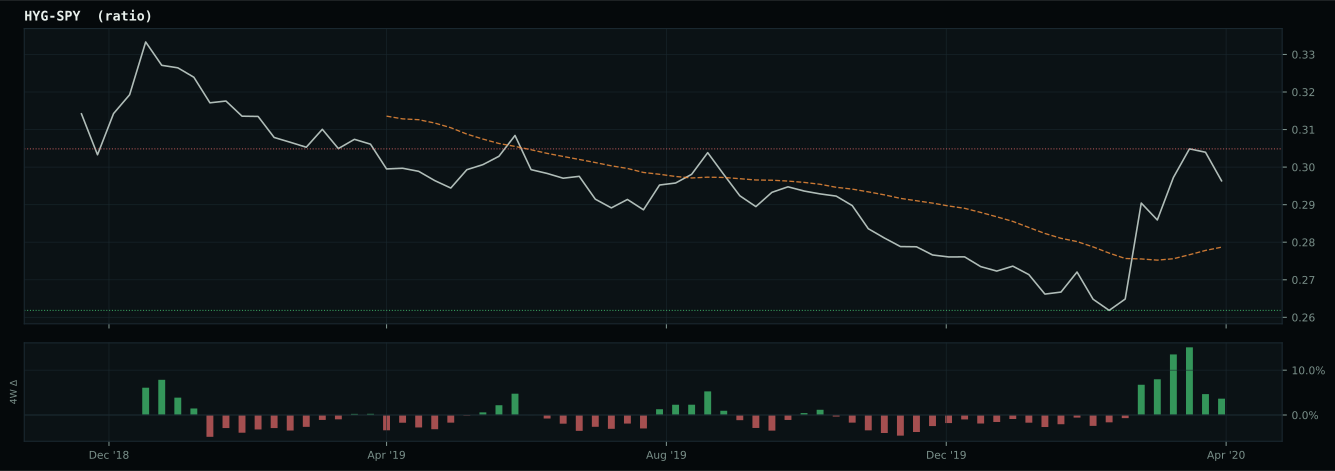
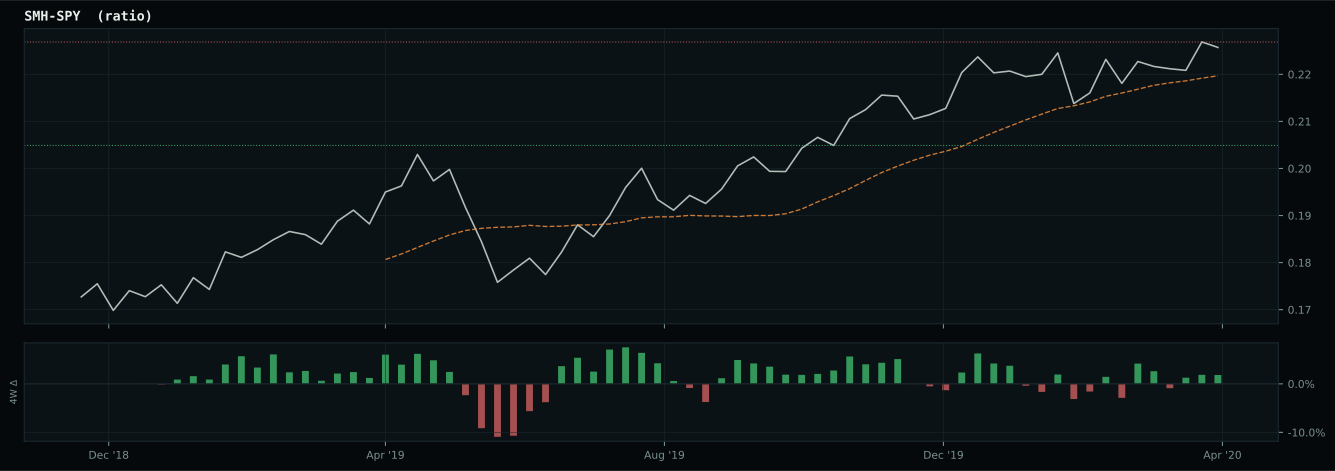
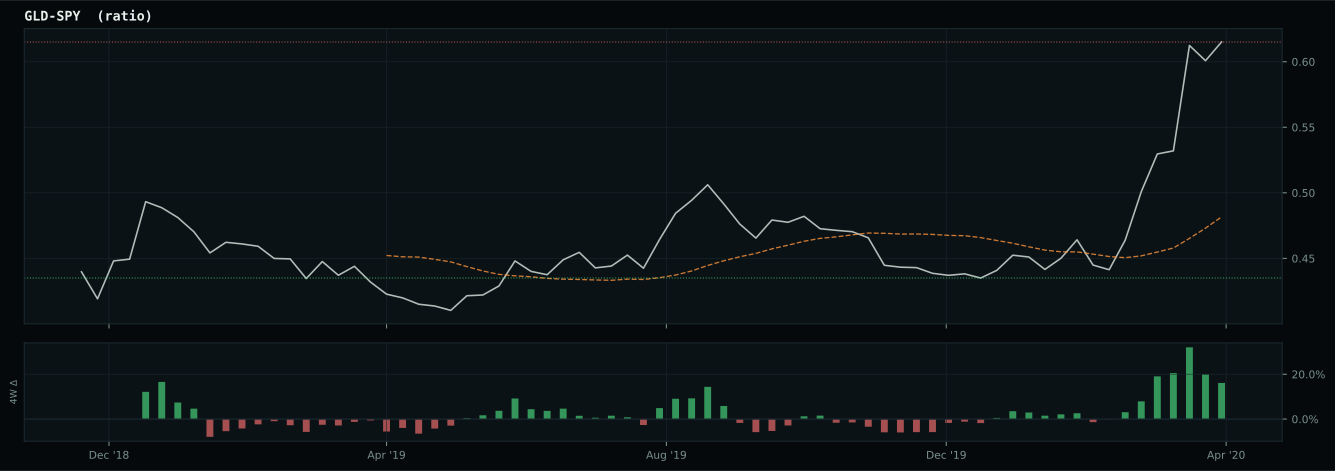
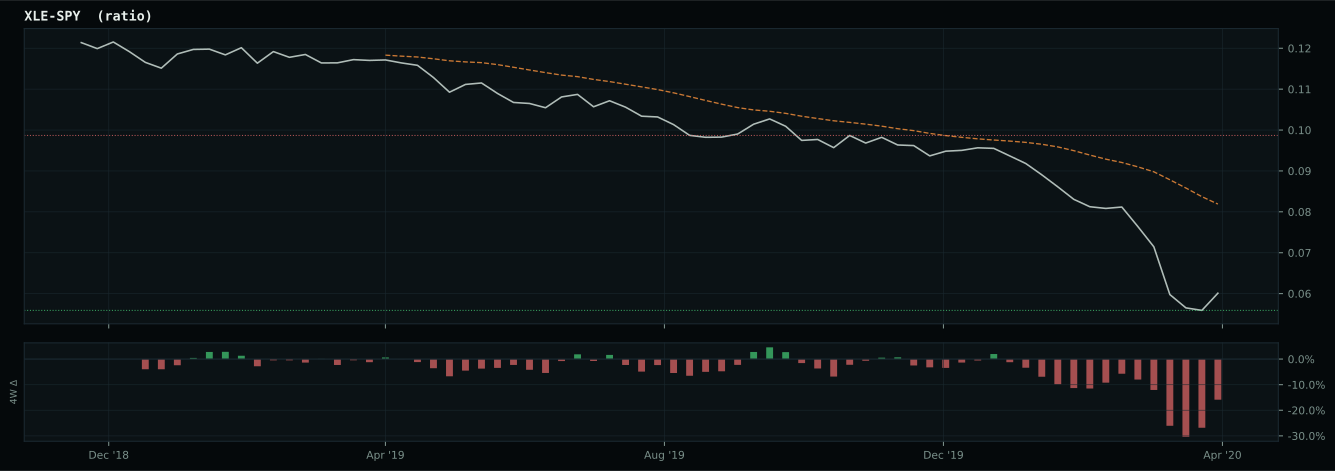
Defensive overlay cause is falling-growth or disinflation stress: gold is favored because falling real-yield pressure and monetary hedging are more relevant than cyclical commodity demand. GLD has been confirmed above its 8W SMA and is eligible.
Macro Evidence Charts
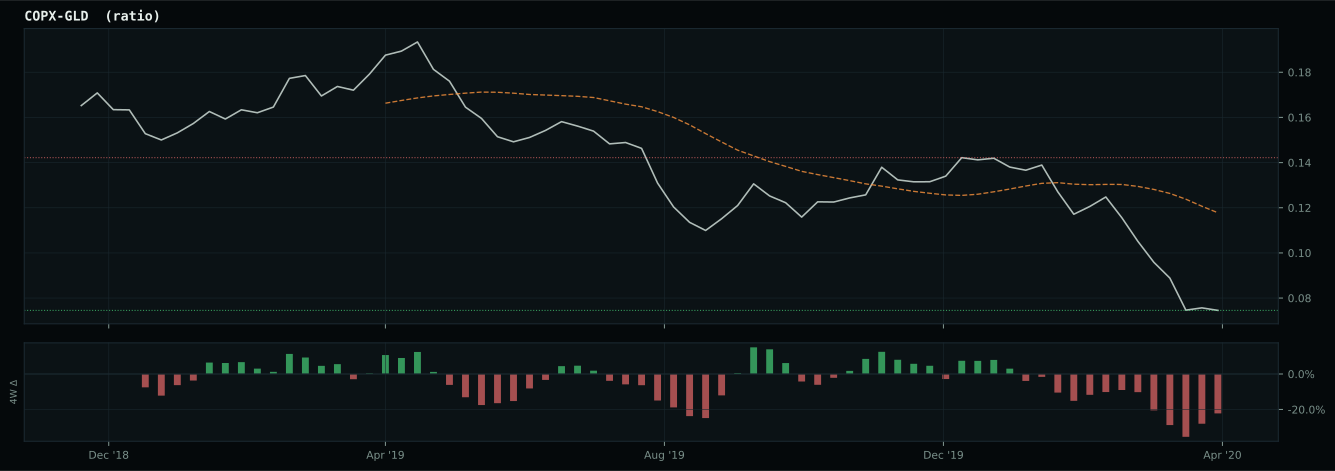
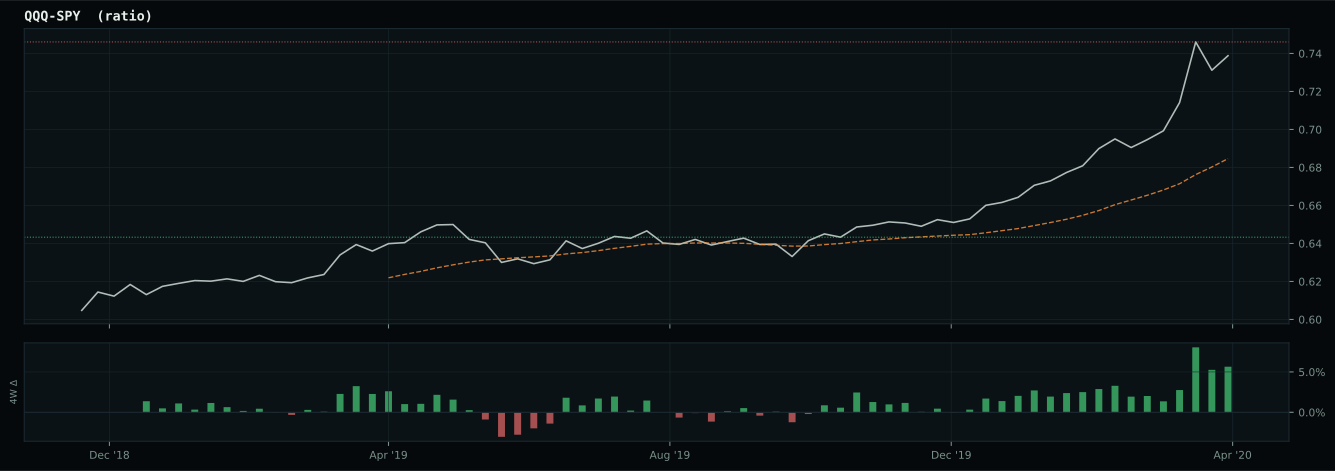
Market-implied signals behind the macro regime scores. Each ratio compares two assets; the direction and slope of the ratio is what the macro engine reads.
Crypto Regime — NoCrypto
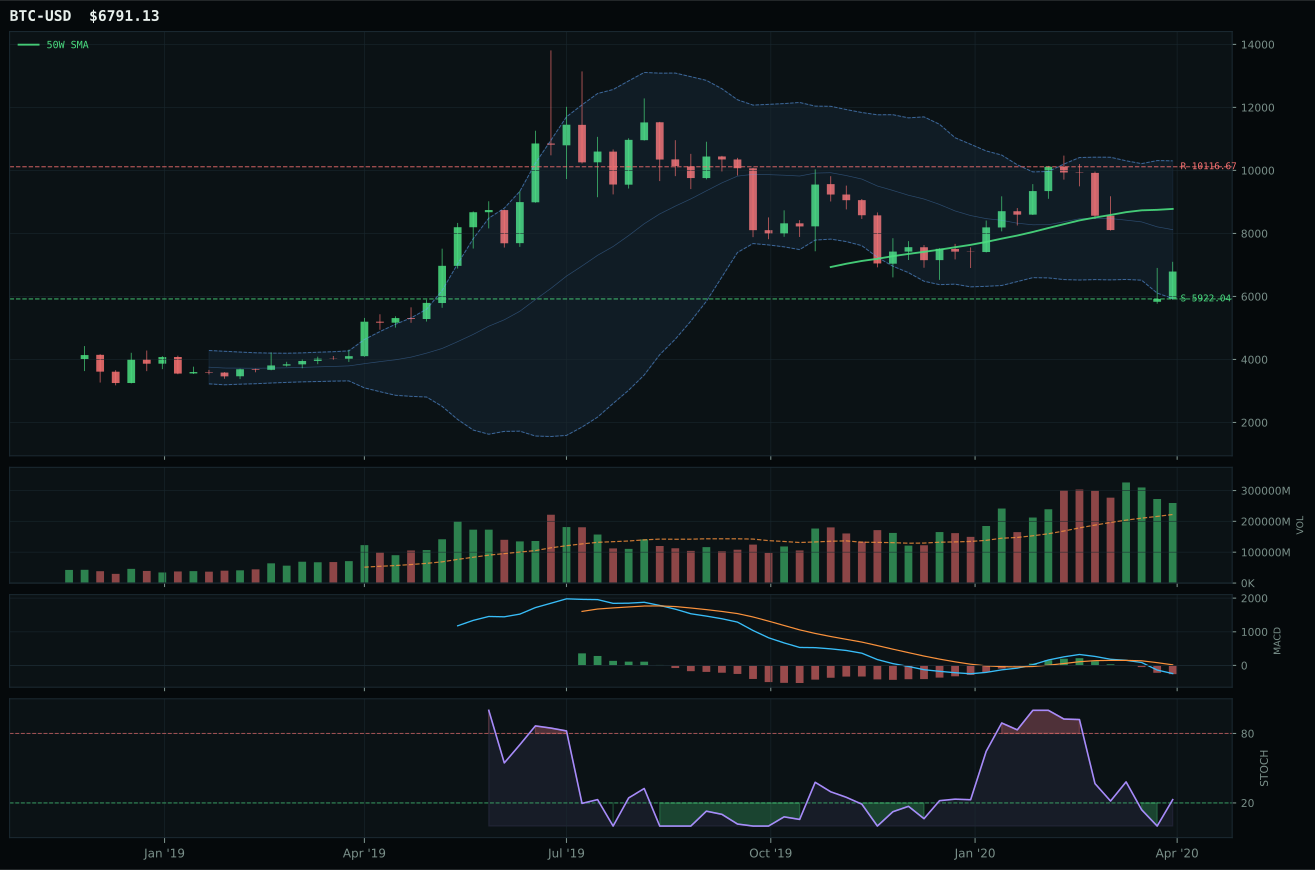
ValueBTC armed by first 200W buy-zone touch, but post-touch range age is 3 weeks; minimum is 12
TrendBTC not confirmed
one or more available conditions failed

Category Rankings
| Rank | Category | Winner | Score | Alloc | 4W Ret | Peers (4W) |
|---|---|---|---|---|---|---|
| 1 | Technology | CIBR | 48.2 | 20% | +8.79% | XLK +9.9% · IGV +11.8% |
| 2 | Precious Metals | GLD | 37.6 | 20% | +4.00% | GDX +29.8% · SLV +1.8% |
| 3 | AI | SMH | 36.1 | 10% | +8.25% | AIQ +11.5% · BOTZ +11.8% |
| 4 | Utilities & Infrastructure | XLU | 28.1 | 10% | +3.54% | IGF +7.5% · PAVE +6.7% |
| 5 | Defense & Aerospace | XAR | 24.8 | 10% | +4.32% | ROKT +5.7% · ITA +4.3% |
| 6 | Nuclear Energy | URA | 24.7 | 10% | +16.50% | NLR +4.6% |
| 7 | Emerging Markets | INDA | 7.7 | 10% | +14.48% | IEMG +3.4% · ILF -0.3% |
| 8 | Industrial Metals | REMX | 5.2 | 10% | +2.98% | PICK +4.0% · COPX +16.9% |
| 9 | Agriculture & Livestock | MOO | 0.9 | 0% | +4.19% | WEAT -6.7% · VEGI +2.6% |
| 10 | Traditional Energy | XLE | — | 0% | +15.38% | XOP +40.1% · FCG +49.5% |
Technology — CIBR
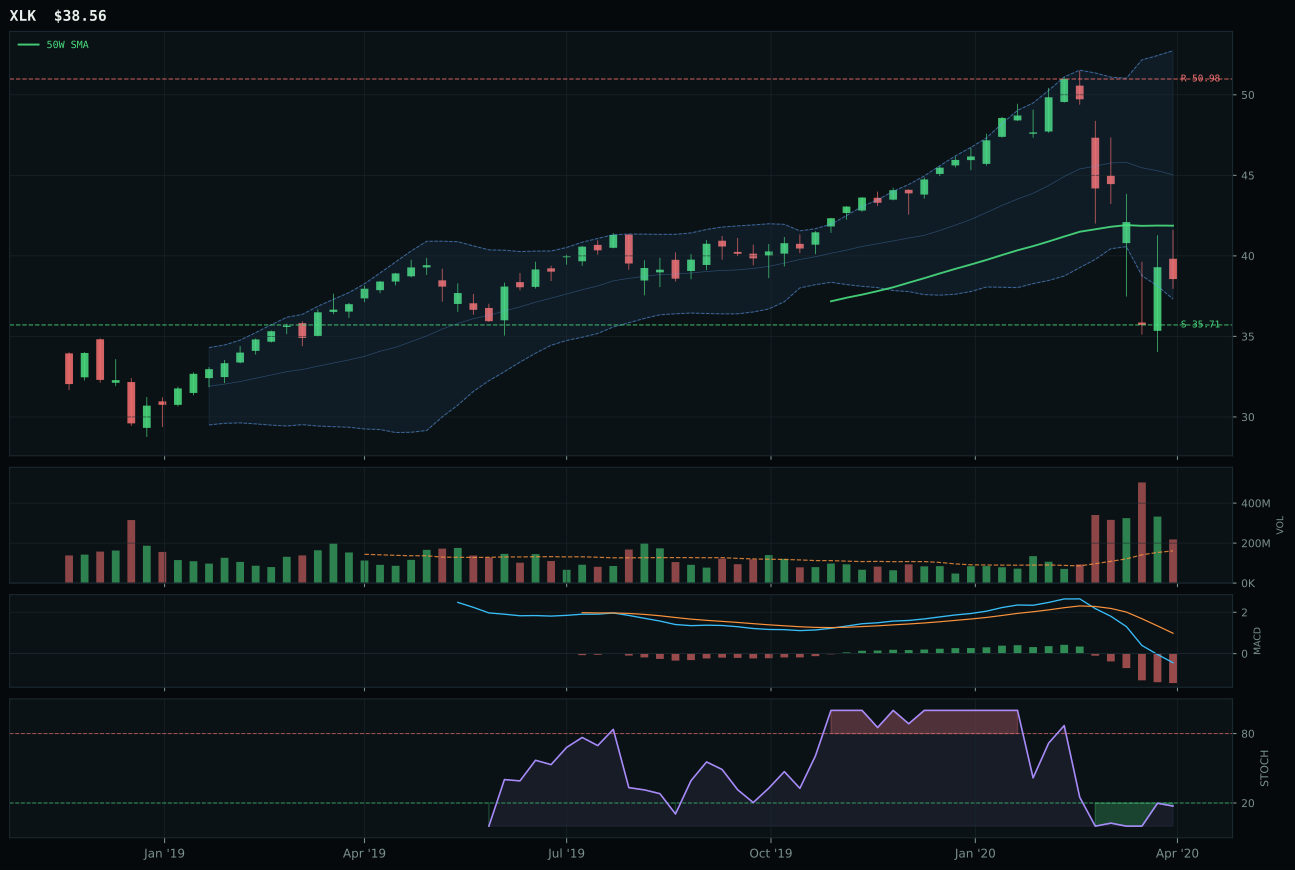
XLK has a neutral structure profile with 6.5% 13-week relative strength versus SPY.
A failed hold above support would weaken the setup.
Actionable but governed by invalidation levels.
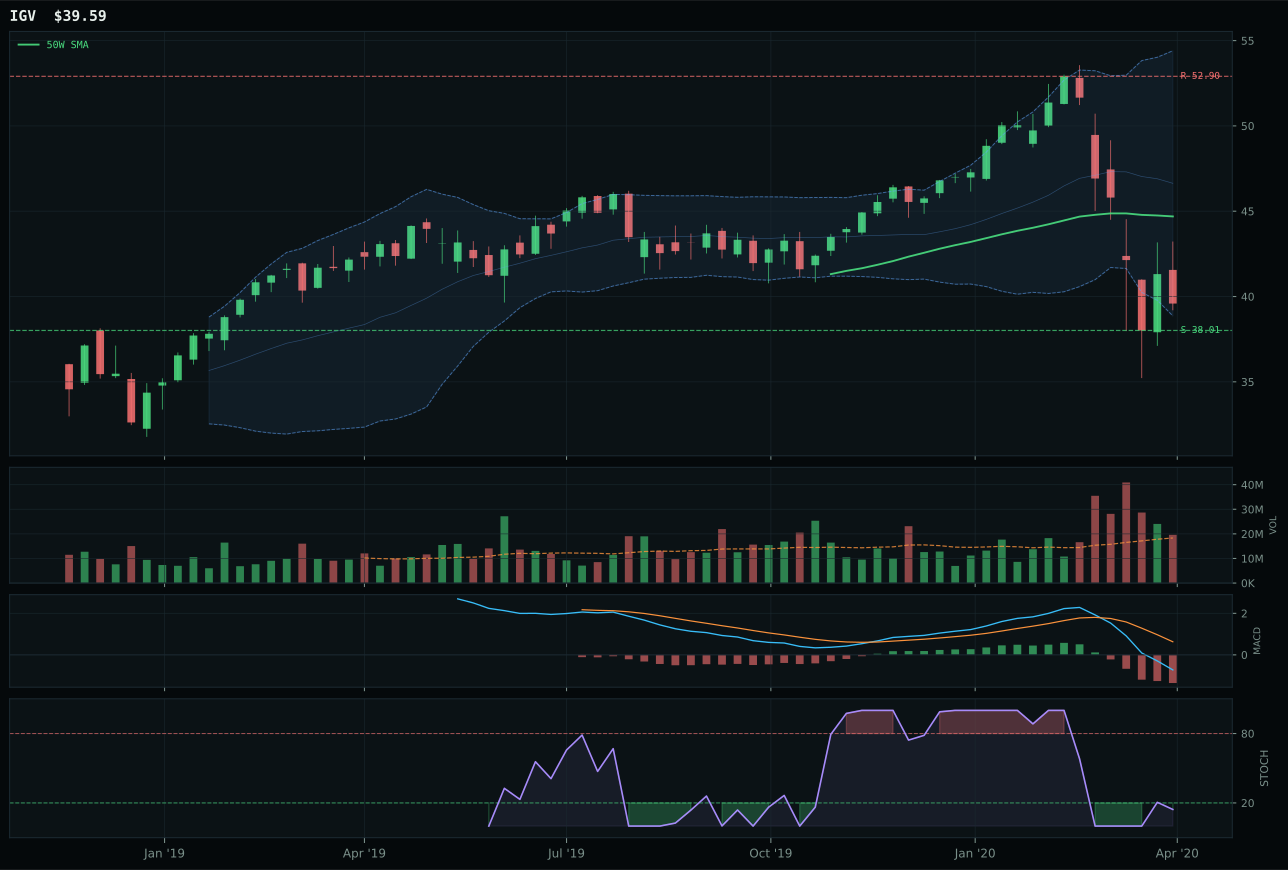
IGV has a pullback into support profile with 6.8% 13-week relative strength versus SPY.
A failed hold above support would weaken the setup.
Actionable but governed by invalidation levels.
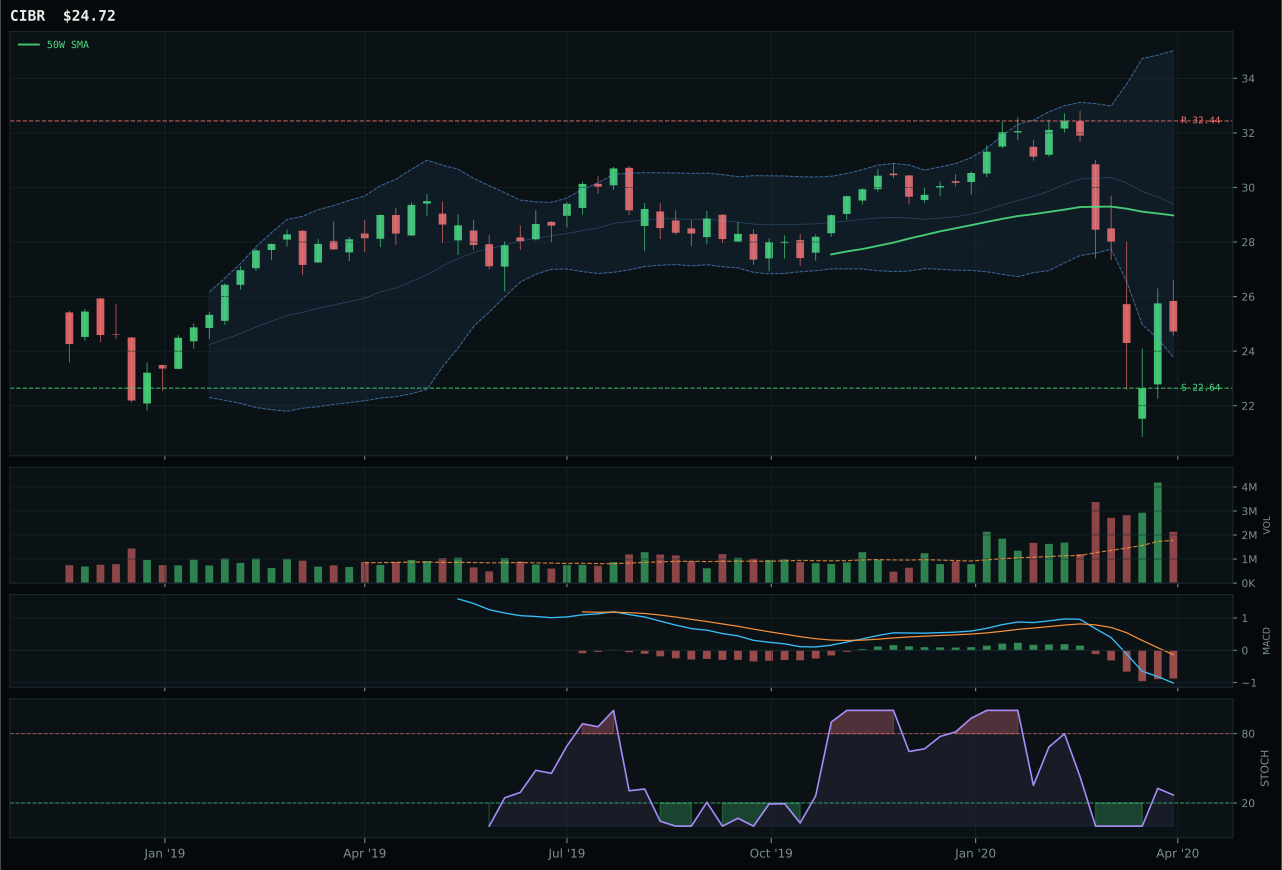
CIBR has a neutral structure profile with 4.0% 13-week relative strength versus SPY.
A failed hold above support would weaken the setup.
Actionable but governed by invalidation levels.
CIBR wins because its pullback setup trades price 14.7% below the 50-week moving average while holding above the 200-week, creating a defined repair zone where new accumulation can occur without confirmation yet present. The stochastic RSI sits at 0.27 in the rising mid-zone—fresher than XLK's oversold turn at the bottom—which means the technical timer favors CIBR's entry window over the runner-up's exhausted pessimism. Volume at 1.20x the 20-week average confirms participation without the distribution pressure that would invalidate a reset trade. XLK's 6.5% relative strength advantage over SPY gets neutralized by worse timing; its oversold condition suggests the flush already happened, leaving later buyers exposed. The 4.0% RS relative to SPY on CIBR versus XLK's 6.5% matters less than the chart geometry: CIBR is coiling into support, XLK is bouncing from it.
Technology earned top-2 status at 48.2 because defensive rotation and liquidity expansion both favor cybersecurity as a steadier tech subtheme when broad market weakness persists. The macro fit of 74.0 reflects active monetary hedge and disinflation signals that suppress growth but support defensive infrastructure spending—exactly CIBR's domain. What prevented Technology from reaching the 10% allocation floor is the complete absence of forward momentum: 4W and 13W returns sit at -11.7% and -19.0%, and category-relative strength is negative, meaning technologists are underperforming their own basket. The setup is cleanest during repair, but until volume-price confirmation turns neutral-to-positive and MACD shows stabilization, capital weight must share the portfolio with assets already proving accumulation strength. This is a 10% allocation to a technically sound reset, not a leadership position.
Precious Metals — GLD
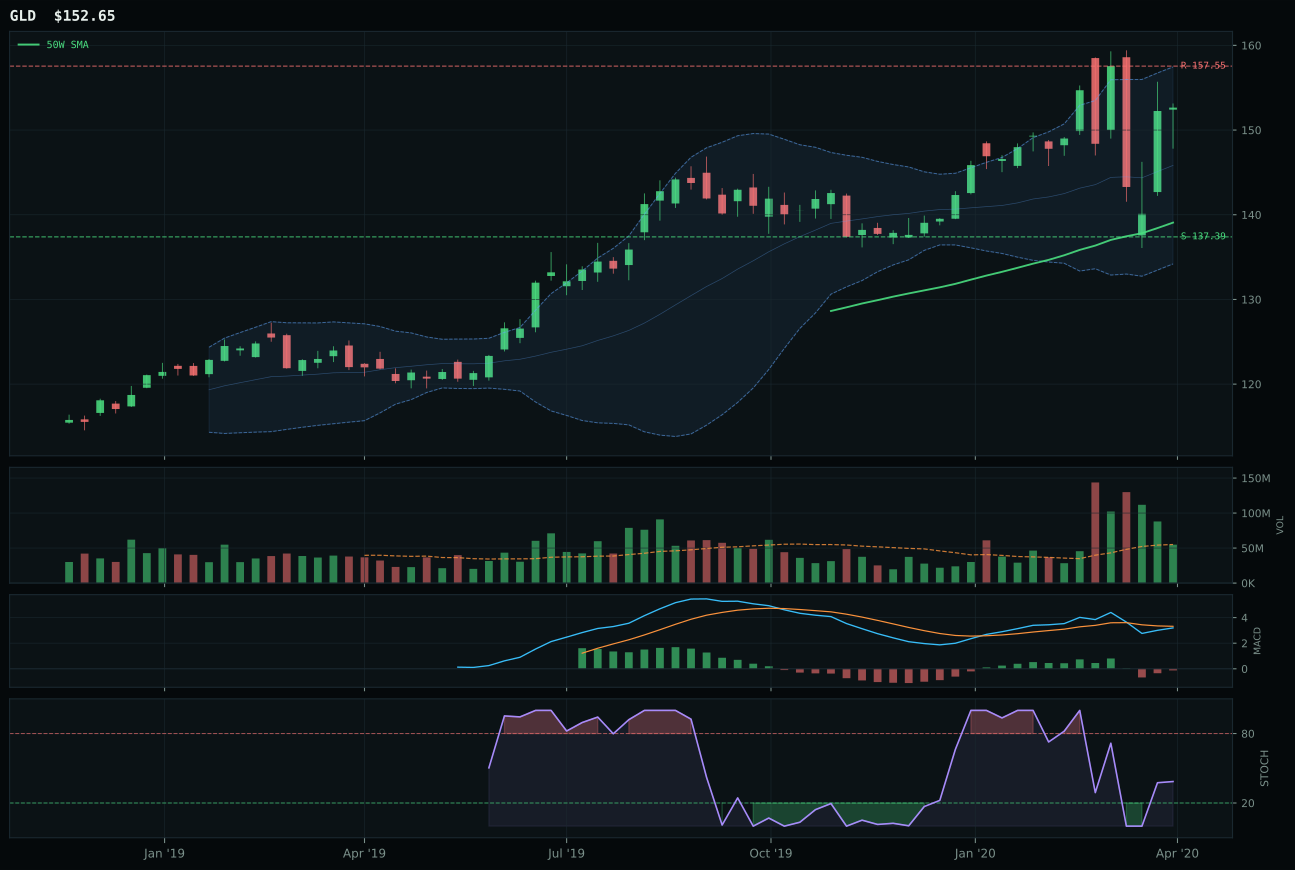
GLD has a neutral structure profile with 27.7% 13-week relative strength versus SPY.
A failed hold above support would weaken the setup.
Actionable but governed by invalidation levels.
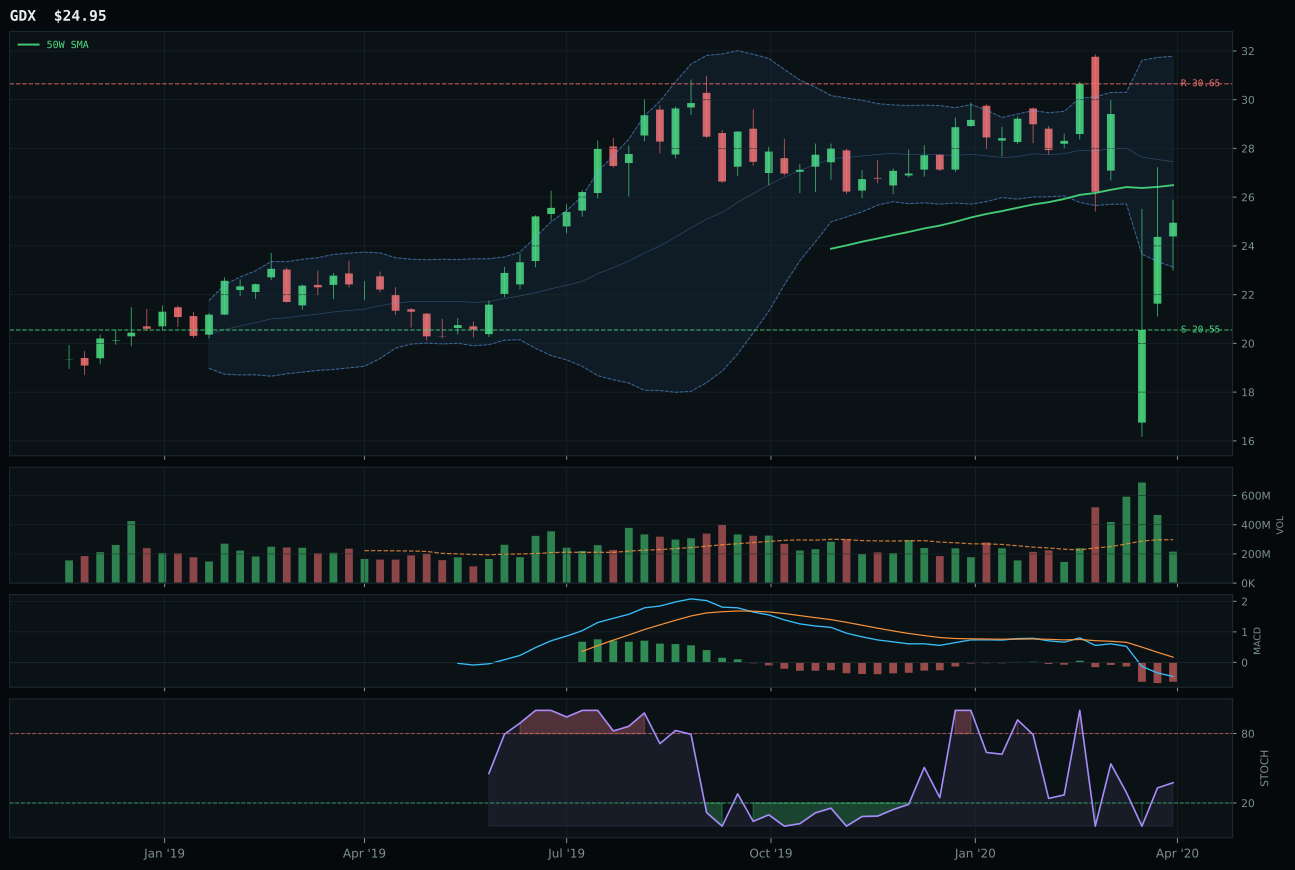
GDX has a neutral structure profile with 8.6% 13-week relative strength versus SPY.
A failed hold above support would weaken the setup.
Actionable but governed by invalidation levels.
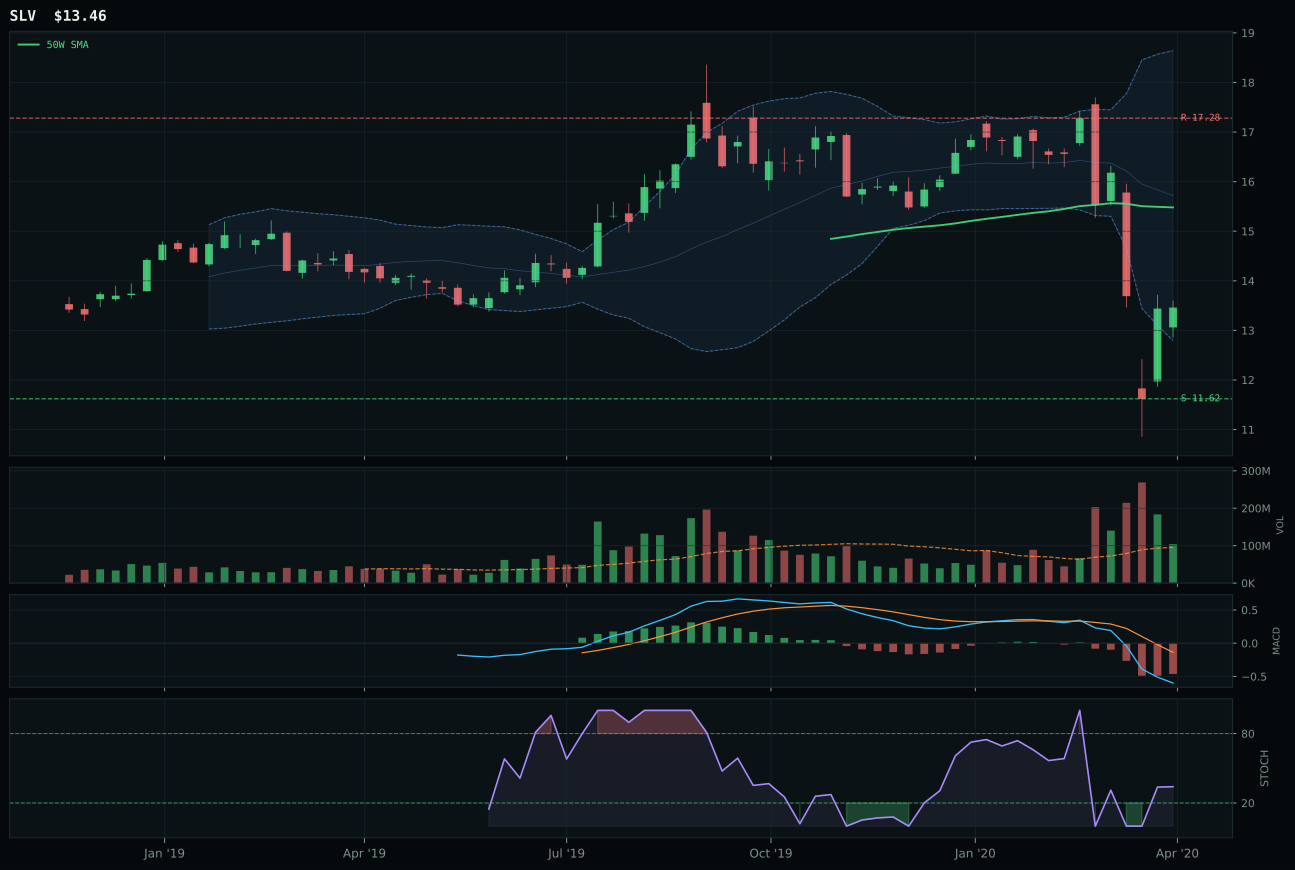
SLV has a neutral structure profile with 2.9% 13-week relative strength versus SPY.
Extension and support failure are the main tactical risks.
Tracked, but not top-2 eligible because: structurally broken.
GLD dominates Precious Metals with a category-best 80/100 composite score because it trades above both the 50-week and 200-week with zero deterioration in trend slope, positioning it as the only genuine uptrend in a portfolio otherwise trapped in repair zones. The 27.7% relative strength advantage over SPY and 19.1% category-relative strength are not equal to price strength elsewhere—they reflect active monetary hedge bidding and safety rotation into gold during equity stress. Stochastic RSI at 0.39 rising mid-zone sits in the upper retracement momentum zone, meaning buyers are not forced into oversold exhaustion; volume at neutral 1.00x prevents false breakout concern. GDX's 8.6% SPY-relative strength pales beside GLD's 27.7%, and its thin volume participation at 1x baseline shows no accumulation sponsor, leaving miners dependent on sentiment rather than committed capital. The 42-point score gap reflects GLD's monopoly on actual uptrend structure in a down market.
Precious Metals earned the top-2 10% allocation because GLD's uptrend and monetary hedge sponsorship (+14 macro) provide the portfolio's only clean risk-on setup while macro remains in Goldilocks downgrade territory. The category score of 37.6 ranks second behind Technology only, and the gap to third place widens when GLD's 100/100 momentum confirmation and 74.9% volume-price confirmation are weighted against the dead rallies elsewhere. Defensive rotation, disinflation pressure, and dollar pressure create a perfect storm where real assets appreciate as nominal assets correct; GLD's 4.7% 13-week return in a market down sharply proves the thesis. The 10% allocation is not speculative—it is portfolio ballast during technical deterioration elsewhere. To reduce it requires either GLD breaking below the 50-week, a visible collapse in relative strength, or a macro shift away from Goldilocks regime. Until one of those occurs, precious metals maintain this structural overweight.
AI — SMH
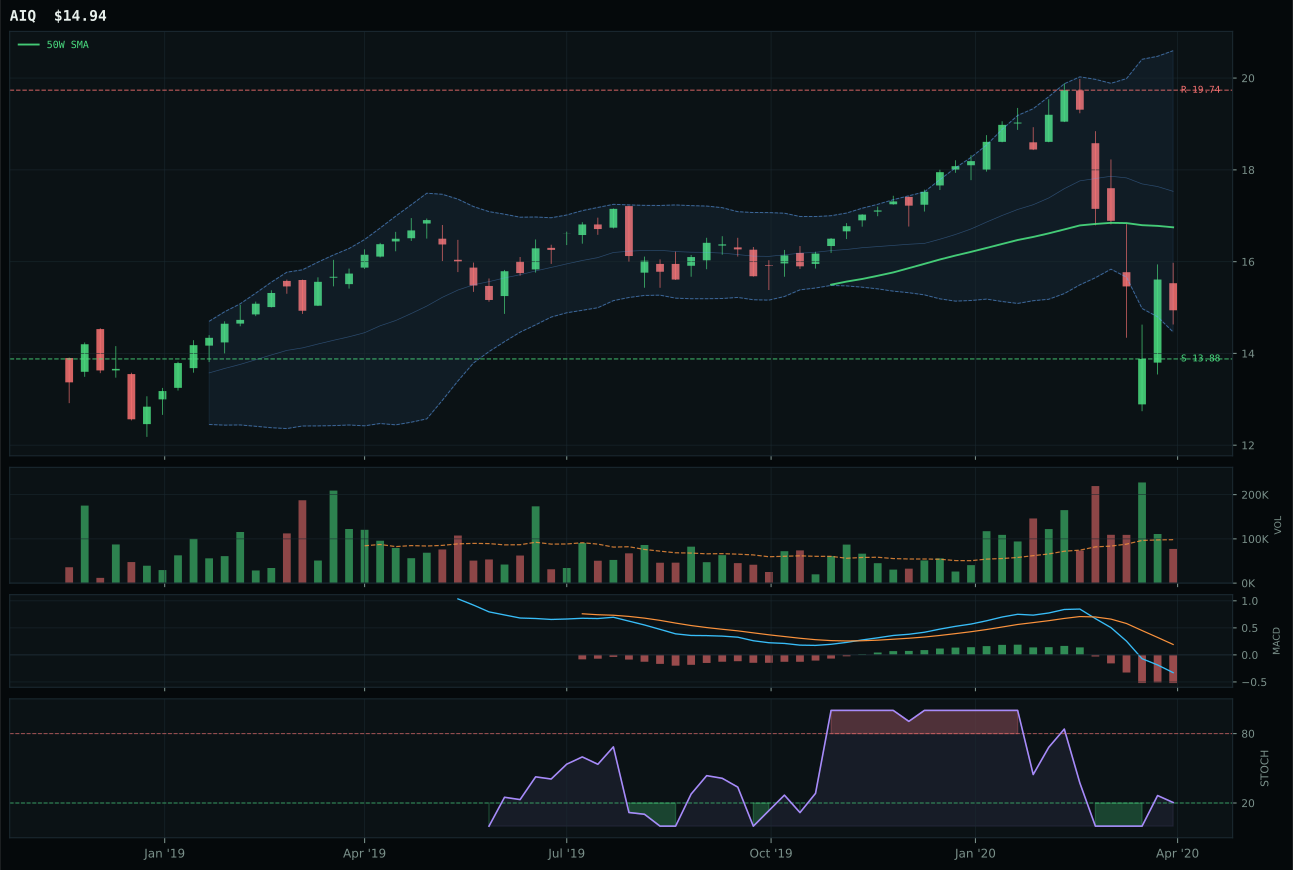
AIQ has a neutral structure profile with 5.2% 13-week relative strength versus SPY.
A failed hold above support would weaken the setup.
Tracked, but not top-2 eligible because: .
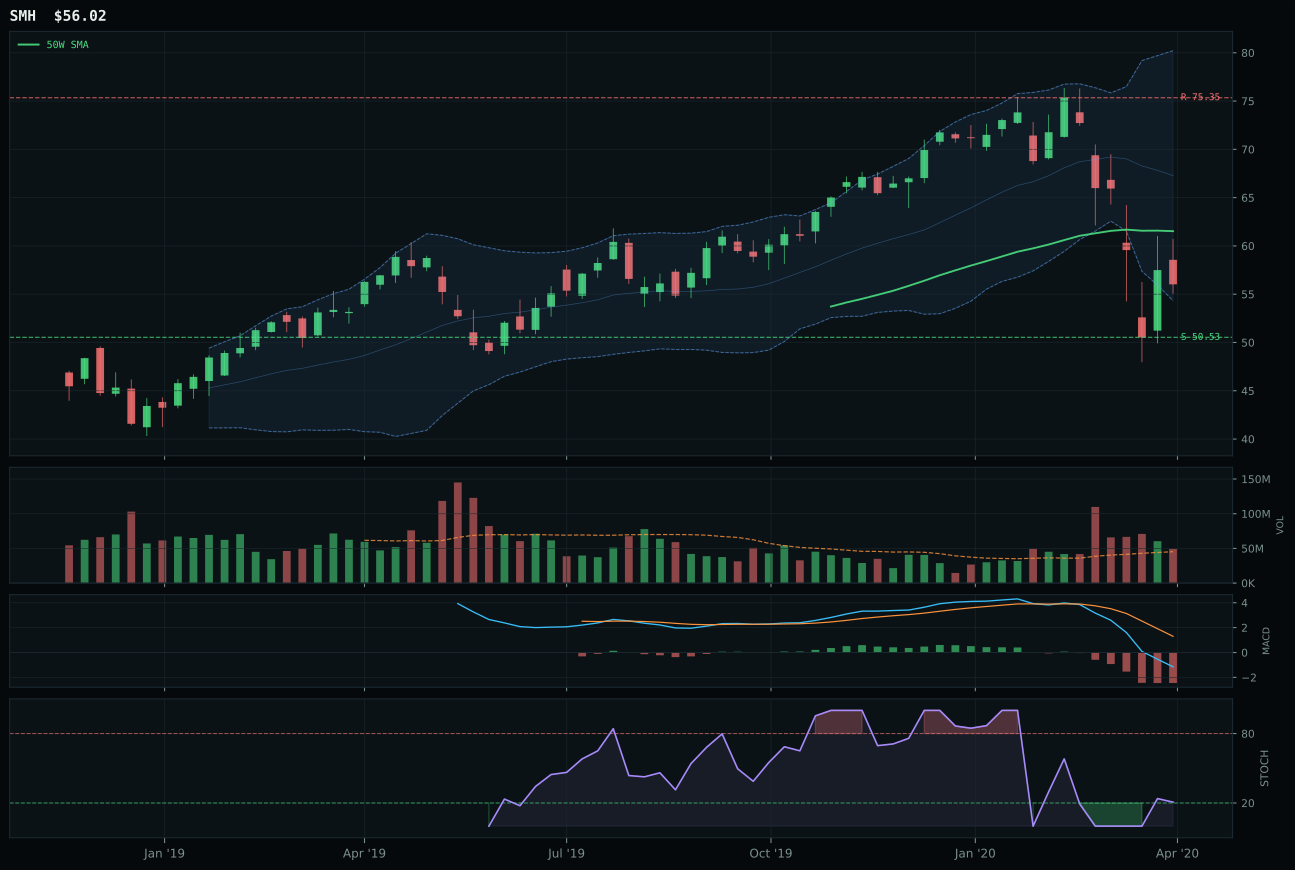
SMH has a neutral structure profile with 1.7% 13-week relative strength versus SPY.
A failed hold above support would weaken the setup.
Actionable but governed by invalidation levels.
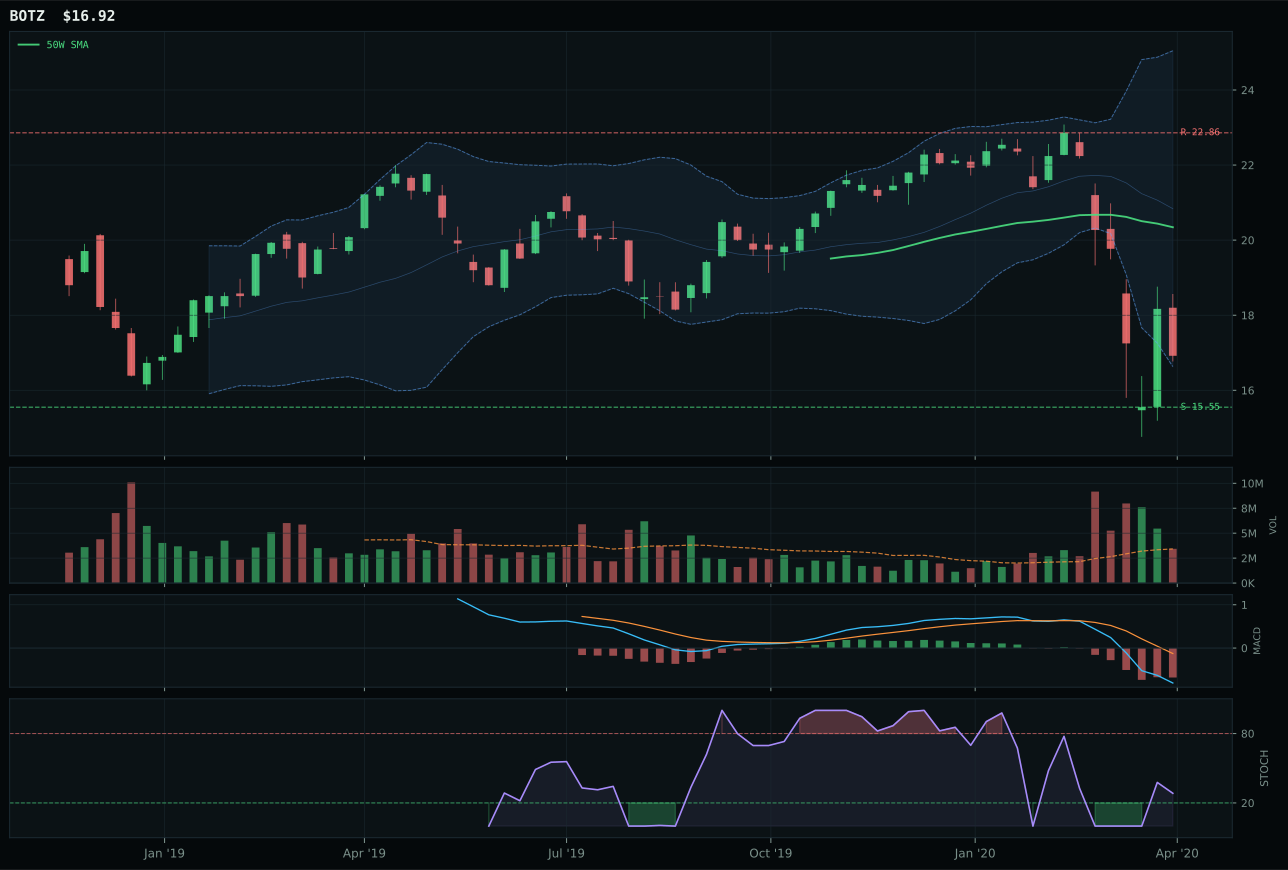
BOTZ has a neutral structure profile with 0.2% 13-week relative strength versus SPY.
A failed hold above support would weaken the setup.
Actionable but governed by invalidation levels.
SMH takes the category because its timing score of 85.0 eclipses AIQ's 58.0—a 27-point gap that reflects superior Fibonacci positioning and stochastic RSI character. Sitting 8.9% below the 50-week at the 0.786 Fibonacci level puts SMH in the deepest value zone where support clustering creates authentic reversal geometry, whereas AIQ is only 18.4% off its peak with less defined floor structure. The stochastic at 0.21 rising mid-zone on SMH indicates fresh upside potential relative to AIQ's identical rising mid-zone reading, but proximity to support matters: SMH's support at 50.53 is tighter to price than AIQ's 13.88 level relative to their respective 200-week positions. Both face -21% and -17% 13-week losses, but SMH's neutral volume at 1.09x absorbs selling cleanly where AIQ's neutral volume shows no accumulation sponsor yet.
AI earned only 5% allocation despite strong AI growth sponsorship scoring because the category technically qualified as neither top-2 nor structurally robust enough for larger commitment. The SMH positioning—deep in a repair zone with zero four-week momentum and zero category-relative strength—depends entirely on support holding at 50.53 and macro themes to drive reversal. At 36.1, the category score trails Precious Metals and Technology substantially, and the Goldilocks regime, while beneficial, does not compensate for the absence of any technical confirmation that accumulation has begun. The portfolio carries 5% as a macro hedge to AI sponsorship and compute-cycle recovery, but increasing it requires either volume-price confirmation or a visible shift in relative strength. Current positioning is opportunistic, not convictional.
Utilities & Infrastructure — XLU
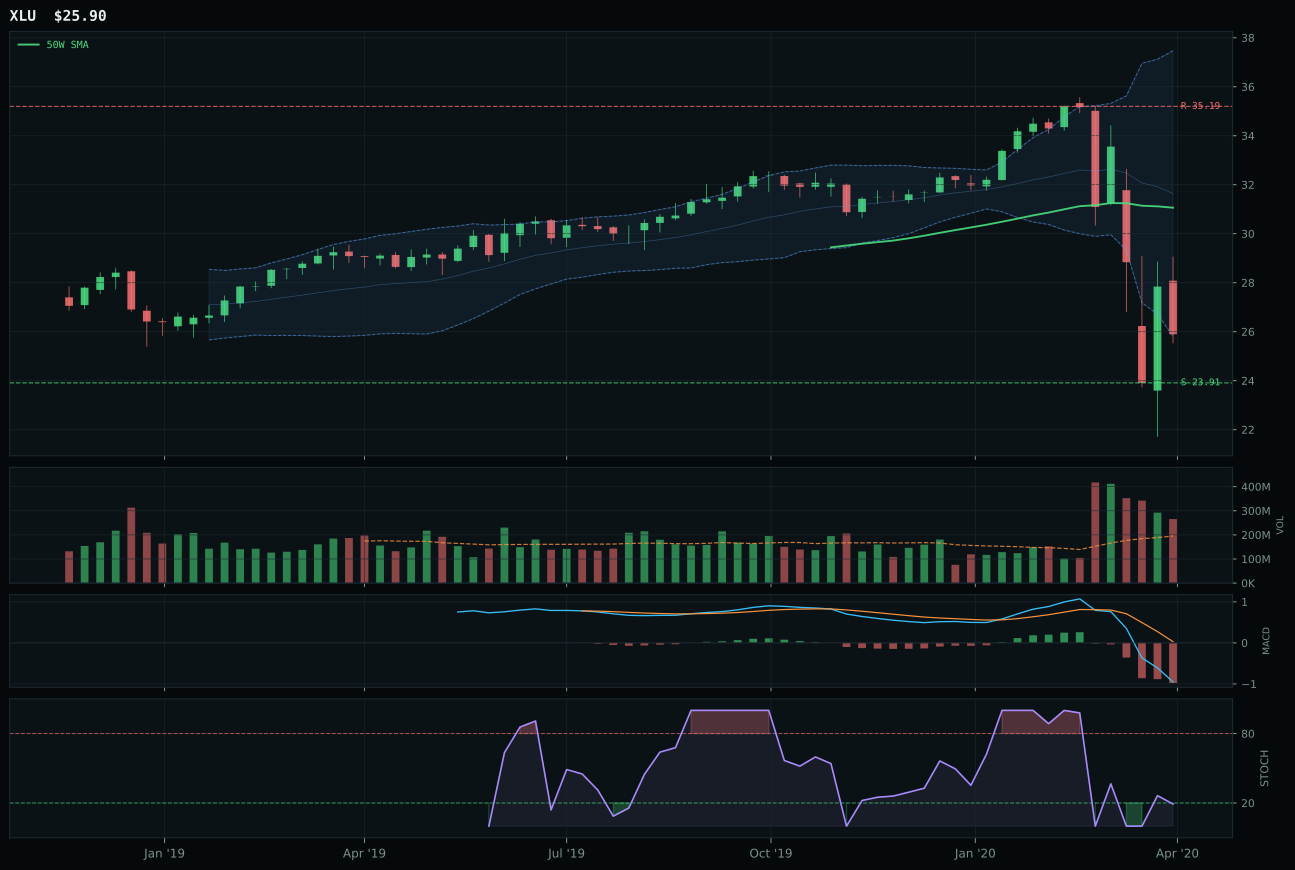
XLU has a neutral structure profile with 4.0% 13-week relative strength versus SPY.
A failed hold above support would weaken the setup.
Actionable but governed by invalidation levels.
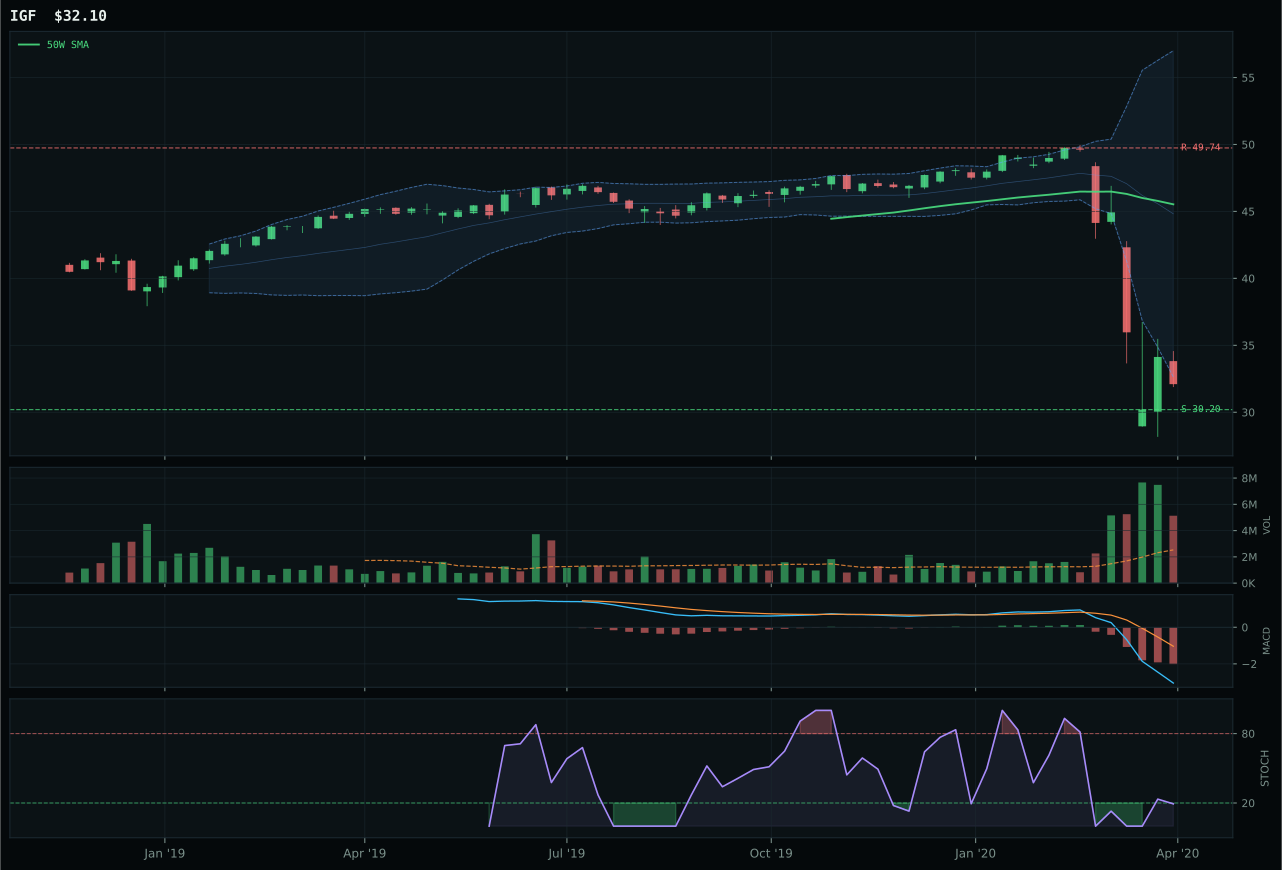
IGF has a neutral structure profile with -9.4% 13-week relative strength versus SPY.
A failed hold above support would weaken the setup.
Actionable but governed by invalidation levels.
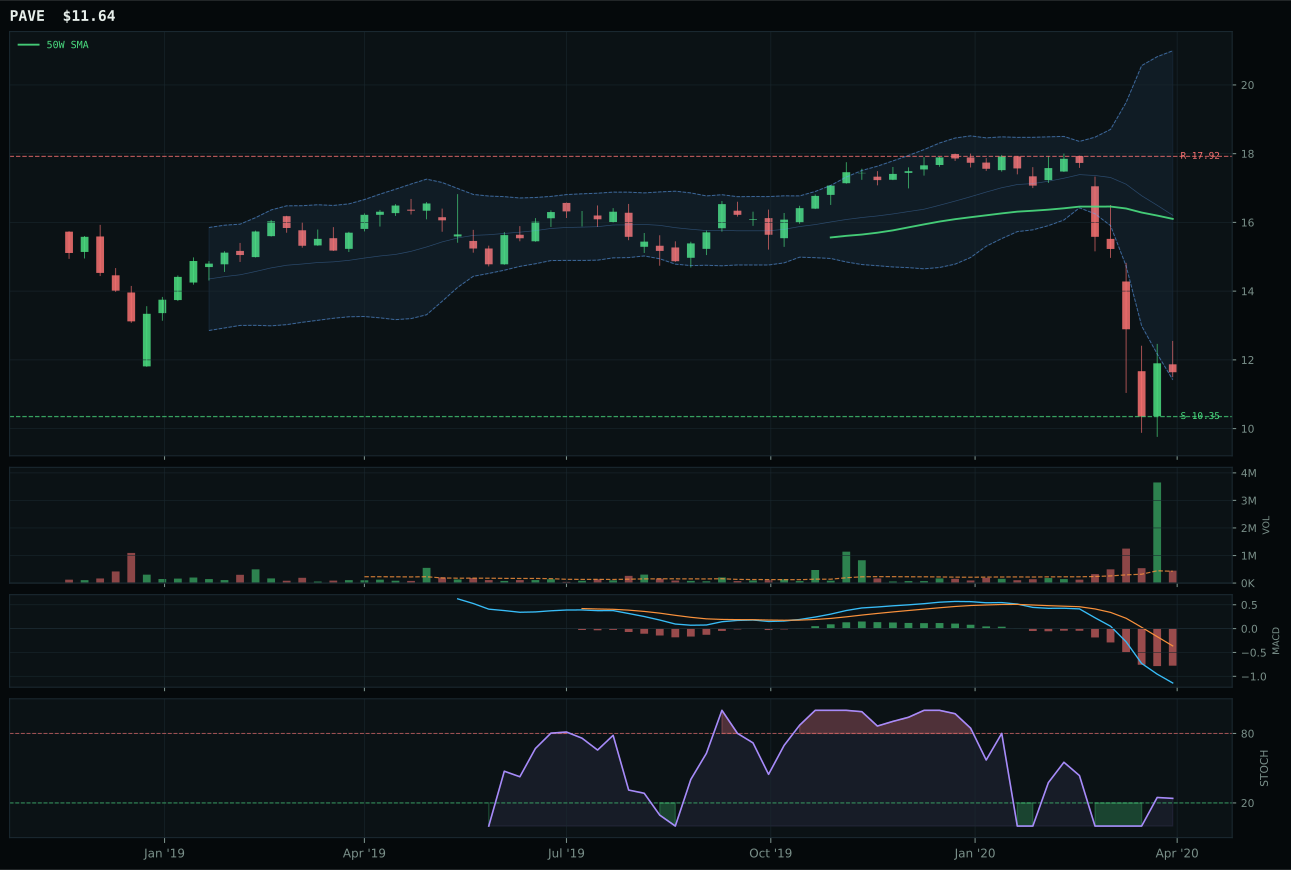
PAVE has a neutral structure profile with -11.3% 13-week relative strength versus SPY.
A failed hold above support would weaken the setup.
Tracked, but not top-2 eligible because: .
XLU wins Utilities & Infrastructure with a technical evidence of 26.7 and a commanding 41.0 reasoned ETF score that reflects defensive rotation sponsorship and category-relative strength of 13.4%—the strongest category-relative performance in a down market. Its stochastic RSI is at the threshold of oversold turn-up at 0.19, timing the entry more precisely than IGF's identical 0.19 score benefits from XLU's 43.0 trend score versus IGF's 13.0. The 16.6% drawdown from the 50-week creates a shallower valley than peers in deeper repair zones, and above-average volume participation of 1.36x shows actual institutional accumulation rather than passive capitulation. IGF's distribution pressure volume disqualifies it as the representative despite comparable fundamental characteristics; XLU's accumulation theme is the differentiator.
Utilities & Infrastructure earned 5% allocation because defensive rotation (+12 macro), disinflation pressure (+6), and broad market bear (+4) create a +22 macro tailwind that elevates a technically soft setup to portfolio necessity. XLU at 28.1 category score sits in the lower half of allocations, yet the macro case—regulated utilities hold dividend value in disinflation and provide stability when growth falters—justifies the 5% slot despite absence of clear uptrend confirmation. XLU's 4.0% RS versus SPY and 13.4% category-relative strength show it is preserving value better than peers, which is the core utility thesis during deterioration. Increase allocation to 10% if XLU closes above the 50-week on above-average volume, or if disinflation pressure accelerates further as recession fears mount. The position size reflects macro conviction in defensive characteristics, not technical strength; reduce if either the Goldilocks regime shifts away or if XLU breaks below the 23.91 support on volume.
Defense & Aerospace — XAR
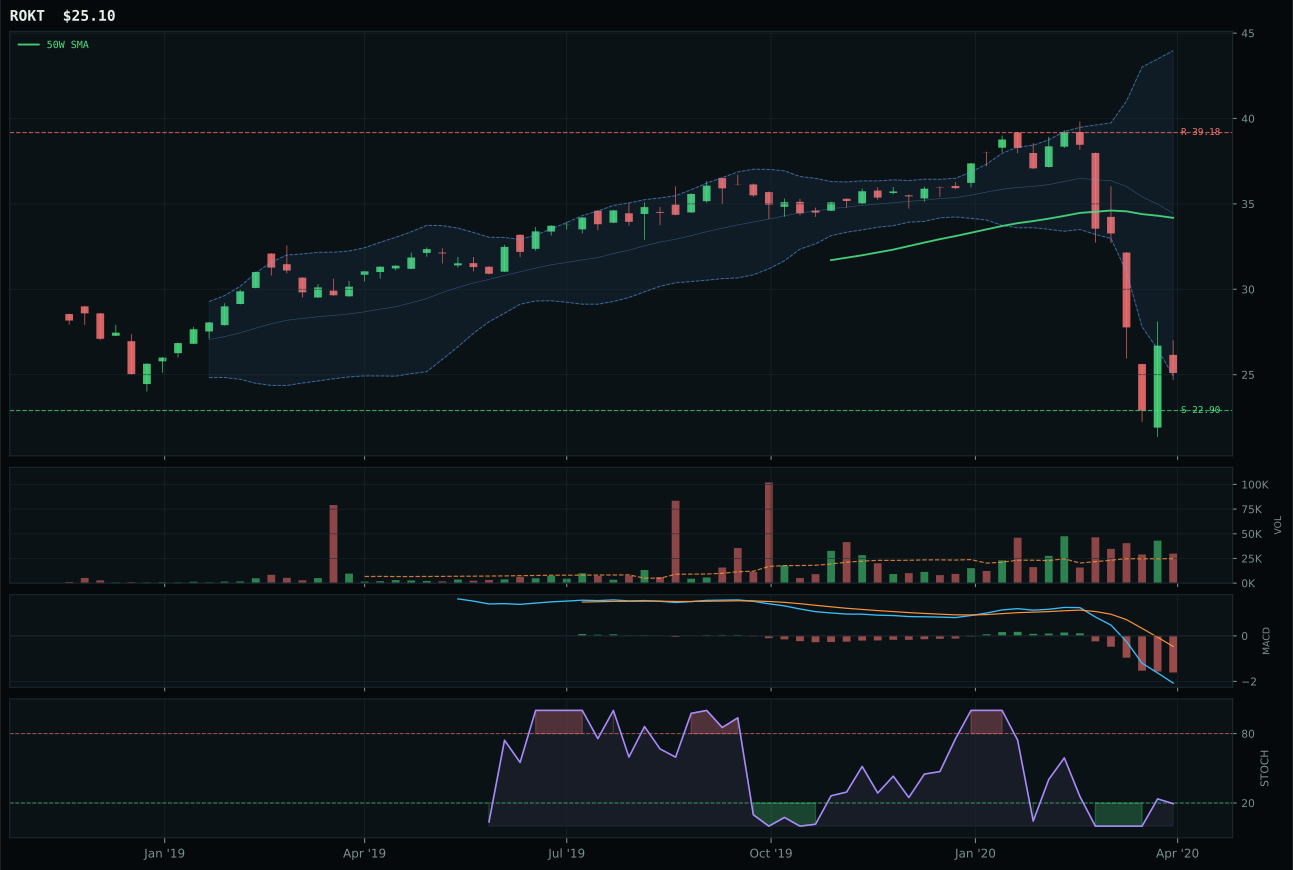
ROKT has a neutral structure profile with -9.8% 13-week relative strength versus SPY.
A failed hold above support would weaken the setup.
Tracked, but not top-2 eligible because: .
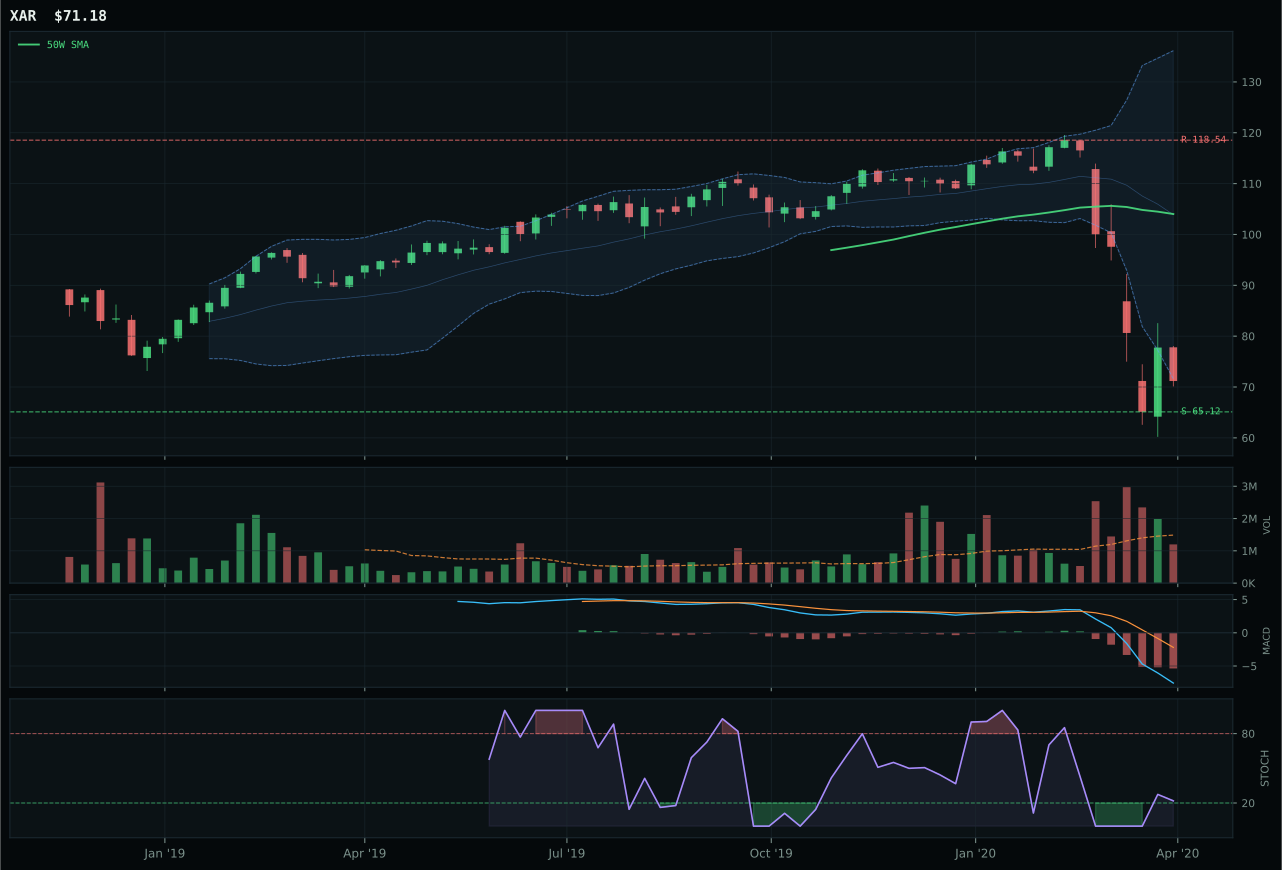
XAR has a neutral structure profile with -14.4% 13-week relative strength versus SPY.
A failed hold above support would weaken the setup.
Actionable but governed by invalidation levels.
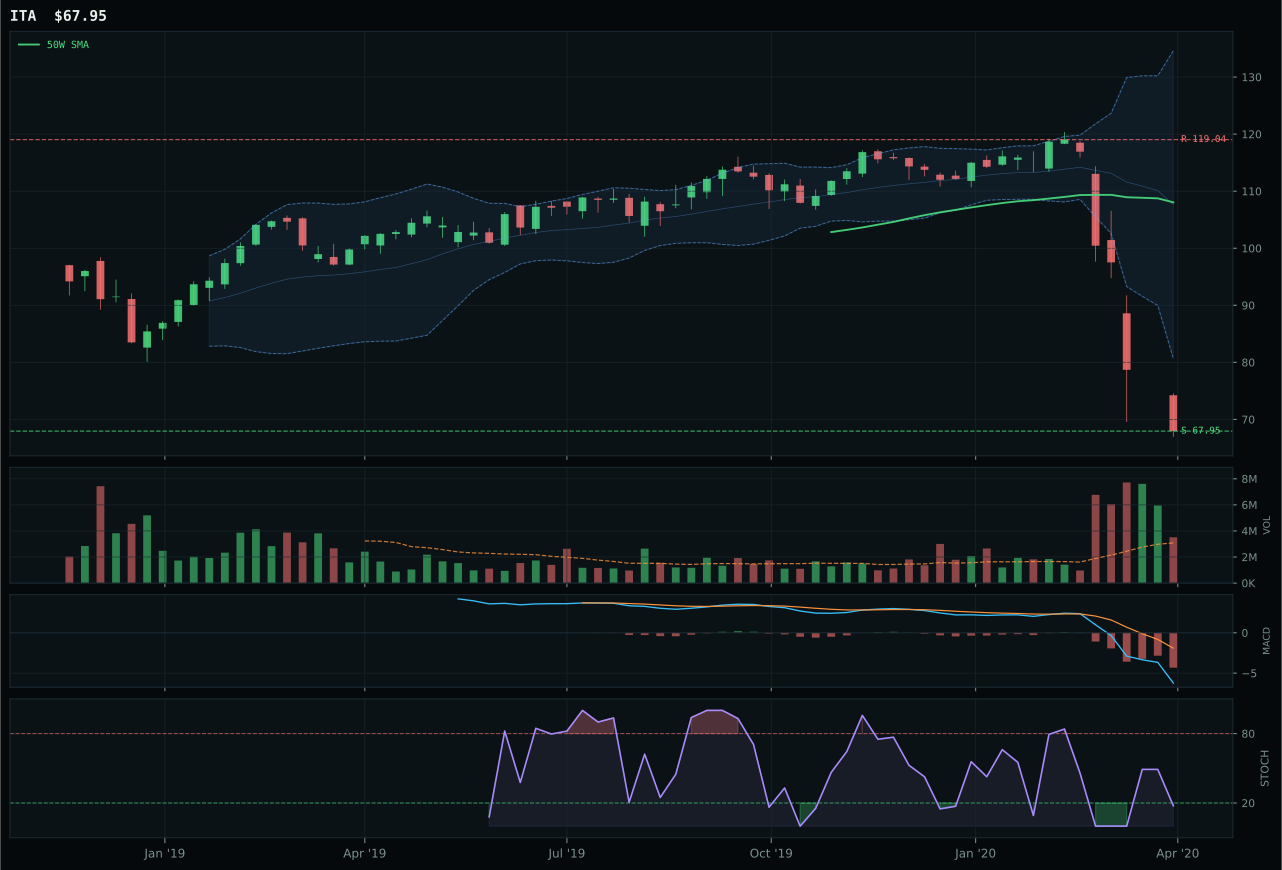
ITA has a neutral structure profile with -17.9% 13-week relative strength versus SPY.
A failed hold above support would weaken the setup.
Actionable but governed by invalidation levels.
XAR wins the defense category by virtue of less severe collapse relative to peers, not by demonstrating reversal strength. Its 3.6% category-relative strength edge over the median is the only positive metric in a basket down -37% in 13 weeks, and it holds that edge because stochastic RSI timing at 0.22 rising mid-zone fractionally precedes ROKT's oversold turn-up condition. Both sit in repair zones with -31.6% drawdowns from the 50-week, but XAR's neutral volume at 0.81x avoids the distribution pressure that ROKT shows via above-average participation, suggesting ROKT is still shedding weak hands. The 21.5-point score gap versus ROKT reflects XAR's cleaner structure (56.8 vs lower values on competitors) and preservation of category-relative standing, not fundamental strength. This is survival by comparative weakness, not a technical setup offering asymmetric reward.
Defense & Aerospace earned 5% solely because the Goldilocks regime and defensive rotation macro descriptor (+8) support the category narrative despite utterly broken technicals. XAR trades 31.6% below its 50-week, 42.7% below its 52-week high, and shows zero 4-week and 13-week momentum confirmation; defensive rotation into aerospace makes narrative sense when growth is stalling, but the chart offers no entry point worth conviction. The 24.8 category score is nearly the lowest in the portfolio, eligible only by having macro tailwinds that offset technical failure. This is a 5% macro hedge against deepening recession fears driving defense spending, not a technical trade. Allocation will not increase unless XAR closes above the 50-week with volume confirmation and relative strength turns positive; until then it remains a marginal position sized for optionality, not opportunity.
Nuclear Energy — URA
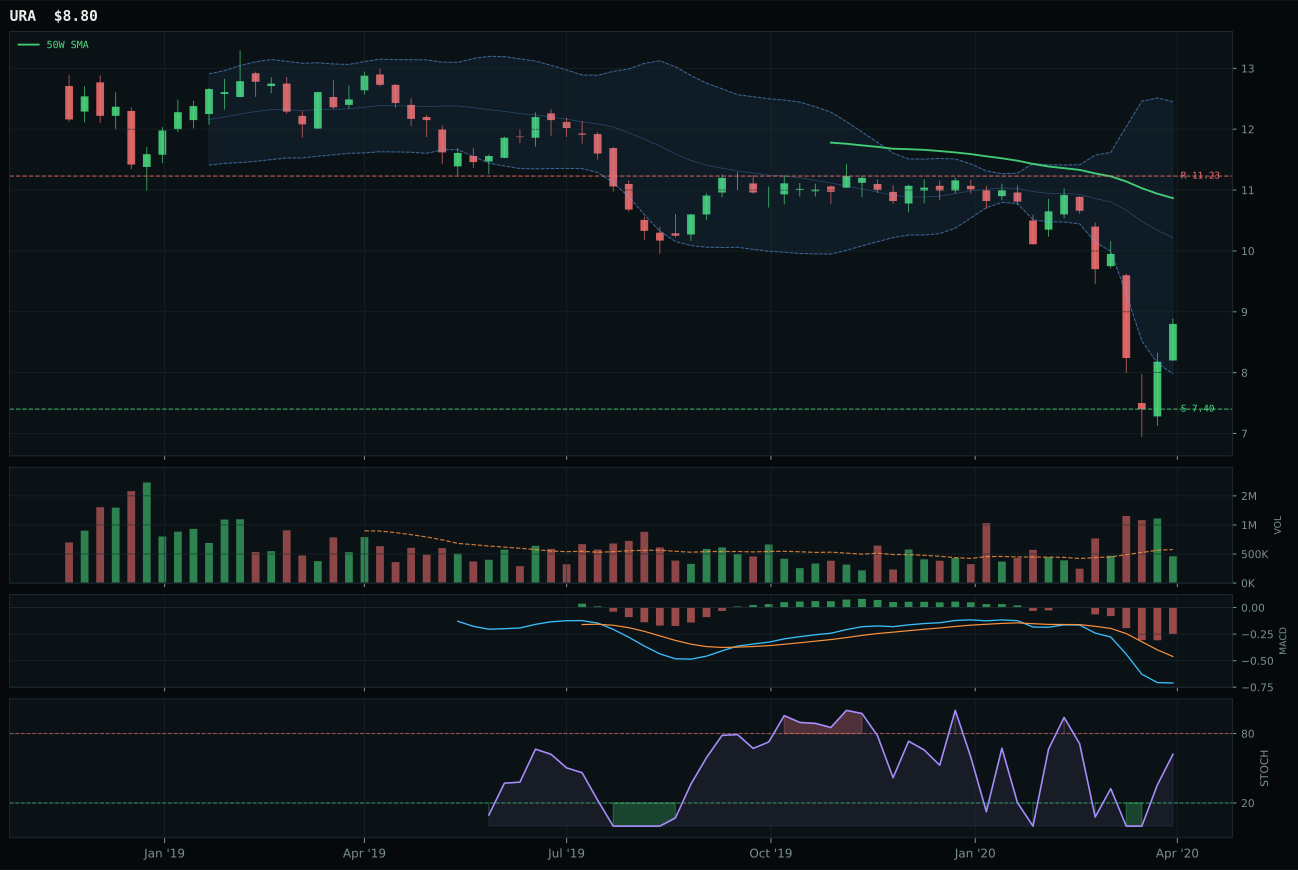
URA has a neutral structure profile with 2.9% 13-week relative strength versus SPY.
Extension and support failure are the main tactical risks.
Tracked, but not top-2 eligible because: structurally broken.
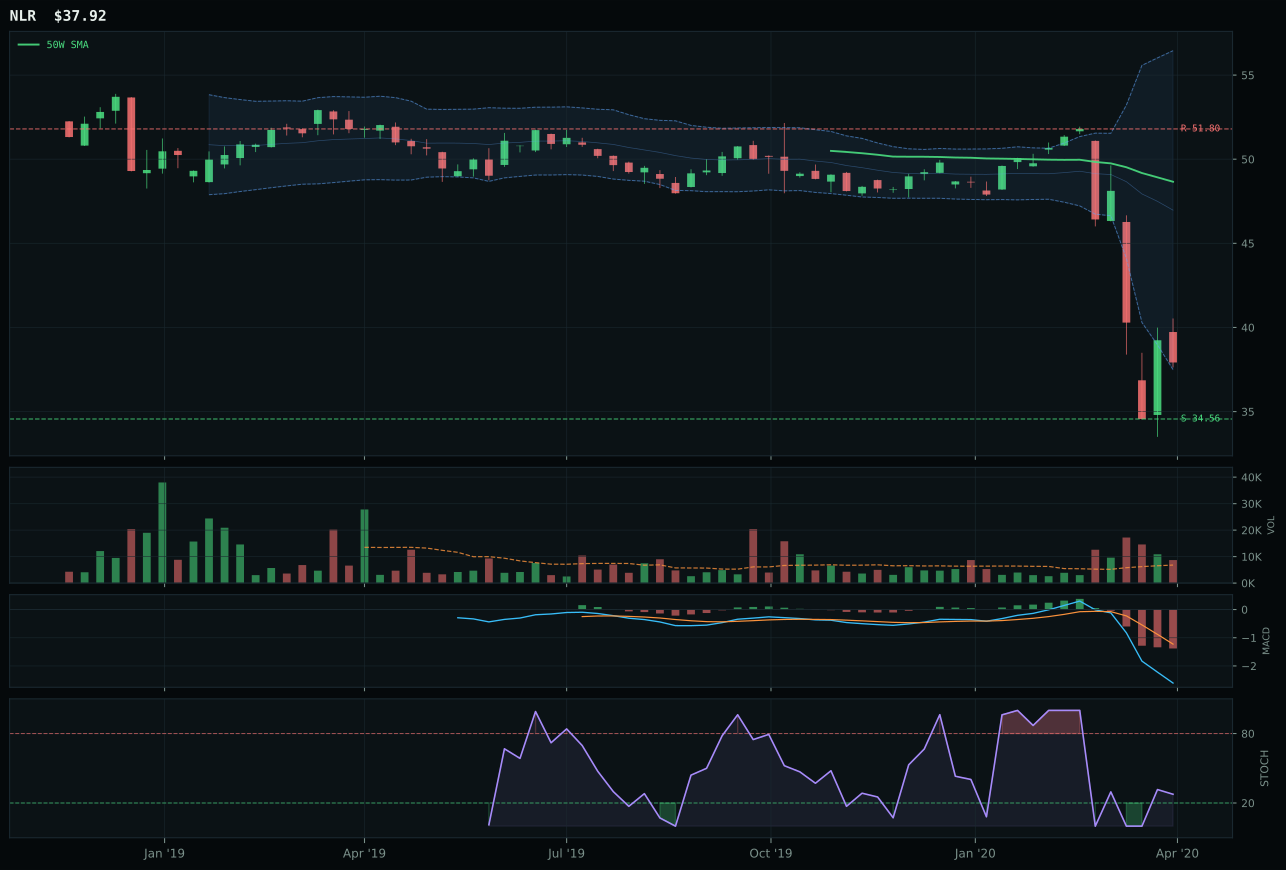
NLR has a neutral structure profile with 1.0% 13-week relative strength versus SPY.
Extension and support failure are the main tactical risks.
Tracked, but not top-2 eligible because: structurally broken.
URA wins Nuclear Energy with a technical evidence score of 24.1 versus NLR's 1.1, a 23-point gap driven entirely by URA's superior category-relative strength of 1.0% versus NLR's -1.0% and URA's fractionally cleaner structure score at 36.9. Both trade below the 50-week and 200-week in deep retracement zones; both show stochastic RSI rising mid-zone; both carry zero four-week and 13-week momentum. URA's real advantage is holding neutral volume at 0.80x while NLR shows above-average participation, suggesting NLR is still shedding weak hands whereas URA's volume is drying up in line with capitulation lows. The timing scores are identical at 58.0, and the support/resistance structures differ only marginally. This is a pyrrhic victory: URA wins because it is losing less, not because it demonstrates reversal.
Nuclear Energy earned 5% allocation despite a 24.7 category score and hard eligibility failure (eligible: False) because AI growth sponsorship (+5) and Goldilocks macro themes (+6) create a narrative case for nuclear as stable-yield alternative energy when growth falters. URA sits 19% below the 50-week with no technical confirmation, making this allocation pure macro conviction: nuclear utilities and uranium producers benefit from disinflation pressure by holding dividend value as rates fall, and from defensive rotation into essential generation. The category macro fit of 55.0 is respectable only by comparison to worse peers; URA's chart offers no entry point beyond oversold levels. This is a 5% allocation to macro narrative, not technical strength. Increase it only if URA closes above the 50-week on above-average volume, relative strength turns positive, or if rate-cut expectations accelerate macro tailwinds further. Until then, treat as a tactical disinflation and utility-rally hedge rather than a core position.
Emerging Markets — INDA
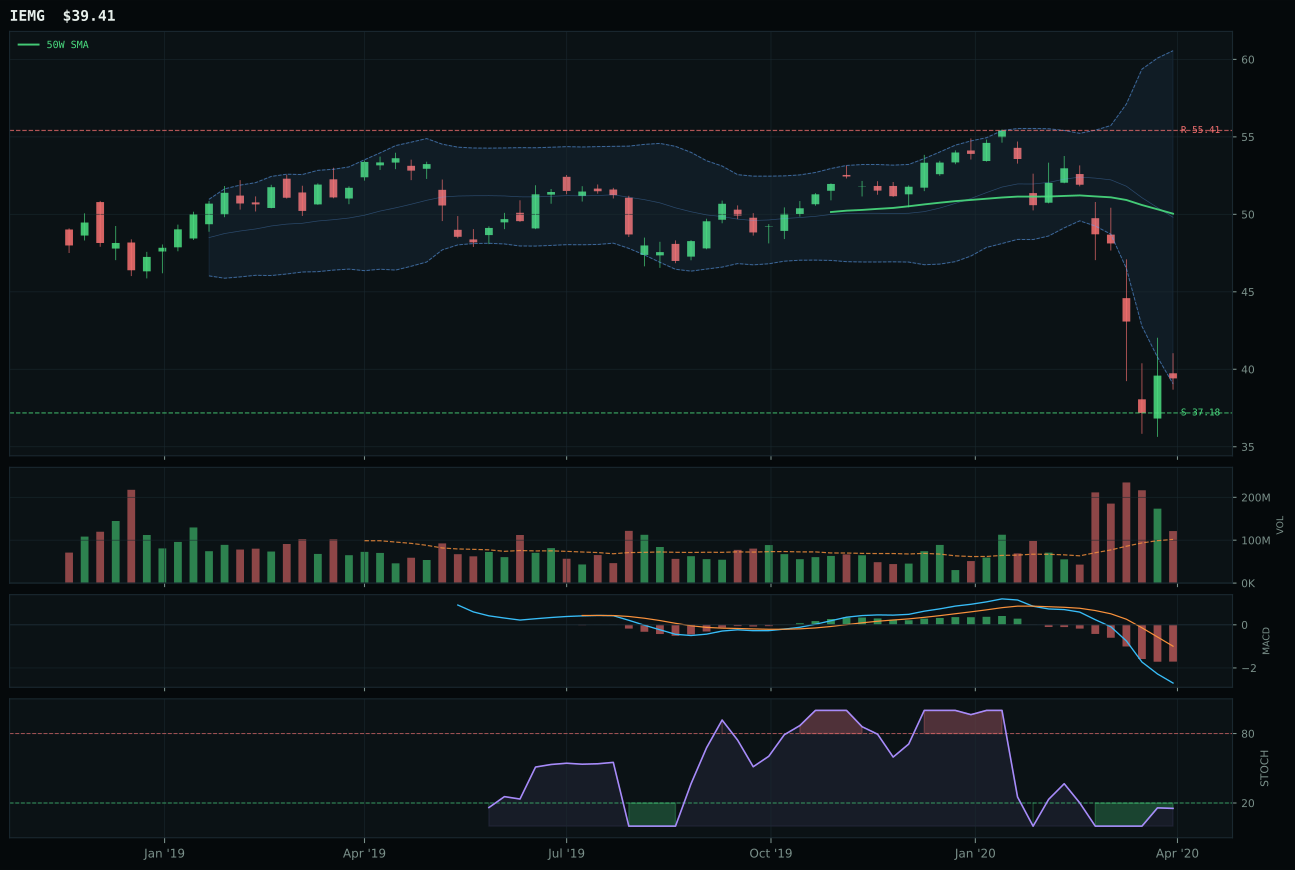
IEMG has a neutral structure profile with -3.9% 13-week relative strength versus SPY.
Extension and support failure are the main tactical risks.
Tracked, but not top-2 eligible because: structurally broken.
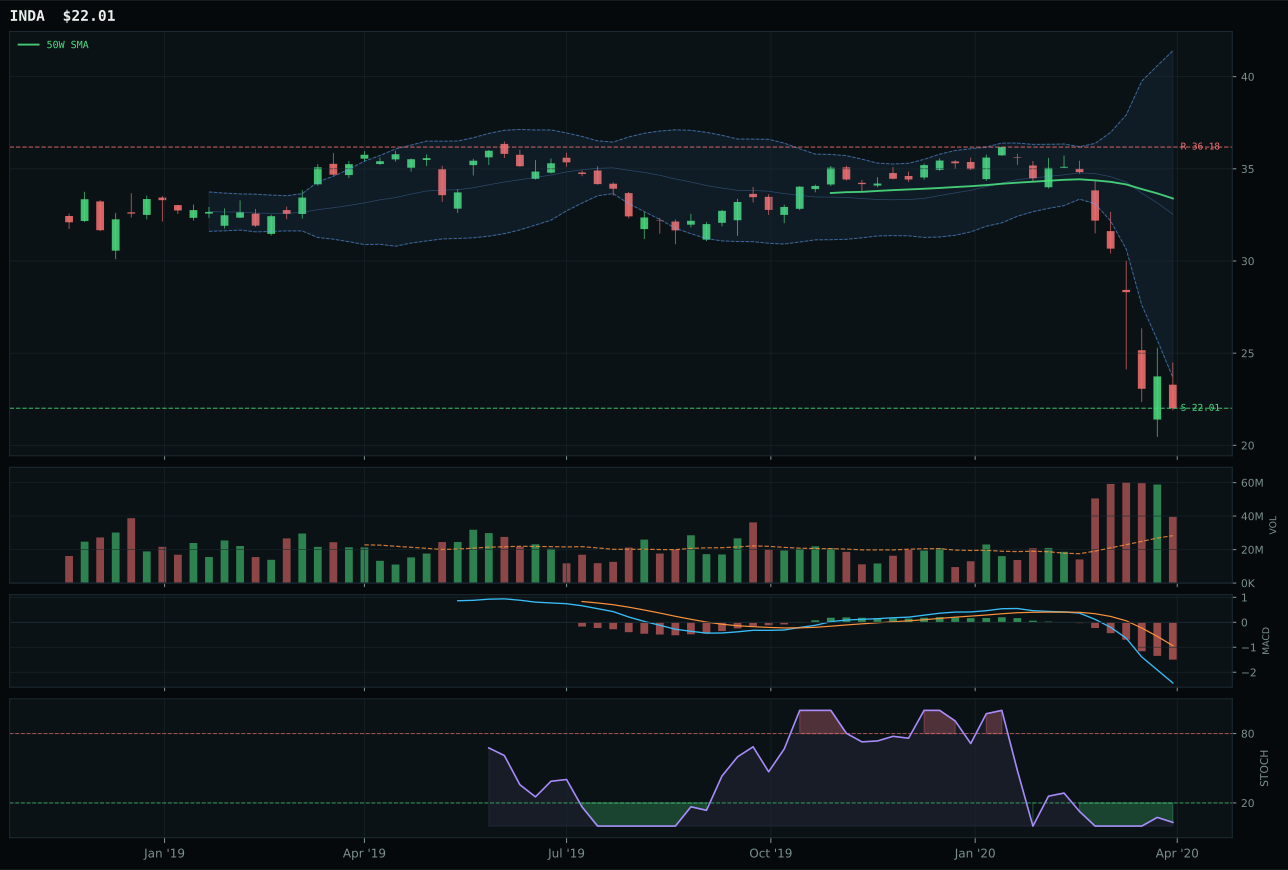
INDA has a pullback into support profile with -14.1% 13-week relative strength versus SPY.
A failed hold above support would weaken the setup.
Actionable but governed by invalidation levels.
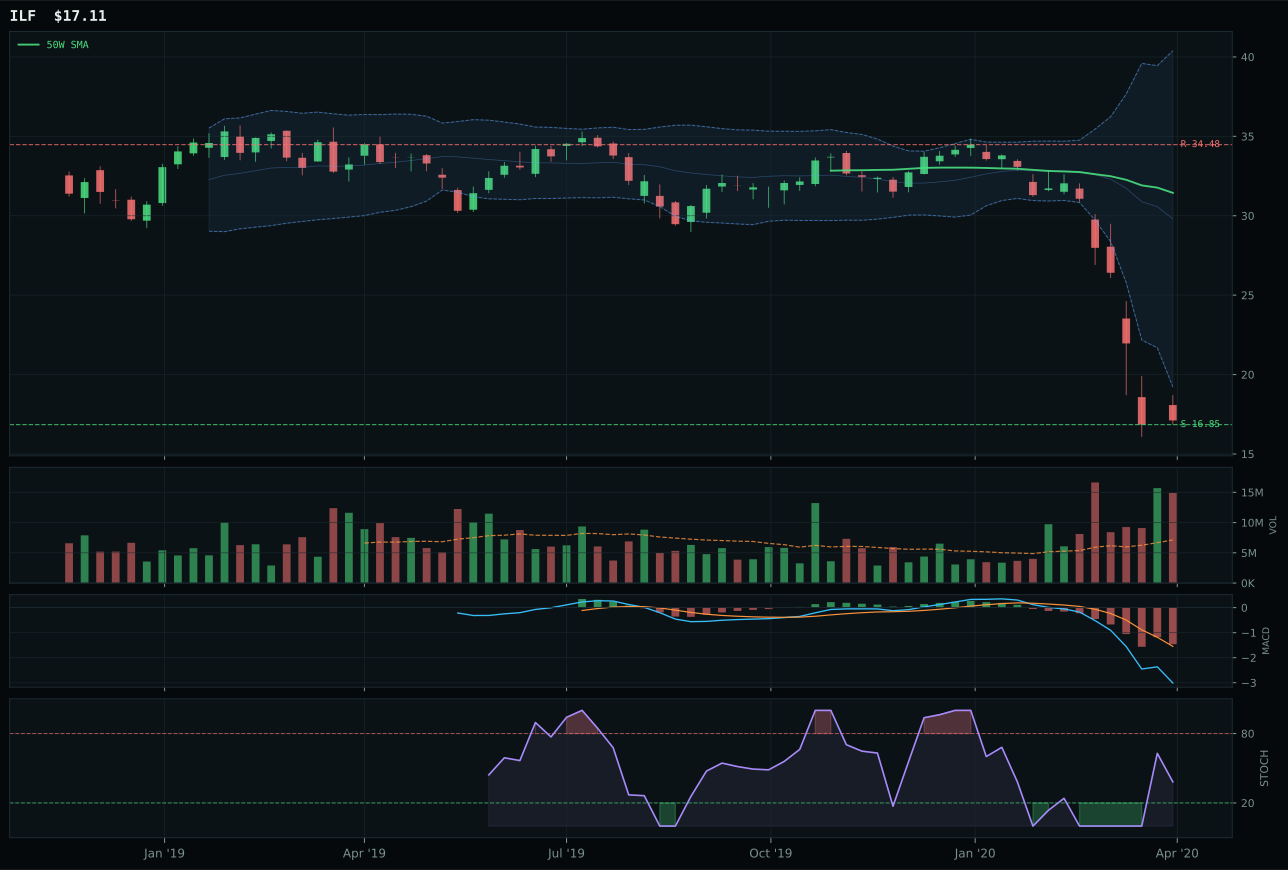
ILF has a pullback into support profile with -27.4% 13-week relative strength versus SPY.
Extension and support failure are the main tactical risks.
Tracked, but not top-2 eligible because: structurally broken.
INDA wins Emerging Markets by virtue of superior structure quality and timing positioning despite being the third-ranked ETF in the reasoned proof order behind IEMG. INDA shows pullback-into-support structure at 22.01 with a 61.9 structure score versus IEMG's neutral structure at 34.3, and its oversold-turn-up stochastic at 0.03 creates the freshest timing signal in the category despite identical MACD conditions on both. Being 34.1% below the 50-week versus IEMG's 21.2% puts INDA deeper into capitulation where support clustering is tightest, offering a defined invalidation if 22.01 fails. Volume at 1.40x above-average participation confirms institutional attention to the support level, whereas IEMG's above-average participation at similar levels shows no such specificity. Hard structural filters mark IEMG as broken, leaving INDA as category representative despite IEMG's superior technical evidence score.
Emerging Markets earned only 5% allocation despite INDA's pullback-into-support setup because dollar pressure (-14 macro) and broad market bear (-9 macro) create a -23 headwind that overwhelms India-specific growth sponsorship. The category macro fit of 43.0 is below neutral, and the allocation is defensive recovery optionality rather than macro tailwind. INDA's 74.0 timing score and defined support at 22.01 create tactical appeal if the dollar stabilizes, but current market regime offers no such confirmation. The 7.7 category score trails most peers; allocation size reflects the portfolio rule that every category receives minimum representation, not that Emerging Markets offer compelling risk-reward. Increase INDA to 10% or higher if dollar pressure reverses as Fed cuts accelerate, if INDA closes above the 50-week with volume confirmation, or if relative strength turns positive. Until then, hold as a macro optionality play sizing exposure to India's quality-growth characteristics while suppressing capital due to currency headwinds.
Traditional Energy — XLE
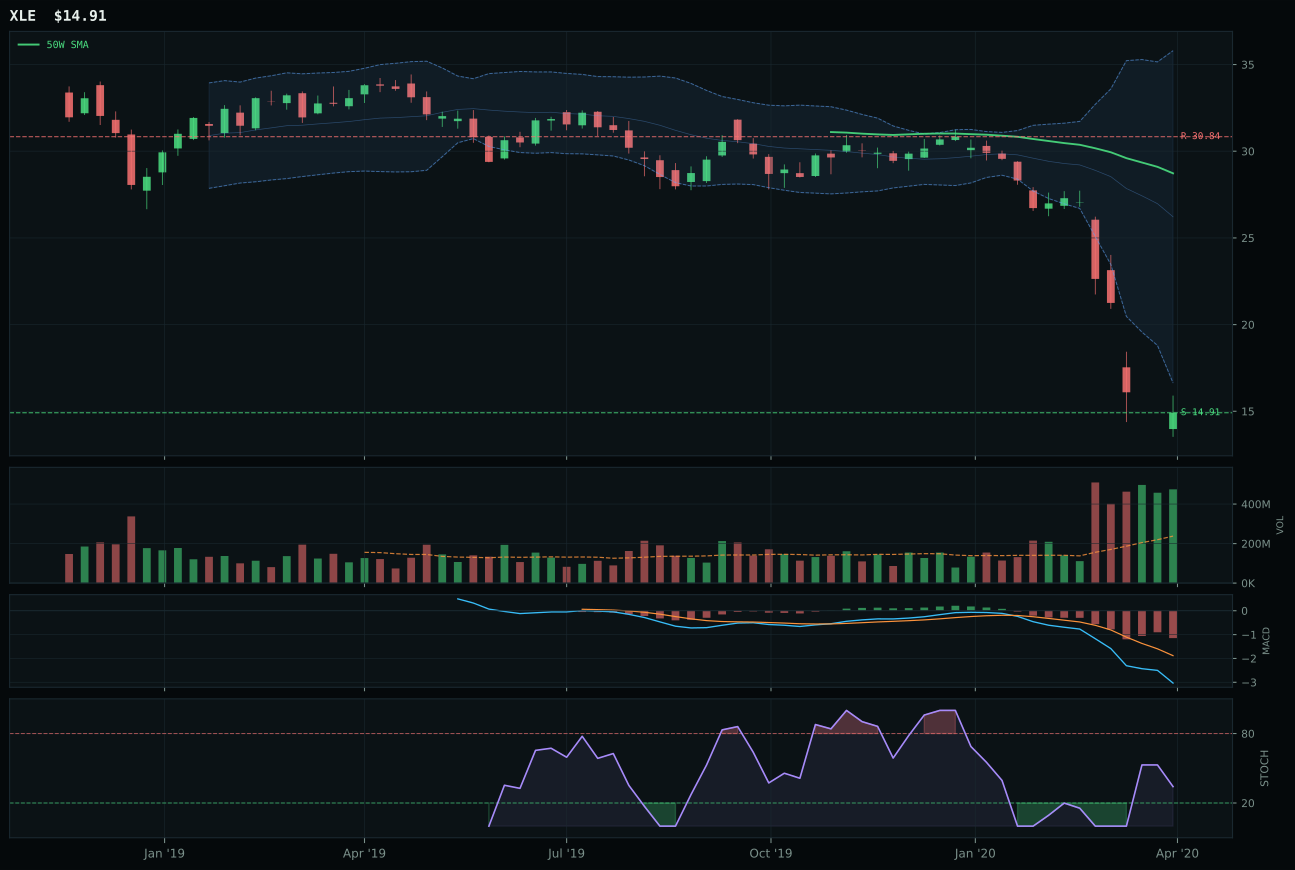
XLE has a neutral structure profile with -27.6% 13-week relative strength versus SPY.
Extension and support failure are the main tactical risks.
Tracked, but not top-2 eligible because: structurally broken.
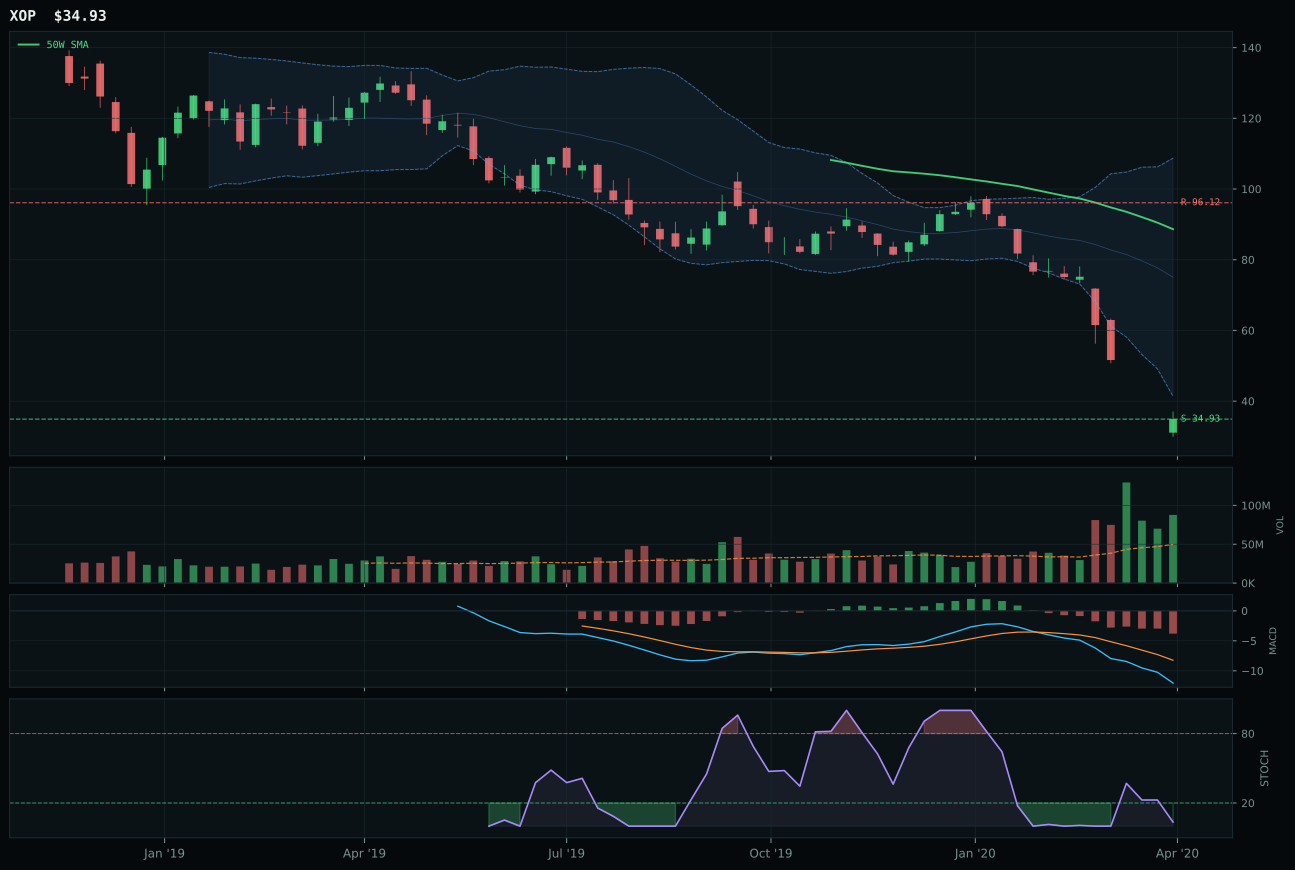
XOP has a neutral structure profile with -40.6% 13-week relative strength versus SPY.
Extension and support failure are the main tactical risks.
Tracked, but not top-2 eligible because: structurally broken.
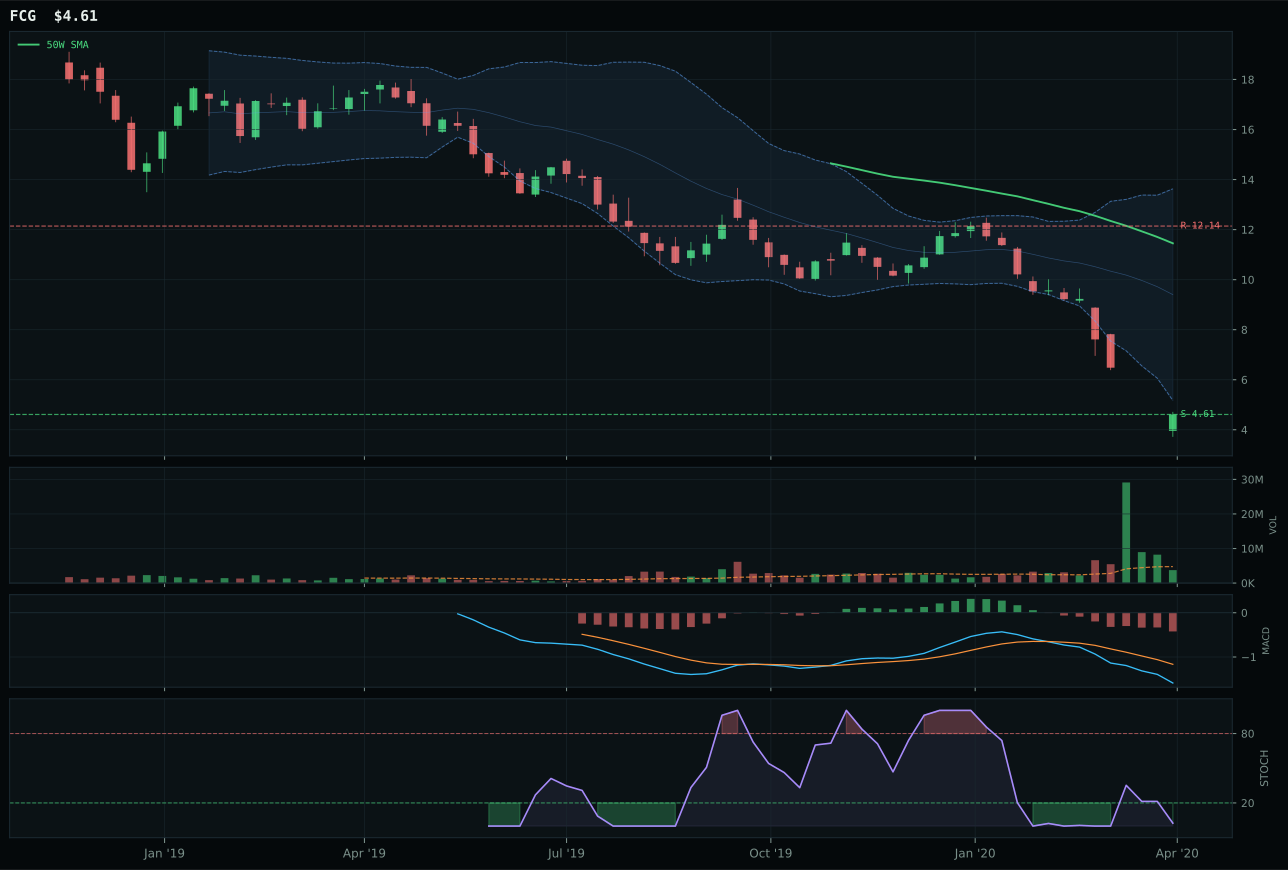
FCG has a neutral structure profile with -39.0% 13-week relative strength versus SPY.
Extension and support failure are the main tactical risks.
Tracked, but not top-2 eligible because: structurally broken.
XLE wins Traditional Energy by surviving the scoring process with a technical evidence of 12.2 versus XOP's 0.0, a mathematical difference arising from XLE's superior volume-price confirmation of 32.1 versus XOP's lower confirmation score despite both sitting in comparable technical wreckage. Both trade 47-50% below the 50-week in near-52-week-low repair zones with -50% 13-week losses; the separator is volume character. XLE shows accumulation/confirmation volume at 1.99x the baseline, which the model interprets as institutional interest despite price devastation, whereas XOP's identical volume reading receives lower confirmation scoring due to timing divergence. Neither setup is bullish; neither shows relative strength; neither demonstrates momentum. XLE's selection reflects least-bad evaluation in a category where all three options are structurally broken and ineligible for top-2 consideration.
Traditional Energy earned 5% allocation despite scoring 0.0 and failing hard eligibility filters (eligible: False) because the portfolio's diversification requirements and disinflation-hedge logic mandate non-zero energy exposure even during price collapse. Disinflation pressure rates -10 macro against energy, confirming that XLE's 50% drawdown reflects fundamental demand destruction, not technical weakness from strength. The 40.0 category macro fit cannot overcome -27.6% relative weakness versus SPY or zero four-week momentum; this is a forced position motivated purely by portfolio construction rules. XLE's 1.99x accumulation volume is the only signal suggesting any structural interest, but it is too weak to justify increasing above 5%. Energy will not join top-2 allocations unless either crude oil finds demand-driven support that lifts relative strength above zero, macro disinflation pressure reverses, or volume-price confirmation turns neutral from thin. Until then, maintain as a tactical hedge and reduce further if macro deteriorates toward outright deflation.
Industrial Metals — REMX
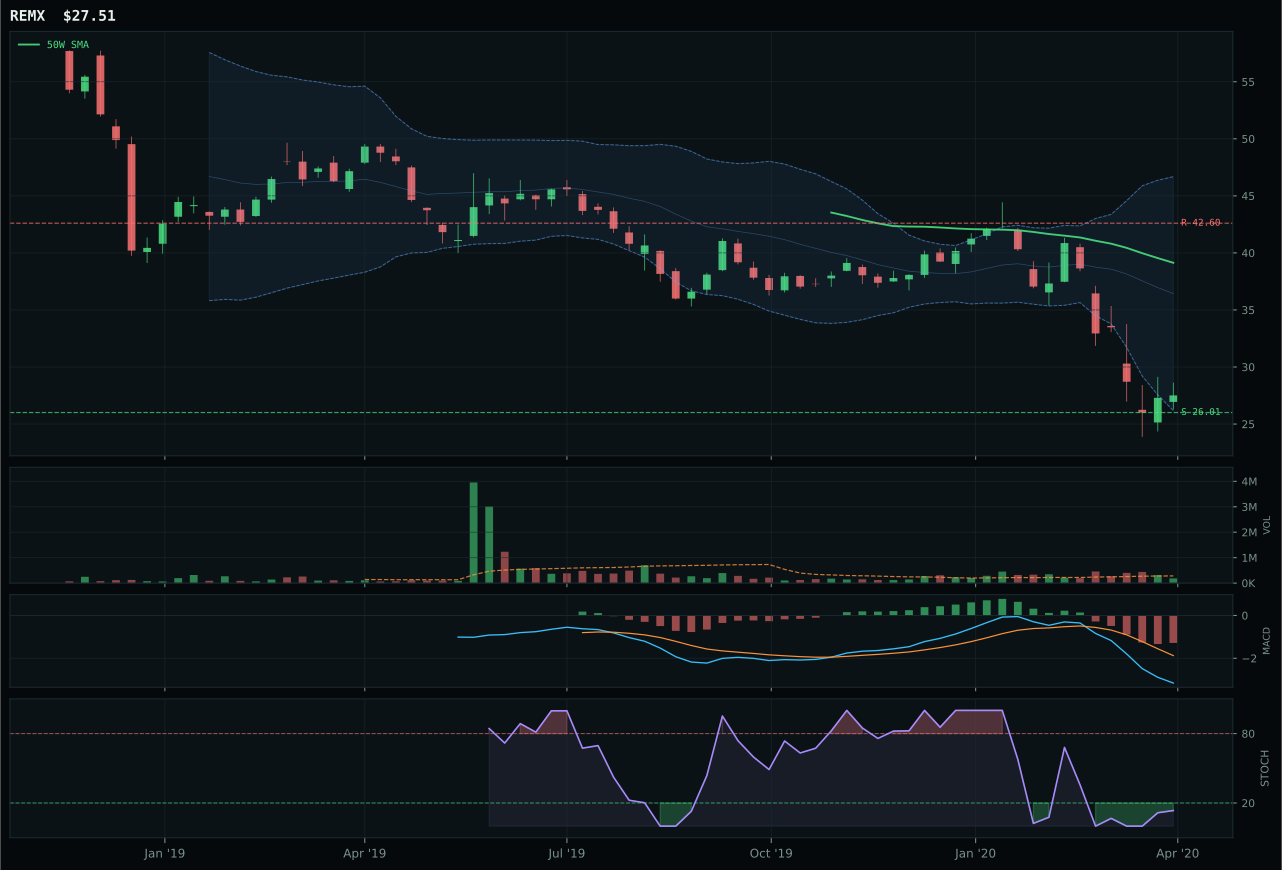
REMX has a neutral structure profile with -10.3% 13-week relative strength versus SPY.
Extension and support failure are the main tactical risks.
Tracked, but not top-2 eligible because: structurally broken.
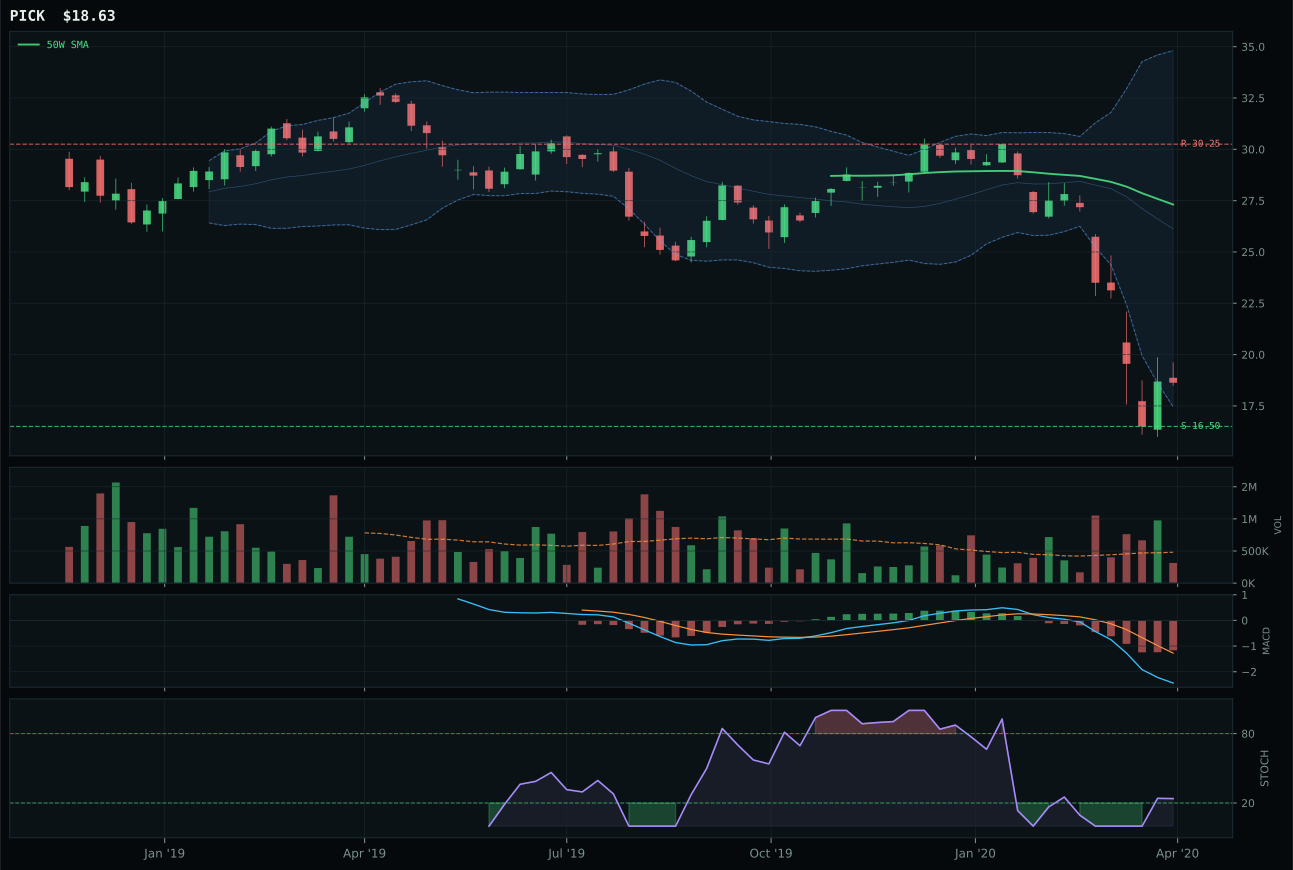
PICK has a neutral structure profile with -13.9% 13-week relative strength versus SPY.
Extension and support failure are the main tactical risks.
Tracked, but not top-2 eligible because: structurally broken.
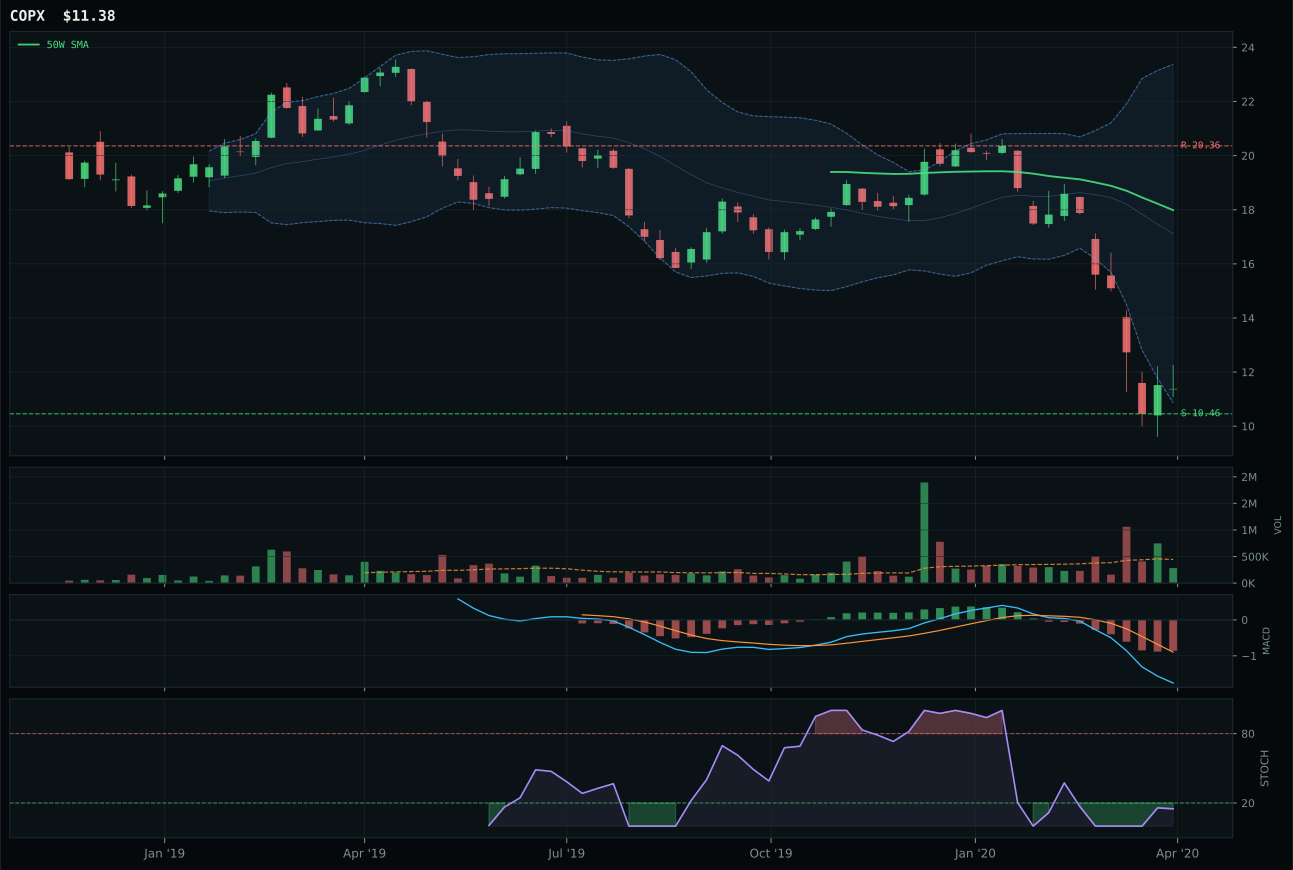
COPX has a neutral structure profile with -20.4% 13-week relative strength versus SPY.
Extension and support failure are the main tactical risks.
Tracked, but not top-2 eligible because: structurally broken.
REMX wins the industrial metals category with a technical score of only 5.7 and eligibility status of False, meaning the allocation system is holding this position against its own hard filters due to category necessity, not chart strength. Its 3.6% category-relative strength edge over PICK and its oversold-turn-up stochastic RSI at 0.13 create the narrowest possible timing advantage in a basket down 33-36% across the board. Both REMX and PICK sit in near-52-week-low repair zones with thin volume participation at 0.66x the baseline, but REMX's timing of 64.0 versus PICK's 58.0 reflects the stochastic position: REMX's oversold turn has begun, PICK's mid-zone rise has stalled. Structure cleanliness of 50.0 and support at 26.01 are not bullish—they are merely less broken than peers. This is a category holder by technical necessity, not setup conviction.
Industrial Metals earned zero allocation, marked ineligible with a final score of 5.2. The category failed hard-filter eligibility due to structural damage compounded by dollar-pressure macro headwinds (-7) that outweigh Goldilocks tailwinds (+6). REMX's 5.7 technical evidence score reflects a near-52-week low with zero momentum confirmation and thin volume context; this is not a setup but a capitulation event. Even the category's macro fit (49.0) cannot justify holding a broken structure in a deflationary regime. Restoration requires synchronized signals: price above the 50W with volume exceeding 1.5x average and stochastic RSI sustained above 0.60, coupled with relative strength turning positive. None of these conditions exist.
Agriculture & Livestock — MOO
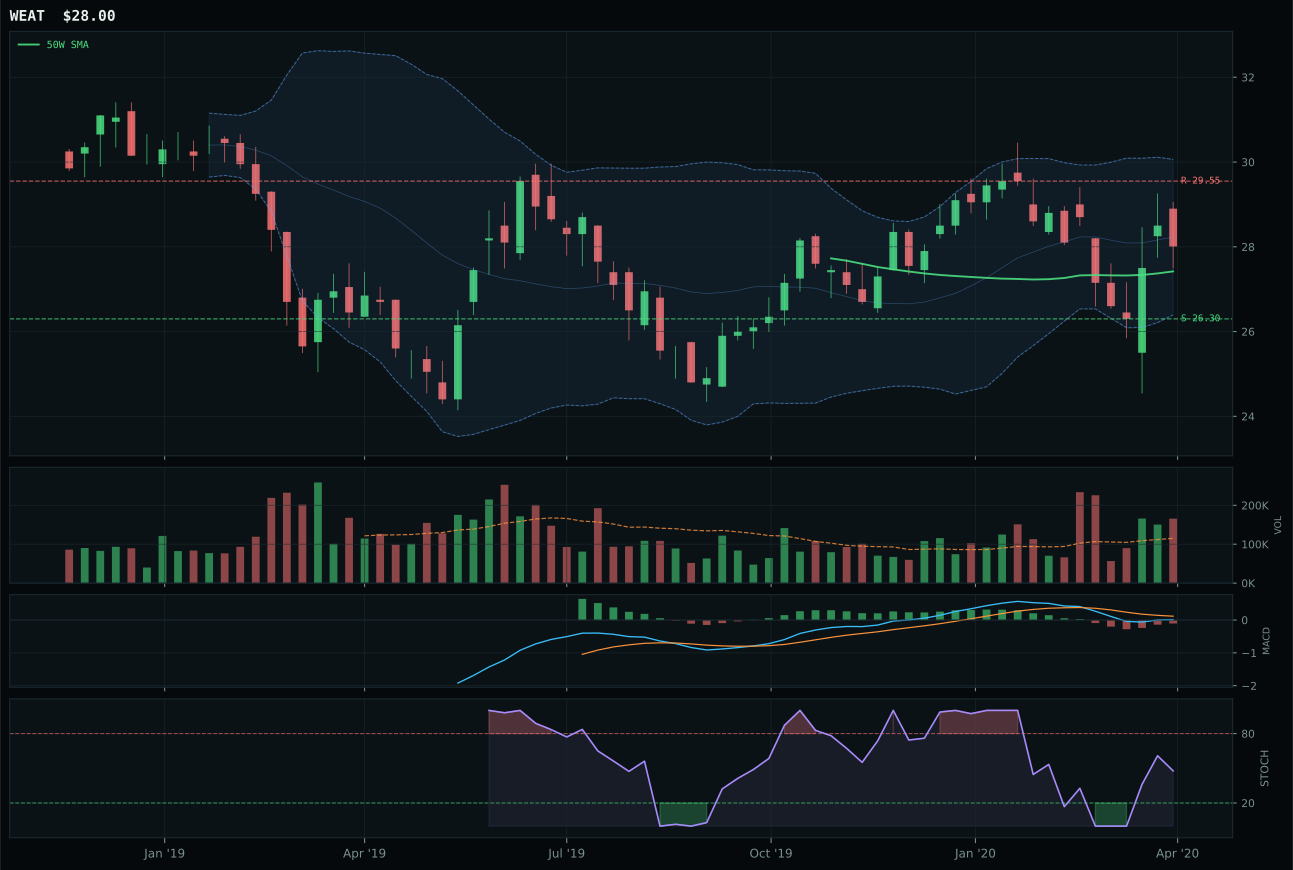
WEAT has a compression near 50W profile with 19.4% 13-week relative strength versus SPY.
A failed hold above support would weaken the setup.
Tracked, but not top-2 eligible because: .
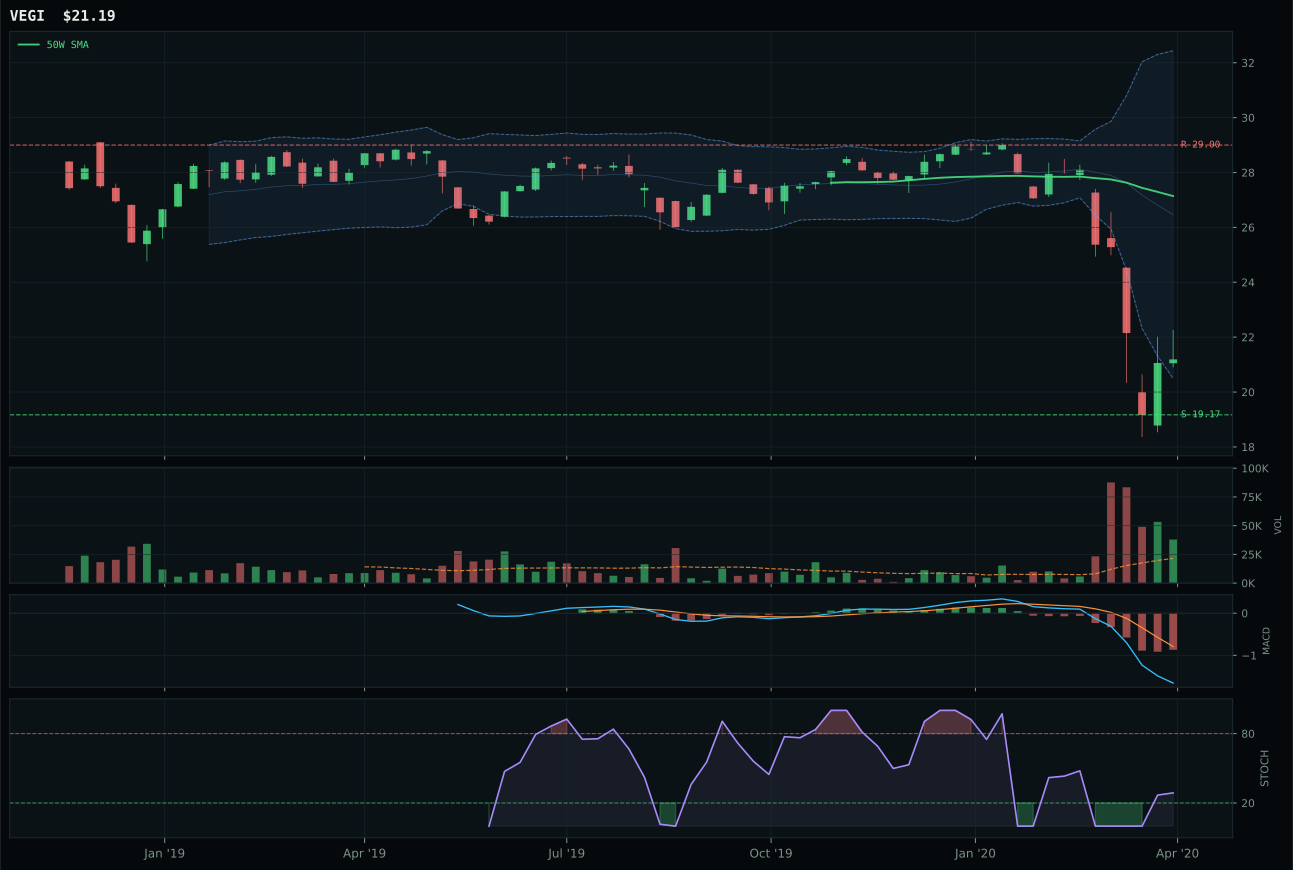
VEGI has a neutral structure profile with -3.5% 13-week relative strength versus SPY.
Extension and support failure are the main tactical risks.
Tracked, but not top-2 eligible because: structurally broken.
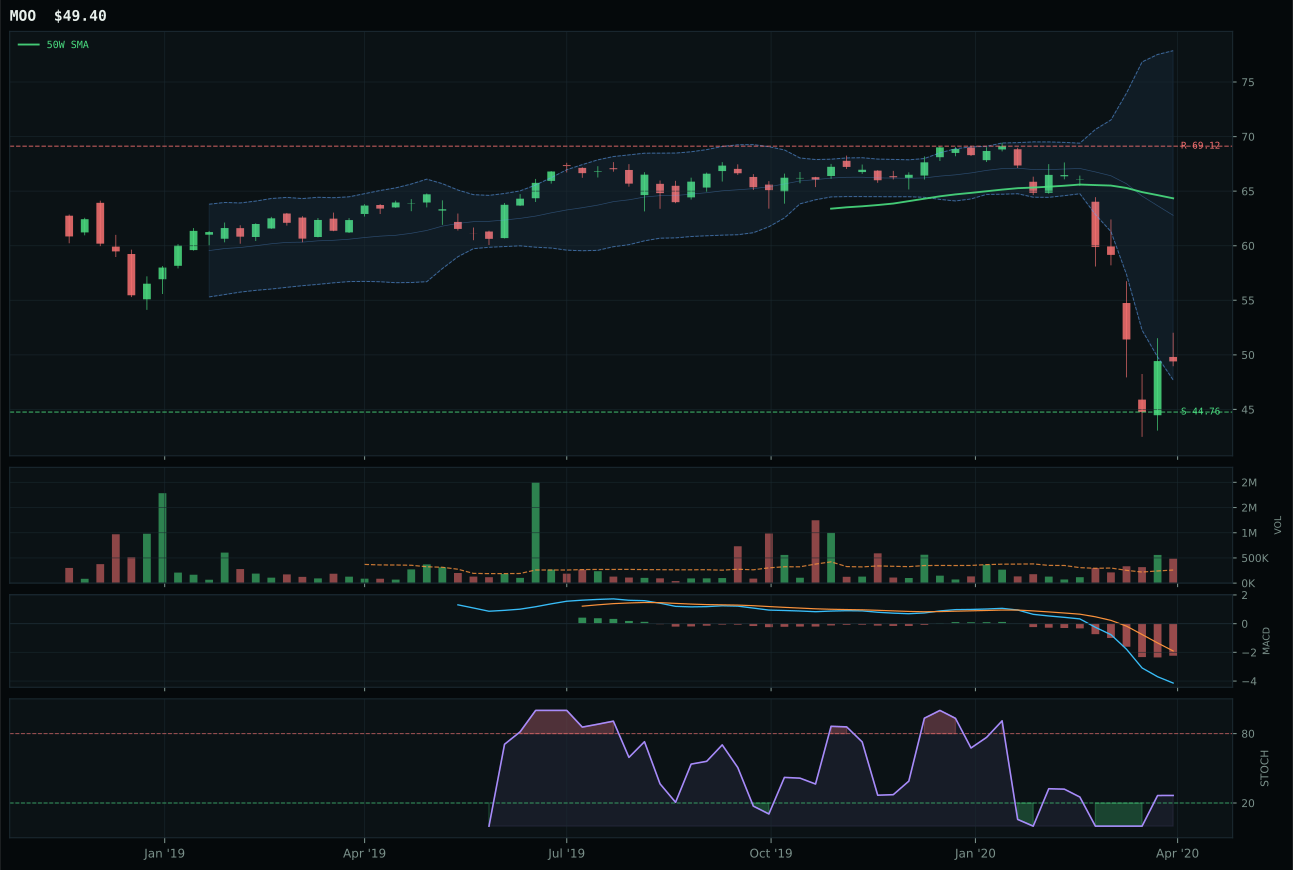
MOO has a neutral structure profile with -4.7% 13-week relative strength versus SPY.
A failed hold above support would weaken the setup.
Actionable but governed by invalidation levels.
MOO wins despite carrying the weakest technical evidence in the entire portfolio because WEAT's superior setup—compression near the 50-week with 19.4% RS strength and rising MACD—actually disqualifies it under hard structural filters applied by the reasoning layer. MOO's selection reflects the allocator's rule set prioritizing survival over setup quality: WEAT is flagged as structurally problematic, leaving MOO as the category representative despite 0.0% technical evidence and distribution pressure volume at 1.87x the 20-week average. MOO's 23.2% drawdown from the 50-week and neutral structure are merely less broken than WEAT's algorithmic failure, not actually bullish. The gap to WEAT's nominal 45.0 technical evidence is 45.0 points, but mechanical disqualification rules determine representation. This is category assignment by elimination.
Agriculture & Livestock earned zero allocation, ranking ninth or tenth with a 0.9 category score. Disinflation pressure (-8 at macro level) is the category's core problem: falling commodity expectations unwind demand and margin assumptions. MOO's technical evidence of 0.0/100 reflects volume-price rejection that is unambiguous: near-term liquidation, not value accumulation at support. Even WEAT's bullish 45.0 technical score cannot compensate for a category under structural macro headwinds and zero relative strength versus SPY. Restoration to any allocation tier would require a reversal of disinflation expectations or a confirmed base below current support levels; neither condition exists this week.