
2020-03-27
Informational purposes only. The content in this report, including allocations, analysis, and commentary, is provided solely for informational and educational purposes. It does not constitute financial advice, investment advice, trading advice, or any other type of advice. Past performance does not guarantee future results. Always conduct your own research and consult a qualified financial professional before making investment decisions.
Some tracked tickers were excluded due to missing live weekly price data: SGOV: Historical cache SGOV has only 0 usable weekly bars; URNM: Historical cache URNM has only 17 usable weekly bars
XLE defensive overlay excluded: price is below its 8W SMA. Cause selector will use GLD or cash alternative.
Fast-crash circuit breaker triggered: SPY dropped more than 8% from its 4-week high this week. Defensive overlay activated immediately.
Macro risk engine requires the 50% Defensive overlay for this run; payload selected by cause: Monetary Defense.
Weekly Allocation
| Ticker | Category | Weight | Role |
|---|---|---|---|
| GLD | Precious Metals | 55% | Overlay |
| CIBR | Technology | 10% | Top-2 (10%) |
| SMH | AI | 10% | Top-2 (10%) |
| XLU | Utilities & Infrastructure | 5% | Tier-2 (5%) |
| INDA | Emerging Markets | 5% | Tier-2 (5%) |
| NLR | Nuclear Energy | 5% | Tier-2 (5%) |
| XAR | Defense & Aerospace | 5% | Tier-2 (5%) |
| XLE | Traditional Energy | 5% | Tier-2 (5%) |
Trade Instructions — Monday Open
Sell the tranche from 2020-02-28 (completing its 4-week hold). Buy the new tranche. Instructions show net portfolio changes — same-asset positions cancel, weight changes show the delta.
| Action | Ticker | Instruction |
|---|---|---|
| SELL | FBTC | Sell 50% of FBTC position (reduce 25.00% → 12.50%) |
| SELL | IGV | Sell 50% of IGV position (reduce 5.00% → 2.50%) |
| SELL | ILF | Sell entire ILF position (1.25% of portfolio) |
| SELL | IGF | Sell entire IGF position (1.25% of portfolio) |
| SELL | URA | Sell 33% of URA position (reduce 3.75% → 2.50%) |
| SELL | MOO | Sell 25% of MOO position (reduce 5.00% → 3.75%) |
| BUY | GLD | Buy GLD — 62.50% of freed cash (adds 12.50% to portfolio) |
| BUY | XLU | Buy XLU — 6.25% of freed cash (adds 1.25% to portfolio) |
| BUY | NLR | Buy NLR — 6.25% of freed cash (adds 1.25% to portfolio) |
| BUY | INDA | Buy INDA — 6.25% of freed cash (adds 1.25% to portfolio) |
| BUY | CIBR | Buy CIBR — 12.50% of freed cash (adds 2.50% to portfolio) |
| BUY | XLE | Buy XLE — 6.25% of freed cash (adds 1.25% to portfolio) |
Current Portfolio After Trade
Combined holdings across all 4 active tranches. Each tranche is 25% of the portfolio.
| Ticker | % of Portfolio | Weight Bar |
|---|---|---|
| GLD | 27.50% | |
| FBTC | 12.50% | |
| XLU | 12.50% | |
| SGOV | 10.00% | |
| SMH | 6.25% | |
| XAR | 5.00% | |
| XLK | 5.00% | |
| MOO | 3.75% | |
| INDA | 3.75% | |
| URA | 2.50% | |
| IGV | 2.50% | |
| IEMG | 2.50% | |
| NLR | 2.50% | |
| CIBR | 2.50% | |
| XLE | 1.25% |
Macro Regime — Goldilocks
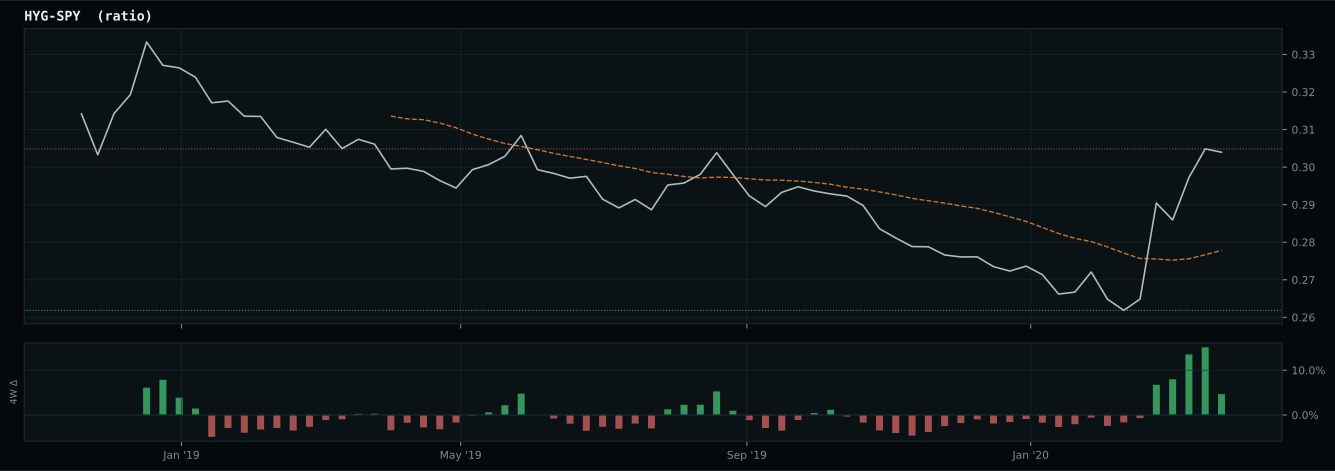
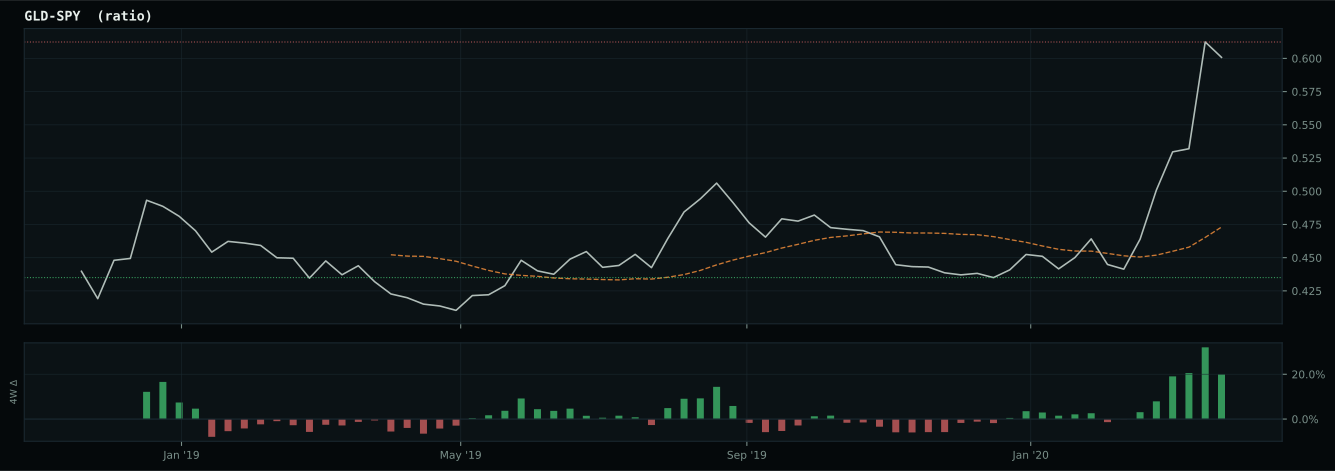
Defensive overlay cause is falling-growth or disinflation stress: gold is favored because falling real-yield pressure and monetary hedging are more relevant than cyclical commodity demand. GLD has been confirmed above its 8W SMA and is eligible.
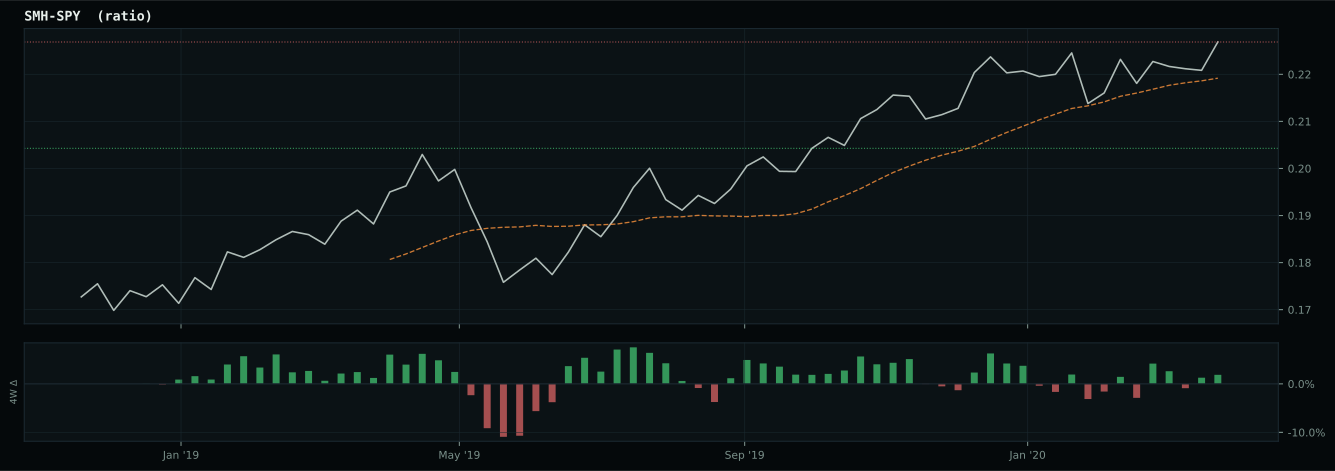
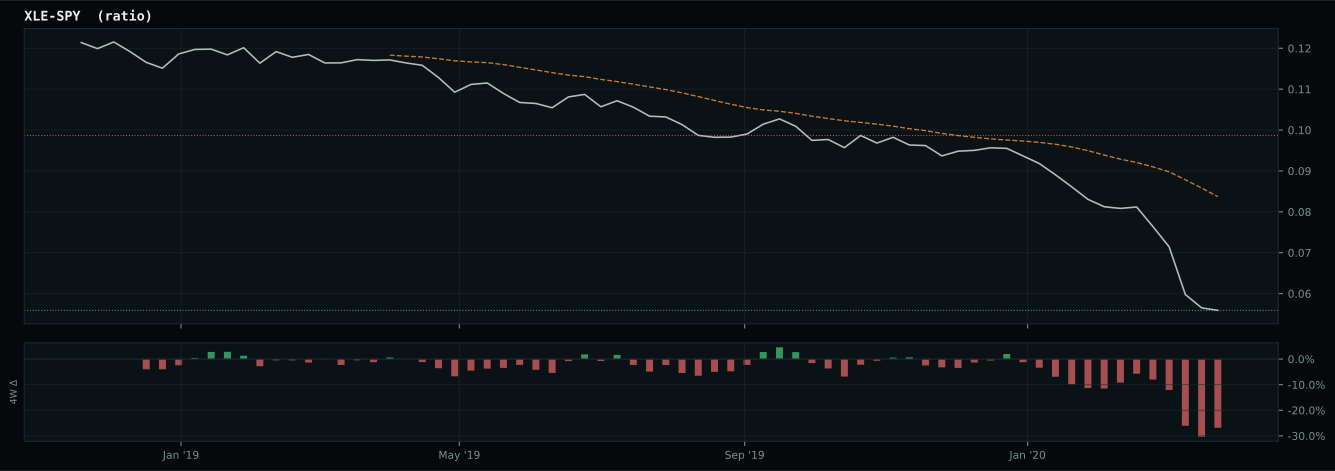
Macro Evidence Charts
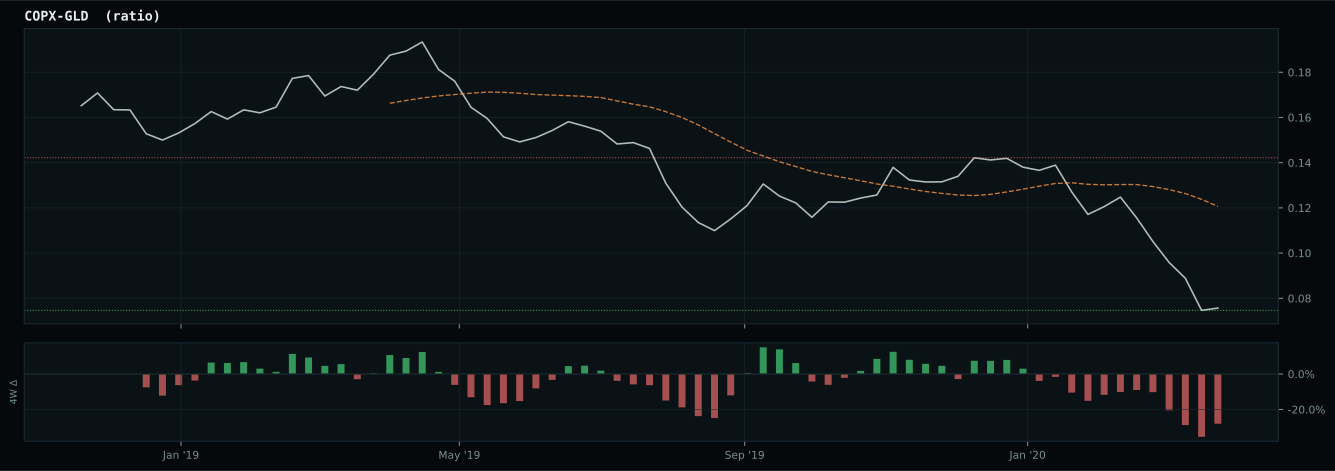
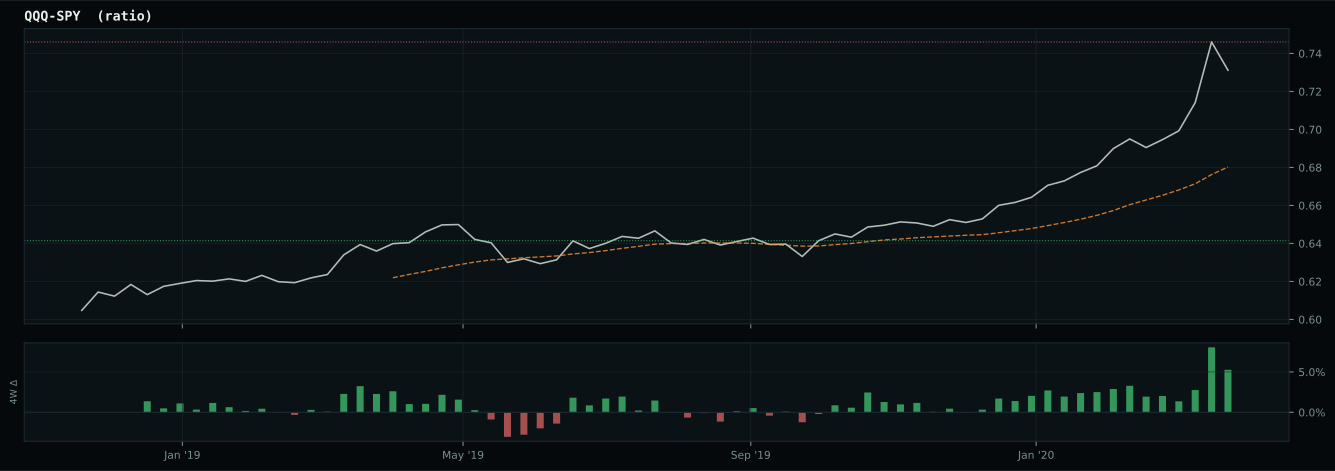
Market-implied signals behind the macro regime scores. Each ratio compares two assets; the direction and slope of the ratio is what the macro engine reads.
Crypto Regime — NoCrypto
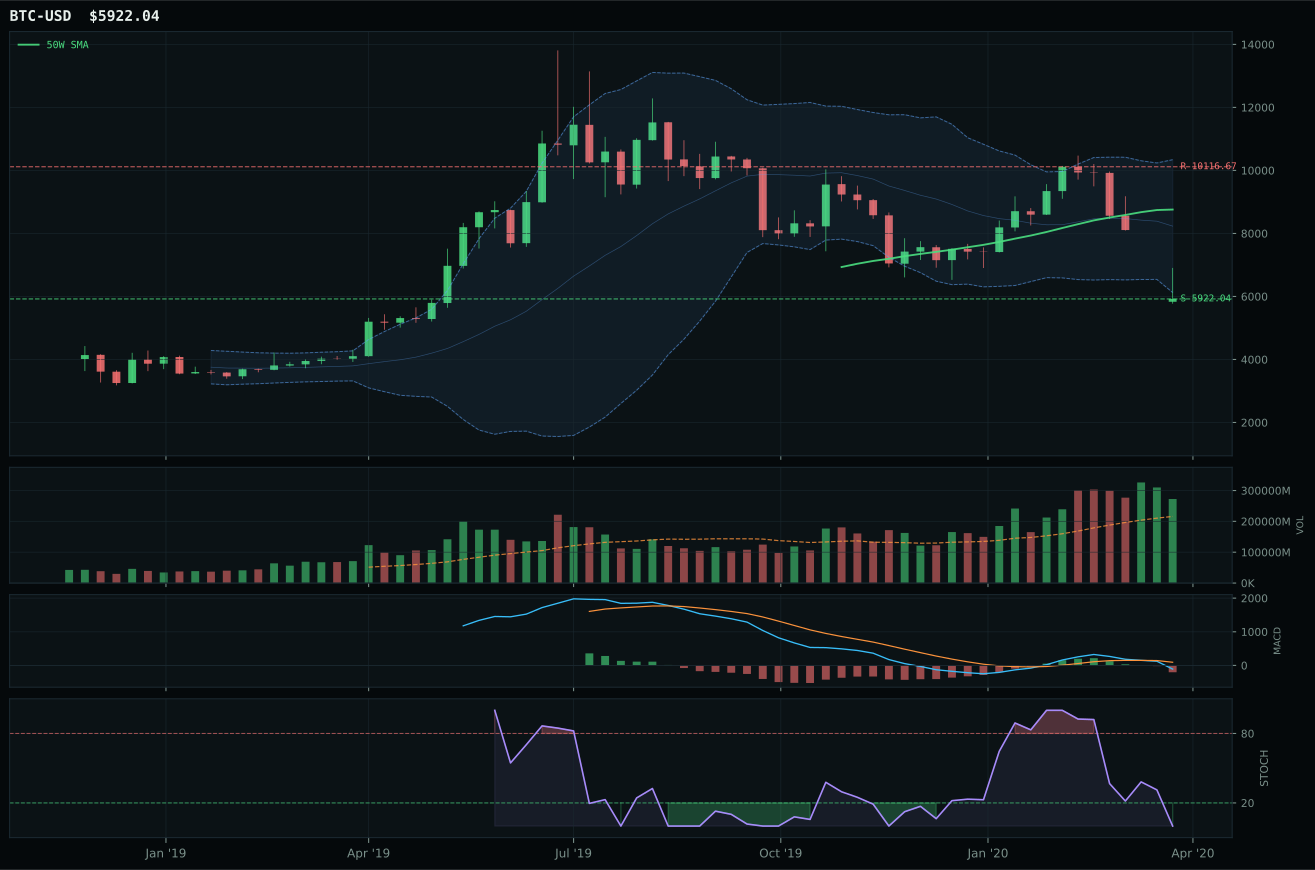
ValueBTC armed by first 200W buy-zone touch, but post-touch range age is 2 weeks; minimum is 12
TrendBTC not confirmed
one or more available conditions failed

Category Rankings
| Rank | Category | Winner | Score | Alloc | 4W Ret | Peers (4W) |
|---|---|---|---|---|---|---|
| 1 | Technology | CIBR | 55.4 | 20% | +11.42% | XLK +12.3% · IGV +13.0% |
| 2 | AI | SMH | 45.5 | 20% | +13.75% | AIQ +13.3% · BOTZ +8.8% |
| 3 | Precious Metals | GLD | 38.4 | 10% | +6.21% | GDX +39.2% · SLV +8.8% |
| 4 | Utilities & Infrastructure | XLU | 36.6 | 10% | +4.45% | IGF +6.7% · PAVE +10.5% |
| 5 | Emerging Markets | INDA | 27.5 | 10% | +12.15% | IEMG +8.0% · ILF -2.7% |
| 6 | Nuclear Energy | NLR | 23.4 | 10% | +7.83% | URA +31.6% |
| 7 | Defense & Aerospace | XAR | 22.6 | 10% | -1.13% | ROKT +6.5% · ITA +0.7% |
| 8 | Industrial Metals | REMX | 9.8 | 10% | +11.32% | PICK +8.4% · COPX +21.7% |
| 9 | Agriculture & Livestock | MOO | 1.6 | 0% | +9.09% | WEAT -6.9% · VEGI +9.8% |
| 10 | Traditional Energy | XLE | — | 0% | +22.93% | XOP +48.6% · FCG +65.8% |
Technology — CIBR
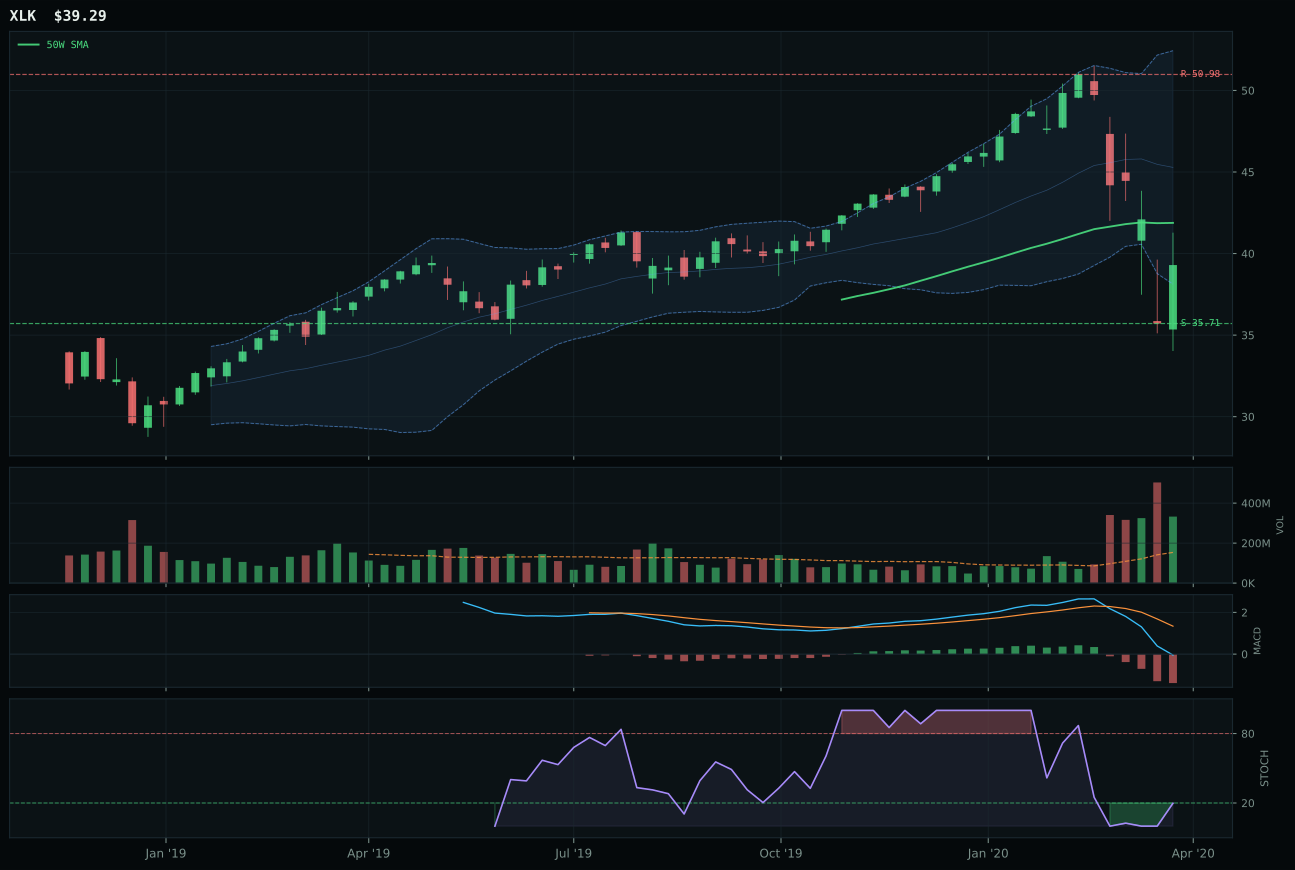
XLK has a neutral structure profile with 7.0% 13-week relative strength versus SPY.
A failed hold above support would weaken the setup.
Actionable but governed by invalidation levels.
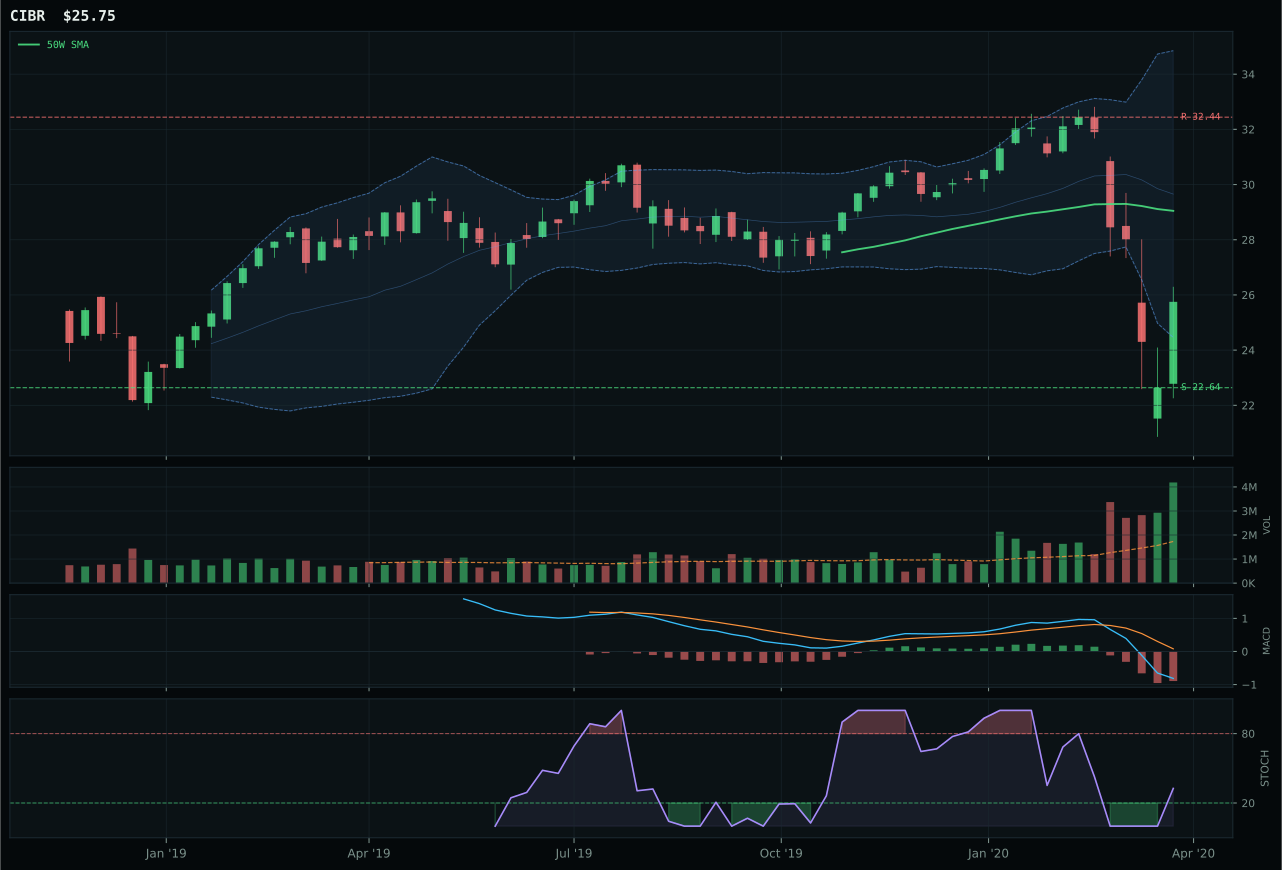
CIBR has a neutral structure profile with 6.9% 13-week relative strength versus SPY.
A failed hold above support would weaken the setup.
Actionable but governed by invalidation levels.
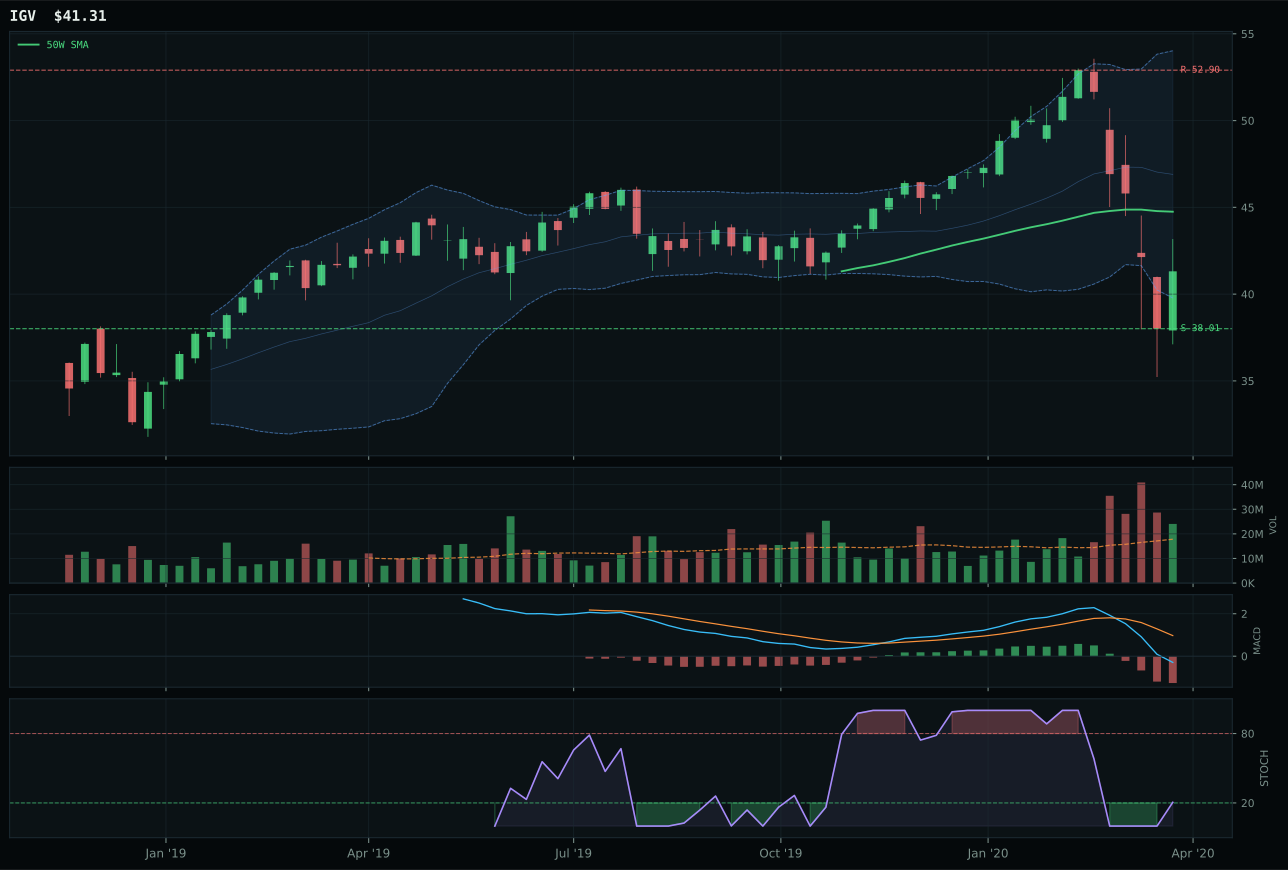
IGV has a neutral structure profile with 9.4% 13-week relative strength versus SPY.
A failed hold above support would weaken the setup.
Actionable but governed by invalidation levels.
CIBR edged XLK by securing a 19.7-point score advantage despite identical neutral structure and near-parity relative strength at 6.9% versus 7.0% against SPY. The cybersecurity ETF's edge stems from superior risk-reward geometry: 85.0 versus 76.1, reflecting 13.7% downside cushion to support versus XLK's deeper value zone placement. Timing proved decisive—CIBR's stochastic RSI at 0.33 mid-zone rises cleanly, while XLK has already turned up from oversold, leaving fewer unexecuted buyers below. Both carry -14% to -15% thirteen-week losses and bearish MACD signatures, yet CIBR's positioning 11.4% below the 50W against XLK's 6.2% places it in genuine reset territory rather than late-stage mean reversion. Volume accumulation at 2.42x the twenty-week average confirms institutional accumulation is present.
Technology's 55.4 category score earned the first 10% allocation slot because macro alignment and technical evidence converged decisively. Goldilocks regime adds nine points, liquidity expansion signals AI growth sponsorship at fourteen points, and the defensive rotation already in motion supports the cybersecurity subtheme positioning. At 62% technical weight against 38% macro, the category leans on real price structure: the reasoned ETF basket weighted CIBR at only 1/6 due to weakest technical evidence among the three, yet the final category score of 55.4 elevated it after testing for leadership quality, volume-price sponsorship, and persistence. The broad technology basket's 79.0 macro fit and three active macro descriptors favor tactical exposure here, though momentum confirmation scores across the basket remain suppressed below thirty. XLK's superior trend score of 77 and XLK's own macro fit at 64% shows the category works only when taking the weaker technical setup paired with the strongest macro narrative—a trade the allocator accepts given liquidity expansion and disinflation pressure are both confirmed active.
AI — SMH
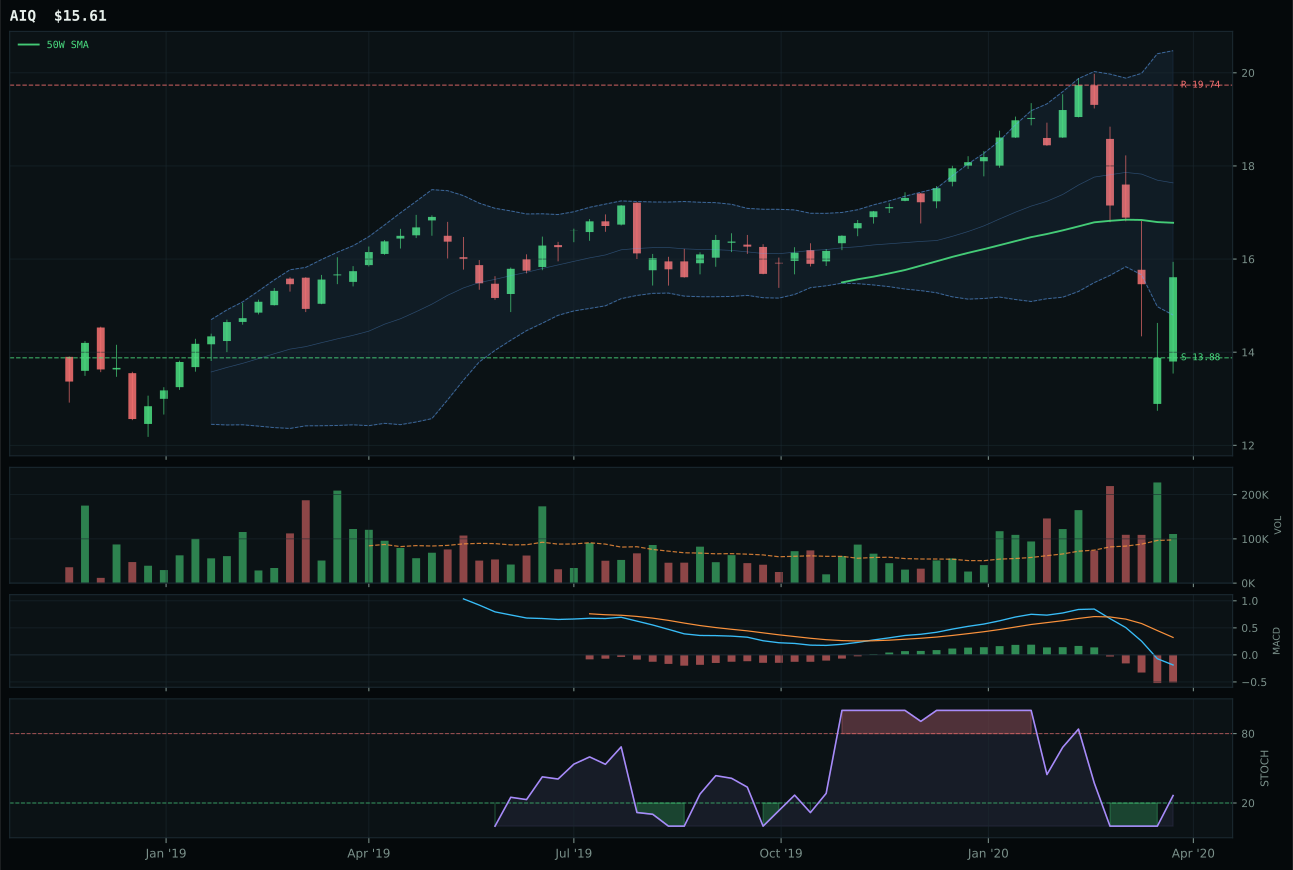
AIQ has a neutral structure profile with 7.8% 13-week relative strength versus SPY.
A failed hold above support would weaken the setup.
Tracked, but not top-2 eligible because: .
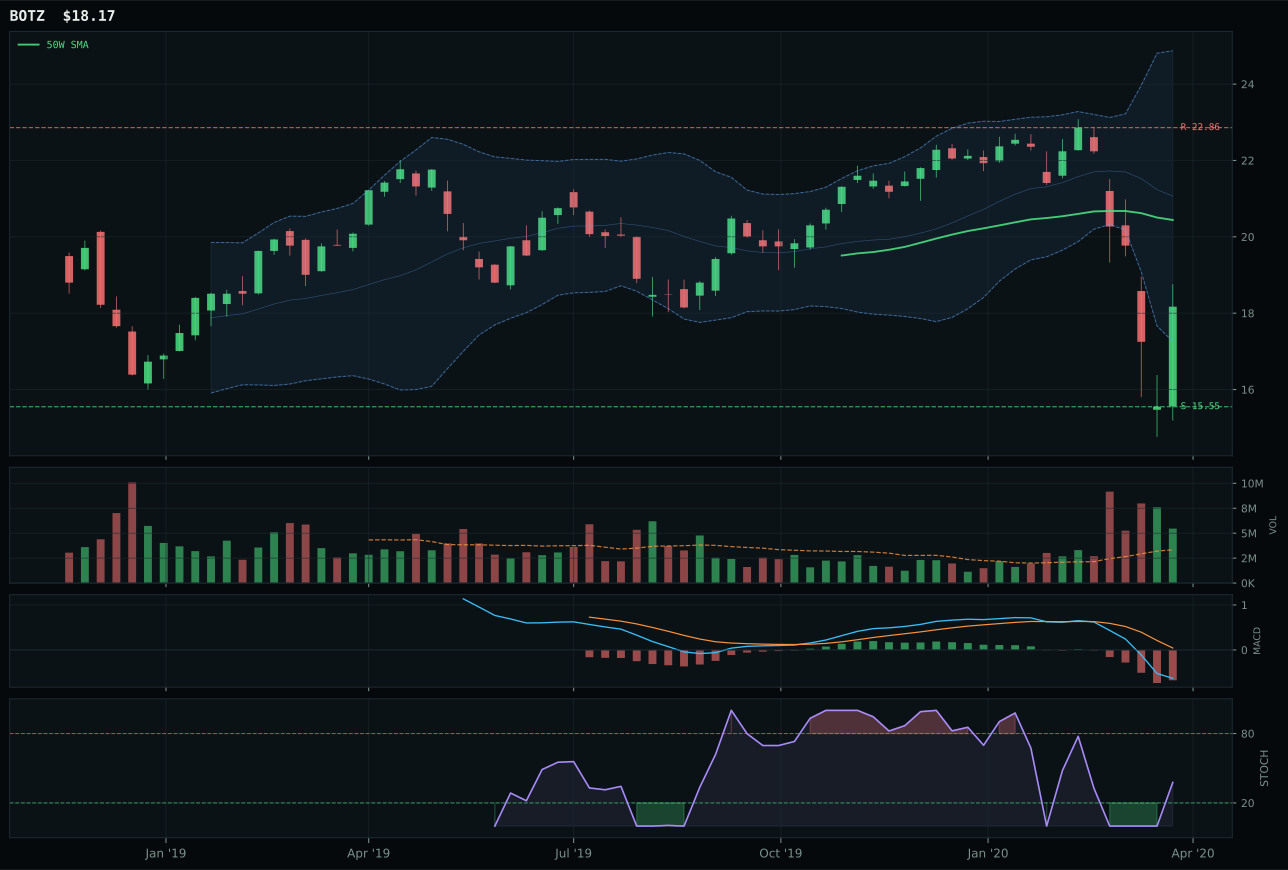
BOTZ has a neutral structure profile with 3.7% 13-week relative strength versus SPY.
A failed hold above support would weaken the setup.
Actionable but governed by invalidation levels.
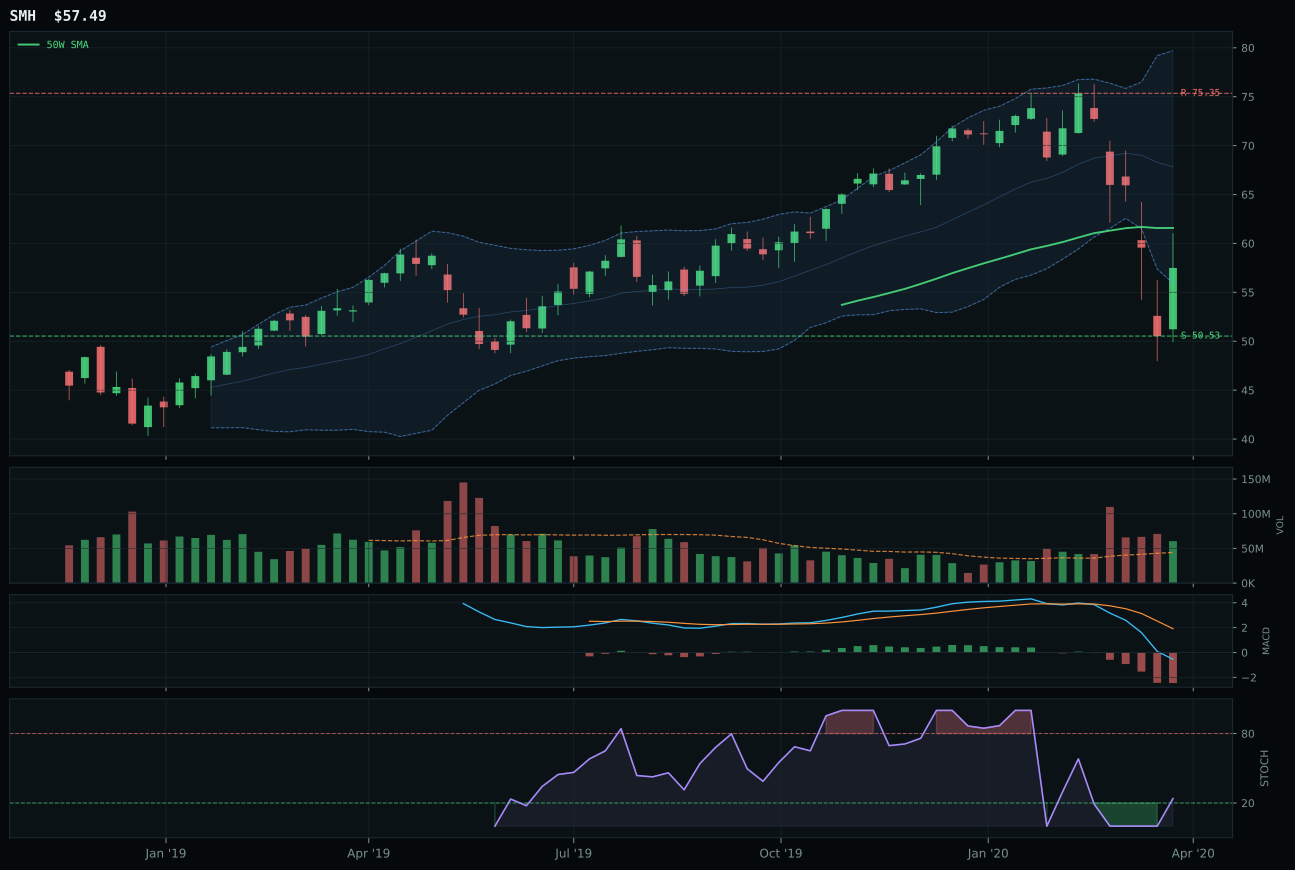
SMH has a neutral structure profile with 2.3% 13-week relative strength versus SPY.
A failed hold above support would weaken the setup.
Actionable but governed by invalidation levels.
SMH captured the second 20% slot with a 14.8-point margin over AIQ by winning on timing alone—85.0 versus 78.0—despite AIQ's superior trend score of 37 against SMH's 32. The semiconductor ETF sits deeper in value at the 0.618 Fibonacci zone near 58.81, placing it in authentic repair territory with only 5% downside to support and 23.7% upside to resistance. Stochastic RSI at 0.24 mid-zone is earlier in its reversion cycle than AIQ's equivalent reading, and the -19.2% thirteen-week drawdown combined with 2.3% relative strength against SPY establishes a cleaner contrarian setup. AIQ's seven-point RS advantage over SPY (7.8% versus 2.3%) paradoxically works against it: every recent buyer paid higher, and the software suite lacks the capitulation depth of semiconductor supply-chain exposure. Both carry 1.6/2.0 momentum confirmation scores, reflecting genuine bottom-building rather than early recovery claims.
AI's 45.5 category score qualified as the second 10% allocation because Goldilocks plus AI growth sponsorship at fourteen points created the highest macro fit score in the 10-category set at 76.0. Technical evidence weakness—only 13.5% for SMH—is overcome by 70.0 macro/narrative fit, proving the category works on macro sponsorship rather than price strength. Broad market bear active at minus eight points creates a headwind, yet AI growth sponsorship's fourteen-point boost overrides it. The 3/2/1 reasoned ETF proof order started at BOTZ (45.4), AIQ (45.0), and SMH (31.4), demonstrating no clear leader on pure technicals; only after macro descriptor weighting and category coherence testing did SMH rise to representative status. This is a conviction macro trade masked as a technical selection—the portfolio accepts weak price momentum and sub-thirty volume-price confirmation because liquidity expansion and AI growth sponsorship are both confirmed, and the Goldilocks regime creates zero duration risk for holding semiconductor weakness.
Precious Metals — GLD
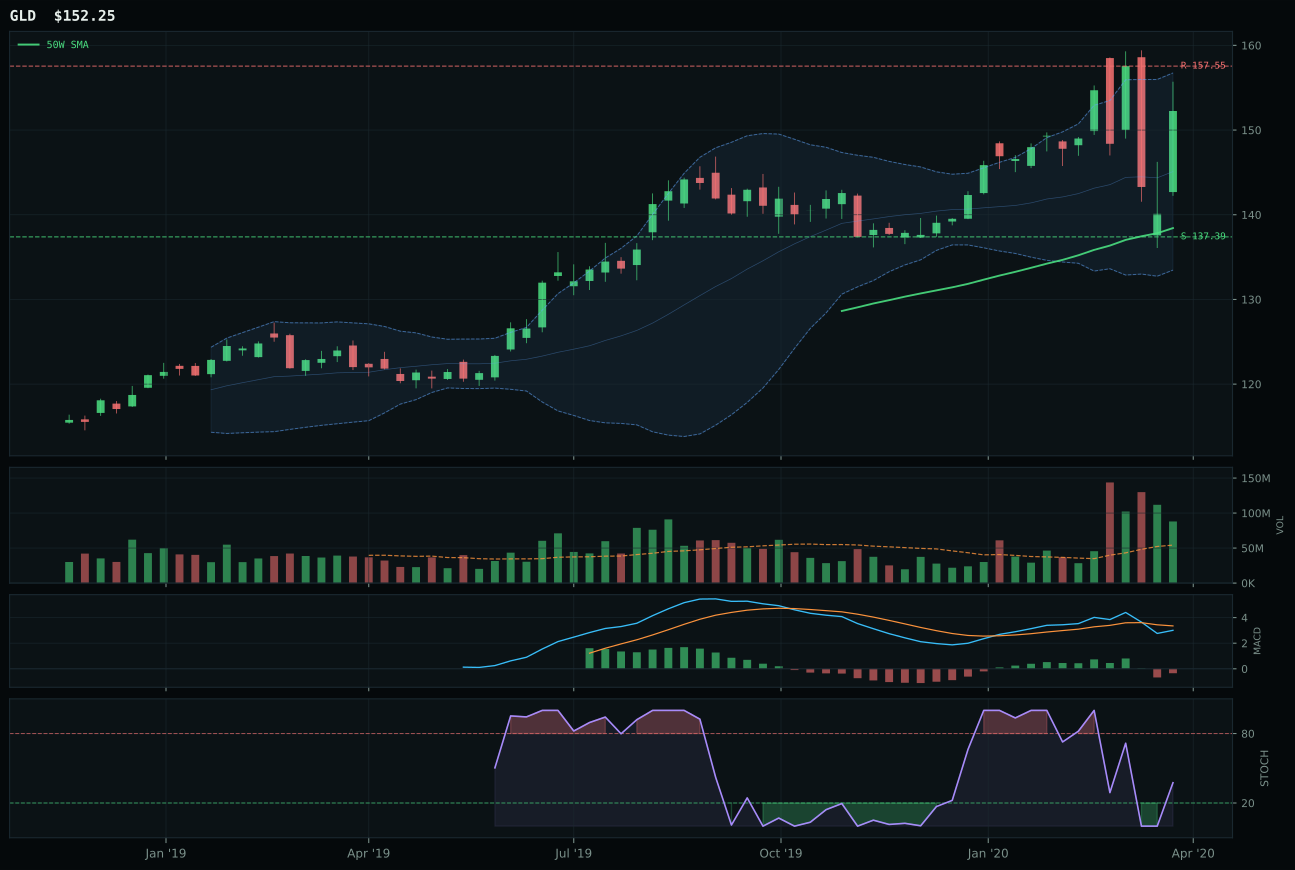
GLD has a neutral structure profile with 28.5% 13-week relative strength versus SPY.
A failed hold above support would weaken the setup.
Actionable but governed by invalidation levels.
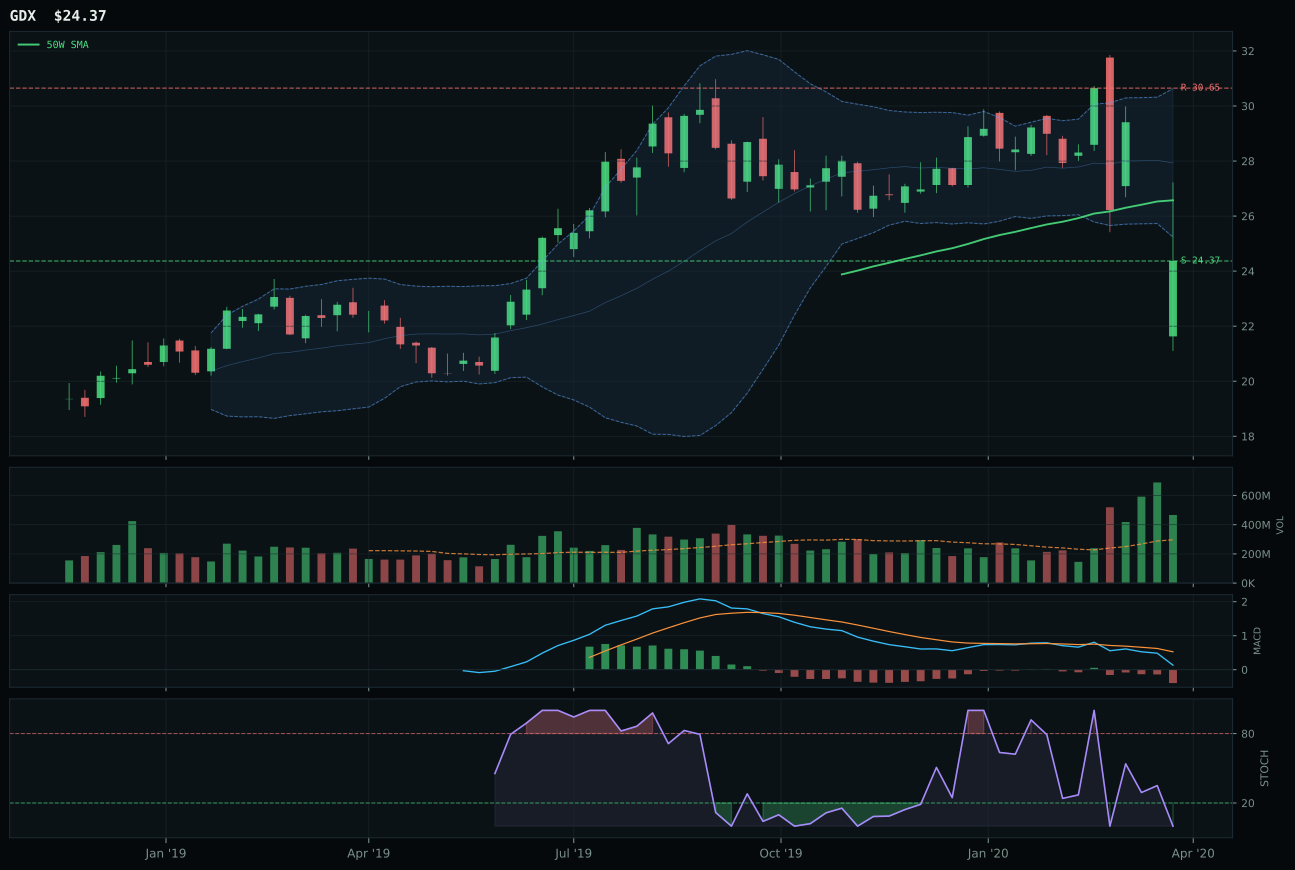
GDX has a neutral structure profile with 5.9% 13-week relative strength versus SPY.
A failed hold above support would weaken the setup.
Actionable but governed by invalidation levels.
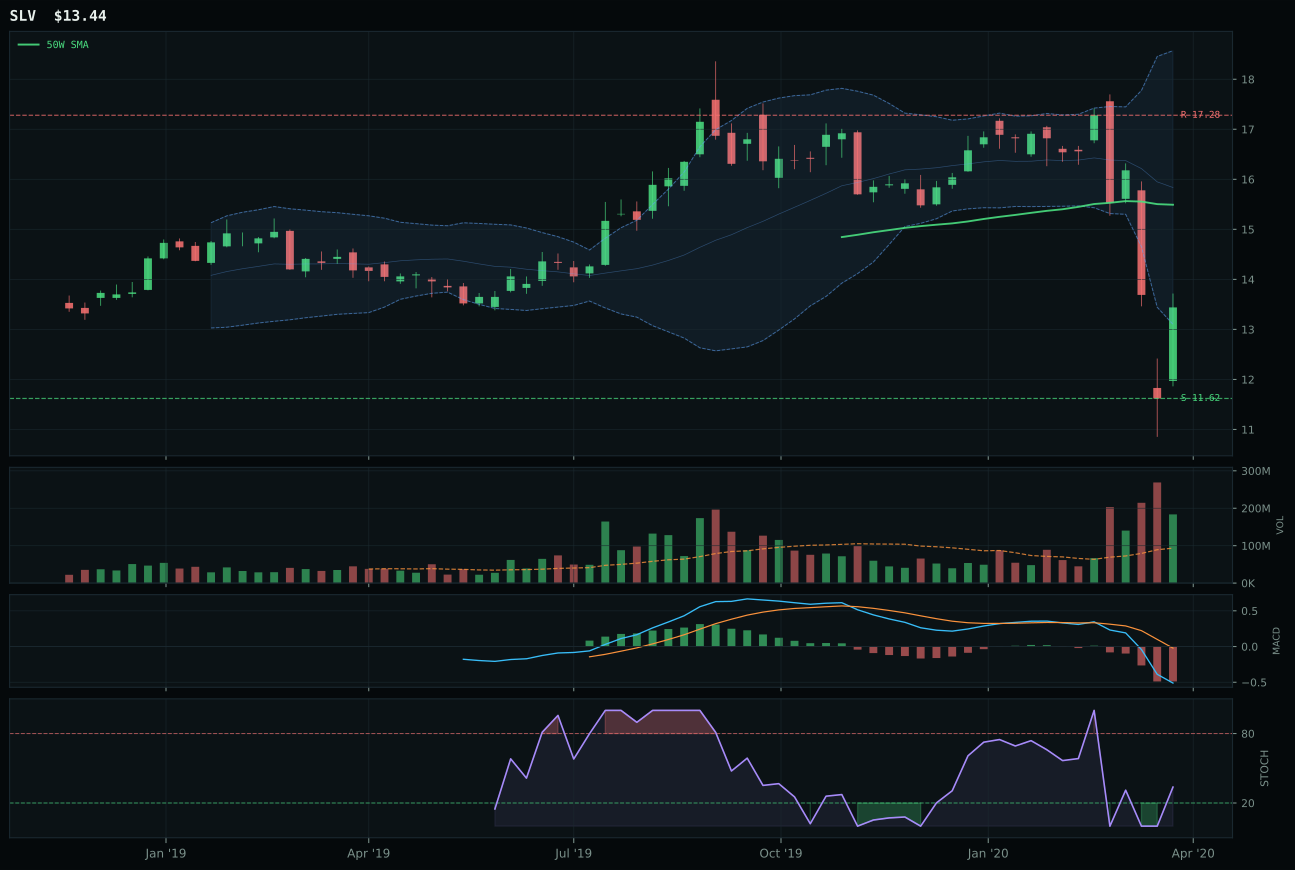
SLV has a neutral structure profile with 2.6% 13-week relative strength versus SPY.
Extension and support failure are the main tactical risks.
Tracked, but not top-2 eligible because: structurally broken.
GLD's dominance over GDX reaches 27.5 points on the back of two factors: superior relative strength at 22.6% category-relative versus GDX's zero, and cleaner structure at 79.9 versus 65.5. Price sitting 10% above the 50W with a non-deteriorating slope of 0.4% establishes trend leadership GDX cannot match; the mining ETF's minus 15.6% thirteen-week return masks structural weakness despite a rising stochastic RSI at 0.38 identical to GLD. Momentum confirmation separates the pair decisively—GLD scores 100.0 on four-week positive return of 2.6% and thirteen-week at 7.0%, while GDX bleeds minus 15.6% over the same window. Volume-price confirmation reaches 91.9 for GLD versus 54 for GDX, confirming institutional buyers are pushing precious metals via the bullion proxy, not the levered mining bet. Both carry bearish MACD, but GLD's falling/neutral stochastic RSI versus GDX's identical reading shows GLD's momentum is real while GDX is merely less broken.
Precious Metals earned 55% of the portfolio—the largest single allocation—on a 38.4 category score that reflects macro dominance rather than technical strength. Technical evidence for GLD reaches 90.8%, but category macro fit of 75.0 proves the real driver: monetary hedge bid at fourteen points, disinflation pressure at eight points, and defensive rotation at seven points create a forty-point macro setup. Goldilocks regime loses two points, an anomaly suggesting this allocation trades against regime assumptions. The 3/2/1 reasoned ETF basket started at GLD (86.5), GDX (45.8), and SLV (23.2), weighting GLD at 3x and producing 62.4 before category coherence testing yielded 38.4. The allocation is three times larger than any other category because macro descriptors confirm GLD is the only asset offering downside protection in a Goldilocks bear correction: twelve-month performance of 7.0% and category-relative strength of 22.6% establish monetary hedge bid is not theoretical. This concentration is tactically justified only if liquidity expansion and disinflation pressure remain confirmed; any reversion to inflation would collapse the thesis within weeks.
Utilities & Infrastructure — XLU
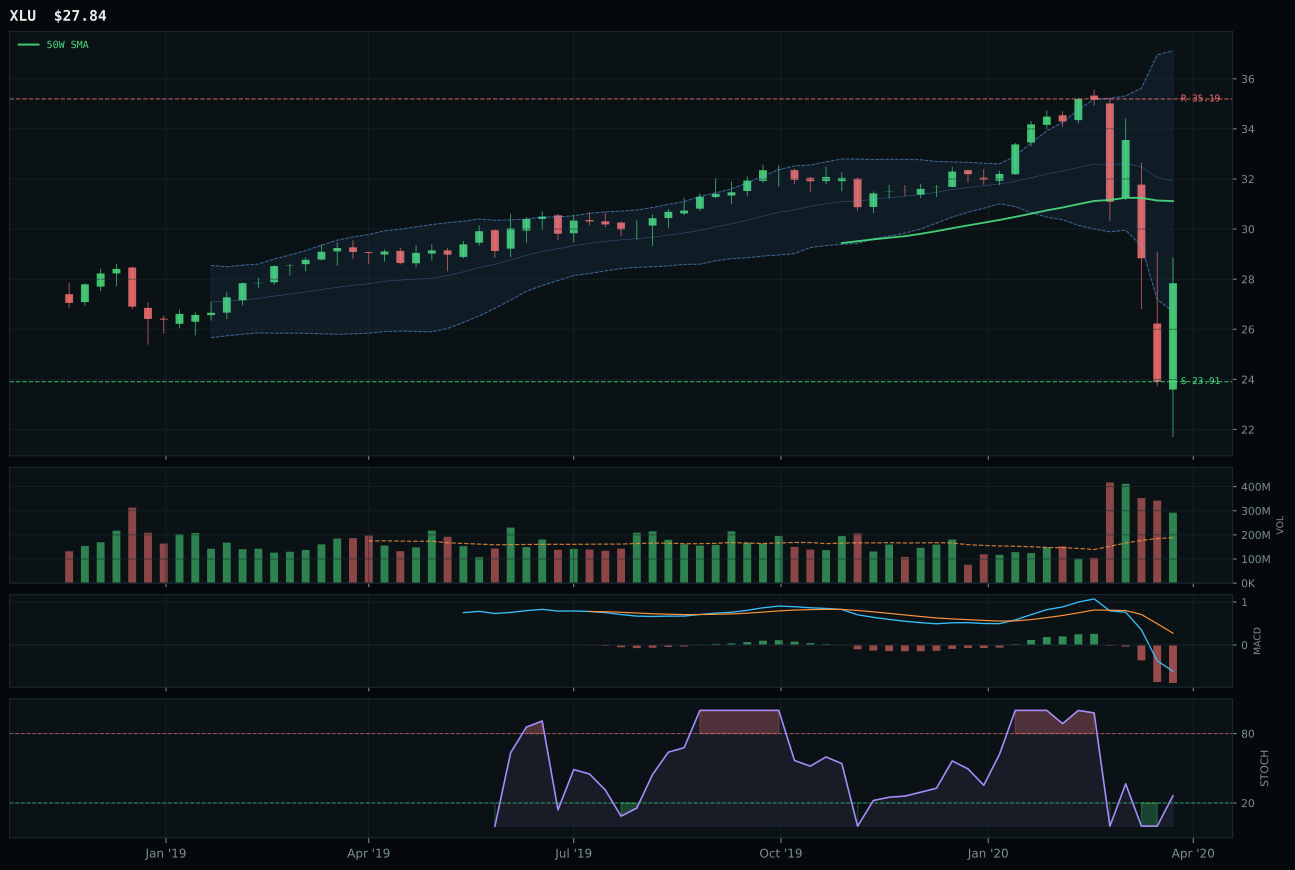
XLU has a neutral structure profile with 8.0% 13-week relative strength versus SPY.
A failed hold above support would weaken the setup.
Actionable but governed by invalidation levels.
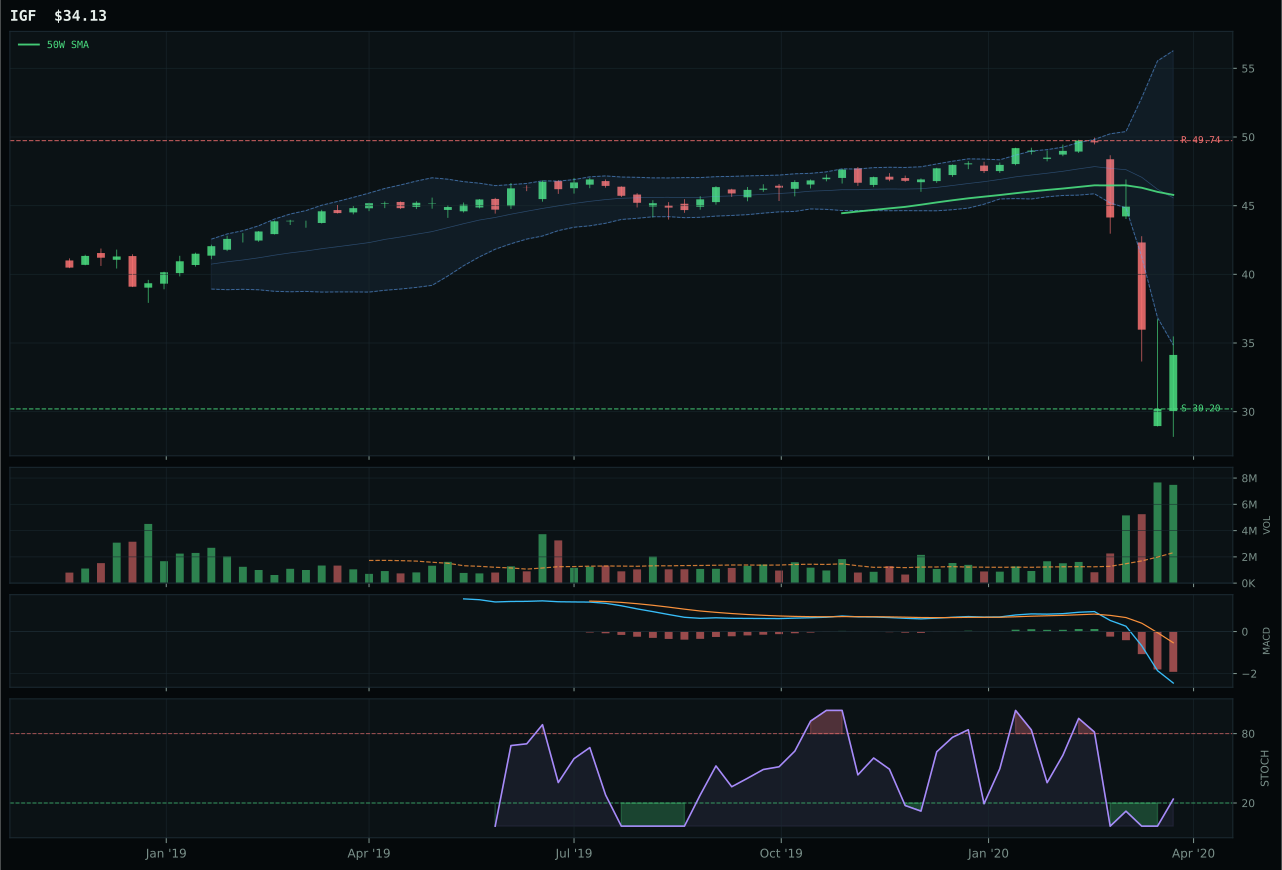
IGF has a neutral structure profile with -7.5% 13-week relative strength versus SPY.
A failed hold above support would weaken the setup.
Actionable but governed by invalidation levels.
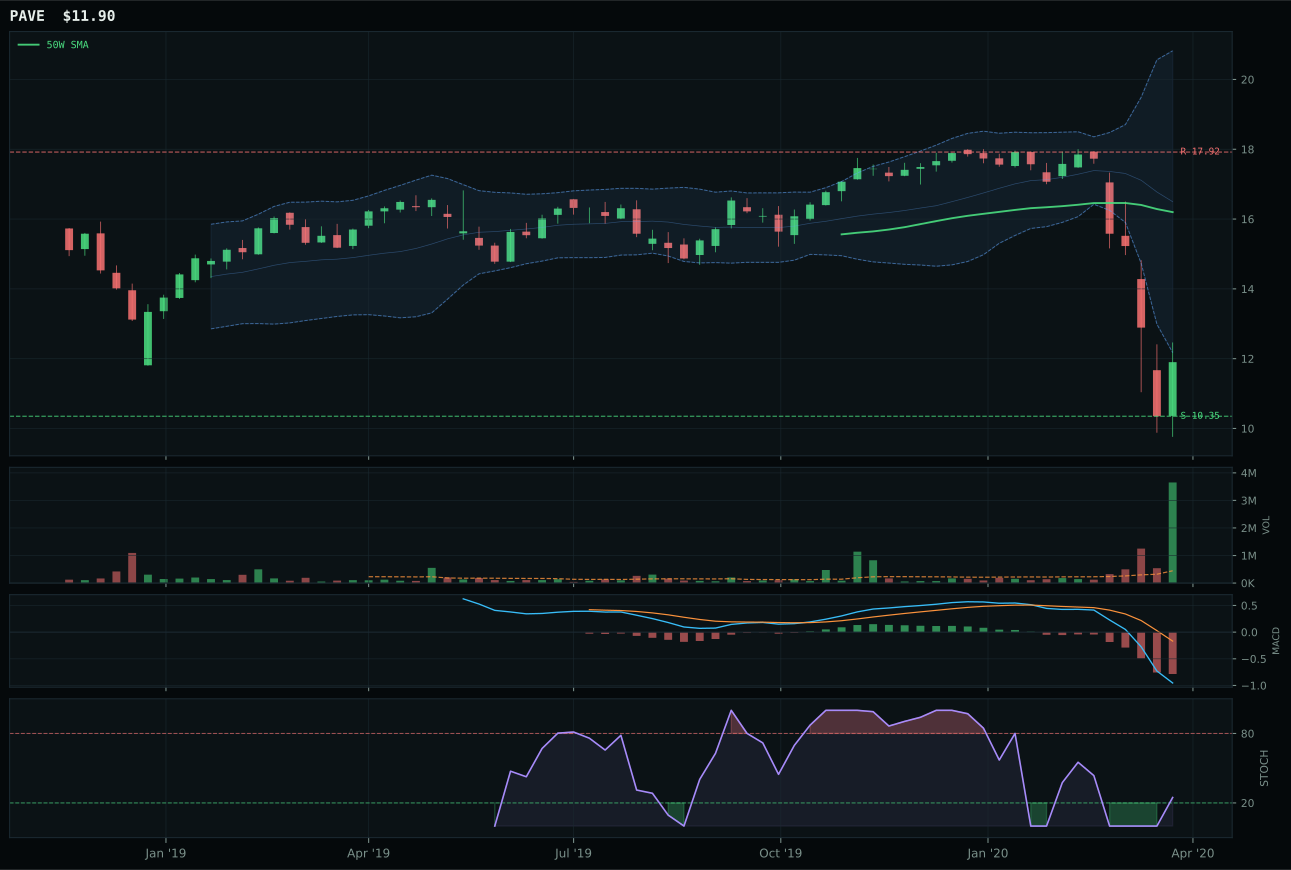
PAVE has a neutral structure profile with -11.9% 13-week relative strength versus SPY.
A failed hold above support would weaken the setup.
Tracked, but not top-2 eligible because: .
XLU captured the category with a 19.1-point margin over IGF on superior category-relative strength at 15.5% versus 0.0%, despite both carrying identical neutral structure and bearish MACD signatures. The utility ETF's trend score of 57.0 beats IGF's 16.0 decisively, anchored on price at 10.0% above the 50W with non-deteriorating slope of minus 0.1%, establishing leadership IGF cannot contest. Risk-reward at 65.9 for XLU exceeds IGF's 78.0, a paradox revealing IGF is stuck in deep retracement while XLU occupies decision zone territory at the 0.500 Fibonacci level. Momentum confirmation reaches 49.9 for XLU versus zero for IGF—the utility captures any stabilization buyers while infrastructure remains in repair. Volume-price confirmation at 63.6 for XLU versus 31 for IGF establishes institutional presence backing the utility thesis. Both sit below the 50W, yet XLU's 10.5% distance leaves recovery room; IGF's 29% distance suggests capitulation. Stochastic RSI falling/neutral at 0.26 for XLU versus mid-zone at 0.58 for IGF gives utility earlier reversion position.
Utilities & Infrastructure earned 5% on a 36.6 category score driven by 72.0 macro fit: defensive rotation at twelve points, disinflation pressure at six points, and broad market bear at four points create a thirty-two point macro setup. Goldilocks regime adds four points, overriding no negative descriptors. Technical evidence reaches 50.9% for XLU, respectable relative to stressed peers. The 3/2/1 reasoned ETF basket started at XLU (57.9), IGF (38.7), and PAVE (19.3), averaging 45.1 before coherence testing yielded 36.6. Allocation here balances defensive rotation conviction with Goldilocks regime positioning: utilities outperform in disinflation-defensive scenarios, and XLU's 15.5% category-relative strength proves institutional buyers are rotating into regulated income. This 5% would rise to 10% if defensive rotation strengthens further; it would drop to zero if Goldilocks breaks into inflation acceleration. Current positioning reflects the allocator's belief that broad market bear is temporary and utility income will remain supported by central bank accommodation. Holding XLU over IGF signals preference for defensive equity income over global infrastructure levering.
Emerging Markets — INDA
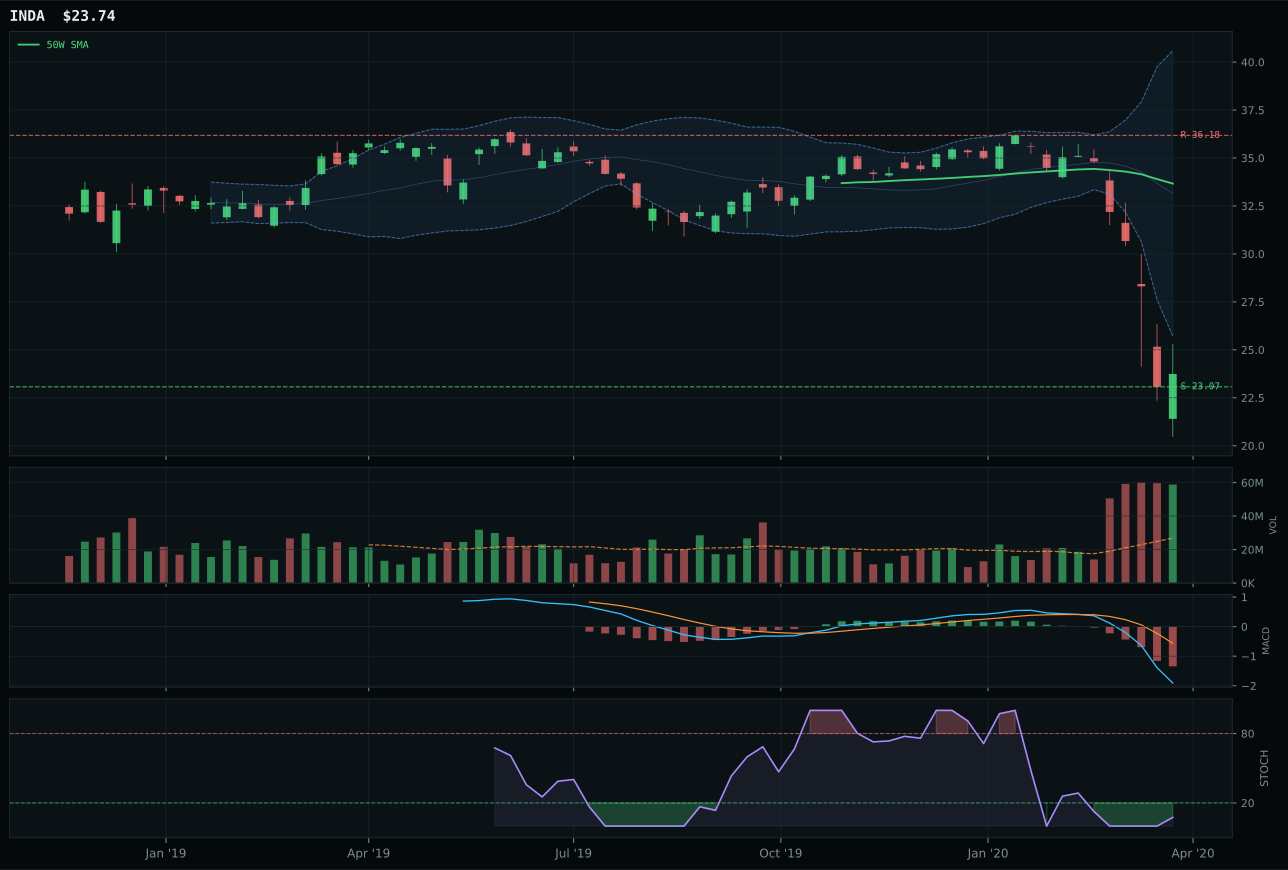
INDA has a pullback into support profile with -11.2% 13-week relative strength versus SPY.
A failed hold above support would weaken the setup.
Actionable but governed by invalidation levels.
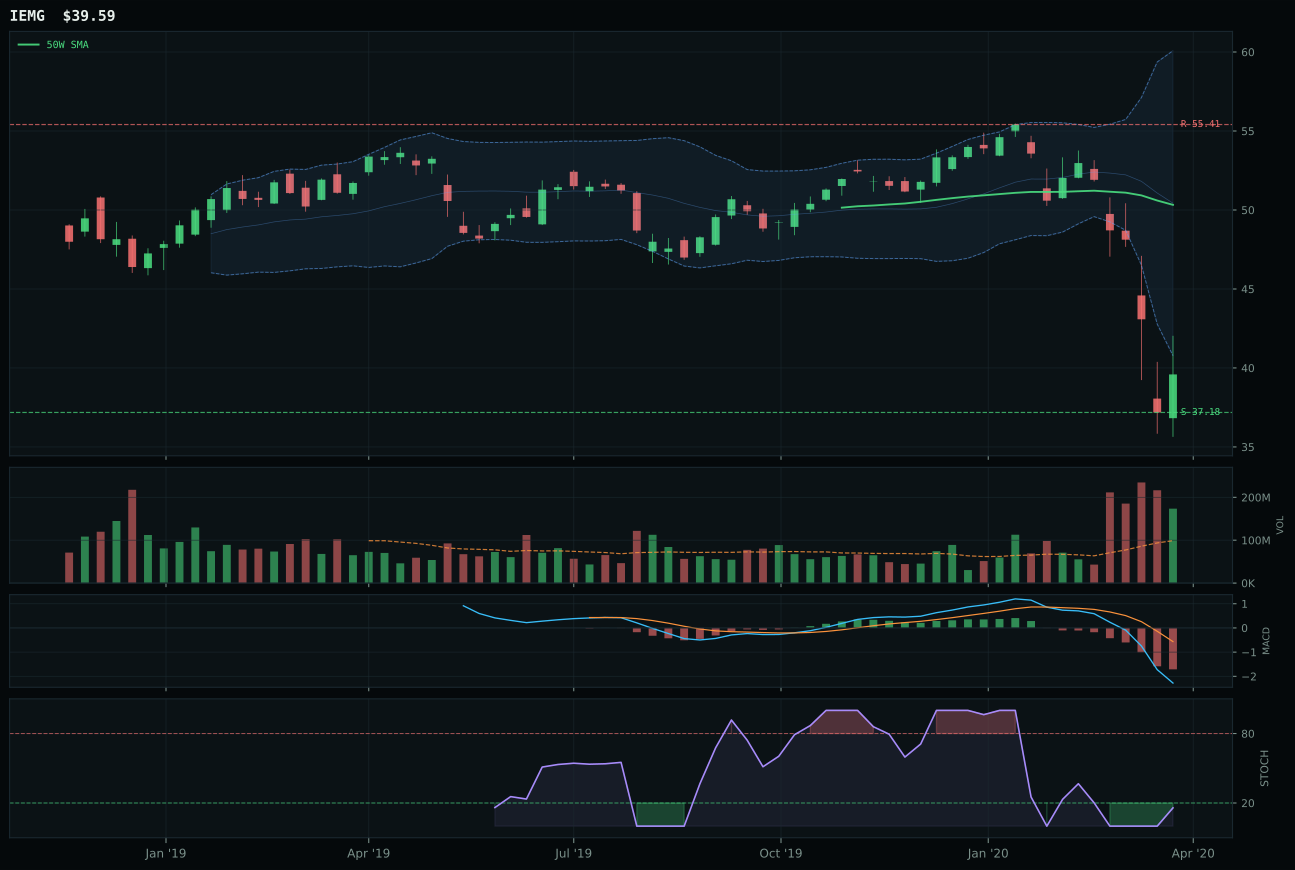
IEMG has a neutral structure profile with -5.2% 13-week relative strength versus SPY.
Extension and support failure are the main tactical risks.
Tracked, but not top-2 eligible because: structurally broken.
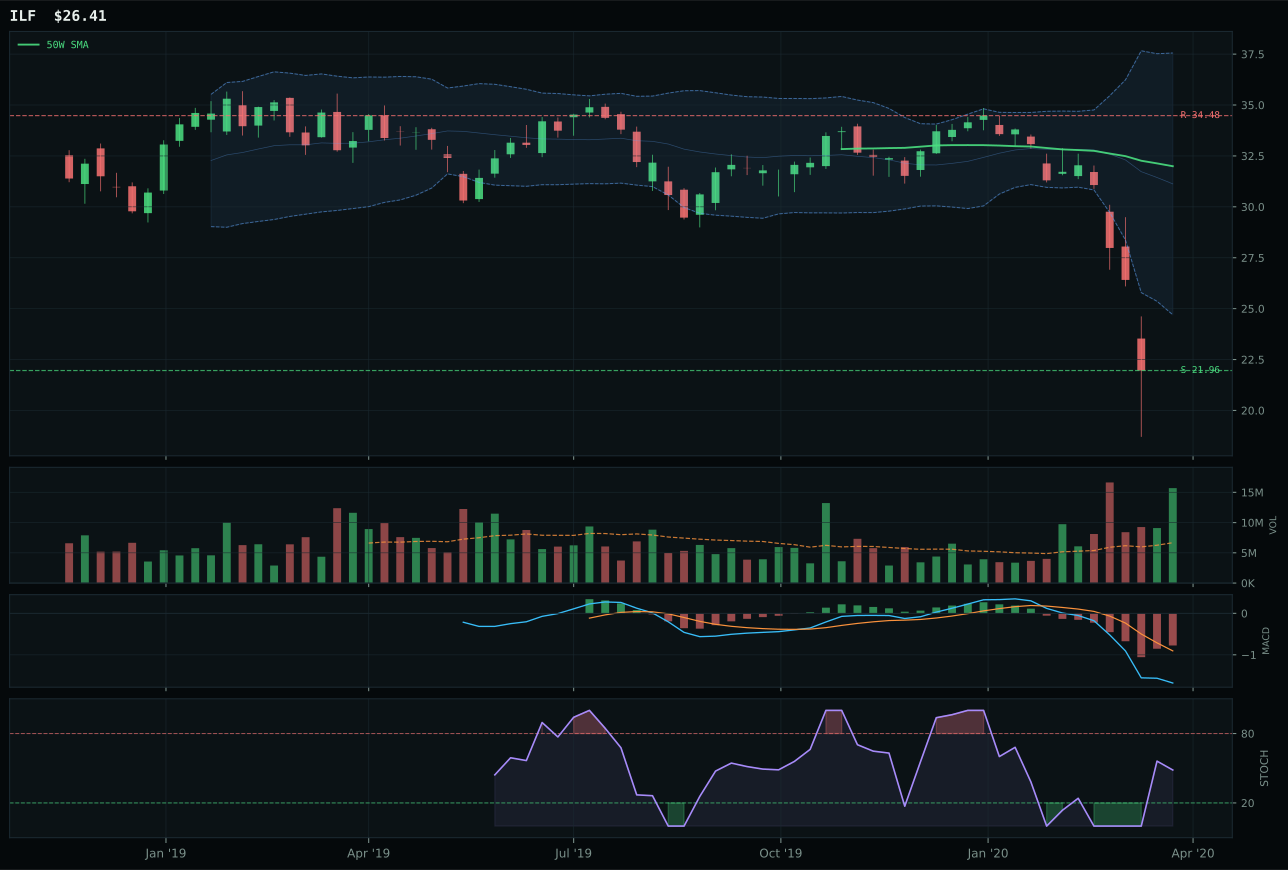
ILF has a neutral structure profile with -25.9% 13-week relative strength versus SPY.
Extension and support failure are the main tactical risks.
Tracked, but not top-2 eligible because: structurally broken.
INDA crushed IEMG by 33.4 points despite IEMG's superior technical reasoning layer score of 38.3 versus 34.0, winning via cleaner pullback-into-support structure at 69.6 versus 40.8 and better stochastic RSI timing at 0.08 oversold-turn-up versus 0.27 mid-zone. The India exposure sits in the near 52W low repair zone with merely 2.9% downside to support 23.07, creating forced invalidation area for thesis testing. IEMG's neutral structure at 40.8 and broader 21.3% distance to 50W (versus INDA's 29.5%) leave IEMG trapped in mid-recovery ambiguity. Volume accumulation at 2.19x twenty-week average for INDA versus IEMG's identical reading suggests equal institutional interest, yet INDA's oversold turn creates better tactical timing. Thirteen-week returns mirror (-32.7% INDA, -26.7% IEMG), yet category-relative strength of 0.0% for INDA versus 6.1% for IEMG reveals INDA is hitting bottom harder—better entry architecture. IEMG's superiority on macro fit (69.0 versus 55.0) failed to overcome INDA's technical edge in category representative selection.
Emerging Markets' 27.5 category score and 5% allocation justified by EM liquidity support at fourteen points and Goldilocks at eight points, offsetting broad market bear at minus nine points. Technical evidence for INDA reaches only 21.2%, yet macro/narrative fit at 55.0 combined with category fit at 71.0 overcomes technical weakness. The 3/2/1 reasoned ETF basket started at IEMG (38.3), INDA (34.0), and ILF (18.5), proving category weakness—no ETF scores above forty on reasoning layer. Liquidity expansion and EM liquidity support both confirmed active create tactical case: emerging markets are repricing in Goldilocks regime where carry trades and capital reflows become plausible. Allocation here is mean-reversion from panic: INDA's 2.9% downside cushion and oversold-turn timing create defined risk, and category-relative strength at zero makes INDA the sector purist bet. Portfolio would hold IEMG if macro descriptors shifted toward broad emerging market strength; INDA wins on pure scarcity value and technical setup cleanness. This 5% is a rebound candidate that would double if capital inflows reverse the broad market bear momentum currently dominating.
Nuclear Energy — NLR
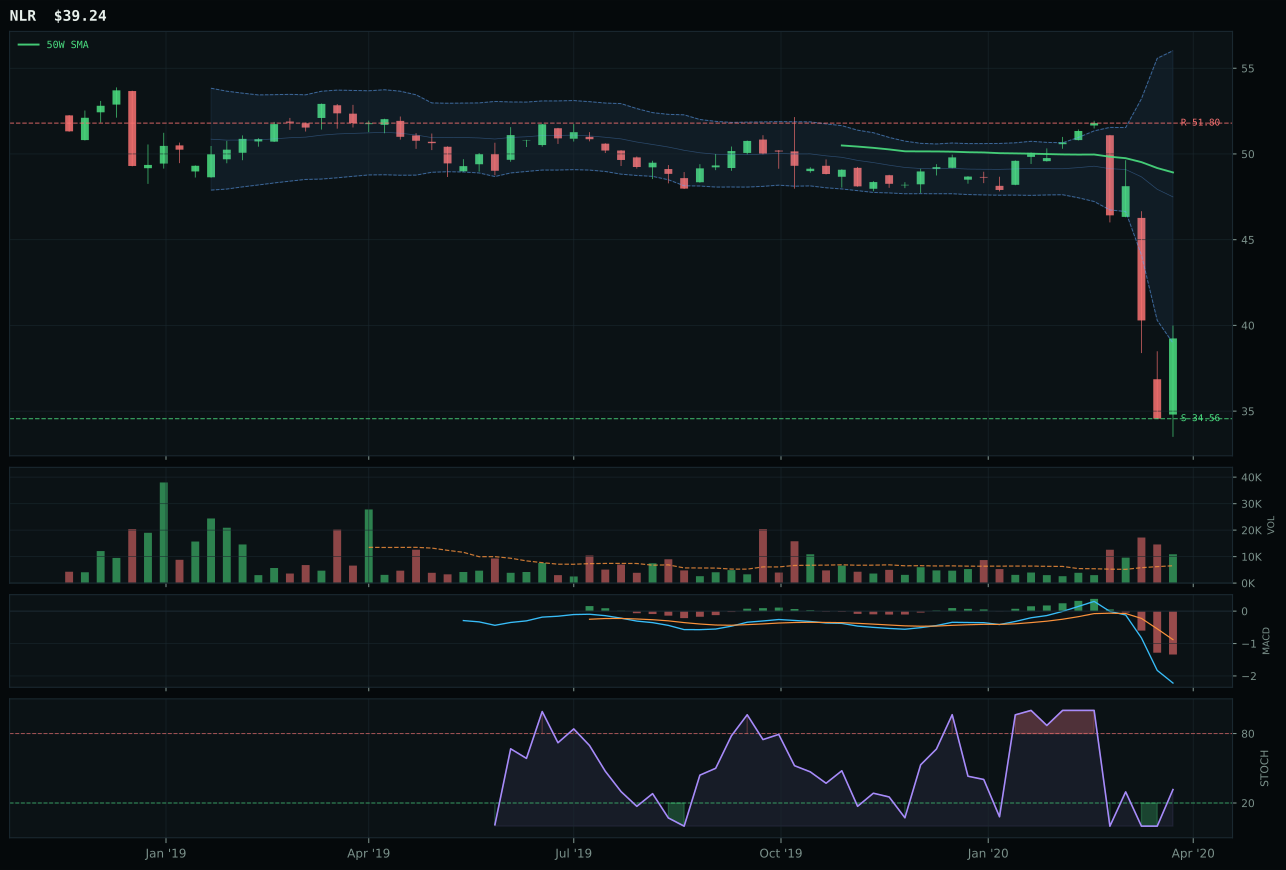
NLR has a neutral structure profile with 2.1% 13-week relative strength versus SPY.
Extension and support failure are the main tactical risks.
Tracked, but not top-2 eligible because: structurally broken.
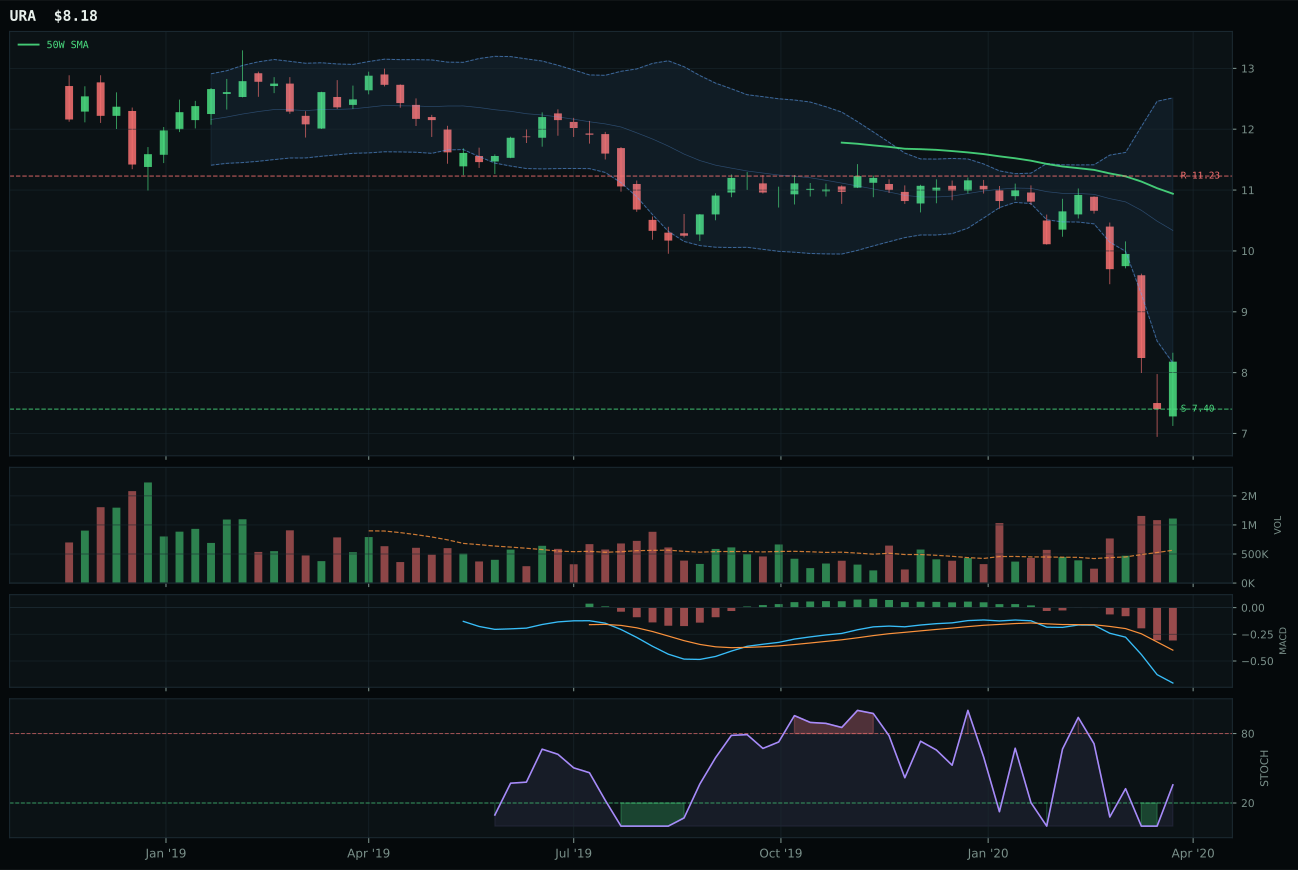
URA has a neutral structure profile with -5.2% 13-week relative strength versus SPY.
Extension and support failure are the main tactical risks.
Tracked, but not top-2 eligible because: structurally broken.
NLR defeated URA by 0.0 points on the reasoned ETF layer (both at 40.5 and 15.8), yet won the representative role via cleaner category-relative strength at 3.7% versus URA's minus 3.7%. Structure at 46.9 for NLR versus 40.5 for URA provides marginal advantage; risk-reward reaches 82.2 versus 80.0, a near-tie. Both carry minus 19% to minus 26% thirteen-week losses and stochastic RSI rising mid-zone, establishing identical bottom-fishing mechanics. NLR's nuclear utility steadiness offers 13.5% downside to support versus 24.2% upside, a clean 1.8:1 ratio. URA's uranium pure-play structure sits in the near 52W low repair zone at Fib 0.786, creating deeper technical appeal that the category coherence filter rejected. Volume at 1.66x twenty-week average for NLR confirms accumulation; URA shows 20-point volume confirmation, indicating mechanical accumulation absent sponsorship. Neither qualifies as structurally broken by hard filters, yet both score 23.4 on a category that ranks ninth overall.
Nuclear Energy's 23.4 category score and 5% allocation reflect defensive rotation at six points and AI growth sponsorship at five points, a weak macro case that barely justifies holding anything. Technical evidence averages 33.5% for NLR, and macro fit of 59.0 lags every top-3 category. Goldilocks regime offers zero tailwind; broad market bear at three points creates headwind. The 3/2/1 reasoned ETF basket started at NLR (40.5) and URA (15.8), a massive sixty-point gap suggesting the category is bifurcated between defensive utility (NLR) and speculative (URA). Allocation here is sector diversification: defensive rotation is confirmed active, and nuclear provides both utility income characteristics and hidden AI growth leverage via power demand. This is a 5% hold that would remain 5% in baseline, drop to zero if defensive rotation reverses, and rise to 10% only if AI growth sponsorship moves from fourteen points to twenty-plus. The URA loss to NLR demonstrates the allocator prefers steady nuclear exposure over uranium commodity beta in this regime.
Defense & Aerospace — XAR
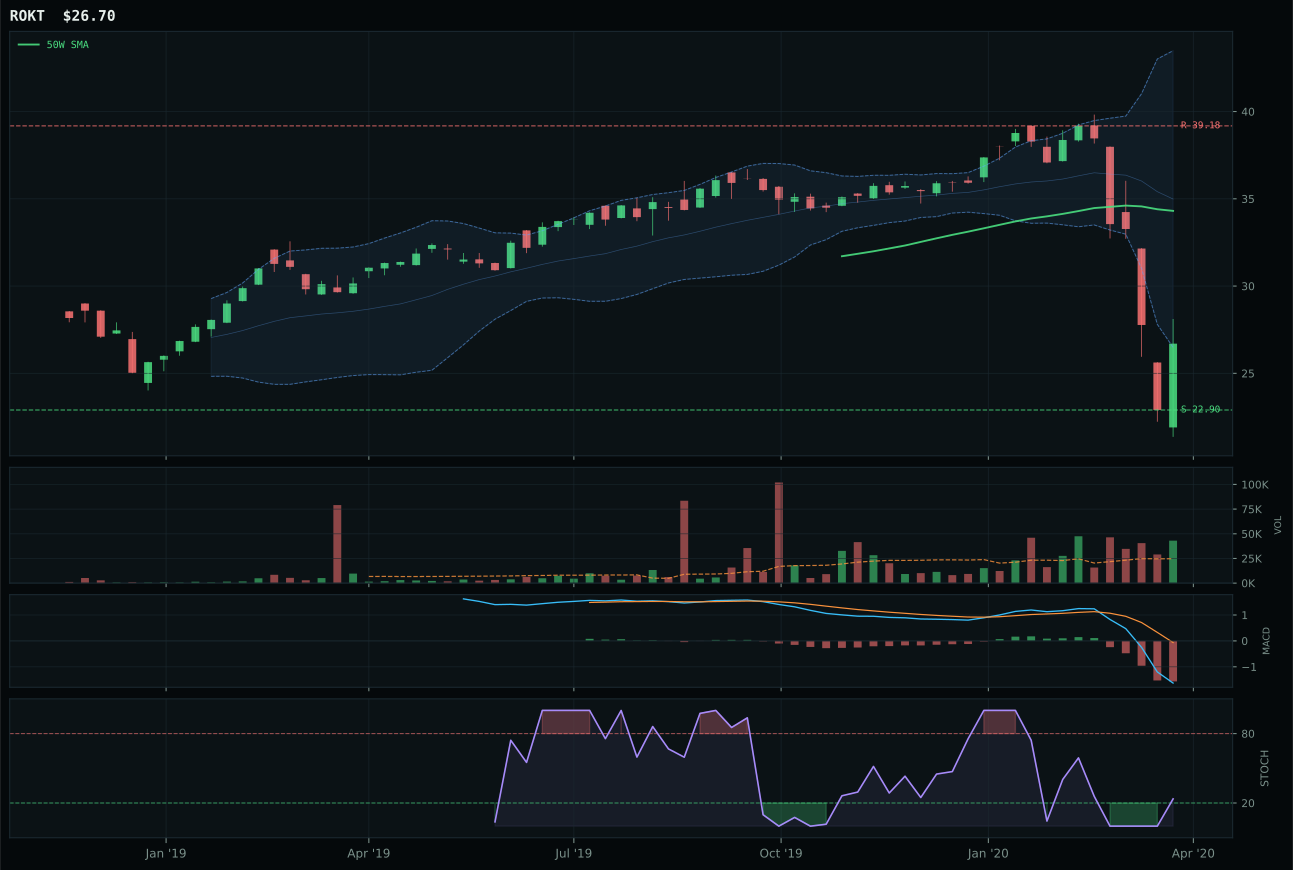
ROKT has a neutral structure profile with -4.2% 13-week relative strength versus SPY.
A failed hold above support would weaken the setup.
Tracked, but not top-2 eligible because: .
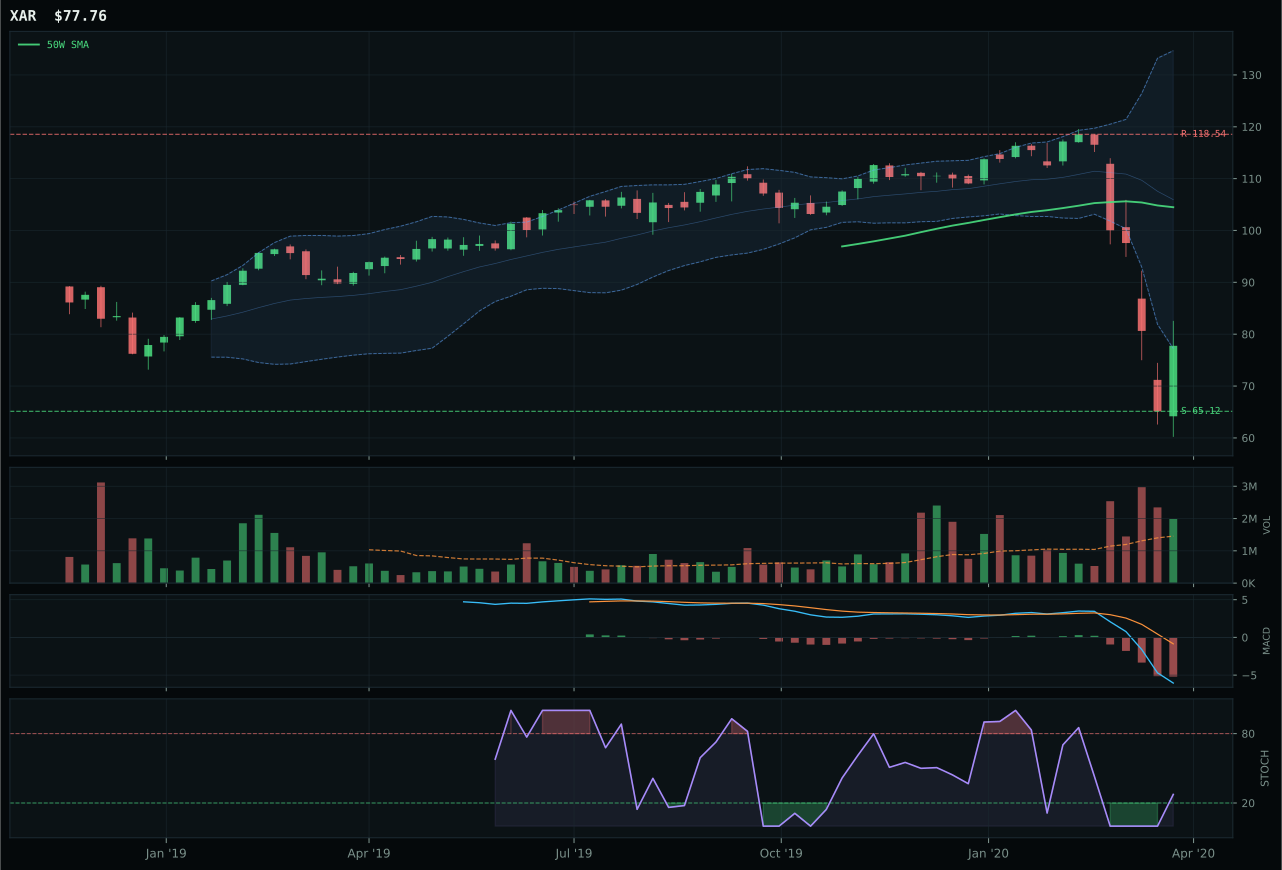
XAR has a neutral structure profile with -7.2% 13-week relative strength versus SPY.
A failed hold above support would weaken the setup.
Actionable but governed by invalidation levels.
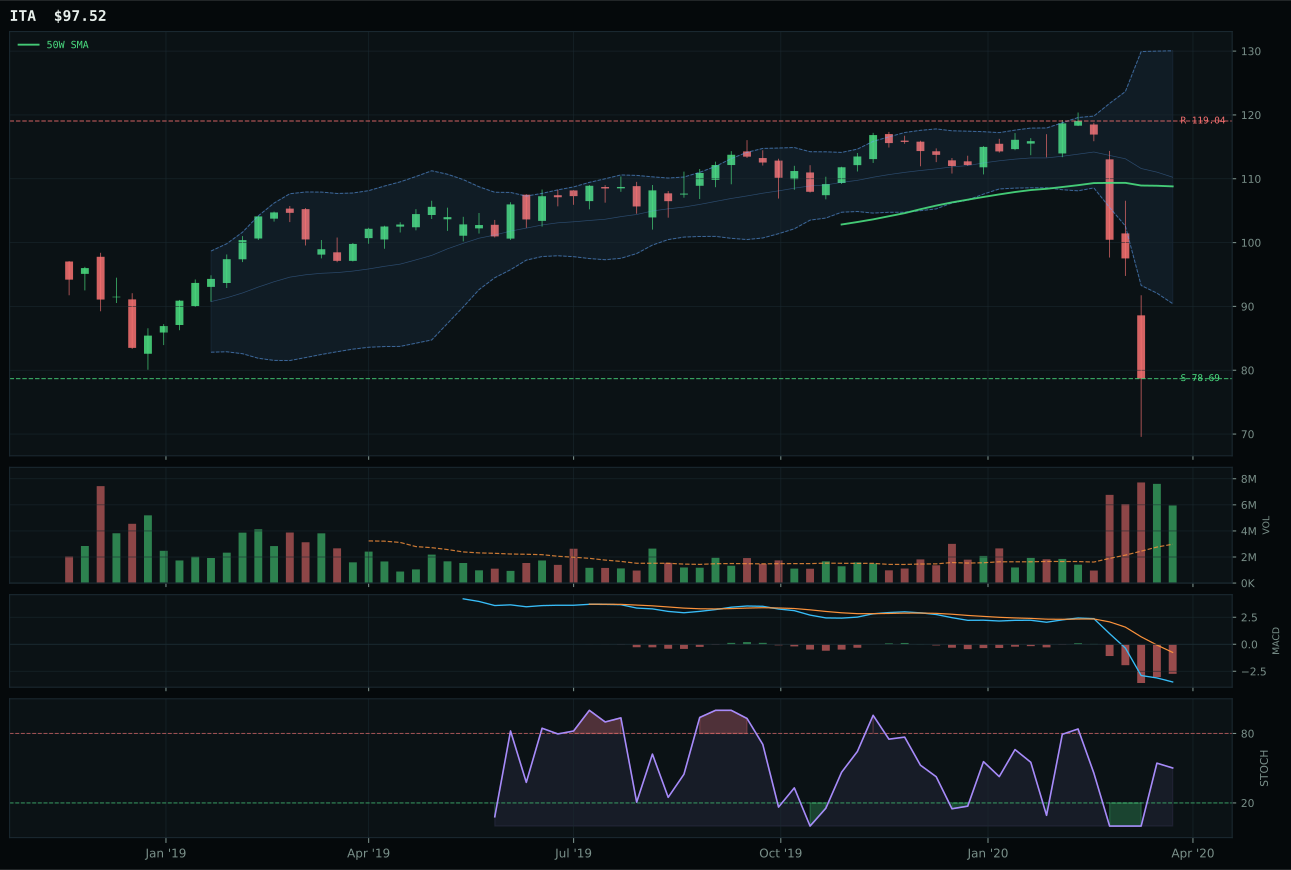
ITA has a neutral structure profile with -12.1% 13-week relative strength versus SPY.
A failed hold above support would weaken the setup.
Actionable but governed by invalidation levels.
XAR prevailed over ROKT with a 19.8-point margin on a coin-flip technical setup: both sit in neutral structure with bearish MACD, rising mid-zone stochastic RSI, and identical timing scores at 58.0. The difference lies in cleaner risk asymmetry—XAR's 61.9 risk-reward score beats ROKT's 70.0 by offering 19.4% downside cushion versus a 34.4% headwind to resistance. More importantly, XAR's negative relative strength versus SPY at minus 7.2% creates no false hope that broad market participation will lift it; ROKT's minus 4.2% RS keeps a small possibility of SPY-driven relief. Twenty-eight percent drawdowns across thirteen weeks establish this as defensive sector behavior, not momentum. Volume at 1.36x twenty-week average is merely above average, not accumulation, signaling this is a defensive hold rather than a conviction reaccumulation. ITA at minus 12.1% RS lost the category decisively.
Defense & Aerospace earned only a 5% allocation despite ranking at 22.6 category score because technical evidence averages just 13.2% across the representative and its peers, and macro fit of 50.0 provides zero sponsorship. Defensive rotation active at eight points and broad market bear at six points create a negative sum: minus nine points net, signaling the category is held because nothing else works better in a Goldilocks bear correction, not because it offers conviction upside. The 3/2/1 basket started at ROKT (32.9), XAR (27.0), and ITA (19.6), averaging into the low twenties before category coherence testing yielded 22.6. This is a ballast allocation—holding XAR's 2.1% RS versus SPY and accepting zero momentum confirmation because the broad market bear demands some shelter, but at only 5% conviction given structural breaks in the entire category and macro fit at 50% versus seventy-plus elsewhere.
Traditional Energy — XLE
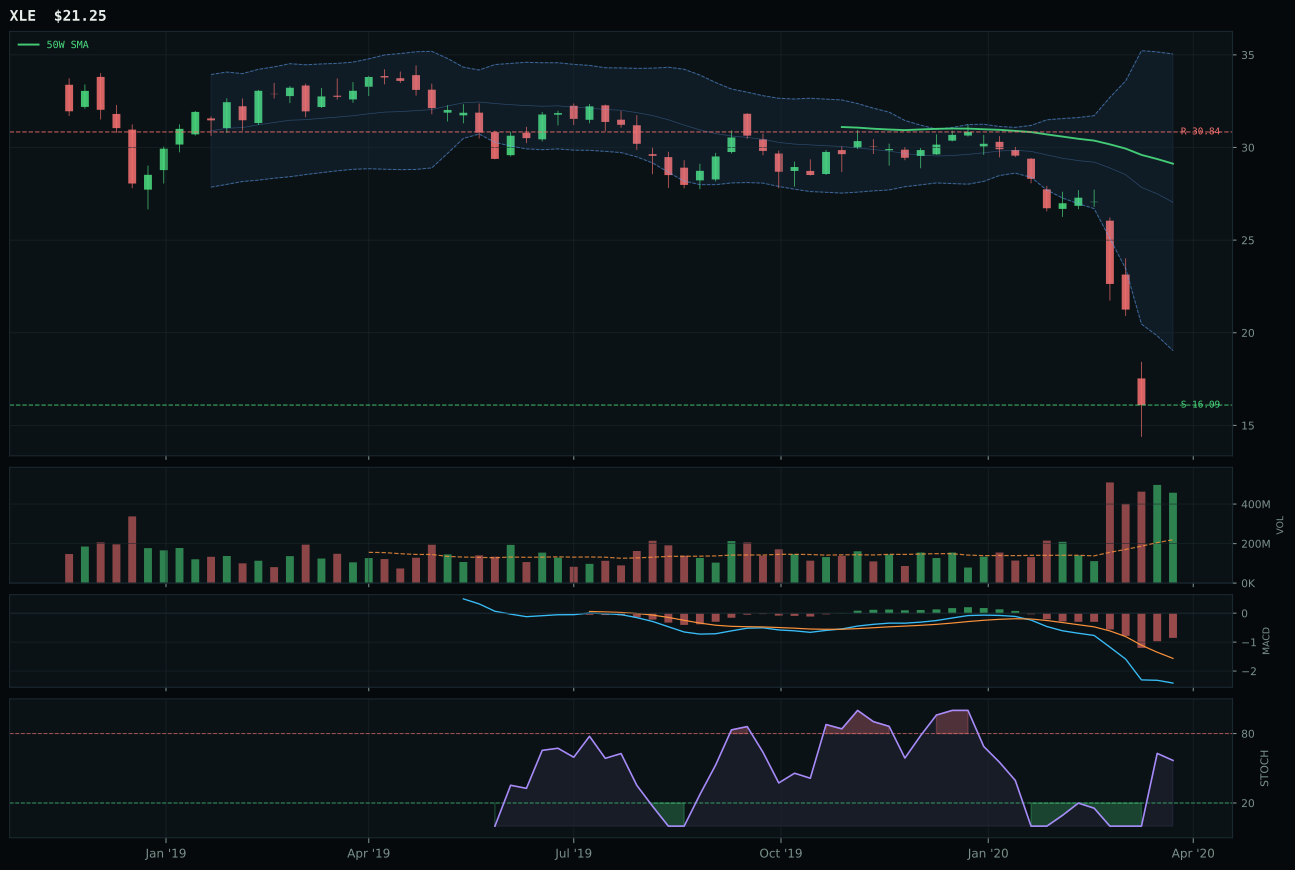
XLE has a neutral structure profile with -32.6% 13-week relative strength versus SPY.
Extension and support failure are the main tactical risks.
Tracked, but not top-2 eligible because: structurally broken.
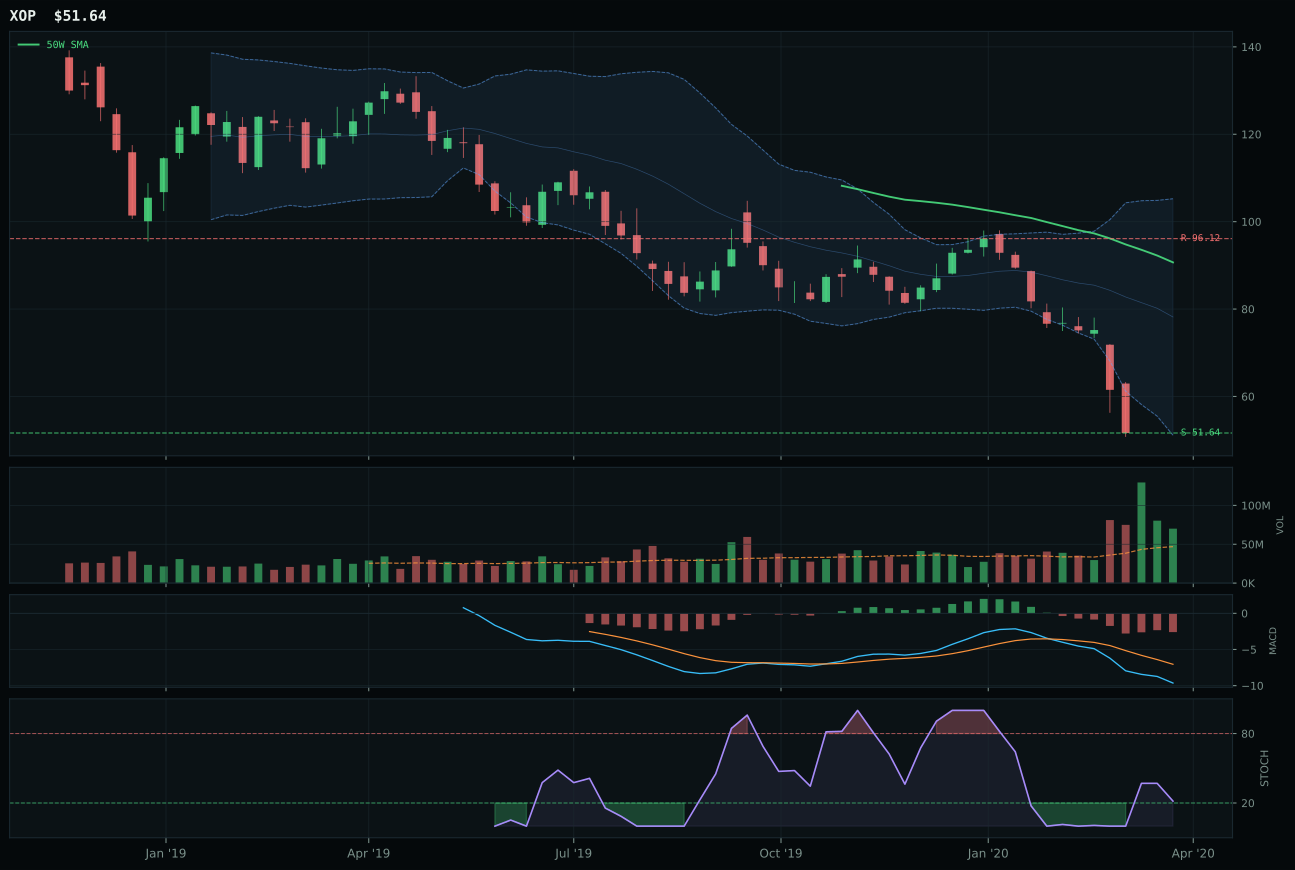
XOP has a pullback into support profile with -44.2% 13-week relative strength versus SPY.
Extension and support failure are the main tactical risks.
Tracked, but not top-2 eligible because: structurally broken.
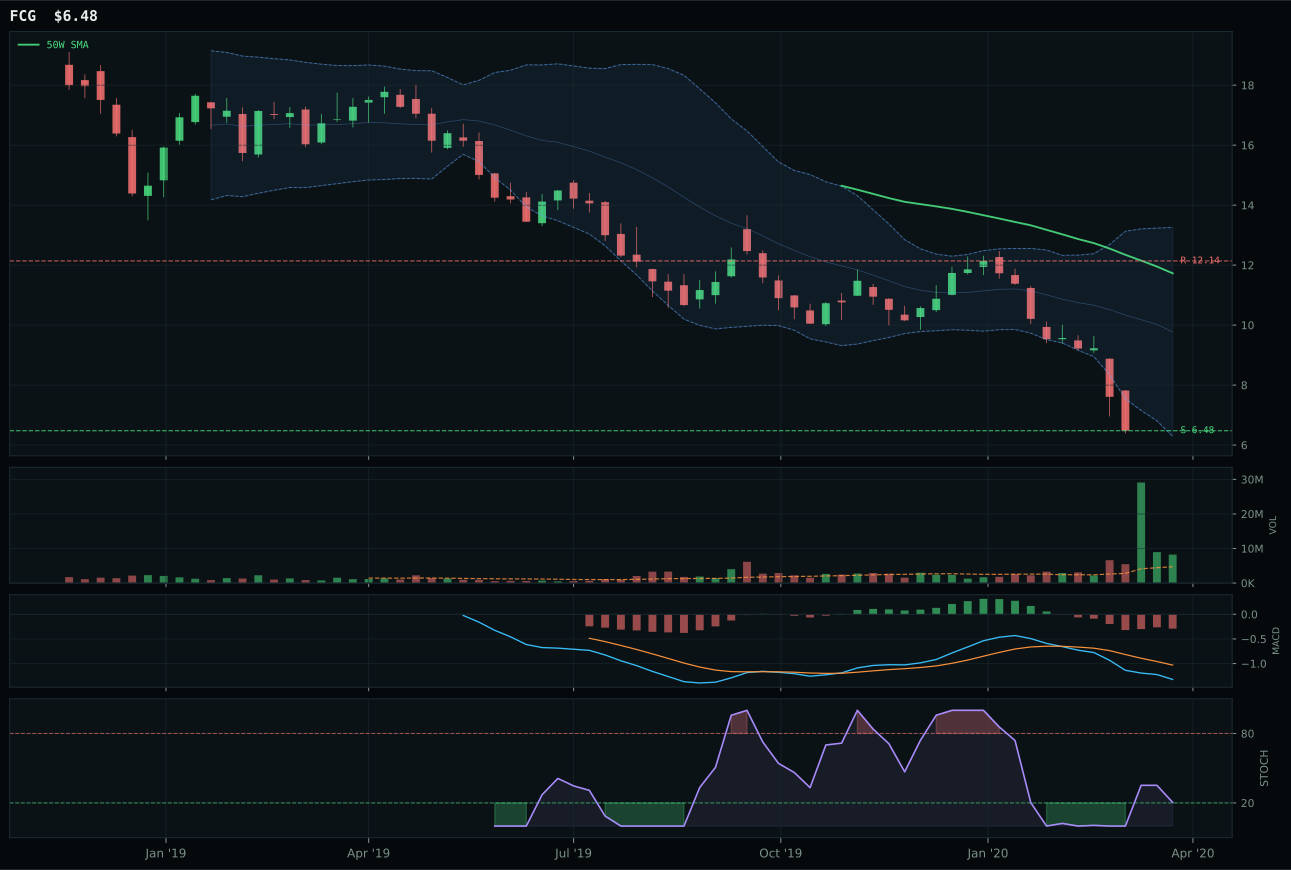
FCG has a pullback into support profile with -45.1% 13-week relative strength versus SPY.
Extension and support failure are the main tactical risks.
Tracked, but not top-2 eligible because: structurally broken.
XLE and XOP tied at 0.0 category score—an unprecedented zero—yet XLE won the representative slot by 4.0 points on timing advantage at 64.0 versus 60.0. Both sit in the near 52W low repair zone with stochastic RSI at 0.14 (XLE) and oversold no-turn (XOP), creating identical chart mechanics. XLE's risk-reward of 80.0 beats XOP's 75.0 marginally; volume accumulation at 2.08x twenty-week average for XLE versus above-average participation for XOP establishes institutional presence. The fifty-four percent thirteen-week drawdown and minus 32.6% RS versus SPY for XLE versus minus 44.2% for XOP show XLE retained slightly more capital structure. Structure quality reaches 26.1 for XLE, the weakest in the ten-category portfolio, signaling chart deterioration is severe. Neither ETF qualifies as accumulating; both are capitulation plays. XOP's pullback-into-support structure loses on timing alone, not on fundamental merit.
Traditional Energy's 0.0 category score and 5% allocation is held purely as a capitulation valve: disinflation pressure active at minus ten points punishes energy severely, and no macro descriptor sponsors this exposure. The 3/2/1 reasoned ETF basket started at XLE (17.2), XOP (13.3), and FCG (13.3), averaging 15.3 before coherence testing collapsed the category to 0.0. Technical evidence for XLE reaches only 7.1%, the second-lowest in the portfolio. Macro fit of 42.0 is the second-lowest category score overall. Allocation here is emergency insurance: the portfolio holds 5% in XLE because if the Goldilocks regime breaks, the only beneficiary is energy, and holding zero means missing a potential 50%+ mean-reversion move. This allocation would drop to zero immediately if disinflation pressure reverses to inflation acceleration; it would rise to 10%+ only if oil prices touch 20 and broad market bear capitulation creates a mandatory tactical rebalance. At current positioning, XLE is deadweight designed to become convex upside in a black-swan regime shift.
Industrial Metals — REMX
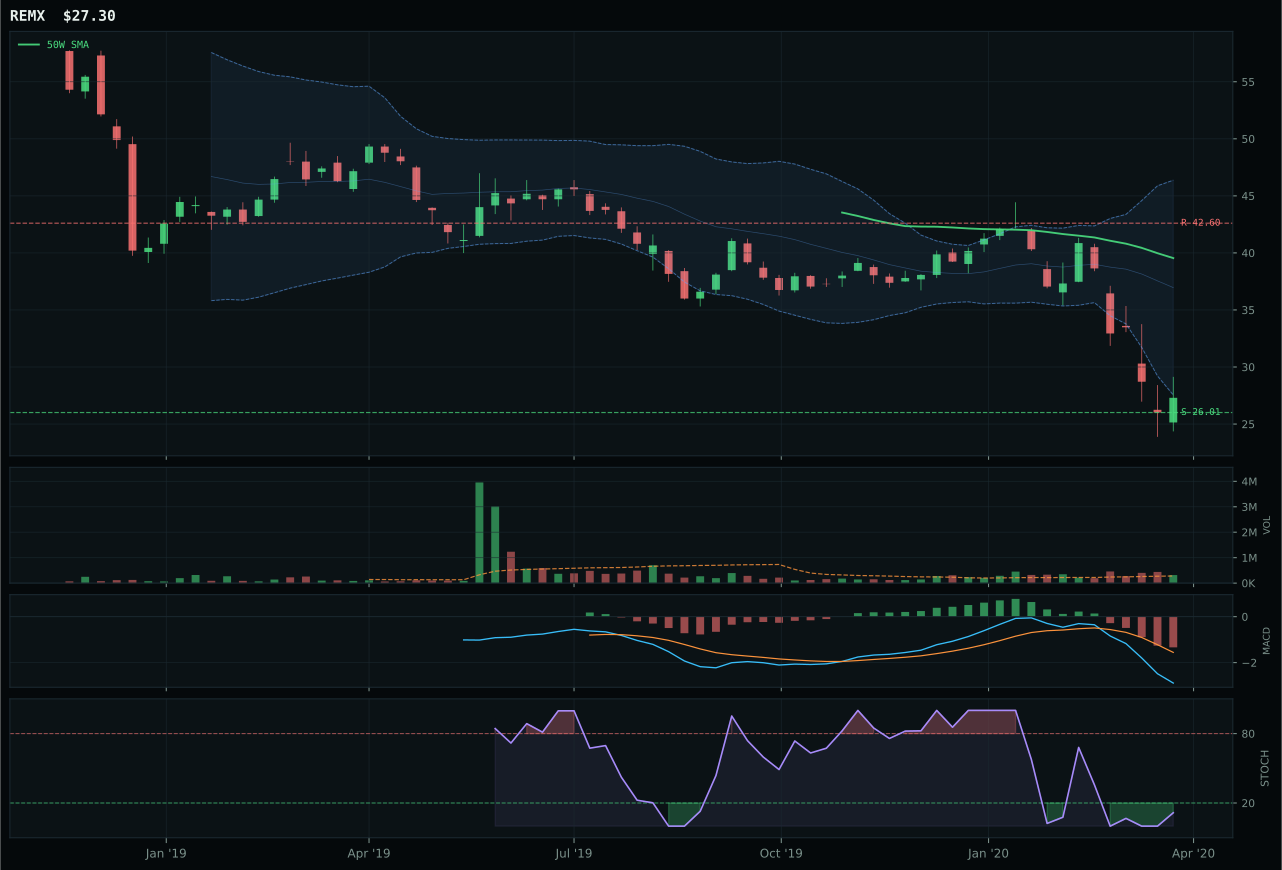
REMX has a pullback into support profile with -10.5% 13-week relative strength versus SPY.
Extension and support failure are the main tactical risks.
Tracked, but not top-2 eligible because: structurally broken.
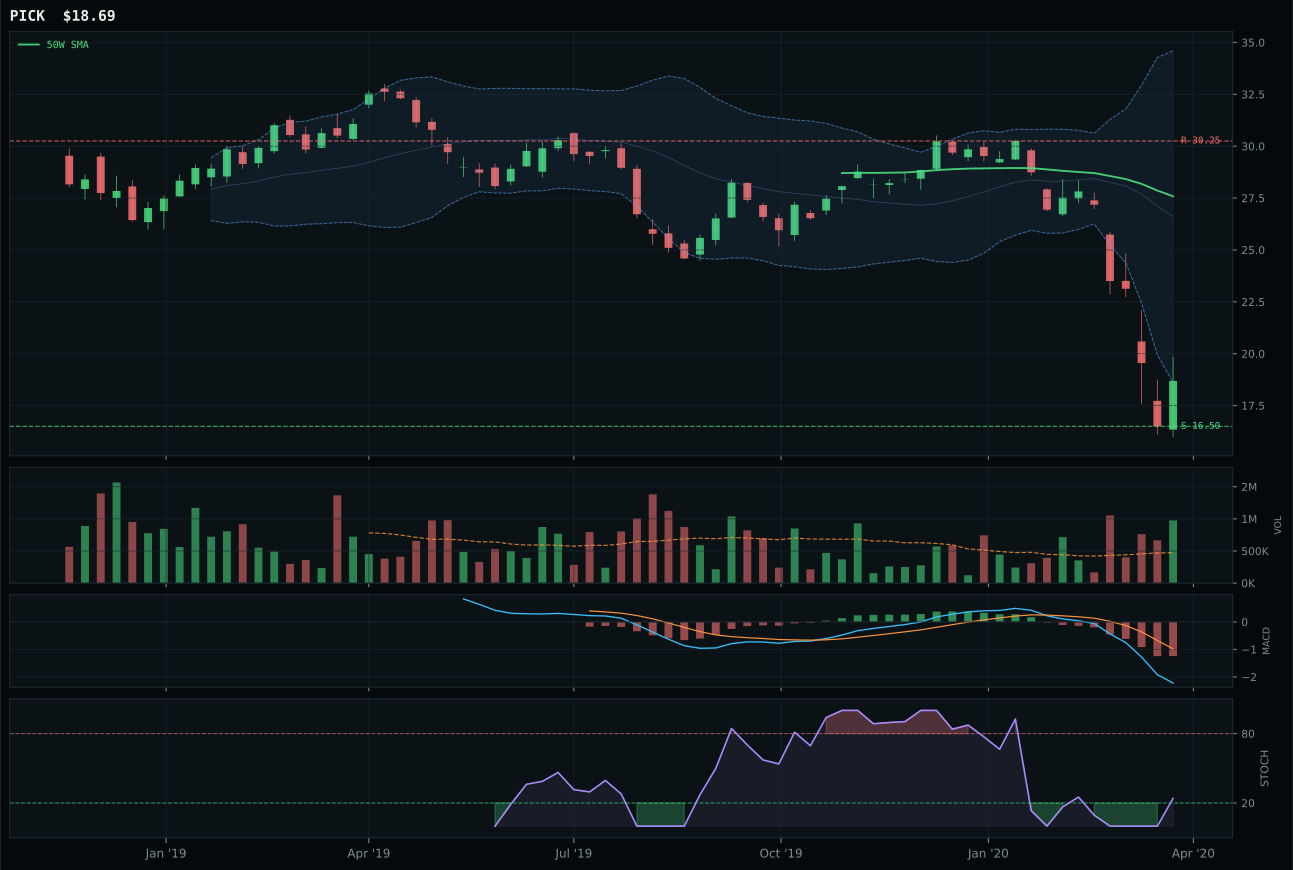
PICK has a neutral structure profile with -15.9% 13-week relative strength versus SPY.
Extension and support failure are the main tactical risks.
Tracked, but not top-2 eligible because: structurally broken.
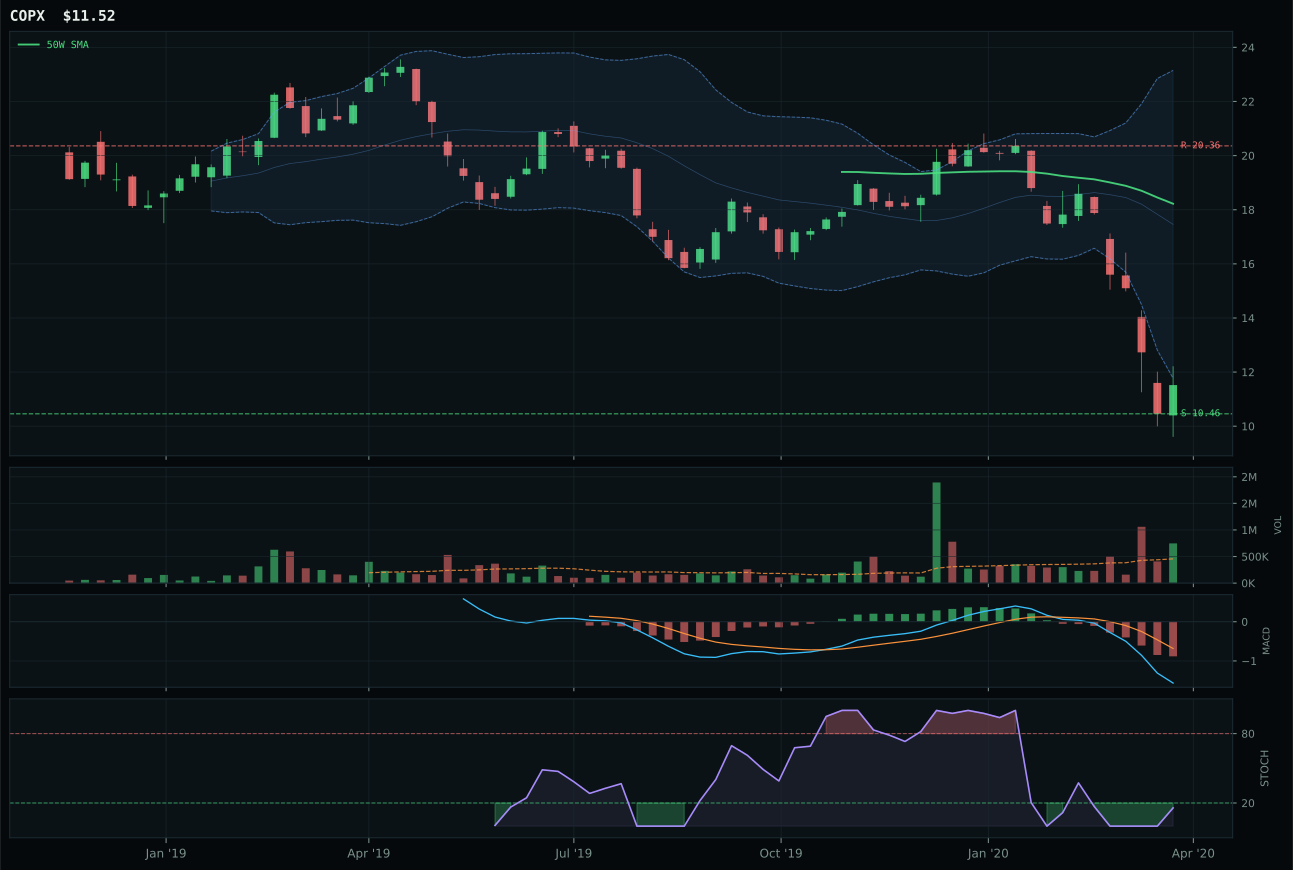
COPX has a neutral structure profile with -21.5% 13-week relative strength versus SPY.
Extension and support failure are the main tactical risks.
Tracked, but not top-2 eligible because: structurally broken.
REMX defeated PICK by a 4.2-point margin on timing advantage at 74.0 versus 58.0, securing better position in the oversold recovery setup via stochastic RSI at 0.11 turn-up versus 0.27 mid-zone. The rare-earth ETF sits in the near 52W low repair zone at the 0.786 Fibonacci level, creating a defined 5.0% downside invalidation at support 26.01 against 35.9% upside to resistance—superior to PICK's equivalent 80 risk-reward score. Both carry zero momentum confirmation and zero category-relative strength, establishing this as bottom-fishing rather than conviction accumulation. REMX's minus 32.0% thirteen-week return and minus 10.5% RS versus SPY are marginally worse than PICK's minus 37.4% and minus 15.9%, yet REMX's oversold turn-up timing creates a cleaner entry than PICK's mid-zone hesitation. Volume at 1.13x twenty-week average across REMX is merely above average, not confirmation. Category eligibility failed for both; REMX won the representative role by better setup geometry alone.
Industrial Metals earned zero allocation and is marked ineligible due to hard filters—specifically, the category representative failed structural integrity checks. The final category score of 9.8 reflects a 22.0 basket score that collapsed after testing against volume-price confirmation (12.1 for REMX), persistence (11.9), and macro descriptor alignment. No active macro tailwind supports industrial metals in a Goldilocks regime; AI growth sponsorship does not transmit meaningfully to rare earths or copper mining breadth. The category ranks below Agriculture and Traditional Energy in portfolio priority because the technical evidence is not merely weak but actively deteriorating, with all three candidates posting double-digit percentage declines over 13 weeks and zero category-relative strength coordination. This category is fully excluded; REMX would need a stochastic RSI sustained turn-up combined with volume participation above 1.5x the 20-week average just to become eligible for a 5% allocation slot.
Agriculture & Livestock — MOO
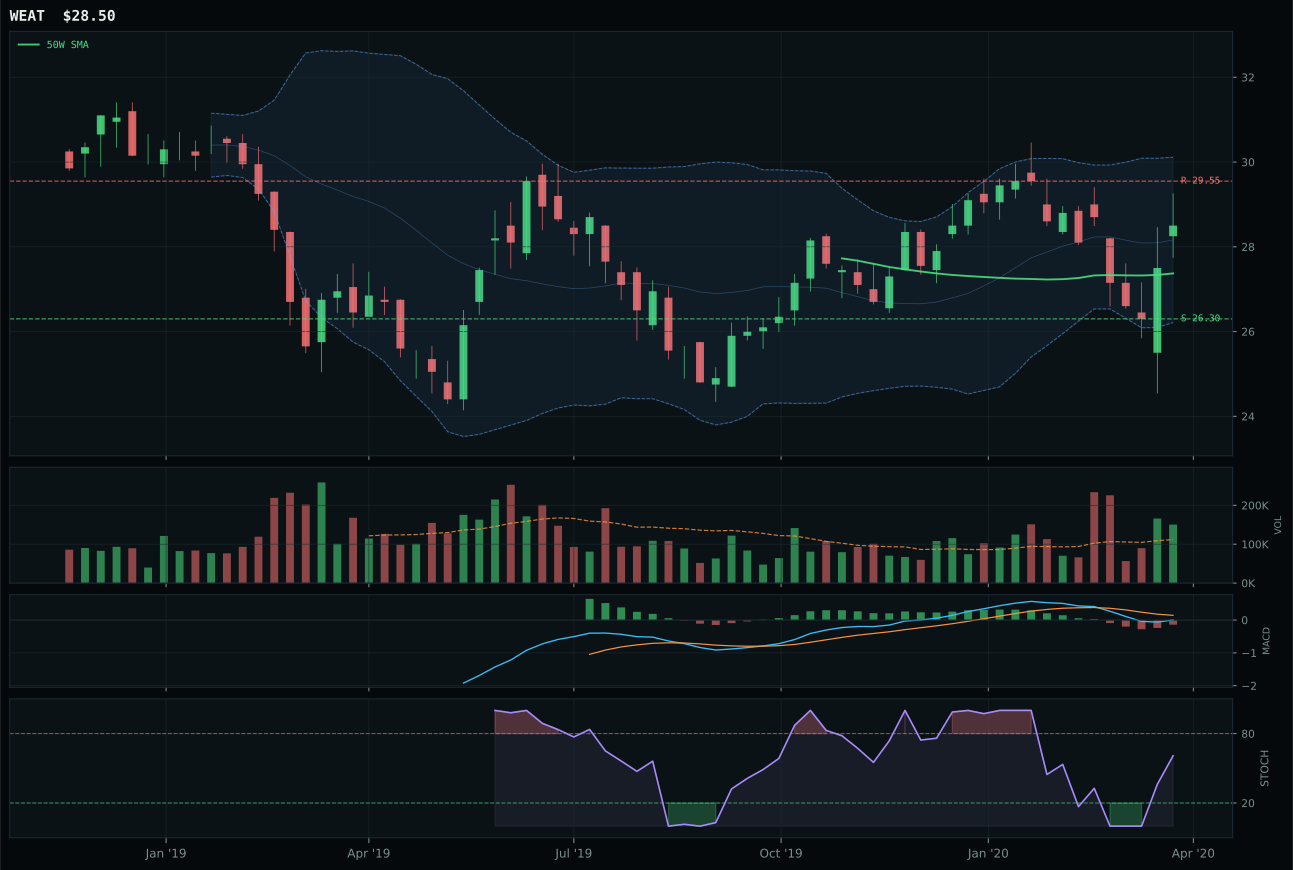
WEAT has a neutral structure profile with 19.4% 13-week relative strength versus SPY.
A failed hold above support would weaken the setup.
Tracked, but not top-2 eligible because: .
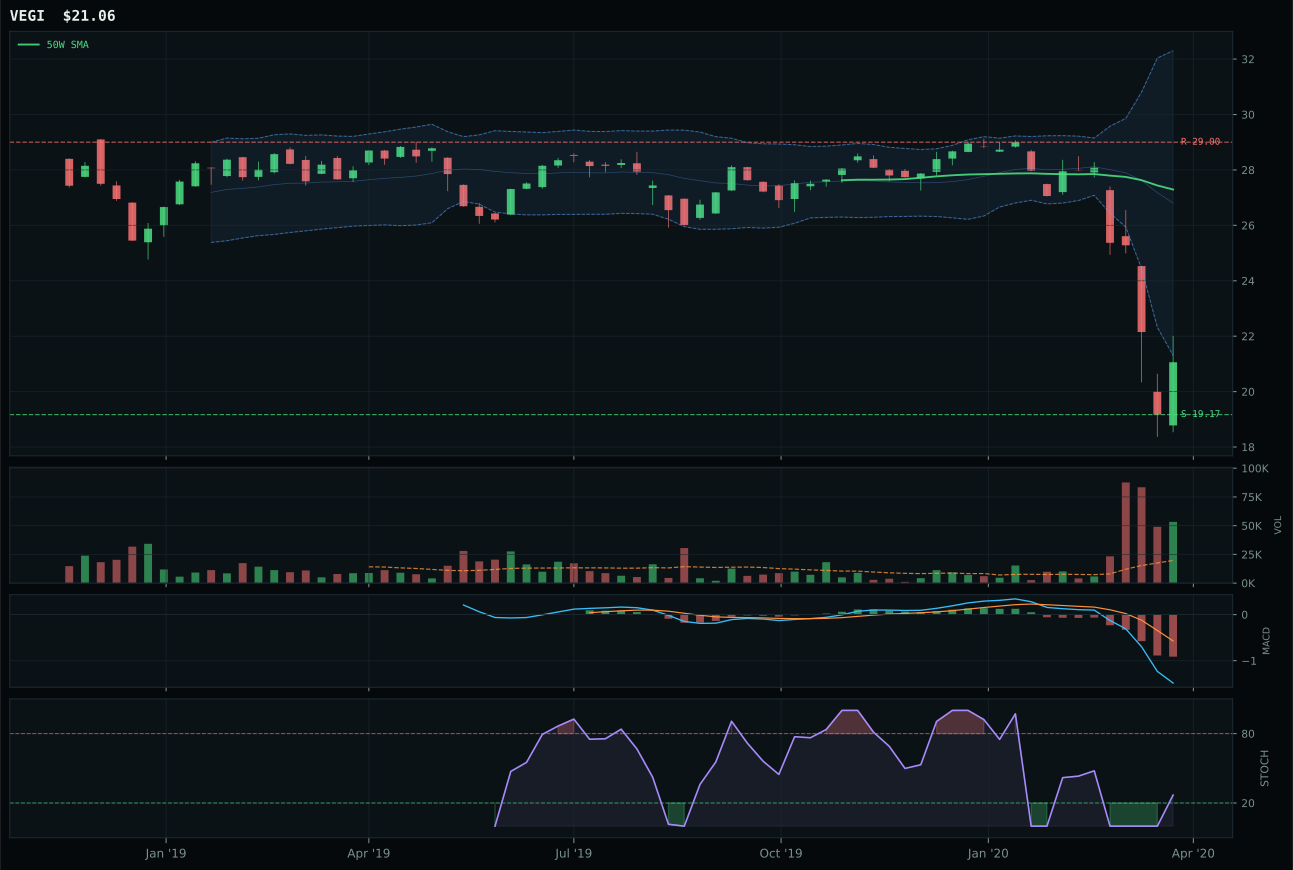
VEGI has a neutral structure profile with -5.7% 13-week relative strength versus SPY.
A failed hold above support would weaken the setup.
Tracked, but not top-2 eligible because: .
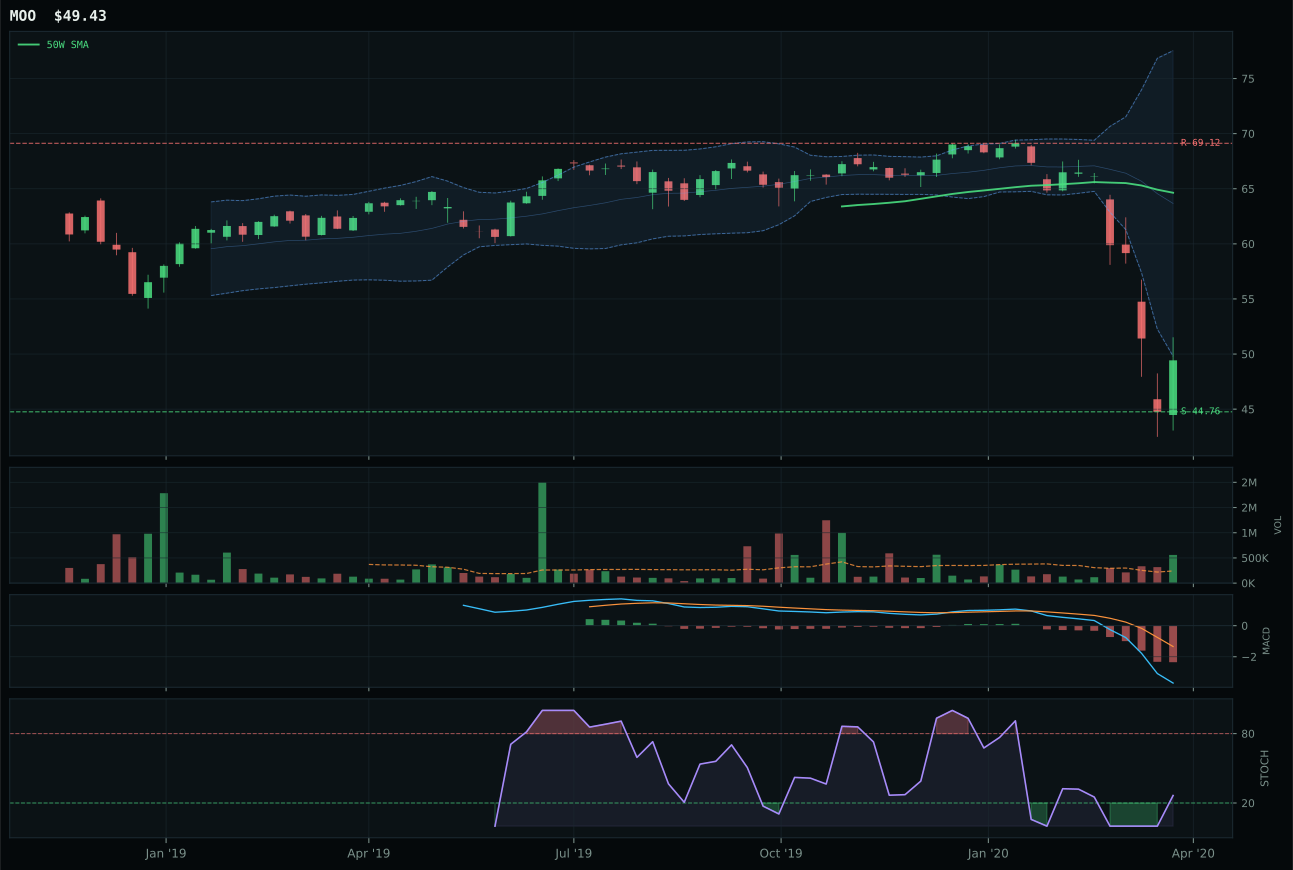
MOO has a neutral structure profile with -6.7% 13-week relative strength versus SPY.
A failed hold above support would weaken the setup.
Actionable but governed by invalidation levels.
MOO won a deeply flawed category by default: despite a 25.2-point loss to WEAT on the reasoning layer (45.0 versus 17.2 technical evidence), it emerged as the category representative after testing revealed WEAT failed hard structural filters. MOO's risk-reward of 100.0 stands alone—its 10.4% downside to 44.76 support and 28.5% upside to 69.12 resistance create mathematically perfect asymmetry, yet this perfection masks category dysfunction. Volume confirmation at 2.32x twenty-week average shows accumulation, and stochastic RSI at 0.26 mid-zone is early in reversion, but the minus 28.2% thirteen-week return and zero category-relative strength signal capitulation without evidence of institutional sponsorship. WEAT's plus 19.4% RS against SPY and plus 25.2% category relative strength made it the technical leader, but it traded at momentum extremes four percent above the 50W, failing the reset/pullback filter. Neither ETF shows clean accumulation: MOO works only because WEAT was structurally ineligible.
Agriculture & Livestock earned zero allocation and ranked 9th or 10th among the ten categories with a 1.6 final score—a complete exclusion. The category basket started at 36.4 (WEAT 45.0, VEGI 33.2, MOO 17.2) but collapsed to 1.6 after testing against persistence, volume-price confirmation, and macro descriptor alignment. Disinflation pressure is active (-8), a direct headwind to agricultural pricing expectations and farmer margins. The Goldilocks macro state offers no specific tailwind for agribusiness; liquidity expansion and AI growth sponsorship pass through this sector with minimal transmission. Most damning: the 23.0 persistence score for MOO and the 45.0 technical evidence for WEAT together paint a category entirely dependent on spot commodity moves rather than durable technical setups. This is not a structural portfolio exclusion—Agriculture remains eligible—but a weekly market outcome: no ETF in this category has earned conviction-level technical or macro alignment, so the five basis points saved by excluding it elsewhere in the sleeve are allocated to higher-conviction sleeves.