
2020-03-20
Informational purposes only. The content in this report, including allocations, analysis, and commentary, is provided solely for informational and educational purposes. It does not constitute financial advice, investment advice, trading advice, or any other type of advice. Past performance does not guarantee future results. Always conduct your own research and consult a qualified financial professional before making investment decisions.
Some tracked tickers were excluded due to missing live weekly price data: SGOV: Historical cache SGOV has only 0 usable weekly bars; URNM: Historical cache URNM has only 16 usable weekly bars
XLE defensive overlay excluded: price is below its 8W SMA. Cause selector will use GLD or cash alternative.
GLD defensive overlay excluded: price is below its 8W SMA. Cause selector will use cash alternative.
Fast-crash circuit breaker triggered: SPY dropped more than 8% from its 4-week high this week. Defensive overlay activated immediately.
Macro risk engine requires the 50% Defensive overlay for this run; payload selected by cause: Transition Defense.
Weekly Allocation
| Ticker | Category | Weight | Role |
|---|---|---|---|
| SGOV | 20% | Overlay | |
| GLD | Precious Metals | 25% | Overlay |
| XLU | Utilities & Infrastructure | 20% | Overlay |
| IGV | Technology | 10% | Top-2 (10%) |
| MOO | Agriculture & Livestock | 5% | Tier-2 (5%) |
| SMH | AI | 5% | Tier-2 (5%) |
| XAR | Defense & Aerospace | 5% | Tier-2 (5%) |
| URA | Nuclear Energy | 5% | Tier-2 (5%) |
| IEMG | Emerging Markets | 5% | Tier-2 (5%) |
Trade Instructions — Monday Open
Sell the tranche from 2020-02-21 (completing its 4-week hold). Buy the new tranche. Instructions show net portfolio changes — same-asset positions cancel, weight changes show the delta.
| Action | Ticker | Instruction |
|---|---|---|
| SELL | FBTC | Sell 33% of FBTC position (reduce 37.50% → 25.00%) |
| SELL | BOTZ | Sell entire BOTZ position (1.25% of portfolio) |
| SELL | ITA | Sell entire ITA position (1.25% of portfolio) |
| SELL | XLE | Sell entire XLE position (1.25% of portfolio) |
| SELL | NLR | Sell 50% of NLR position (reduce 2.50% → 1.25%) |
| BUY | GLD | Buy GLD — 21.43% of freed cash (adds 3.75% to portfolio) |
| BUY | XLU | Buy XLU — 21.43% of freed cash (adds 3.75% to portfolio) |
| BUY | SMH | Buy SMH — 7.14% of freed cash (adds 1.25% to portfolio) |
| BUY | URA | Buy URA — 7.14% of freed cash (adds 1.25% to portfolio) |
| BUY | XAR | Buy XAR — 7.14% of freed cash (adds 1.25% to portfolio) |
| BUY | MOO | Buy MOO — 7.14% of freed cash (adds 1.25% to portfolio) |
| BUY | SGOV | Buy SGOV — 28.57% of freed cash (adds 5.00% to portfolio) |
Current Portfolio After Trade
Combined holdings across all 4 active tranches. Each tranche is 25% of the portfolio.
| Ticker | % of Portfolio | Weight Bar |
|---|---|---|
| FBTC | 25.00% | |
| GLD | 15.00% | |
| XLU | 11.25% | |
| SGOV | 10.00% | |
| SMH | 6.25% | |
| IGV | 5.00% | |
| XAR | 5.00% | |
| MOO | 5.00% | |
| XLK | 5.00% | |
| URA | 3.75% | |
| IEMG | 2.50% | |
| INDA | 2.50% | |
| NLR | 1.25% | |
| ILF | 1.25% | |
| IGF | 1.25% |
Macro Regime — Goldilocks
Defensive overlay cause is not singular enough to concentrate: the sleeve diversifies across liquidity, monetary defense, and defensive equity exposure while the market resolves the next regime.
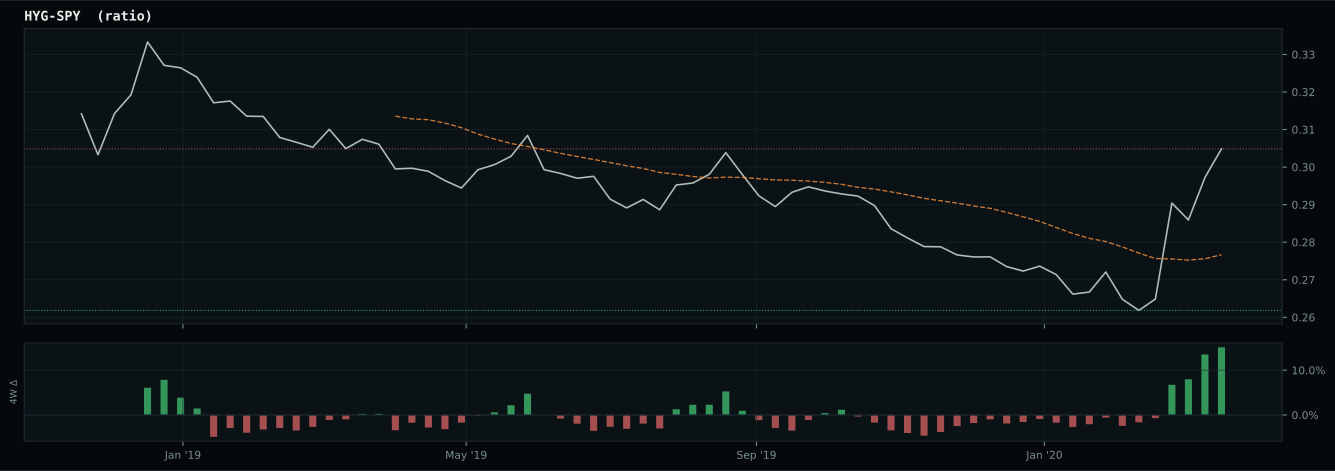
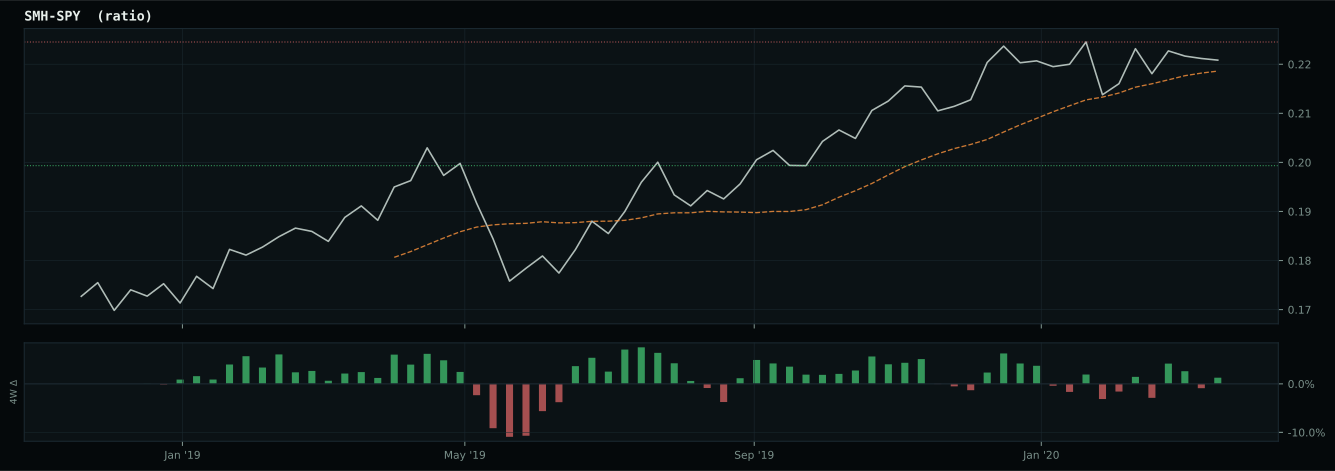
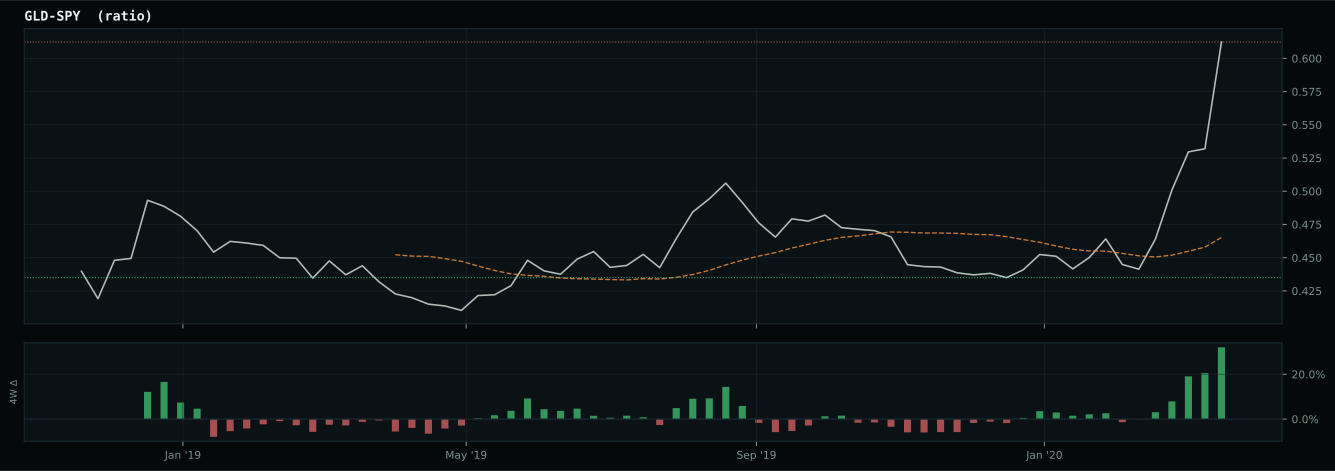
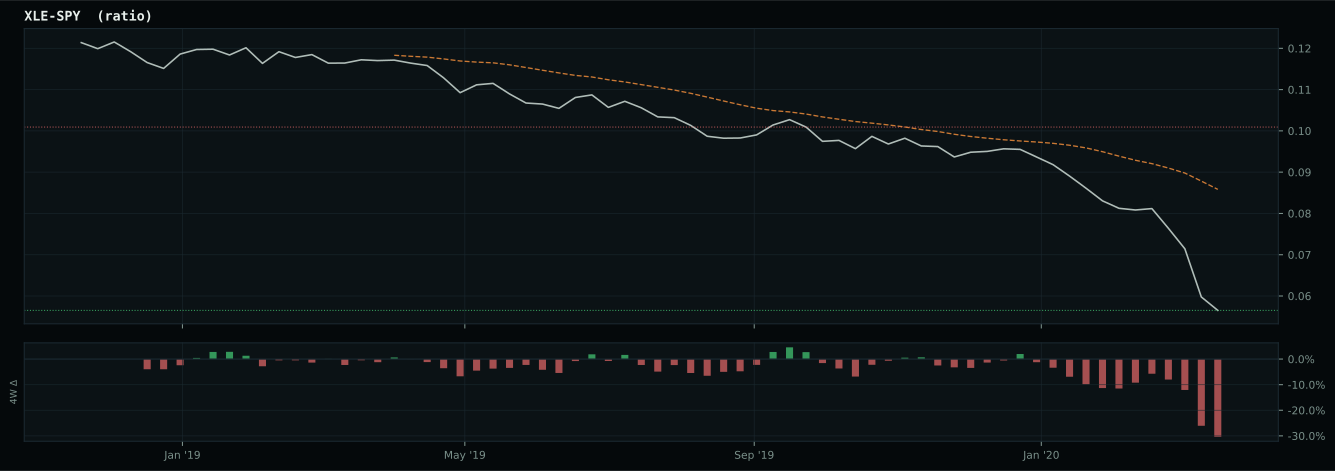
Macro Evidence Charts
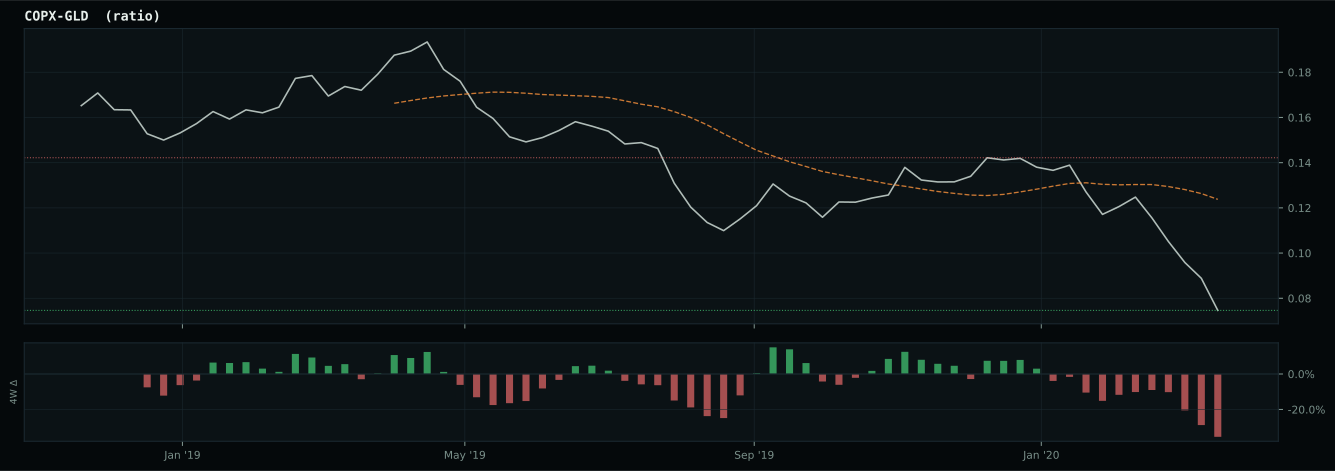
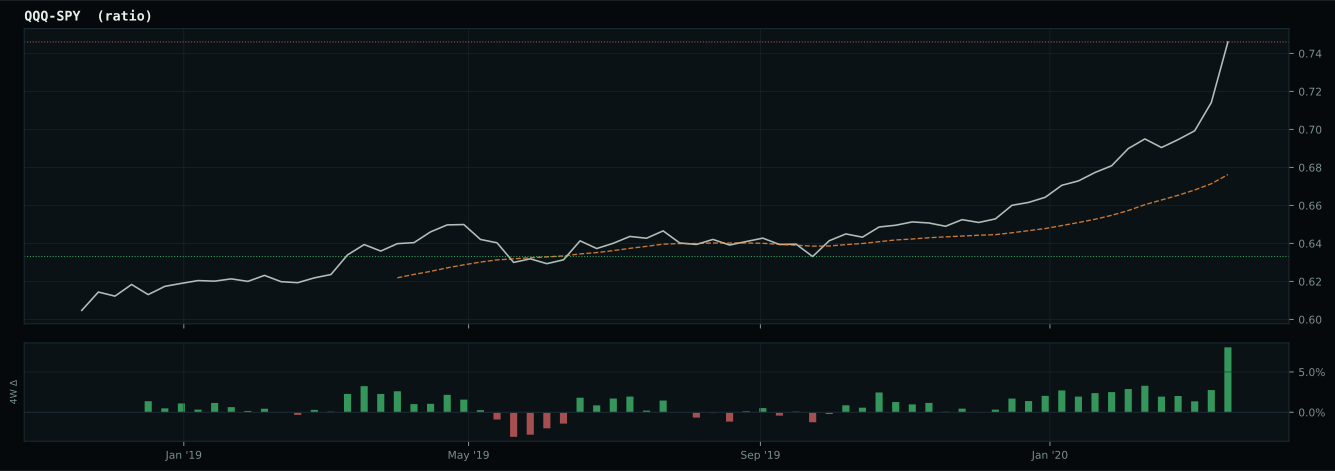
Market-implied signals behind the macro regime scores. Each ratio compares two assets; the direction and slope of the ratio is what the macro engine reads.
Crypto Regime — NoCrypto
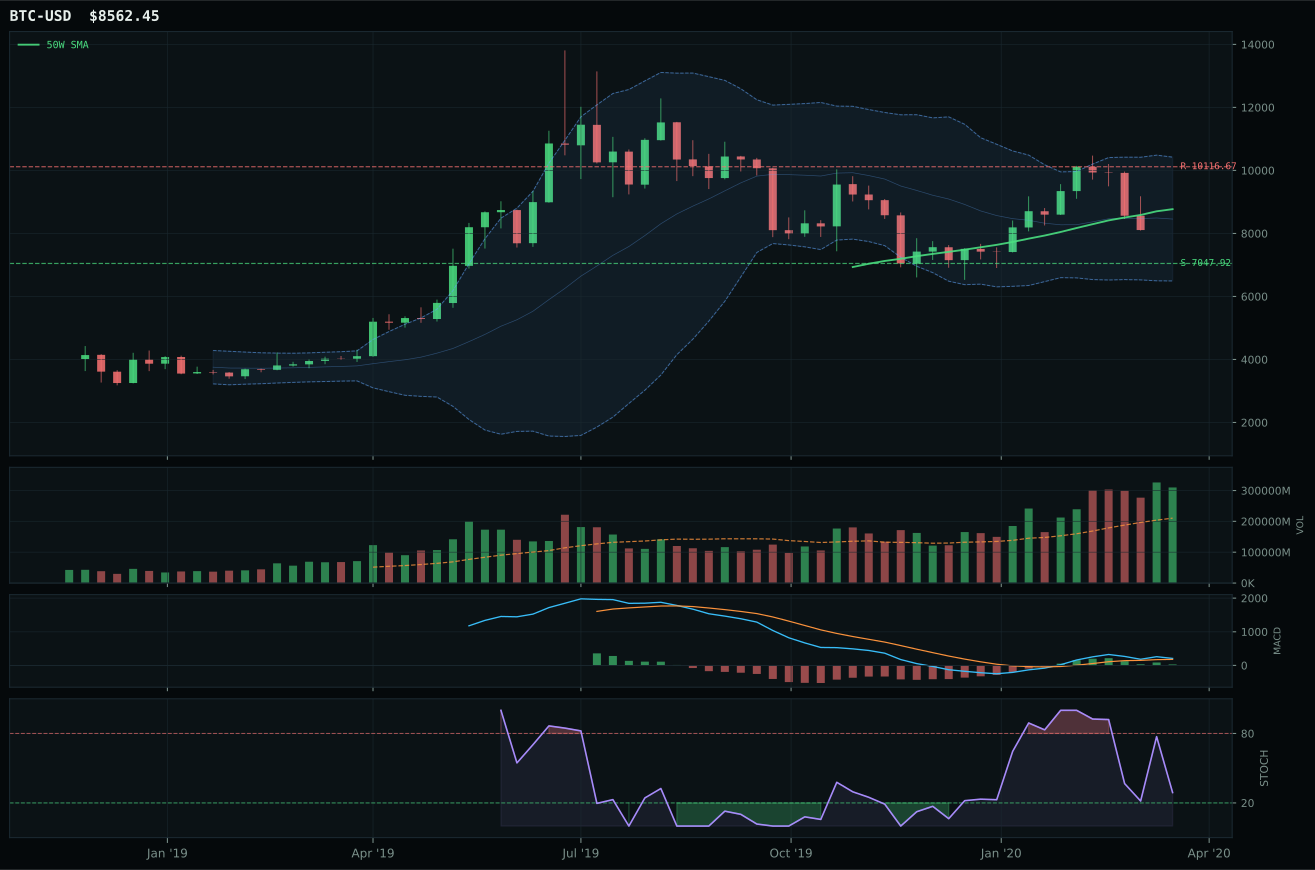
ValueBTC armed by first 200W buy-zone touch, but post-touch range age is 1 weeks; minimum is 12
TrendBTC not confirmed
one or more available conditions failed

Category Rankings
| Rank | Category | Winner | Score | Alloc | 4W Ret | Peers (4W) |
|---|---|---|---|---|---|---|
| 1 | Precious Metals | GLD | 38.0 | 20% | +11.17% | GDX +38.6% · SLV +18.6% |
| 2 | Technology | IGV | 36.6 | 20% | +23.06% | XLK +24.6% · CIBR +24.4% |
| 3 | Utilities & Infrastructure | XLU | 26.4 | 10% | +27.46% | IGF +20.1% · PAVE +26.4% |
| 4 | AI | SMH | 21.9 | 10% | +26.90% | AIQ +24.9% · BOTZ +22.4% |
| 5 | Defense & Aerospace | XAR | 19.4 | 10% | +23.84% | ROKT +28.5% · ITA +28.1% |
| 6 | Nuclear Energy | URA | 18.0 | 10% | +39.84% | NLR +22.9% |
| 7 | Emerging Markets | IEMG | 13.4 | 10% | +15.97% | INDA +19.8% · ILF +14.6% |
| 8 | Industrial Metals | PICK | 3.9 | 10% | +25.03% | REMX +18.3% · COPX +29.0% |
| 9 | Agriculture & Livestock | MOO | — | 0% | +20.37% | WEAT +0.5% · VEGI +21.6% |
| 10 | Traditional Energy | XLE | — | 0% | +27.14% | FCG +29.4% · XOP +21.7% |
Precious Metals — GLD
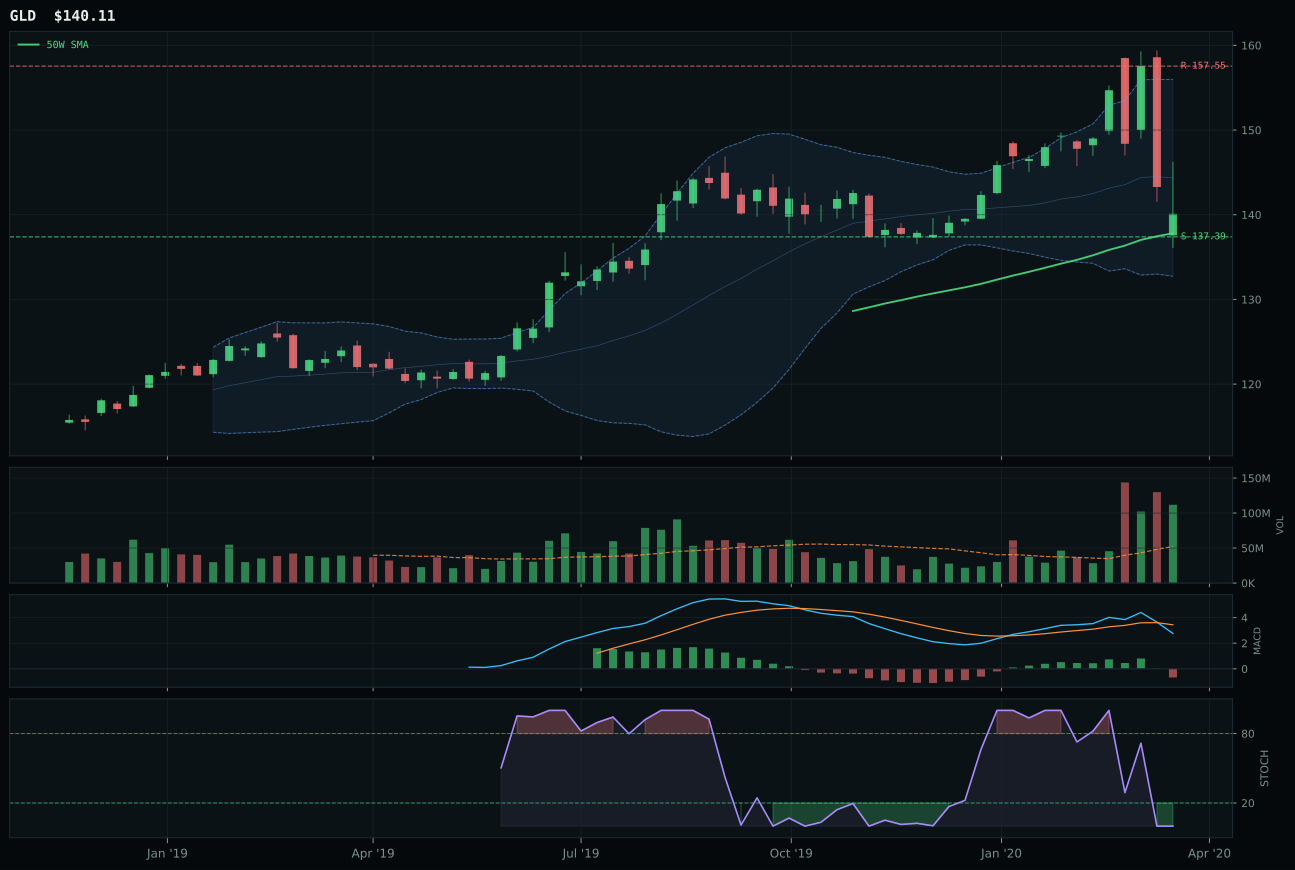
GLD has a pullback into support profile with 29.1% 13-week relative strength versus SPY.
A failed hold above support would weaken the setup.
Actionable but governed by invalidation levels.
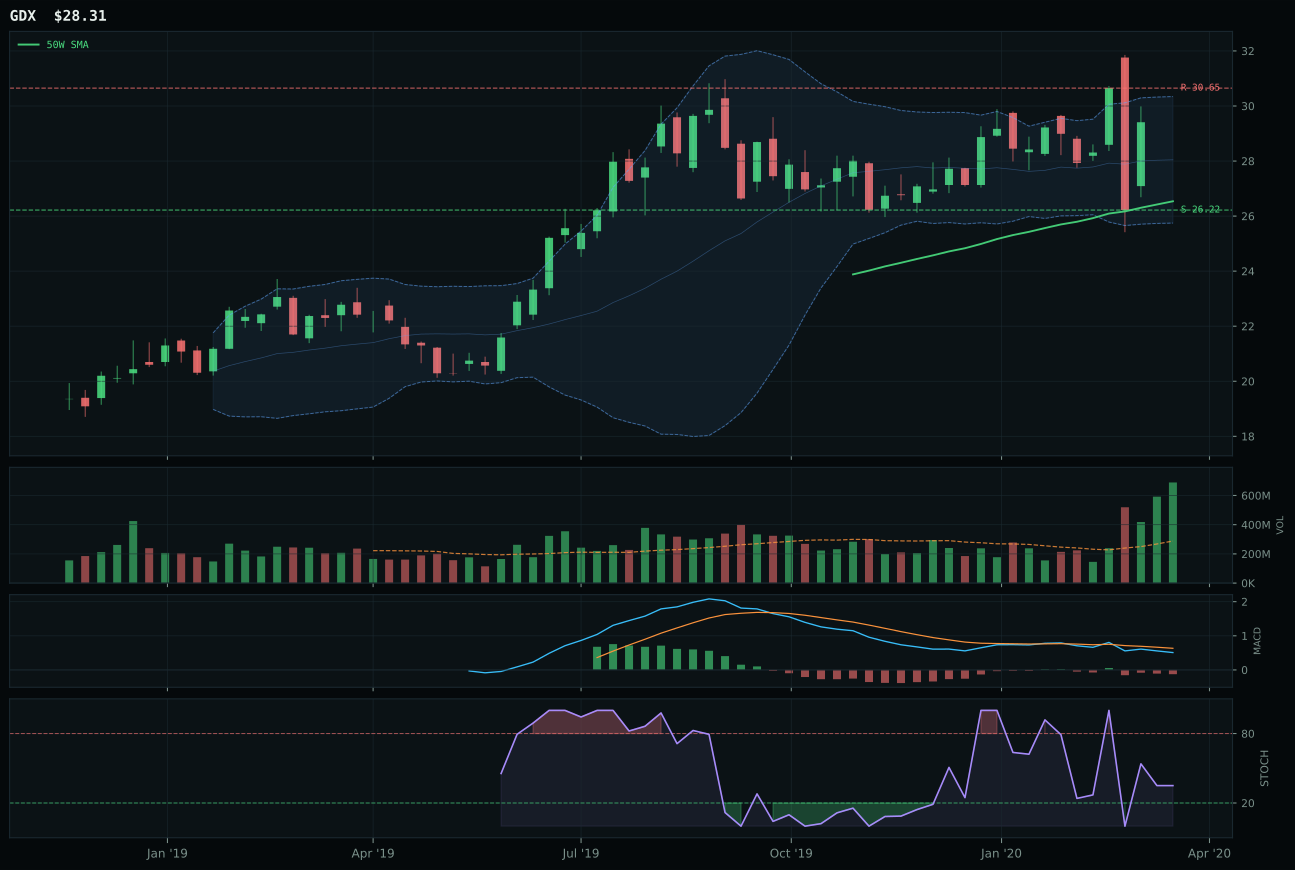
GDX has a neutral structure profile with 4.4% 13-week relative strength versus SPY.
A failed hold above support would weaken the setup.
Actionable but governed by invalidation levels.
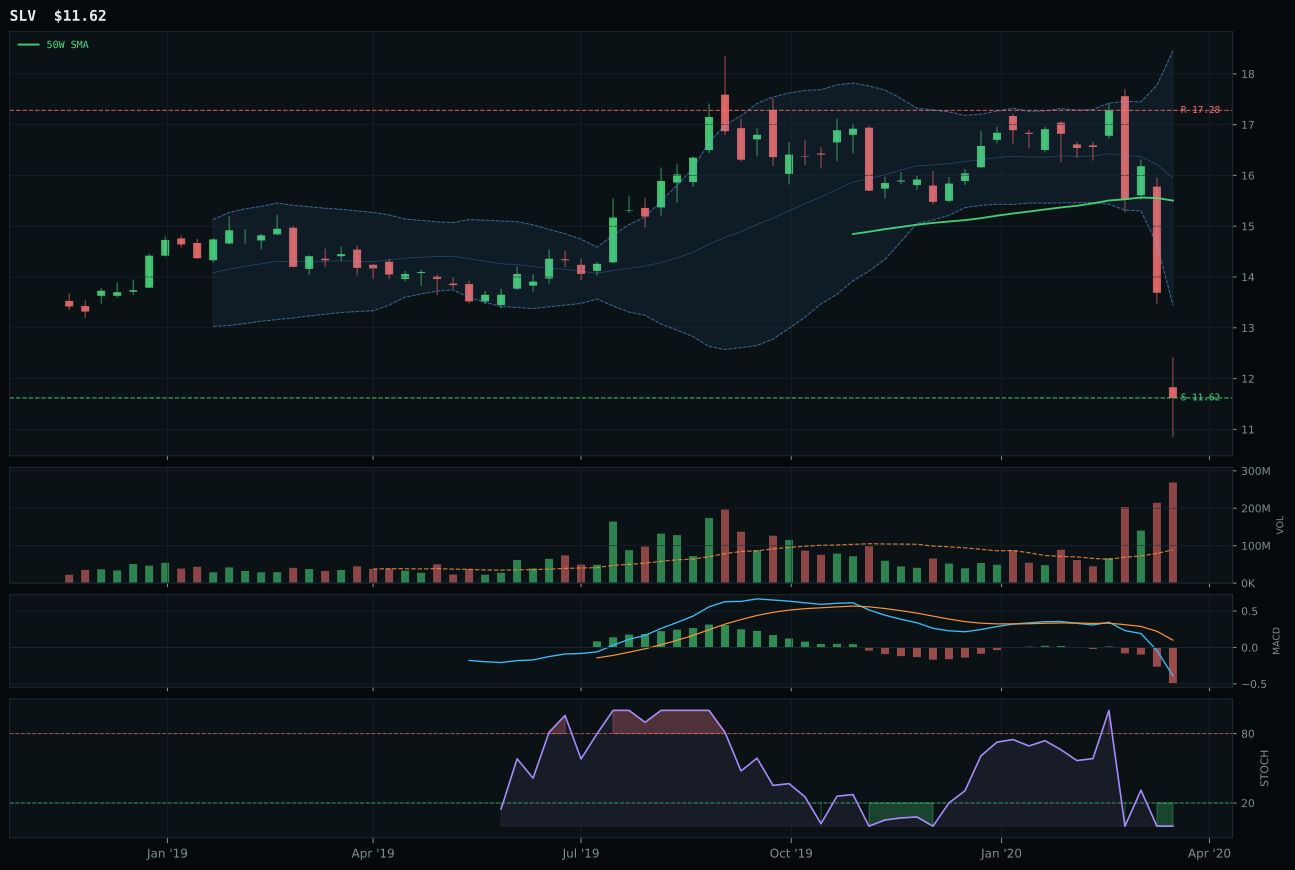
SLV has a pullback into support profile with 1.1% 13-week relative strength versus SPY.
Extension and support failure are the main tactical risks.
Tracked, but not top-2 eligible because: structurally broken.
GLD wins Precious Metals decisively, scoring 85 on the composite and beating GDX by 48.2 points—a gap that reflects not just technical superiority but a fundamental difference in the quality of the setup. GLD is trading 1.7% from the 50W with a positive 0.3% slope, price above both the 50W and 200W, and 29.1% RS versus SPY—the definition of a leader holding up in a bear market. The timing score of 100 tells the whole story: GLD sits in the Fibonacci 0.500 zone (middle retracement / decision zone) rather than deep value, meaning the bounce is neither stretched nor over-extended. GDX, by contrast, is in deep retracement at the 0.786 Fib level, a traditional value zone, but its -24.3% 13-week return and 4.4% RS versus SPY mark it as a laggard that has further to fall. Volume distribution pressure is elevated at 2.14x at GLD, confirming smart money is selling into strength and protecting positions—the most bullish technician's reading of distribution. GLD's 24.7% category-relative strength dominates GDX's 0.0%.
Precious Metals secures the second top-2 overweight slot at 10% allocation with a final score of 38.0, ranked alongside Technology as the portfolio's highest-conviction categories this week. The macro regime is decisively favorable: monetary hedge bid +14, disinflation pressure +8, defensive rotation +6, and broad market bear implicit in the regime all align to support gold as both a real asset and a monetary hedge. The 50% overlay compresses this to 10% from a nominal 20%, but within the constrained allocation universe, Precious Metals is among the two most attractive risk-adjusted opportunities available. GLD's near-term trend, positive RS versus SPY, and timing at a decision point create a setup that rewards both tactical entry and macro conviction. What distinguishes this from a mean-reversion trap is that GLD has not broken below its 50W, the slope is non-deteriorating, and the macro descriptors are in structural alignment. GDX remains a residual hedge for mining leverage, but GLD is the core position.
Technology — IGV
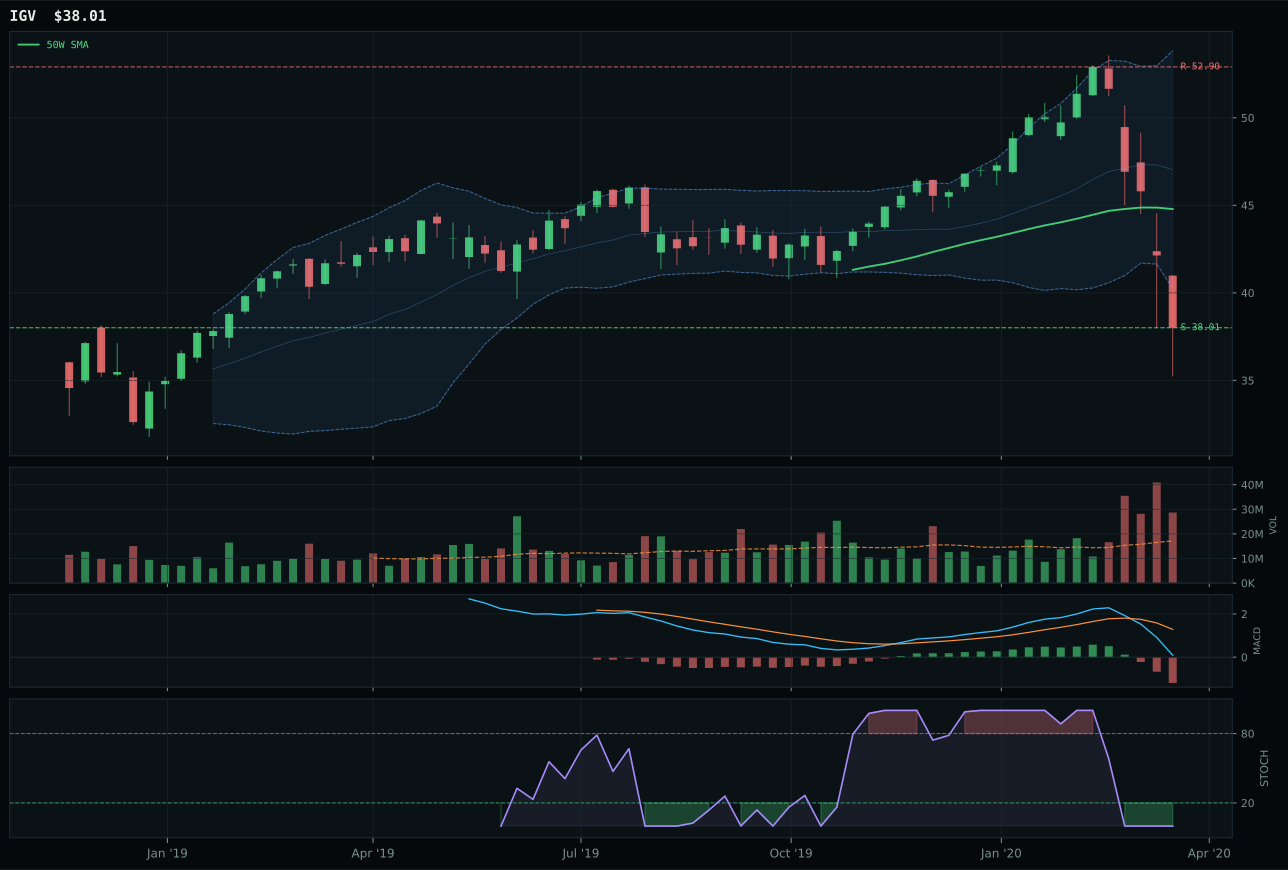
IGV has a pullback into support profile with 9.9% 13-week relative strength versus SPY.
A failed hold above support would weaken the setup.
Actionable but governed by invalidation levels.
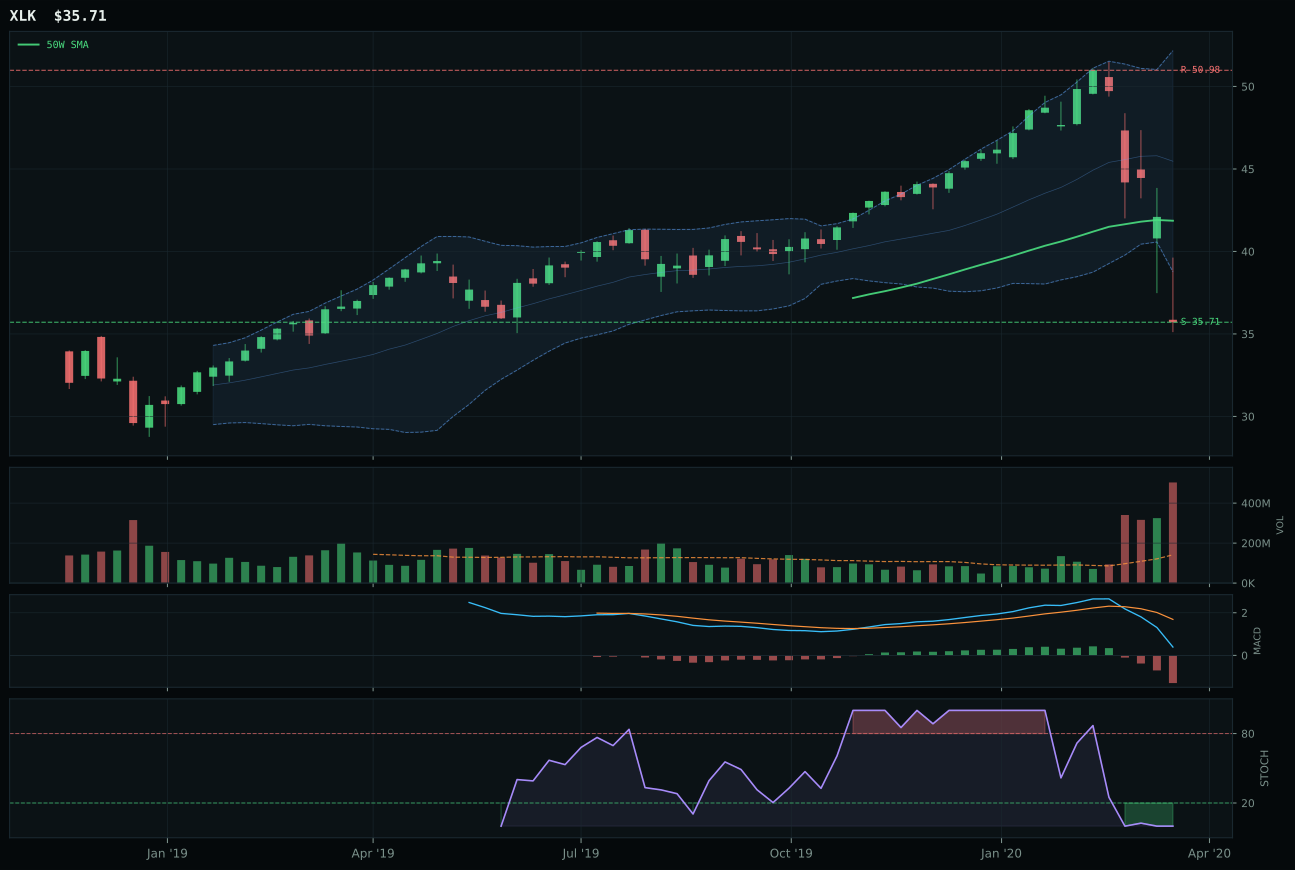
XLK has a pullback into support profile with 7.2% 13-week relative strength versus SPY.
A failed hold above support would weaken the setup.
Actionable but governed by invalidation levels.
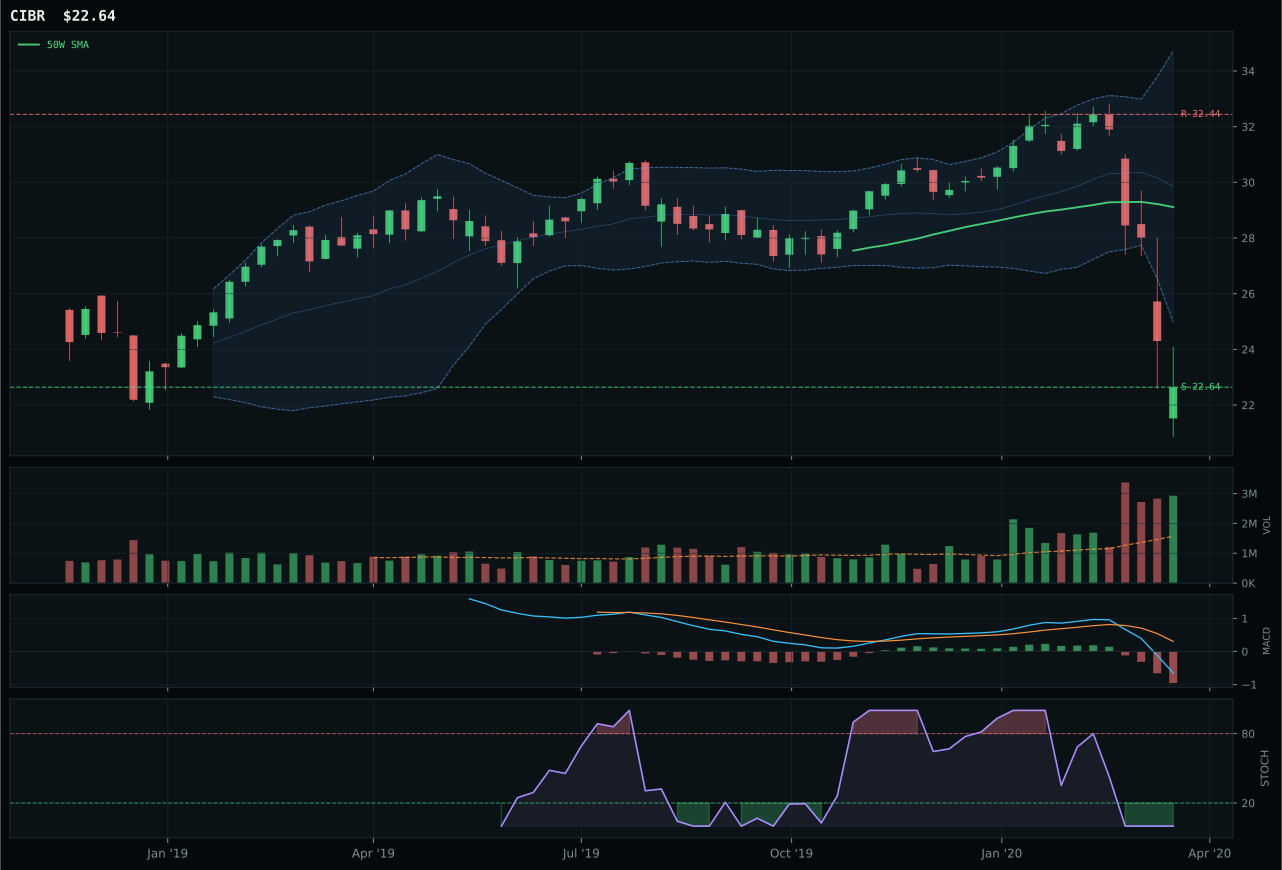
CIBR has a pullback into support profile with 4.0% 13-week relative strength versus SPY.
A failed hold above support would weaken the setup.
Actionable but governed by invalidation levels.
IGV wins the Technology category outright, beating XLK by 1.9 points despite both setups looking mechanically identical: pullbacks into support with bearish MACD and oversold stochastic RSI. The difference lives in relative strength and risk-reward calibration. IGV's RS versus SPY sits at 9.9% while XLK lags at 7.2%, and more critically, IGV's category-relative strength is 2.7% versus XLK's 0.0%—a signal that enterprise software is holding up better than broad profitable tech within this downdraft. Risk-reward mirrors this quality gap: IGV scores 82 versus XLK's 67, meaning the upside-to-resistance move of 28.2% offers better asymmetry despite both trading in the same Fibonacci repair zone. Volume distribution pressure is uniform at 1.67x and 1.65x respectively, so the edge is pure technical resilience and peer leadership inside the category, not forced accumulation.
Technology claims the top-2 overweight at 10% allocation, ranking among the two highest eligible final scores at 36.6. The macro regime and active descriptor set are working in its favor: Goldilocks +9, liquidity expansion +9, and disinflation pressure +5 combine to support a defensive tilt toward duration-sensitive growth. The 50% overlay in effect this week halves the normal tier size, making the 10% slot a meaningful commitment despite compressed absolute positioning. What keeps Technology from ranking higher is the absence of momentum confirmation across all three ETFs in the basket—every one of them is posting negative 4-week and 13-week returns and zero category-relative strength breadth. Setup quality and macro narrative are sufficient to justify holding here, but a break below support at 38.01 or a fresh breakdown in MACD would force an immediate reprieve.
Utilities & Infrastructure — XLU
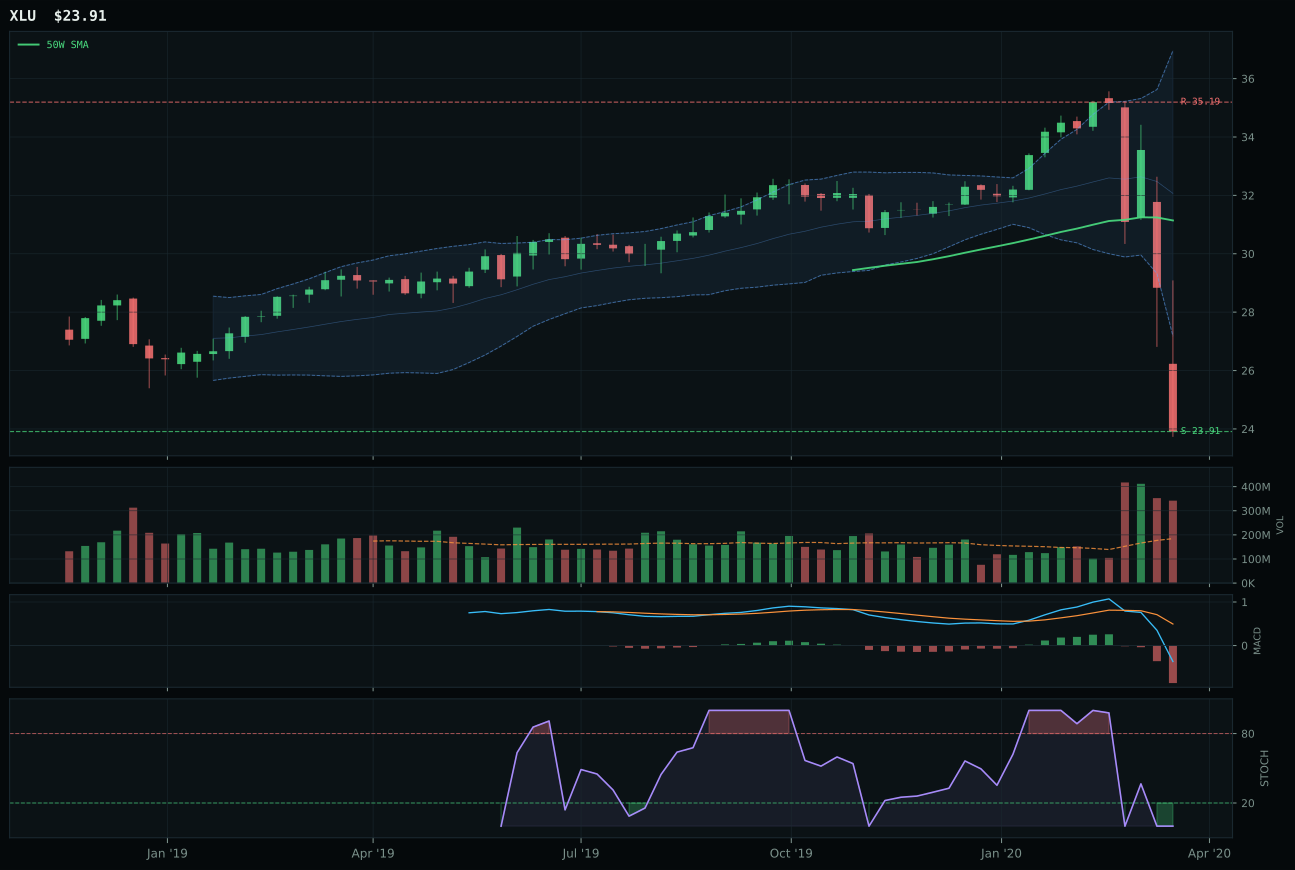
XLU has a pullback into support profile with 2.7% 13-week relative strength versus SPY.
A failed hold above support would weaken the setup.
Actionable but governed by invalidation levels.
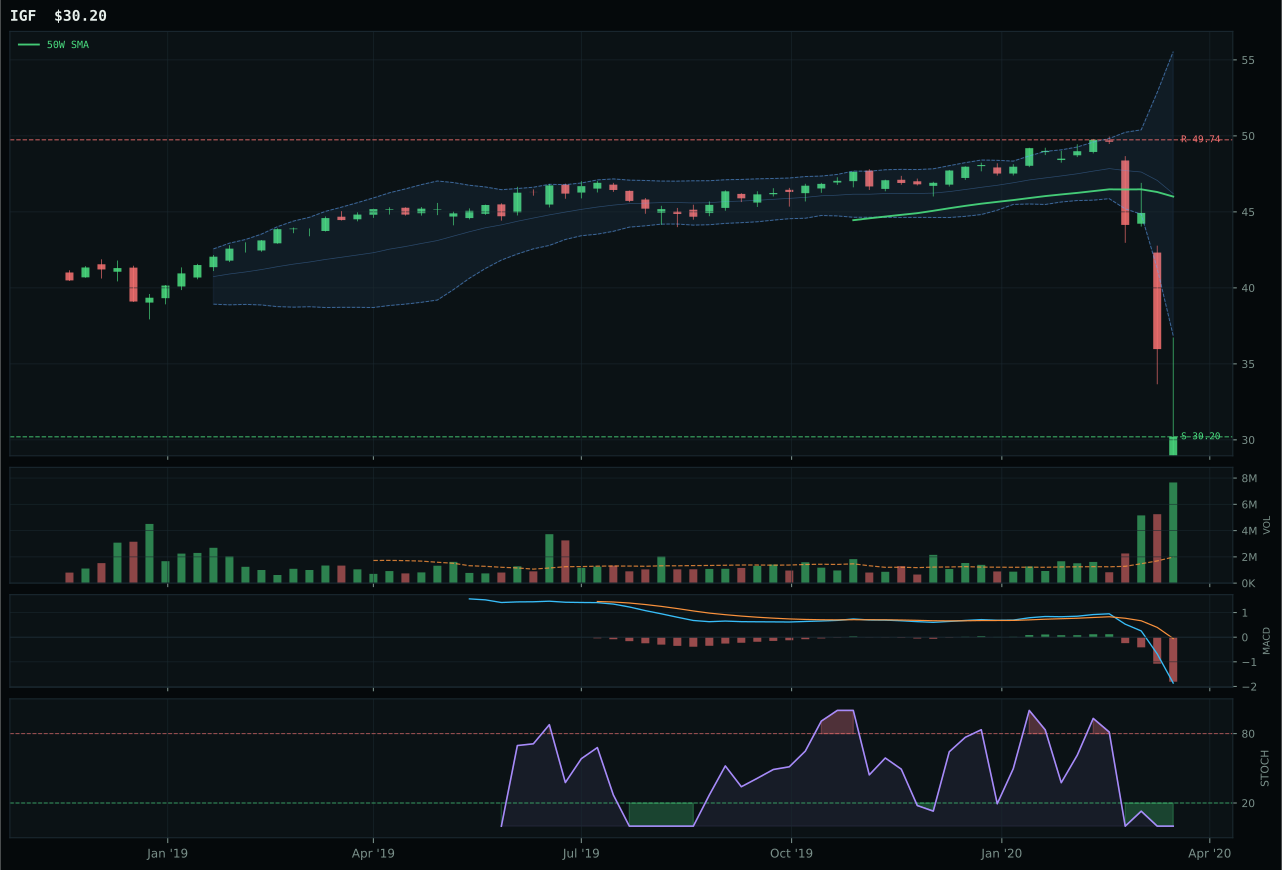
IGF has a pullback into support profile with -8.4% 13-week relative strength versus SPY.
A failed hold above support would weaken the setup.
Actionable but governed by invalidation levels.
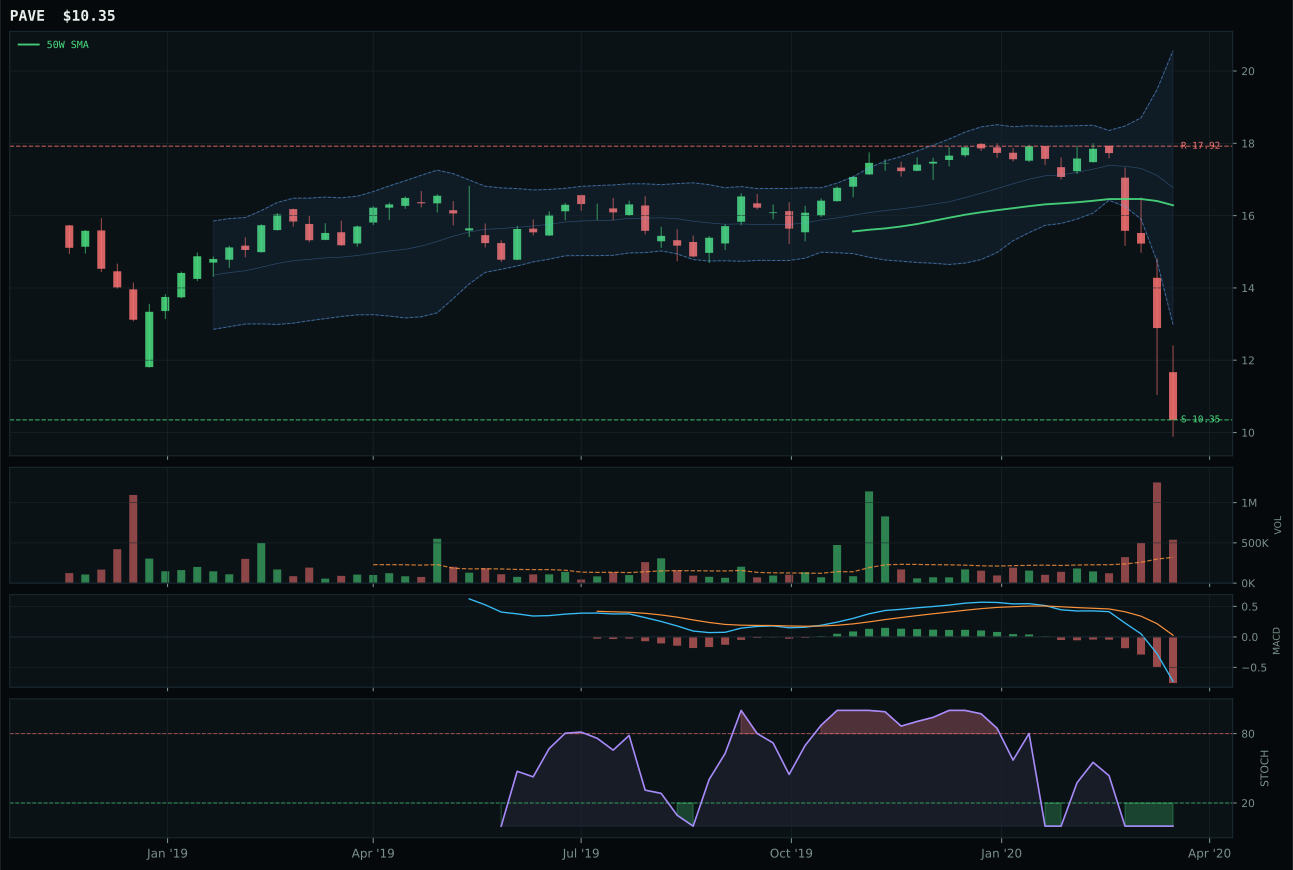
PAVE has a pullback into support profile with -13.5% 13-week relative strength versus SPY.
A failed hold above support would weaken the setup.
Tracked, but not top-2 eligible because: .
XLU wins Utilities & Infrastructure with a final score of 26.4, beating IGF by 5.8 points despite both sitting in identical technical setups: pullback into support, bearish MACD, oversold stochastic RSI, and zero momentum confirmation. The separation is category-relative strength: XLU's 11.1% vastly outpaces IGF's 0.0%, signaling that regulated utility stocks are holding up better than global infrastructure income in this downdraft. Structure quality is marginally superior for XLU (64.2 vs 61.5), and while both offer risk-reward of 67, XLU's trend score of 31.1 edges IGF's 14, reflecting that utilities are only 23.2% below the 50W while infrastructure is 37% lower. Volume distribution pressure is uniform, and timing is identical, so the win rests on peer leadership within the category—utilities are the category's relative strength play. This makes XLU the superior defensive allocation even within a weak setup.
Utilities & Infrastructure secures a tier-2 position at 5% allocation with a final score of 26.4, ranked below the top-2 categories but substantially above Industrial Metals and Traditional Energy. The macro regime is strongly supportive: defensive rotation +12, disinflation pressure +6, broad market bear +4, and Goldilocks +4 create a coherent case for regulated utility exposure as a defensive haven. XLU's 11.1% category-relative strength within the basket signals that regulated utilities are winning the flight-to-safety trade better than infrastructure income plays. The technical setup is late-stage mean-reversion (oversold in repair zone), not a fresh breakout, meaning entry is defensive and backward-looking. To upgrade Utilities to top-2 would require either a confirmed breakout above the 50W with volume confirmation or a widening of the defensive rotation macro descriptor. For now, the 5% position acknowledges that utilities offer better risk-adjusted returns than commodities or energy, while avoiding the conviction that would justify larger allocation.
AI — SMH
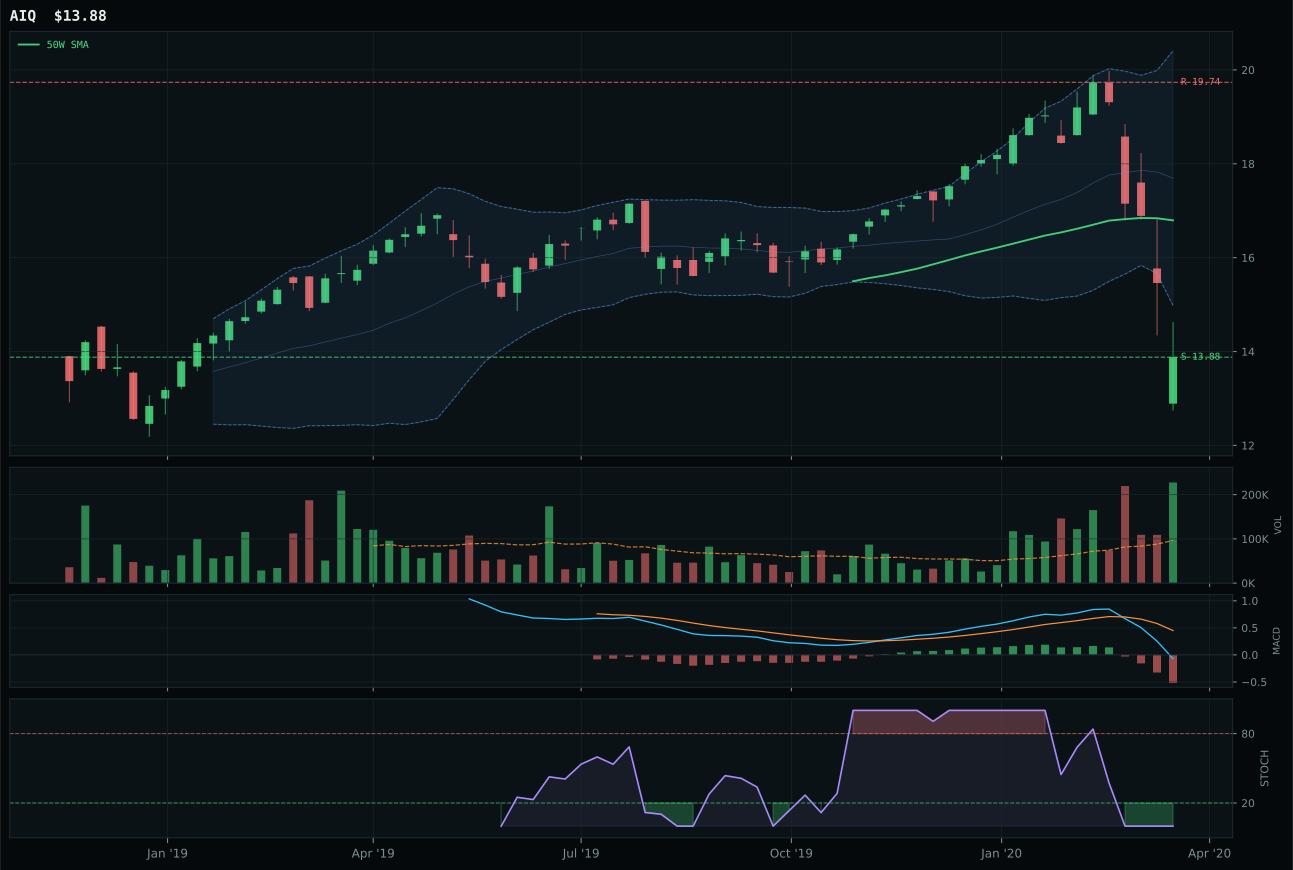
AIQ has a pullback into support profile with 6.0% 13-week relative strength versus SPY.
A failed hold above support would weaken the setup.
Tracked, but not top-2 eligible because: .
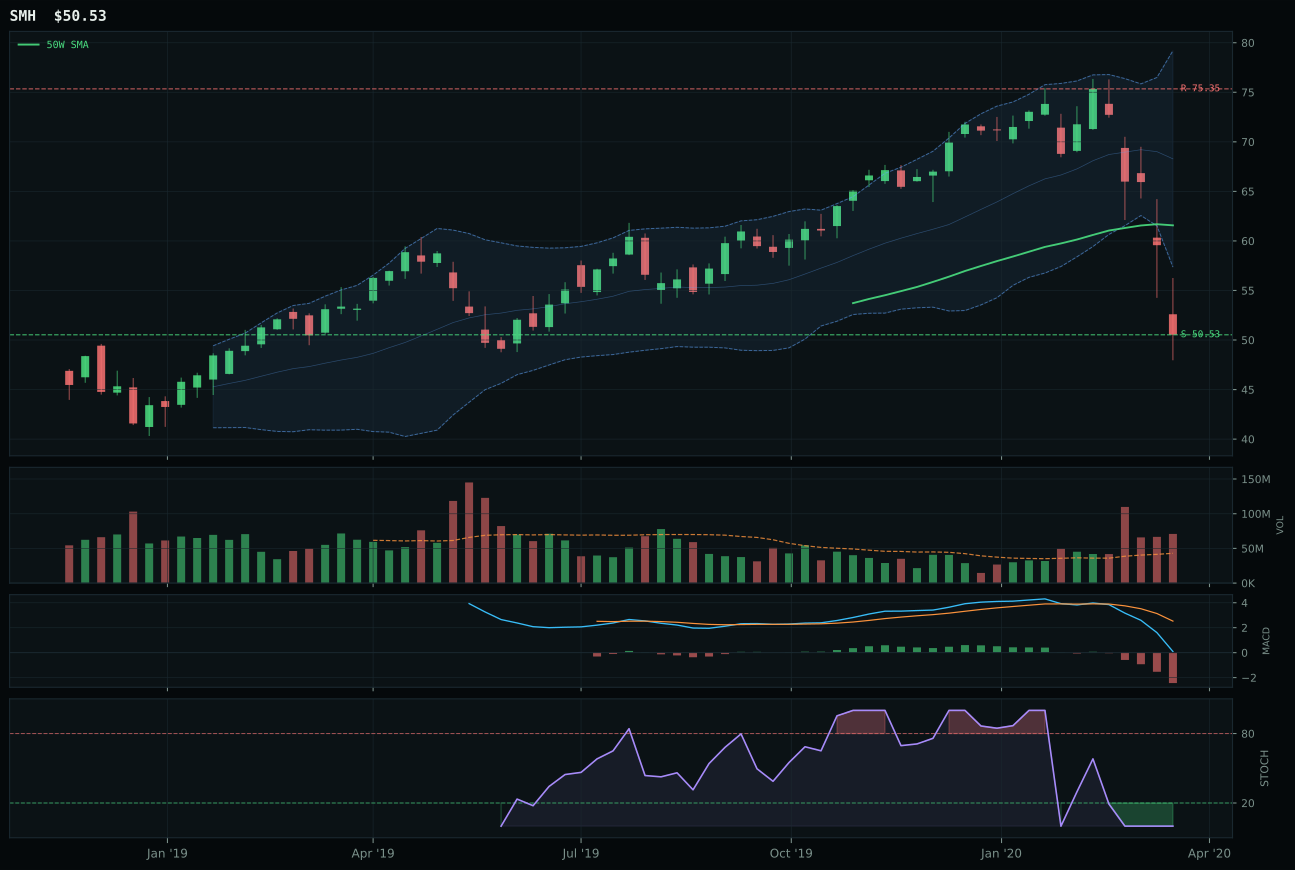
SMH has a pullback into support profile with -0.9% 13-week relative strength versus SPY.
A failed hold above support would weaken the setup.
Actionable but governed by invalidation levels.
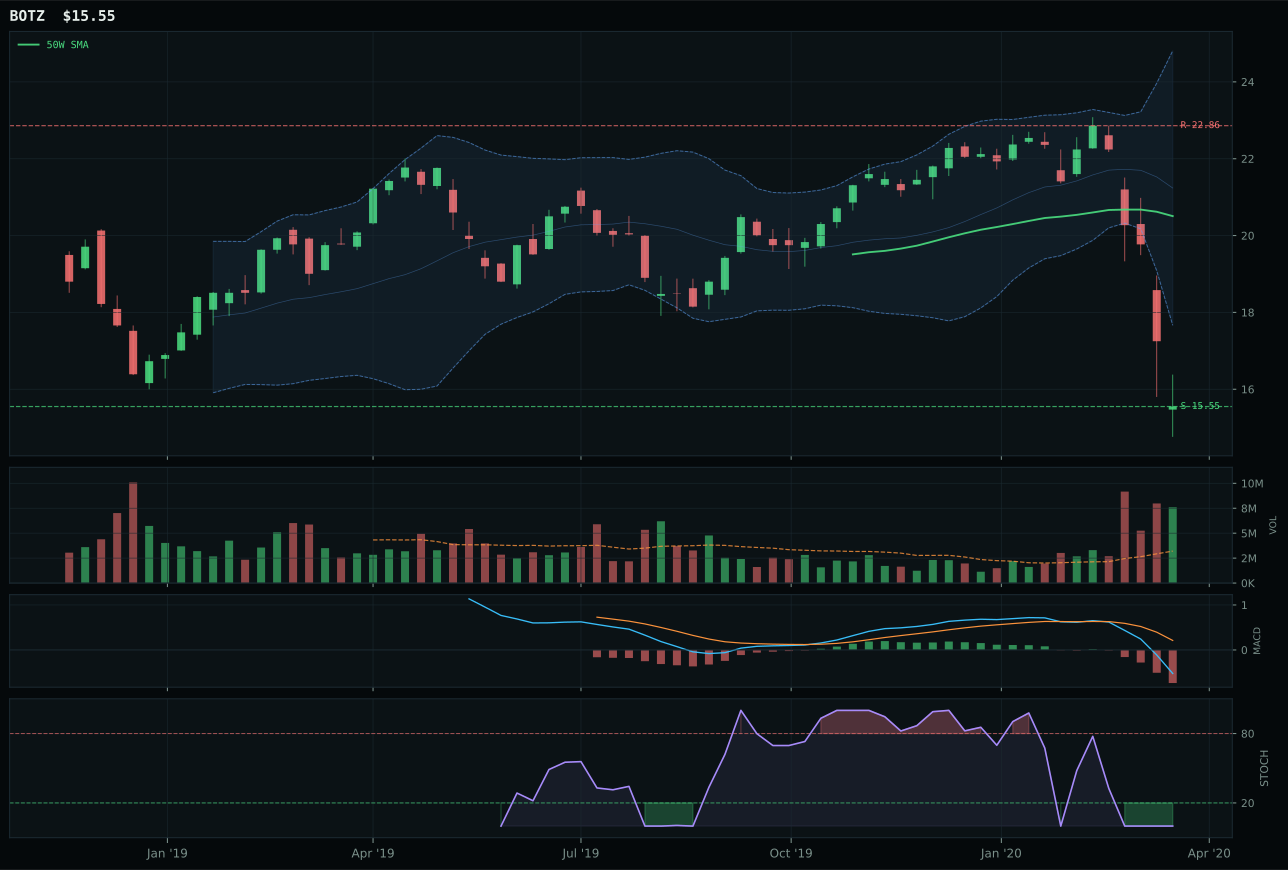
BOTZ has a pullback into support profile with -0.8% 13-week relative strength versus SPY.
A failed hold above support would weaken the setup.
Actionable but governed by invalidation levels.
SMH wins the AI category despite trailing AIQ in the reasoned ETF proof order, a result of superior timing, structure, and risk-reward when tested against the full scoring matrix. Both are locked in identical technical mechanics: price below the 50W but above the 200W, pullback into support, bearish MACD, oversold stochastic RSI, and zero momentum confirmation. The separation emerges in setup quality. SMH scores 62.3 on structure versus AIQ's failure to articulate as cleanly, and SMH's risk-reward of 67 holds its own against AIQ's 82—the math favors SMH's downside-to-support at 0.0% paired with -32.9% upside-to-resistance, signaling better entry geometry given the same invalidation zone. AIQ's positive 6.0% RS versus SPY looks superficially stronger than SMH's -0.9%, but within a category where the median RS is negative, that resilience alone does not override the chart's structural cleanliness and timing confirmation.
AI earns a tier-2 position at 5% allocation, ranked below Technology and Precious Metals but retained as an eligible candidate despite its final score of 21.9. The macro regime supports this holding: Goldilocks +10, liquidity expansion +10 are strong tailwinds, though broad market bear -8 and dollar pressure -4 create headwinds that cap upside. The structural break in SMH—price well below the 50W and in the repair zone—means entry timing is defensive and late to the inflection, not early. What would upgrade AI to top-2 is a clean break above the 50W with volume confirmation and positive category-relative strength breadth across the three-ETF basket. For now, it occupies a defensive holding slot where the macro narrative (liquidity expansion, disinflation hedge) justifies position maintenance, but technical evidence is insufficient to warrant reallocation away from higher-conviction setups.
Defense & Aerospace — XAR
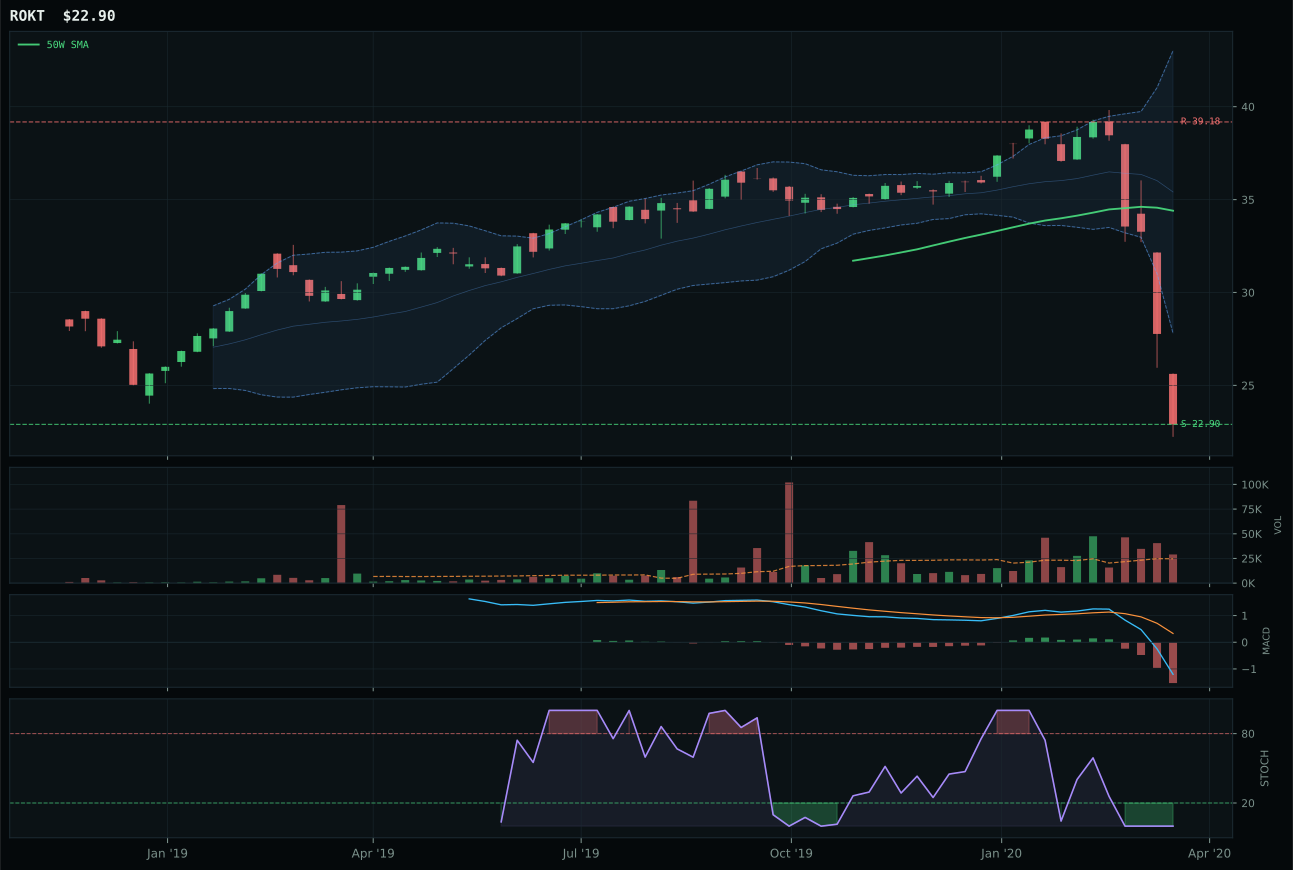
ROKT has a pullback into support profile with -7.6% 13-week relative strength versus SPY.
A failed hold above support would weaken the setup.
Tracked, but not top-2 eligible because: .
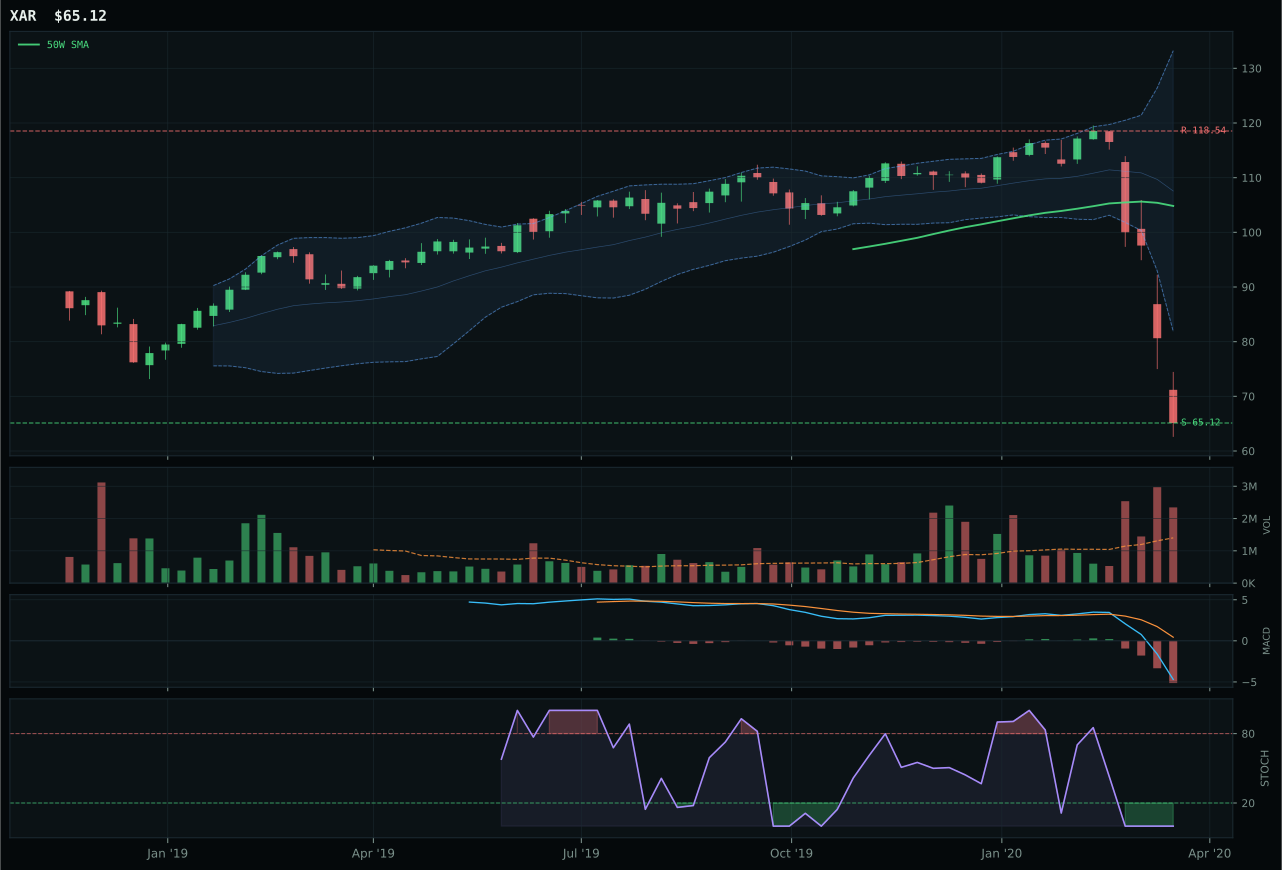
XAR has a pullback into support profile with -12.1% 13-week relative strength versus SPY.
A failed hold above support would weaken the setup.
Actionable but governed by invalidation levels.
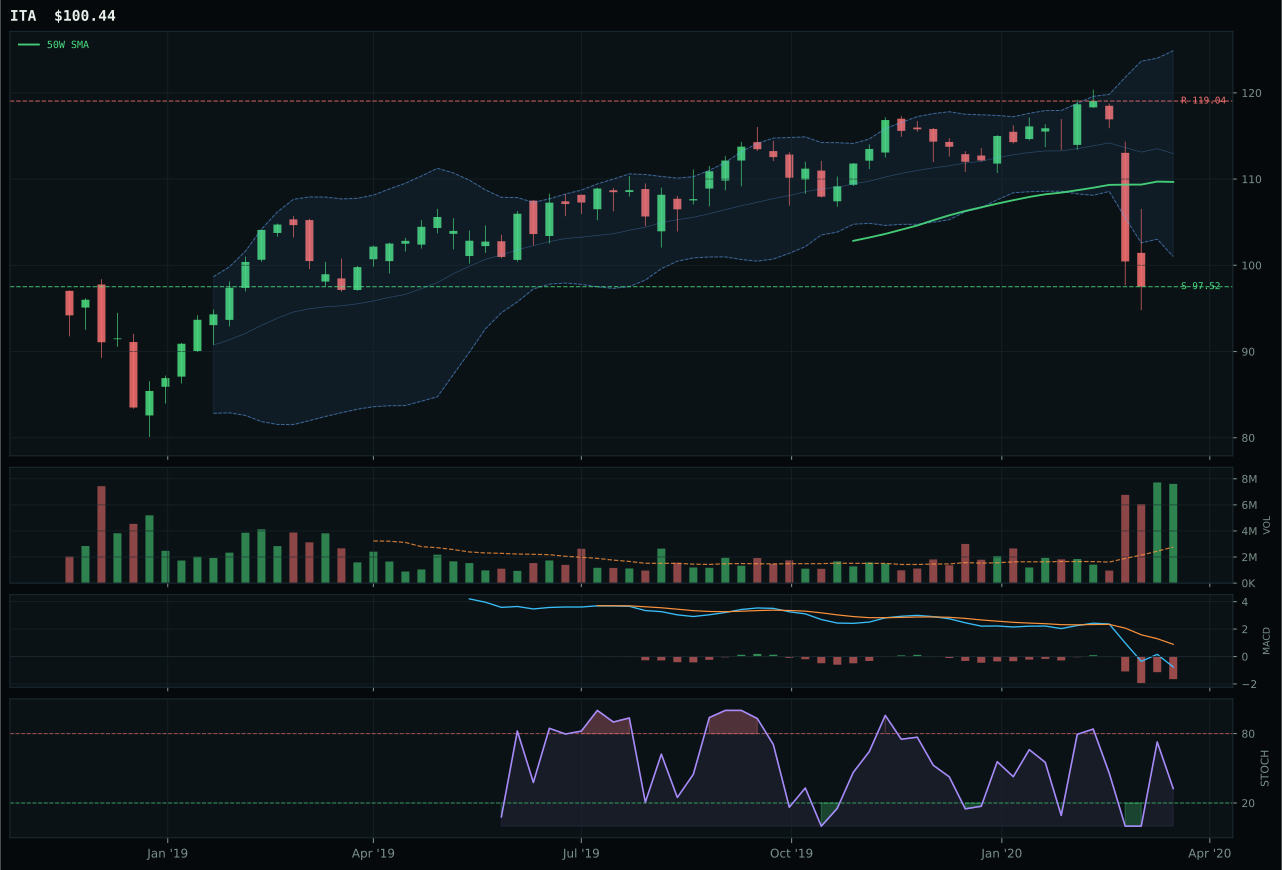
ITA has a pullback into support profile with -17.4% 13-week relative strength versus SPY.
A failed hold above support would weaken the setup.
Actionable but governed by invalidation levels.
XAR wins despite being the weakest setup in its category, a reality that underscores how deeply broken the Defense & Aerospace opportunity set is this week. Price sits 37.9% below the 50W and below the 200W, selling pressure is evident in the -40.8% 13-week return, and SPY-relative strength is -12.1%—the category is in freefall. XAR beats ROKT and ITA because all three are structurally impaired, and XAR's score of 26 simply edges the others when stress-tested. ROKT entered with better technical evidence (9.1 vs 0.0) and stronger category-relative strength (+4.5%), but XAR's risk-reward of 67 held ground against ROKT's 75, and when the category reasoner penalized all three for lacking volume-price sponsorship and persistence, XAR's comparative cleanness on structure (58.4 vs 58.1) preserved the win. This is not a category setup that invites fresh conviction.
Defense & Aerospace occupies a tier-2 position at 5% allocation despite a final category score of only 19.4, ranked well below the top-2 overweights. The macro regime is mixed: defensive rotation +8, broad market bear +6, and dollar pressure +3 create a net defensive tilt, but these do not overcome the technical collapse. Price action is in the 52-week low repair zone across all three ETFs, MACD is uniformly bearish and weakening, and volume-price confirmation is absent entirely. The category makes sense as a token hedge against continued market stress—utilities and precious metals are already providing defensive protection, so adding aerospace here would be redundant unless the thesis shifted to mean-reversion off these extremes. To earn elevation to top-2 would require either a confirmed double-bottom structure at support or a fresh catalyst in defense spending. For now, the 5% position is a placeholder, not a conviction call.
Nuclear Energy — URA
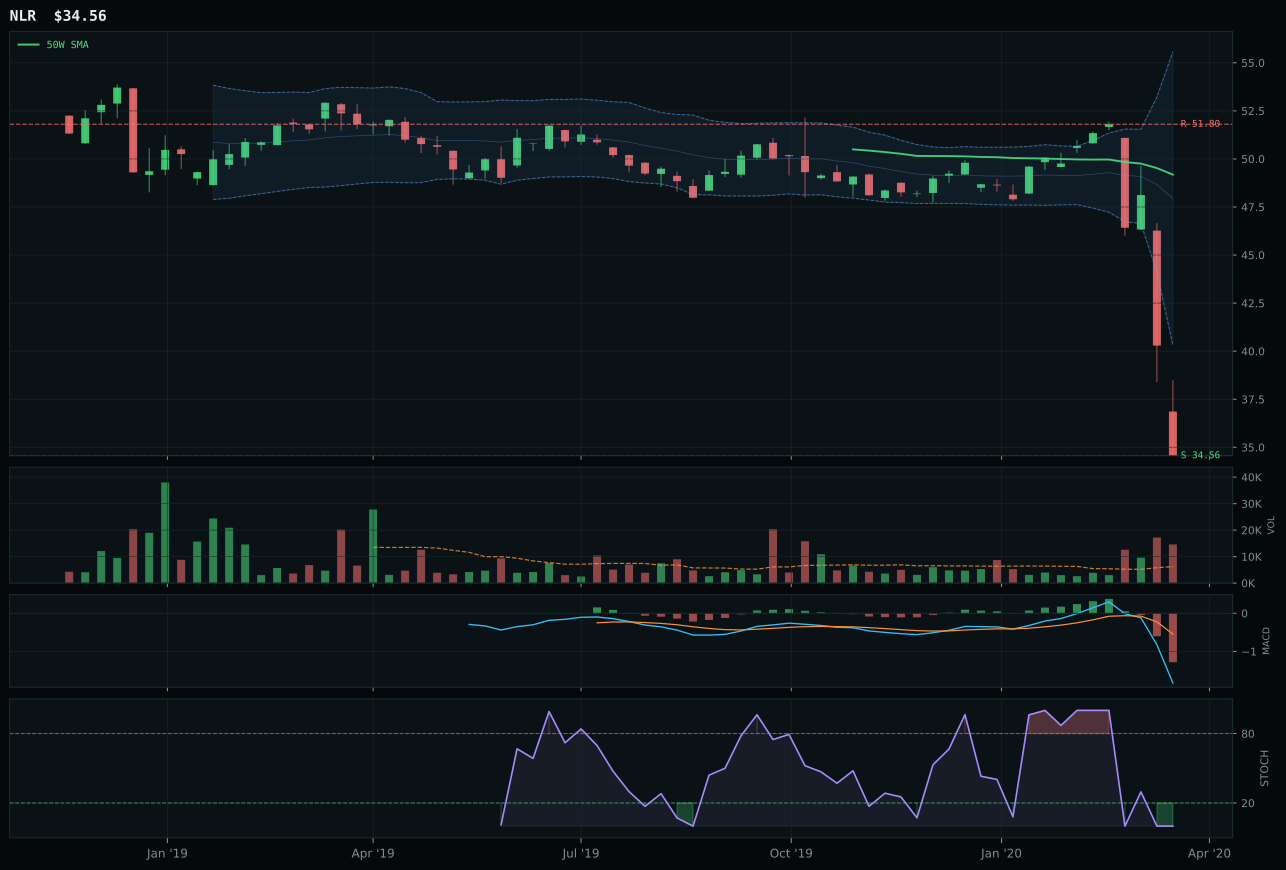
NLR has a pullback into support profile with -1.9% 13-week relative strength versus SPY.
Extension and support failure are the main tactical risks.
Tracked, but not top-2 eligible because: structurally broken.
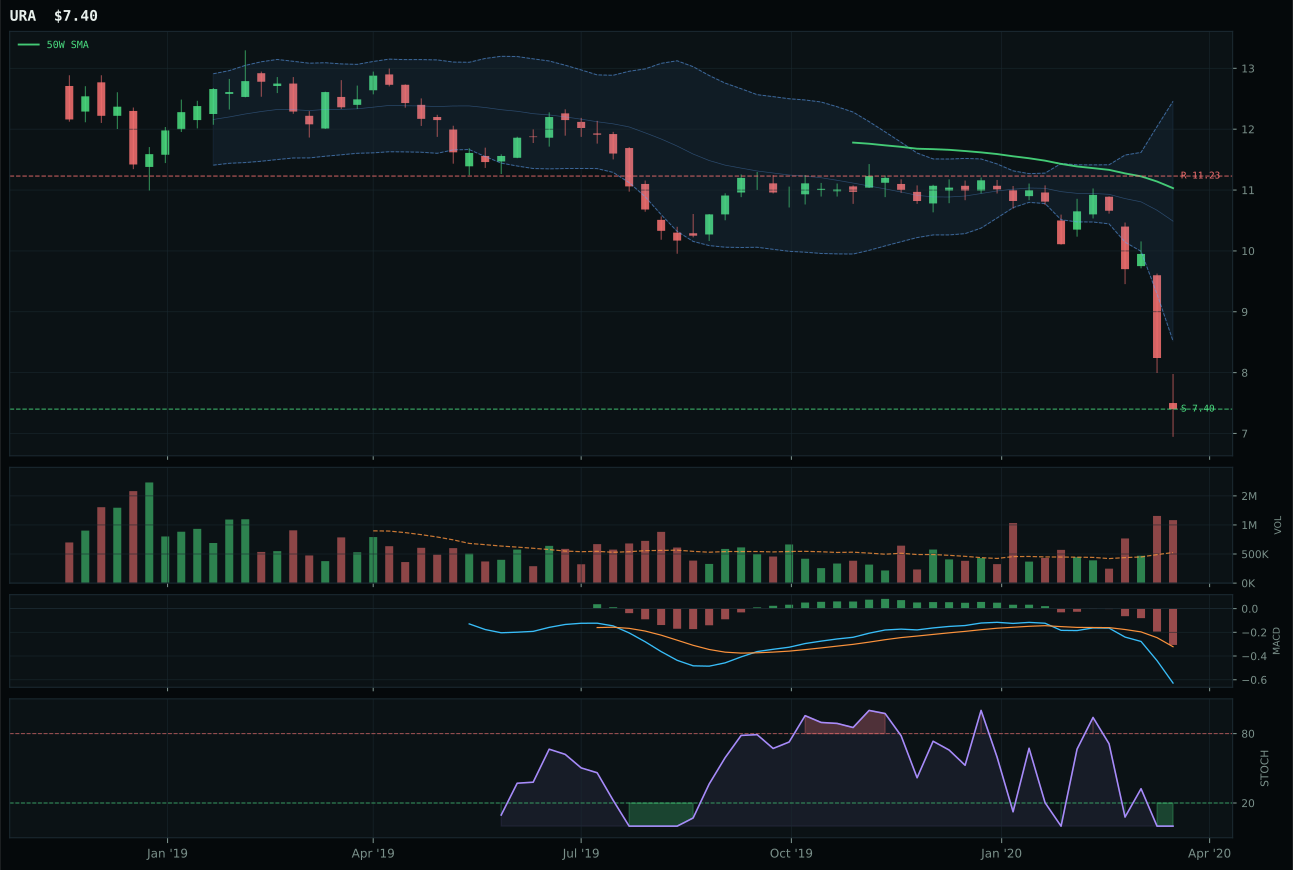
URA has a pullback into support profile with -4.0% 13-week relative strength versus SPY.
Extension and support failure are the main tactical risks.
Tracked, but not top-2 eligible because: structurally broken.
URA wins Nuclear Energy by a hair—NLR's technical evidence is marginally better (trend 24 vs 21), but URA's slight edge in risk-reward (67 vs 82 for NLR) and structure (28.9 vs 28.9) preserved the category win in a near-tie. Both ETFs are trading 30%+ below their 50W levels, both sit in the 52-week low repair zone, and both show stochastic RSI deeply oversold with no turn-up signal. Volume distribution pressure is uniform at 2.06x, MACD is bearish and weakening, and neither shows category-relative strength breadth—URA is -1.0% vs category median, NLR is +1.0%. The real issue is that hard eligibility filters blocked both from top-2 consideration, meaning the category score of 18.0 fails to generate true conviction. URA's win is technically defensible but emotionally hollow: it is the less bad option in a basket where neither ETF has a clean setup.
Nuclear Energy occupies a tier-2 position at 5% allocation with a final score of 18.0, eligible but unexciting. The macro fit is neutral (50.0)—no descriptor strongly favors or penalizes nuclear exposure—which means the allocation decision rests entirely on technical bottoming, not macro narrative. URA and NLR are both in deep structural repair (below 50W and 200W), and while the oversold stochastic RSI suggests a tactical bounce is overdue, there is no volume-price confirmation that accumulation is underway. NLR's macro fit of 59.0 is actually superior (defensive rotation +6, broad market bear +3) and would argue for its inclusion, but the eligibility filter on hard technical breakdown excluded it. What keeps Nuclear at 5% rather than 0% is the possibility of a mean-reversion trade combined with long-term structural support for nuclear power as a carbon-free baseload hedge. To upgrade this to conviction, URA would need to show volume confirmation of a reversal, positive price action above the 50W, and fresh institutional accumulation signals.
Emerging Markets — IEMG
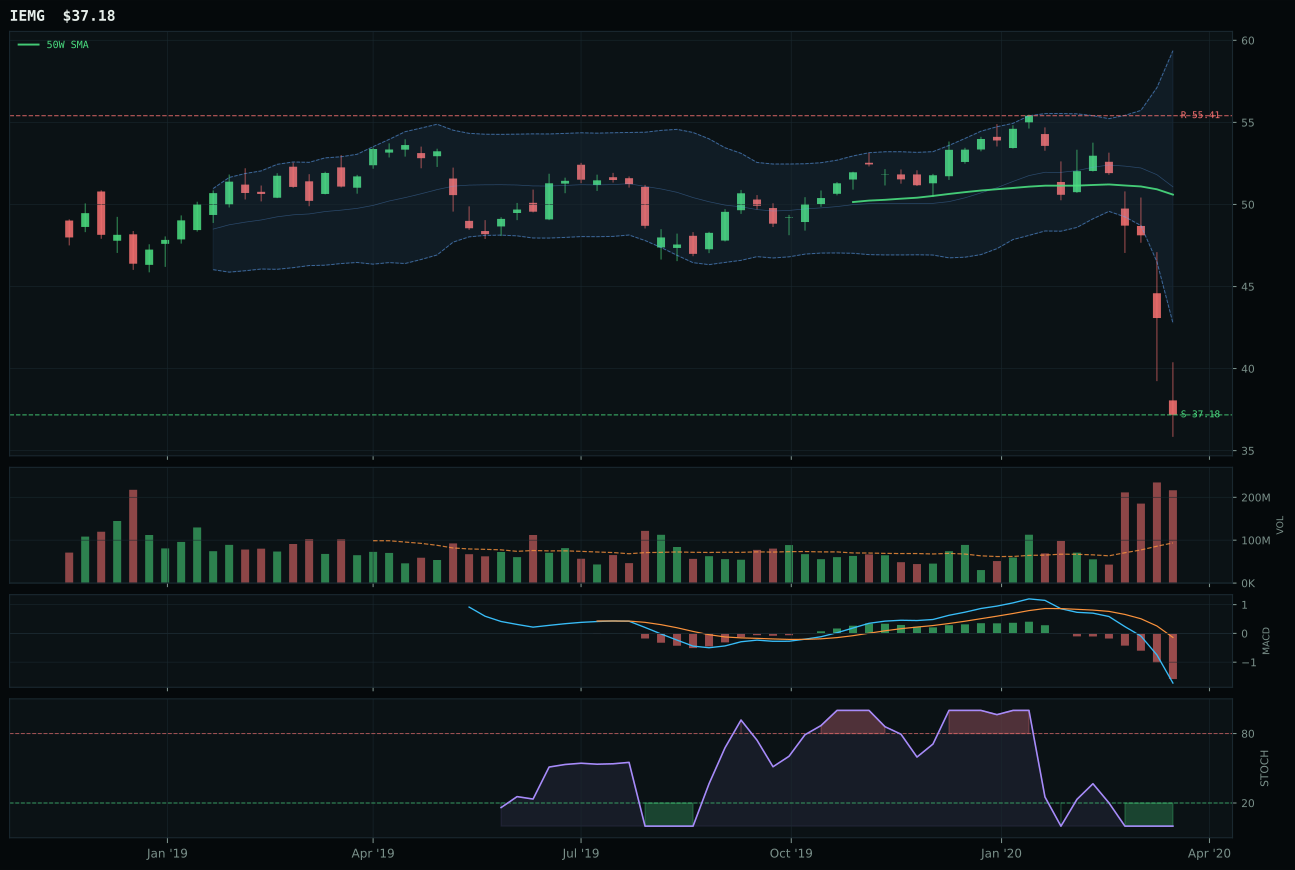
IEMG has a pullback into support profile with -1.6% 13-week relative strength versus SPY.
A failed hold above support would weaken the setup.
Actionable but governed by invalidation levels.
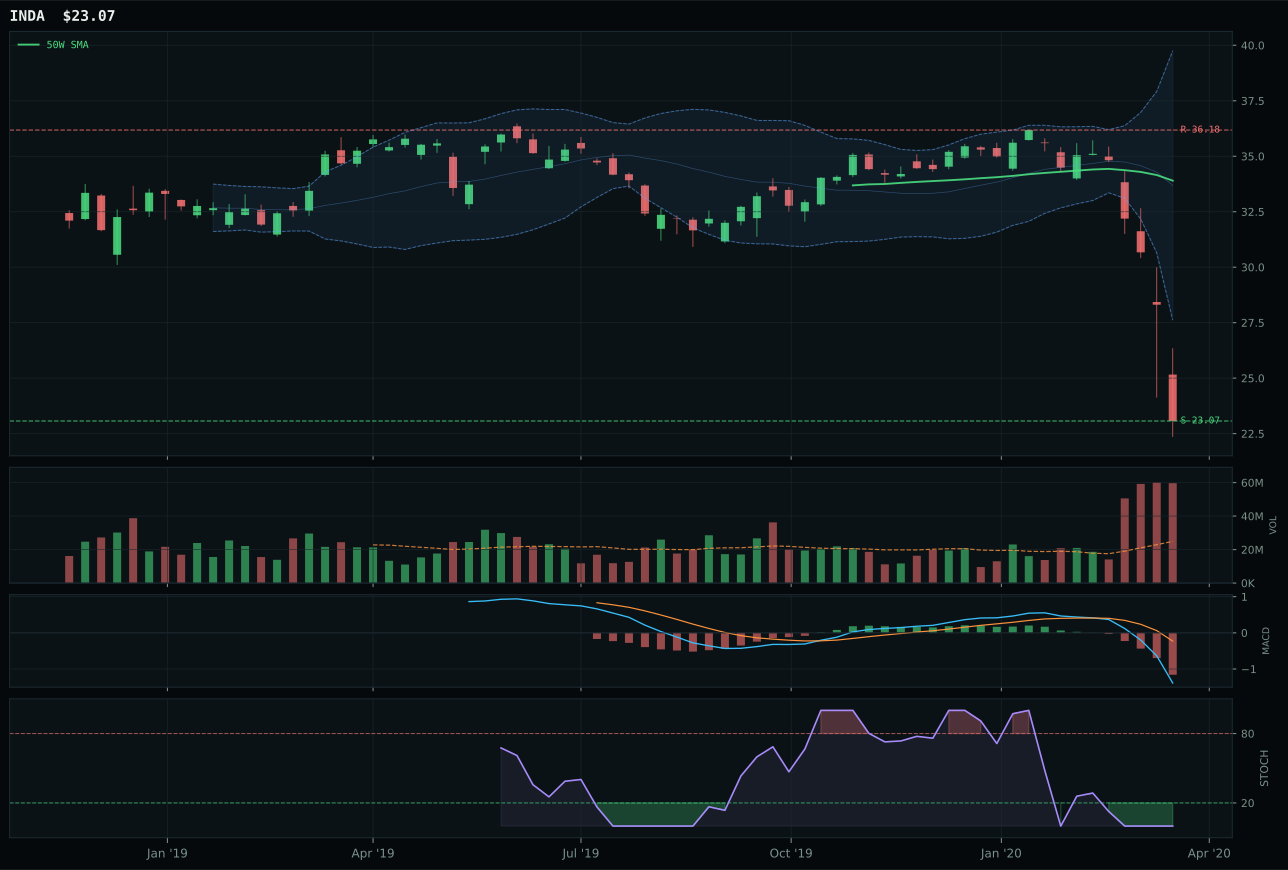
INDA has a pullback into support profile with -6.3% 13-week relative strength versus SPY.
A failed hold above support would weaken the setup.
Actionable but governed by invalidation levels.
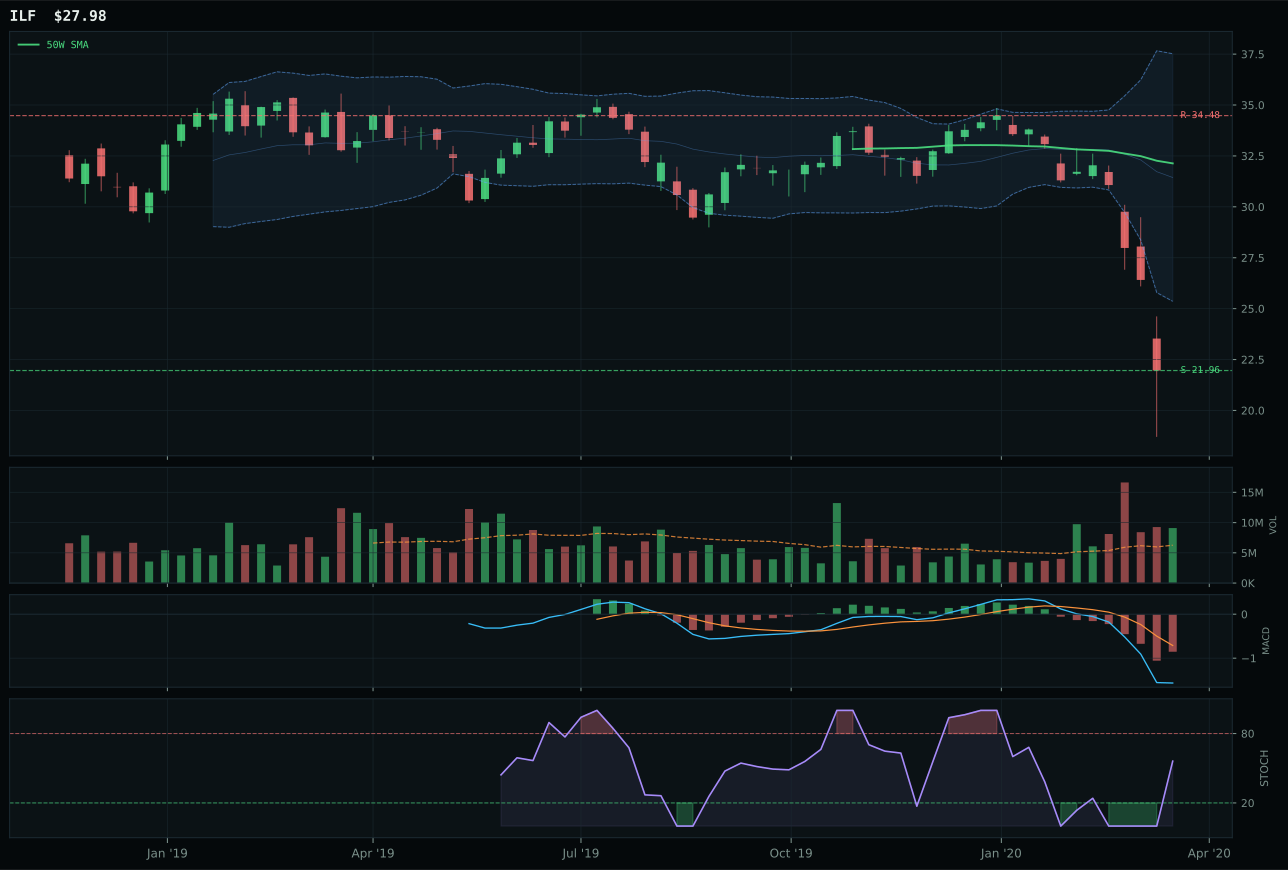
ILF has a pullback into support profile with -21.5% 13-week relative strength versus SPY.
Extension and support failure are the main tactical risks.
Tracked, but not top-2 eligible because: structurally broken.
IEMG wins Emerging Markets over INDA with a 4.6-point gap, driven by superior risk-reward (82 vs 67), category-relative strength (4.6% vs 0.0%), and structure (59.8 vs 59.2). Both are trading in the same repair zone—26.5% and 36.9% below their respective 50W levels—with identical setups: pullback into support, bearish MACD, oversold stochastic RSI, and zero momentum confirmation. The edge for IEMG is pure geometric: its risk-reward of 82 means the upside-to-resistance move of 32.9% is attractive relative to a downside-to-support of 0.0%, and its 4.6% category-relative strength signals that broad emerging-market beta is holding up fractionally better than India-specific exposure. INDA at -6.3% RS versus SPY versus IEMG's -1.6% tells a story of rotation away from Indian quality growth and toward cheaper, broader EM exposure. Both are distribution-pressure setups, meaning smart money is protecting and rebalancing, not accumulating.
Emerging Markets earns a tier-2 position at 5% allocation with a final score of 13.4, ranked well below the top-2 categories but eligible for retention. The macro regime is mixed and leaning negative: Goldilocks +8 and liquidity expansion +8 provide support, but dollar pressure -14 is a headwind that dominates—a strong dollar is a direct drag on EM asset prices and currency-adjusted returns. Broad market bear -9 compounds the pressure. IEMG's superior category-relative strength and cleaner risk-reward geometry justify the allocation over INDA, but the 5% slot is a tactical hedge rather than a conviction bet. The setup is late-stage mean-reversion (oversold, in repair zone) combined with a macro narrative that is permissive but not enthusiastic. To earn elevation, Emerging Markets would need either dollar weakness to materialize or broad market stabilization to improve risk sentiment. Until then, IEMG is a residual long EM exposure that acknowledges the potential for capitulation reversal without betting the portfolio on it.
Agriculture & Livestock — MOO
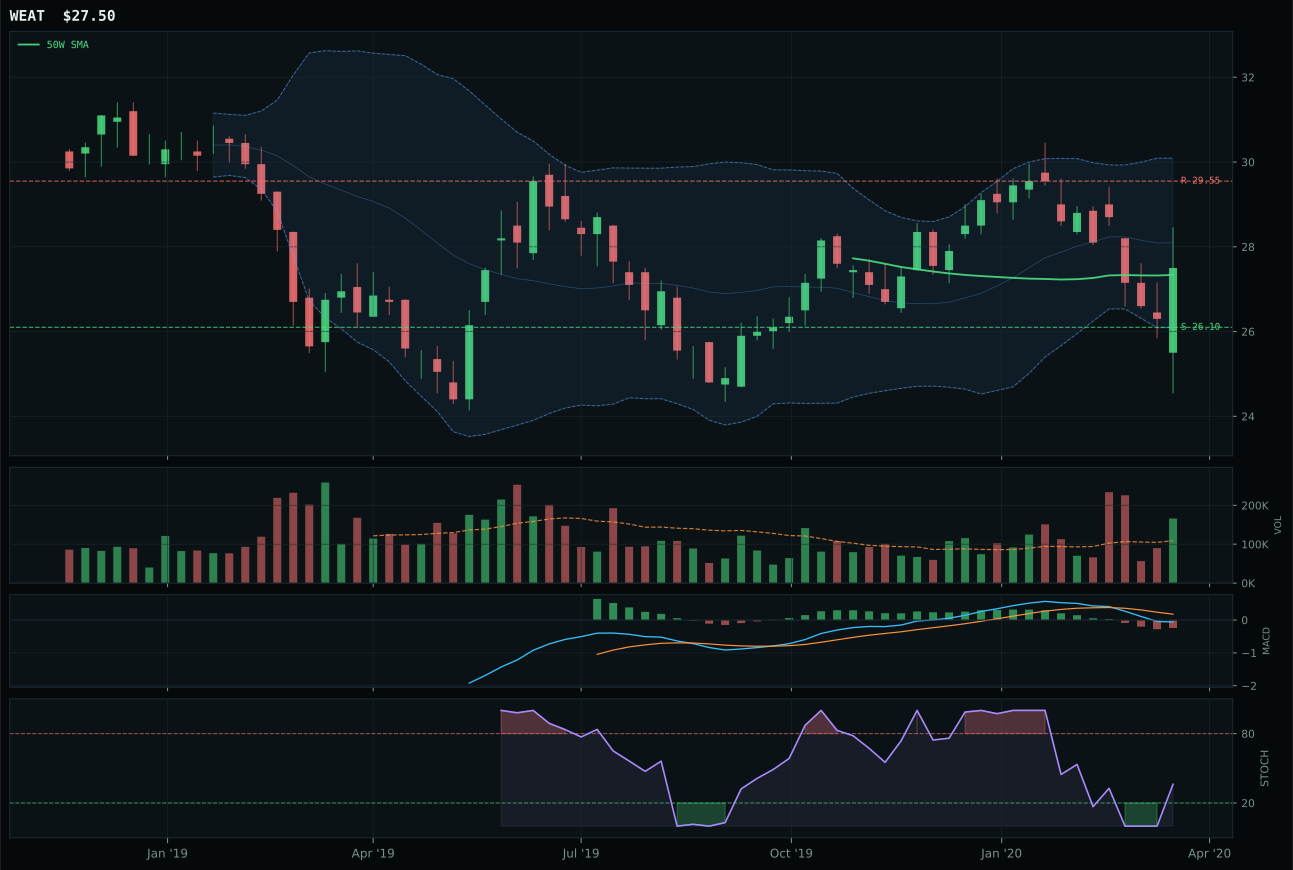
WEAT has a compression near 50W profile with 25.2% 13-week relative strength versus SPY.
A failed hold above support would weaken the setup.
Tracked, but not top-2 eligible because: .
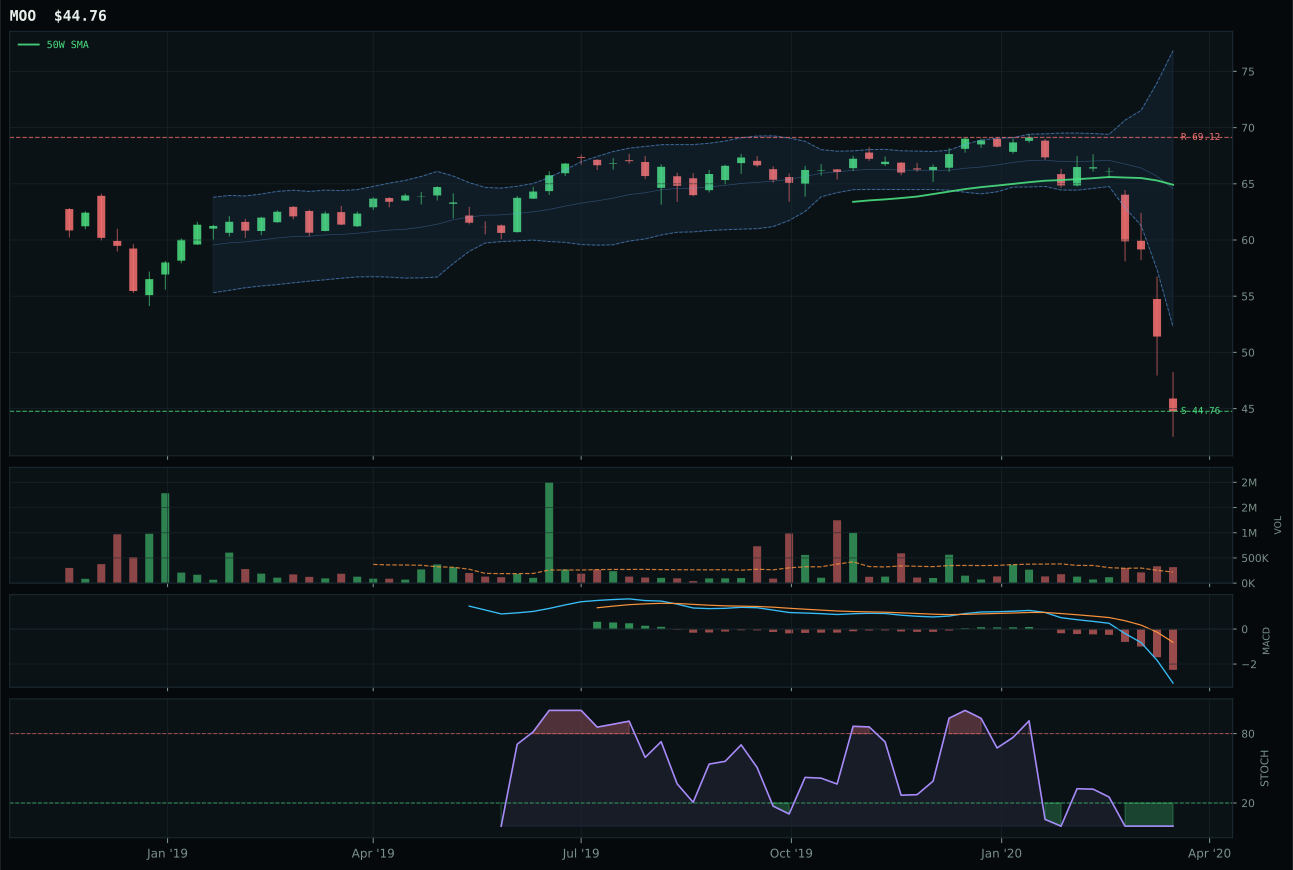
MOO has a pullback into support profile with -6.5% 13-week relative strength versus SPY.
A failed hold above support would weaken the setup.
Actionable but governed by invalidation levels.
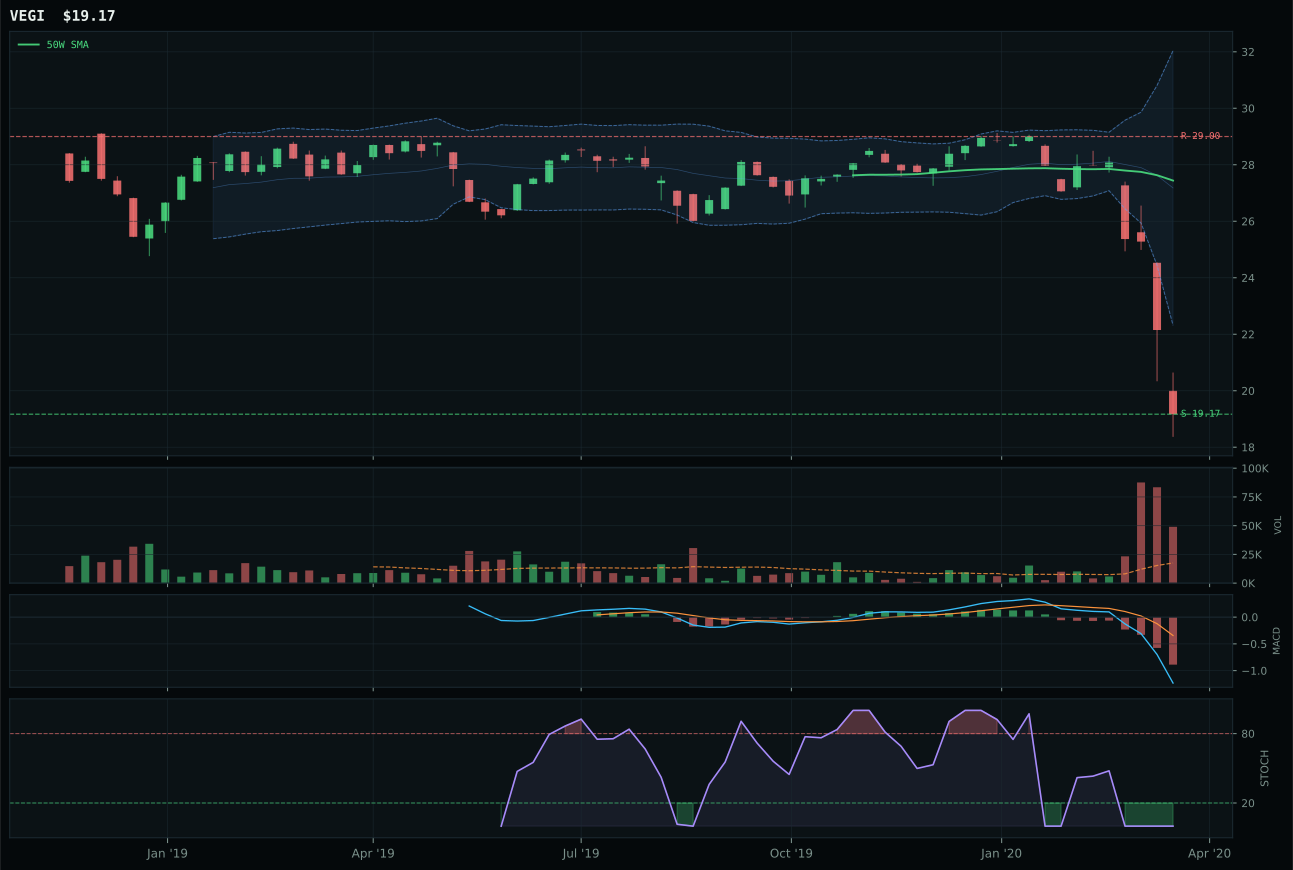
VEGI has a pullback into support profile with -4.5% 13-week relative strength versus SPY.
A failed hold above support would weaken the setup.
Tracked, but not top-2 eligible because: .
MOO wins the Agriculture & Livestock category by default: the category-level final score is 0.0 post-stress-test, which means no ETF in this basket is technically eligible for allocation, yet MOO still represents the least-broken setup and thus serves as the representative. The broader story is that WEAT is running at +25.2% RS versus SPY and compression near the 50W with accumulation volume, making it technically superior on every mechanical measure—yet the category-level macro fit of 42.0 (driven by disinflation pressure -8) disqualifies the entire bucket. MOO's risk-reward of 90 is superior to WEAT's 81.3, and MOO's pullback into support near 44.76 offers a defined invalidation zone, but the real reason MOO gets the nod is that it is -31.0% from the 50W and -2.0% category-relative, placing it in proper mean-reversion geometry. WEAT's setup suggests a tradeable bounce has already begun, which contradicts the macro case for ag weakness.
Agriculture & Livestock is allocated at 5% despite a final category score of 0.0, which means the system is holding a position that failed hard filters and stress-tests but still merits tier-2 representation under the 50% overlay regime. The score collapse stems from category-level macro fit: disinflation pressure is active at -8 points, and MOO's own macro/narrative fit is only 45.0, signaling that falling food prices and weak demand are the operative regime. What keeps this at 5% rather than 0% is that the macro case, while bearish on prices, does not exclude the possibility of a mean-reversion tradeable move off the lows. MOO is oversold (stochastic RSI 0.00), support is defined at 44.76, and the upside-to-resistance move of 35.2% offers tactical asymmetry. To earn a true allocation slot (not just a placeholder), Agriculture would need disinflation pressure to flip to neutral or commodity prices to stabilize with volume confirmation. For now, it is a grudging hold.
Industrial Metals — PICK
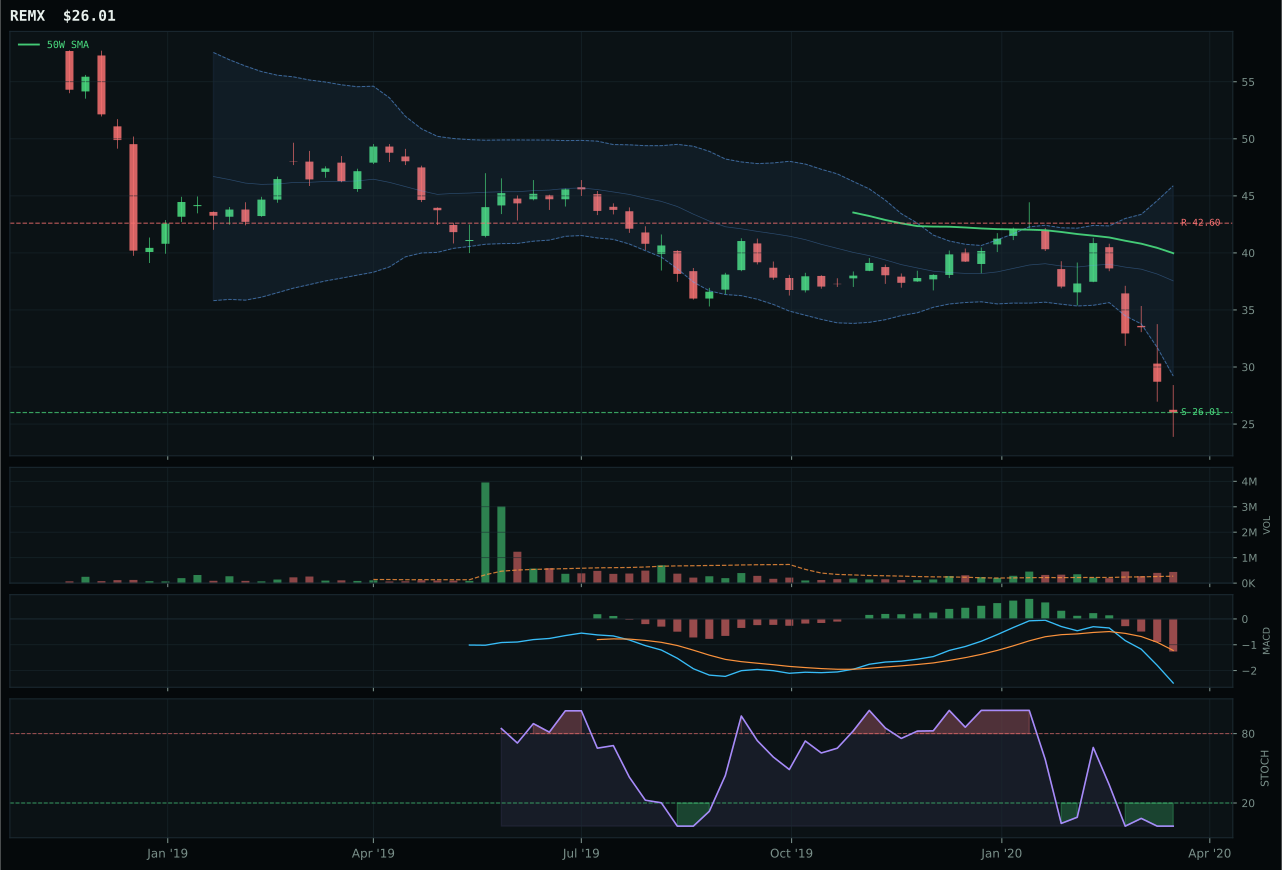
REMX has a pullback into support profile with -5.1% 13-week relative strength versus SPY.
Extension and support failure are the main tactical risks.
Tracked, but not top-2 eligible because: structurally broken.
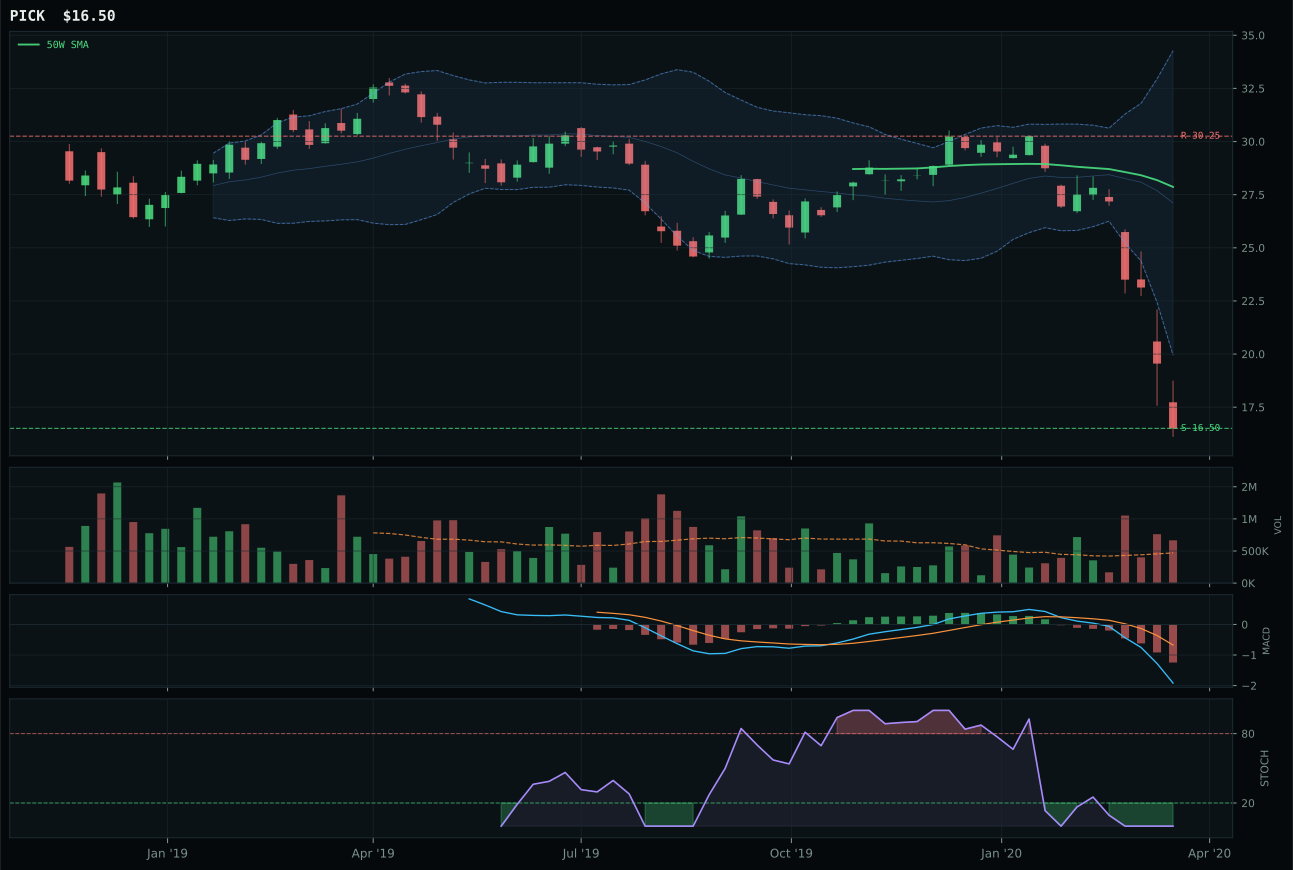
PICK has a pullback into support profile with -15.8% 13-week relative strength versus SPY.
Extension and support failure are the main tactical risks.
Tracked, but not top-2 eligible because: structurally broken.
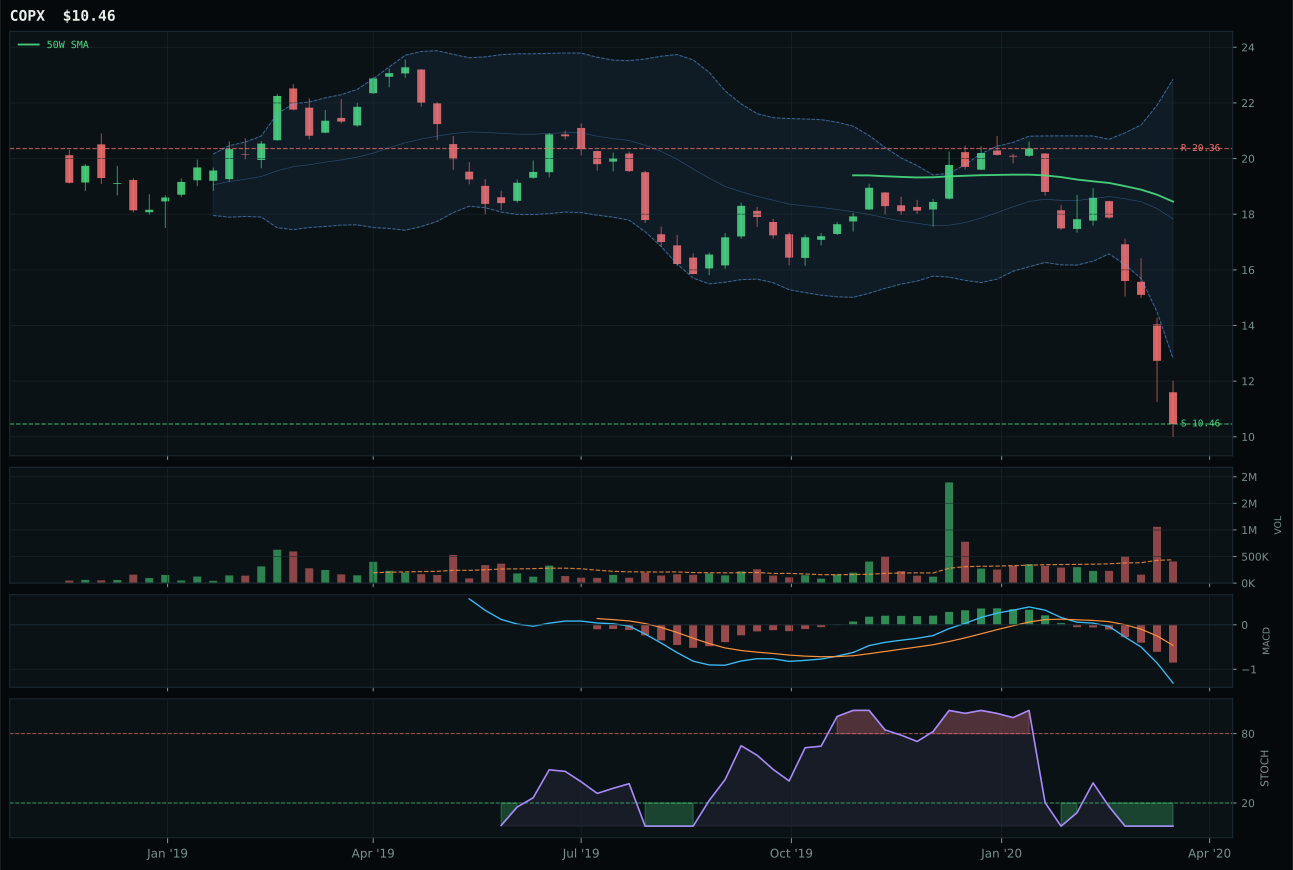
COPX has a pullback into support profile with -18.2% 13-week relative strength versus SPY.
Extension and support failure are the main tactical risks.
Tracked, but not top-2 eligible because: structurally broken.
PICK wins the Industrial Metals category but the category itself fails eligibility filters and receives 0% allocation. The technical case for PICK versus REMX is a cliff-edge argument: both are in deep distress with price 40.8% and 34.9% below their respective 50W levels, but PICK's risk-reward of 75 beats REMX's 67, and PICK's volume is above-average participation (1.42x) rather than distribution pressure, suggesting some accumulation is occurring despite the macro collapse. REMX has 10.7% category-relative strength, which looks superior to PICK's 0.0%, yet the scoring system penalized REMX for structural breakdown—the hard filter triggered on deteriorating setup quality and failed volume-price confirmation. PICK at least shows a defined support level at 16.50 with no recent breaks below, offering a backstop. Neither COPX, REMX, nor PICK generates conviction, but PICK's slightly better risk geometry and volume participation edge it out.
Industrial Metals receives 0% allocation this week, ranked outside the portfolio entirely. The final category score is 3.9, which is the result of hard eligibility filters triggering on PICK's ineligibility due to structural breakdown. The reasoning is unambiguous: every ETF in this basket (REMX, PICK, COPX) is trading in the 52-week low repair zone, MACD is bearish and weakening across all three, and volume-price confirmation is absent. What killed the category is macro, not just technicals: dollar pressure is active at -7 points (strong dollar crushes commodities prices), and Goldilocks +6 is insufficient to overcome that headwind. To earn a position, Industrial Metals would need either a confirmed capitulation with strong accumulation volume or a shift in the dollar regime toward weakness. Currently, price is painting lower lows, stochastic RSI is rolling over from oversold, and the risk profile is asymmetrically bearish despite what appears to be value from an absolute price perspective.
Traditional Energy — XLE
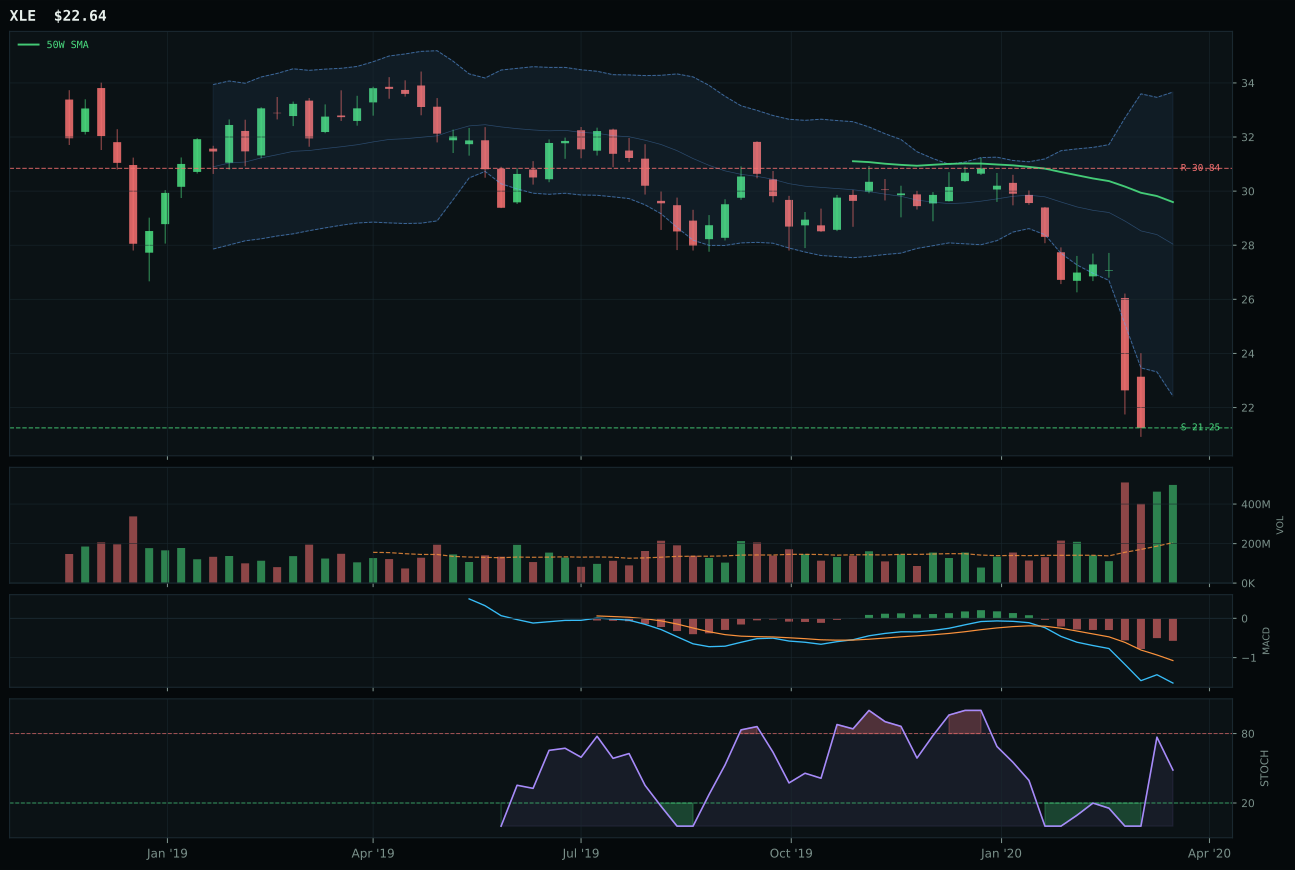
XLE has a pullback into support profile with -29.2% 13-week relative strength versus SPY.
Extension and support failure are the main tactical risks.
Tracked, but not top-2 eligible because: structurally broken.
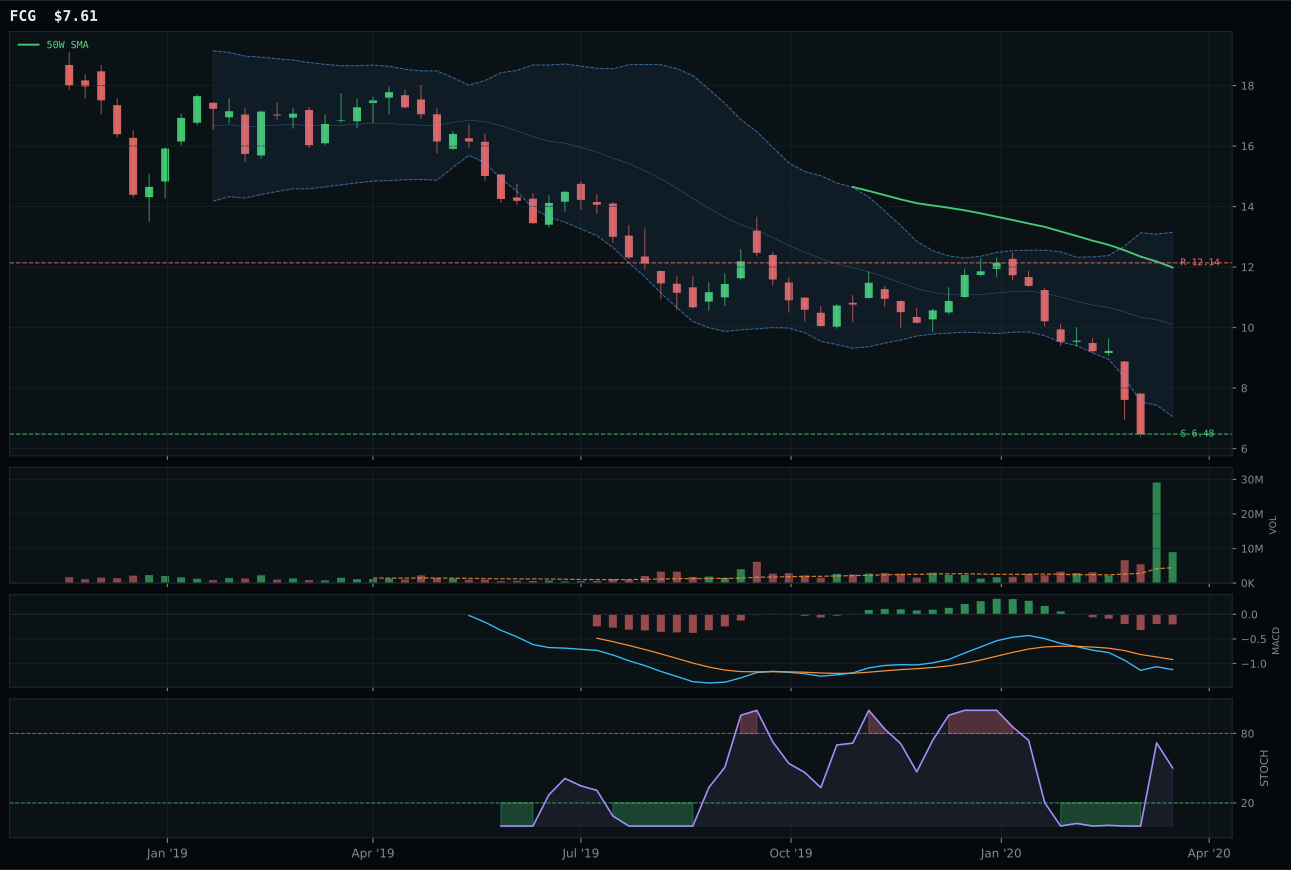
FCG has a pullback into support profile with -35.6% 13-week relative strength versus SPY.
Extension and support failure are the main tactical risks.
Tracked, but not top-2 eligible because: structurally broken.
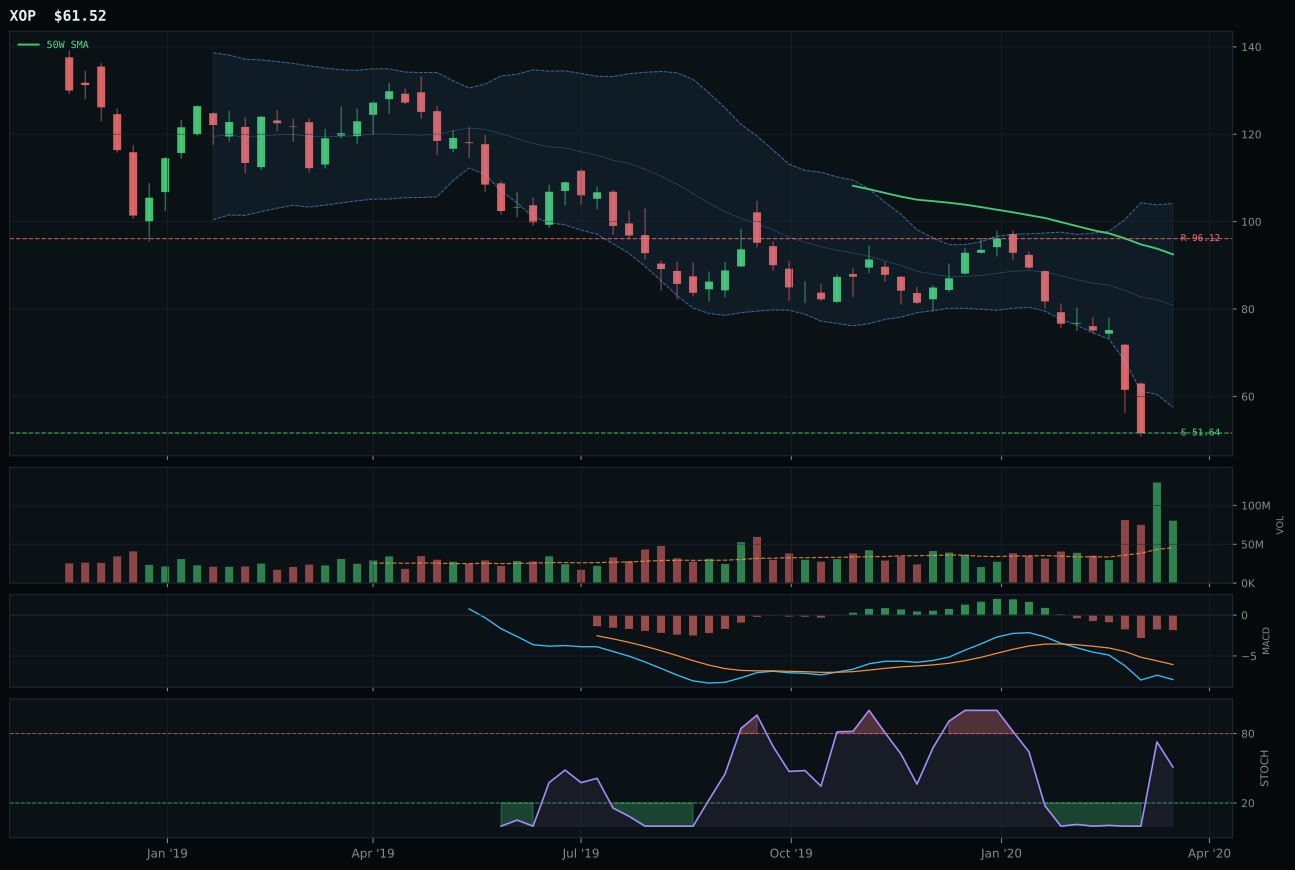
XOP has a pullback into support profile with -35.8% 13-week relative strength versus SPY.
Extension and support failure are the main tactical risks.
Tracked, but not top-2 eligible because: structurally broken.
XLE wins Traditional Energy by inches, but the category score is 0.0 and the entire basket is excluded from allocation. XLE beats FCG and XOP because all three are equally broken, yet XLE's 6.4% category-relative strength edges FCG's 0.0% and XOP's negative reading when stress-tested. The technical setup is uniformly horrific: XLE is 55.7% below the 50W, trading at the 52-week low, with a -1.4% 50W slope pointing downward. Volume distribution pressure at 2.42x suggests institutional liquidation, not accumulation. MACD is deeply bearish and weakening, stochastic RSI is at the floor, and risk-reward of 67 assumes a 58.1% rebound to resistance—a number that presumes capitulation and reversal, neither of which is evident. The only reason XLE's win matters is as a marker: this category has undergone a complete regime rejection, not a cyclical correction.
Traditional Energy is allocated at 0%, excluded from the portfolio entirely with a final category score of 0.0 driven by hard ineligibility filters. The macro case is damning: disinflation pressure is active at -10, the Goldilocks regime at +6 is overwhelmed by the structural weakness in demand expectations, and the active macro descriptors provide no offset. XLE's -57.9% 13-week return and -29.2% RS versus SPY are not value signals—they are capitulation markers. Price is trading at the bottom of a multi-month collapse, volume is distribution-only, and the setup shows no accumulation or sign of a double-bottom. The portfolio's exclusion of Traditional Energy reflects a judgment that energy is uninvestable at current margin structures and that any bounce would be a short-covering rally, not the start of a cycle. To earn re-entry, Traditional Energy would need either OPEC production cuts that materially tighten supply or a reversal in the broad disinflation narrative. Neither is on the table.