
2020-03-13
Informational purposes only. The content in this report, including allocations, analysis, and commentary, is provided solely for informational and educational purposes. It does not constitute financial advice, investment advice, trading advice, or any other type of advice. Past performance does not guarantee future results. Always conduct your own research and consult a qualified financial professional before making investment decisions.
Some tracked tickers were excluded due to missing live weekly price data: SGOV: Historical cache SGOV has only 0 usable weekly bars; URNM: Historical cache URNM has only 15 usable weekly bars
XLE defensive overlay excluded: price is below its 8W SMA. Cause selector will use GLD or cash alternative.
GLD defensive overlay excluded: price is below its 8W SMA. Cause selector will use cash alternative.
Fast-crash circuit breaker triggered: SPY dropped more than 8% from its 4-week high this week. Defensive overlay activated immediately.
Macro risk engine requires the 50% Defensive overlay for this run; payload selected by cause: Transition Defense.
Weekly Allocation
| Ticker | Category | Weight | Role |
|---|---|---|---|
| SGOV | 20% | Overlay | |
| GLD | Precious Metals | 20% | Overlay |
| XLU | Utilities & Infrastructure | 20% | Overlay |
| XLK | Technology | 10% | Top-2 (10%) |
| INDA | Emerging Markets | 10% | Top-2 (10%) |
| MOO | Agriculture & Livestock | 5% | Tier-2 (5%) |
| SMH | AI | 5% | Tier-2 (5%) |
| XAR | Defense & Aerospace | 5% | Tier-2 (5%) |
| URA | Nuclear Energy | 5% | Tier-2 (5%) |
Trade Instructions — Monday Open
Sell the tranche from 2020-02-14 (completing its 4-week hold). Buy the new tranche. Instructions show net portfolio changes — same-asset positions cancel, weight changes show the delta.
| Action | Ticker | Instruction |
|---|---|---|
| SELL | FBTC | Sell 25% of FBTC position (reduce 50.00% → 37.50%) |
| SELL | IGV | Sell 33% of IGV position (reduce 7.50% → 5.00%) |
| SELL | SMH | Sell 20% of SMH position (reduce 6.25% → 5.00%) |
| SELL | ITA | Sell 50% of ITA position (reduce 2.50% → 1.25%) |
| SELL | XLE | Sell 50% of XLE position (reduce 2.50% → 1.25%) |
| SELL | NLR | Sell 33% of NLR position (reduce 3.75% → 2.50%) |
| BUY | XLU | Buy XLU — 18.75% of freed cash (adds 3.75% to portfolio) |
| BUY | INDA | Buy INDA — 6.25% of freed cash (adds 1.25% to portfolio) |
| BUY | GLD | Buy GLD — 18.75% of freed cash (adds 3.75% to portfolio) |
| BUY | URA | Buy URA — 6.25% of freed cash (adds 1.25% to portfolio) |
| BUY | XAR | Buy XAR — 6.25% of freed cash (adds 1.25% to portfolio) |
| BUY | MOO | Buy MOO — 6.25% of freed cash (adds 1.25% to portfolio) |
| BUY | XLK | Buy XLK — 12.50% of freed cash (adds 2.50% to portfolio) |
| BUY | SGOV | Buy SGOV — 25.00% of freed cash (adds 5.00% to portfolio) |
Current Portfolio After Trade
Combined holdings across all 4 active tranches. Each tranche is 25% of the portfolio.
| Ticker | % of Portfolio | Weight Bar |
|---|---|---|
| FBTC | 37.50% | |
| GLD | 11.25% | |
| XLU | 7.50% | |
| IGV | 5.00% | |
| SMH | 5.00% | |
| XLK | 5.00% | |
| SGOV | 5.00% | |
| XAR | 3.75% | |
| MOO | 3.75% | |
| NLR | 2.50% | |
| IEMG | 2.50% | |
| URA | 2.50% | |
| INDA | 2.50% | |
| ITA | 1.25% | |
| XLE | 1.25% | |
| BOTZ | 1.25% | |
| ILF | 1.25% | |
| IGF | 1.25% |
Macro Regime — Goldilocks
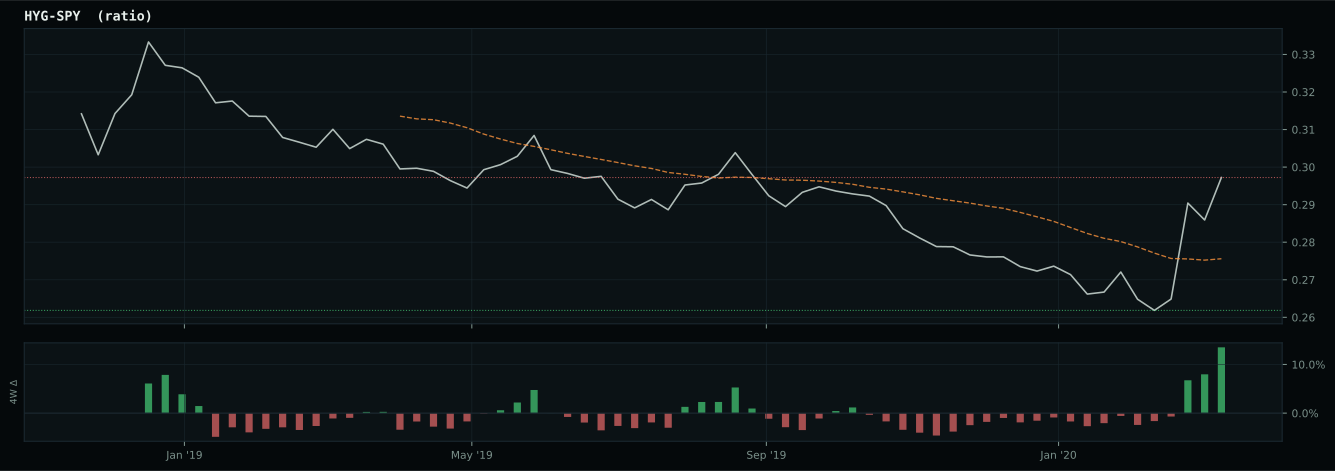
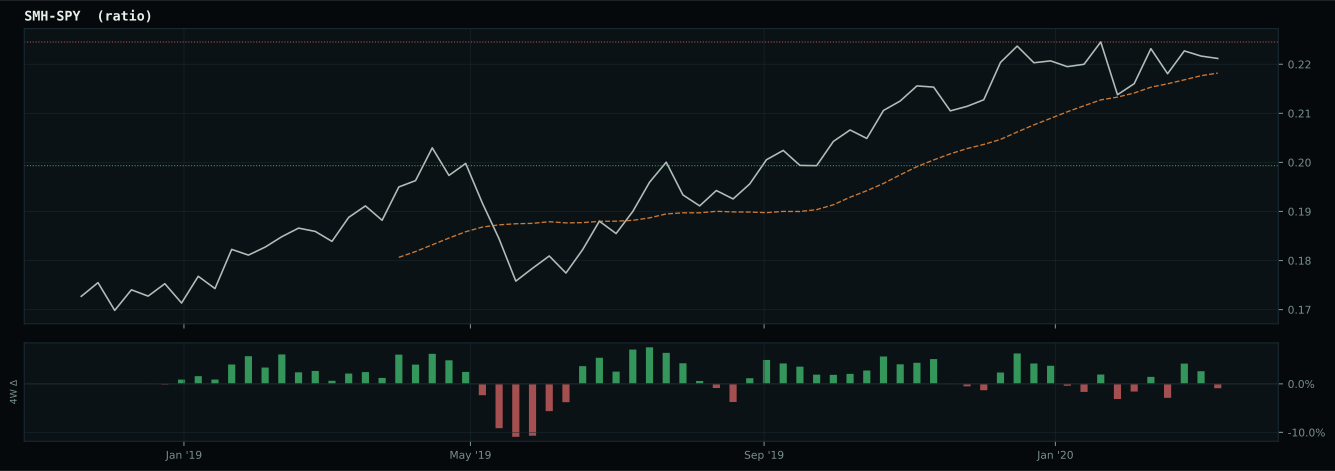
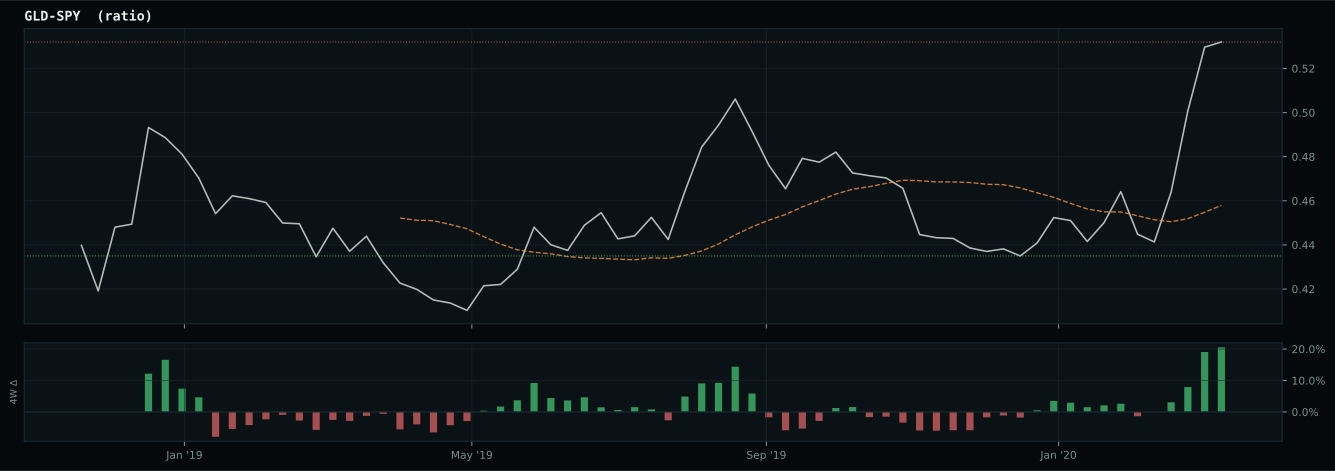
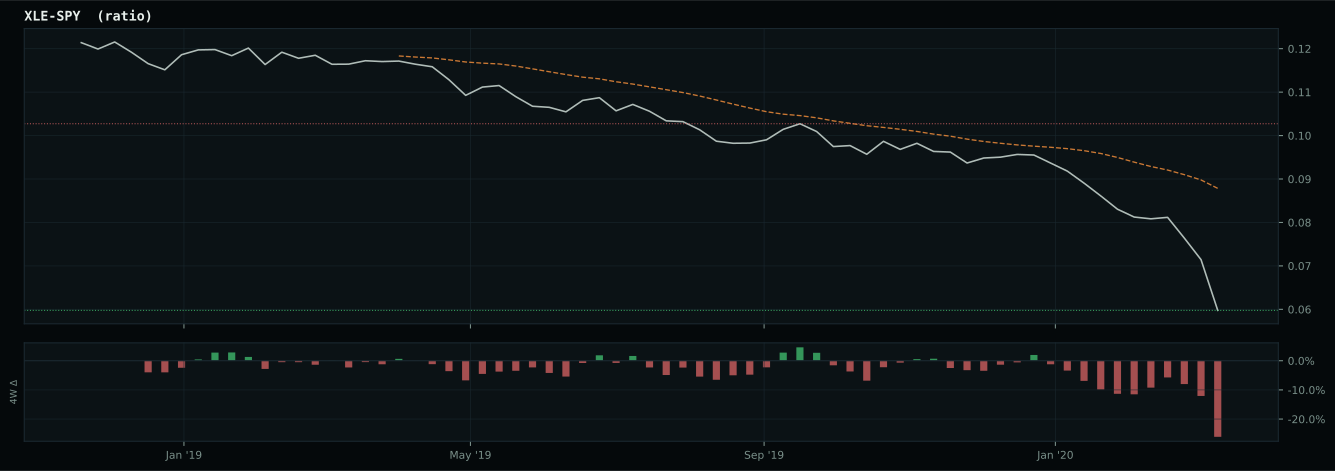
growth data is not confirming the weak market-implied risk appetite signal
Defensive overlay cause is not singular enough to concentrate: the sleeve diversifies across liquidity, monetary defense, and defensive equity exposure while the market resolves the next regime.
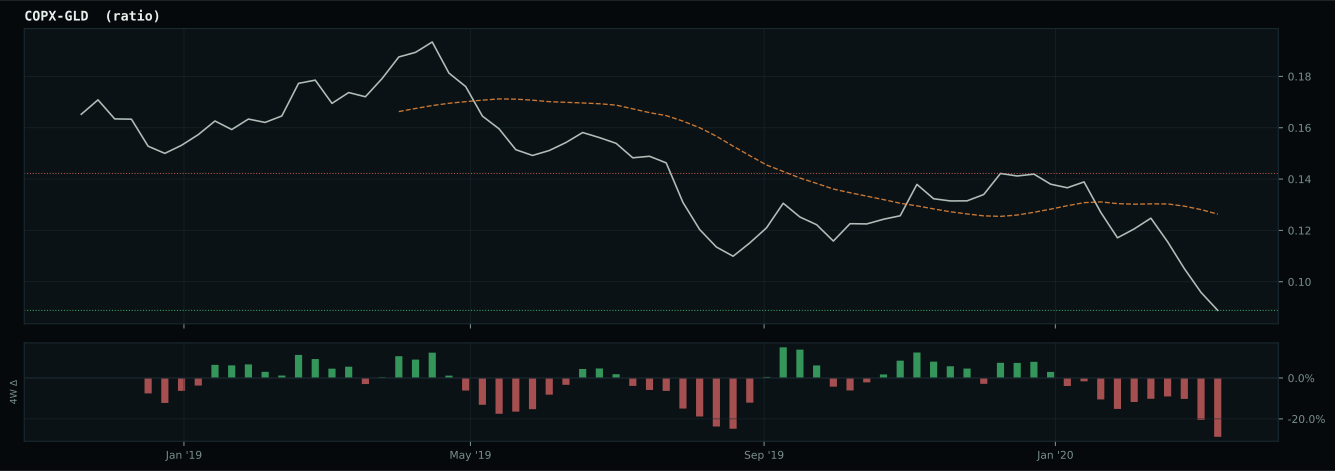
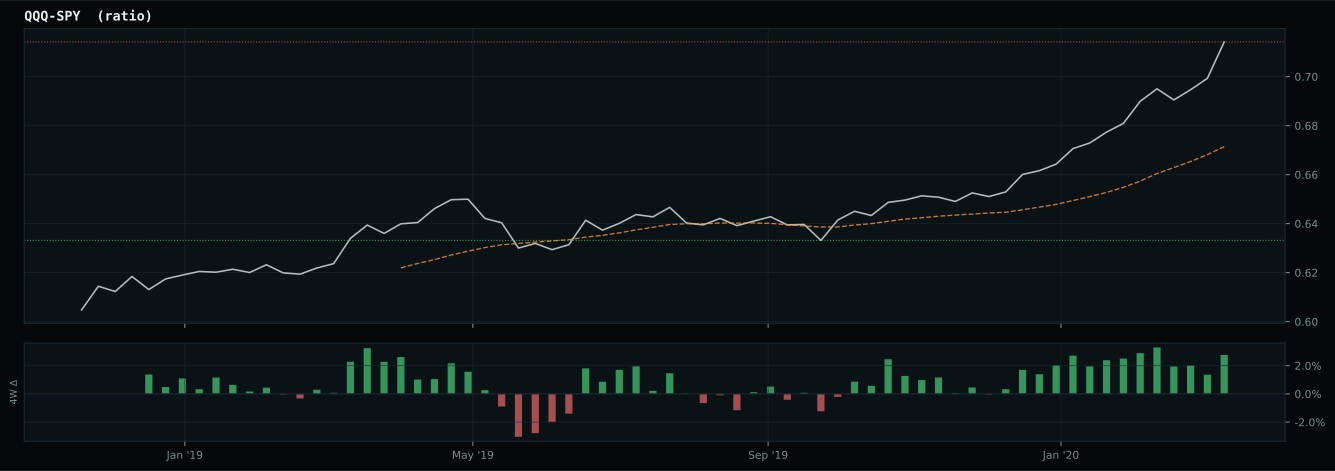
Macro Evidence Charts
Market-implied signals behind the macro regime scores. Each ratio compares two assets; the direction and slope of the ratio is what the macro engine reads.
Crypto Regime — NoCrypto
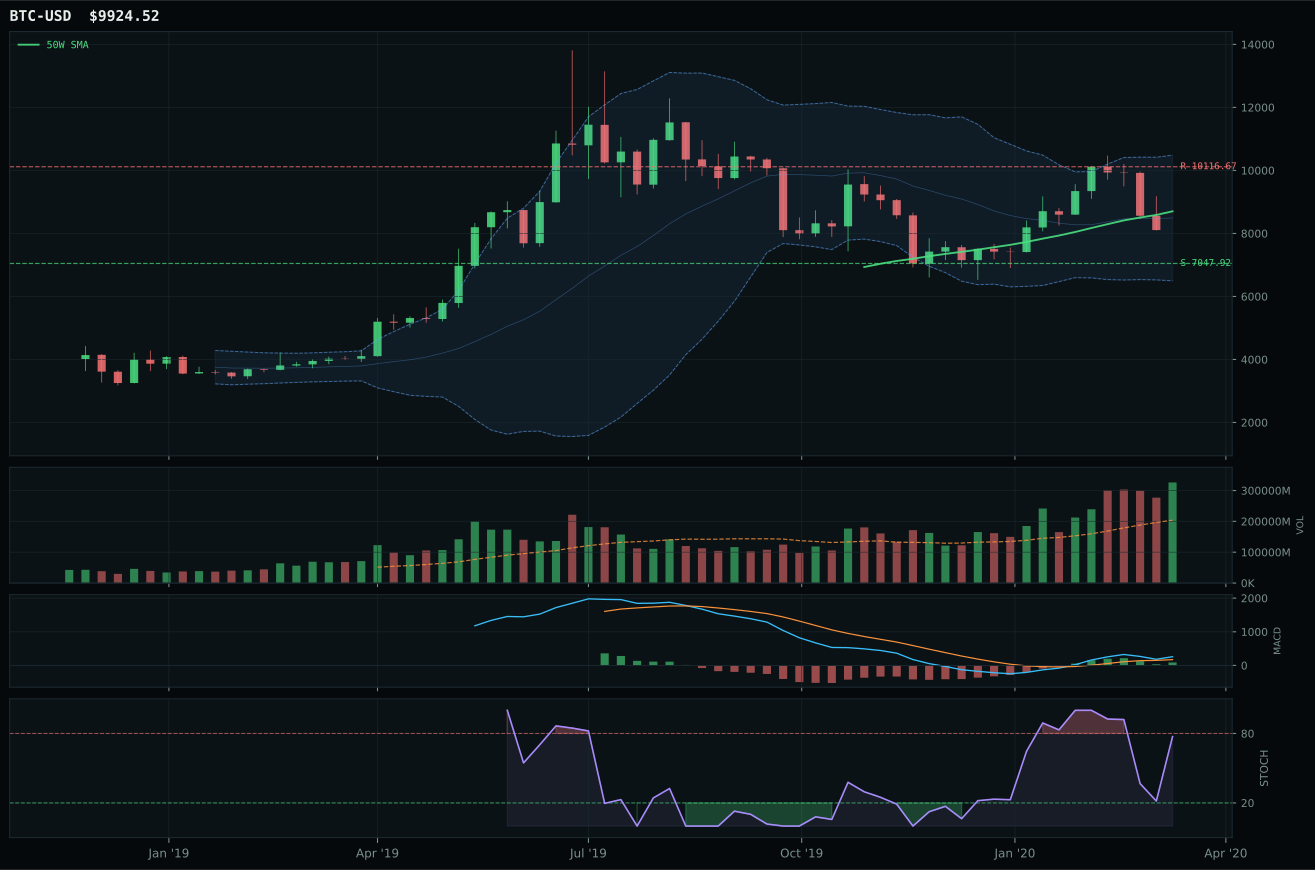
post-touch structure is too wide to count as a range; max/min close ratio is 3.33
TrendBTC not confirmed
one or more available conditions failed

Category Rankings
| Rank | Category | Winner | Score | Alloc | 4W Ret | Peers (4W) |
|---|---|---|---|---|---|---|
| 1 | Technology | XLK | 41.5 | 20% | +18.32% | IGV +7.2% · CIBR +25.2% |
| 2 | Emerging Markets | INDA | 33.9 | 20% | +0.44% | IEMG +10.4% · ILF +3.9% |
| 3 | Utilities & Infrastructure | XLU | 28.6 | 10% | +15.36% | IGF +26.9% · PAVE +15.3% |
| 4 | Precious Metals | GLD | 27.0 | 10% | +15.71% | SLV +19.9% · GDX +71.0% |
| 5 | AI | SMH | 26.9 | 10% | +17.23% | AIQ +25.8% · BOTZ +21.0% |
| 6 | Defense & Aerospace | XAR | 20.3 | 10% | +12.88% | ROKT +9.9% · ITA +7.3% |
| 7 | Nuclear Energy | URA | 15.8 | 10% | +26.53% | NLR +15.2% |
| 8 | Industrial Metals | PICK | 6.3 | 10% | +19.12% | REMX +15.2% · COPX +15.8% |
| 9 | Agriculture & Livestock | MOO | — | 0% | +19.04% | WEAT +12.7% · VEGI +17.7% |
| 10 | Traditional Energy | XLE | — | 0% | +25.55% | FCG +30.5% · XOP +32.3% |
Technology — XLK
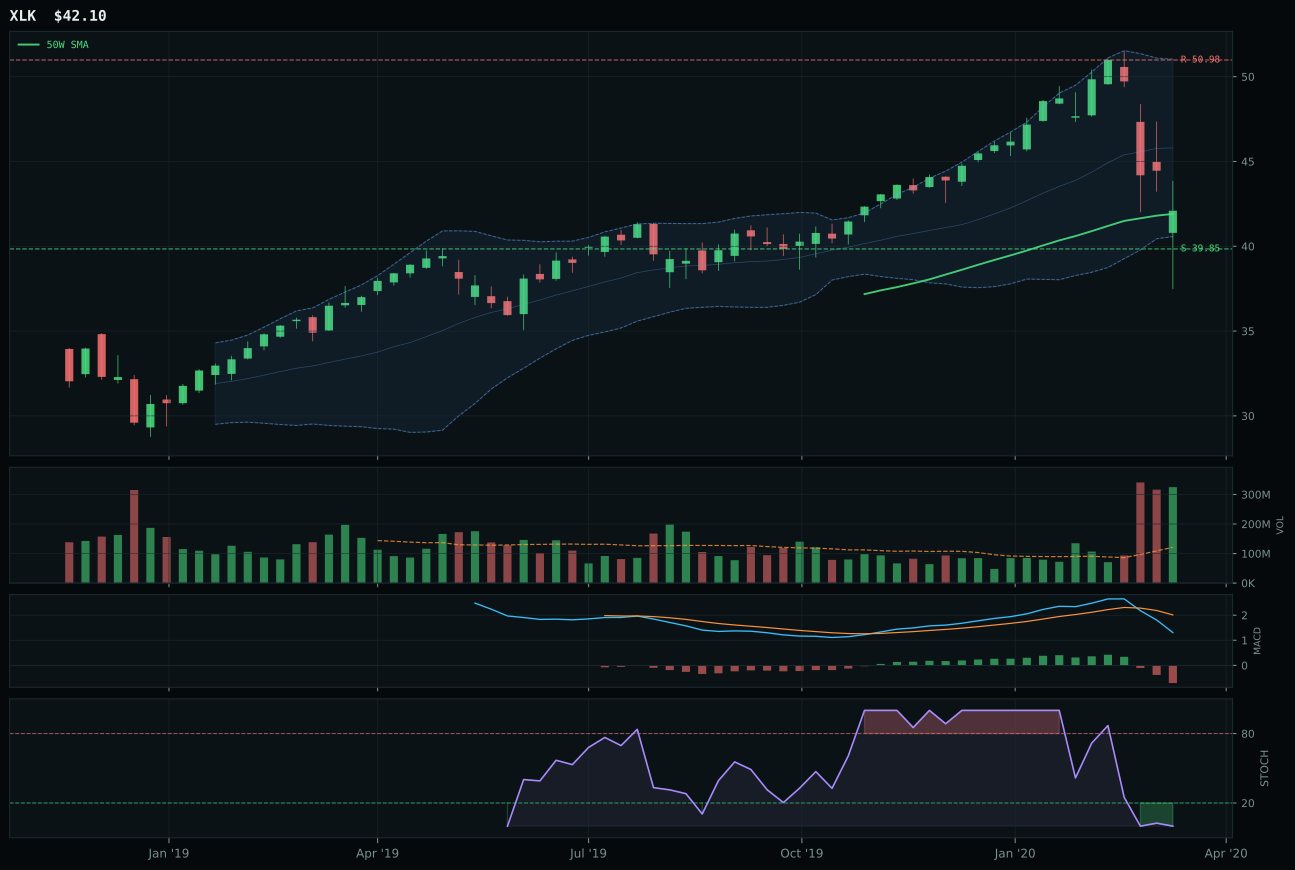
XLK has a compression near 50W profile with 9.2% 13-week relative strength versus SPY.
A failed hold above support would weaken the setup.
Actionable but governed by invalidation levels.
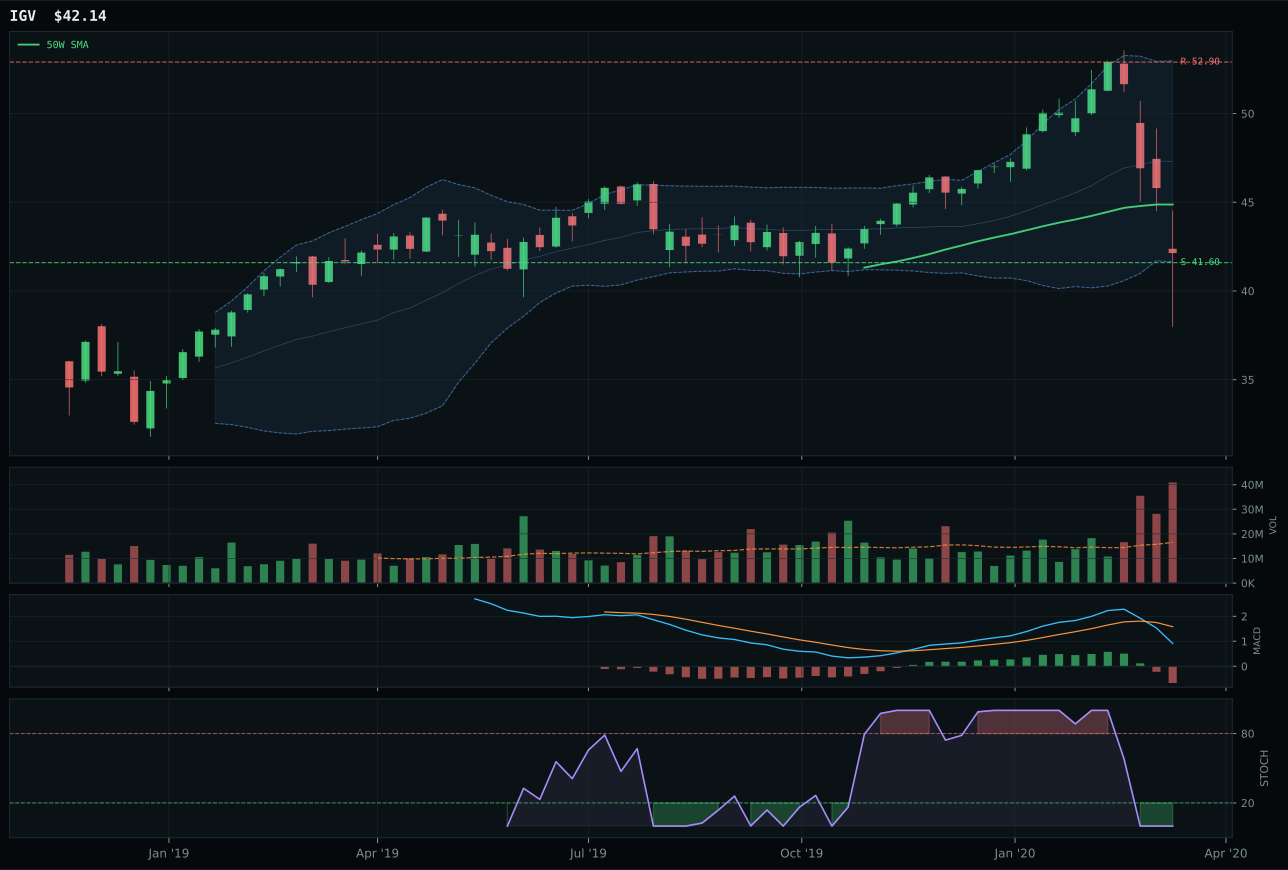
IGV has a pullback into support profile with 7.2% 13-week relative strength versus SPY.
A failed hold above support would weaken the setup.
Actionable but governed by invalidation levels.
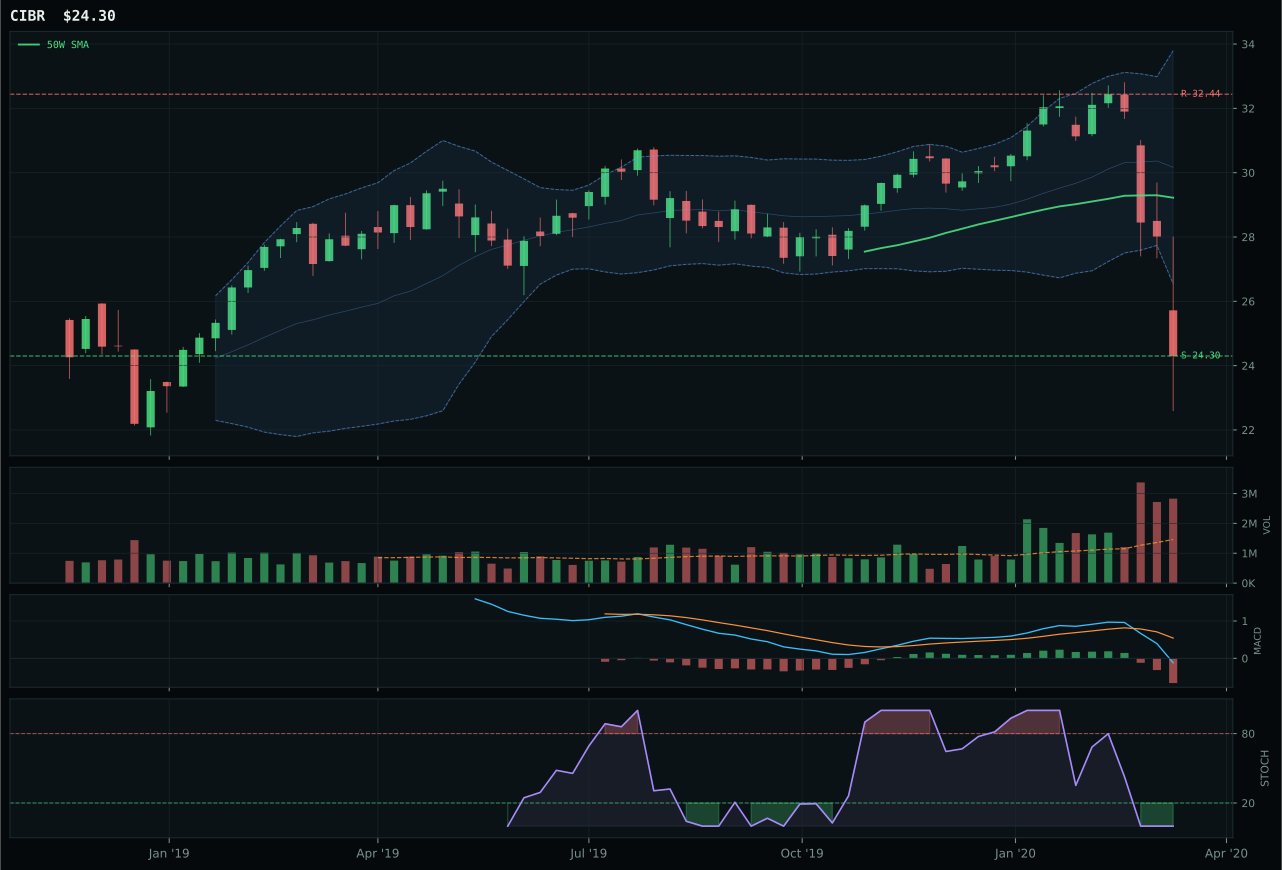
CIBR has a pullback into support profile with -3.1% 13-week relative strength versus SPY.
A failed hold above support would weaken the setup.
Actionable but governed by invalidation levels.
XLK wins decisively because it holds price above both the 50-week and 200-week moving averages while compressing near the 50W—a setup that offers defined expansion potential if buyers defend the level. The 9.2% relative strength versus SPY combined with a 2.0% edge over IGV inside the category shows genuine sponsorship, not just a broad-market bounce. IGV stumbled on timing (87.0 vs 100.0), weaker category-relative strength (0.0%), and a less clean structure (69.0), making it vulnerable despite enterprise software's defensive appeal. The real tell is XLK's stochastic RSI at oversold while MACD turns weak—a setup screaming for either capitulation washout or dead-cat dynamics, but the compression zone near 41.34 (Fib 0.618) offers meaningful risk control if the trade fails.
Technology earned its 10% top-2 overweight by posting the highest eligible category score at 41.5, ranking above all peer exposures in the portfolio this week. The Goldilocks macro regime actively supports growth with liquidity expansion and disinflation pressure both firing, a combination that typically lifts duration-sensitive equities off their lows. XLK's 92.0/100 trend score reflects genuine upside structure, while the 38% macro fit weighting (down from strategic defaults) ensures the category wins on both technical merit and regime alignment. This allocation makes sense as a tactical long-duration play into defensive rotation, though the momentum score of 5.9 warns that new buyers are late to the party and the risk asymmetry has already shifted significantly against fresh entries.
Emerging Markets — INDA
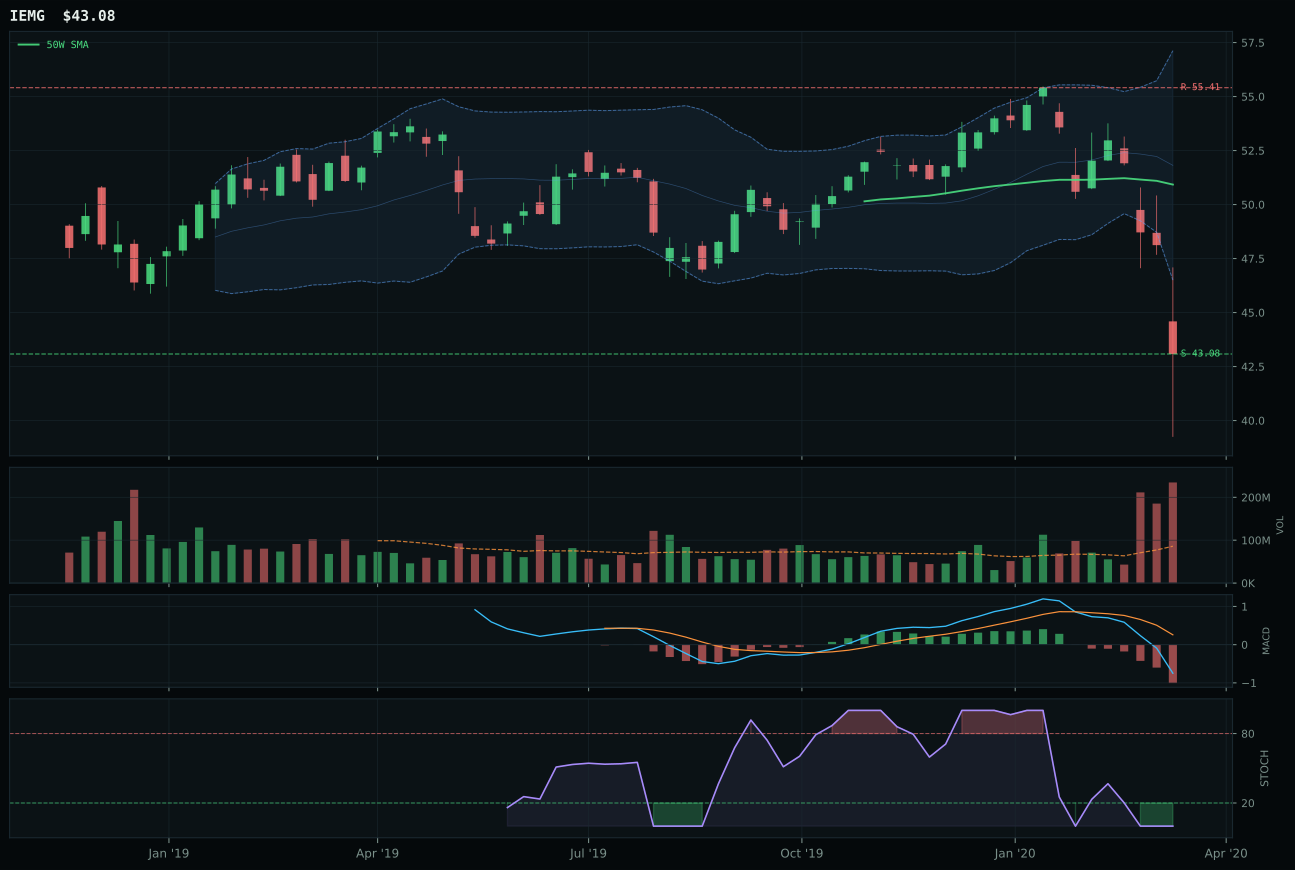
IEMG has a pullback into support profile with -4.1% 13-week relative strength versus SPY.
A failed hold above support would weaken the setup.
Actionable but governed by invalidation levels.
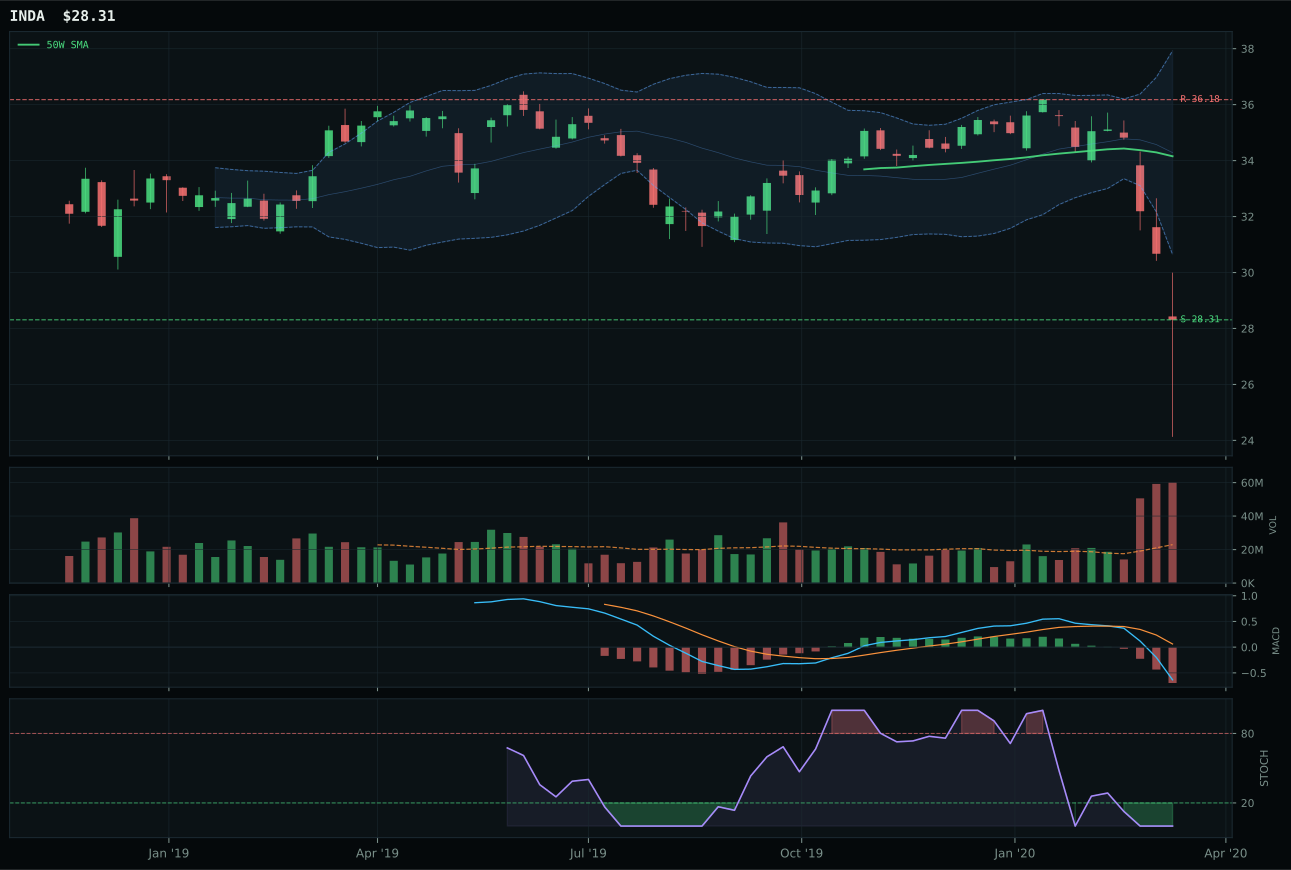
INDA has a pullback into support profile with -4.4% 13-week relative strength versus SPY.
A failed hold above support would weaken the setup.
Actionable but governed by invalidation levels.
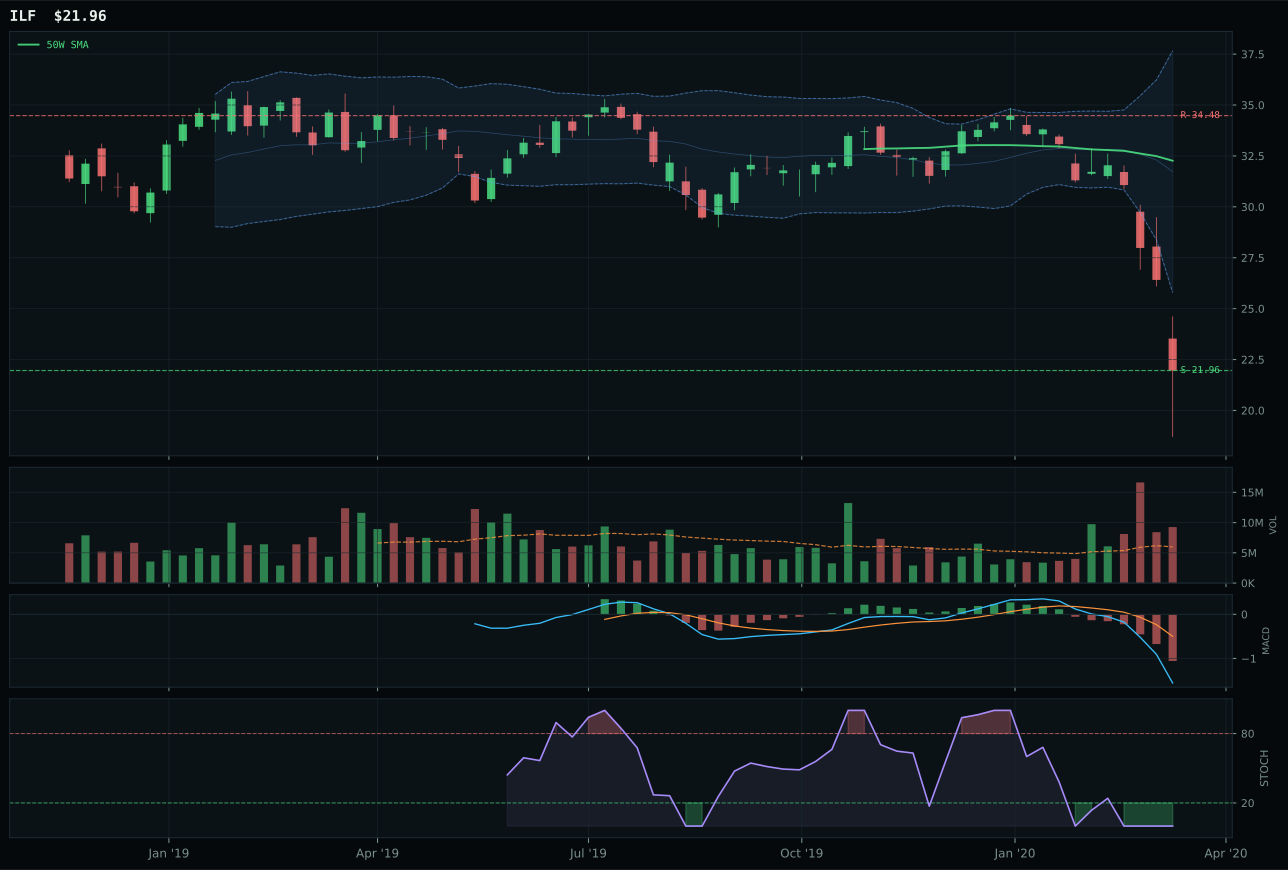
ILF has a pullback into support profile with -19.7% 13-week relative strength versus SPY.
A failed hold above support would weaken the setup.
Actionable but governed by invalidation levels.
INDA beats IEMG by precisely one score point (33 vs 32) in a nearly dead heat, winning on risk/reward (90.0 vs 82.0) and matching all other dimensions in structure and timing. Both ETFs sit in deep retracement zones (INDA at Fib 0.618, IEMG near 52W low) with identical -4.4% and -4.1% RS versus SPY, showing the category's structural stress. The deciding factor is INDA's superior 90.0 risk/reward versus IEMG's 82.0—with both sitting at pullback-into-support setups, INDA offers better asymmetry to resistance (21.8% upside room) relative to downside break risk. Volume distribution pressure and oversold stochastic RSI are identical across both, so the win comes down to price location precision rather than fundamental strength.
Emerging Markets earned its 10% top-2 overweight slot because the category score of 33.9 ranks second-highest in the portfolio, supported by genuinely active macro tailwinds (EM liquidity support +14, Goldilocks +8, liquidity expansion +8) that offset the technical weakness of -19.2% to -19.6% 13-week returns. INDA's representative score of 33 edges both Technology (41.5) and every tier-2 category, despite zero momentum confirmation and zero volume-price sponsorship, because the macro case for EM exposure is compelling in a Goldilocks environment with policy accommodation. The allocation reflects a view that EM bears are overdone and EM liquidity support from global central banks creates carry-trade potential even as technicals remain weak. To sustain this allocation, the portfolio needs EM liquidity support to remain active and Goldilocks to persist—any shock to either (Fed taper, EM currency crises, China slowdown) would invalidate the trade immediately given the zero technical confirmation.
Utilities & Infrastructure — XLU
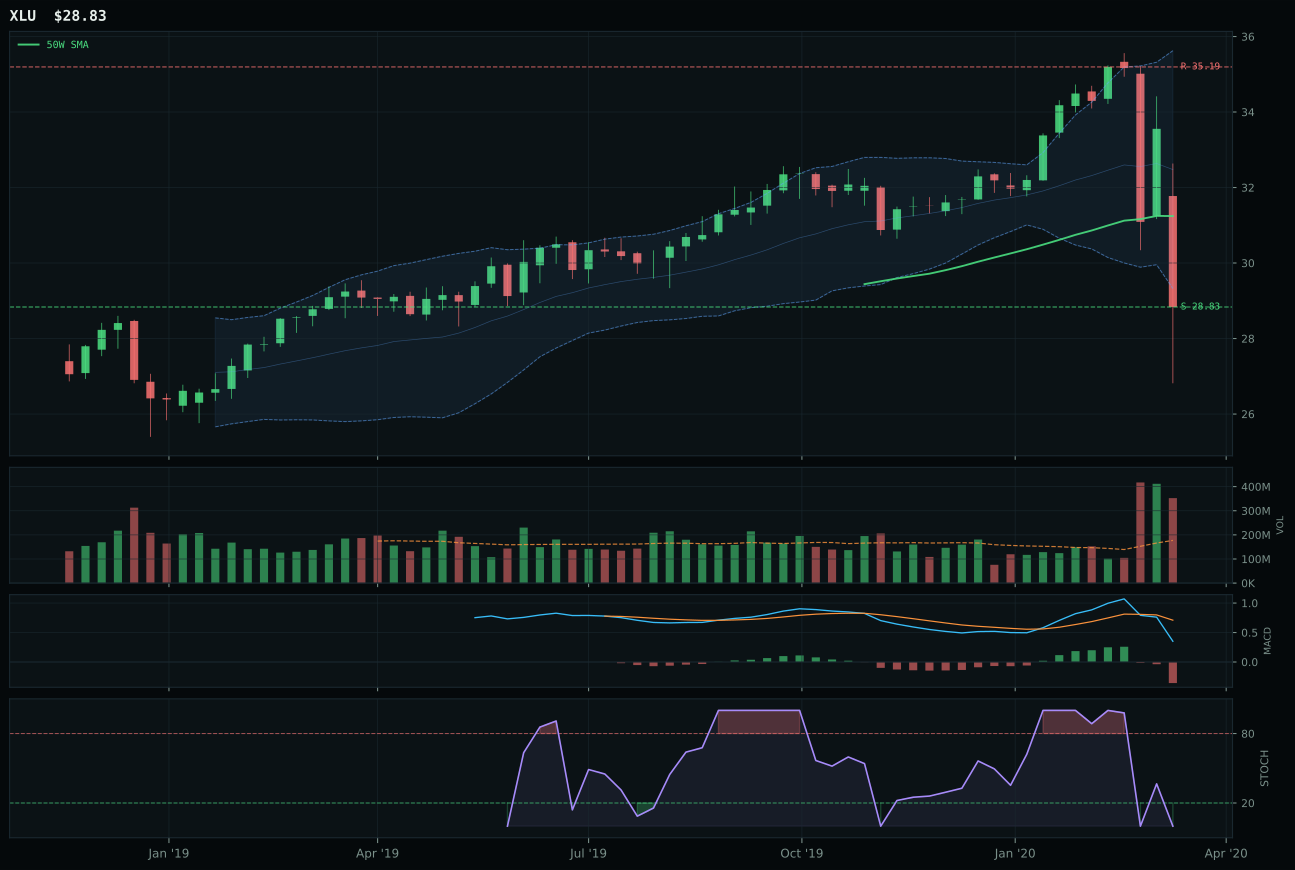
XLU has a pullback into support profile with 6.1% 13-week relative strength versus SPY.
A failed hold above support would weaken the setup.
Actionable but governed by invalidation levels.
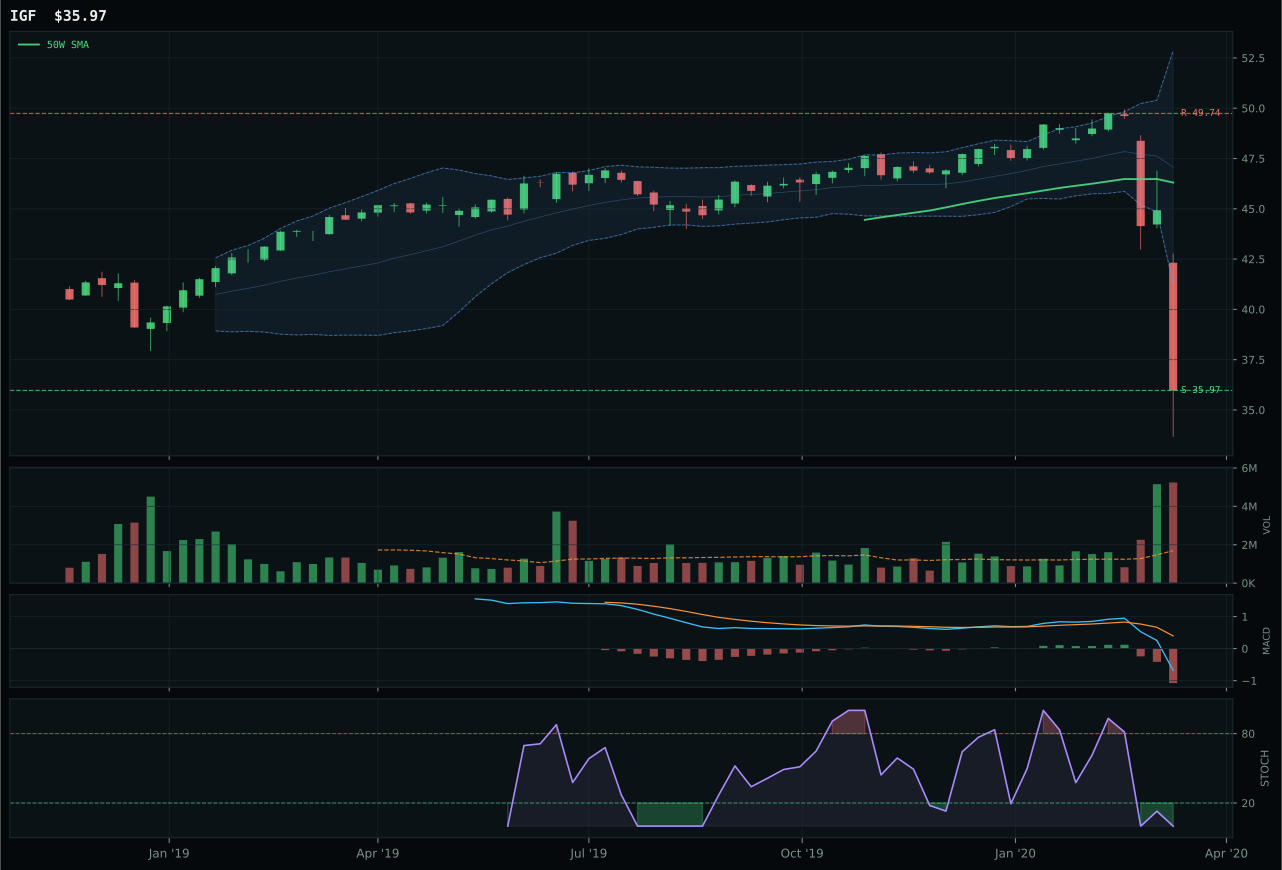
IGF has a pullback into support profile with -9.5% 13-week relative strength versus SPY.
A failed hold above support would weaken the setup.
Actionable but governed by invalidation levels.
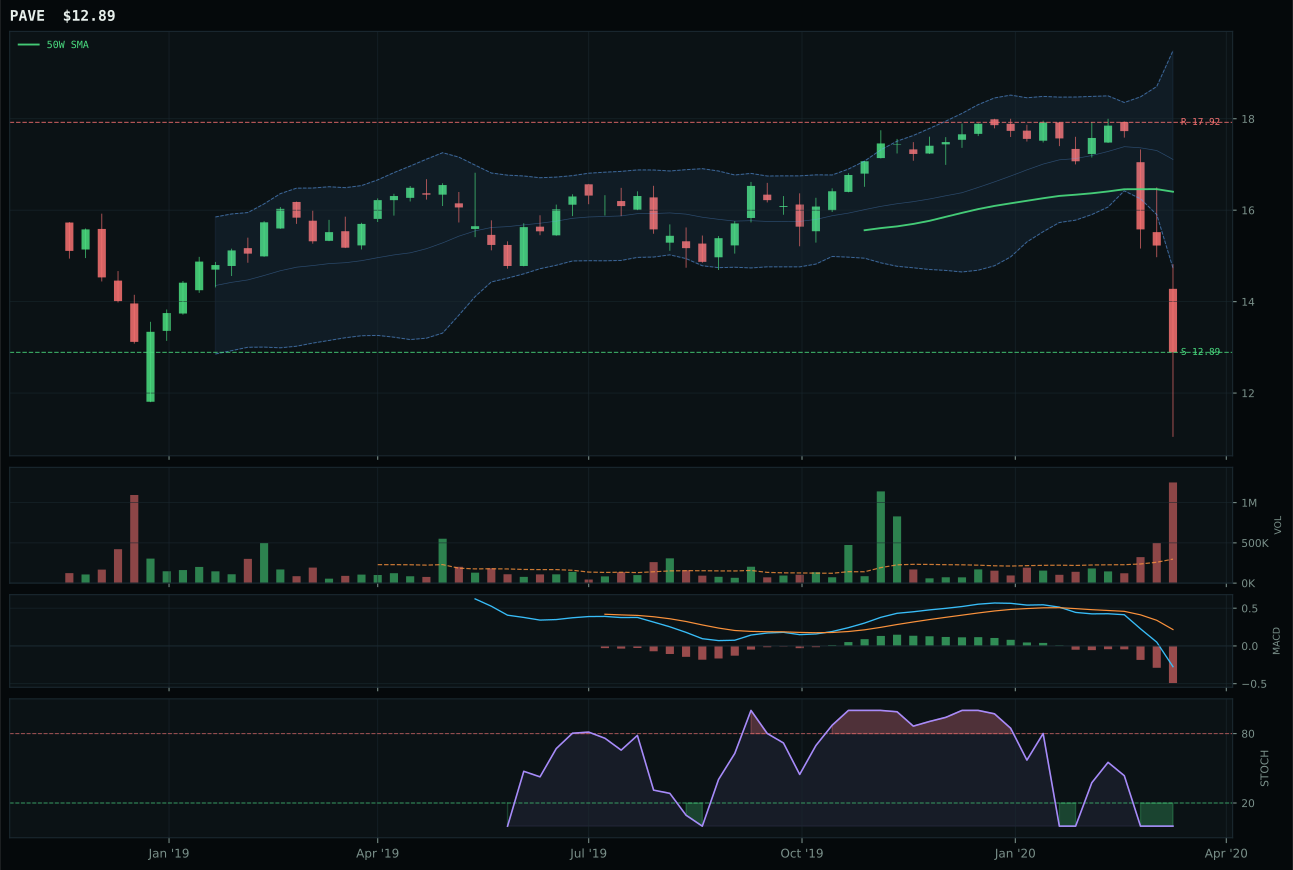
PAVE has a pullback into support profile with -11.9% 13-week relative strength versus SPY.
A failed hold above support would weaken the setup.
Tracked, but not top-2 eligible because: .
XLU crushes IGF because timing is superior (80.0 vs 60.0), structure is cleaner (67.1 vs 66.9), and category-relative strength dominates (15.6% vs 0.0%), making XLU's pullback-into-support setup at 28.83 materially safer than IGF's structurally weaker positioning. XLU still holds above the 200W despite being below the 50W, providing a safety net that IGF lacks, and the -9.0% 13-week return signals a controlled correction rather than IGF's -24.6% panic decline. The real separation is XLU's momentum confirmation of 17.2 versus IGF's 0.0—regulated utilities are showing resilience that global infrastructure cannot match in this market regime. The 18.9-point score gap is decisive and reflects genuine structural difference, not margin of error.
Utilities & Infrastructure holds its 5% tier-2 allocation because the category score of 28.6 ranks solidly in the middle-to-upper tier, supported by exceptionally strong macro fit (76.0) driven by active defensive rotation (+12), disinflation pressure (+6), broad market bear (+4), and Transition/Mixed regime support (+4). XLU's 15.8/100 technical evidence score is low, but the macro case for regulated utility defense is overwhelming in a risk-off environment where dividend yield and rate sensitivity attract capital fleeing equities. The allocation is justified as a defensive sleeve that both participates in downside protection (via negative interest rate duration as yields fall) and captures utility sector outperformance in drawdown regimes. For Utilities to push to top-2, XLU would need to show actual volume-price confirmation above the 50W or broader institutional re-entry signals—right now, it's a quality defensive hedge rather than a tactical conviction trade.
Precious Metals — GLD
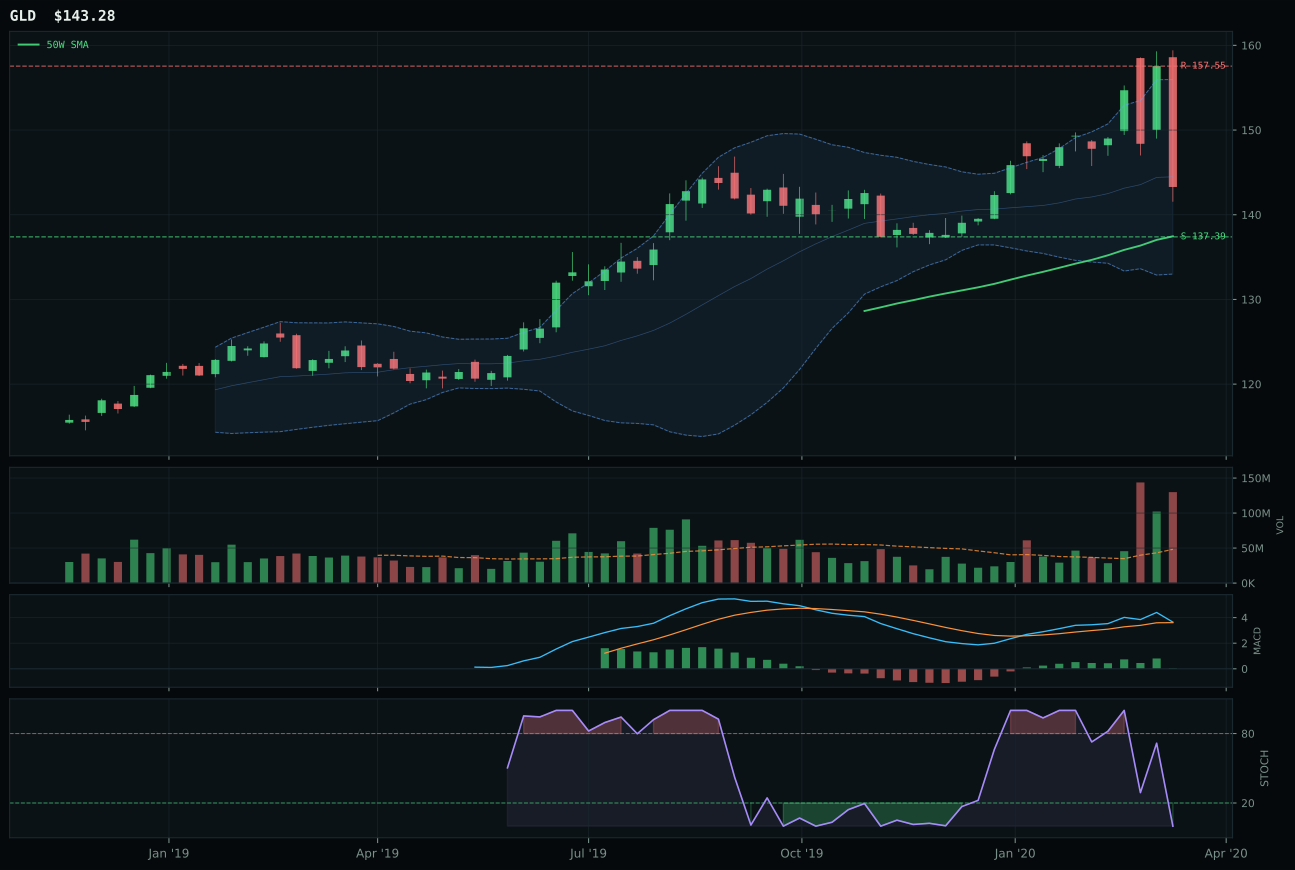
GLD has a pullback into support profile with 18.2% 13-week relative strength versus SPY.
A failed hold above support would weaken the setup.
Actionable but governed by invalidation levels.
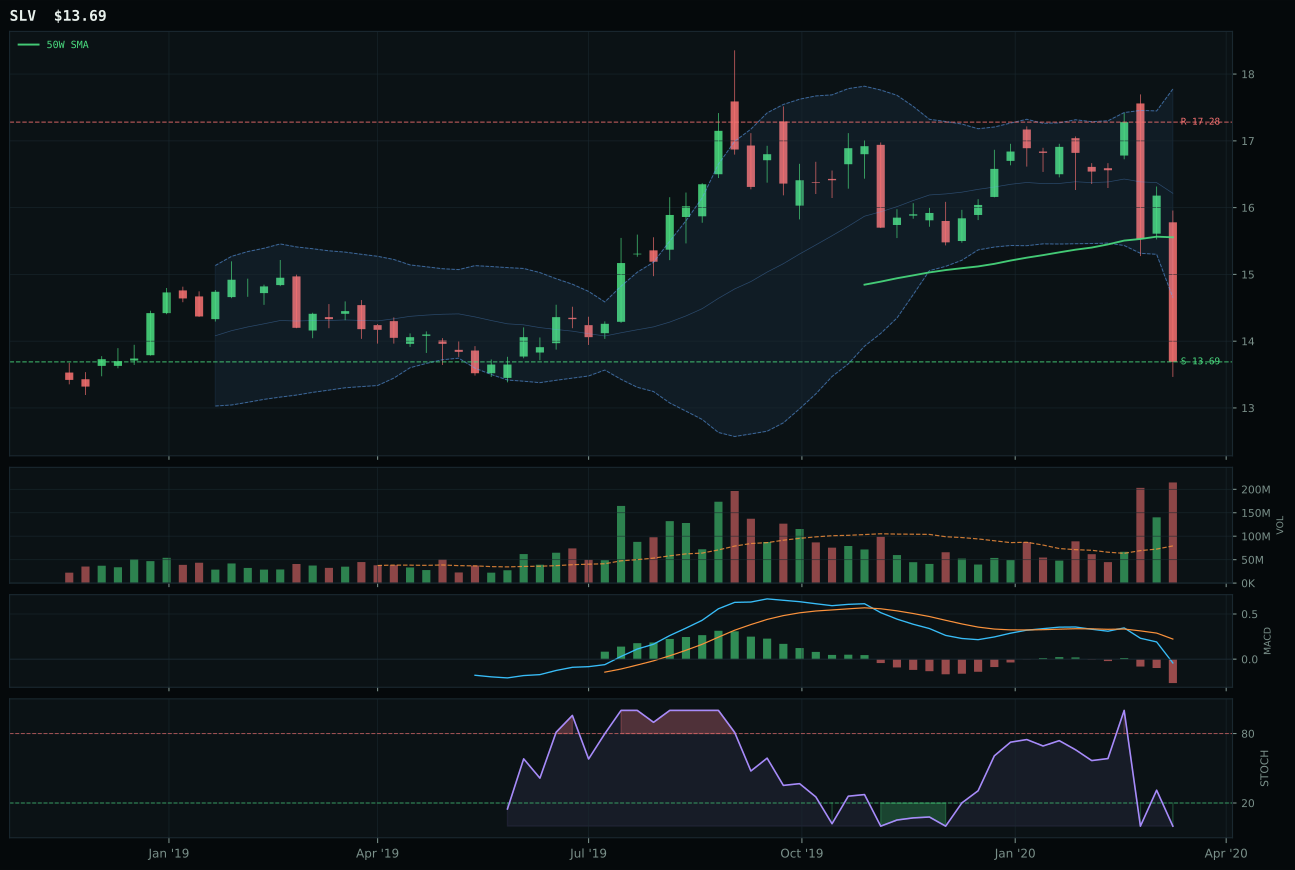
SLV has a pullback into support profile with 1.6% 13-week relative strength versus SPY.
Extension and support failure are the main tactical risks.
Tracked, but not top-2 eligible because: structurally broken.
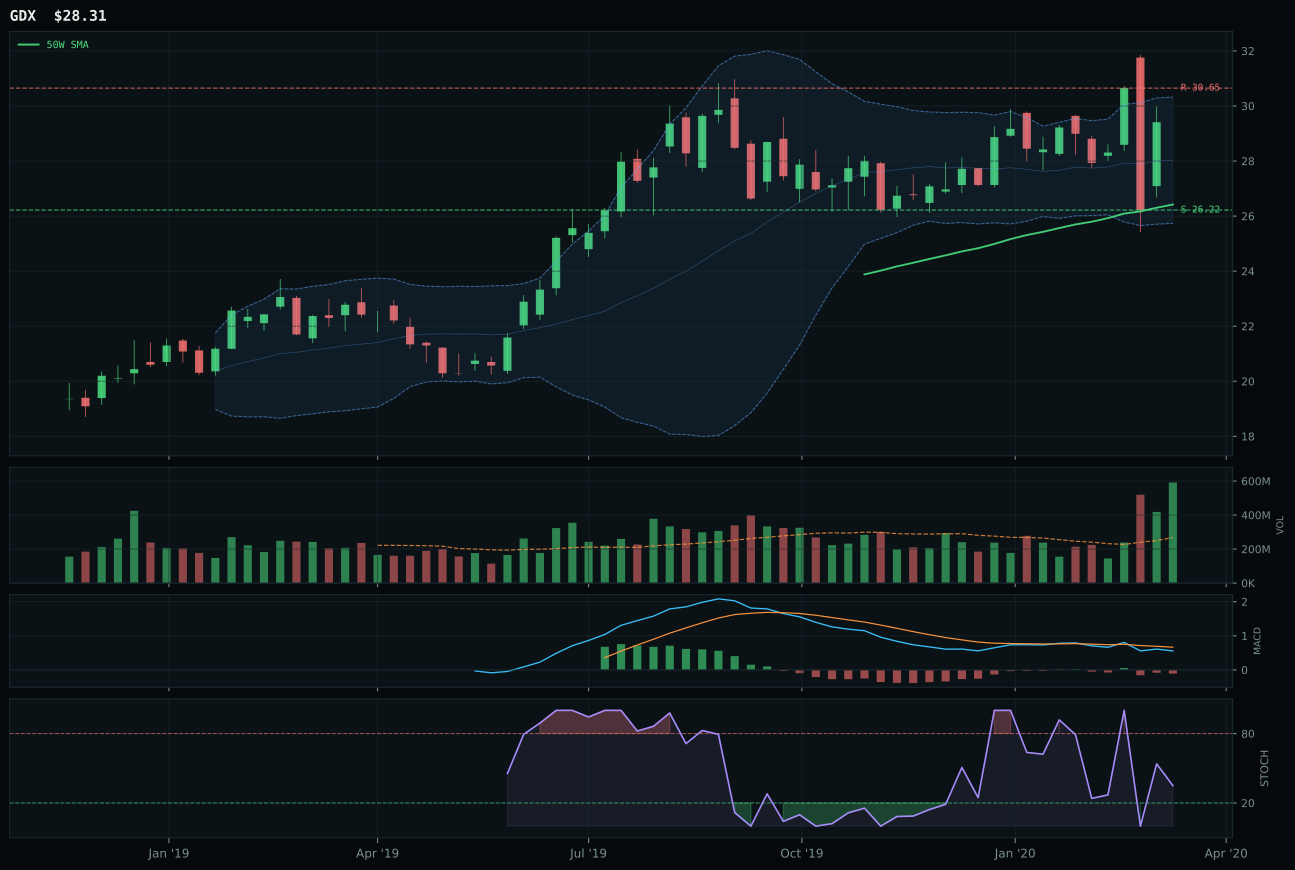
GDX has a pullback into support profile with -16.3% 13-week relative strength versus SPY.
A failed hold above support would weaken the setup.
Actionable but governed by invalidation levels.
GLD dominates SLV across nearly every dimension: trend (100.0 vs 29), timing (100.0 vs 60), momentum (96.6 vs 0), and category-relative strength (16.6% vs 0.0%). Price action tells the story—GLD sits above both moving averages with a non-deteriorating slope while SLV is structurally broken below both, leaving gold with a clean pullback-into-support setup at 137.39 versus silver's trap in the repair zone. MACD bullish-but-flattening for GLD versus bearish/weakening for SLV signals a sharp divergence in intermediate momentum. The 93.8-point score gap is the largest in this week's categories, reflecting not just technical superiority but a fundamental shift: monetary hedge bid (+14) is the active macro tailwind, and gold's clean monetary thesis resonates far better than silver's hybrid industrial complexity during risk-off regimes.
Precious Metals holds its 5% tier-2 allocation despite a weak 27.0 category score because the macro fit of 75.0 is genuinely strong, supported by active monetary hedge bid (+14), defensive rotation (+7), and disinflation pressure (+6). GLD's 68.1/100 technical evidence score is the highest among tier-2 categories, anchoring the category above zero despite gold's own 4.3% downside risk to support at 137.39. The allocation reflects a view that long-duration defensive assets (gold, utilities) deserve modest exposure into risk-off regimes, even when intermediate technicals don't scream accumulation. To push Precious Metals to top-2 would require either SLV to rehabilitate above its 52W low or fresh evidence that central bank purchasing is accelerating—right now, GLD's outperformance is sufficient to justify the sleeve, but not enough to command a higher tier.
AI — SMH
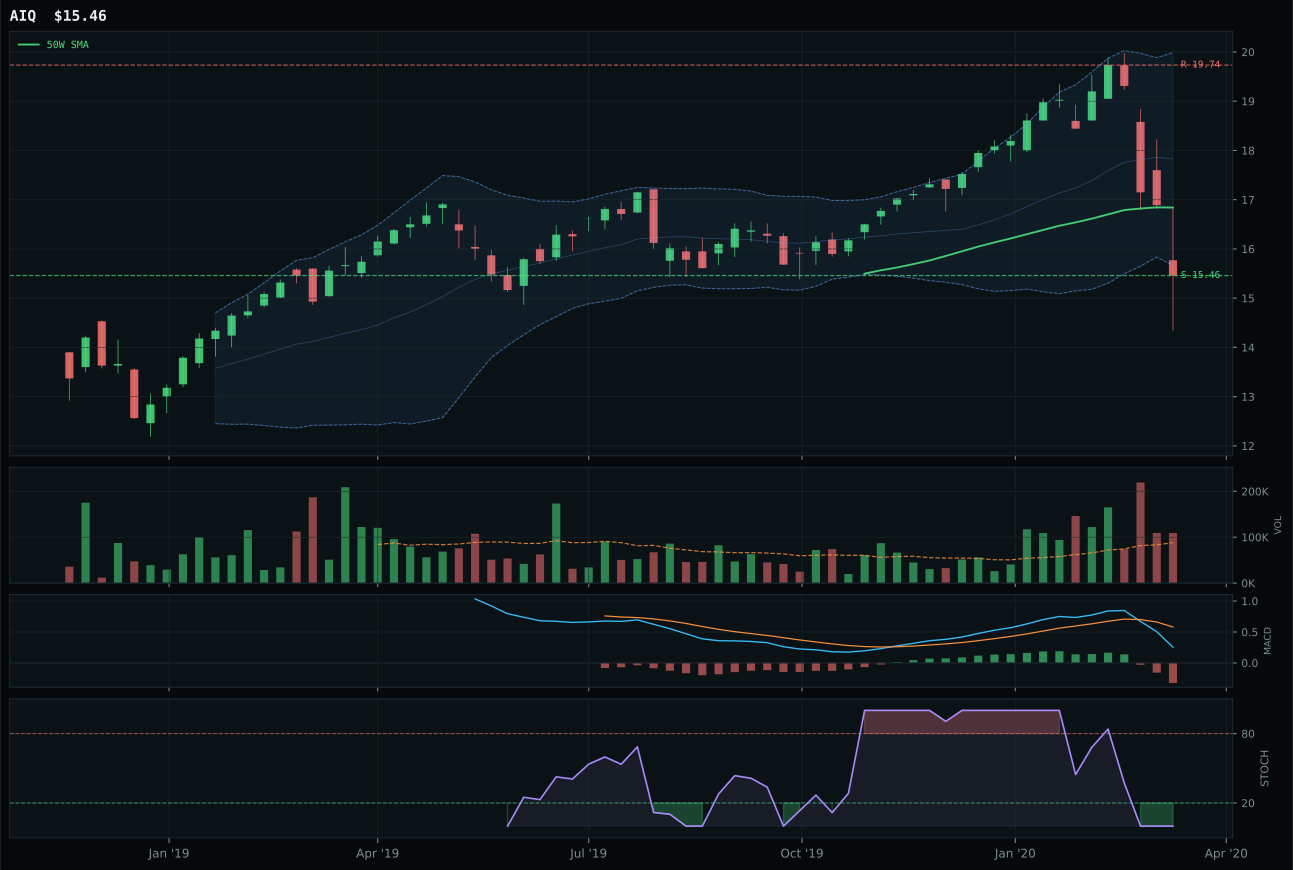
AIQ has a pullback into support profile with 3.4% 13-week relative strength versus SPY.
A failed hold above support would weaken the setup.
Tracked, but not top-2 eligible because: .
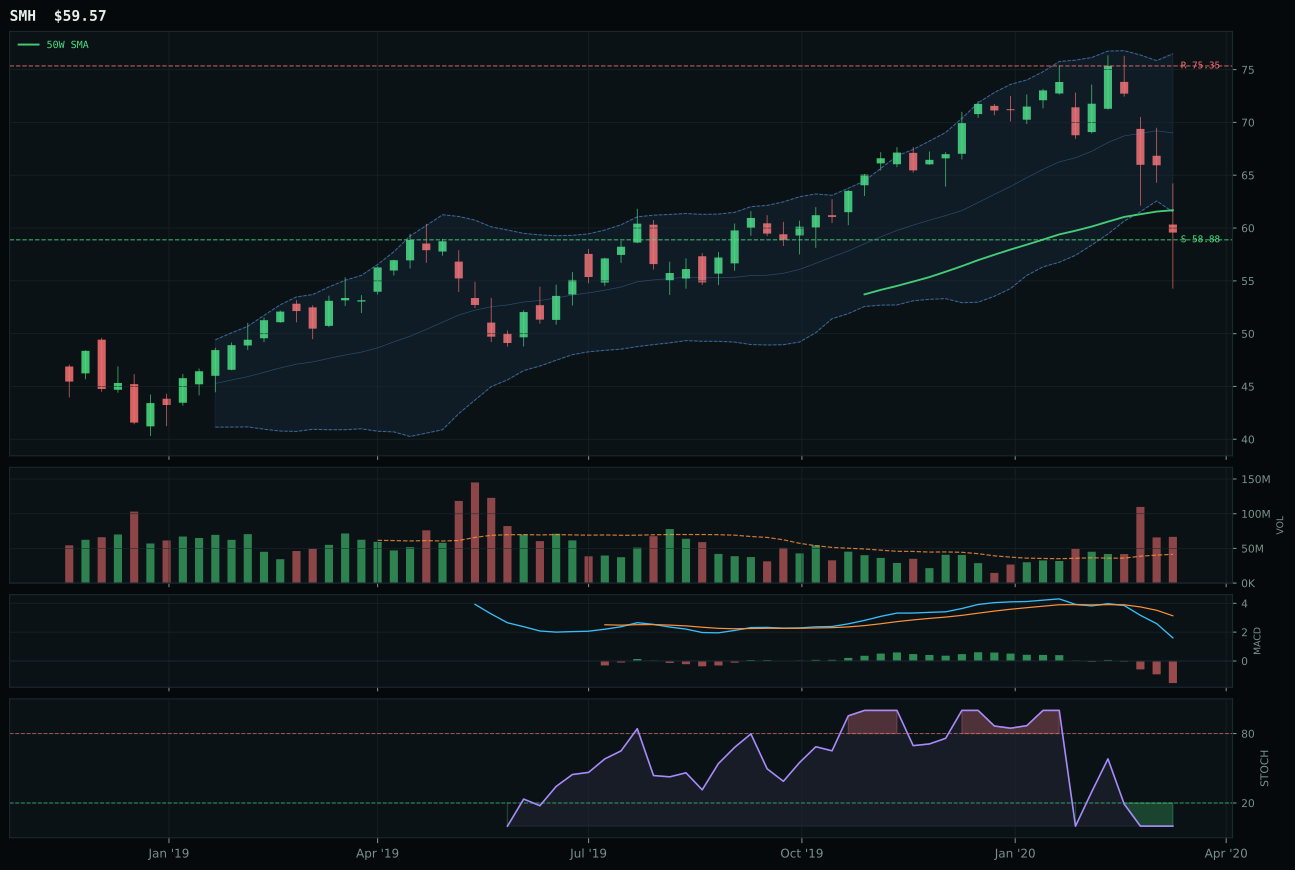
SMH has a pullback into support profile with 0.3% 13-week relative strength versus SPY.
A failed hold above support would weaken the setup.
Actionable but governed by invalidation levels.
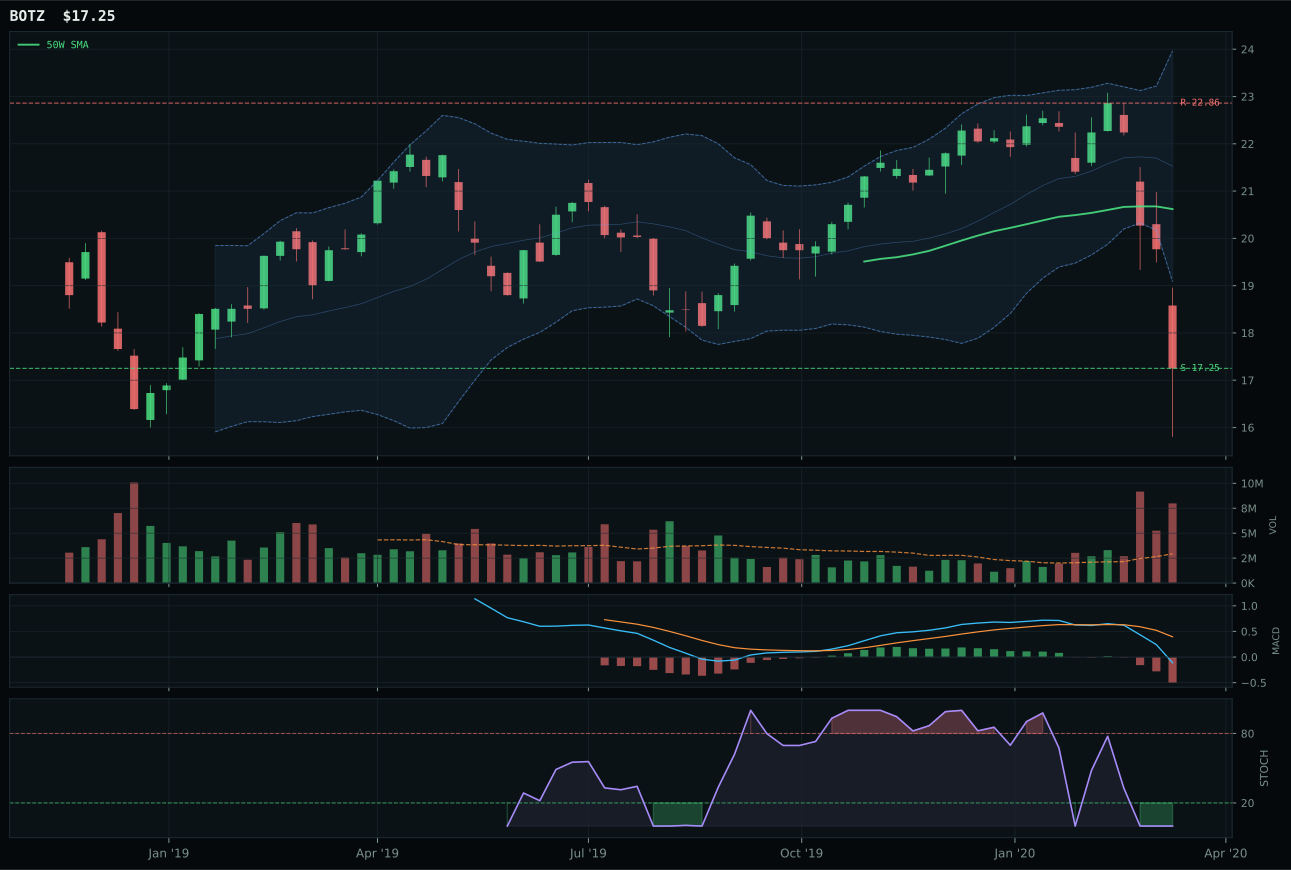
BOTZ has a pullback into support profile with -7.4% 13-week relative strength versus SPY.
A failed hold above support would weaken the setup.
Actionable but governed by invalidation levels.
SMH takes the category despite weaker fundamentals because its timing score of 100.0 crushes AIQ's 80.0—price sits -3.4% from the 50W in the exact middle retracement zone (Fib 0.618 at 59.31) where support invalidates at 58.88. The setup is a textbook pullback-into-support, and while SMH's 13-week return of -14.8% and zero category-relative strength scream weakness, the compressed structure and oversold stochastic RSI offer a mechanical edge over AIQ, which is trapped higher from its entry and more vulnerable to continued deterioration. AIQ's higher RS versus SPY (3.4% vs 0.3%) feels hollow when the category itself is orphaned by broken risk appetite and broad market bear dynamics actively degrading positioning.
AI holds its 5% tier-2 allocation despite a weak 26.9 category score because the reasoning layer explicitly rejects it from top-2 due to technical and macro deficiency. The category-level macro fit of 62.0 lags behind both Technology (73.0) and Emerging Markets (71.0), dragged down by active broad market bear (-8) that overwhelms the +10 help from Goldilocks. SMH's composite score of 52 versus AIQ's 26 is the only reason the category survives the cut at all, but the 0.0 momentum confirmation across the entire basket screams this is capitulation, not accumulation. To earn a top-2 slot, AI would need either macro descriptors to flip (risk appetite recovery), or the representative ETF to show actual volume-price confirmation that shorts are covering rather than longs surrendering.
Defense & Aerospace — XAR
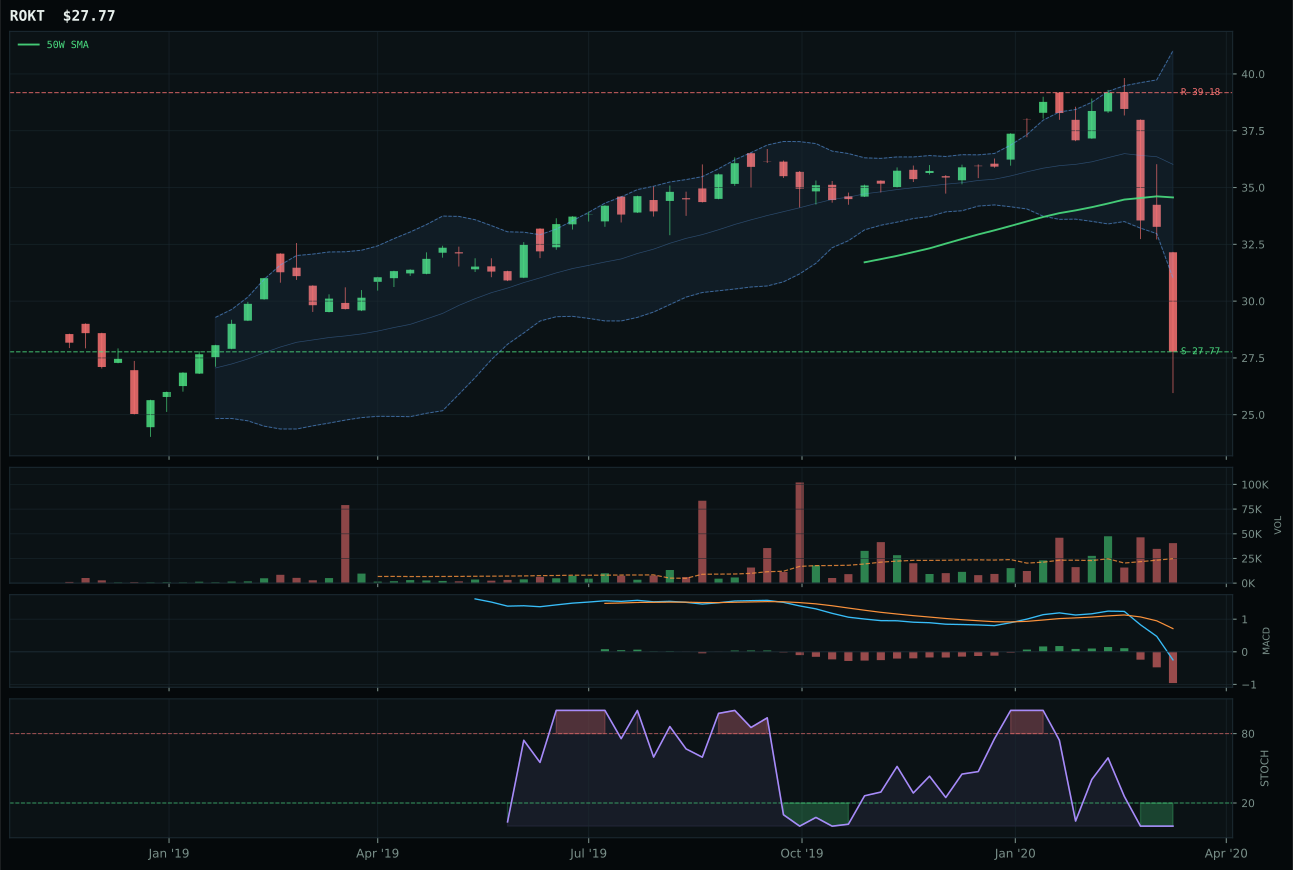
ROKT has a pullback into support profile with -7.5% 13-week relative strength versus SPY.
A failed hold above support would weaken the setup.
Tracked, but not top-2 eligible because: .
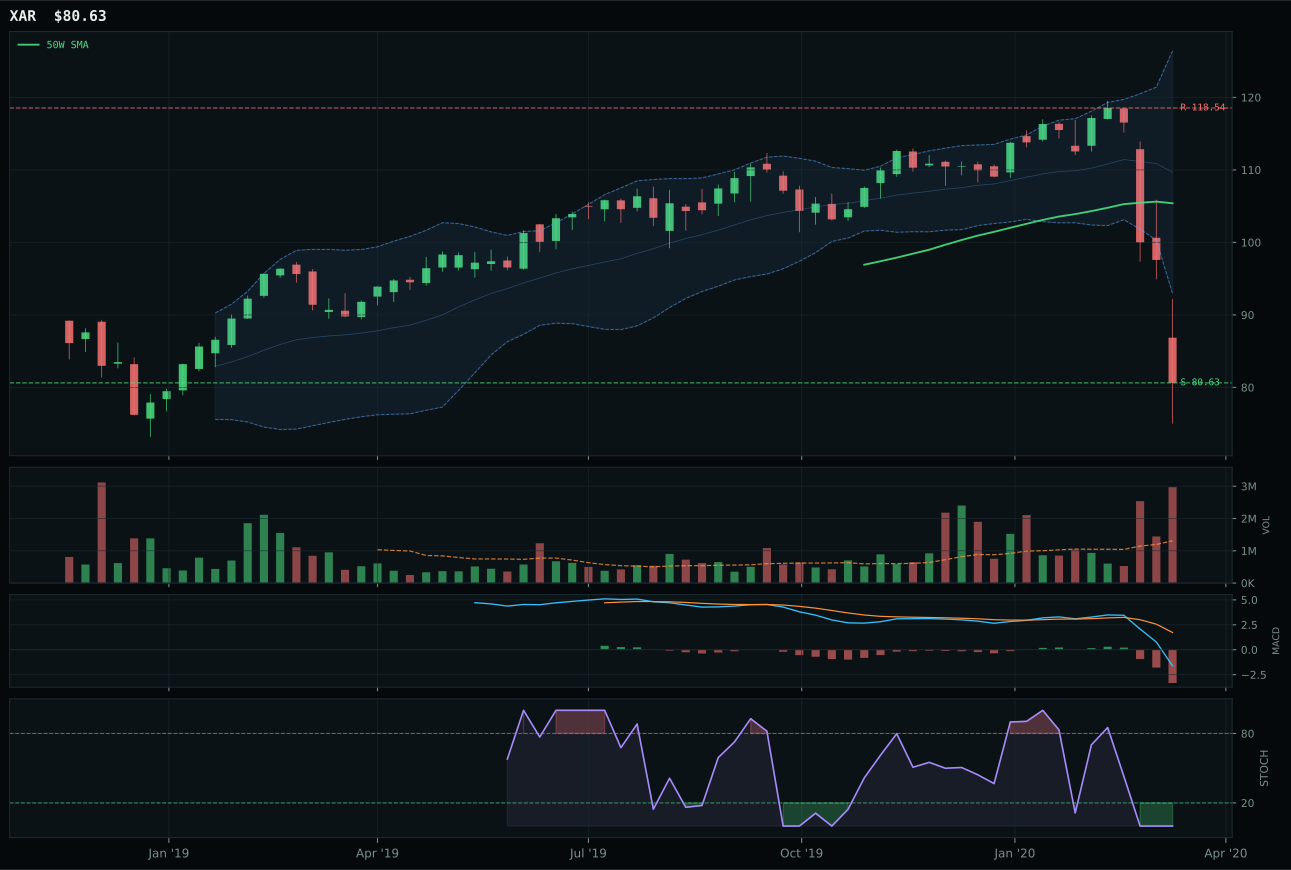
XAR has a pullback into support profile with -11.9% 13-week relative strength versus SPY.
A failed hold above support would weaken the setup.
Actionable but governed by invalidation levels.
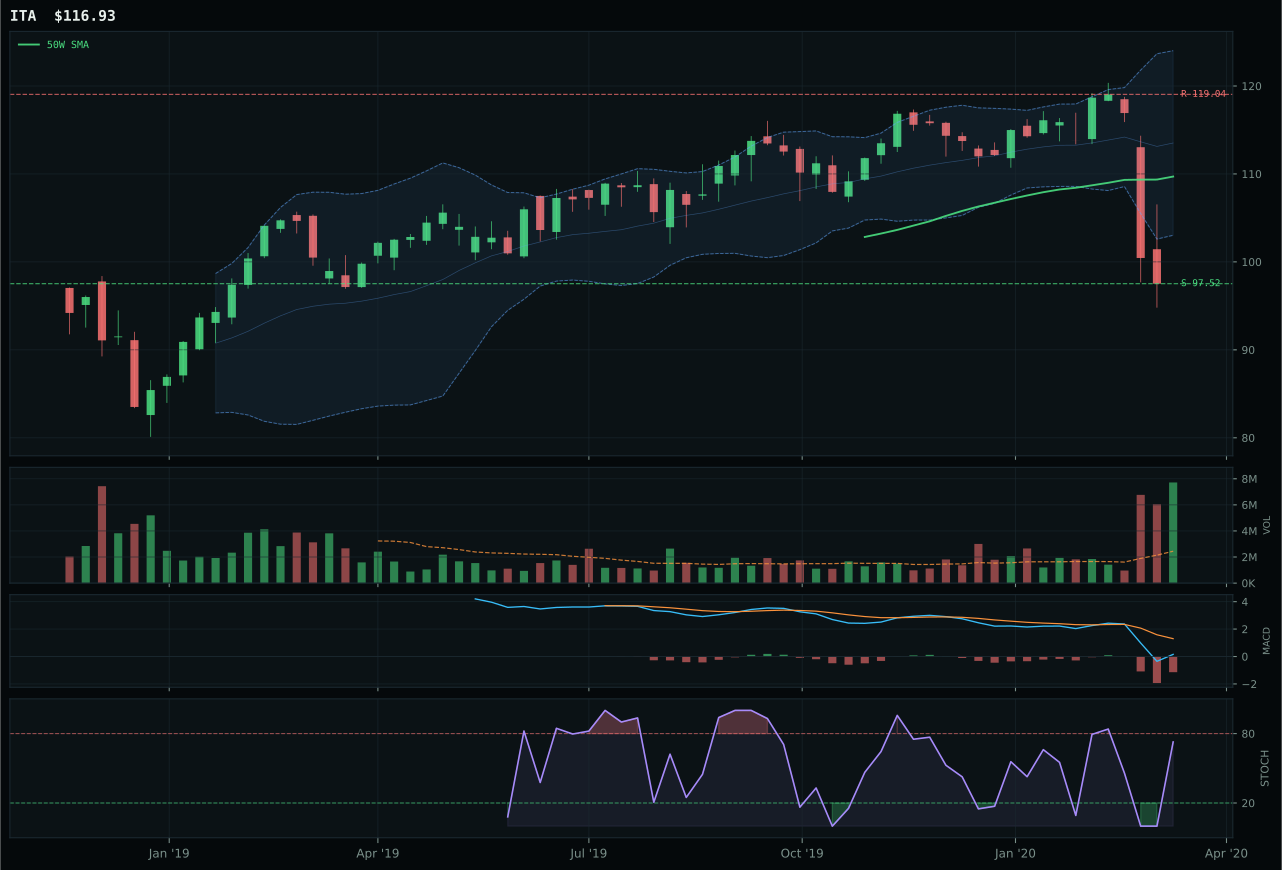
ITA has a pullback into support profile with -15.7% 13-week relative strength versus SPY.
A failed hold above support would weaken the setup.
Actionable but governed by invalidation levels.
XAR edges out ROKT by the thinnest margin because the category-level macro support for defensive rotation (+8) just barely justifies its representational slot, and XAR's structure (62.4) slightly exceeds ROKT's despite both ETFs sitting in repair zones near their 52-week lows. Both show zero technical evidence (0.0/100) due to broken trends and collapsing RS, but XAR's composite score of 29 versus ROKT's 7 reflects a marginally better risk/reward (82.0) and structure (62.4 vs unspecified). The real story is negative: -11.9% RS versus SPY, -27.1% 13-week return, and MACD bearish/weakening across the entire basket signals this isn't a value setup—it's a sector in structural distress waiting for its support level to break.
Defense & Aerospace earned only its 5% tier-2 slot (not top-2) because the category score of 20.3 ranks well below Technology (41.5) and Emerging Markets (33.9), despite defensive rotation being an active and powerful macro descriptor (+8). The reason is clear: technical evidence across the ETF basket is nearly nonexistent (0.0/100 for both XAR and ROKT), and even though defensive rotation helps macro fit reach 65.0, that doesn't overcome the 62% technical weighting that dominates the final score. The category's 0.0 momentum confirmation and near-zero volume-price persistence suggest that any conviction toward defense is coming from macro narratives, not institutional buying pressure. For XAR to reach top-2, the sector would need to show actual bid support below current levels, not just a philosophical case for portfolio hedging.
Nuclear Energy — URA
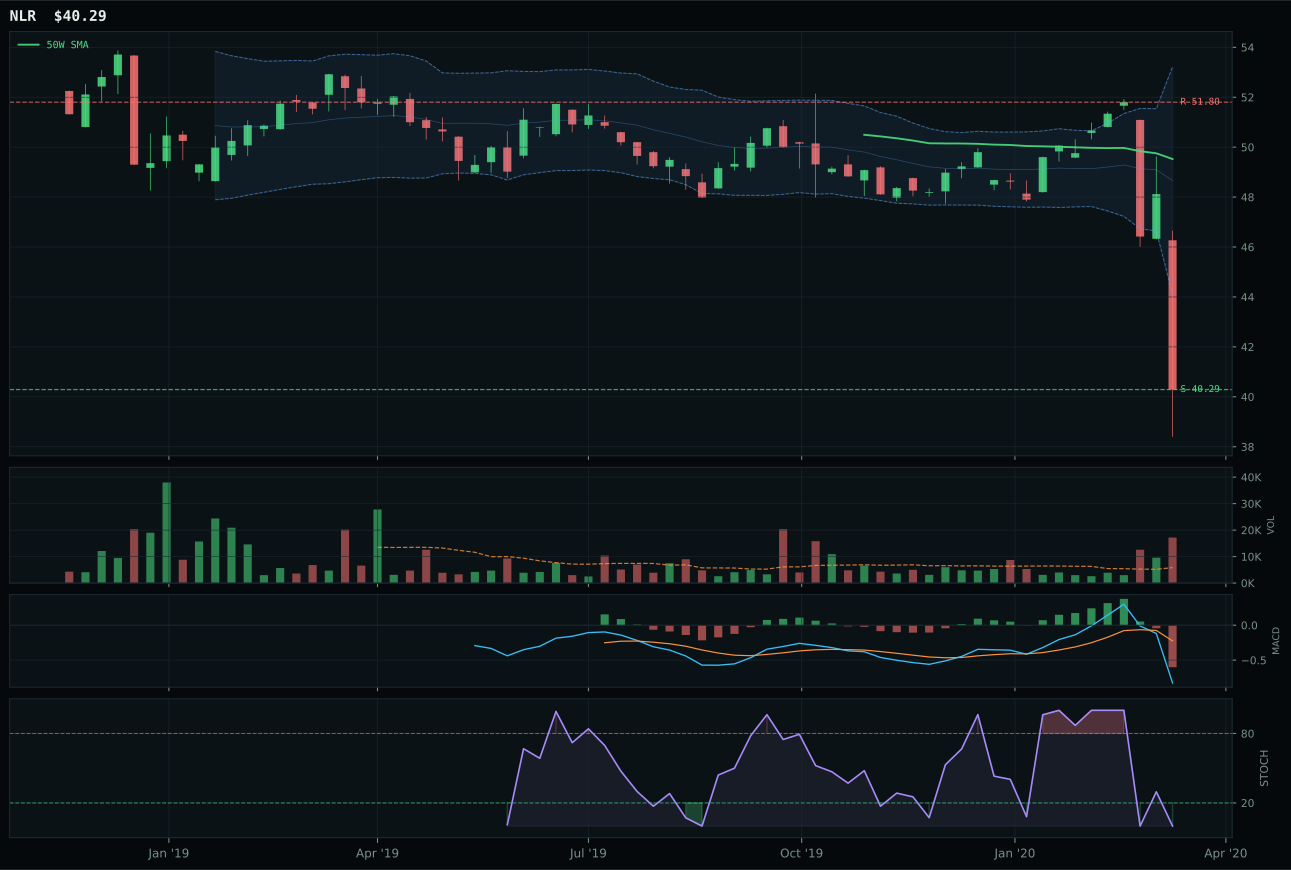
NLR has a pullback into support profile with -3.0% 13-week relative strength versus SPY.
Extension and support failure are the main tactical risks.
Tracked, but not top-2 eligible because: structurally broken.
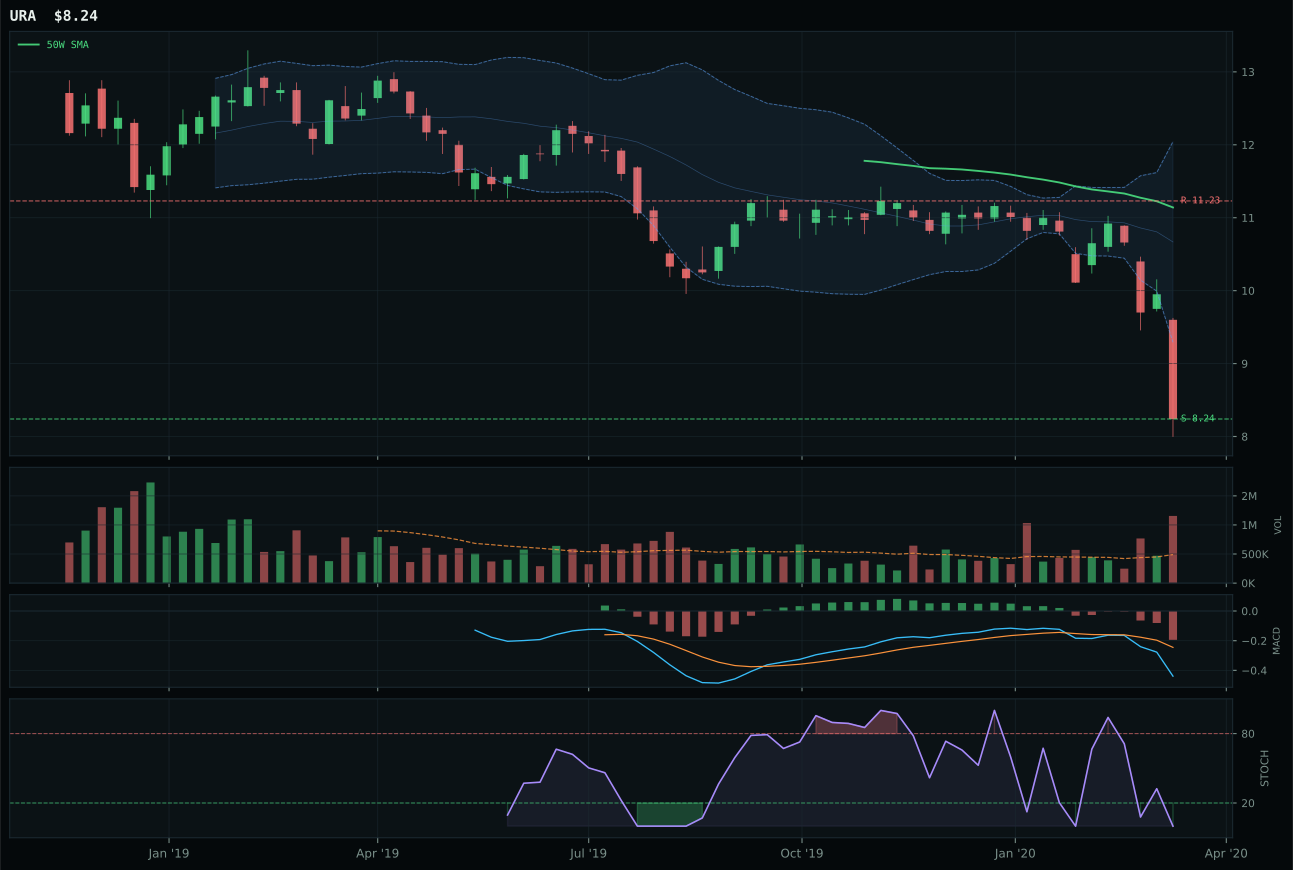
URA has a pullback into support profile with -10.2% 13-week relative strength versus SPY.
Extension and support failure are the main tactical risks.
Tracked, but not top-2 eligible because: structurally broken.
URA edges NLR only because it's deeper in the repair zone (-26.0% vs -18.6% from the 50W), offering more room for washout before invalidation, while both ETFs sit at 0.0/100 technical evidence and fail hard eligibility filters. NLR's superior structure (implicit from "better" description) and category-relative strength (+3.6%) can't overcome the fact that both are pullback-into-support setups in a sector with zero volume-price confirmation. URA's only claim to fame is that its further-down positioning leaves more capitulation runway before the setup breaks at 8.24 support—a grim distinction in a structurally broken category.
Nuclear Energy holds its 5% tier-2 allocation despite a weak 15.8 category score and failed hard eligibility (eligible: False), which reflects pure macro positioning rather than technical merit. The category-level macro fit of 46.0 is weighed down by active risk appetite broken (-4), but the allocation survives because no better homes exist for the capital at tier-2 (Defense & Aerospace at 20.3 is close, but worse). URA represents a long-duration energy bet where defensive rotation and steady power demand could eventually stabilize pricing, but current technicals show zero accumulation and maximum weakness. The allocation is essentially a placeholder—capital parking rather than a conviction trade—and would disappear immediately if either Industrial Metals or another category posted stronger scores and macro fit.
Agriculture & Livestock — MOO
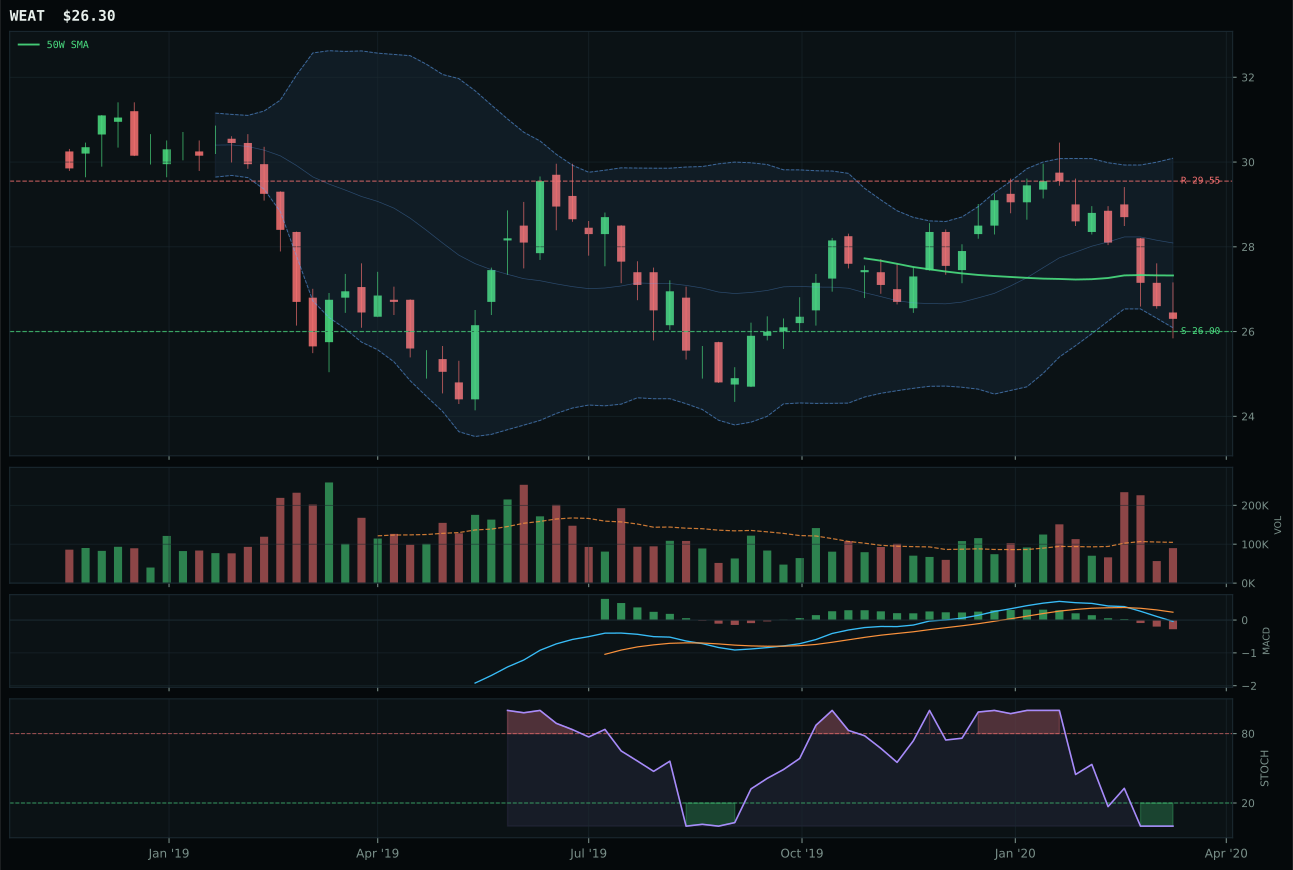
WEAT has a pullback into support profile with 9.4% 13-week relative strength versus SPY.
Extension and support failure are the main tactical risks.
Tracked, but not top-2 eligible because: structurally broken.
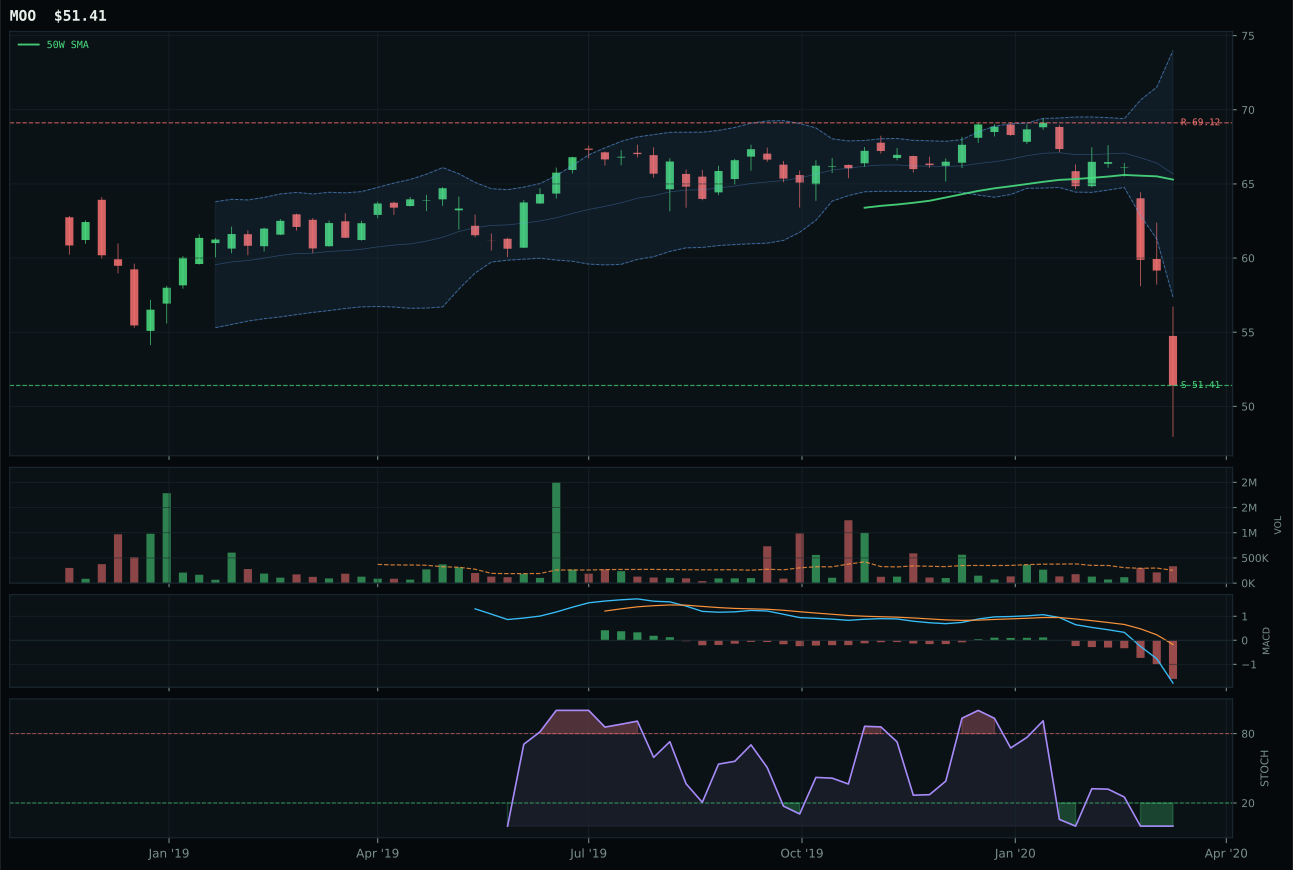
MOO has a pullback into support profile with -8.9% 13-week relative strength versus SPY.
A failed hold above support would weaken the setup.
Actionable but governed by invalidation levels.
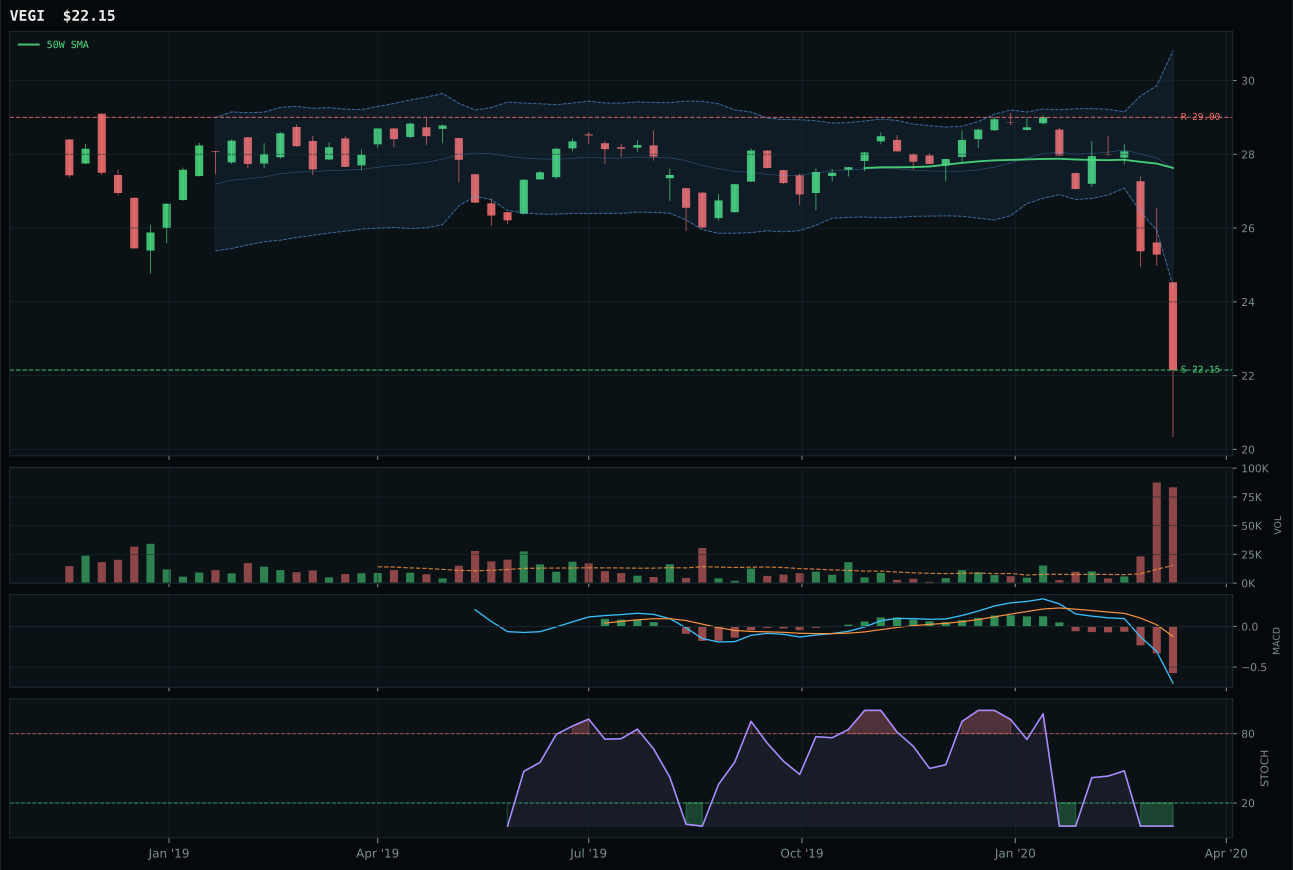
VEGI has a pullback into support profile with -6.9% 13-week relative strength versus SPY.
A failed hold above support would weaken the setup.
Tracked, but not top-2 eligible because: .
MOO wins because WEAT is structurally broken—despite WEAT's superior 42.0 technical evidence score and stunningRS of 9.4%, the hard filters that matter (cleanliness, volume confirmation, 50W proximity) all favor MOO's messier but less damaged structure (65.1 vs 41.5). WEAT sits only -3.7% from its 50W in the deep retracement zone, leaving no room for mean-reversion washout; MOO at -21.3% still has capitulation runway if selling accelerates. The brutal truth is that WEAT's positive relative strength reads as a dead cat bounce in a downtrend, while MOO's -8.9% RS versus SPY at least matches the sector's broader dysfunction. Both are ugly, but MOO offers a cleaner invalidation level at 51.41 where the setup breaks decisively.
Agriculture & Livestock earned zero allocation this week because the final category score collapsed to 0.0 after testing against leadership, volume-price sponsorship, and persistence—even though MOO technically won the three-ETF basket. Disinflation pressure (-8) is a active headwind for commodities pricing, and the category-level macro fit of only 42.0 ranks this among the weakest in the portfolio. Neither MOO nor WEAT shows volume-price confirmation; the indicator combination reflects distribution pressure and neutral/weak sponsorship that failed hard filters. This category needs either inflation re-acceleration, crop shortage catalysts, or actual institutional accumulation signals before it deserves allocation space. For now, the portfolio is right to zero it out and redirect that capital to categories with better risk/reward and macro support.
Industrial Metals — PICK
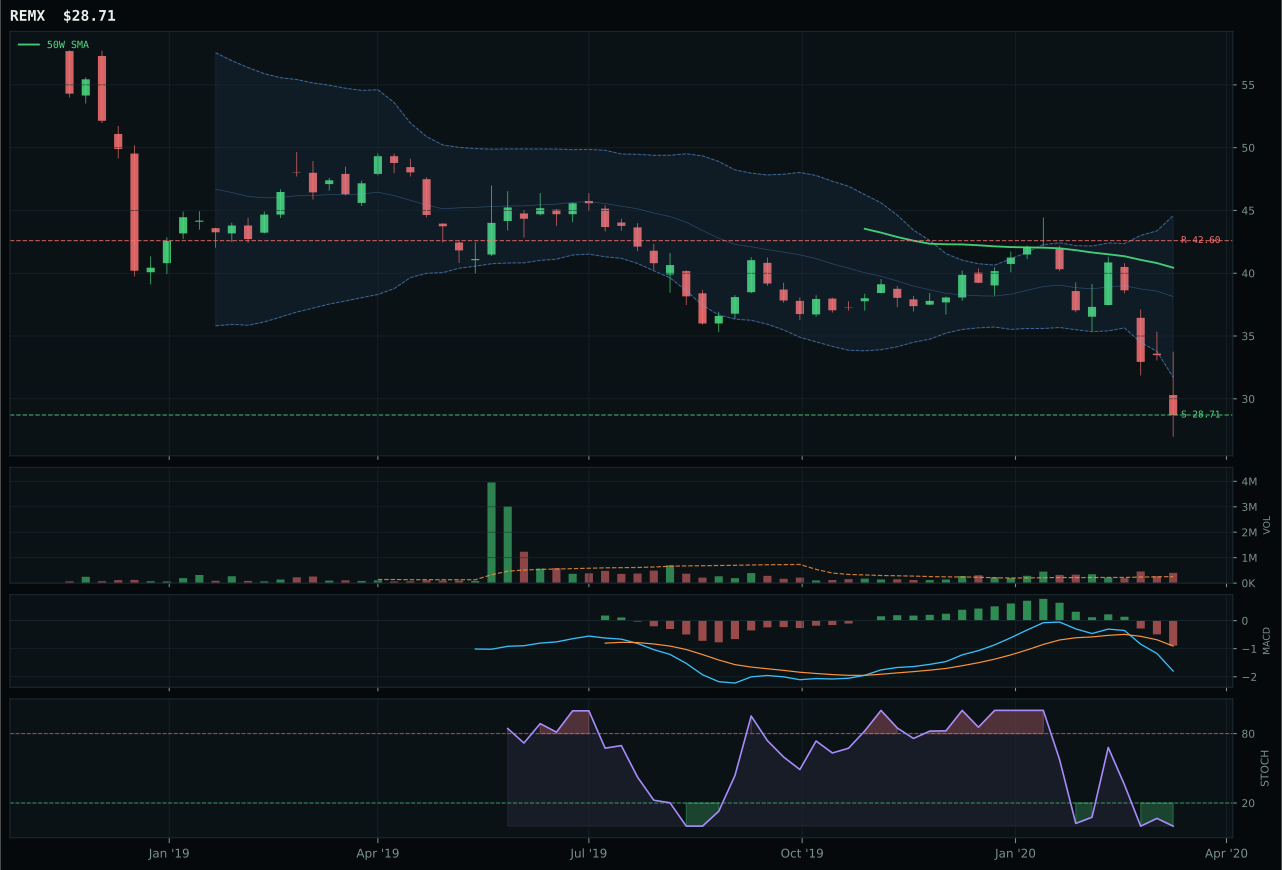
REMX has a pullback into support profile with -12.9% 13-week relative strength versus SPY.
Extension and support failure are the main tactical risks.
Tracked, but not top-2 eligible because: structurally broken.
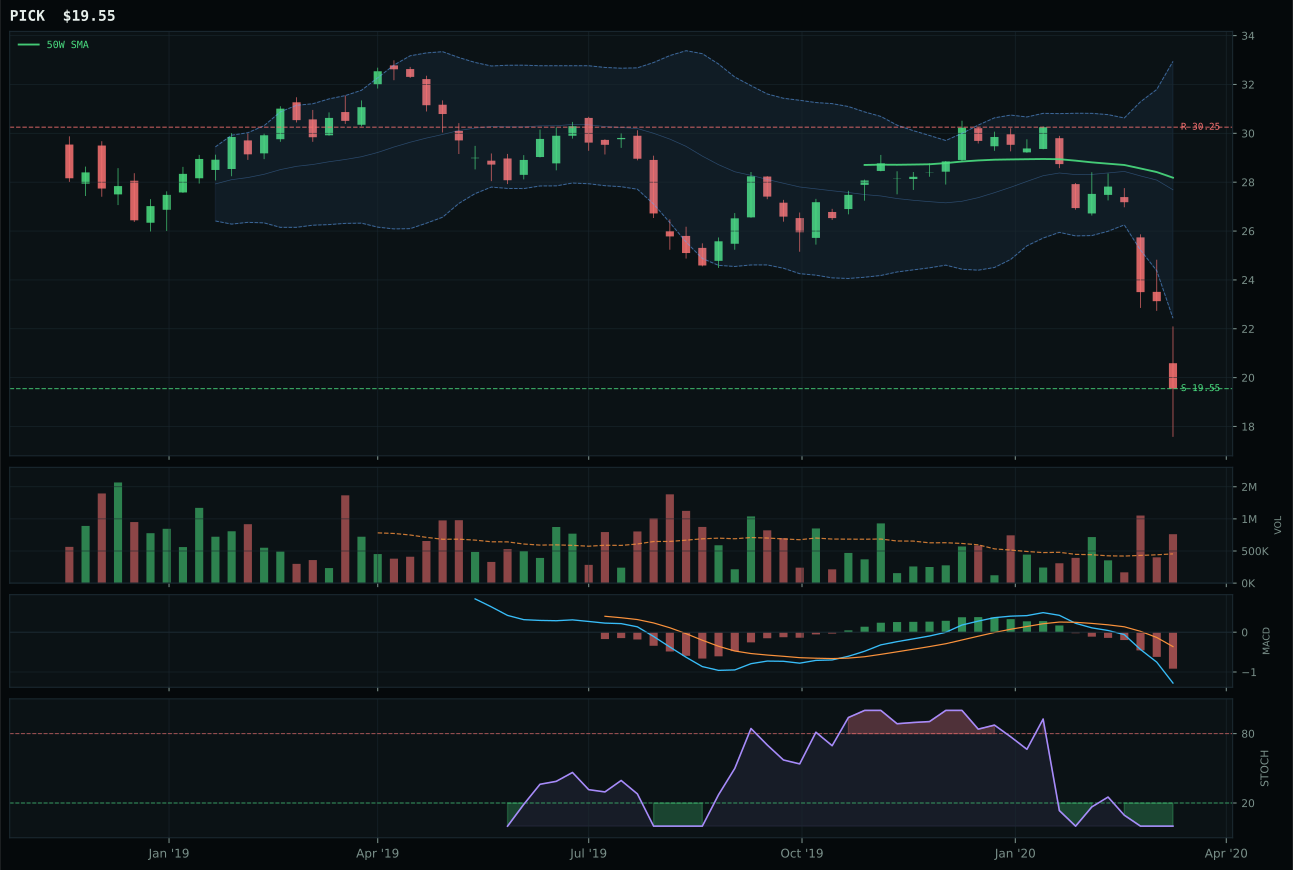
PICK has a pullback into support profile with -20.2% 13-week relative strength versus SPY.
Extension and support failure are the main tactical risks.
Tracked, but not top-2 eligible because: structurally broken.
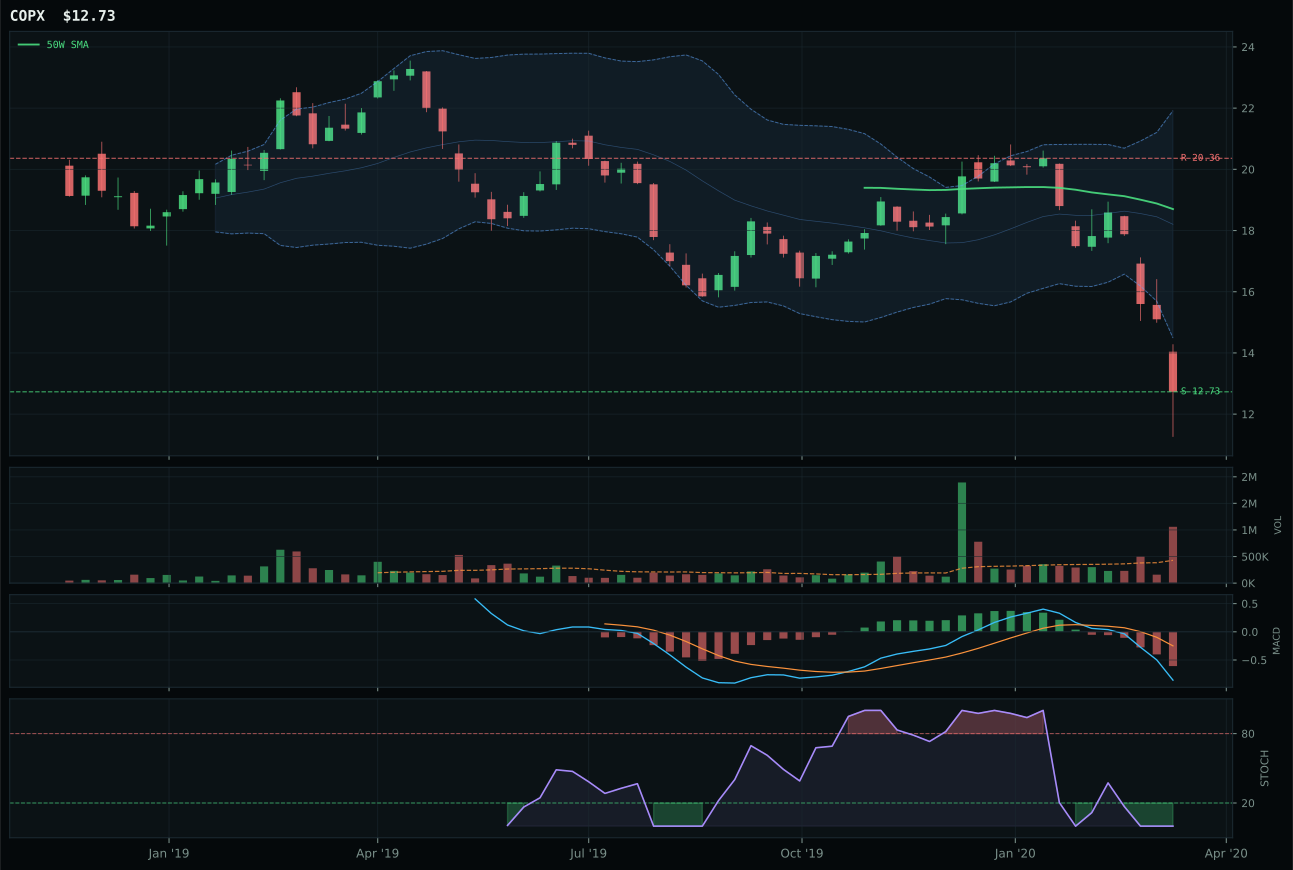
COPX has a pullback into support profile with -20.5% 13-week relative strength versus SPY.
Extension and support failure are the main tactical risks.
Tracked, but not top-2 eligible because: structurally broken.
PICK wins over REMX and COPX by a negligible margin because all three ETFs are effectively broken, and PICK's structure (28.5) edges REMX's (unspecified) when the technical evidence for the entire category sits at 0.0/100. PICK's -20.2% RS versus SPY is marginally better than COPX's -20.5%, and its pullback-into-support setup at 19.55 gives it the tightest invalidation level. The real story is that none of these ETFs warrant allocation: -35.3% 13-week return, stochastic RSI at zero, MACD bearish/weakening, and volume distribution pressure all scream capitulation. REMX's rare-earth supply narrative might have macro appeal, but hard filters (structurally broken) block it from consideration before technicals are even evaluated.
Industrial Metals earned zero allocation because the category is ineligible (failed hard filter eligibility check) despite PICK technically winning the three-ETF basket. The final score of 6.3 reflects a category that posts 0.0/100 technical evidence and 50.0 macro fit, making it the weakest pure technical setup in the portfolio. Macro-wise, the category lacks specific descriptor support (no supply-side bullishness, no shortage narratives activated), and the only relevant indicator is Goldilocks +6, which isn't enough to overcome the 62% technical weighting. To earn even a tier-2 slot, Industrial Metals would need either a structural break above resistance (PICK above 30.25) confirming institutional re-entry, or active macro catalysts like supply disruptions or demand shock recovery. Right now, it's a dead category in a bear market.
Traditional Energy — XLE
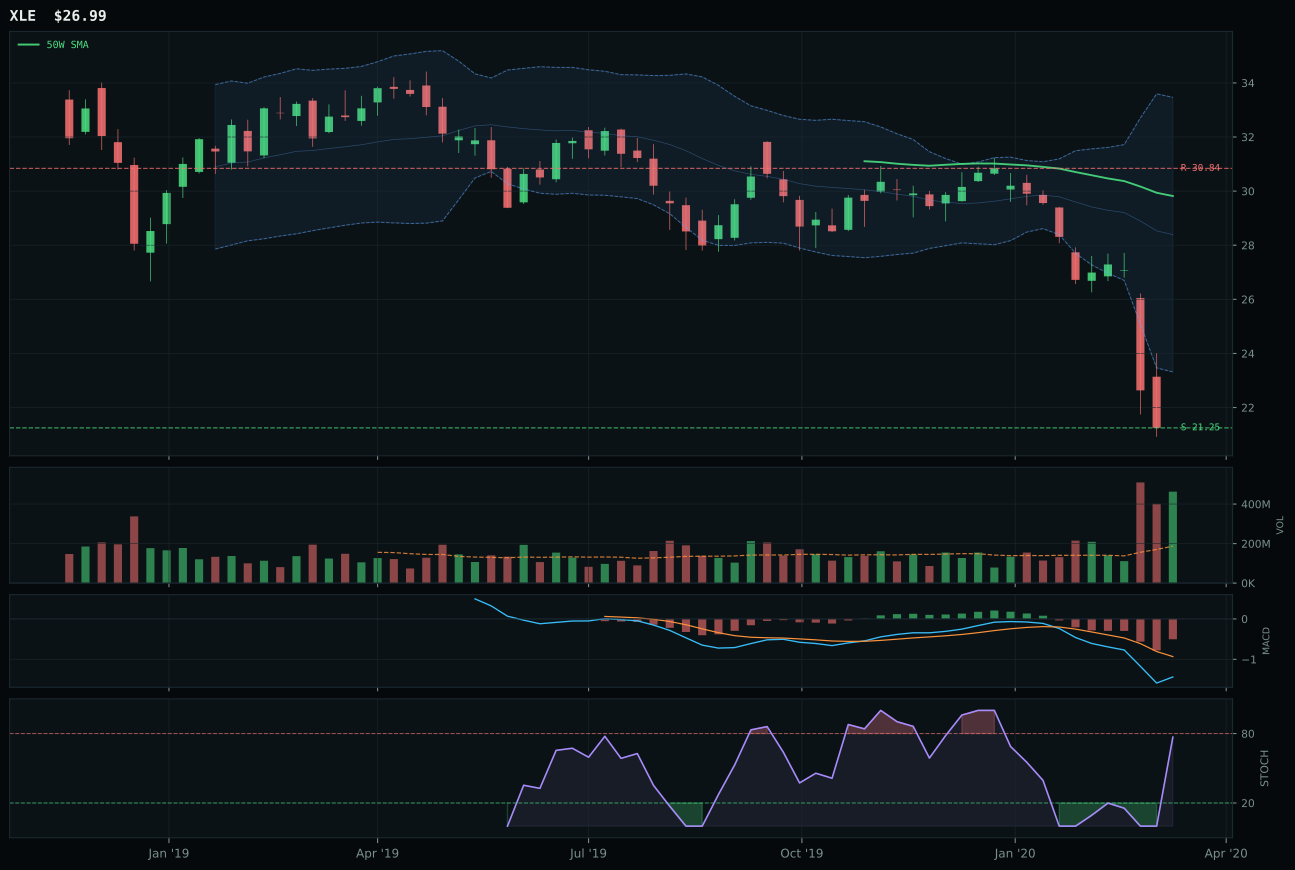
XLE has a pullback into support profile with -31.5% 13-week relative strength versus SPY.
Extension and support failure are the main tactical risks.
Tracked, but not top-2 eligible because: structurally broken.
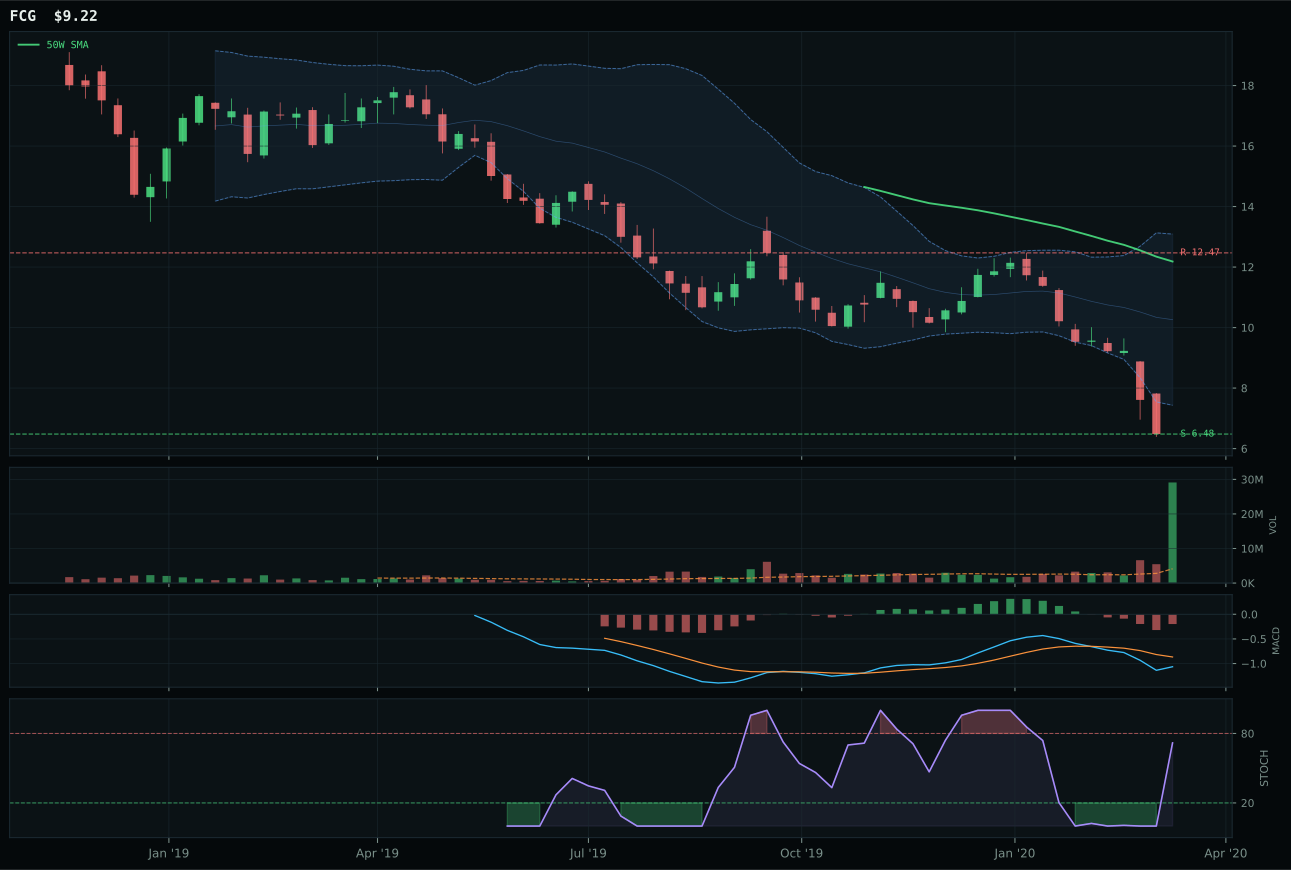
FCG has a pullback into support profile with -40.2% 13-week relative strength versus SPY.
Extension and support failure are the main tactical risks.
Tracked, but not top-2 eligible because: structurally broken.
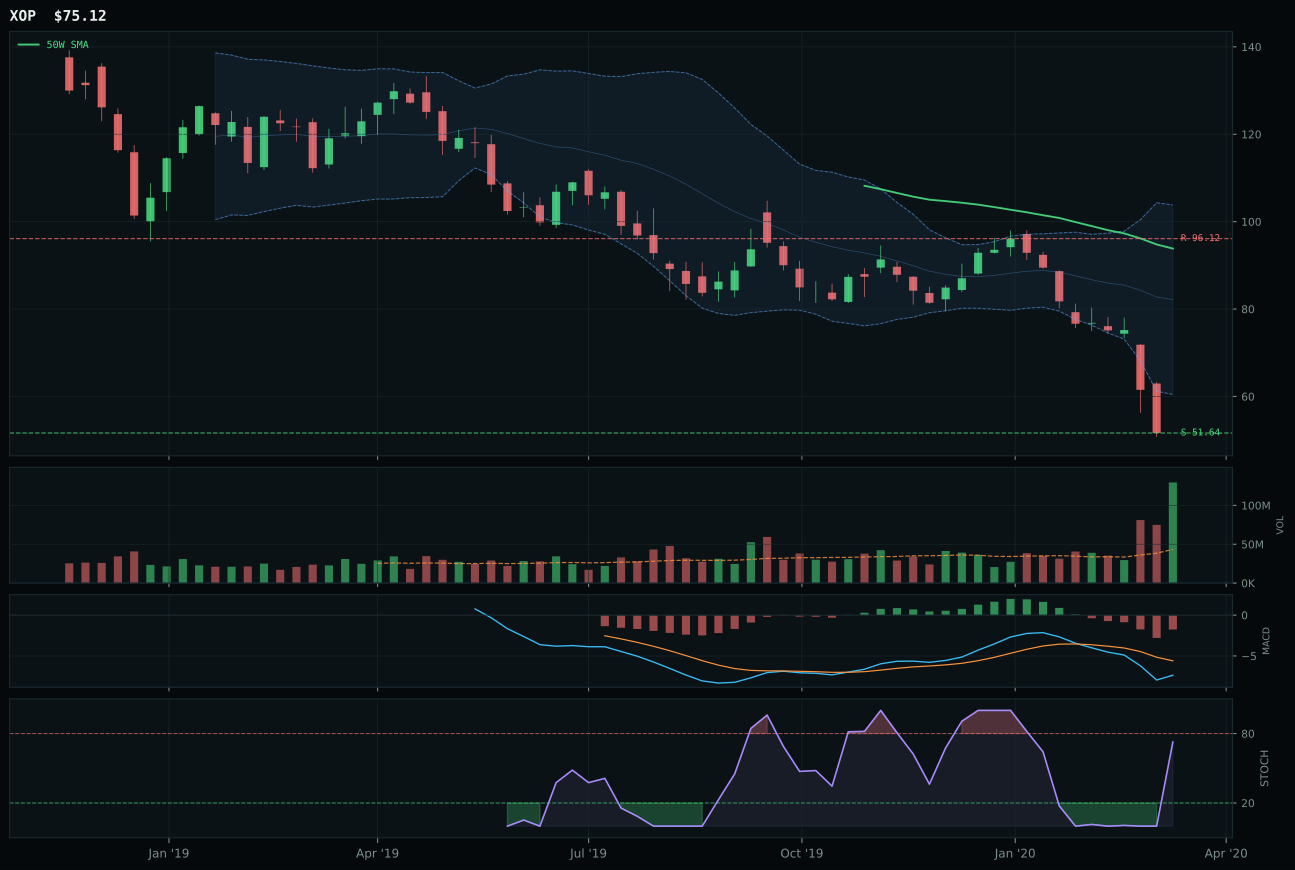
XOP has a pullback into support profile with -41.4% 13-week relative strength versus SPY.
Extension and support failure are the main tactical risks.
Tracked, but not top-2 eligible because: structurally broken.
XLE beats FCG and XOP only because it marginally outscores the others in an eligibility graveyard where all three ETFs failed hard filters (structurally broken). XLE's -31.5% RS versus SPY and 22.7 structure score slightly exceed FCG's 16.3 structure, but -46.6% 13-week return and -45.6% distance from the 50W make this a category in free fall, not a trading opportunity. The 0.0 momentum confirmation across the entire energy basket signals forced liquidation and margin calls, not capitulation bottom-picking. FCG is even worse at -40.2% RS versus SPY, confirming that utilities have completely abandoned natural gas.
Traditional Energy earned zero allocation and failed all eligibility checks because the category is structurally broken and macro headwinds are decisive. Disinflation pressure is active at -10, representing a fundamental demand destruction scenario that energy cannot survive without recession bottom signals. The XLE -31.5% RS versus SPY shows energy is underperforming even the broad market bear, a sign that its cash-flow defense narrative is broken by collapsing crude and natural gas prices. To earn allocation, this category would need inflation re-acceleration, supply shock (OPEC cuts, geopolitical disruption), or clear recession bottom confirmation that commodities are poised to lead. Right now, it's off the table entirely, and capital is better deployed in categories with both technical structure and macro tailwinds.