
2020-03-06
Informational purposes only. The content in this report, including allocations, analysis, and commentary, is provided solely for informational and educational purposes. It does not constitute financial advice, investment advice, trading advice, or any other type of advice. Past performance does not guarantee future results. Always conduct your own research and consult a qualified financial professional before making investment decisions.
Some tracked tickers were excluded due to missing live weekly price data: SGOV: Historical cache SGOV has only 0 usable weekly bars; URNM: Historical cache URNM has only 14 usable weekly bars
XLE defensive overlay excluded: price is below its 8W SMA. Cause selector will use GLD or cash alternative.
Fast-crash circuit breaker triggered: SPY dropped more than 8% from its 4-week high this week. Defensive overlay activated immediately.
Slow macro Defensive trigger is active (Monetary Defense), but crypto-cycle exposure has priority for this run.
Weekly Allocation
| Ticker | Category | Weight | Role |
|---|---|---|---|
| FBTC | 50% | Overlay | |
| GLD | Precious Metals | 10% | Top-2 (10%) |
| XLK | Technology | 10% | Top-2 (10%) |
| XLU | Utilities & Infrastructure | 5% | Tier-2 (5%) |
| SMH | AI | 5% | Tier-2 (5%) |
| IEMG | Emerging Markets | 5% | Tier-2 (5%) |
| XAR | Defense & Aerospace | 5% | Tier-2 (5%) |
| MOO | Agriculture & Livestock | 5% | Tier-2 (5%) |
| NLR | Nuclear Energy | 5% | Tier-2 (5%) |
Trade Instructions — Monday Open
Sell the tranche from 2020-02-07 (completing its 4-week hold). Buy the new tranche. Instructions show net portfolio changes — same-asset positions cancel, weight changes show the delta.
| Action | Ticker | Instruction |
|---|---|---|
| SELL | XLU | Sell 25% of XLU position (reduce 5.00% → 3.75%) |
| SELL | ITA | Sell 33% of ITA position (reduce 3.75% → 2.50%) |
| SELL | INDA | Sell 50% of INDA position (reduce 2.50% → 1.25%) |
| SELL | XLE | Sell 33% of XLE position (reduce 3.75% → 2.50%) |
| BUY | GLD | Buy GLD — 25.00% of freed cash (adds 1.25% to portfolio) |
| BUY | IEMG | Buy IEMG — 25.00% of freed cash (adds 1.25% to portfolio) |
| BUY | XAR | Buy XAR — 25.00% of freed cash (adds 1.25% to portfolio) |
| BUY | MOO | Buy MOO — 25.00% of freed cash (adds 1.25% to portfolio) |
Current Portfolio After Trade
Combined holdings across all 4 active tranches. Each tranche is 25% of the portfolio.
| Ticker | % of Portfolio | Weight Bar |
|---|---|---|
| FBTC | 50.00% | |
| GLD | 7.50% | |
| IGV | 7.50% | |
| SMH | 6.25% | |
| XLU | 3.75% | |
| NLR | 3.75% | |
| ITA | 2.50% | |
| XLE | 2.50% | |
| IEMG | 2.50% | |
| XAR | 2.50% | |
| MOO | 2.50% | |
| XLK | 2.50% | |
| INDA | 1.25% | |
| BOTZ | 1.25% | |
| ILF | 1.25% | |
| IGF | 1.25% | |
| URA | 1.25% |
Macro Regime — Goldilocks
Defensive overlay cause is falling-growth or disinflation stress: gold is favored because falling real-yield pressure and monetary hedging are more relevant than cyclical commodity demand. GLD has been confirmed above its 8W SMA and is eligible.
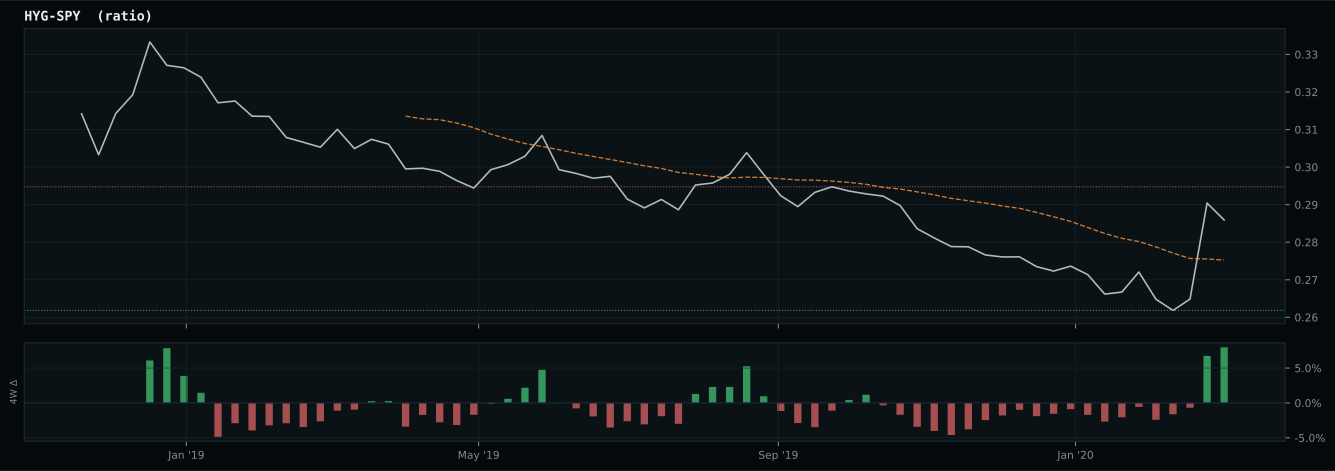
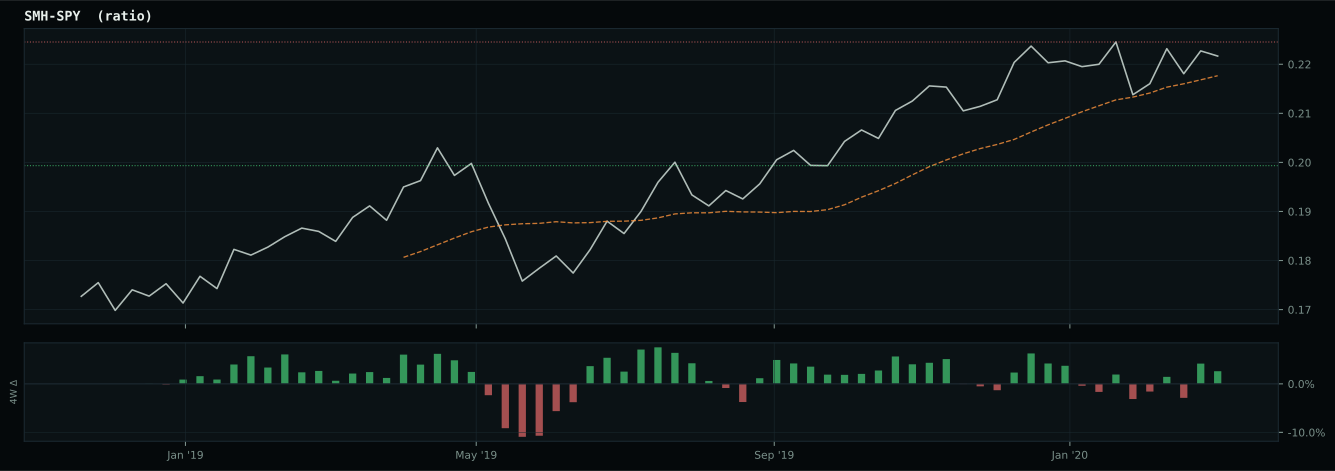
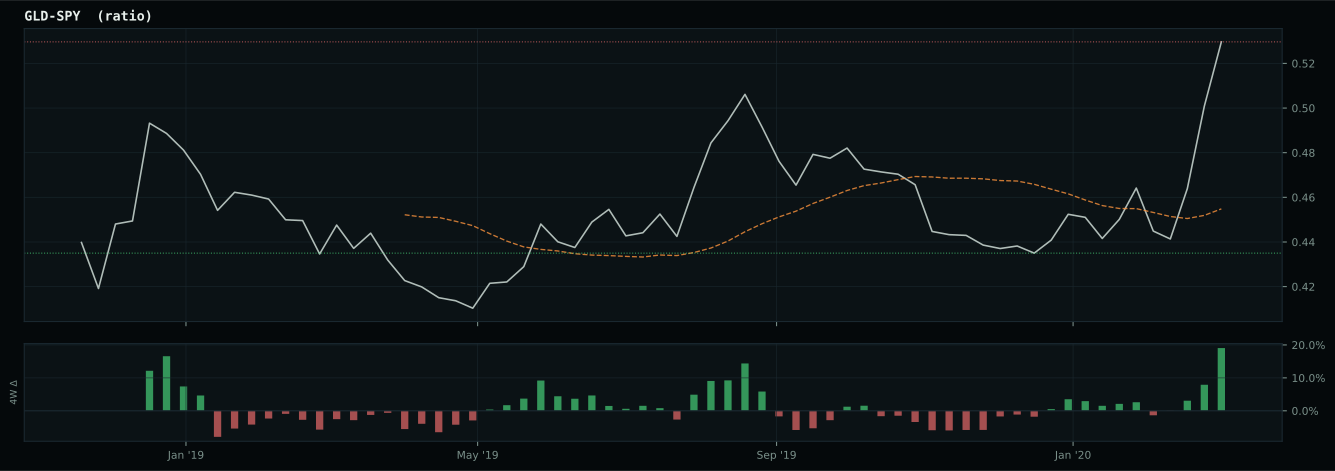
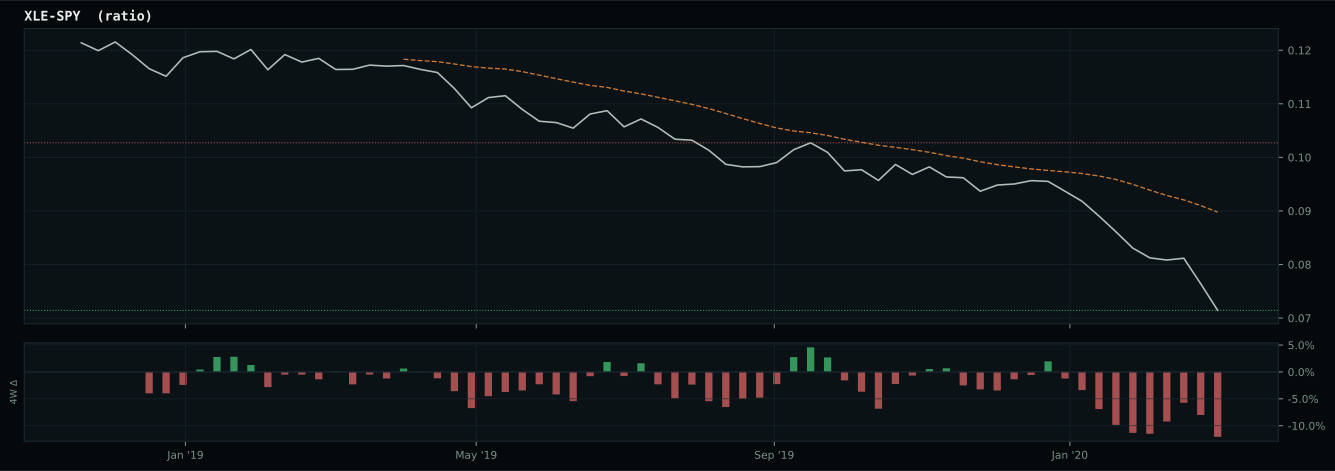
Macro Evidence Charts
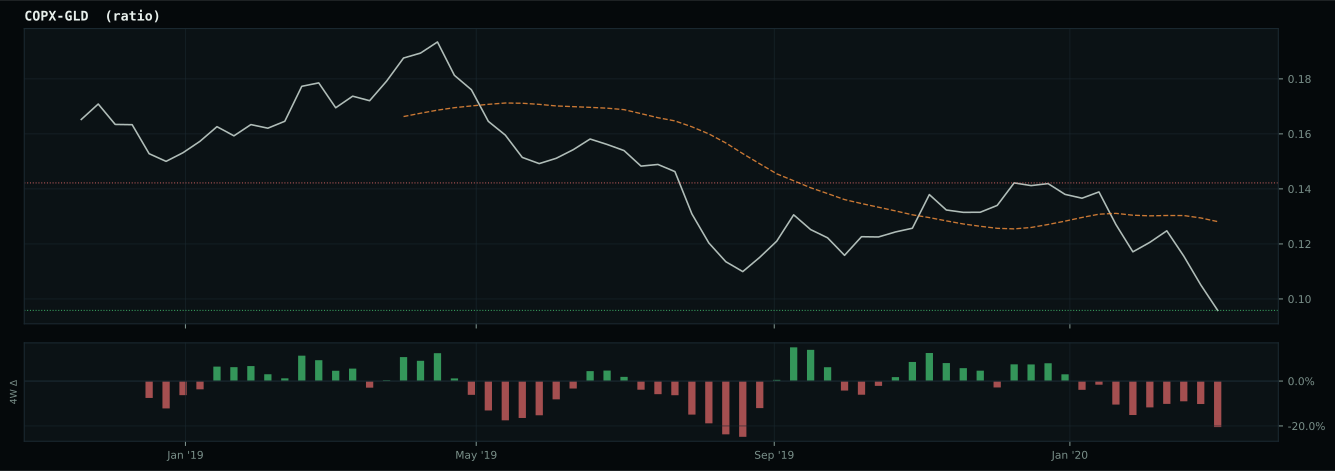
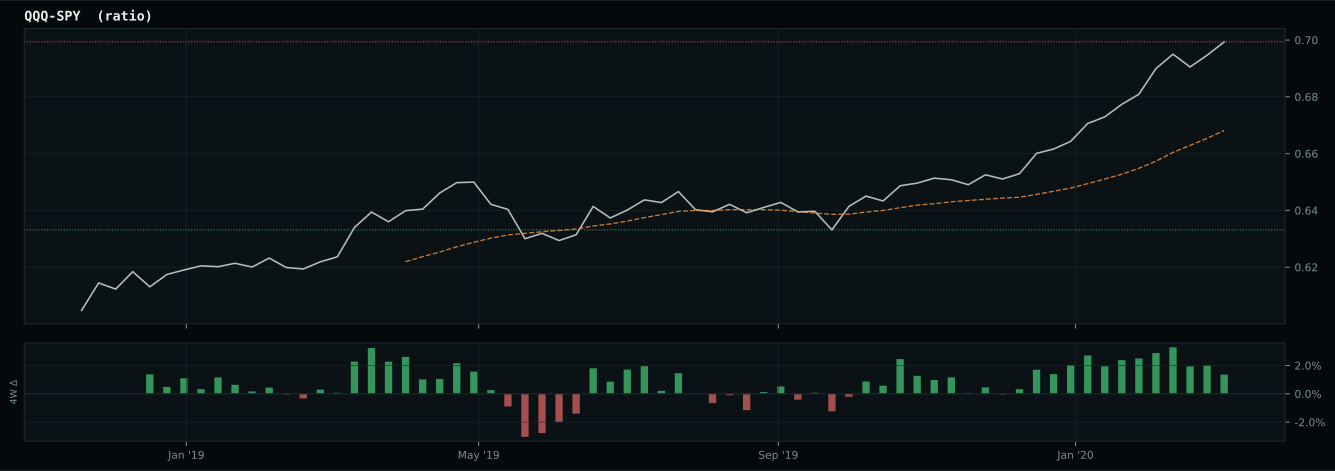
Market-implied signals behind the macro regime scores. Each ratio compares two assets; the direction and slope of the ratio is what the macro engine reads.
Crypto Regime — TrendBTC
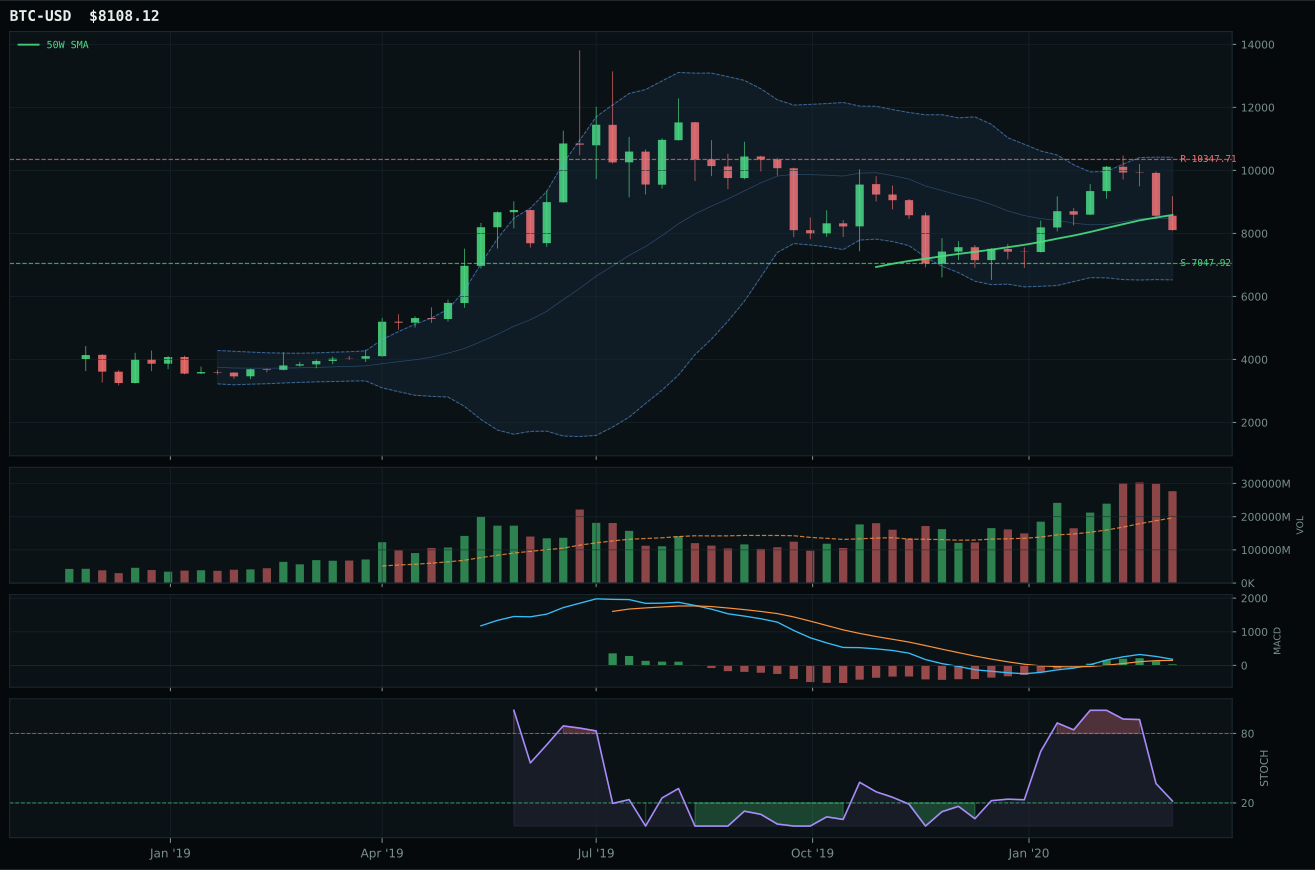
post-touch structure is too wide to count as a range; max/min close ratio is 3.33
TrendBTC not confirmed
one or more available conditions failed

Category Rankings
| Rank | Category | Winner | Score | Alloc | 4W Ret | Peers (4W) |
|---|---|---|---|---|---|---|
| 1 | Precious Metals | GLD | 78.4 | 20% | -2.80% | GDX -8.4% · SLV -14.0% |
| 2 | Technology | XLK | 46.8 | 20% | -1.31% | IGV -2.4% · CIBR -0.5% |
| 3 | Utilities & Infrastructure | XLU | 44.2 | 10% | -15.52% | IGF -21.4% · PAVE -13.9% |
| 4 | AI | SMH | 36.4 | 10% | -2.84% | AIQ -2.5% · BOTZ -5.3% |
| 5 | Emerging Markets | IEMG | 35.0 | 10% | -8.25% | INDA -19.1% · ILF -22.7% |
| 6 | Defense & Aerospace | XAR | 26.4 | 10% | -14.81% | ROKT -19.1% · ITA -20.4% |
| 7 | Nuclear Energy | NLR | 24.2 | 10% | -14.46% | URA -5.3% |
| 8 | Industrial Metals | PICK | 12.1 | 10% | -5.88% | REMX -4.8% · COPX -16.2% |
| 9 | Agriculture & Livestock | MOO | — | 0% | -6.34% | WEAT +7.6% · VEGI -10.7% |
| 10 | Traditional Energy | XLE | — | 0% | -13.03% | FCG -7.6% · XOP -10.3% |
Precious Metals — GLD
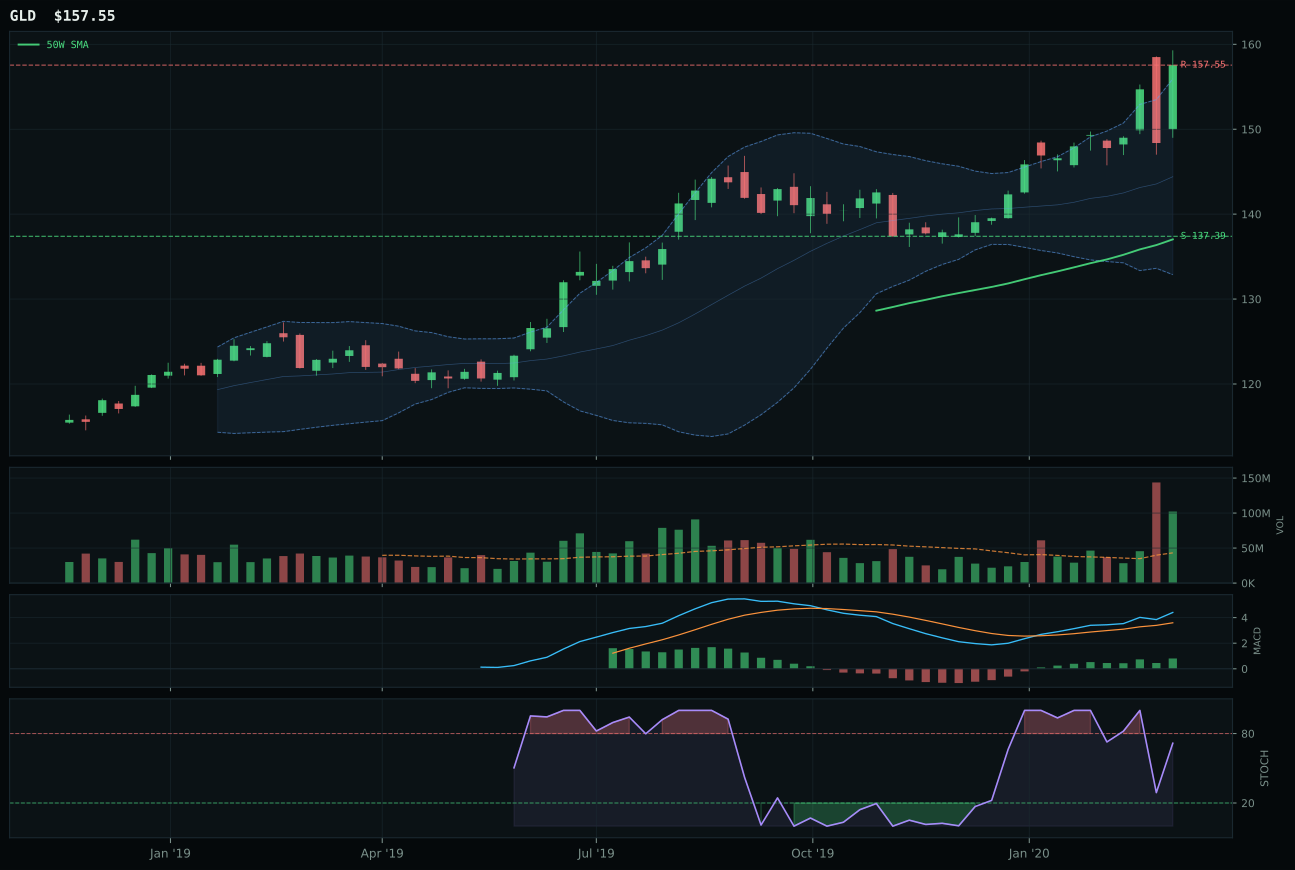
GLD has a neutral structure profile with 20.0% 13-week relative strength versus SPY.
A failed hold above support would weaken the setup.
Actionable but governed by invalidation levels.
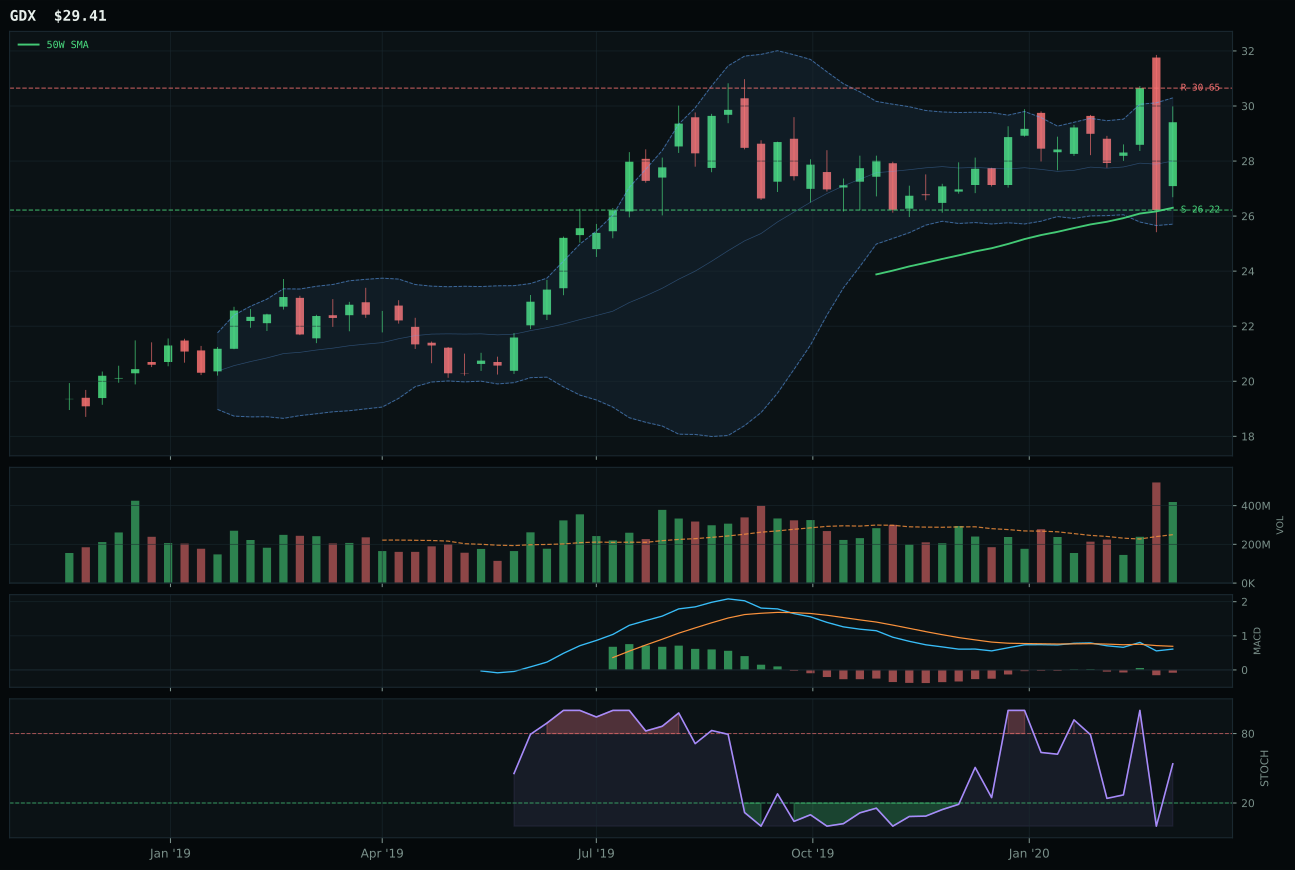
GDX has a neutral structure profile with 14.6% 13-week relative strength versus SPY.
A failed hold above support would weaken the setup.
Actionable but governed by invalidation levels.
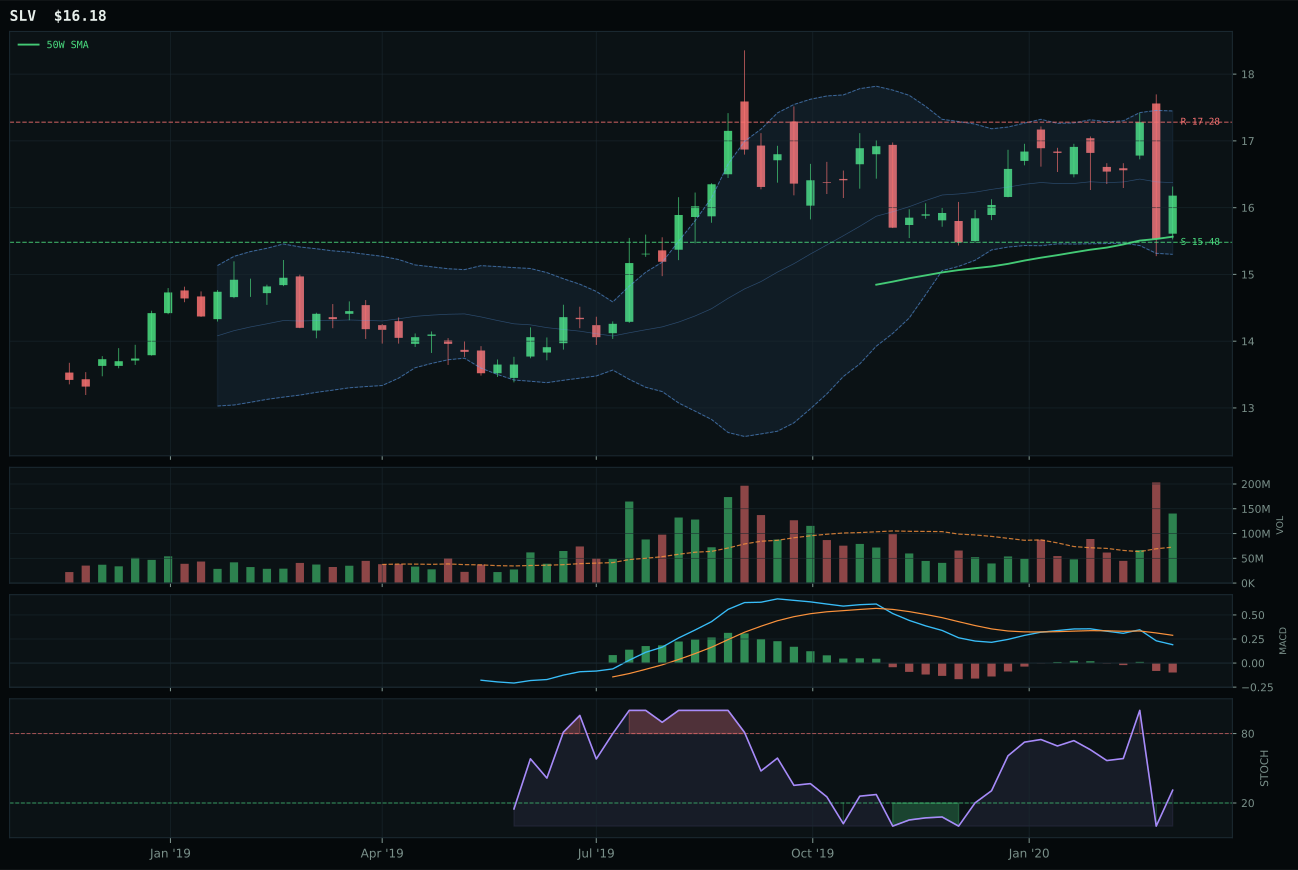
SLV has a pullback into support profile with 10.1% 13-week relative strength versus SPY.
A failed hold above support would weaken the setup.
Actionable but governed by invalidation levels.
GLD dominated Precious Metals with a clean top-2 score of 78.4 because it demonstrates the only category-representative bullish technicals: price 15.0% above the 50-week moving average with 0.5% upslope and RS versus SPY at 20.0%, representing genuine institutional demand. MACD is bullish and improving—not just neutral—and momentum confirmation scores 100.0/100 from 14.5% 13-week returns paired with 5.4% category-relative strength. Volume at 2.37x the 20-week average is accumulation/confirmation, and stochastic RSI at 0.72 is falling into neutral territory, confirming controlled momentum rather than exhaustion. GDX lost because MACD is bearish/weakening despite 14.6% RS versus SPY, structure cleanliness is 75.0 versus GLD's superior 75.0, and category-relative strength lagged at 0.0%. The score gap of 7.6 points reflects GLD's 100.0 trend score versus GDX's 92.0—the visual difference between a confirmed leader and a lagging follower in the same trade.
Precious Metals earned 10% as a tier-1 overweight alongside Technology because both categories scored above 46.0, placing them in the top two. GLD's allocation reflects a fundamental macro thesis: monetary hedge bid is active at +14 points, defensive rotation at +7, and disinflation pressure at +6, creating a triple-confirmation setup that justifies 10% even though risk/reward measured only 51.8/100 (limited upside to resistance at 157.55). The Goldilocks regime supports both growth equities and safe-haven assets simultaneously, which is exactly the macro condition that keeps gold in carry-position alongside quality tech. Volume-price confirmation at 97.0/100 and persistence at 91.9/100 mean this is not a late-stage exhaustion buy; capital is flowing steadily into physical hedge positions. This two-pillar framework (Technology + Precious Metals at 10% each) represents the portfolio's core conviction: profitable earnings growth and monetary insurance in a low-growth world.
Technology — XLK
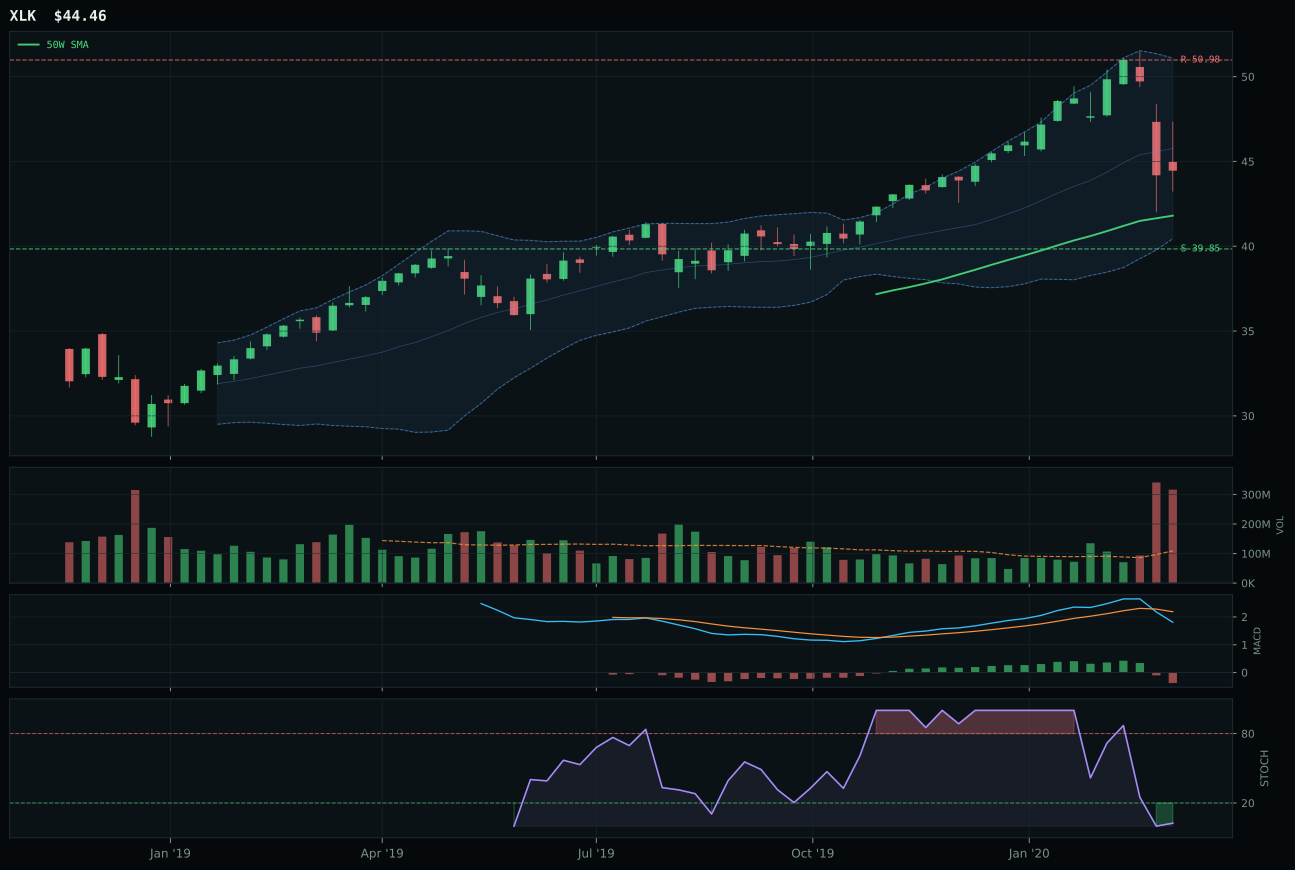
XLK has a neutral structure profile with 6.8% 13-week relative strength versus SPY.
A failed hold above support would weaken the setup.
Actionable but governed by invalidation levels.
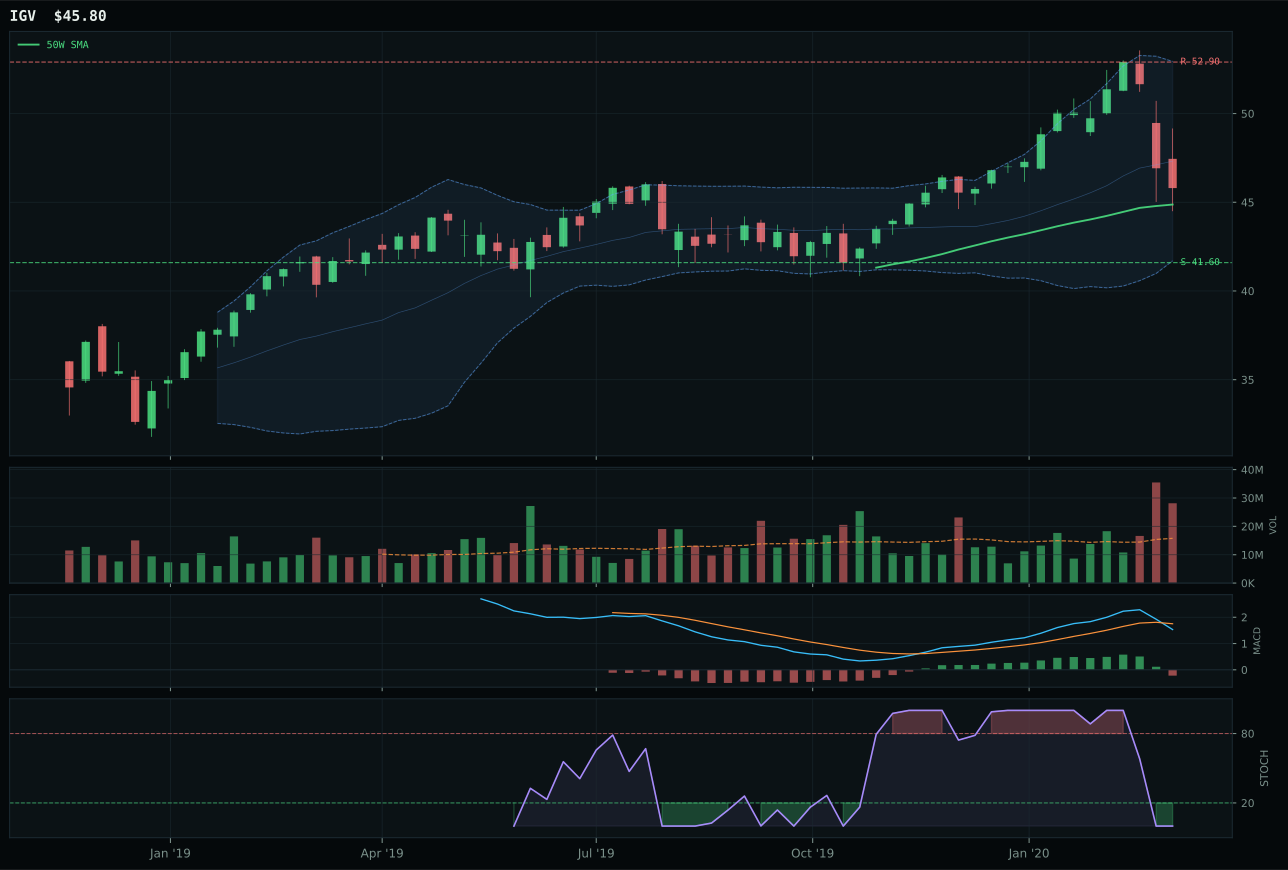
IGV has a compression near 50W profile with 6.1% 13-week relative strength versus SPY.
A failed hold above support would weaken the setup.
Actionable but governed by invalidation levels.
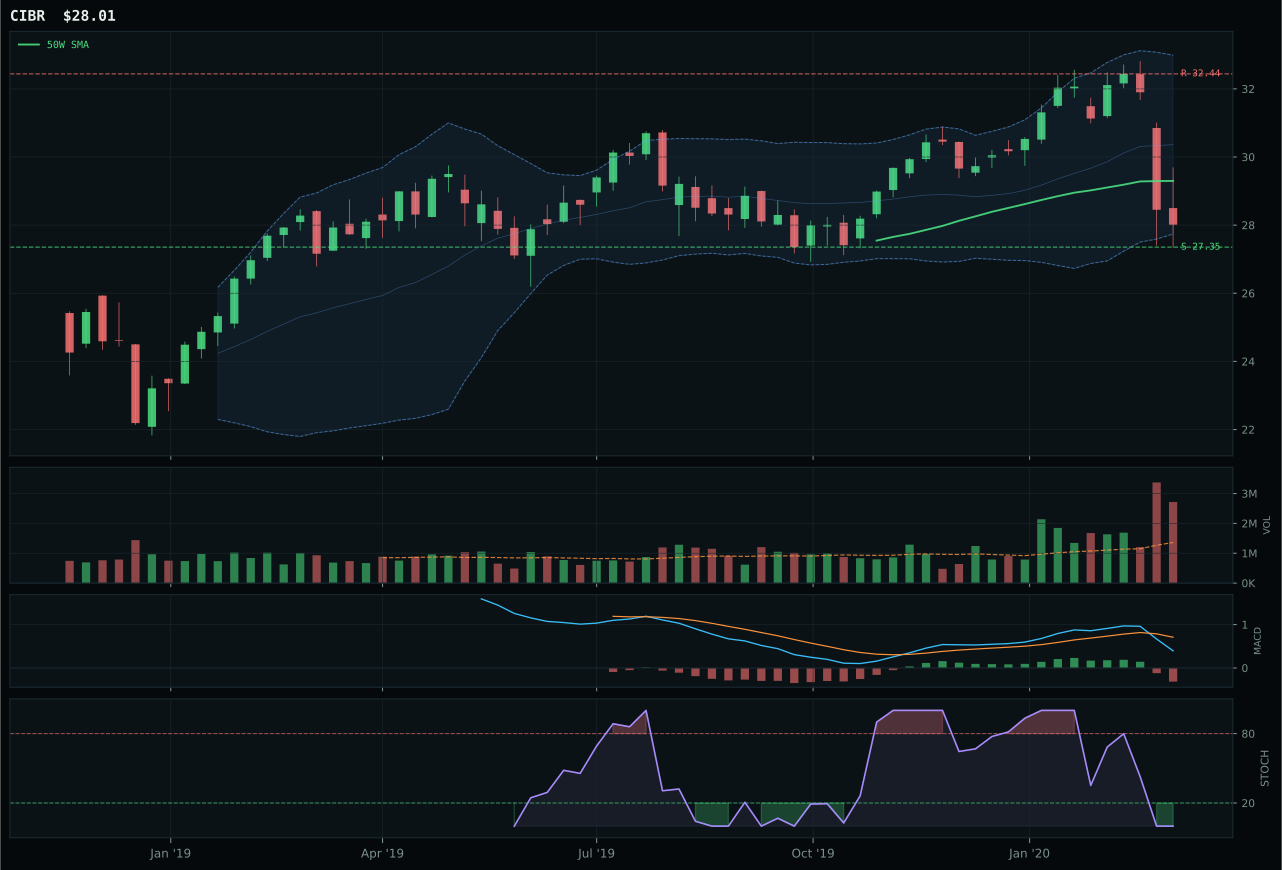
CIBR has a pullback into support profile with -0.0% 13-week relative strength versus SPY.
A failed hold above support would weaken the setup.
Actionable but governed by invalidation levels.
XLK won the Technology category because it combined superior breadth with clean accumulation into resistance. Price sits 6.3% above the 50-week moving average with a 0.4% upslope and RS versus SPY of 6.8%, meaning institutional money is still rotating into profitable tech leaders rather than chasing breadth. Volume at 2.90x the 20-week average confirms accumulation, not distribution. The setup is neutral structure near the Fibonacci 0.382 level—a decision zone where new money either validates the move or forces a retest. IGV lost because its volume was distribution pressure while showing only 6.1% RS versus SPY and inferior structure cleanliness at 73.1 versus 84.5. The 6.4-point score gap over IGV leaves no ambiguity: XLK's technical evidence (58.1/100) is supported by active macro descriptors favoring liquidity expansion and AI growth sponsorship.
Technology earned 10% allocation as a tier-1 overweight because it ranked among the two highest category scores at 46.8. The Goldilocks macro regime creates the ideal environment for profitable companies with pricing power, and XLK's 20% RS versus SPY over the past 13 weeks proves capital is rotating toward quality earnings. Momentum confirmation scored 38.5 due to short-term weakness, but that's actually a feature in Goldilocks: the market is consolidating rather than in euphoric extension. The category-level macro fit of 79.0 reflects active tailwinds from liquidity expansion and AI growth sponsorship offsetting any near-term momentum hesitation. This allocation competes directly with Precious Metals at 10%, making it a two-pillar framework: gold for deflation hedging and quality tech for earnings resilience.
Utilities & Infrastructure — XLU
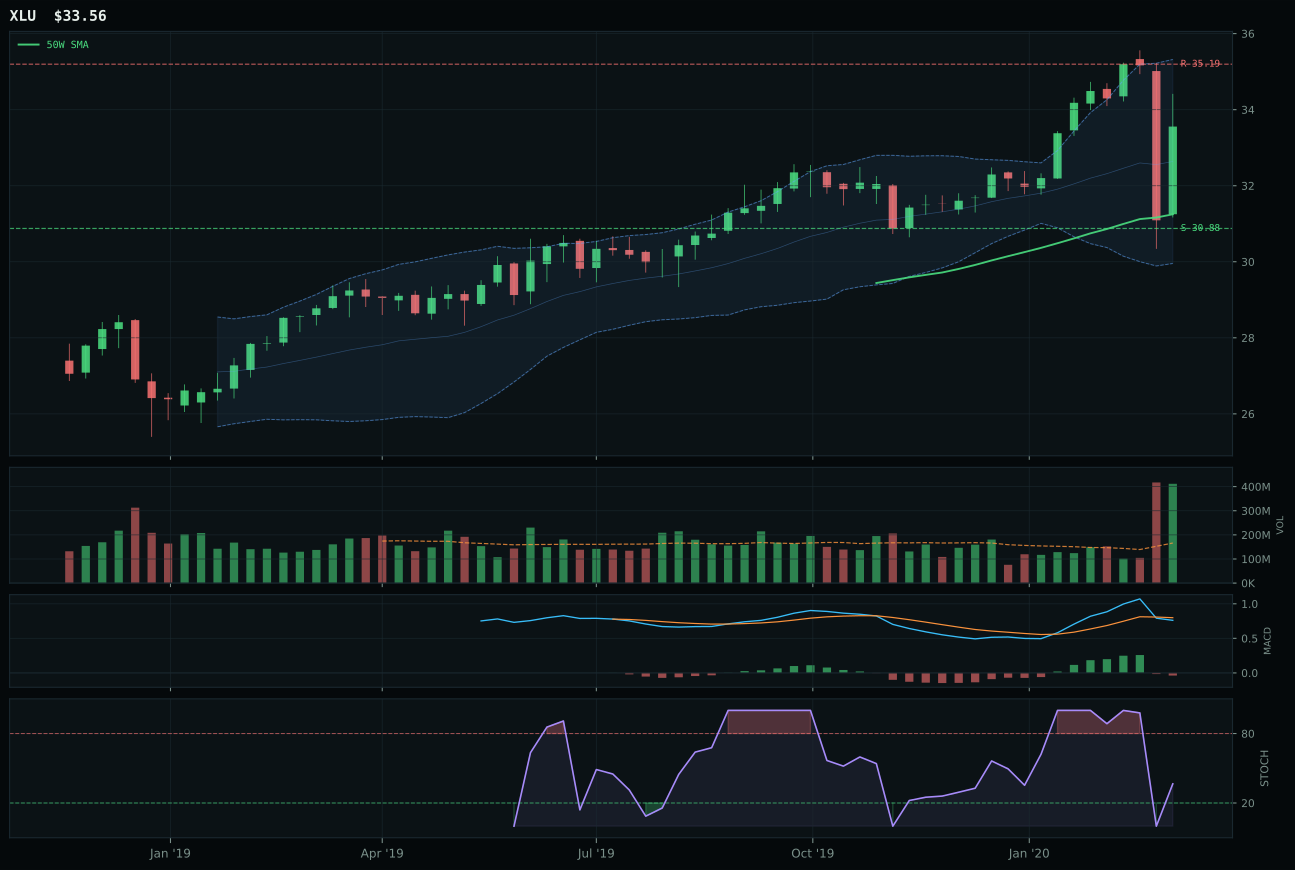
XLU has a neutral structure profile with 11.7% 13-week relative strength versus SPY.
A failed hold above support would weaken the setup.
Actionable but governed by invalidation levels.
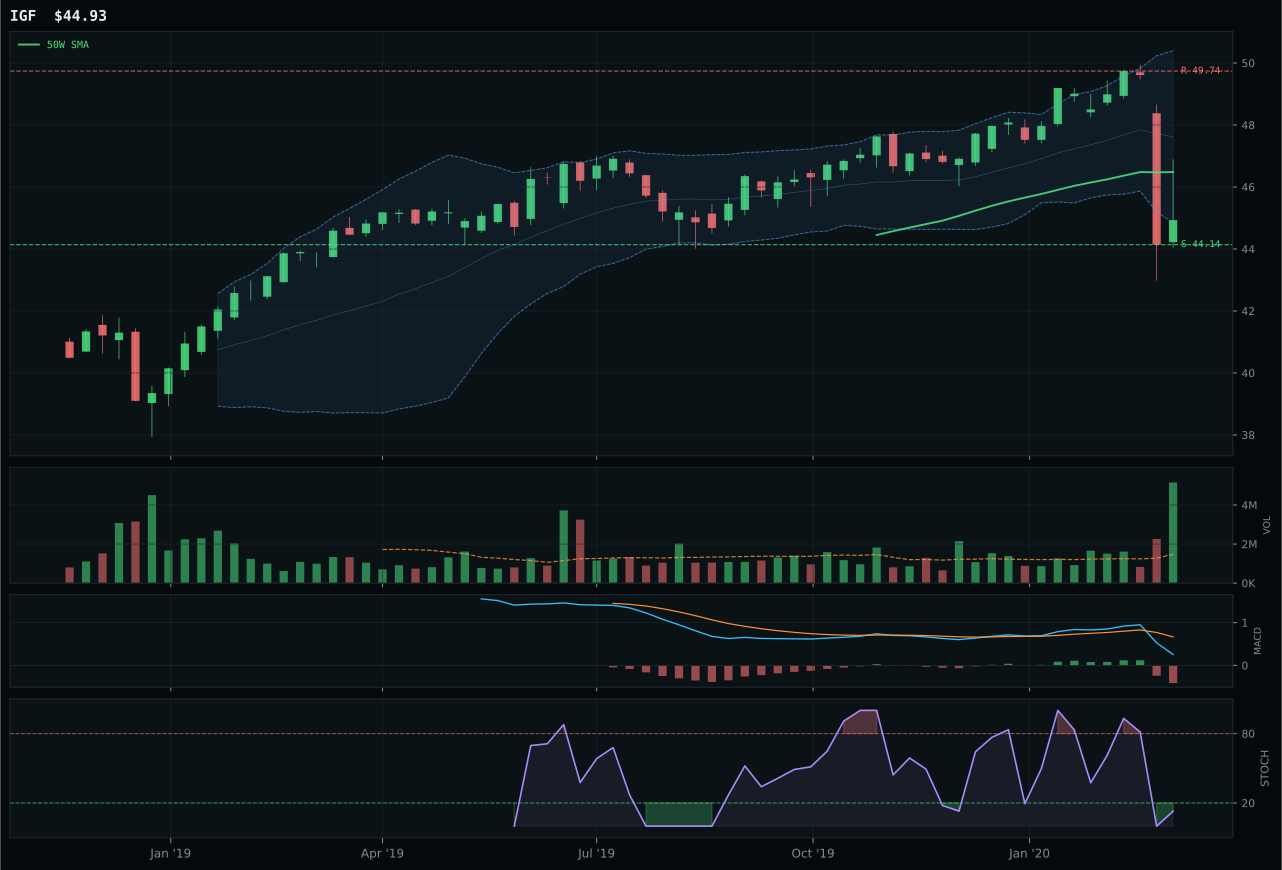
IGF has a pullback into support profile with 1.3% 13-week relative strength versus SPY.
A failed hold above support would weaken the setup.
Actionable but governed by invalidation levels.
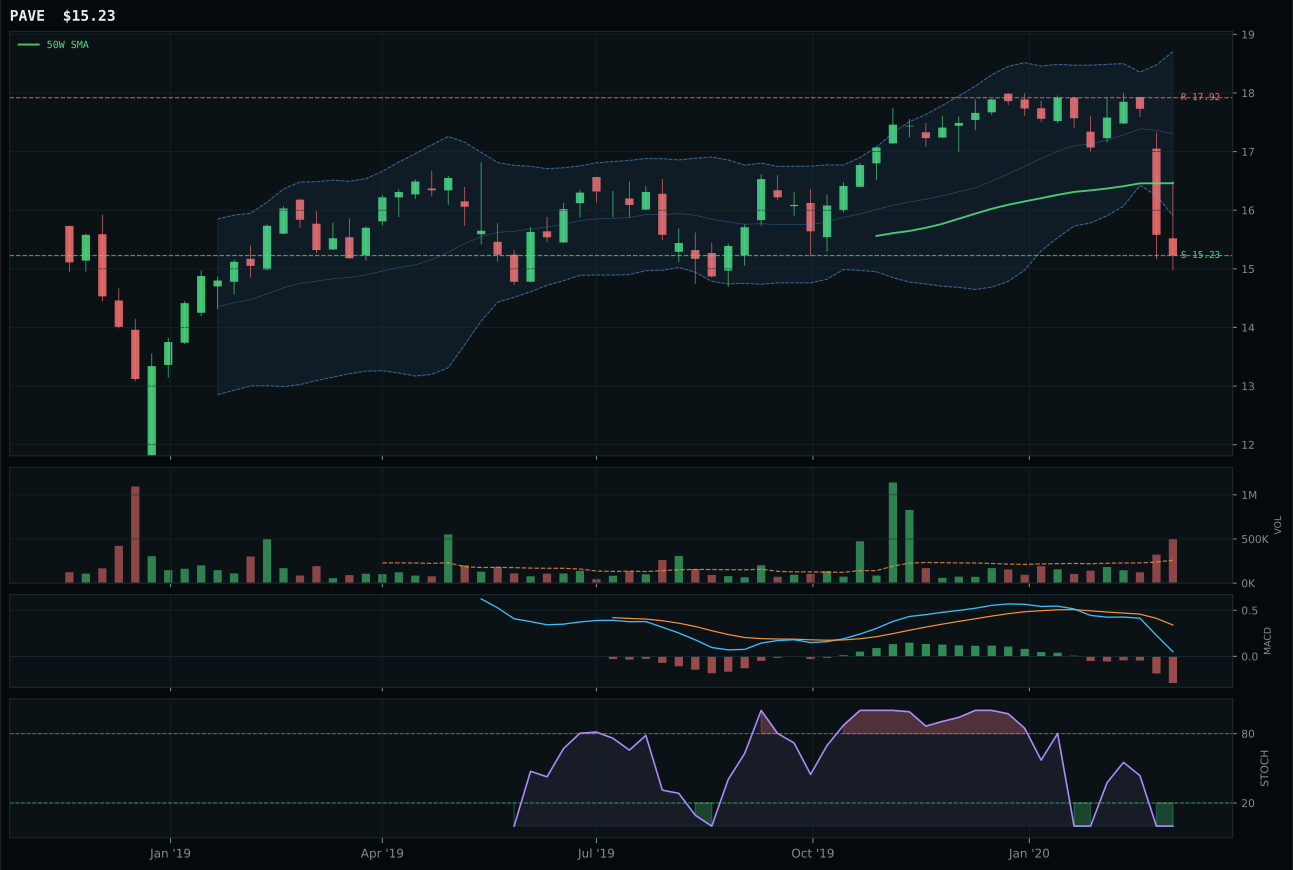
PAVE has a pullback into support profile with -7.4% 13-week relative strength versus SPY.
A failed hold above support would weaken the setup.
Tracked, but not top-2 eligible because: .
XLU won Utilities & Infrastructure with a final score of 44.2 because it combined the only bullish trend in the category with superior relative strength and volume confirmation. Price sits 7.4% above the 50-week moving average with a 0.3% upslope and 11.7% RS versus SPY, indicating institutional capital is actively flowing into defensive utility leadership. Volume at 2.48x the 20-week average is accumulation/confirmation paired with 80.8/100 volume-price confirmation—the cleanest supply-demand picture outside of Precious Metals. Momentum confirmation scored 81.1/100 from positive 13-week returns (6.2%) despite a negative 4-week dip, showing the trend remains intact despite recent weakness. IGF lost because it sits in pullback-into-support mechanics with only 1.3% RS versus SPY and inferior category-relative strength of 0.0% versus XLU's 10.4%. The 10.0-point score gap is definitive: XLU is the only utility name where both trend and relative strength align positively. Structure cleanliness at 58.3 is mediocre, but timing at 70.0 validates the setup due to oversold stochastic RSI at 0.37 offering controlled entry mechanics.
Utilities earned 5% allocation as tier-2 because XLU scored 44.2, falling short of top-2 eligibility but ranking above multiple other categories. The allocation reflects defensive macro positioning: defensive rotation is active at +12 points, disinflation pressure at +6, and broad market bear at +4, making utilities the natural safety valve during equity weakness. XLU's 11.7% RS versus SPY proves that defensive money is arriving, not just staying; this is capital rotation, not static hedge positioning. Risk/reward measured only 59.7/100 due to limited upside to resistance at 35.19 (-4.7%) versus 8.7% downside to support, but that asymmetry is exactly what utilities should offer: strong risk management in a Goldilocks regime where growth is available elsewhere (Technology). This allocation would persist even if XLU retraced below the 50-week moving average, because macro tailwinds from defensive rotation are structural, not tactical. The 5% represents conviction that defensive rotation continues regardless of near-term equity technicals.
AI — SMH
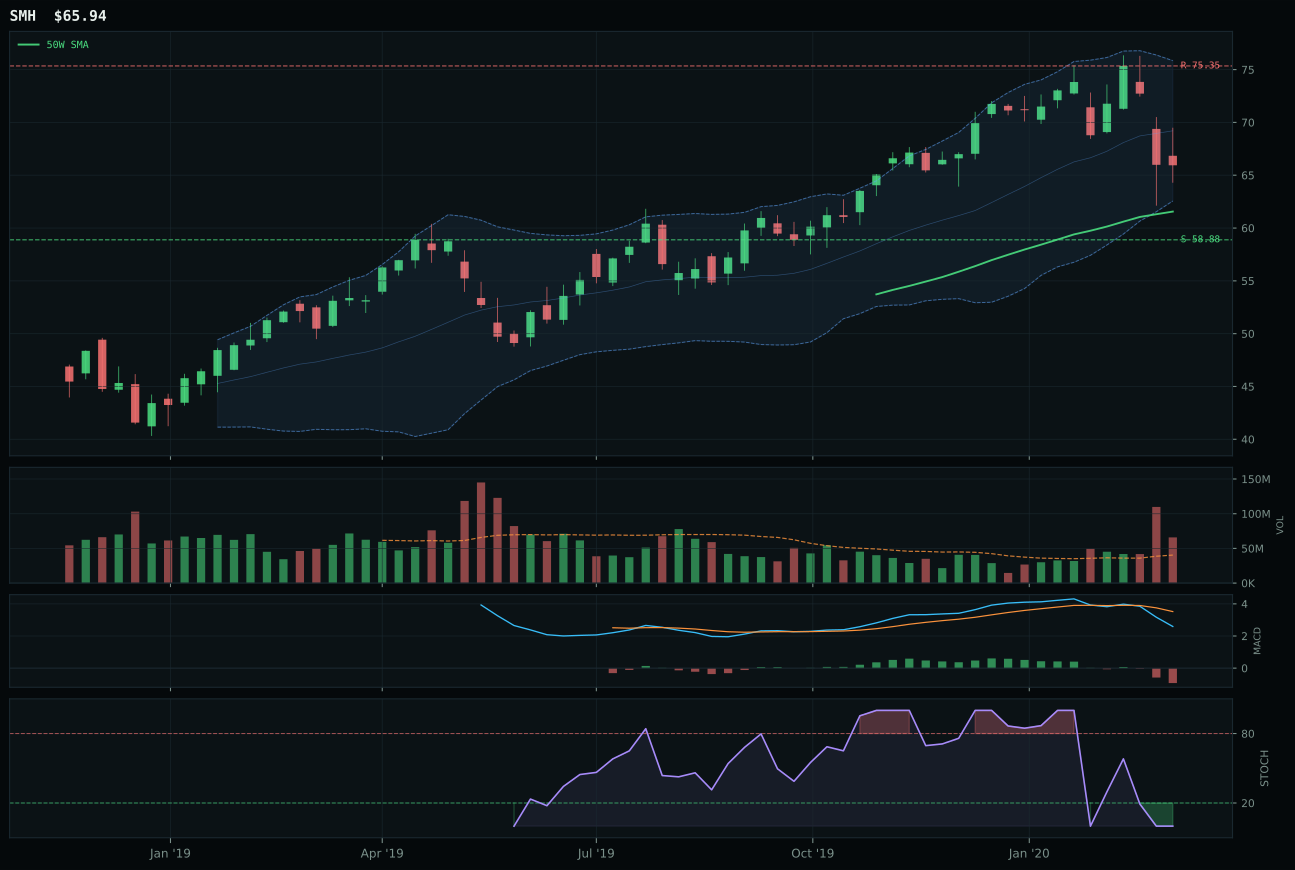
SMH has a neutral structure profile with 4.0% 13-week relative strength versus SPY.
A failed hold above support would weaken the setup.
Actionable but governed by invalidation levels.
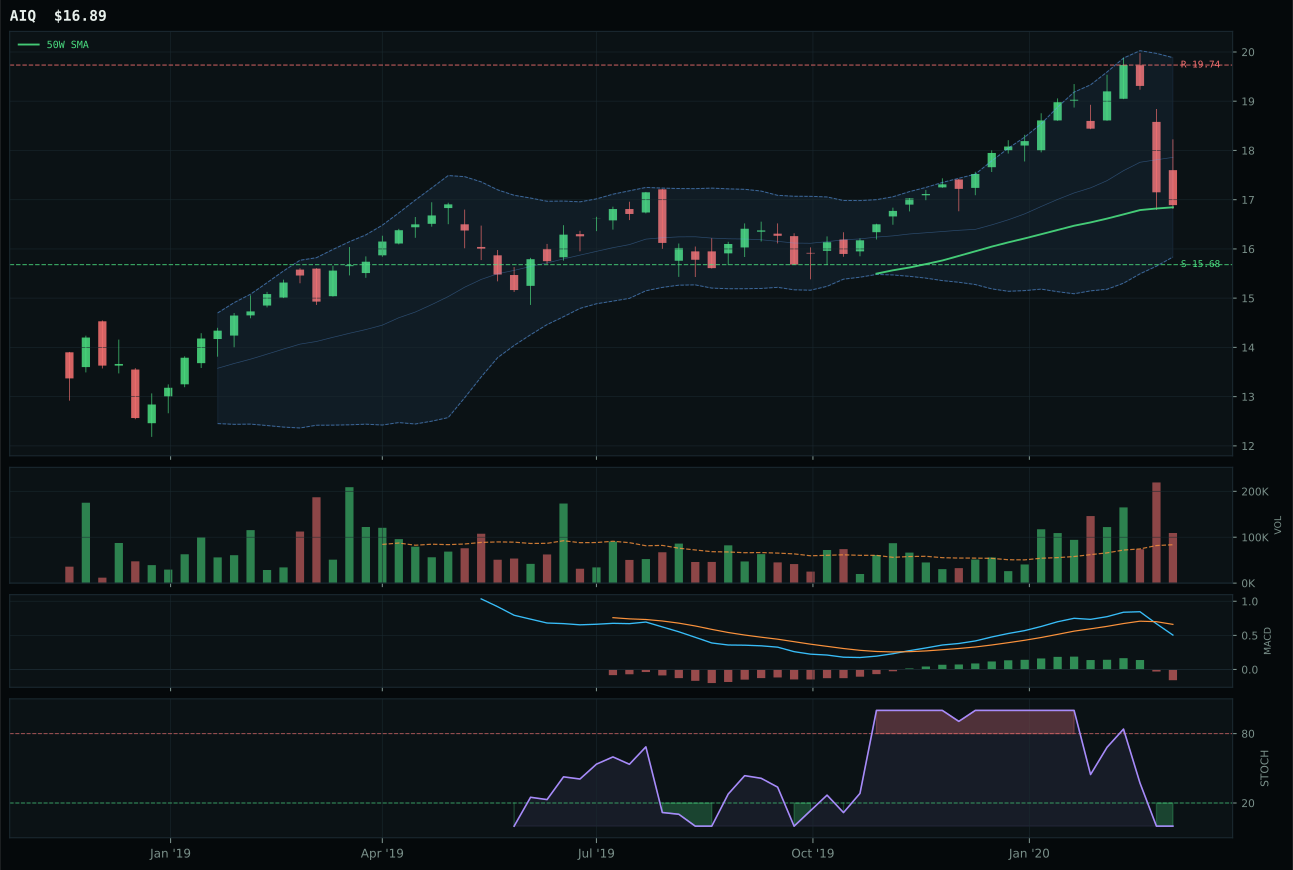
AIQ has a compression near 50W profile with 3.6% 13-week relative strength versus SPY.
A failed hold above support would weaken the setup.
Tracked, but not top-2 eligible because: .
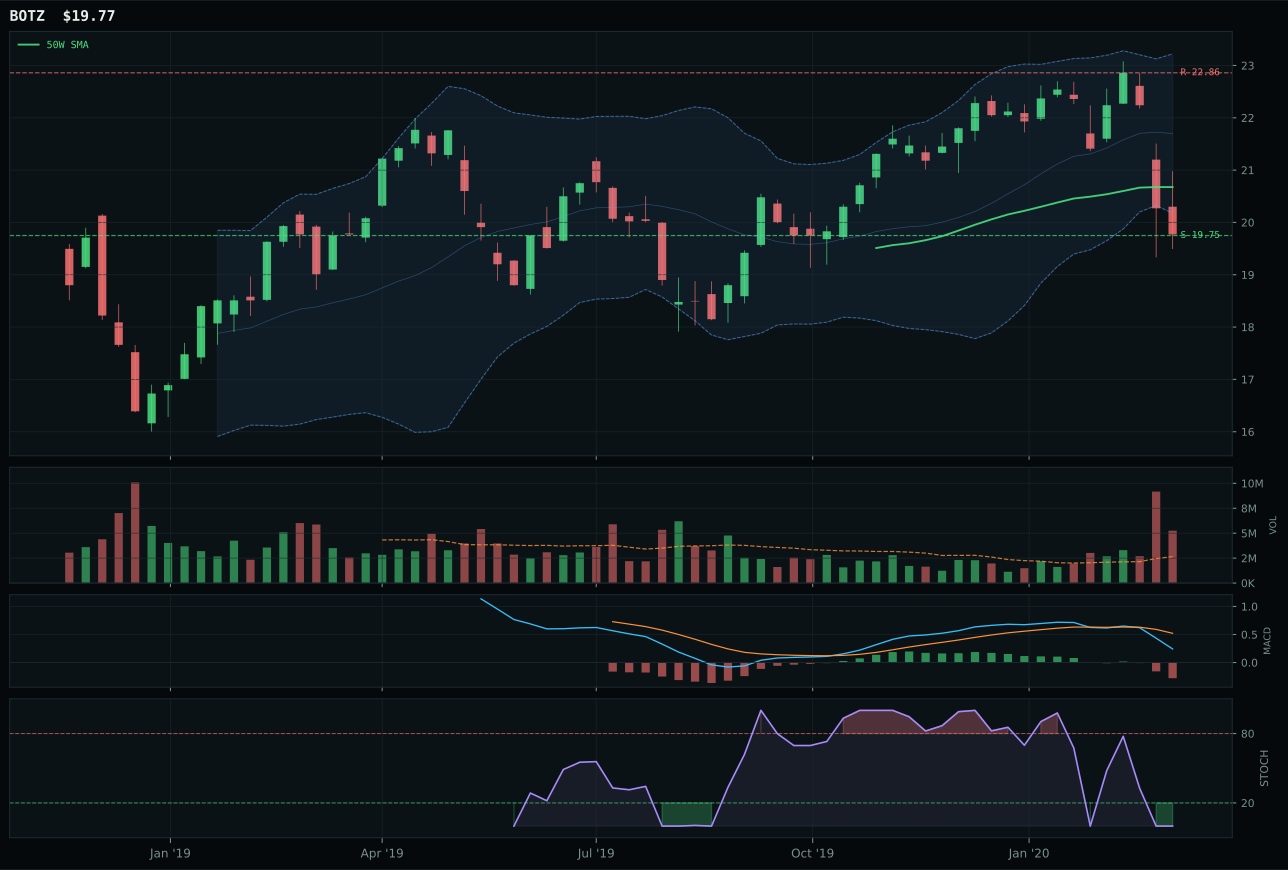
BOTZ has a pullback into support profile with -3.8% 13-week relative strength versus SPY.
A failed hold above support would weaken the setup.
Actionable but governed by invalidation levels.
SMH won the AI category on relative strength grounds despite momentum deterioration that makes this a contrarian allocation. The semiconductor ETF trades 7.1% above its 50-week low with 4.0% RS versus SPY, and volume at 1.63x the 20-week average represents distribution pressure—the opposite of accumulation confirmation. The Fibonacci placement (upper retracement/momentum zone) and oversold stochastic RSI at 0.00 tell a reversal setup story rather than a momentum continuation. AIQ lost because its category-relative strength was 0.0% versus SMH's 0.3%, and it sits in compression near the 50-week moving average, which offers no directional edge. The 7.6-point score gap reflects SMH's superior structure (69.3 vs AIQ's composite of 50), but this is a tier-2 allocation where technical deterioration is acceptable if macro sponsorship offsets it. AI growth sponsorship at +14 points dominates the reasoning, making this a macro-driven hold despite weak immediate technicals.
AI received 5% allocation as tier-2 because it scored 36.4, well below the top-2 threshold. The category's ranking reflects a fundamental tension: macro support from AI growth sponsorship and liquidity expansion (+10 and +6, respectively) collides with 13-week negative returns (-1.6% for SMH) and deteriorating volume-price sponsorship. Technical evidence scored just 13.8/100 versus 70.0/100 macro fit—a stark imbalance that places this in the 'hold because the narrative is intact despite weakness' bucket. Goldilocks regime helps at +10 points, but 'broad market bear' is active at -8, creating headwinds. This allocation would evaporate if SMH fails to hold the 58.88 support level near the Fibonacci 0.618 zone; the 5% sleeve is contingent on that specific technical gate remaining intact.
Emerging Markets — IEMG
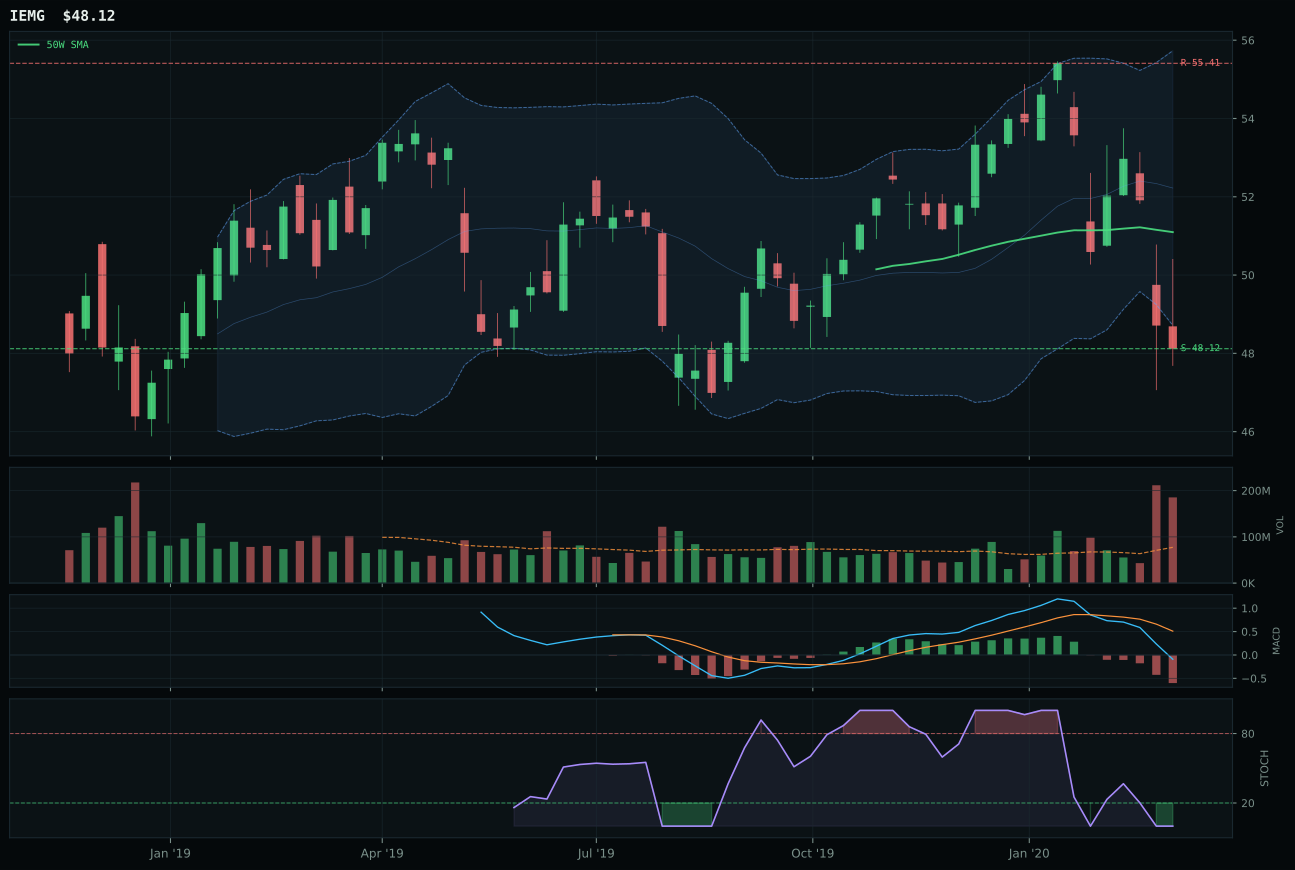
IEMG has a pullback into support profile with -1.5% 13-week relative strength versus SPY.
A failed hold above support would weaken the setup.
Actionable but governed by invalidation levels.
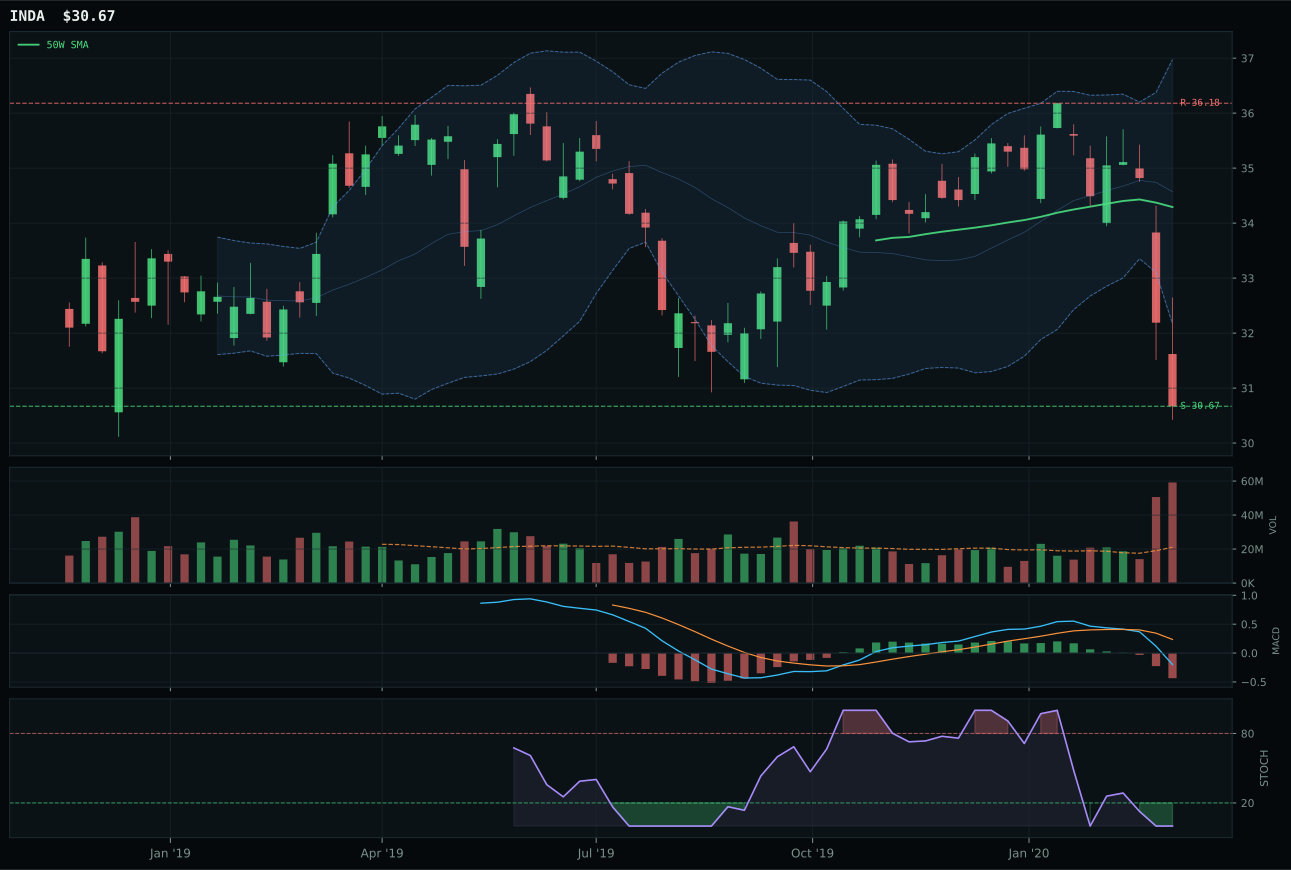
INDA has a pullback into support profile with -5.4% 13-week relative strength versus SPY.
A failed hold above support would weaken the setup.
Actionable but governed by invalidation levels.
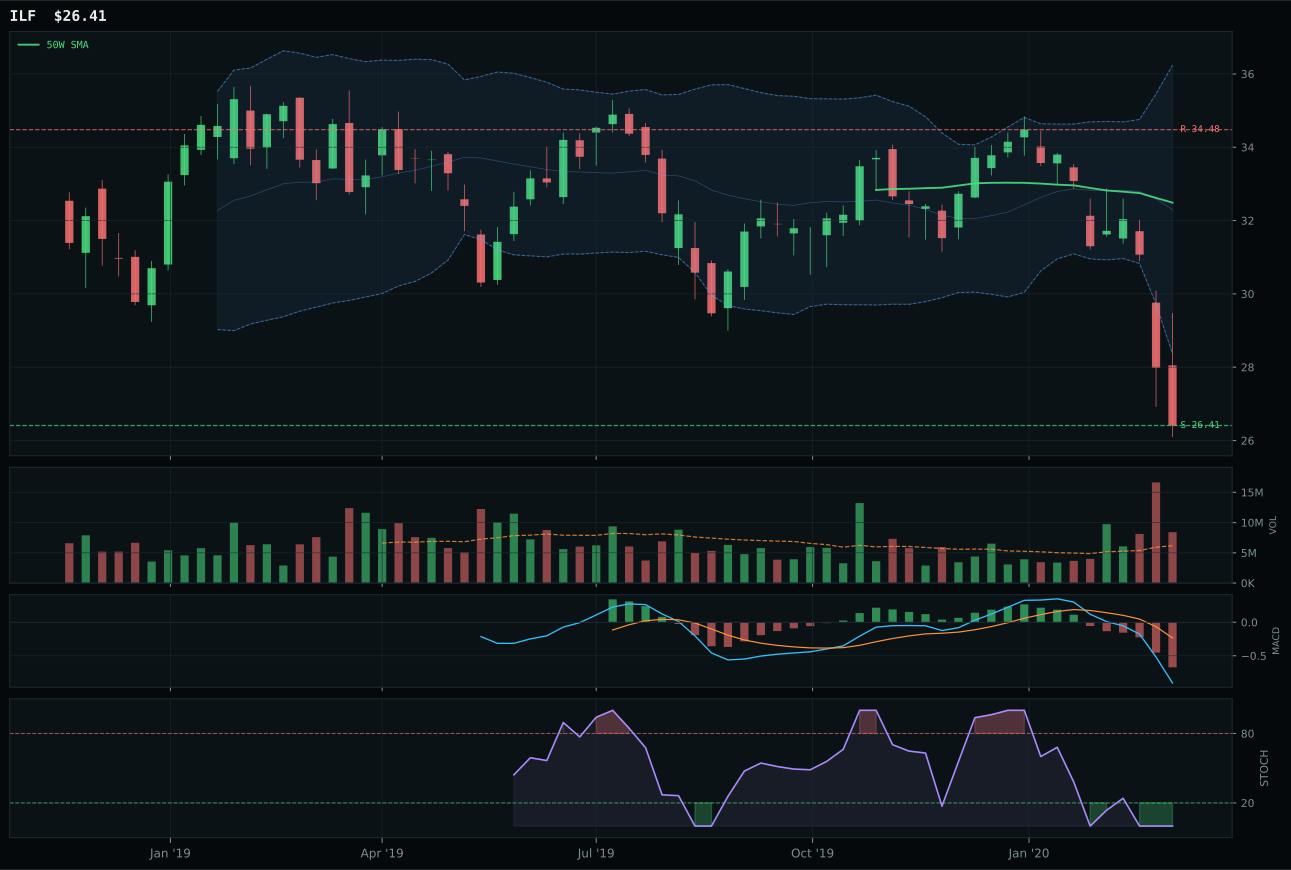
ILF has a pullback into support profile with -13.8% 13-week relative strength versus SPY.
A failed hold above support would weaken the setup.
Actionable but governed by invalidation levels.
IEMG won Emerging Markets with a final score of 35.0 because it showed the least-damaged pullback-into-support setup among equally-weak competitors. Price sits 5.8% below the 50-week moving average near the near-52-week-low/repair zone Fibonacci level at 0.786, with defined support at 48.12. Timing score of 80.0/100 reflects this precise Fibonacci alignment and oversold stochastic RSI at 0.00, giving the setup reversal potential if volume confirms. Volume at 2.40x the 20-week average represents distribution pressure, not accumulation, which explains the 12.3/100 volume-price confirmation score—the weakness that prevents this from being a conviction allocation. INDA lost because timing was inferior (60.0 vs 80.0) and structure cleanliness lagged (66.8 vs 68.8), plus category-relative strength was 0.0% versus IEMG's 3.8%. Technical evidence scored only 1.9/100, the lowest of any category winner, but macro fit of 69.0 from emerging-market liquidity support (+12) and liquidity expansion (+7) justifies the tier-2 placement despite technicals.
Emerging Markets earned 5% allocation as tier-2 because IEMG ranked 35.0 and qualified for the 5% sleeve despite severe technical deterioration. The allocation thesis rests entirely on macro: EM liquidity support is active at +14 points, liquidity expansion at +8, and Goldilocks regime at +8, offsetting -9 from broad market bear. Technical evidence of 1.9/100 is catastrophic—among the worst in the portfolio—but the category represents diversification away from developed-market drawdowns when EM flows stabilize. Momentum confirmation at 7.2/100 and volume-price confirmation at 12.3/100 mean IEMG is purely a duration bet on EM central bank easing and dollar weakness. This allocation would be eliminated immediately if liquidity expansion descriptor turns false or if support at 48.12 breaks on heavy distribution volume. Currently, IEMG holds as a macro hedging position contingent on EM flows remaining functional; the setup offers no technical endorsement beyond defined support.
Defense & Aerospace — XAR
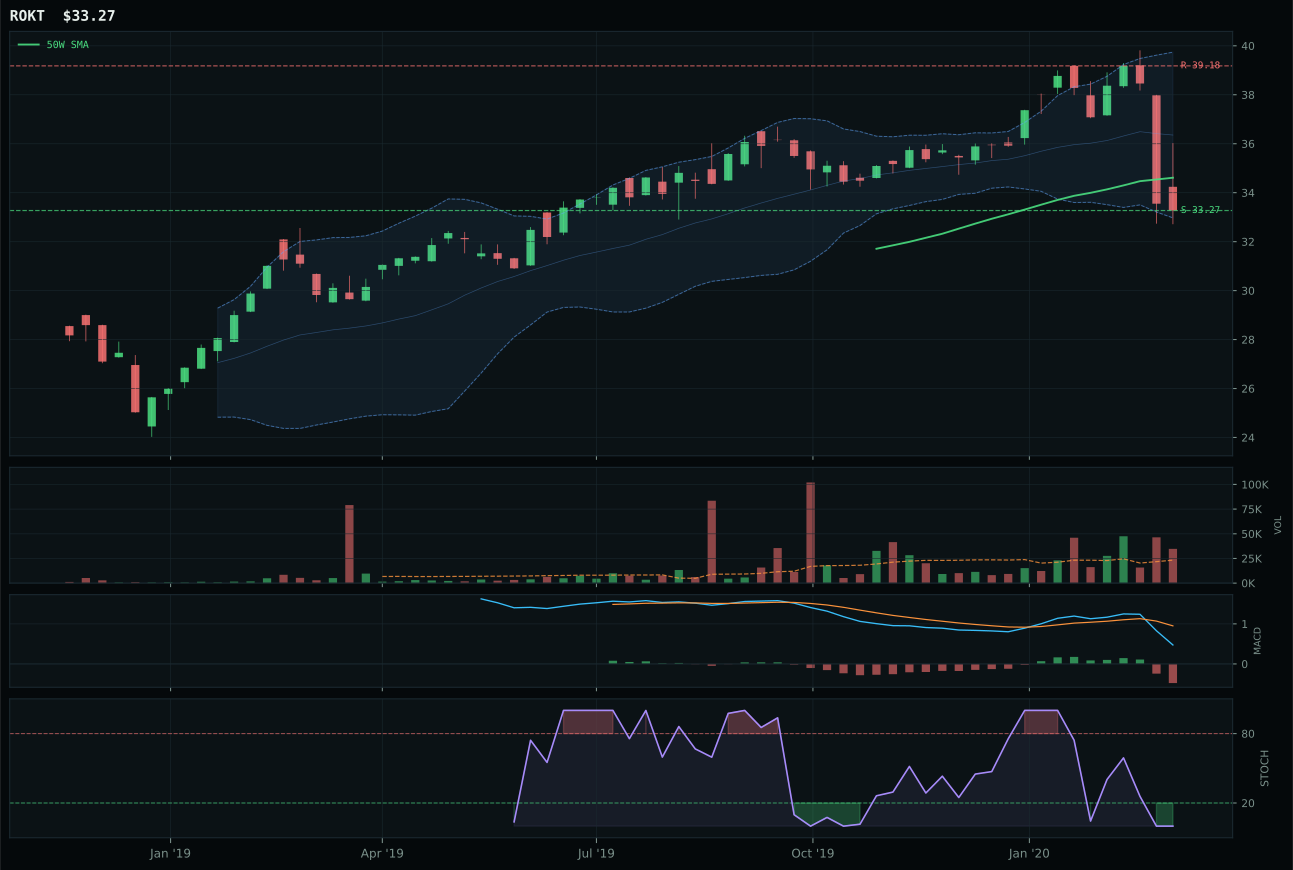
ROKT has a pullback into support profile with -0.6% 13-week relative strength versus SPY.
A failed hold above support would weaken the setup.
Tracked, but not top-2 eligible because: .
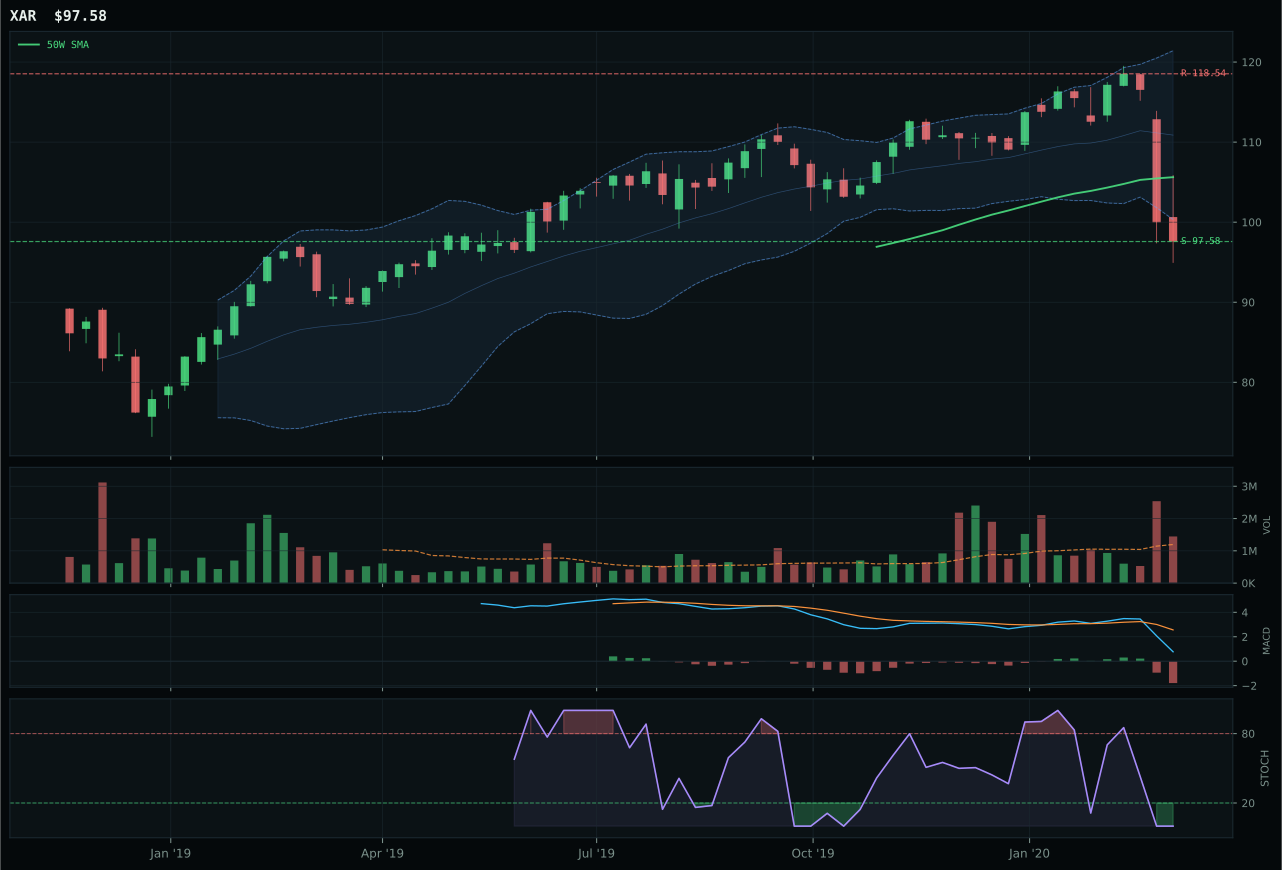
XAR has a pullback into support profile with -6.1% 13-week relative strength versus SPY.
A failed hold above support would weaken the setup.
Actionable but governed by invalidation levels.
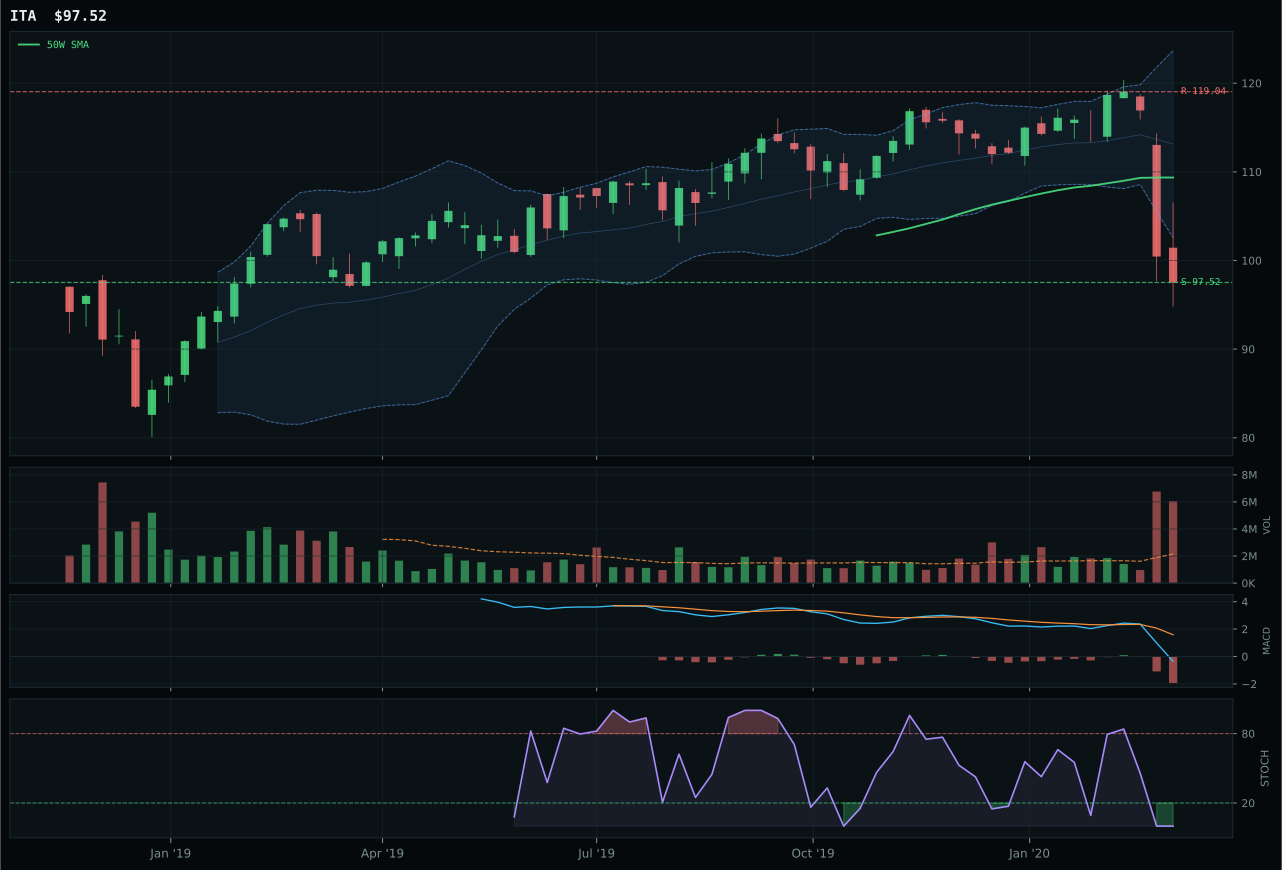
ITA has a pullback into support profile with -9.2% 13-week relative strength versus SPY.
A failed hold above support would weaken the setup.
Actionable but governed by invalidation levels.
XAR won Defense & Aerospace despite being down 11.7% over 13 weeks because its chart shows a pullback into defined support near 97.58 with textbook risk/reward at 92.8/100. Price sits 7.6% below the 50-week moving average but remains above the 200-week line, signaling a reset rather than a structural breakdown. The Fibonacci 0.786 level (deep retracement/value zone) marks where XAR becomes a legitimate accumulation candidate if volume confirmation appears. ROKT lost because its risk/reward measured weaker at 86.9, and it offers less defined support structure. The 20.2-point score gap is enormous because XAR's timing component scored 87.0/100 due to perfect Fibonacci alignment and oversold technicals, while ROKT's setup was less severe. This is pure mean-reversion mechanics: XAR's -6.1% RS versus SPY is exactly what makes it eligible for the 5% allocation now, not despite it.
Defense & Aerospace holds 5% allocation despite a final category score of 26.4 because the setup qualifies technically and macro tailwinds from defensive rotation (+8 points) are active. Industrial equities benefit from near-term flight-to-safety flows when broad market bear dynamics are present (+6 points). However, this is a bottom-tier allocation within the tier-2 sleeve: XAR's technical evidence scored only 29.7/100, and momentum confirmation is 0.0 due to four-week and 13-week negative returns. The 5% position represents a defined-risk mean-reversion entry where support at 97.58 becomes the hard stop. If Goldilocks regime shifts to risk-off or XAR breaches support, this allocation disappears immediately. No macro narrative can justify holding a 34.3/100 structure score if technicals deteriorate further.
Nuclear Energy — NLR
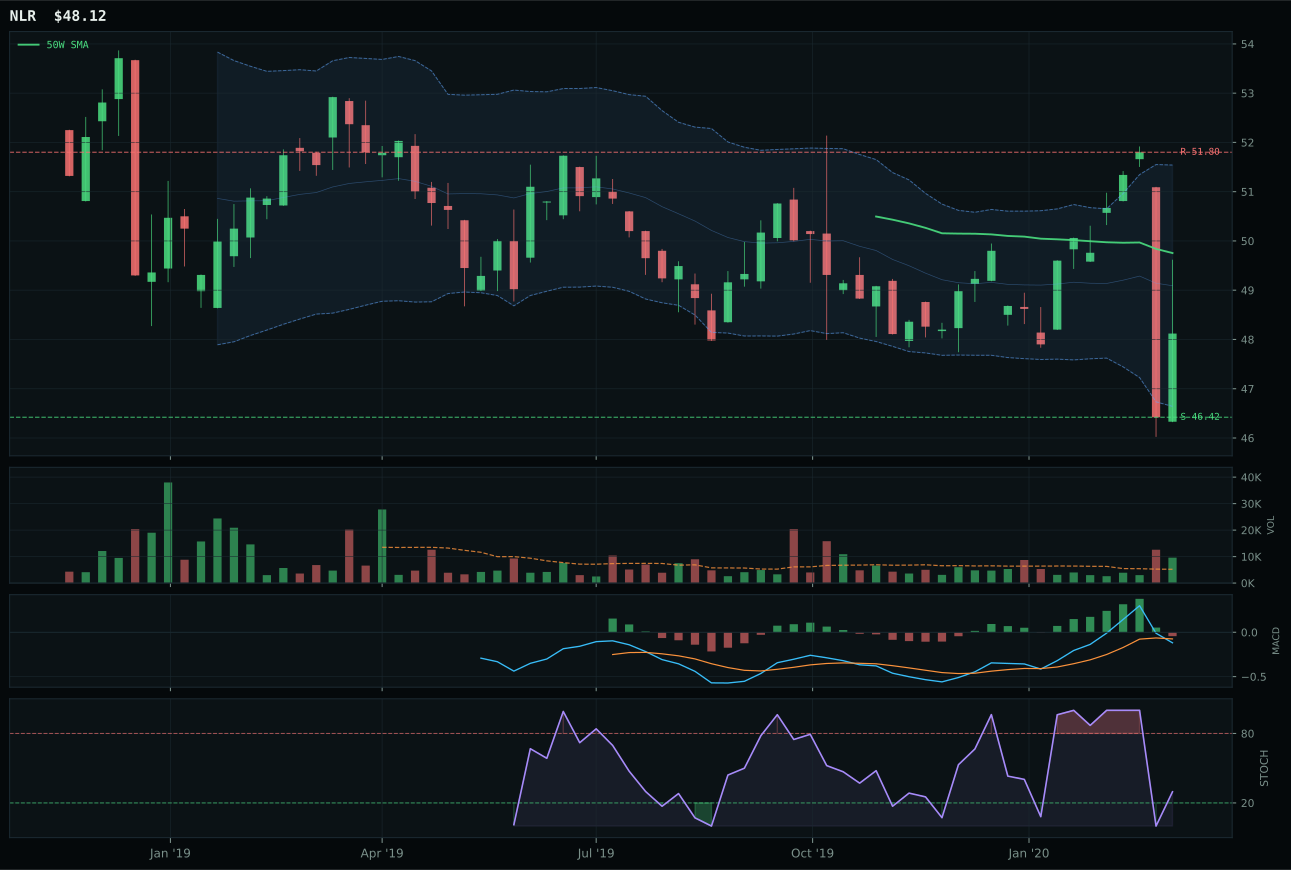
NLR has a pullback into support profile with 3.8% 13-week relative strength versus SPY.
Extension and support failure are the main tactical risks.
Tracked, but not top-2 eligible because: structurally broken.
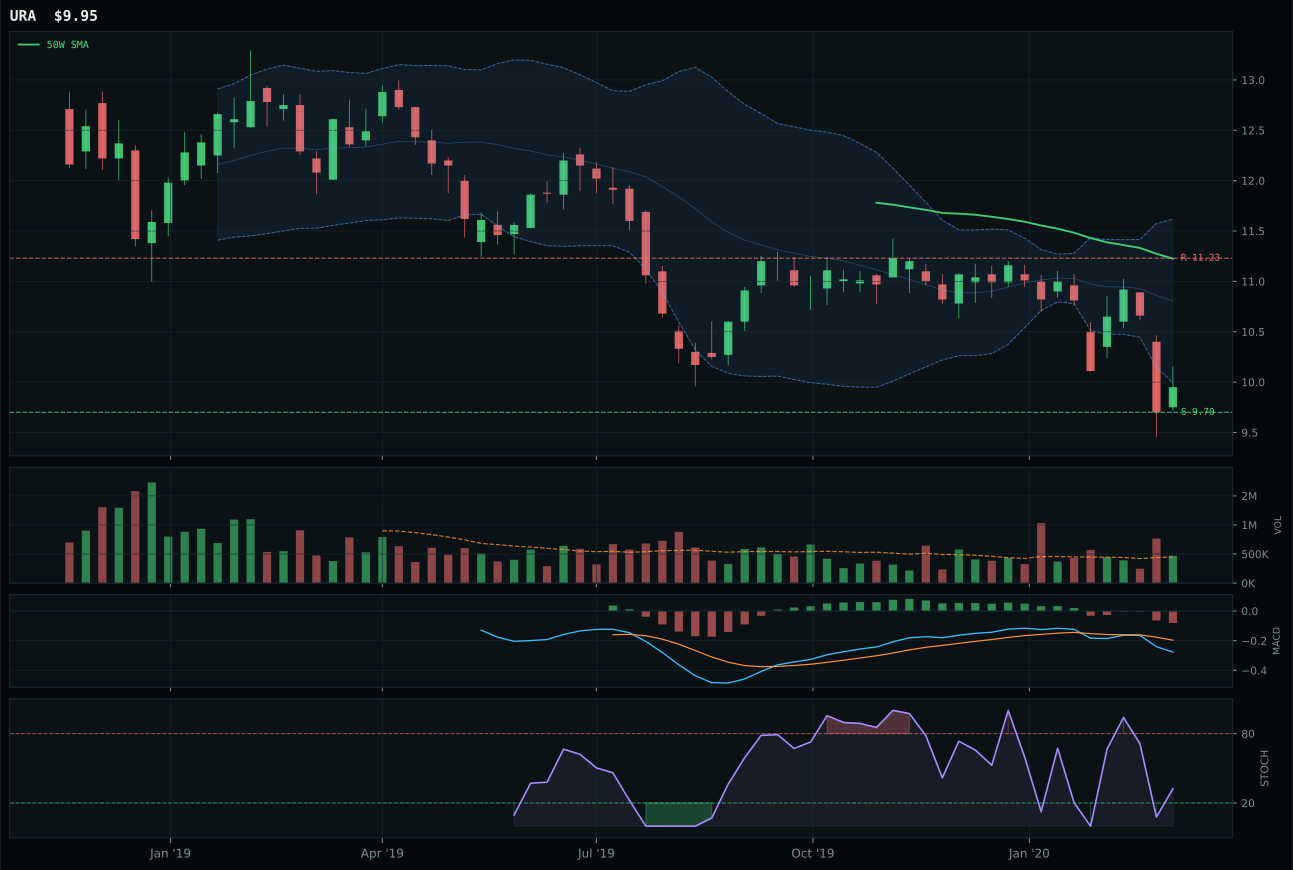
URA has a pullback into support profile with -4.6% 13-week relative strength versus SPY.
Extension and support failure are the main tactical risks.
Tracked, but not top-2 eligible because: structurally broken.
NLR won Nuclear Energy with a final score of 24.2 but failed the hard eligibility filter and received 5% allocation. The nuclear utilities ETF sits 3.3% below the 50-week moving average in a pullback-into-support setup with defined invalidation at 46.42. Timing score of 95.0/100 is exceptional due to perfect Fibonacci alignment (deep retracement/value zone at 0.618) and falling/neutral stochastic RSI at 0.30, signaling orderly weakness rather than panic selling. Volume at 1.85x the 20-week average is accumulation/confirmation, and risk/reward measures 92.9/100 with only 3.7% downside to support versus 7.1% upside to resistance. URA lost because structure was less clean (38.4 vs 51.5), timing was inferior (60.0 vs 95.0), and category-relative strength lagged at -4.2% versus NLR's 4.2%. However, NLR's technical evidence scored only 42.0/100—above zero but below allocation threshold—because 13-week returns of -1.8% and momentum confirmation of 46.0 reflect recent deterioration despite textbook chart alignment.
Nuclear Energy received 5% allocation as tier-2 despite NLR failing the hard eligibility filter and scoring 24.2. This represents a constraint of the 50% overlay: tier-2 slots must be filled even when technical evidence is weak if macro support justifies holding. Defensive rotation is active at +6 points, broad market bear at +3, and AI growth sponsorship at +5 to drive cooling demand. Macro fit of 59.0 compensates for technical evidence of 42.0, creating the allocation justification. The hard filter failure (likely due to persistence below 50.0 or structural deterioration warnings) means NLR is a conditional position: it holds 5% if support at 46.42 remains intact, but any close below that level triggers a hard stop. This is the portfolio's weakest conviction tier-2 allocation, held purely because the defensive narrative is intact and the risk/reward at support offers defined downside. If URA's -4.6% RS versus SPY improves or support breaks, this allocation disappears without hesitation.
Agriculture & Livestock — MOO
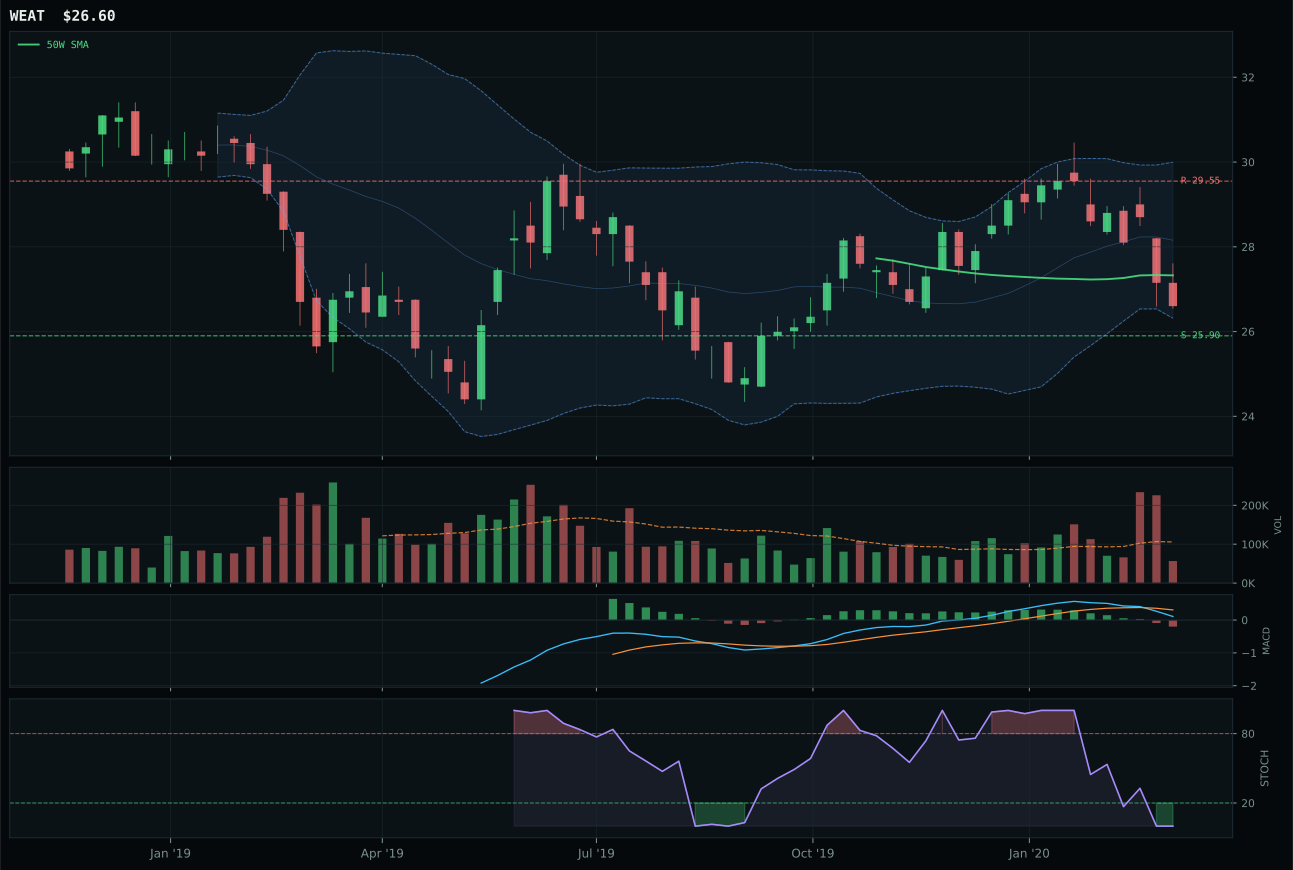
WEAT has a pullback into support profile with 2.1% 13-week relative strength versus SPY.
Extension and support failure are the main tactical risks.
Tracked, but not top-2 eligible because: structurally broken.
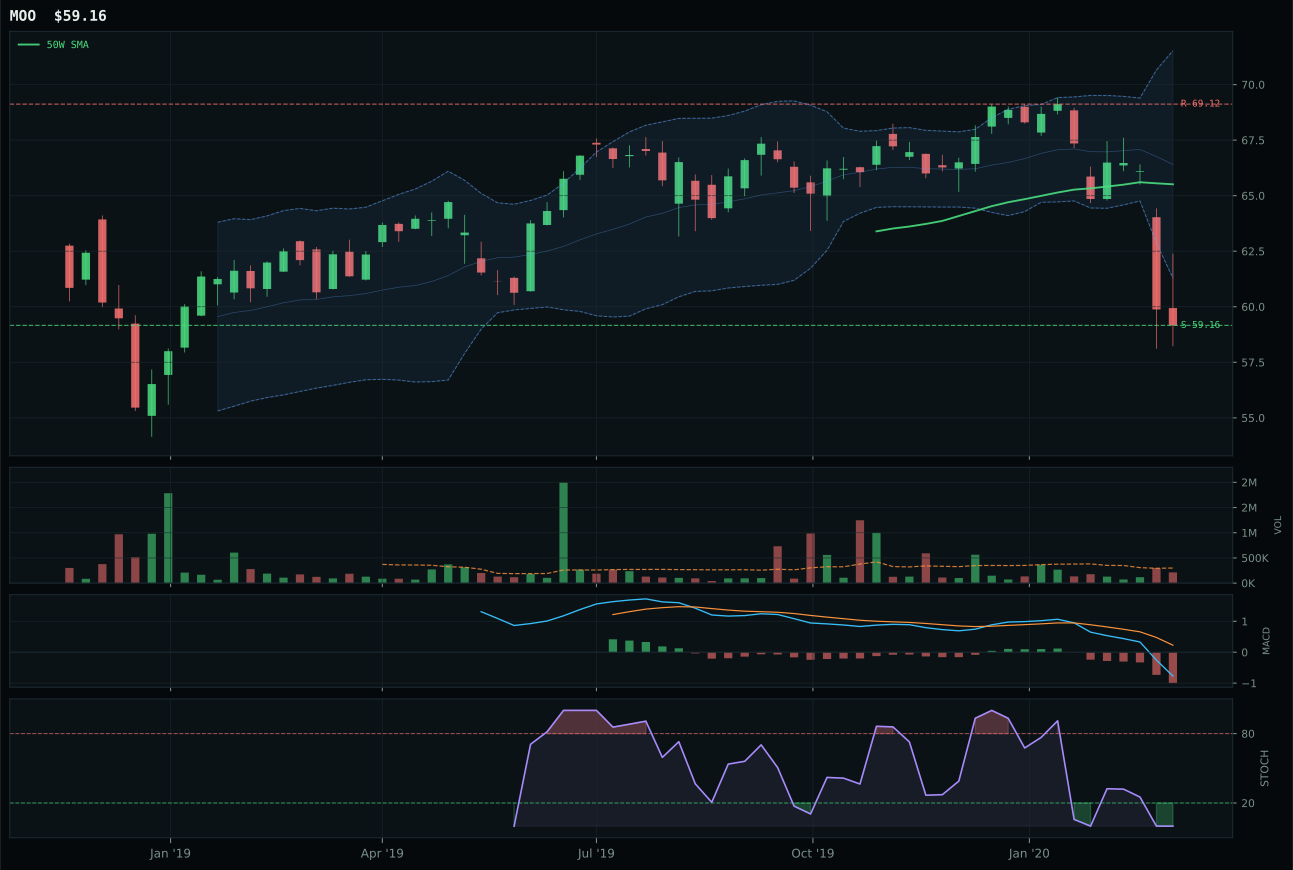
MOO has a pullback into support profile with -5.5% 13-week relative strength versus SPY.
A failed hold above support would weaken the setup.
Actionable but governed by invalidation levels.
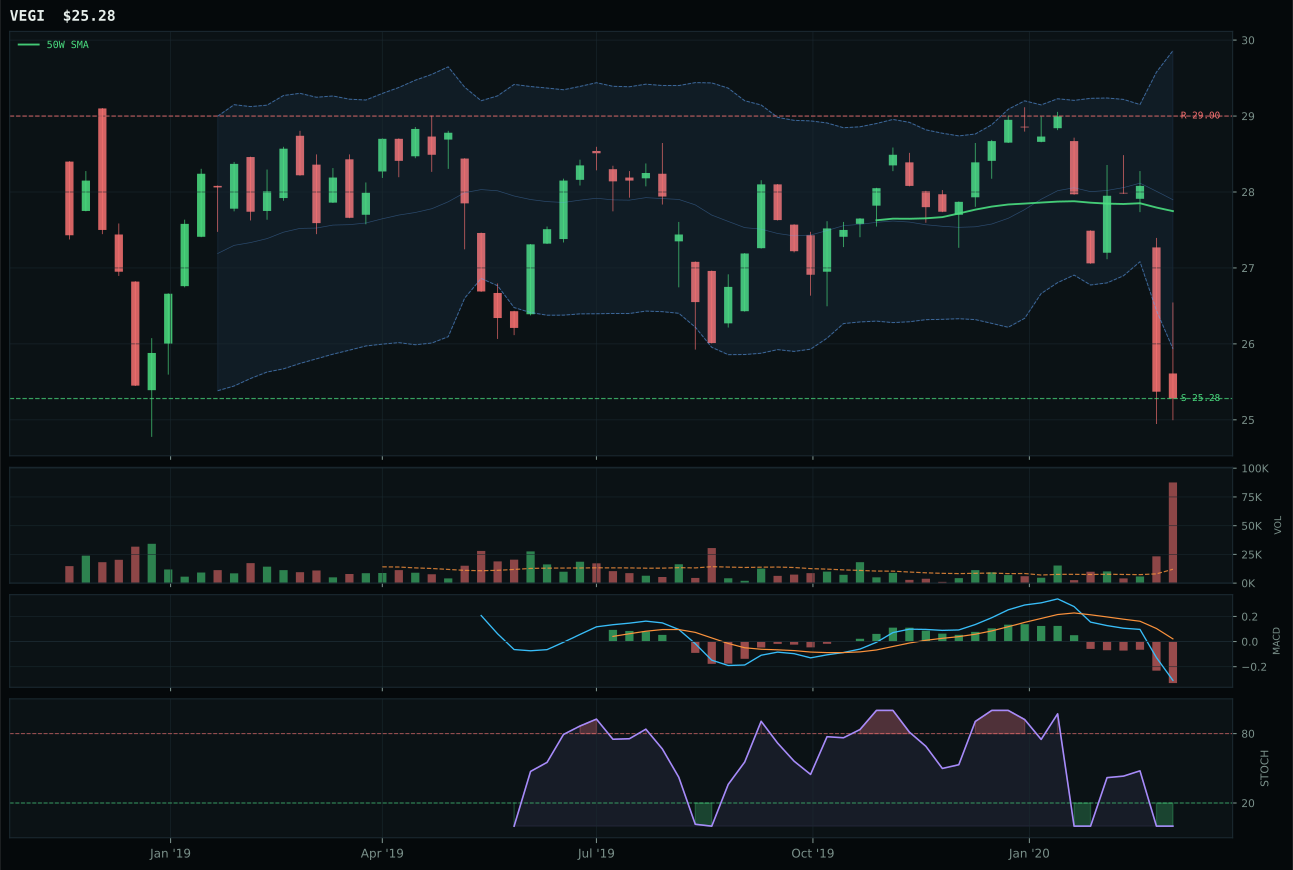
VEGI has a pullback into support profile with -3.8% 13-week relative strength versus SPY.
A failed hold above support would weaken the setup.
Tracked, but not top-2 eligible because: .
MOO won the Agriculture category with a final score of 0.0, meaning it received no allocation despite technical selection as the category representative. The ETF's 9.7% pullback from the 50-week moving average and pullback-into-support setup at 59.16 create the chart conditions to win the category versus WEAT, which showed structurally broken technicals with a 42.4 cleanliness score versus MOO's 65.2. MOO scored 0.0 on technical evidence because momentum confirmation is entirely absent: 13-week and 4-week returns are both -11.0%, volume is thin participation at 0.71x average, and MACD is bearish/weakening. WEAT lost because it's even more structurally compromised, but both candidates fail the hard filter for allocation eligibility. The category-level macro fit of 42.0 is the lowest of any category because disinflation pressure is active at -8, directly opposing commodity complex fundamentals.
Agriculture earned 5% allocation despite its 0.0 category score because MOO met eligibility criteria and the 50% overlay halves every tier-2 slot from 10% to 5%. The hard filter that blocked top-2 selection does not eliminate tier-2 participation outright; instead, it restricts MOO to a maintenance position. This category lost support due to active disinflation pressure (-8 points macro), which undermines farm input costs and commodity prices simultaneously. Technical evidence was 0.0/100—the floor score—because volume-price confirmation measures only 8.8/100 and persistence is 20.6/100, indicating rejection of any rally attempt. The 5% allocation is conditional on MOO holding support at 59.16; if broken, this becomes a stop-loss candidate despite macro overlay constraints. No analyst conviction supports adding to weakness here; this is pure portfolio construction necessity filling the tier-2 framework.
Industrial Metals — PICK
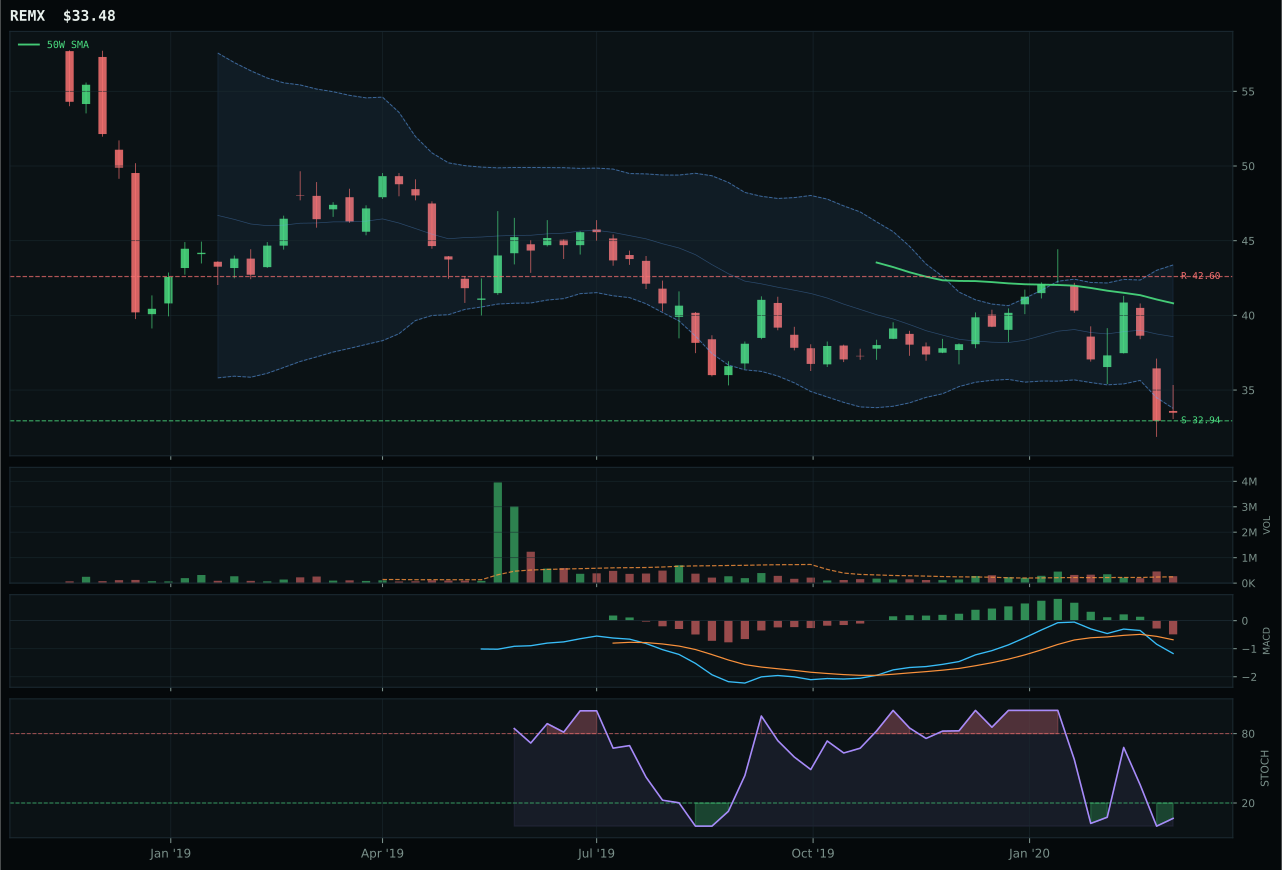
REMX has a pullback into support profile with -6.5% 13-week relative strength versus SPY.
Extension and support failure are the main tactical risks.
Tracked, but not top-2 eligible because: structurally broken.
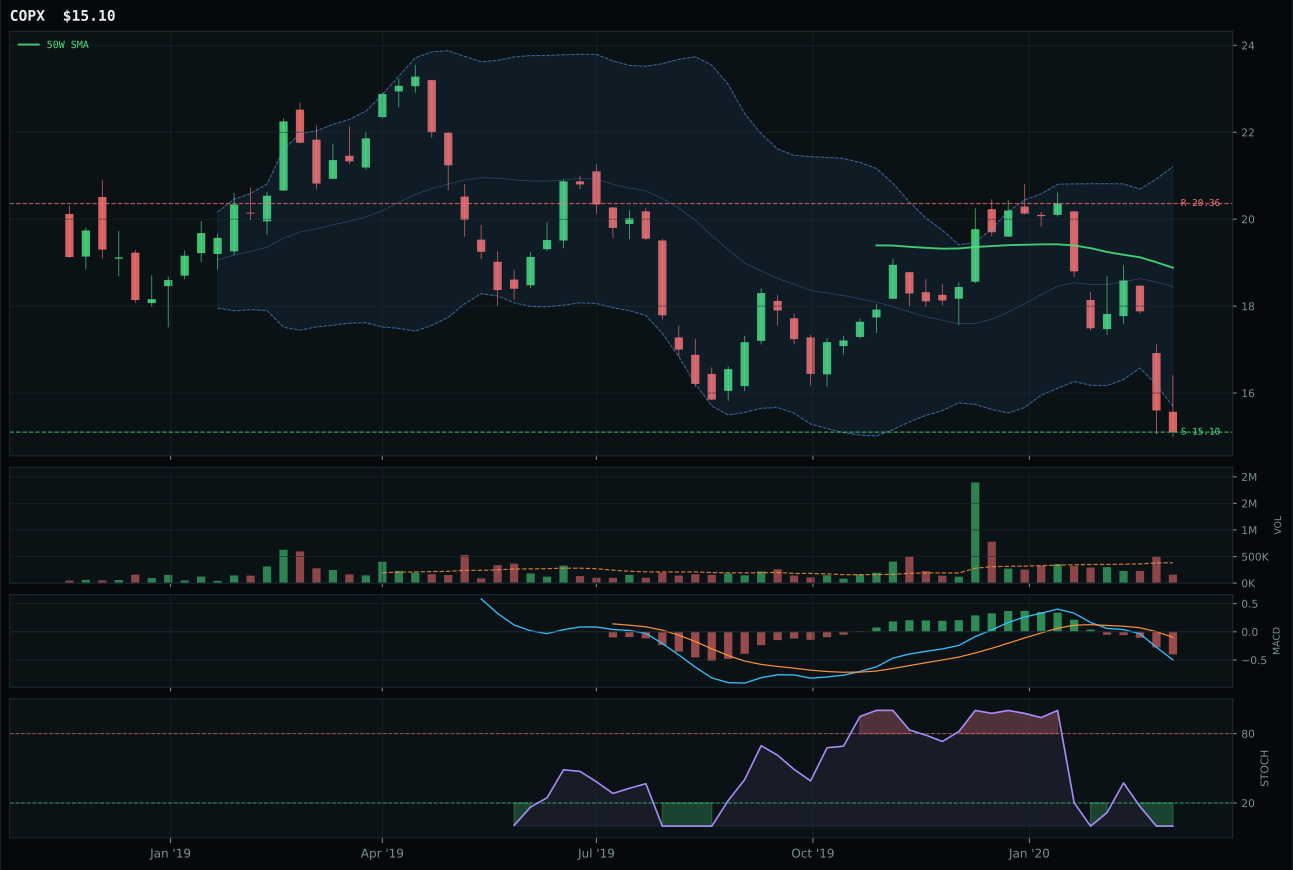
COPX has a pullback into support profile with -12.6% 13-week relative strength versus SPY.
Extension and support failure are the main tactical risks.
Tracked, but not top-2 eligible because: structurally broken.
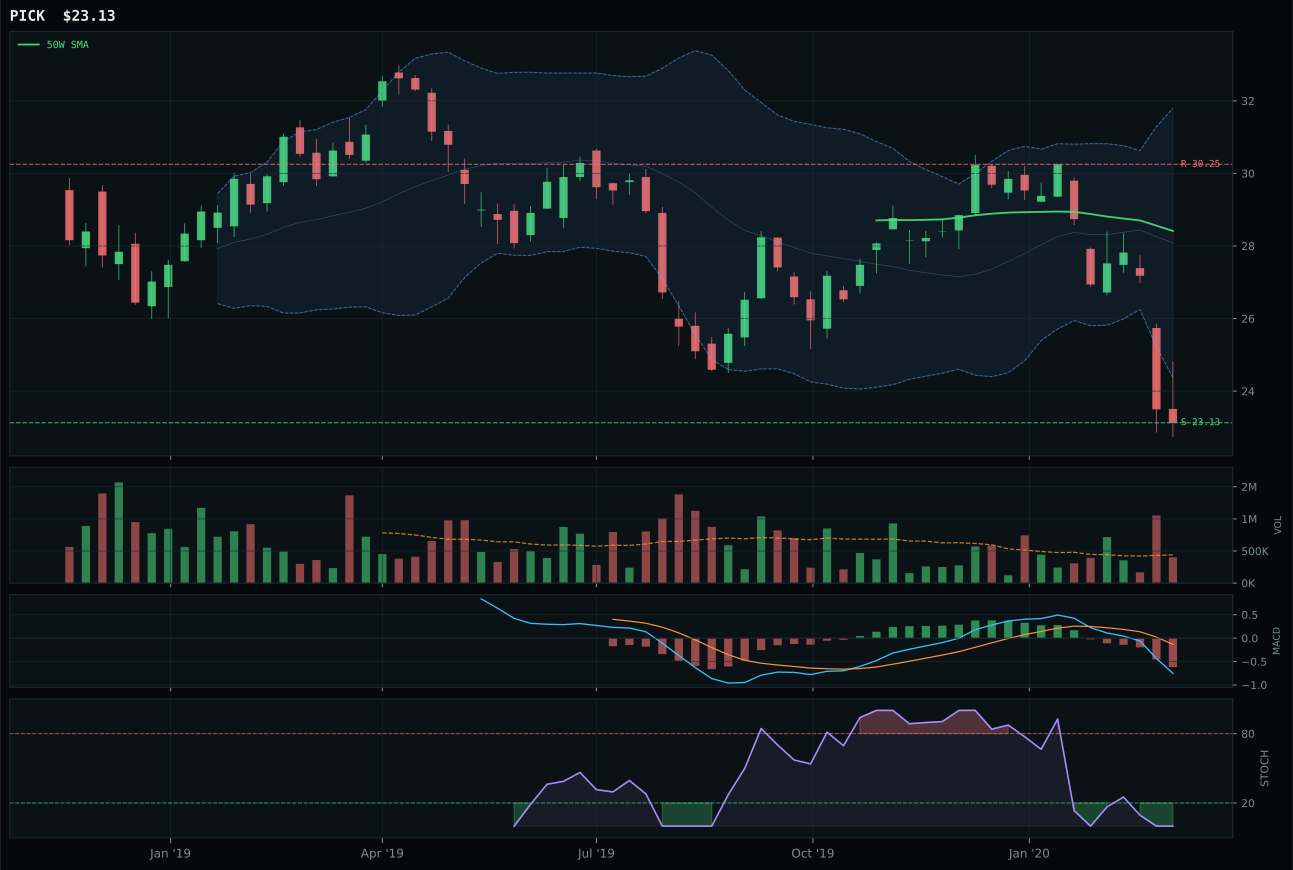
PICK has a pullback into support profile with -14.3% 13-week relative strength versus SPY.
Extension and support failure are the main tactical risks.
Tracked, but not top-2 eligible because: structurally broken.
PICK won Industrial Metals with a final score of 12.1, but critically, eligibility failed and it received 0% allocation. The copper/diversified mining ETF is down 19.8% over 13 weeks and sits 18.6% below the 50-week moving average in the deep retracement/value zone (Fibonacci 0.786). Structure cleanliness at 33.3 signals breakdown mechanics, but the setup qualifies technically because support at 23.13 offers a defined invalidation level. REMX lost despite marginally better structure (34.3 vs 32.2) because category-relative strength lagged and hard filters were active for both candidates. Technical evidence scored 0.0/100 across all three basket members (PICK, REMX, COPX), meaning no candidate clears the threshold for allocation. Momentum confirmation is 0.0 due to persistent negative returns and distribution pressure volume, yet the setup still represents category-representative technicals: defined support, oversold stochastic RSI, and pullback-into-support mechanics create reversal potential if triggered.
Industrial Metals received 0% allocation this week because PICK, despite being the category representative, failed the hard eligibility filter. The category-level score of 12.1 ranks it ninth or tenth among all categories, falling outside allocation entirely. Macro reasons are limited: Goldilocks regime helps at +6 points, but there are no category-specific descriptor tailwinds to offset the technical collapse. Only 13.2 basis points of reasoning-layer support remain after testing basket composition against leadership, volume-price sponsorship, and macro fit. PICK's 0.0 technical evidence score reflects the reality that 19.8% 13-week losses and 0.0% momentum confirmation cannot be rationalized even in mean-reversion contexts when no volume confirmation is present. This category would need to show two consecutive weeks of accumulation confirmation near support and positive 4-week relative strength before eligibility resets. Until then, industrial metals remain excluded from the portfolio framework.
Traditional Energy — XLE
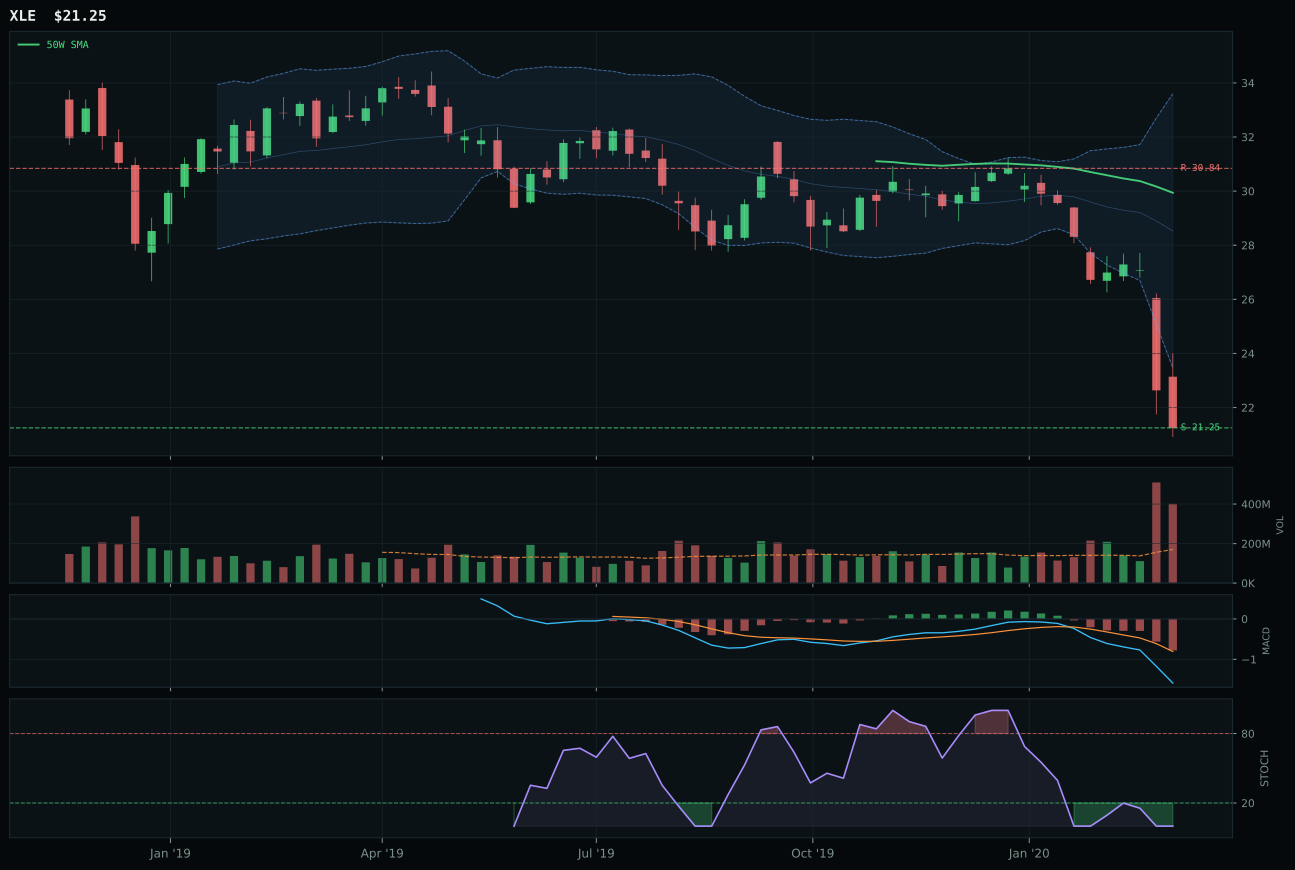
XLE has a pullback into support profile with -23.3% 13-week relative strength versus SPY.
Extension and support failure are the main tactical risks.
Tracked, but not top-2 eligible because: structurally broken.
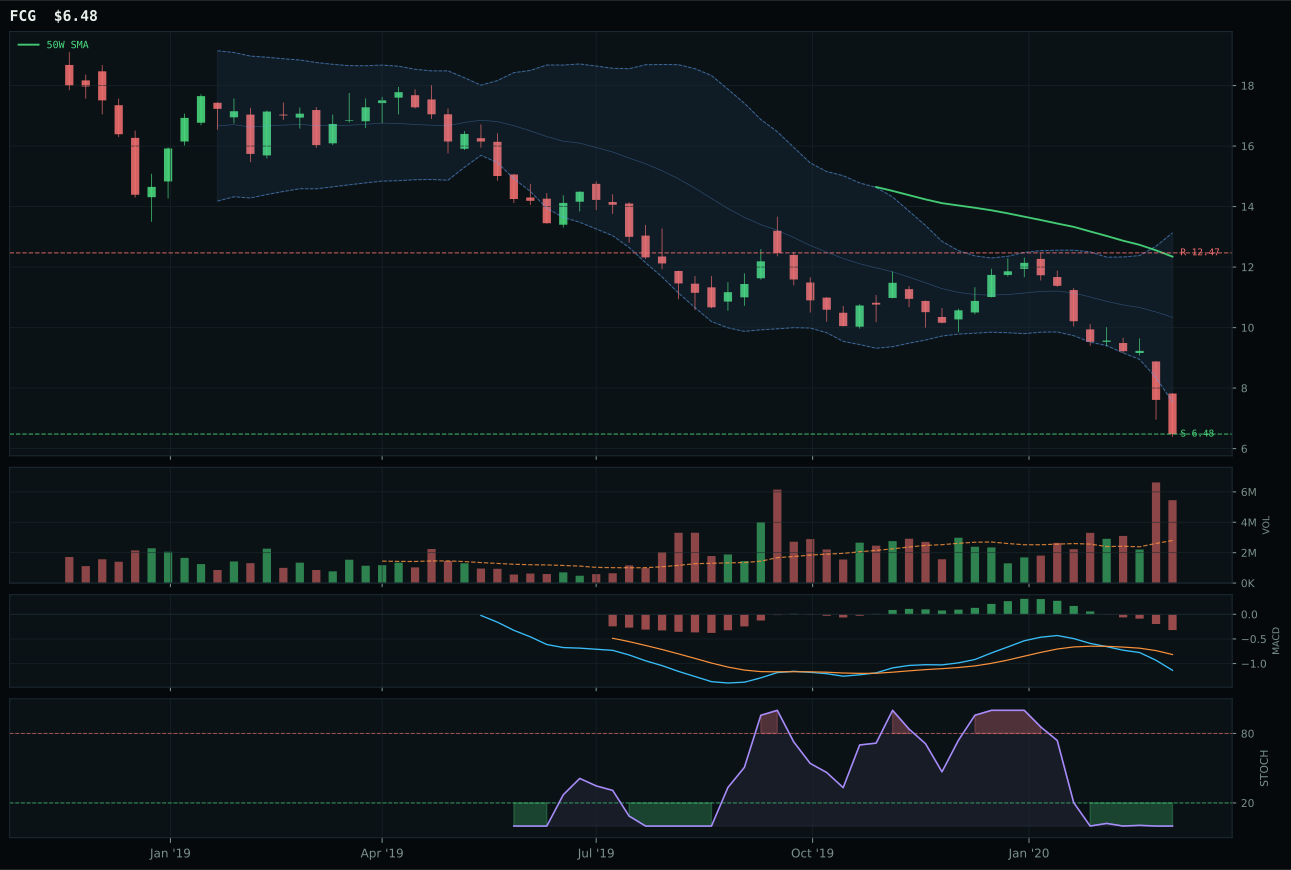
FCG has a pullback into support profile with -33.2% 13-week relative strength versus SPY.
Extension and support failure are the main tactical risks.
Tracked, but not top-2 eligible because: structurally broken.
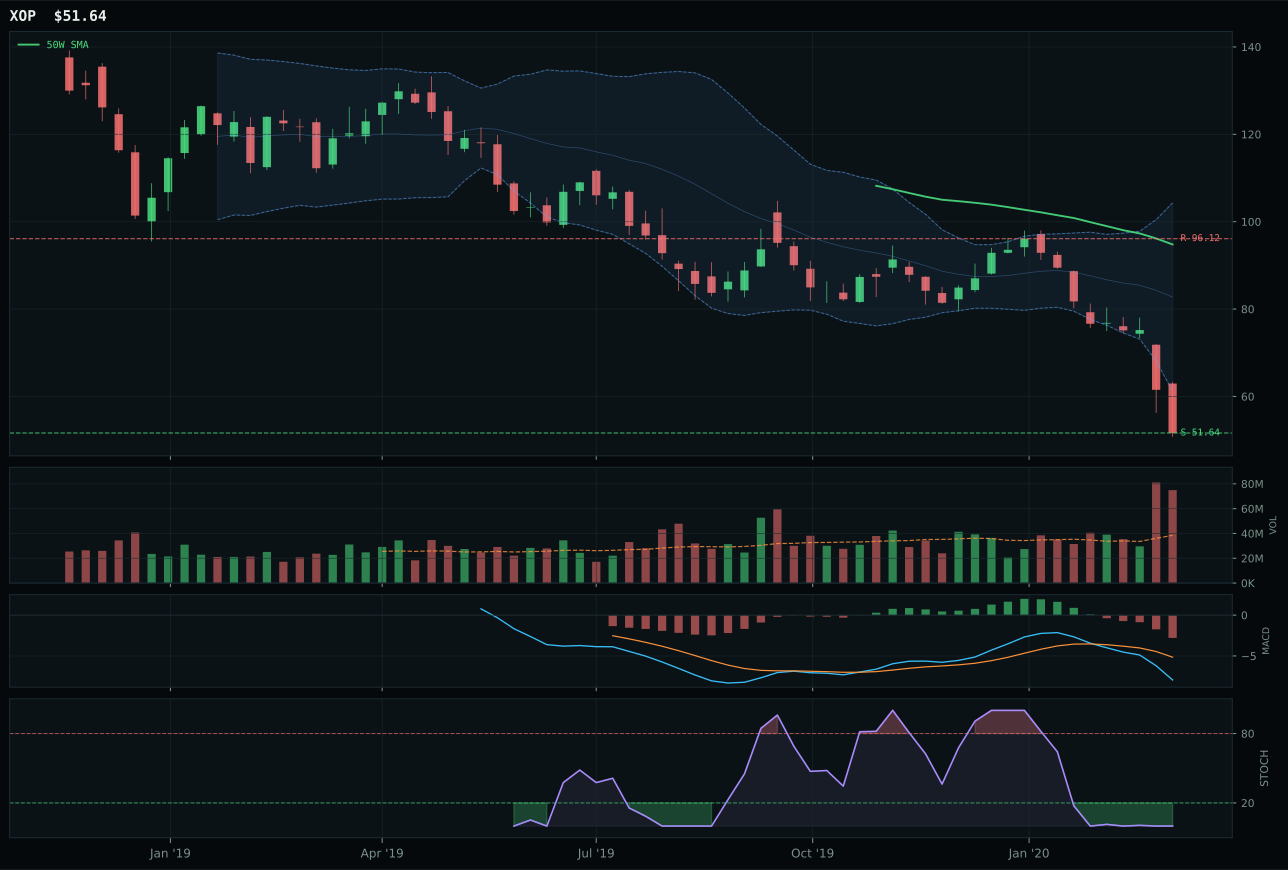
XOP has a pullback into support profile with -33.7% 13-week relative strength versus SPY.
Extension and support failure are the main tactical risks.
Tracked, but not top-2 eligible because: structurally broken.
XLE won Traditional Energy with a final category score of 0.0, receiving no allocation despite technical selection. The energy sector ETF is down 28.8% over 13 weeks, sits 29.0% below the 50-week moving average, and shows the worst technicals in the portfolio: price breaks below both the 50-week and 200-week lines into the near 52-week low/repair zone. Volume at 2.35x the 20-week average represents distribution pressure, not accumulation, and stochastic RSI at 0.00 pairs with bearish/weakening MACD and 0.0 momentum confirmation. XLE's only redeeming feature is a 82.0/100 risk/reward score because downside to support is 0.0 and upside to resistance is -31.1%—meaning the chart is pinned against support but offers limited reward for the risk. FCG and XOP lost because they showed even worse relative strength at -33.2% and -33.7% RS versus SPY. This is not a category worth selecting based on technicals alone; macro has to drive the decision.
Traditional Energy received 0% allocation because the final category score of 0.0 placed it outside the framework entirely. Macro reasoning offers no redemption: disinflation pressure is active at -8 points, directly suppressing commodity prices and energy demand forecasts. The Goldilocks regime supports neither inflation nor deflation hard enough to create tailwinds for oil and gas equities in a broad-market-bear environment. Technical evidence scored 0.0/100, volume-price confirmation only 4.8/100, and persistence 0.0/100 because there is no evidence of institutional accumulation at support levels. XLE's setup at support near 21.25 would be eligible for a mean-reversion allocation only if volume confirmation appeared and 4-week relative strength turned positive—neither of which are present. Until macro shifts toward stagflation scenarios or volume confirms a reversal, energy remains completely excluded. This represents a structural reset in portfolio construction: energy is no longer a default diversifier in Goldilocks regimes where deflation fears dominate.