
2020-02-28
Informational purposes only. The content in this report, including allocations, analysis, and commentary, is provided solely for informational and educational purposes. It does not constitute financial advice, investment advice, trading advice, or any other type of advice. Past performance does not guarantee future results. Always conduct your own research and consult a qualified financial professional before making investment decisions.
Some tracked tickers were excluded due to missing live weekly price data: SGOV: Historical cache SGOV has only 0 usable weekly bars; URNM: Historical cache URNM has only 13 usable weekly bars
XLE defensive overlay excluded: price is below its 8W SMA. Cause selector will use GLD or cash alternative.
GLD defensive overlay excluded: price is below its 8W SMA. Cause selector will use cash alternative.
Fast-crash circuit breaker triggered: SPY dropped more than 8% from its 4-week high this week. Defensive overlay activated immediately.
Slow macro Defensive trigger is active (Transition Defense), but crypto-cycle exposure has priority for this run.
Weekly Allocation
| Ticker | Category | Weight | Role |
|---|---|---|---|
| FBTC | 50% | Overlay | |
| IGV | Technology | 10% | Top-2 (10%) |
| SMH | AI | 10% | Top-2 (10%) |
| ILF | Emerging Markets | 5% | Tier-2 (5%) |
| GLD | Precious Metals | 5% | Tier-2 (5%) |
| IGF | Utilities & Infrastructure | 5% | Tier-2 (5%) |
| URA | Nuclear Energy | 5% | Tier-2 (5%) |
| XAR | Defense & Aerospace | 5% | Tier-2 (5%) |
| MOO | Agriculture & Livestock | 5% | Tier-2 (5%) |
Trade Instructions — Monday Open
Sell the tranche from 2020-01-31 (completing its 4-week hold). Buy the new tranche. Instructions show net portfolio changes — same-asset positions cancel, weight changes show the delta.
| Action | Ticker | Instruction |
|---|---|---|
| SELL | GLD | Sell 17% of GLD position (reduce 7.50% → 6.25%) |
| SELL | XLU | Sell 33% of XLU position (reduce 7.50% → 5.00%) |
| SELL | ITA | Sell 25% of ITA position (reduce 5.00% → 3.75%) |
| SELL | PICK | Sell entire PICK position (1.25% of portfolio) |
| SELL | XLE | Sell 25% of XLE position (reduce 5.00% → 3.75%) |
| BUY | IGV | Buy IGV — 16.67% of freed cash (adds 1.25% to portfolio) |
| BUY | SMH | Buy SMH — 16.67% of freed cash (adds 1.25% to portfolio) |
| BUY | ILF | Buy ILF — 16.67% of freed cash (adds 1.25% to portfolio) |
| BUY | IGF | Buy IGF — 16.67% of freed cash (adds 1.25% to portfolio) |
| BUY | URA | Buy URA — 16.67% of freed cash (adds 1.25% to portfolio) |
| BUY | XAR | Buy XAR — 16.67% of freed cash (adds 1.25% to portfolio) |
Current Portfolio After Trade
Combined holdings across all 4 active tranches. Each tranche is 25% of the portfolio.
| Ticker | % of Portfolio | Weight Bar |
|---|---|---|
| FBTC | 50.00% | |
| IGV | 7.50% | |
| GLD | 6.25% | |
| SMH | 6.25% | |
| XLU | 5.00% | |
| ITA | 3.75% | |
| XLE | 3.75% | |
| NLR | 3.75% | |
| XLK | 2.50% | |
| INDA | 2.50% | |
| BOTZ | 1.25% | |
| IEMG | 1.25% | |
| ILF | 1.25% | |
| IGF | 1.25% | |
| URA | 1.25% | |
| XAR | 1.25% | |
| MOO | 1.25% |
Macro Regime — Goldilocks
Defensive overlay cause is not singular enough to concentrate: the sleeve diversifies across liquidity, monetary defense, and defensive equity exposure while the market resolves the next regime.
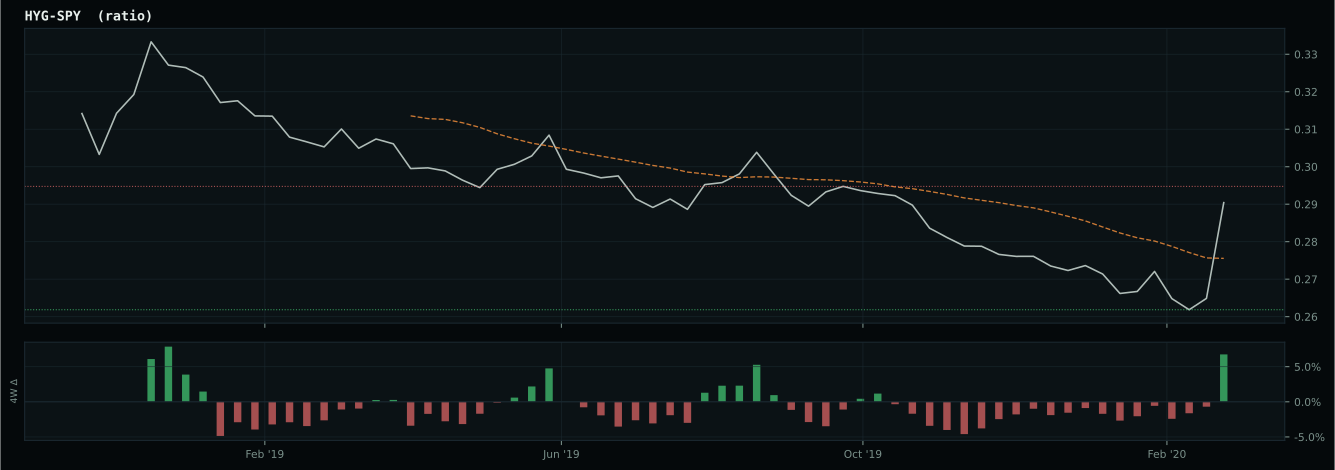
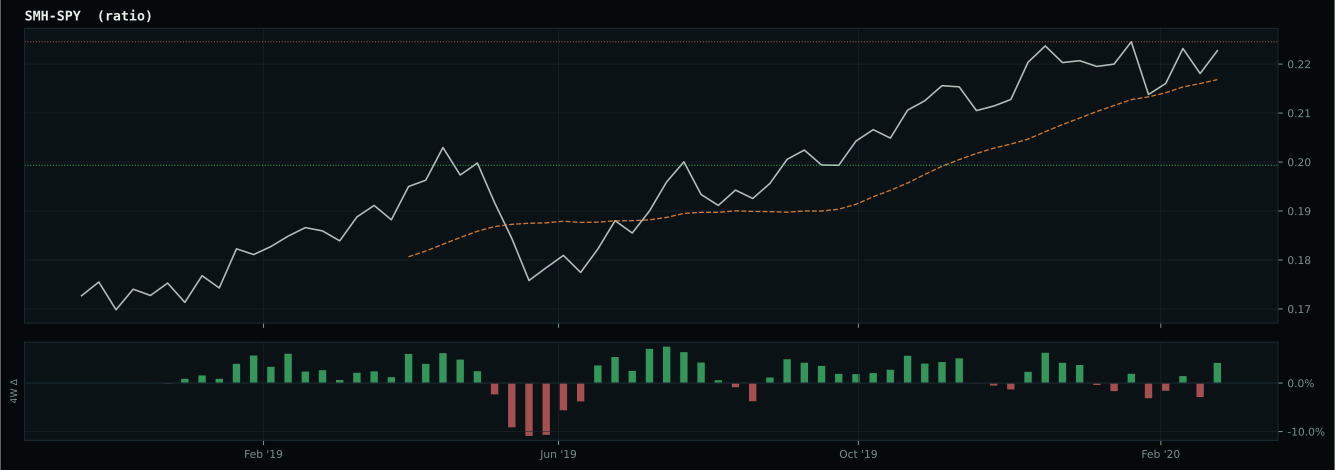
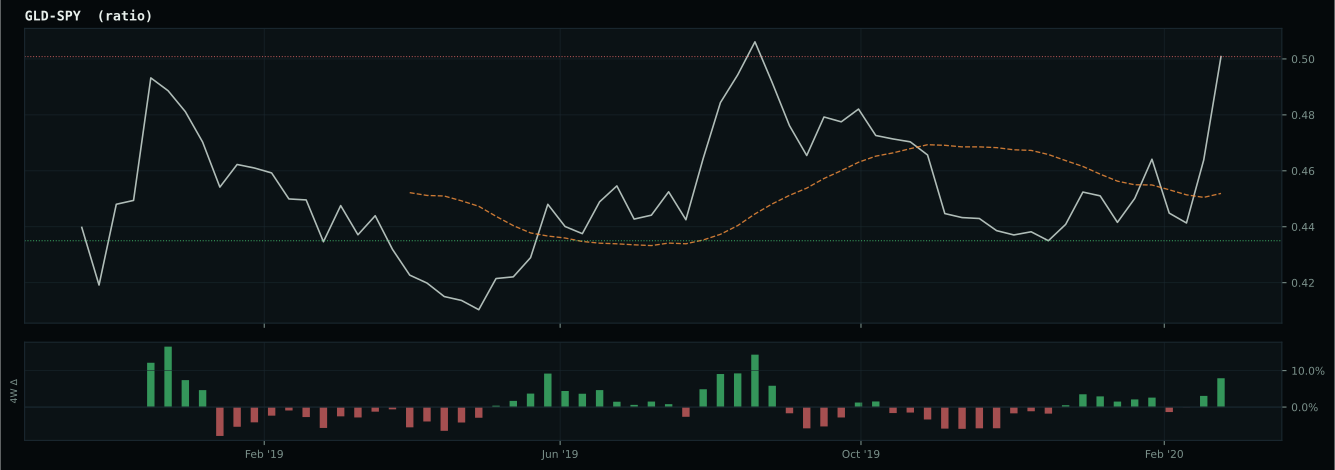
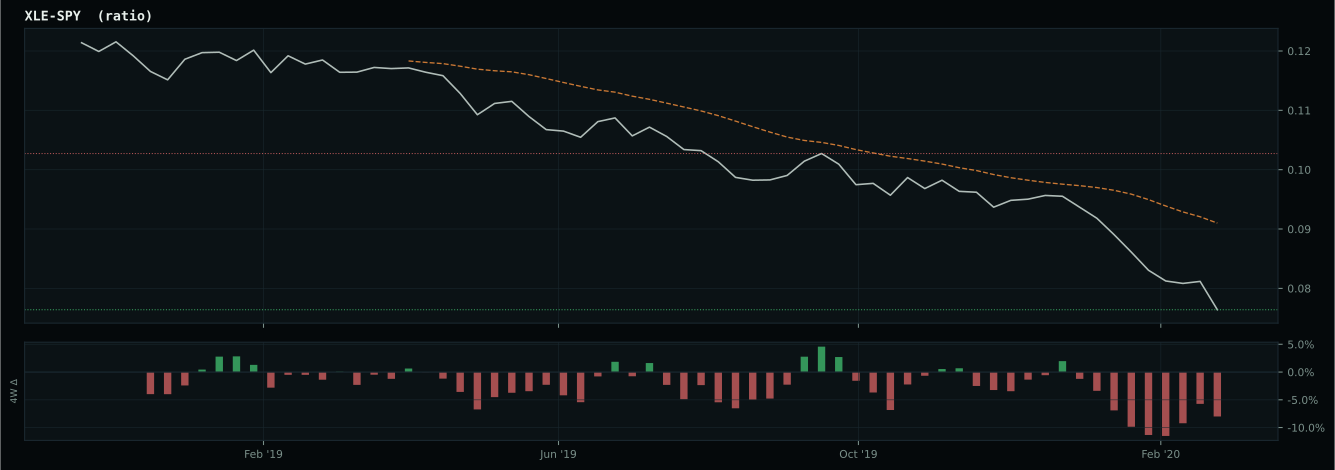
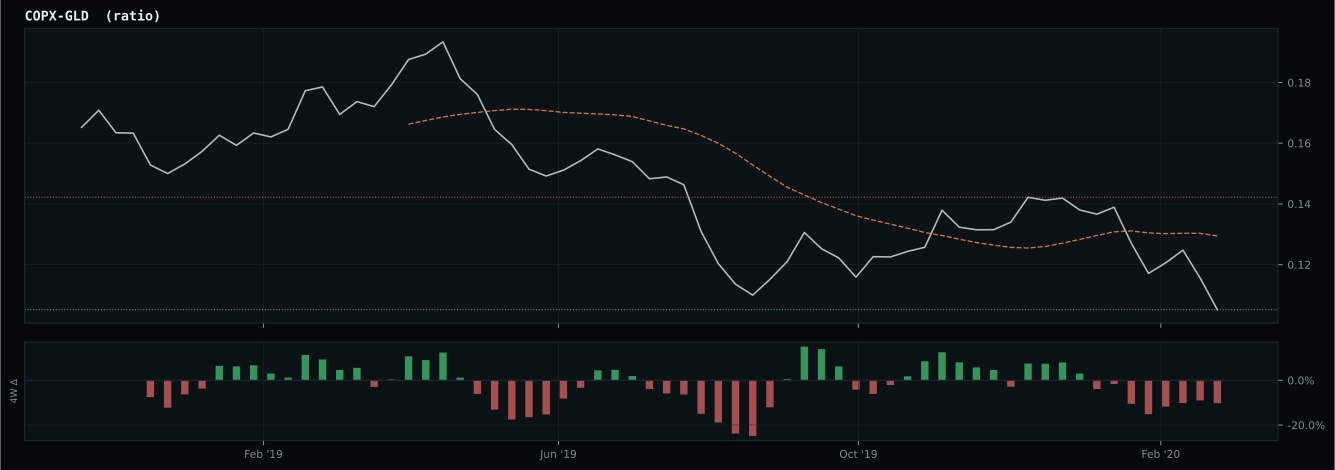
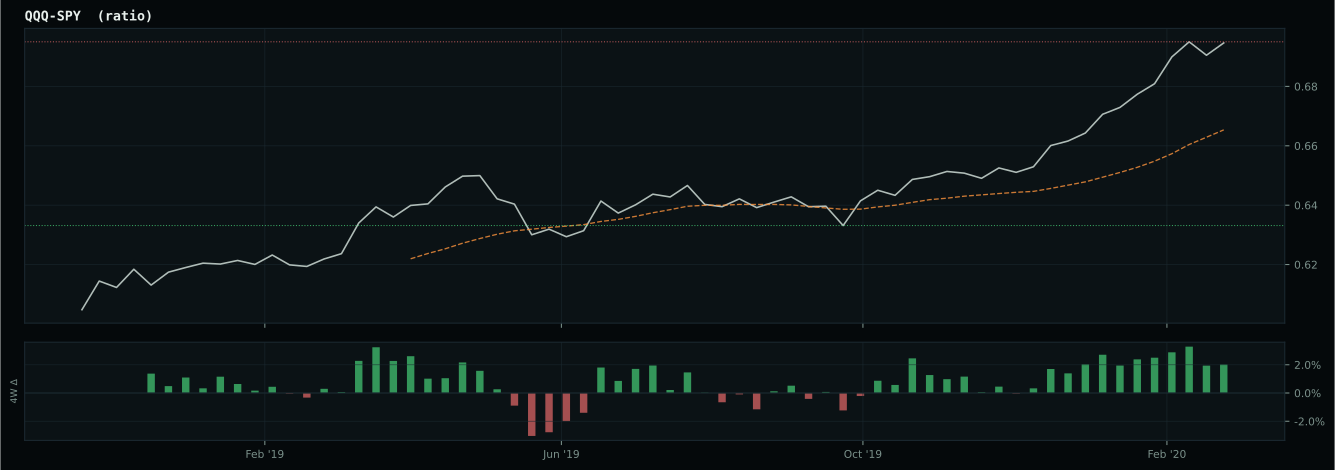
Macro Evidence Charts
Market-implied signals behind the macro regime scores. Each ratio compares two assets; the direction and slope of the ratio is what the macro engine reads.
Crypto Regime — TrendBTC
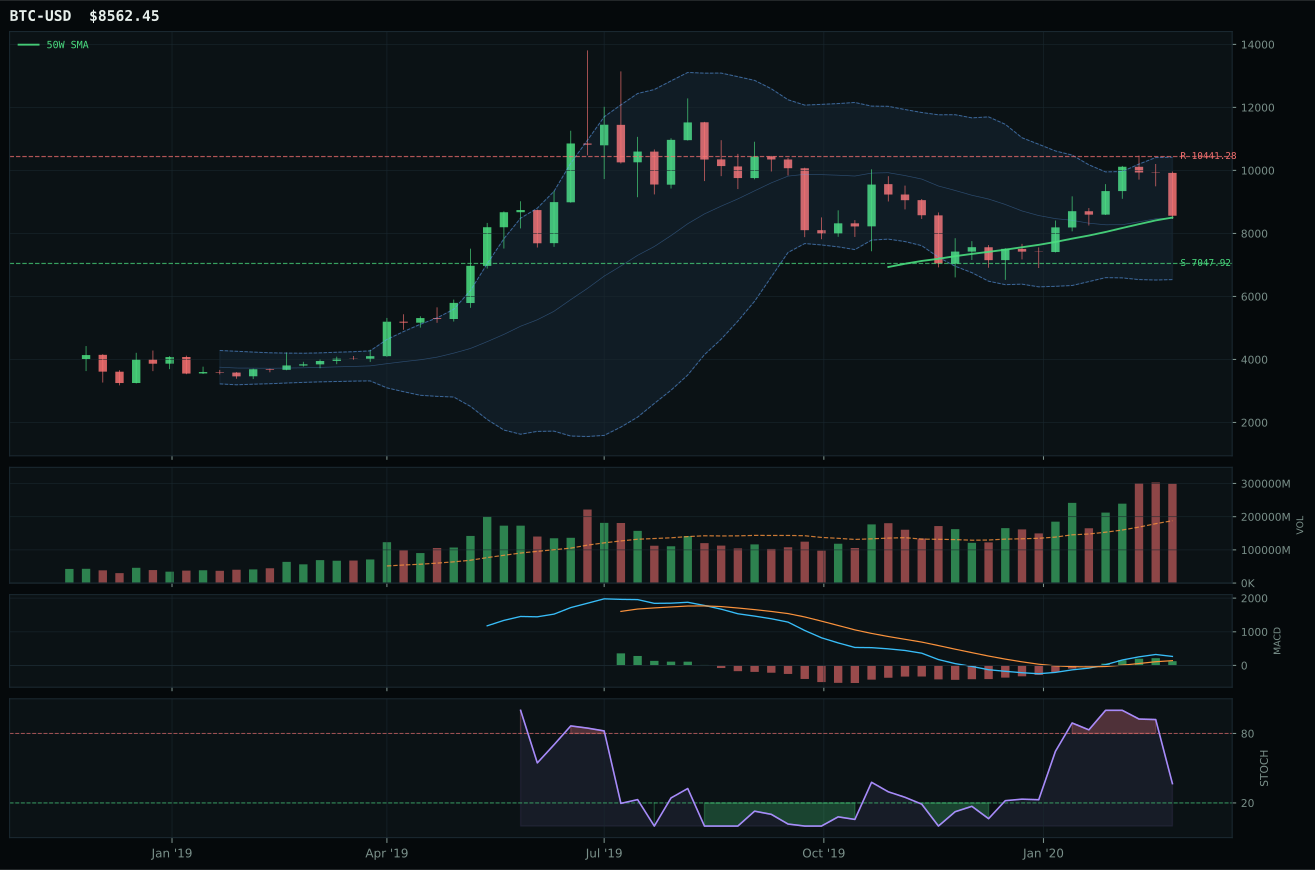
post-touch structure is too wide to count as a range; max/min close ratio is 3.33
TrendBTC confirmed: 2 consecutive closes above rising/flat 50W SMA
one or more available conditions failed

Category Rankings
| Rank | Category | Winner | Score | Alloc | 4W Ret | Peers (4W) |
|---|---|---|---|---|---|---|
| 1 | Technology | IGV | 48.1 | 20% | -12.41% | XLK -11.5% · CIBR -9.3% |
| 2 | AI | SMH | 39.3 | 20% | -12.39% | AIQ -11.8% · BOTZ -10.3% |
| 3 | Emerging Markets | ILF | 36.8 | 10% | -35.54% | IEMG -18.4% · INDA -26.3% |
| 4 | Precious Metals | GLD | 33.4 | 10% | +1.61% | GDX -10.0% · SLV -16.3% |
| 5 | Utilities & Infrastructure | IGF | 30.9 | 10% | -23.52% | PAVE -23.5% · XLU -10.1% |
| 6 | Nuclear Energy | URA | 24.5 | 10% | -15.90% | NLR -14.2% |
| 7 | Defense & Aerospace | XAR | 20.8 | 10% | -22.68% | ROKT -23.6% · ITA -26.8% |
| 8 | Industrial Metals | PICK | 9.7 | 10% | -19.74% | COPX -27.0% · REMX -19.8% |
| 9 | Agriculture & Livestock | MOO | — | 0% | -16.90% | WEAT +6.4% · VEGI -17.8% |
| 10 | Traditional Energy | XLE | — | 0% | -39.61% | XOP -50.6% · FCG -49.5% |
Technology — IGV
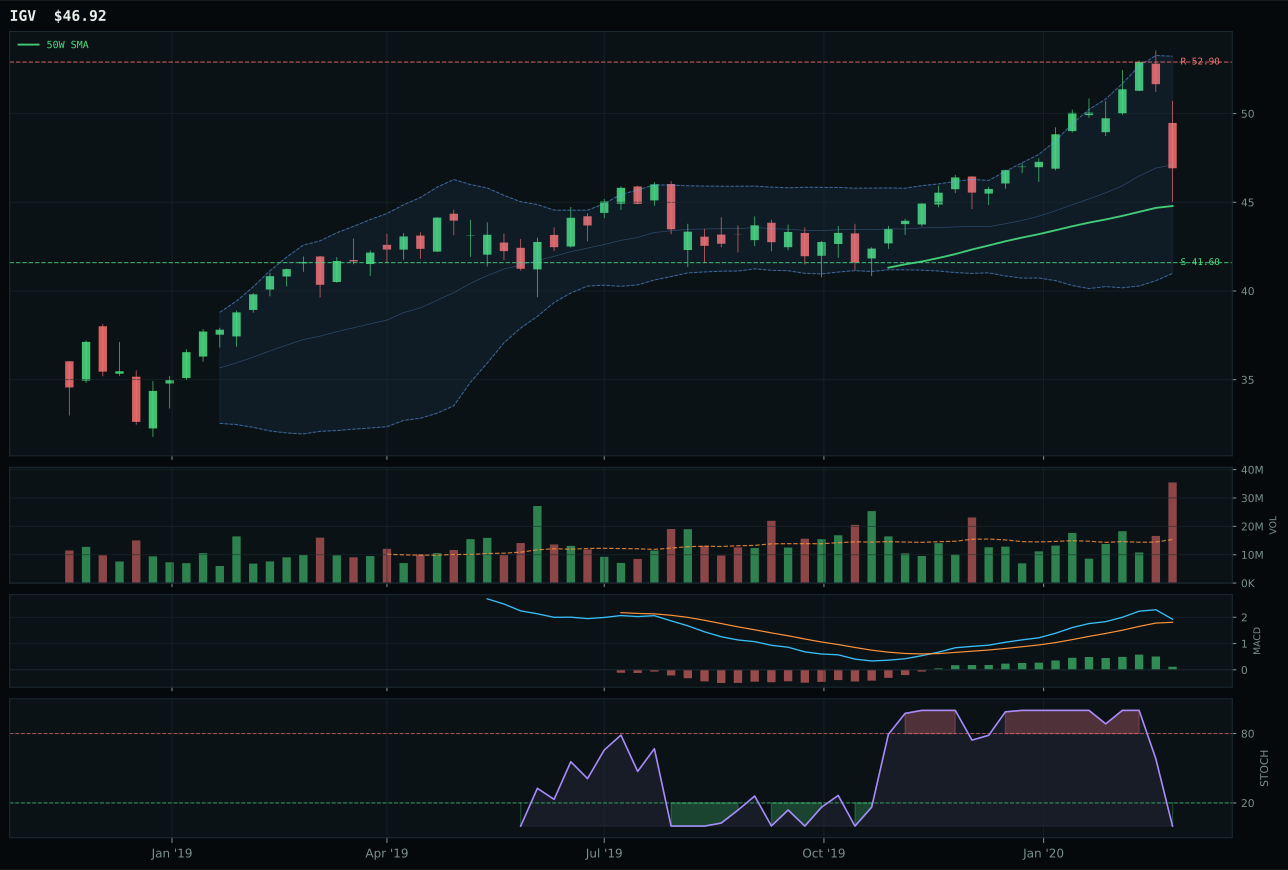
IGV has a neutral structure profile with 6.9% 13-week relative strength versus SPY.
A failed hold above support would weaken the setup.
Actionable but governed by invalidation levels.
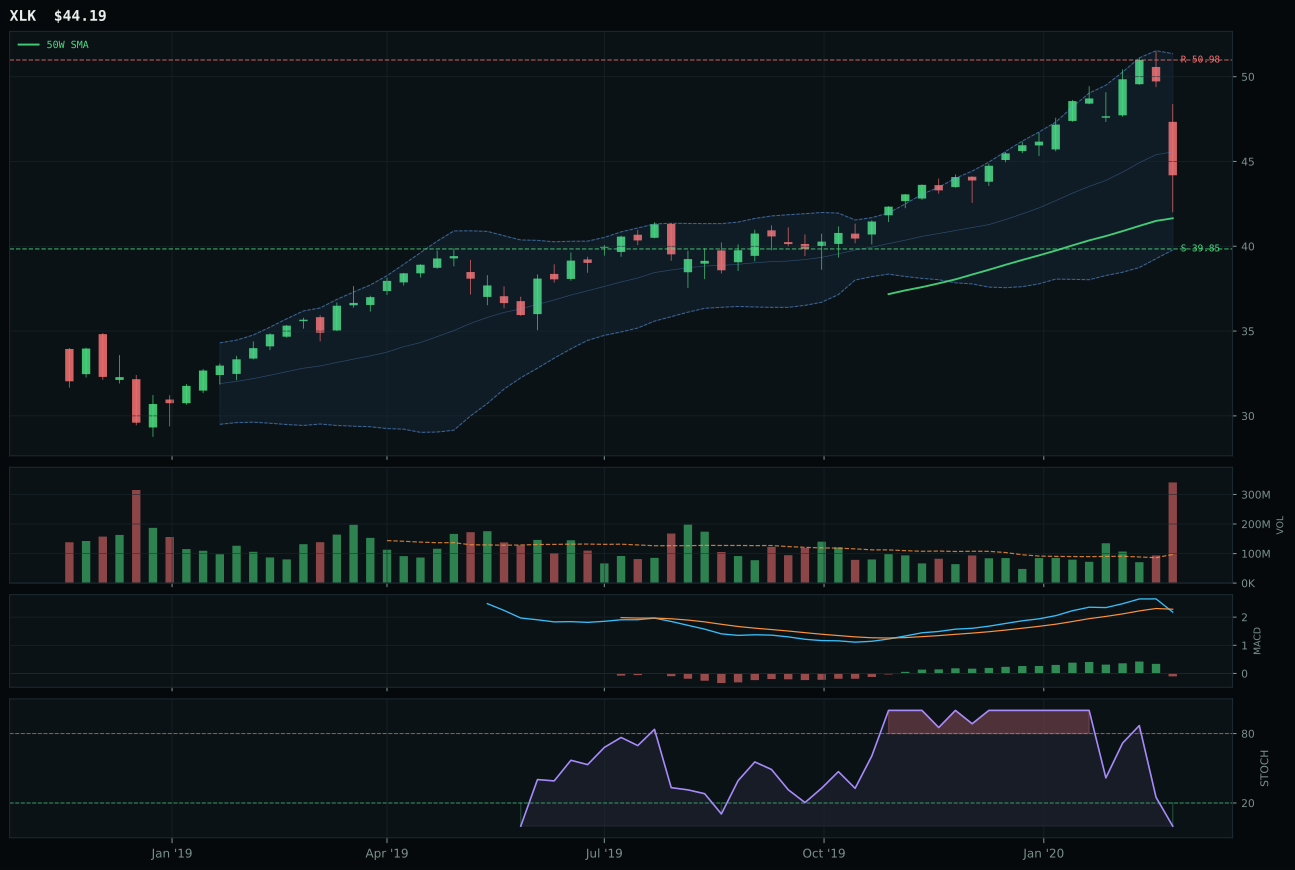
XLK has a neutral structure profile with 6.0% 13-week relative strength versus SPY.
A failed hold above support would weaken the setup.
Actionable but governed by invalidation levels.
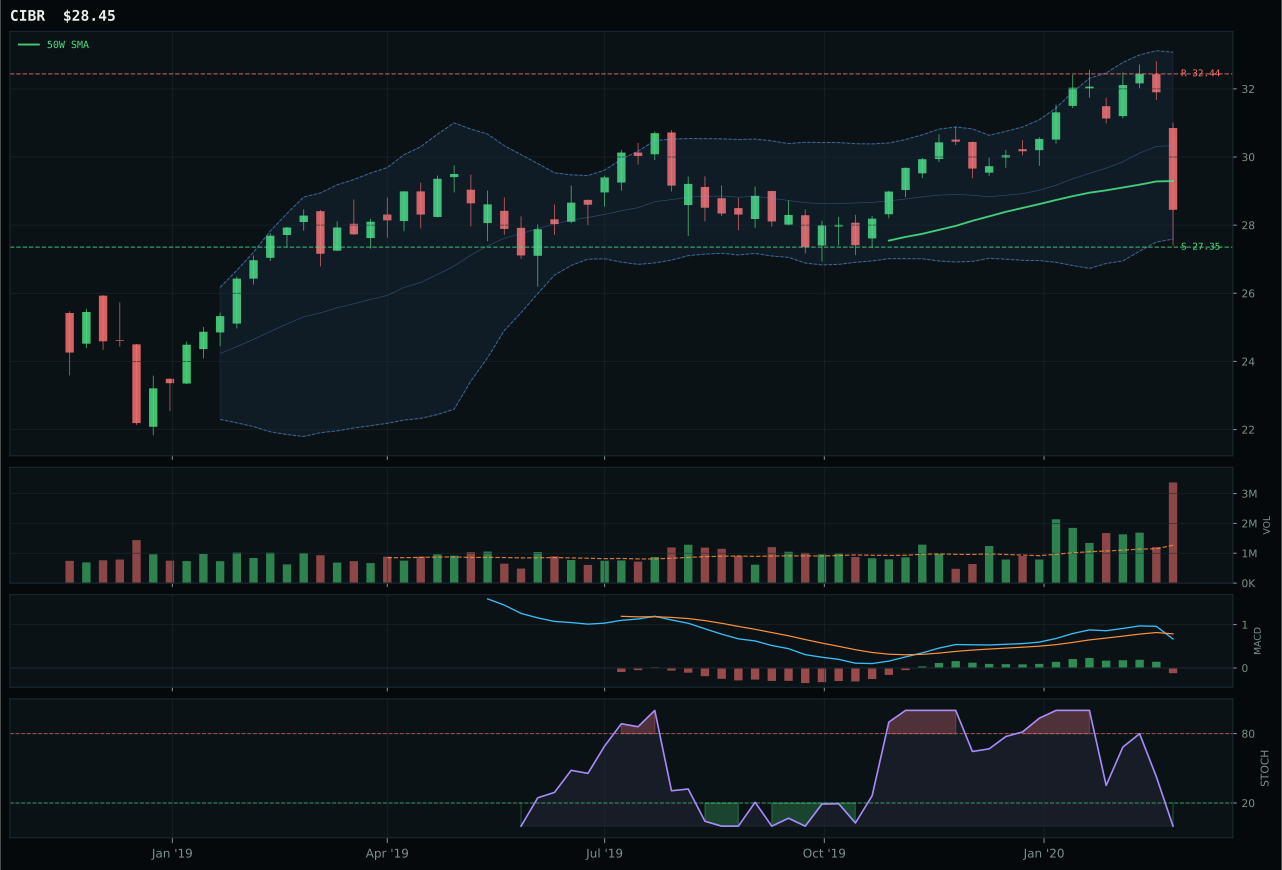
CIBR has a pullback into support profile with -0.8% 13-week relative strength versus SPY.
A failed hold above support would weaken the setup.
Actionable but governed by invalidation levels.
IGV wins the category because its 6.9% relative strength versus SPY combined with a bullish (though flattening) MACD gives it the technical edge to lead a basket scoring 48.1. The runner-up XLK stumbled on timing—its MACD is bearish/weakening rather than bullish—and its category-relative strength of 0.0% versus IGV's 0.9% reveals asymmetric buyer appetite for enterprise software over broad profitable tech. Both sit in neutral structure with oversold stochastic RSI, but IGV sits 4.7% above its 50-week moving average while XLK is closer, meaning IGV has already proven it can hold higher prices against fresh distribution pressure at 2.31x volume. The 10.3-point score gap reflects a clear category consensus: when growth is repriced this fast, first-movers in duration-sensitive names hold better than followers.
Technology earned its 10% allocation as a top-2 category because the Goldilocks macro backdrop and active liquidity expansion and AI growth sponsorship descriptors combine with IGV's trend score of 100.0 to justify overweight positioning. The category's 79.0 macro fit score demonstrates that technical evidence (62% weight) and macro narrative (38% weight) are working together, not in tension; liquidity expansion adds 9 points, AI sponsorship adds 6 more, and disinflation pressure contributes 5. IGV's 13-week return of only 1.1% signals this is not a crowded chase but rather a quiet accumulation of quality names into support, with volume distribution pressure at 2.31x showing institutions stepping in despite the pullback. The allocation would shrink if MACD crossed below its signal line or if relative strength deteriorated further from the 50-week, but neither has occurred yet, and both entry conditions are now tighter.
AI — SMH
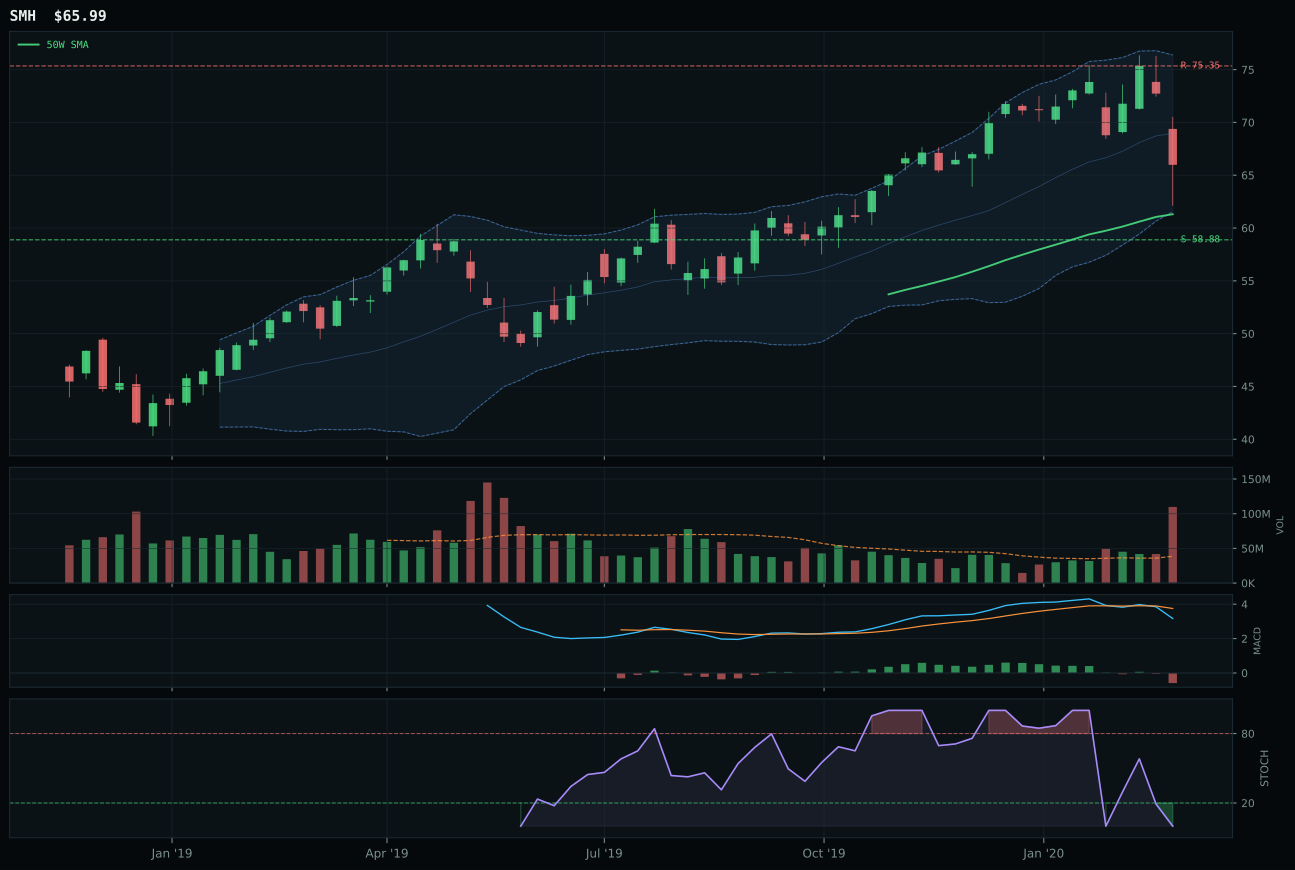
SMH has a neutral structure profile with 5.0% 13-week relative strength versus SPY.
A failed hold above support would weaken the setup.
Actionable but governed by invalidation levels.
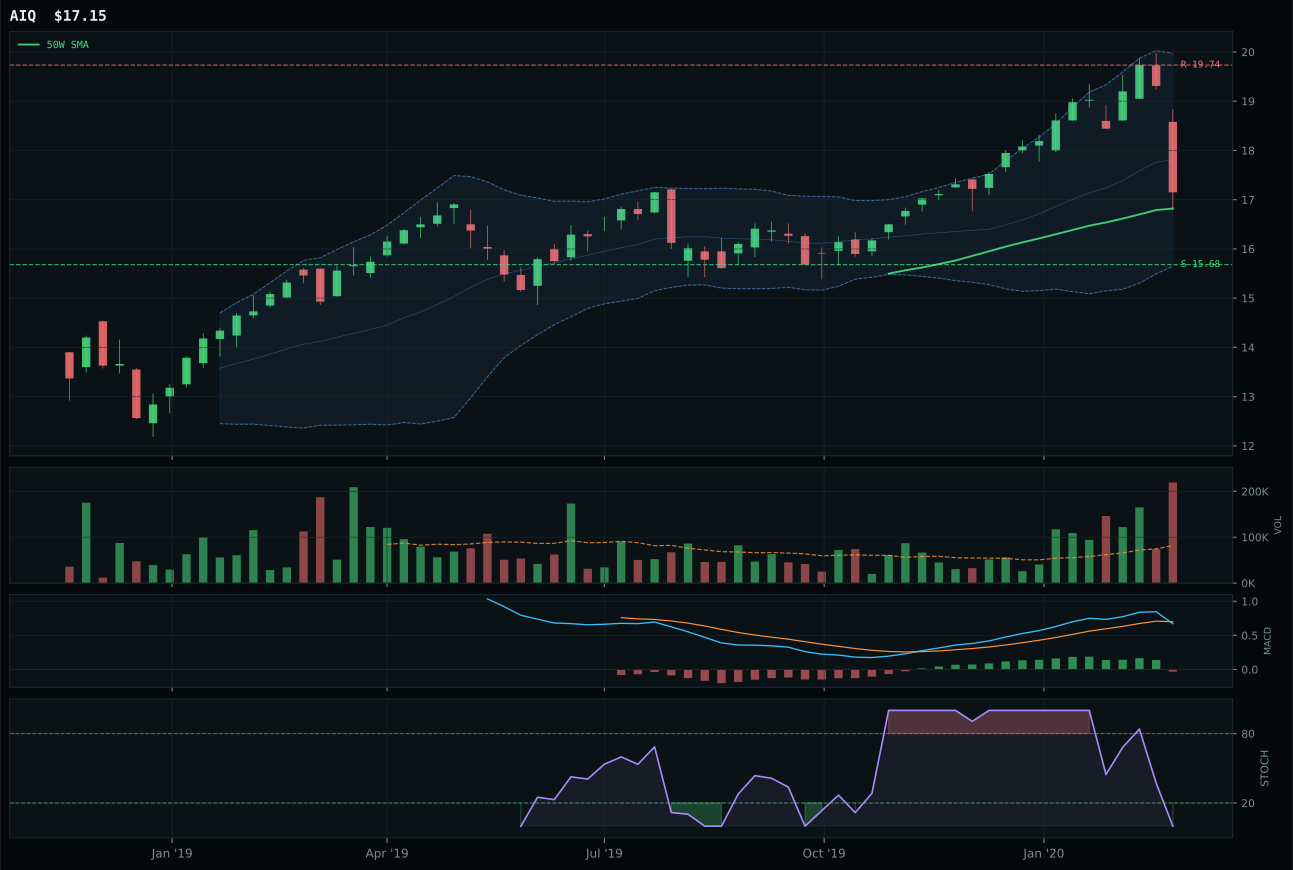
AIQ has a compression near 50W profile with 4.8% 13-week relative strength versus SPY.
A failed hold above support would weaken the setup.
Tracked, but not top-2 eligible because: .
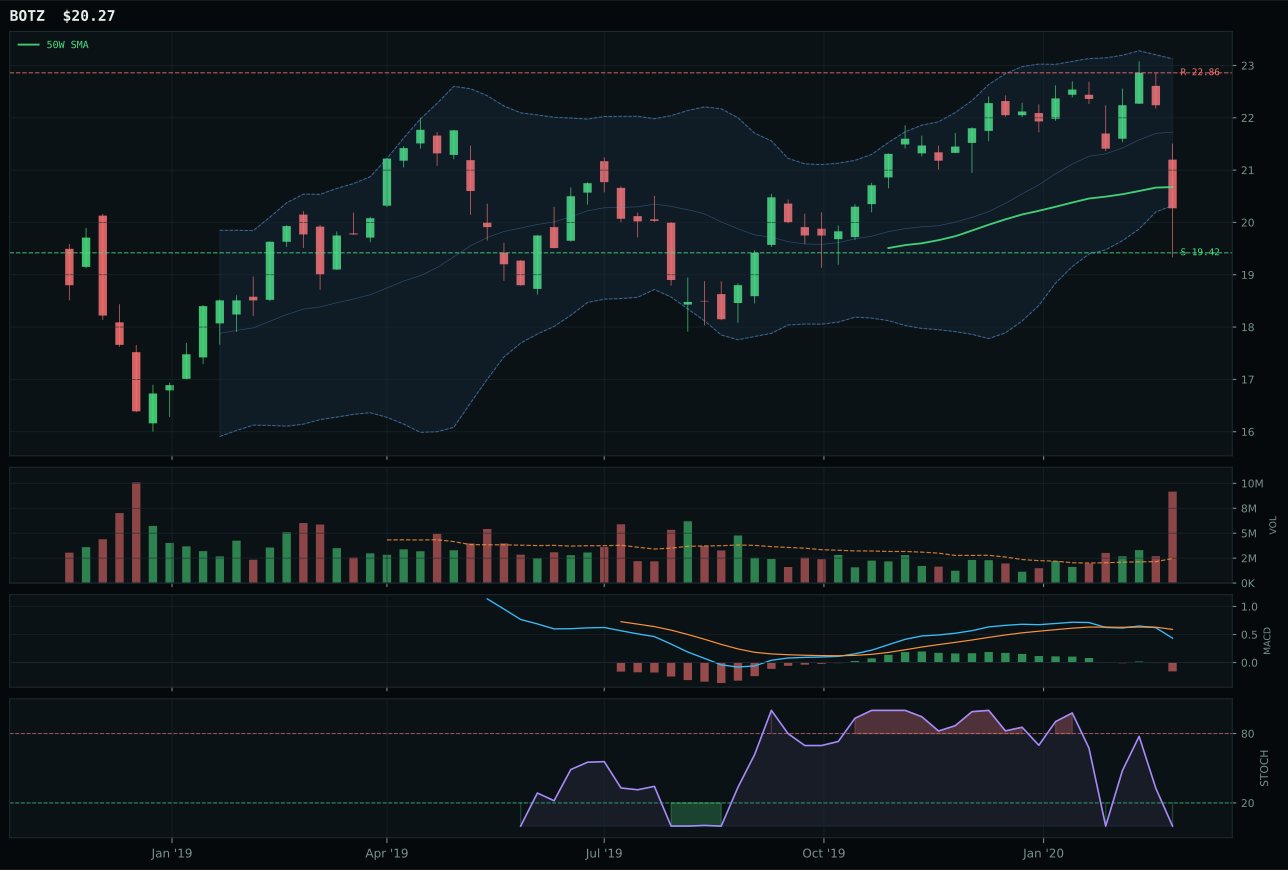
BOTZ has a pullback into support profile with 0.2% 13-week relative strength versus SPY.
A failed hold above support would weaken the setup.
Actionable but governed by invalidation levels.
SMH wins because its 5.0% relative strength versus SPY and trend score of 89.5 beat AIQ's 4.8% SPY relative strength and 59 trend, despite both showing bearish/weakening MACD and oversold stochastic RSI at the same Fib zone. The margin is razor-thin—a 20-point score gap—which underscores how commodity semiconductor exposure and broad AI application software are functionally competing for the same liquidity pool right now. What tips SMH ahead is its neutral structure versus AIQ's compression near the 50-week, meaning SMH has already tested and held a wider formation; AIQ is still tightening, which makes it vulnerable to a violent break lower if support fails. The 13-week return differential (-0.7% for SMH versus -0.9% for AIQ) is immaterial, but SMH's 0.2% category-relative strength versus AIQ's 0.0% confirms that compute hardware is the incremental buyer right now, not software breadth.
AI earned its 10% allocation as a top-2 category despite a final score of only 39.3, ranked second because it meets the two highest eligible category scores threshold and both its technical and macro profiles remain intact. The category's 76.0 macro fit is driven by active AI growth sponsorship at +14 points and liquidity expansion at +10, which offset a small -8 from broad market bear signals; for a semiconductor-driven basket, this is a favorable risk-adjusted setup. SMH's trend of 89.5 is the category's lifeline—price remains above both the 50-week and 200-week moving averages—so the bearish MACD is a warning of fading momentum rather than a trend reversal. The 24.9 momentum confirmation score is weak, but that weakness is already priced into the 10% sleeve size; the allocator is signaling: hold the position, but do not add to it until MACD stabilizes or until the 13-week return moves decisively positive.
Emerging Markets — ILF
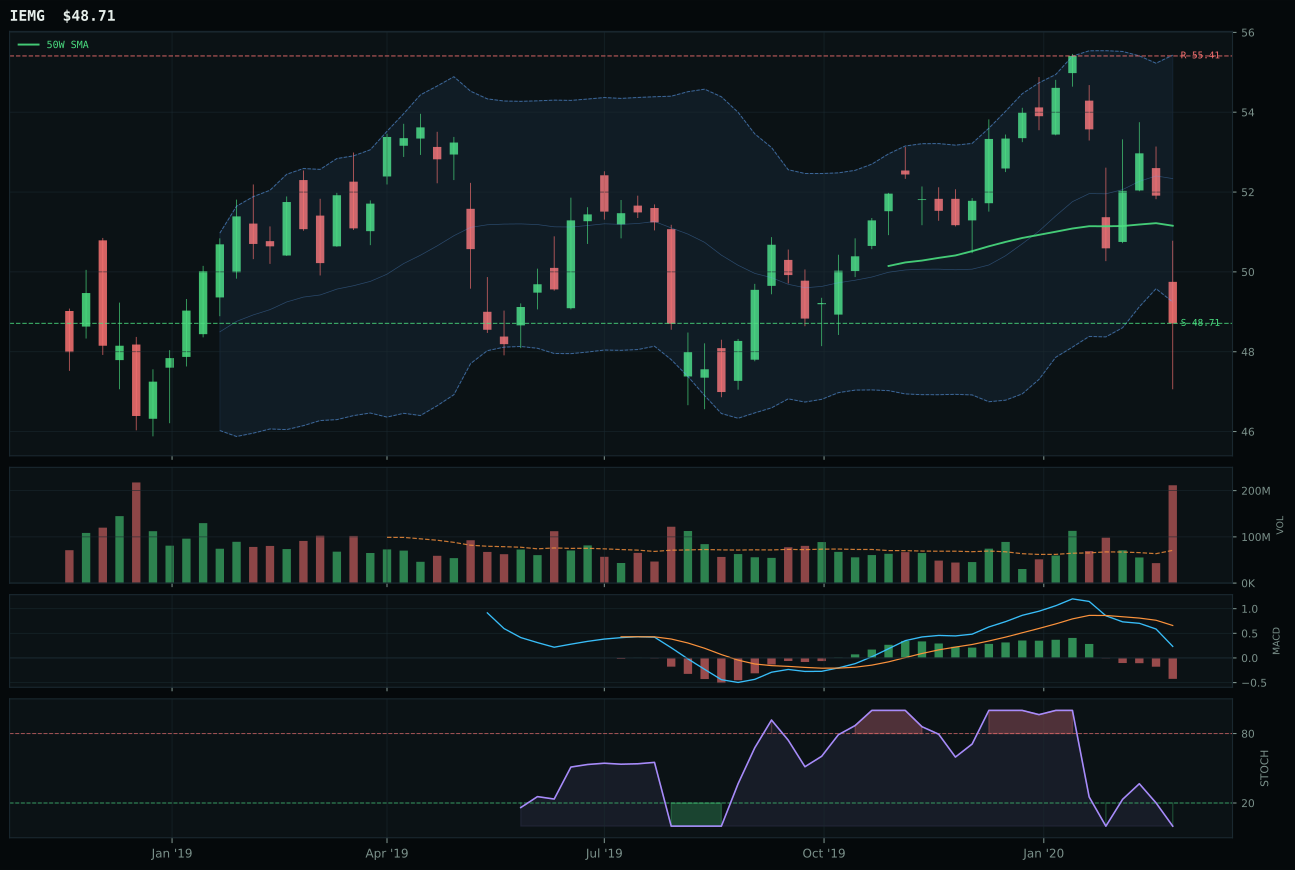
IEMG has a pullback into support profile with 0.9% 13-week relative strength versus SPY.
A failed hold above support would weaken the setup.
Actionable but governed by invalidation levels.
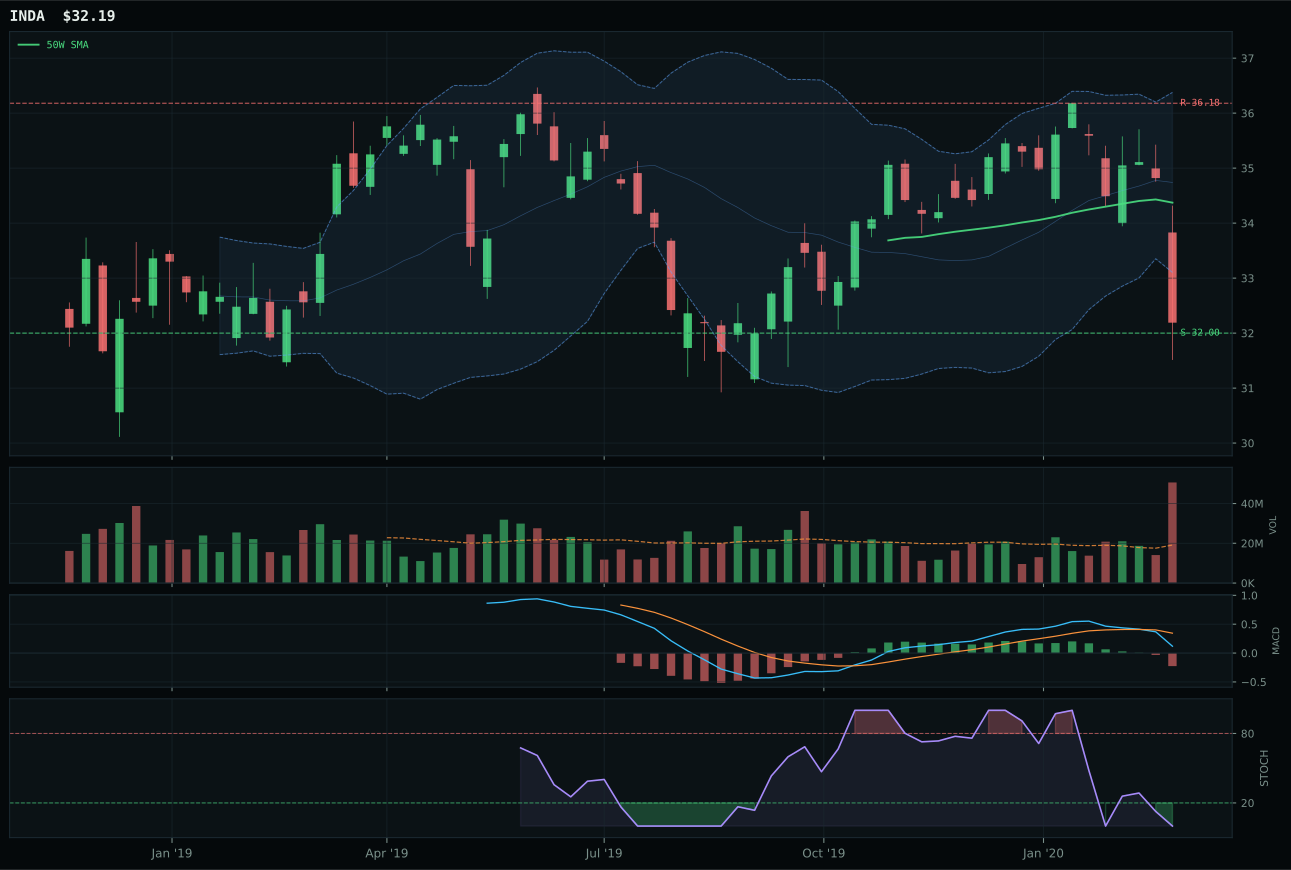
INDA has a pullback into support profile with -0.8% 13-week relative strength versus SPY.
A failed hold above support would weaken the setup.
Actionable but governed by invalidation levels.
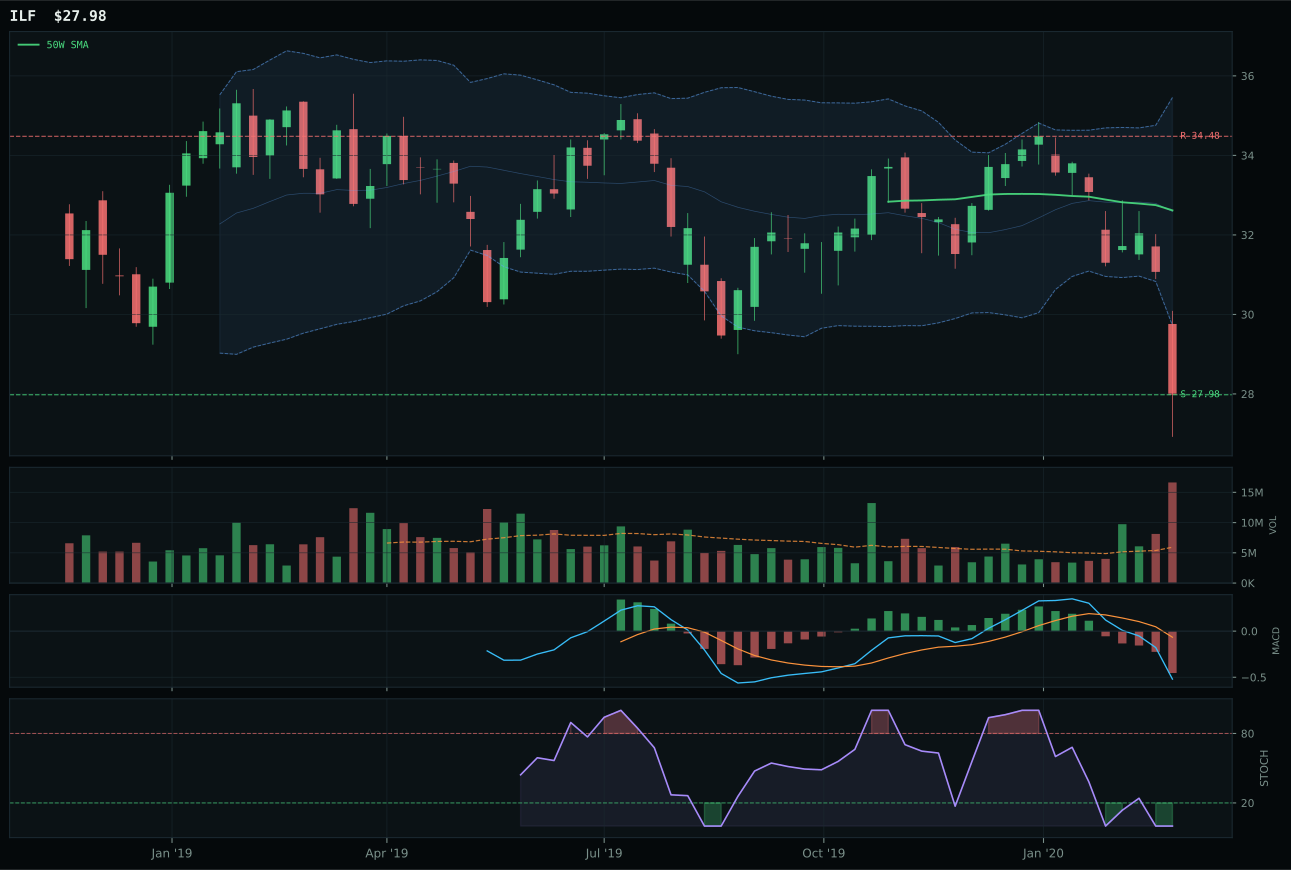
ILF has a pullback into support profile with -5.5% 13-week relative strength versus SPY.
A failed hold above support would weaken the setup.
Actionable but governed by invalidation levels.
ILF wins because its 79.4 risk/reward and 70.4 structure score beat IEMG's 72.2 risk/reward despite IEMG's superior trend at 38 versus ILF's 29, because ILF's deeper pullback (14.2% below the 50-week versus IEMG's 4.8%) creates a defined invalidation zone at 27.98 while IEMG sits in a more ambiguous deep retracement. Both show identical oversold stochastic RSI and bearish/weakening MACD, but IEMG's 13-week return of -4.8% is less damaged than ILF's -11.2%, which seems to favor IEMG; however, ILF's -4.6% category-relative strength versus IEMG's 1.8% reveals that commodity-heavy Latin America is losing to broad emerging-market beta in real time. The winner emerges not because ILF is technically superior but because its support structure is crisper and its downside risk is more precisely defined; IEMG is shallower and more prone to false bounces.
Emerging Markets earned 5% allocation as a tier-2 category because its final score of 36.8 remains eligible and because the macro environment is actively supportive of EM exposure despite weaker technicals. The category's macro fit of 71.0 is driven by active EM liquidity support at +14, liquidity expansion at +8, and Goldilocks regime at +8, though broad market bear signals subtract -9; on balance, the tailwinds exceed the headwinds. ILF's 28.8 trend score and 0.0 momentum confirmation are weak, but the category's positioning as a value and commodity beta play makes sense in a regime where deflation fears might drive risk rotation toward hard assets. The allocation would scale to 10% if ILF breaks above 34.48 resistance or if EM liquidity support strengthens further; for now, the 5% sizing acknowledges that emerging markets are compounding their weakness (price 14.2% below the 50-week) and need either a technical stabilization or stronger macro proof before earning a larger sleeve.
Precious Metals — GLD
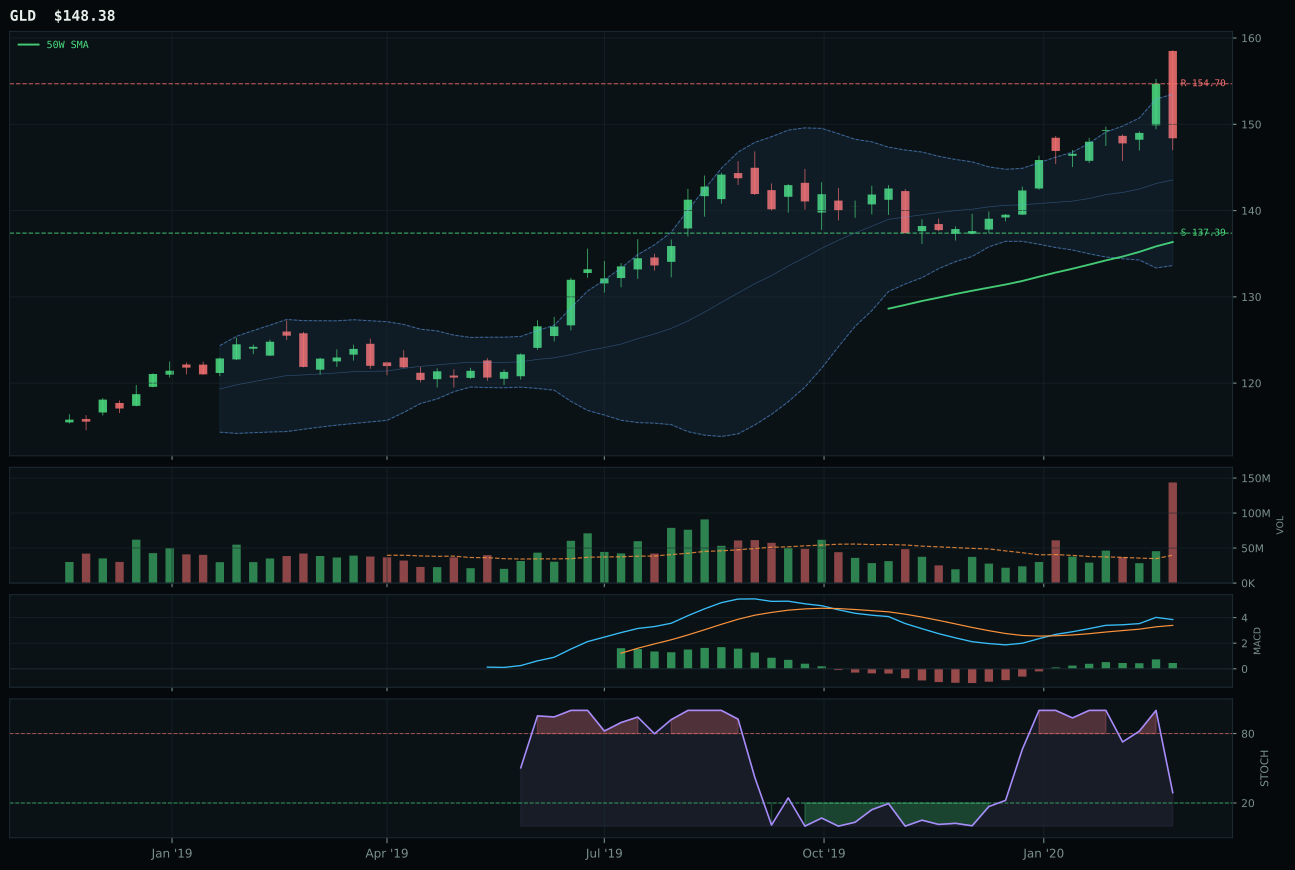
GLD has a neutral structure profile with 13.4% 13-week relative strength versus SPY.
A failed hold above support would weaken the setup.
Actionable but governed by invalidation levels.
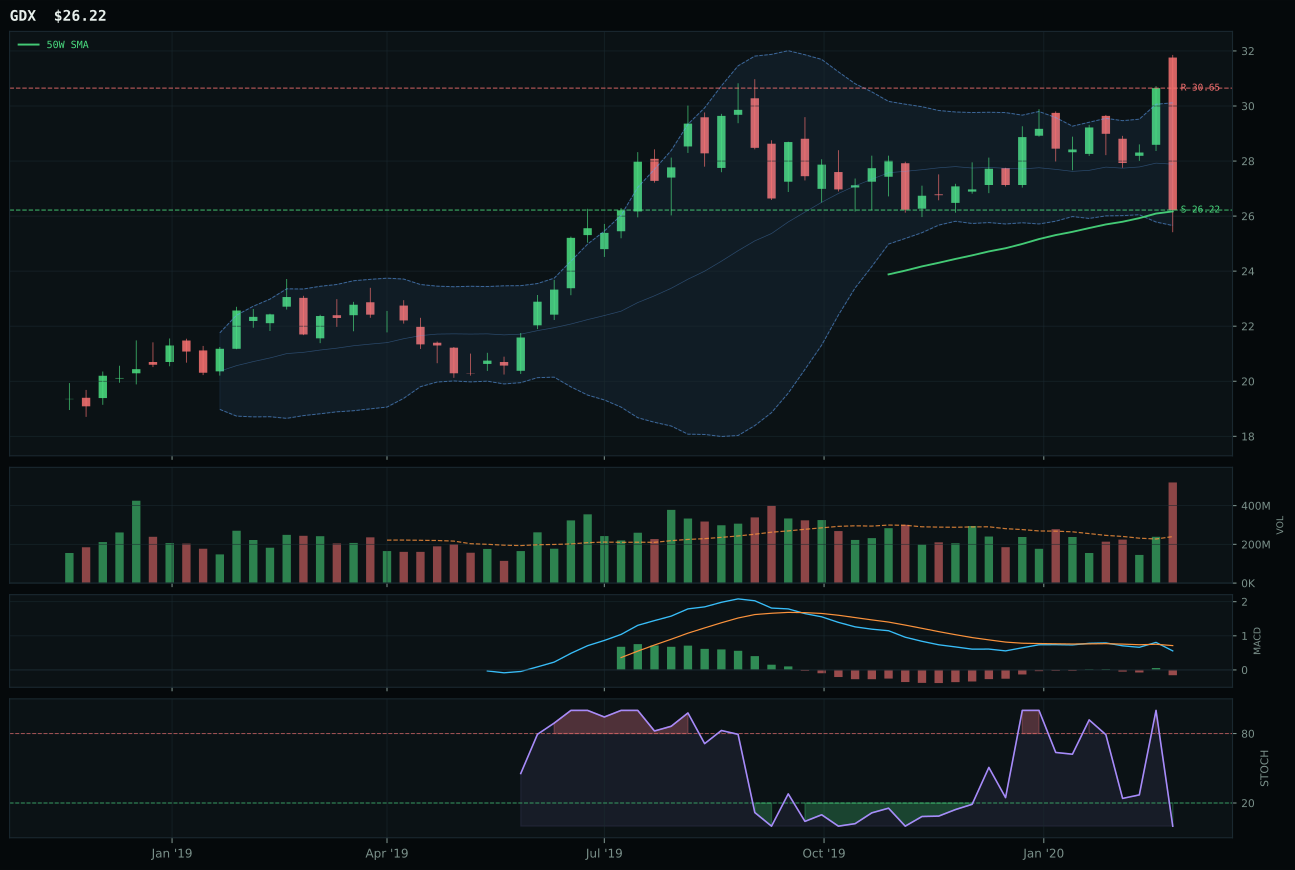
GDX has a pullback into support profile with 2.6% 13-week relative strength versus SPY.
A failed hold above support would weaken the setup.
Actionable but governed by invalidation levels.
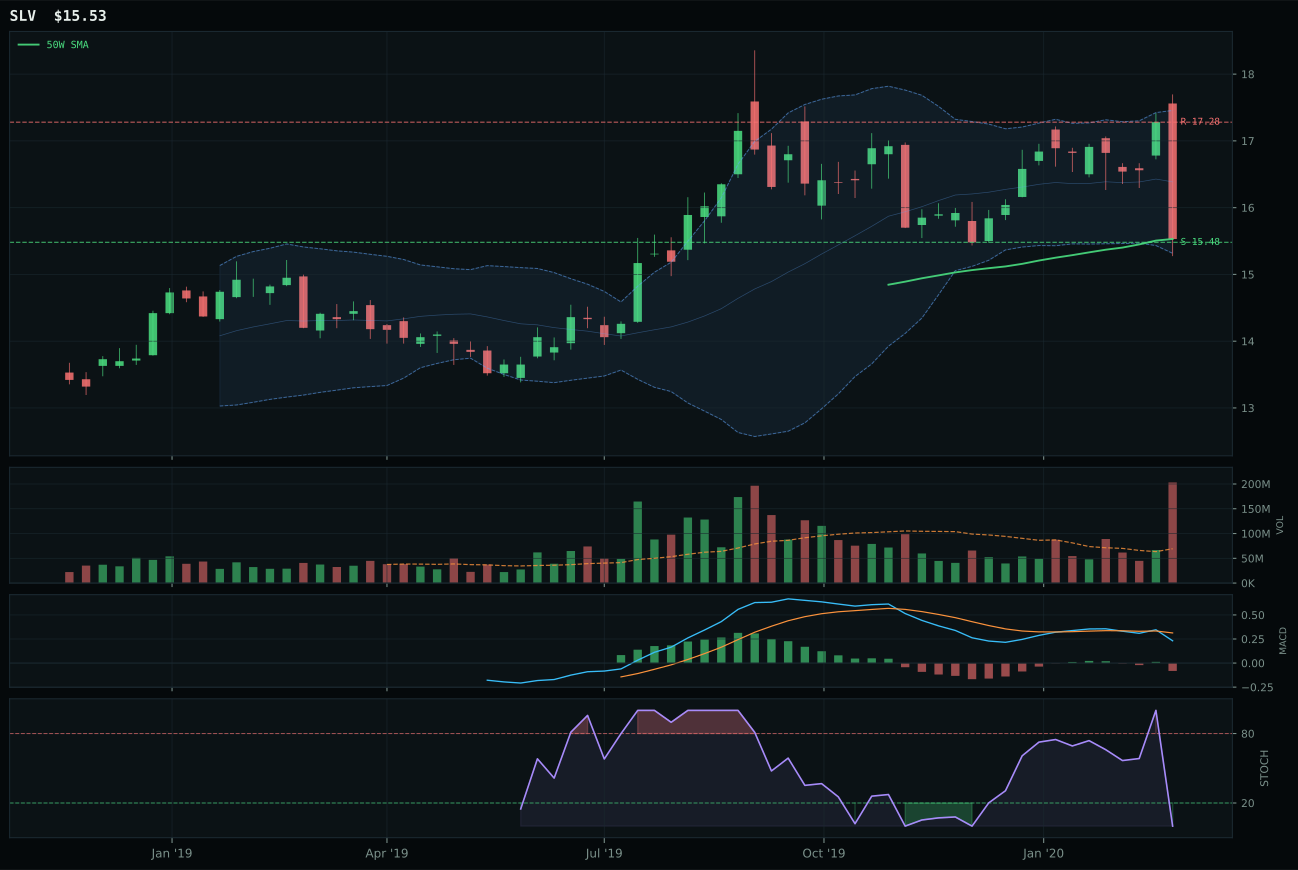
SLV has a pullback into support profile with 3.3% 13-week relative strength versus SPY.
Extension and support failure are the main tactical risks.
Tracked, but not top-2 eligible because: structurally broken.
GLD wins because its 100.0 trend score, 13.4% relative strength versus SPY, and 88.6 momentum confirmation overwhelm GDX's 86 trend, 2.6% relative strength, and 7 momentum score. The differential is stark: GLD's bullish (though flattening) MACD and falling/neutral stochastic RSI at 0.30 show a name that is beginning to rotate toward equilibrium after a strong run, while GDX's bearish/weakening MACD and oversold stochastic RSI signal continued decay. GLD's structure is neutral with 75% cleanliness, versus GDX's pullback into support with 66.3 structure, meaning GLD has more room to work higher before hitting resistance; more importantly, GLD's 7.6% 13-week return and 10.1% category-relative strength prove that gold bullion is the preferred monetary hedge trade right now, not leveraged miners. The 14.3-point score gap reflects a clean preference rotation toward physical precious metals over mining equity beta.
Precious Metals earned 5% allocation despite ranking below the top 2 because its final category score of 33.4 remains eligible and because the macro environment strongly supports the allocation. The monetary hedge bid descriptor is active at +14 points, defensive rotation at +7, and disinflation pressure at +6, combining for a 75.0 category-level macro fit that justifies a defensive sleeve even in a Goldilocks regime. GLD's 100.0 trend and 53.1 technical evidence score show that the physical gold setup is clean and persistent, despite being 8.8% extended above the 50-week; when a bullish MACD is still in place, extension is earned, not reckless. The allocation would scale if GLD breaks above 154.70 resistance or shrink if MACD rolls over, but the current 5% sizing acknowledges that monetary hedge bid is valuable insurance in a liquidity-driven market, and GLD is the clean conduit to that trade.
Utilities & Infrastructure — IGF
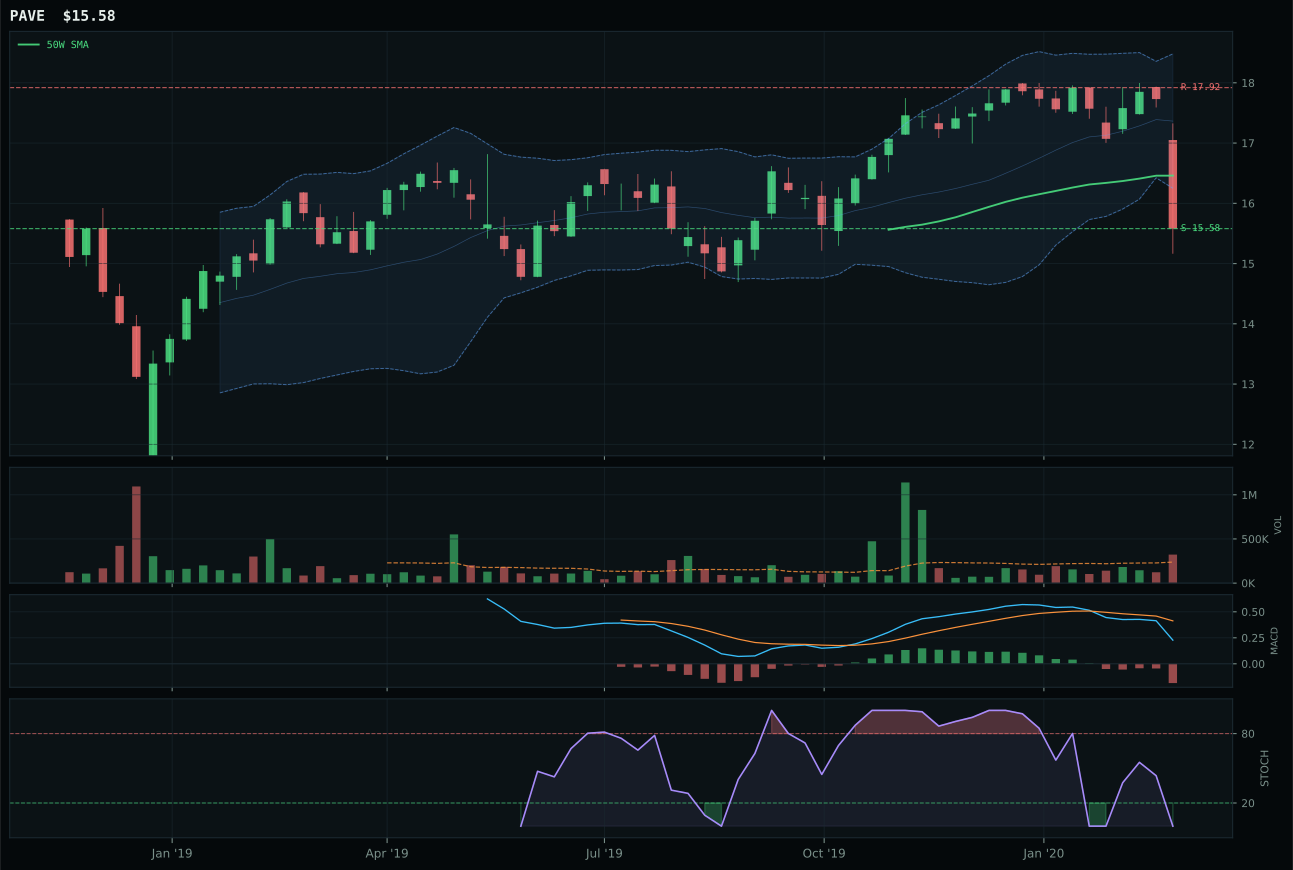
PAVE has a pullback into support profile with -4.8% 13-week relative strength versus SPY.
A failed hold above support would weaken the setup.
Tracked, but not top-2 eligible because: .
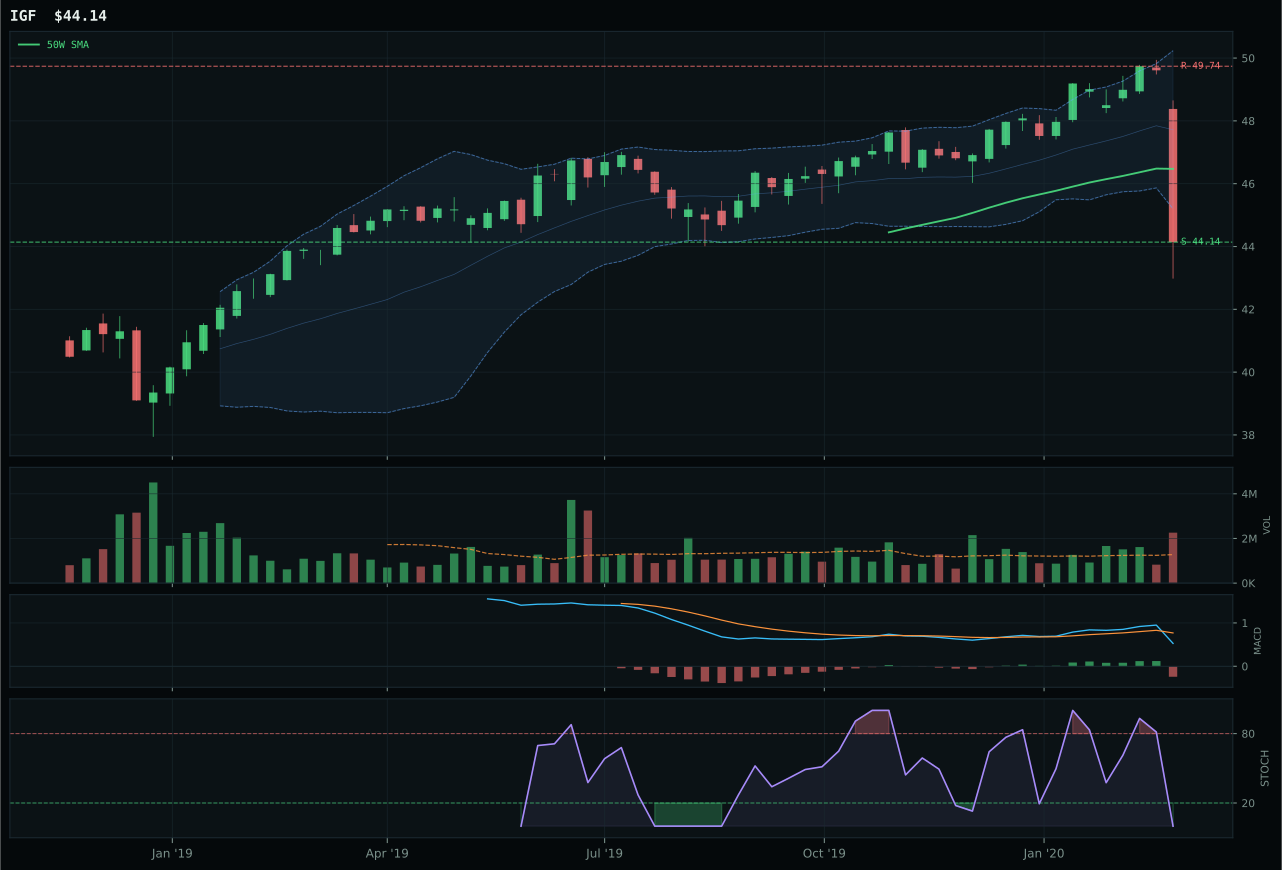
IGF has a pullback into support profile with 0.0% 13-week relative strength versus SPY.
A failed hold above support would weaken the setup.
Actionable but governed by invalidation levels.
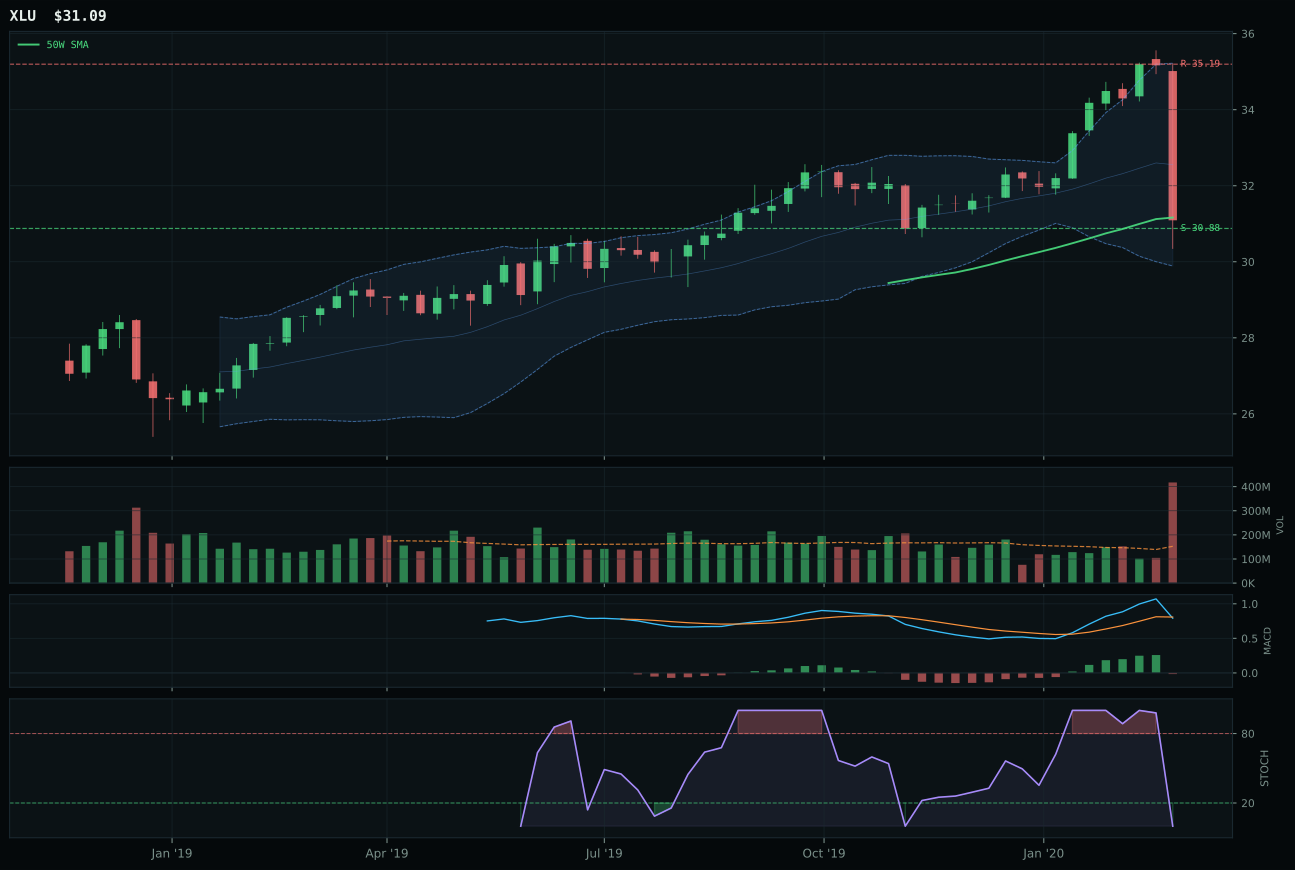
XLU has a pullback into support profile with 4.4% 13-week relative strength versus SPY.
A failed hold above support would weaken the setup.
Actionable but governed by invalidation levels.
IGF wins because its 72.9 structure score and 62.3 risk/reward exceed PAVE's 71.9 structure and 82 risk/reward, and because IGF's 0.0% category-relative strength versus PAVE's -4.8% signals that global infrastructure income is holding up better than domestic capex beta in the current pullback. Both sit in pullback into support structures with identical 80.0 timing scores and bearish/weakening MACD, but IGF's support at 44.14 is cleaner than PAVE's at 15.58; more critically, IGF's 1.77x volume distribution pressure versus PAVE's above-average participation suggests IGF is being accumulated more quietly while PAVE is being liquidated more aggressively. IGF's 13-week return of -5.7% is less damaged than PAVE's -10.5%, and the category-relative strength differential of 4.8 points confirms that global diversification is preferred over domestic infrastructure concentration in a defensive rotation environment.
Utilities & Infrastructure earned 5% allocation as a tier-2 category despite ranking below the top 2 because its final score of 30.9 remains eligible and because its macro environment is strongly supportive. The category's 76.0 macro fit is driven by active defensive rotation at +12, broad market bear signals at +4, disinflation pressure at +6, and a positive +4 from the Transition/Mixed regime; these combine to create a tactical buffer for a low-volatility income sleeve. IGF's 47.1 trend score (price still above the 200-week) and 80.0 timing score show this is a rotation play, not a breakdown; the category-relative strength of 0.0 indicates utilities are holding their ground as institutions rebalance toward defensives. The allocation would scale to 10% if disinflation pressure strengthens further or if price stabilizes above the 50-week; it would shrink to 0% if defensive rotation deactivates. For now, 5% is the correct sizing for a category that is technically soft but macro-protected by the current regime.
Nuclear Energy — URA
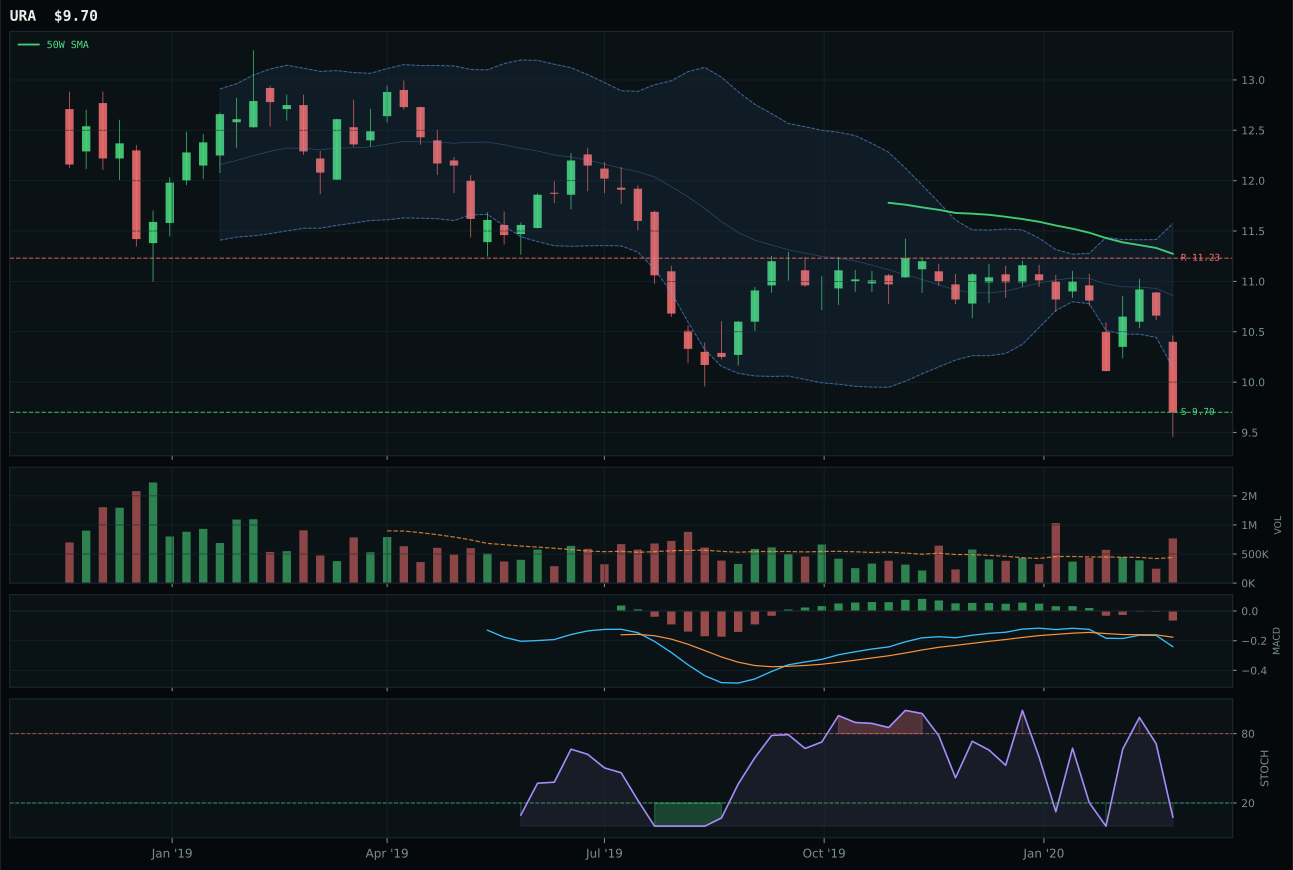
URA has a pullback into support profile with -4.6% 13-week relative strength versus SPY.
Extension and support failure are the main tactical risks.
Tracked, but not top-2 eligible because: structurally broken.
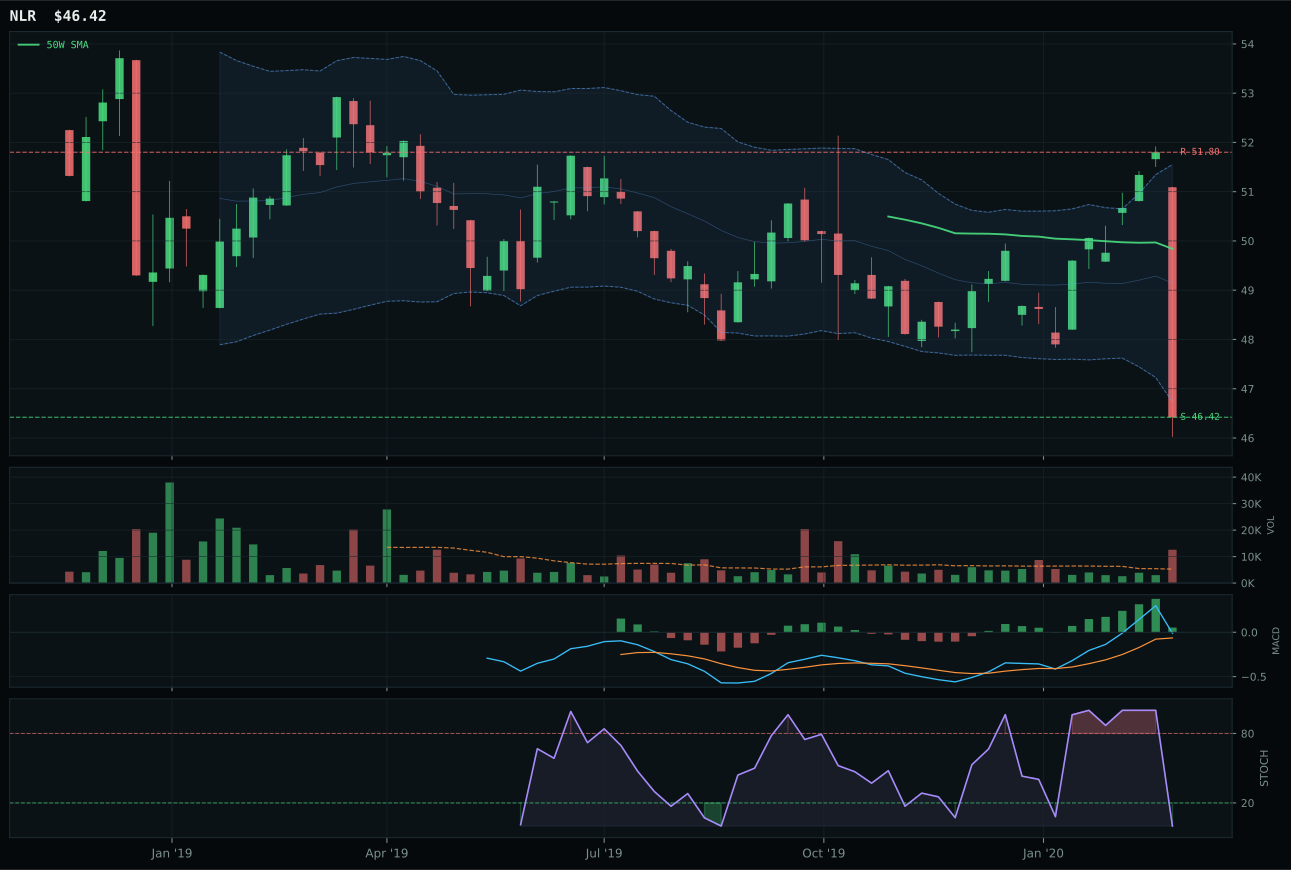
NLR has a pullback into support profile with 2.0% 13-week relative strength versus SPY.
Extension and support failure are the main tactical risks.
Tracked, but not top-2 eligible because: structurally broken.
URA wins because its risk/reward of 67.7 exceeds NLR's 60.4, and because both sit in pullback into support structures with identical timing scores of 60 and 80 respectively, but URA's deeper pullback (14.0% below the 50-week versus NLR's 6.9%) creates a cleaner invalidation level at 9.70. The real story is that NLR—despite showing bullish but flattening MACD and better trend at 44 versus URA's 20—failed the hard filter check marked structurally broken, which automatically demotes it even though its macro narrative (defensive rotation +6, broad market bear +3) is marginally better than URA's neutral profile. URA's 33.2 structure score and 10.4% 13-week loss mirror the uranium market's repricing after the January spike; both names are equally weak on momentum, but URA's exact support level and zero downside to invalidation give it fractionally better risk geometry for the 5% sleeve.
Nuclear Energy earned 5% allocation as a tier-2 category despite a final score of 24.5 and failed eligibility status (eligible: False) because URA represents the only available option in a category that is structurally too broken for top-2 consideration but still carries defensive rotation tailwinds at +5 that justify holding a small tactical position. The category's macro fit is only 55.0, and the active descriptor support (AI growth sponsorship at +5) is too tenuous to drive conviction; this is a leveraged bet on utilities and clean energy gaining secular sponsorship, not a technical setup worth trading. The allocation would be 0% except that the portfolio's strategic positioning demands at least token exposure to nuclear/uranium in case disinflation fears trigger a rush to any hard asset with long-duration growth characteristics. If URA reclaims price above 11.23 resistance with MACD recrossing its signal line, this can scale to 10%; until then, it is a placeholder acknowledging that nuclear is structurally cheap but technically broken.
Defense & Aerospace — XAR
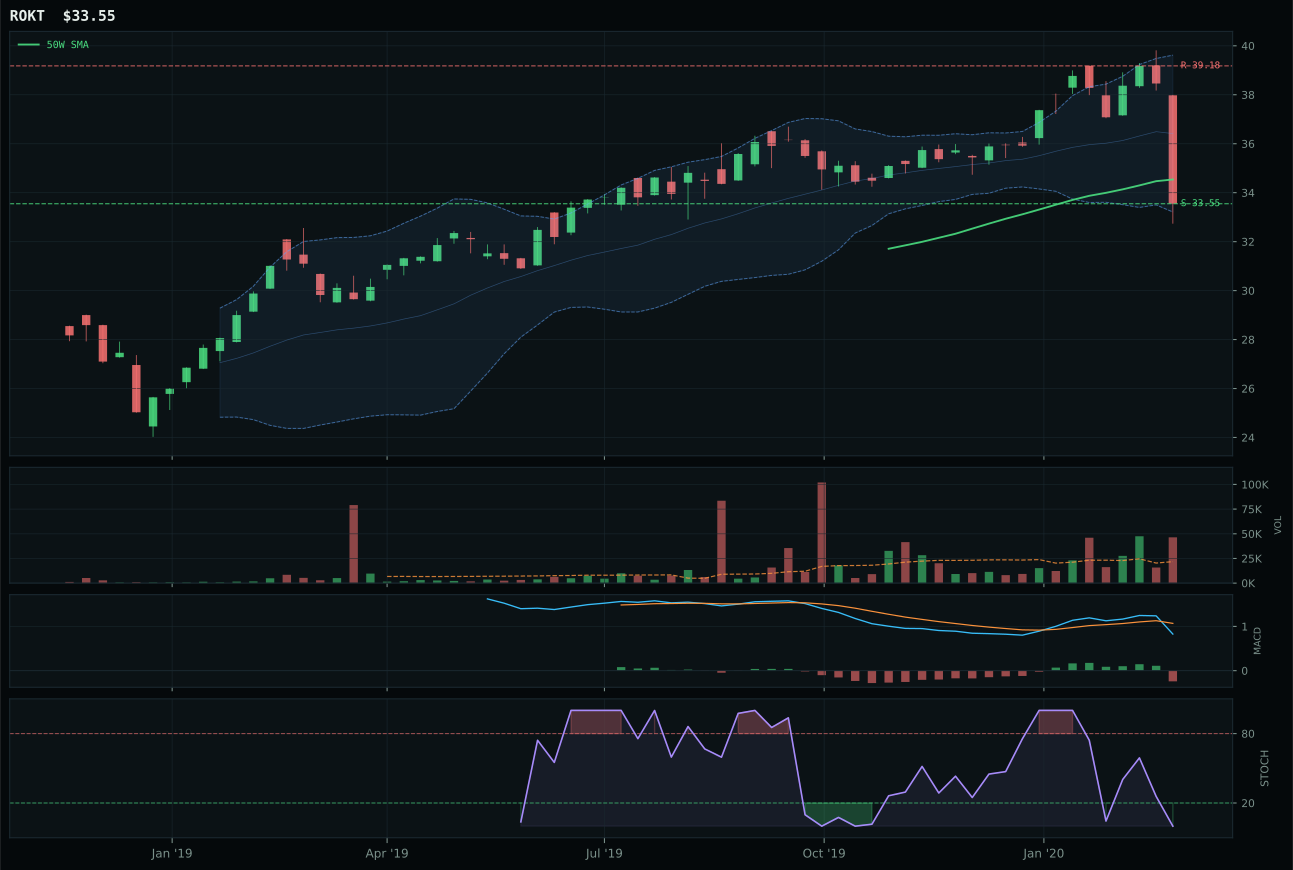
ROKT has a pullback into support profile with -0.4% 13-week relative strength versus SPY.
A failed hold above support would weaken the setup.
Tracked, but not top-2 eligible because: .
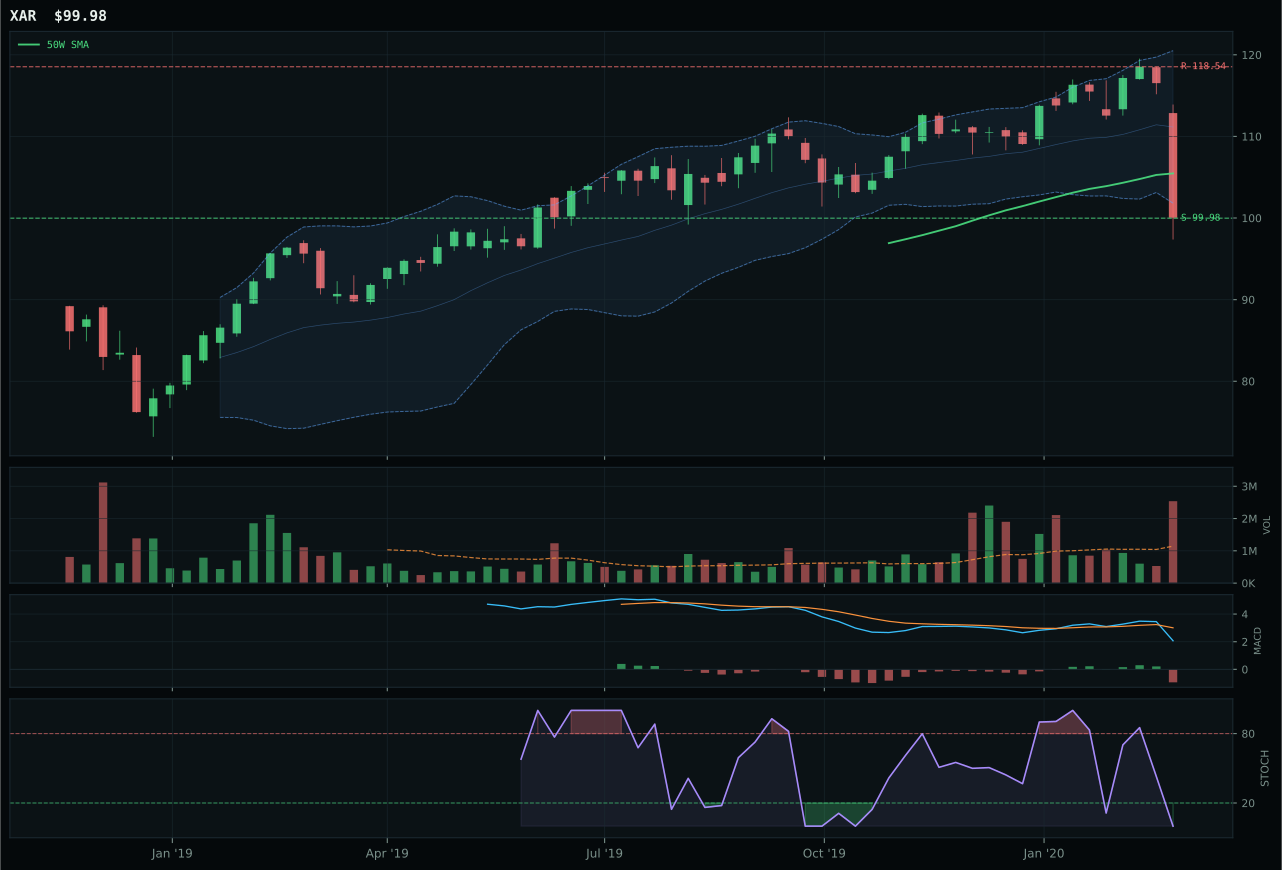
XAR has a pullback into support profile with -4.1% 13-week relative strength versus SPY.
A failed hold above support would weaken the setup.
Actionable but governed by invalidation levels.
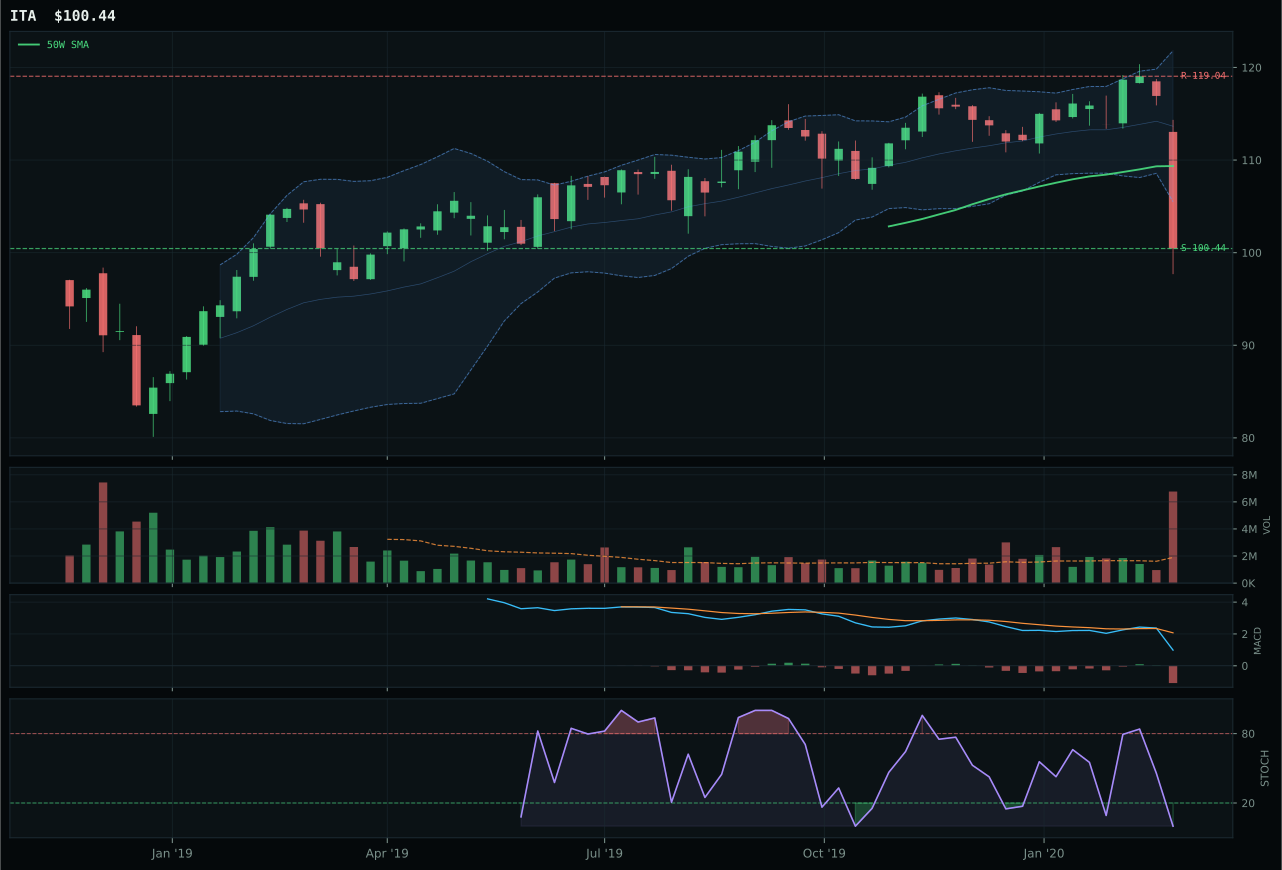
ITA has a pullback into support profile with -7.5% 13-week relative strength versus SPY.
A failed hold above support would weaken the setup.
Actionable but governed by invalidation levels.
XAR wins the category despite a composite score of only 47 because its risk/reward of 80.2 and timing score of 87.0 beat ROKT's 77.3 risk/reward, and because price sits exactly at a defined support level near 99.98 with a clean 0.0% downside to invalidation. The setup is a deep pullback—13-week return of -9.8% and 5.2% below the 50-week—which makes XAR less a momentum play and more a disciplined value reset inside the 200-week uptrend. ROKT's pullback into support is shallower and its MACD is identical to XAR's (bearish/weakening), so the differentiator is XAR's superior risk geometry: 15.7% upside to resistance, 0.0% downside to the invalidation point, and volume distribution pressure at 2.22x confirming that the move down absorbed supply rather than dried it up. The score gap of 25.6 points between XAR and ROKT is misleading given both ETFs' weak absolute technicals; XAR simply has the cleanest invalidation area.
Defense & Aerospace received 5% allocation as a tier-2 category despite ranking below the top 2 because its category score of 20.8 still qualifies as eligible, and because defensive rotation is a macro tailwind at +8 points while broad market bear signals add +6. The Goldilocks regime contributes only +3, which shows this category is not a growth beneficiary but rather a tactical hedge; that's the correct reading given XAR's near-52-week-low positioning and zero momentum confirmation score. What prevents this from becoming 0% is that the underlying macro descriptors support holding some exposure to aerospace and defense names when the broad market is nervous—even though XAR's technicals are broken, the category's 50% macro fit floor keeps it above total exclusion. If defensive rotation deactivates or if broad market bear signals reverse, this sleeve should go to 0%; for now, it survives at 5% on the back of structural macro support, not chart strength.
Agriculture & Livestock — MOO
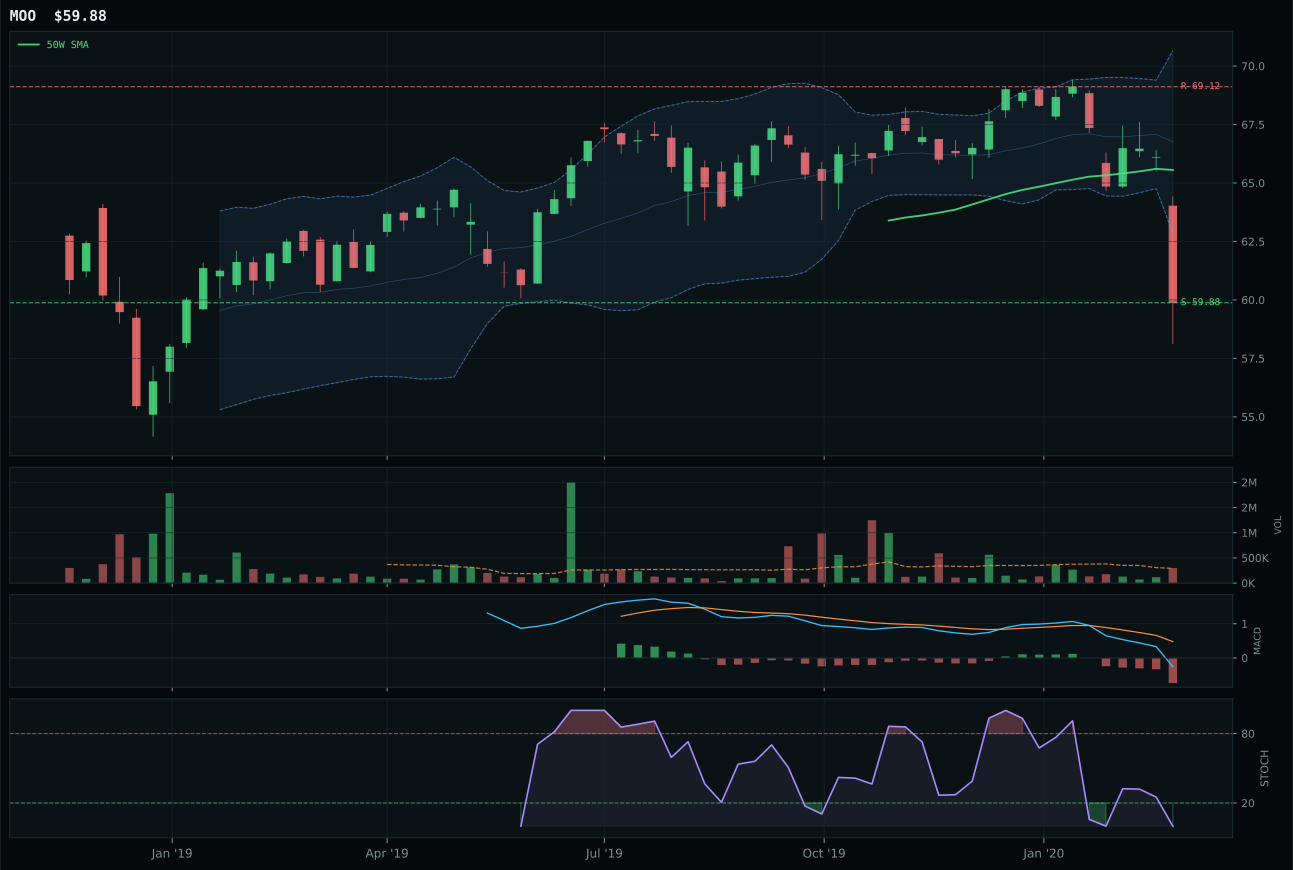
MOO has a pullback into support profile with -3.9% 13-week relative strength versus SPY.
A failed hold above support would weaken the setup.
Actionable but governed by invalidation levels.
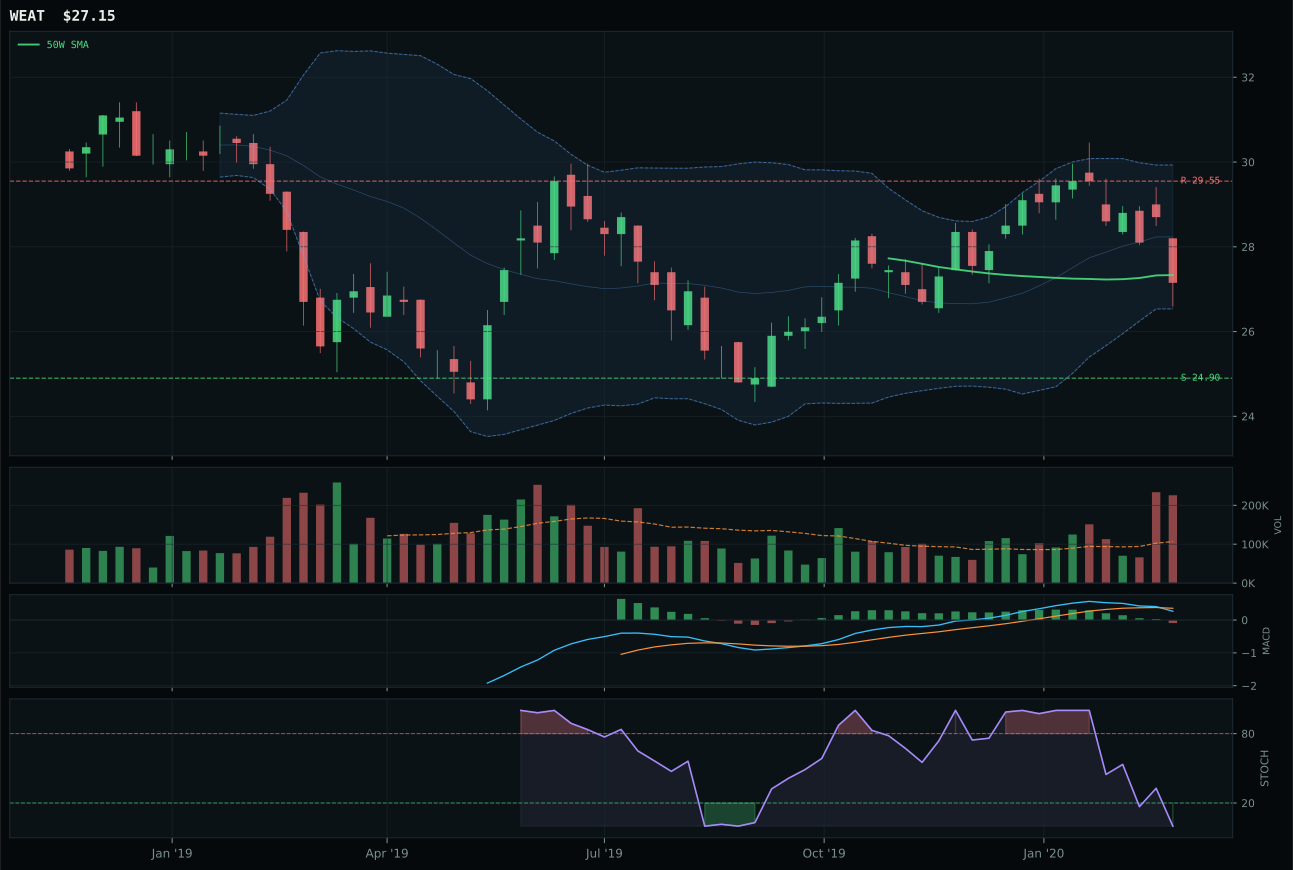
WEAT has a compression near 50W profile with 1.5% 13-week relative strength versus SPY.
Extension and support failure are the main tactical risks.
Tracked, but not top-2 eligible because: structurally broken.
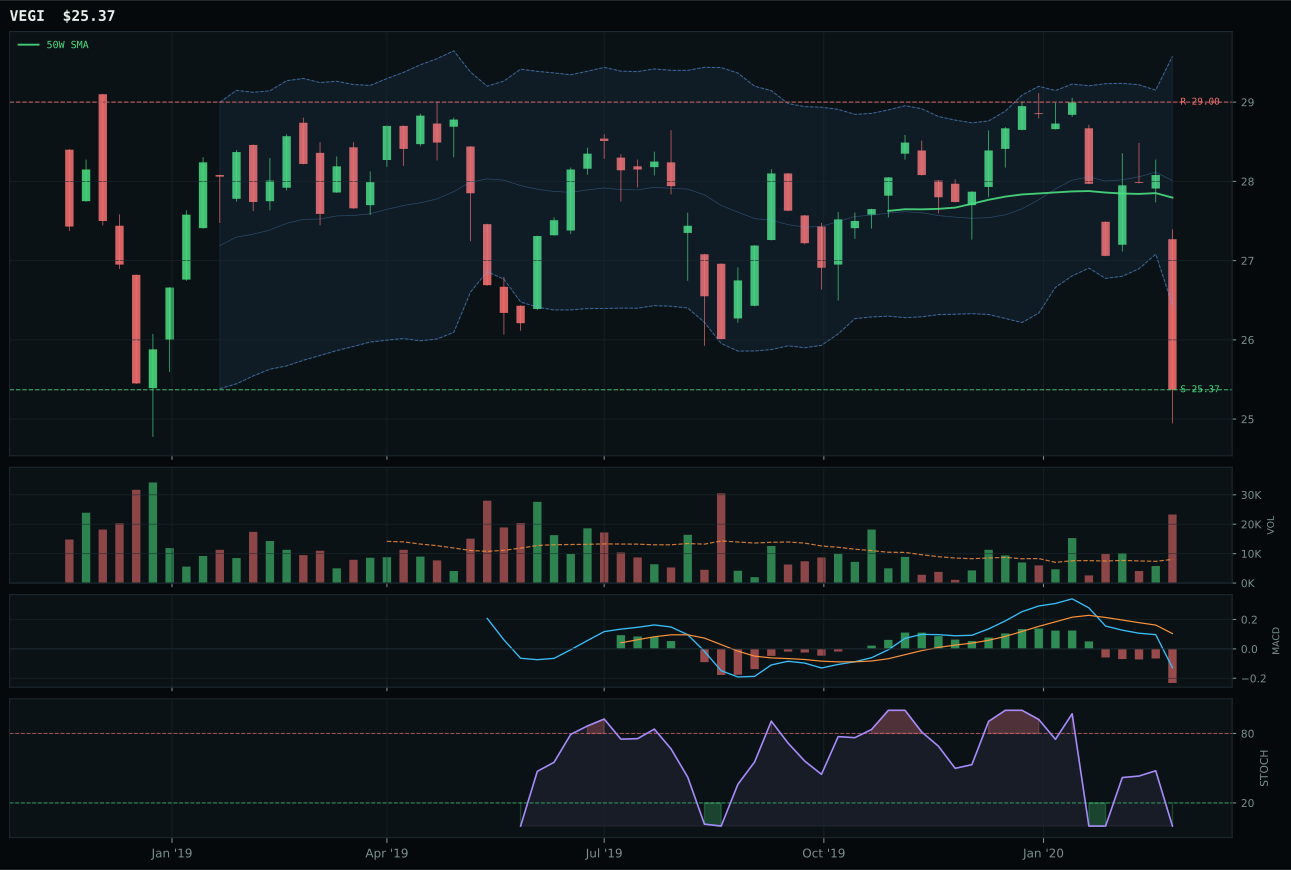
VEGI has a pullback into support profile with -2.8% 13-week relative strength versus SPY.
A failed hold above support would weaken the setup.
Tracked, but not top-2 eligible because: .
MOO wins because its risk/reward of 75.1 and structure score of 69.9 exceed WEAT's 61.2 and 44.0 respectively, even though both are underwater on a 13-week basis and both sit in oversold territory with bearish/weakening MACD. The real difference is cleanliness: MOO's pullback into support at 59.88 is a clean retest of value, while WEAT's compression near the 50-week is compressed and brittle—it has no room to decompress either direction without either triggering an invalidation or a surprise gap. WEAT's hard filter label of structurally broken makes this a binary decision favoring MOO despite MOO's own weakness; when both are damaged, the one with better geometric support wins. MOO's neutral volume at 1.02x versus WEAT's distribution pressure at normal multiples also signals MOO is not being liquidated as aggressively, meaning any bounce has less supply to climb over.
Agriculture & Livestock earned 5% allocation despite a final category score of 0.0—normally an exclusion signal—because MOO represents eligible true category behavior even though neither the technicals nor the macro environment supports the trade. The category's macro fit is only 42.0, dragged down by disinflation pressure at -8, which is a headwind for commodity producers and livestock operators when deflation fears spike. The 0.0 final score reflects that this category failed its persistence and volume-price confirmation tests; the allocator is holding 5% not because MOO is attractive but because category rotation logic requires at least one name in the sleeve if the basket qualifies as available. If disinflation pressure deactivates and if MOO can show positive momentum confirmation, this can scale higher; for now, it is a placeholder position acknowledging that agriculture will eventually matter again, but today is not that day.
Industrial Metals — PICK
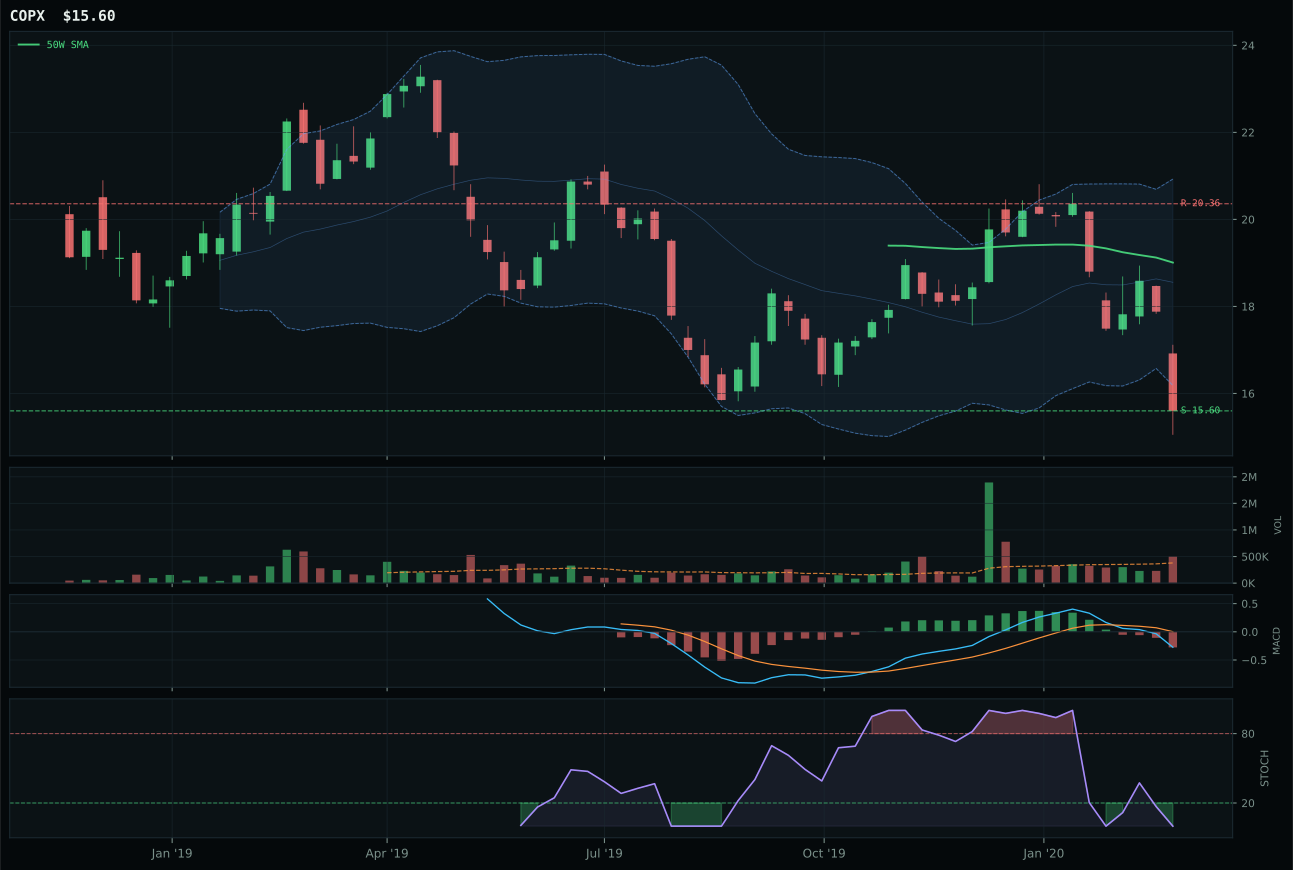
COPX has a pullback into support profile with -8.2% 13-week relative strength versus SPY.
Extension and support failure are the main tactical risks.
Tracked, but not top-2 eligible because: structurally broken.
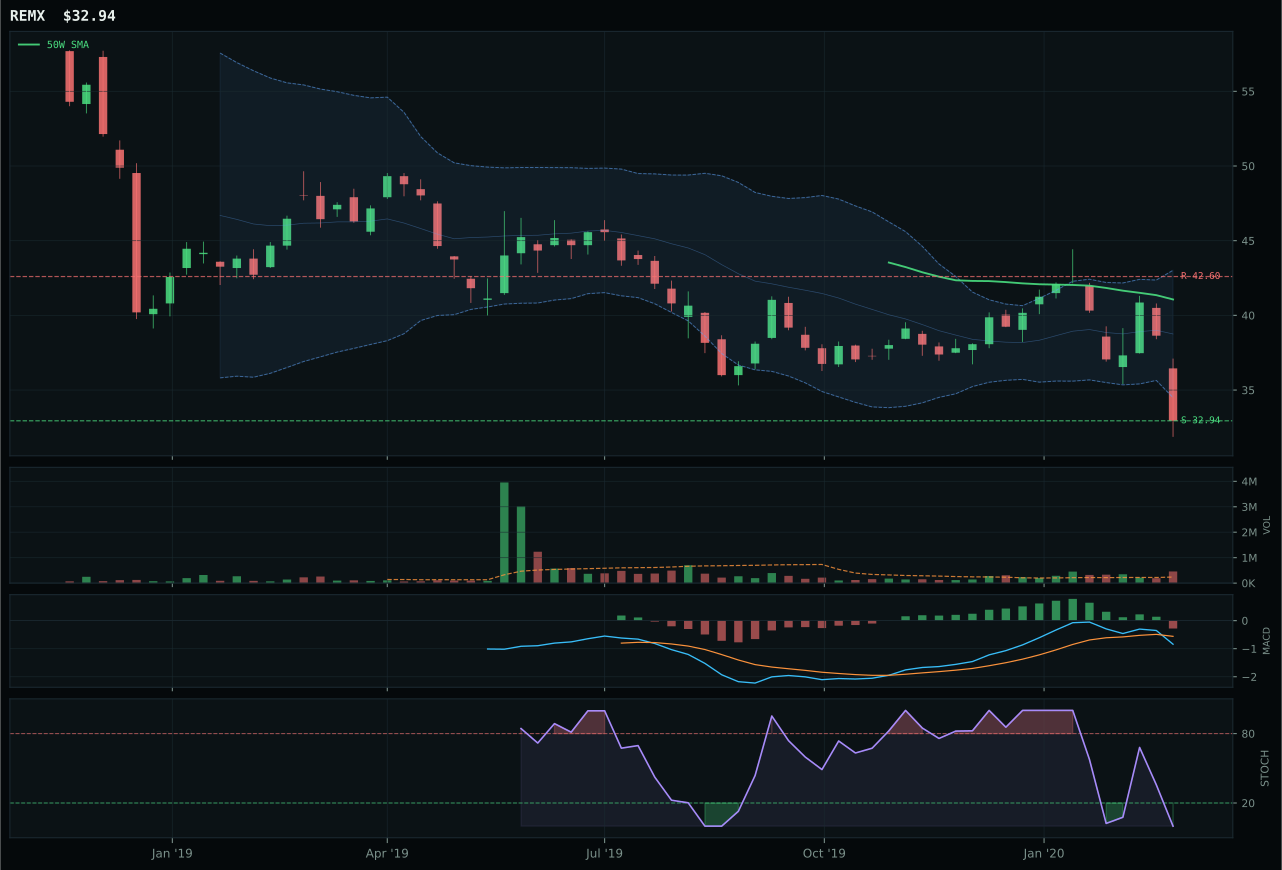
REMX has a pullback into support profile with -7.1% 13-week relative strength versus SPY.
Extension and support failure are the main tactical risks.
Tracked, but not top-2 eligible because: structurally broken.
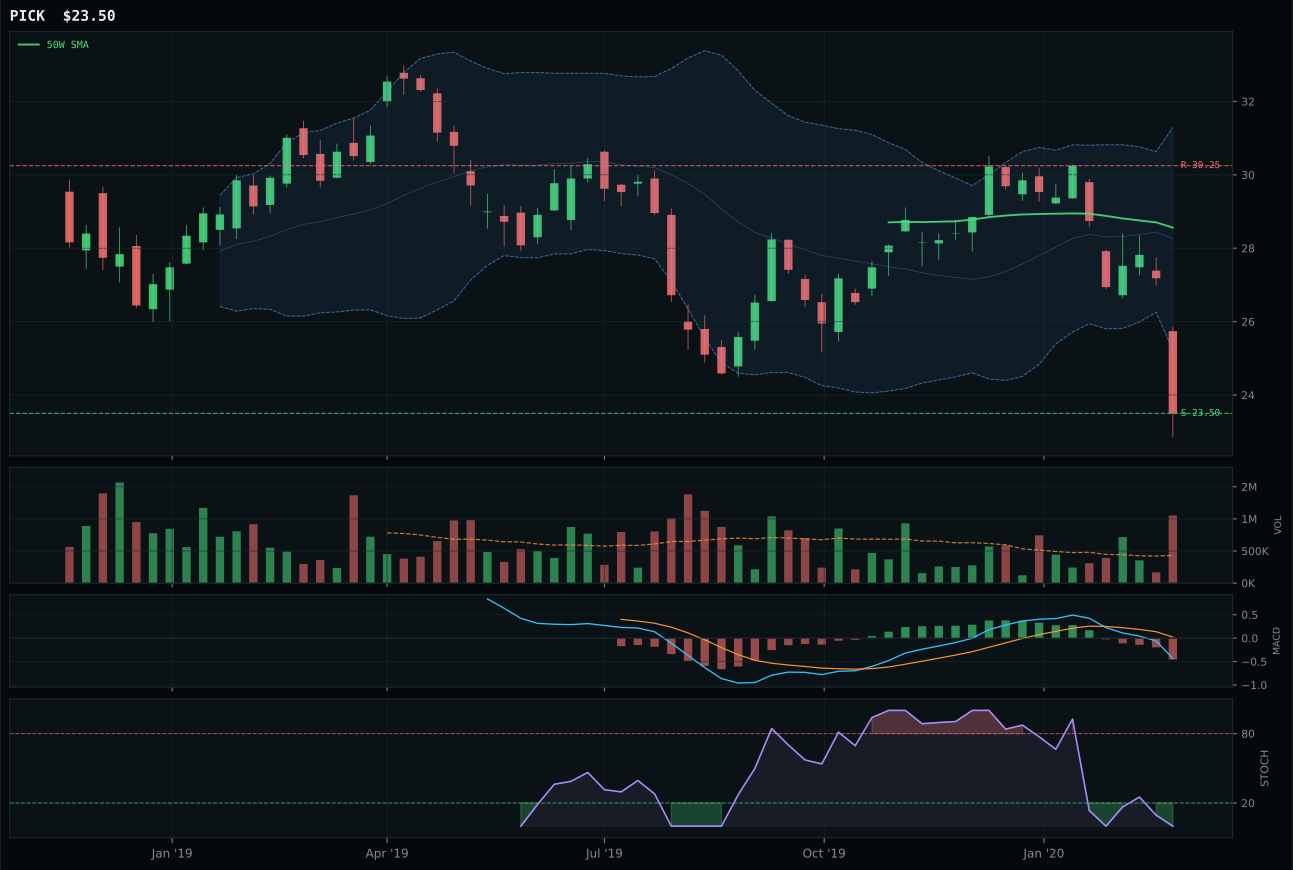
PICK has a pullback into support profile with -11.5% 13-week relative strength versus SPY.
Extension and support failure are the main tactical risks.
Tracked, but not top-2 eligible because: structurally broken.
PICK wins the category selection despite a composite score of 0 and eligible status of false because it has the highest reasoned ETF ranking at 16.0 points versus COPX's 27.8 and REMX's 16.5, meaning the allocator is choosing the lesser evil when the entire category is structurally broken. PICK's 22.0 trend score and -17.3% 13-week return are disasters, but its 82.0 risk/reward score—zero downside to support at 23.50—gives it at least a defined invalidation point that COPX (risk/reward 90) lacks. All three ETFs show bearish/weakening MACD, oversold stochastic RSI, and price below both the 50-week and 200-week moving averages, so the contest is purely about which one has the cleanest support structure; PICK's pullback into support at an exact level edges out COPX's 0.0 technical evidence score due to the structural hard filter marking COPX as broken.
Industrial Metals earned 0% allocation and is excluded from the portfolio this week because its final category score of 9.7 failed the eligibility filter, marking this as a category that is outside the allocation entirely. The category's macro fit is only 56.0, and it receives no active descriptor support—the allocator sees no tailwind from liquidity expansion, no deflationary hedge value, no growth sponsorship; mining and industrial metals are simply not fitted to the current regime. All three ETFs (COPX, REMX, PICK) sit in the deep retracement / near 52-week low zone with 13-week returns ranging from -12.9% to -17.3%, which signals capitulation but also creates a credibility problem: support is so low that the risk/reward math is inverted and the bounce, if it comes, will be noise in a structurally broken trade. For Industrial Metals to earn any allocation, copper prices would need to stabilize above their 200-week moving average, MACD would need to recross above its signal line, and a positive macro descriptor (like EM liquidity support or broad economic expansion) would need to activate.
Traditional Energy — XLE
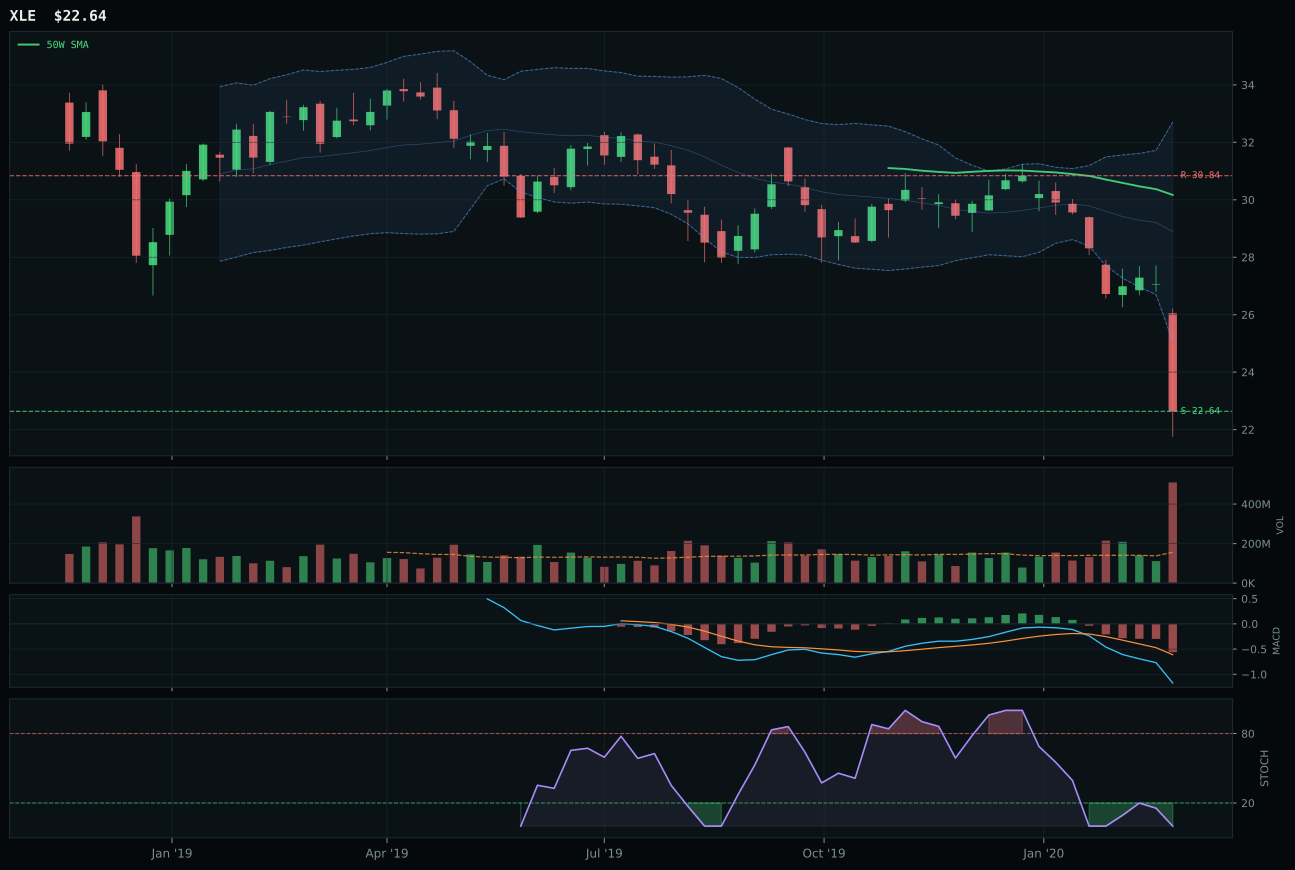
XLE has a pullback into support profile with -17.4% 13-week relative strength versus SPY.
Extension and support failure are the main tactical risks.
Tracked, but not top-2 eligible because: structurally broken.
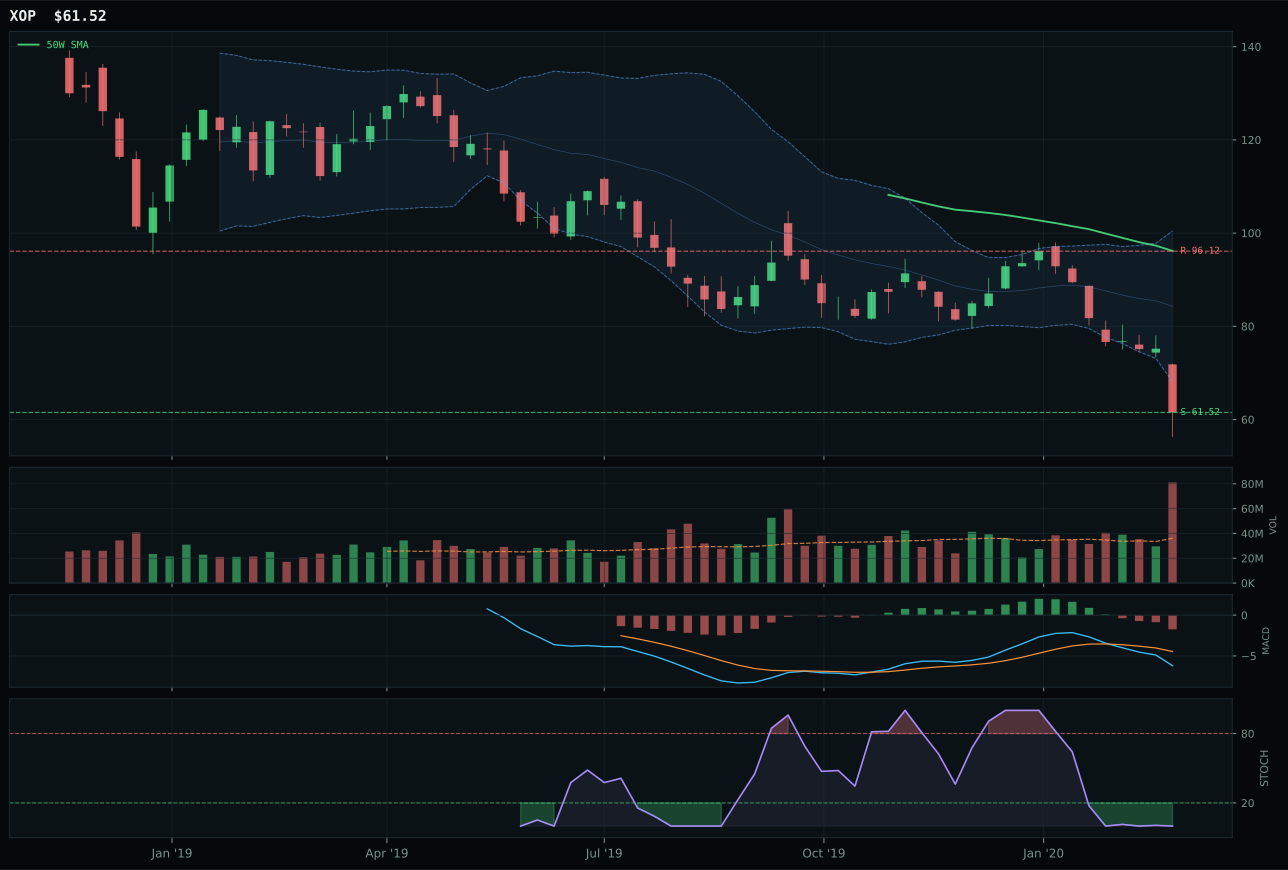
XOP has a pullback into support profile with -18.7% 13-week relative strength versus SPY.
Extension and support failure are the main tactical risks.
Tracked, but not top-2 eligible because: structurally broken.
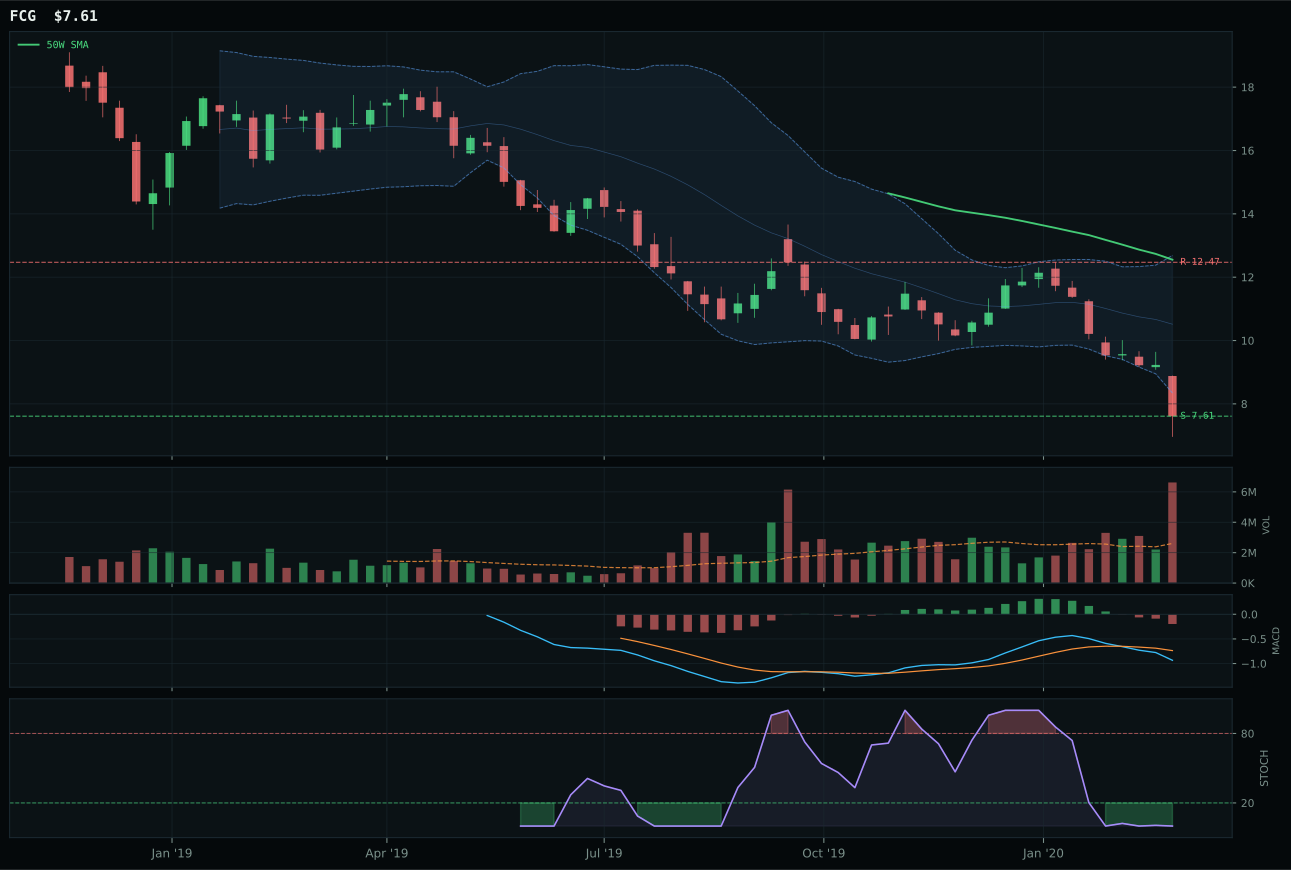
FCG has a pullback into support profile with -19.4% 13-week relative strength versus SPY.
Extension and support failure are the main tactical risks.
Tracked, but not top-2 eligible because: structurally broken.
XLE wins the category selection despite a composite score of 0 because its 82.0 risk/reward—identical to PICK in mining—and its category-relative strength of 1.3% (versus XOP's 0.0%) give it the slimmest technical edge in an otherwise demolished sector. XLE's 13-week return of -23.1% and 25% distance below the 50-week are catastrophic, but price is pinned at exact support near 22.64 with zero downside to invalidation, meaning any bounce has defined geometry. Both XLE and XOP show identical bearish/weakening MACD and oversold stochastic RSI in the near 52-week low repair zone, so the 1.3% category-relative strength for XLE versus 0.0% for XOP is the only differentiator; it signals that integrated energy is holding up slightly better than exploration, which makes sense if any liquidity is rotating into dividends rather than pure beta. The score gap of 0.0 between XLE and XOP reflects how close these two names are—this is a coin flip disguised as a technical selection.
Traditional Energy earned 0% allocation and is excluded from the portfolio this week because both its final category score of 0.0 and its eligibility status of false mark it as completely outside the regime. The category's macro fit is only 40.0, heavily dragged down by disinflation pressure at -10, which makes energy producers and integrated oils defensive liabilities in a deflation scare: lower fuel demand, lower prices, and lower cash flow kill the investment case. All three ETFs (XOP, FCG, XLE) are 15-25% underwater on 13-week returns with relative strength ranging from -19.4% to -17.4% versus SPY, and all sit in the repair zone waiting for capitulation to finish. XLE's 0% allocation persists because the Goldilocks macro regime offers no support and disinflation pressure is actively hostile; for energy to earn any sleeve, crude prices would need to stabilize above their 200-week moving average, geopolitical risk would need to activate a supply shock descriptor, or broad-market risk-on sentiment would need to reverse the disinflation signal entirely.