
2020-02-21
Informational purposes only. The content in this report, including allocations, analysis, and commentary, is provided solely for informational and educational purposes. It does not constitute financial advice, investment advice, trading advice, or any other type of advice. Past performance does not guarantee future results. Always conduct your own research and consult a qualified financial professional before making investment decisions.
Some tracked tickers were excluded due to missing live weekly price data: SGOV: Historical cache SGOV has only 0 usable weekly bars; URNM: Historical cache URNM has only 12 usable weekly bars
Weekly Allocation
| Ticker | Category | Weight | Role |
|---|---|---|---|
| FBTC | 50% | Overlay | |
| GLD | Precious Metals | 10% | Top-2 (10%) |
| IGV | Technology | 10% | Top-2 (10%) |
| XLU | Utilities & Infrastructure | 5% | Tier-2 (5%) |
| BOTZ | AI | 5% | Tier-2 (5%) |
| IEMG | Emerging Markets | 5% | Tier-2 (5%) |
| ITA | Defense & Aerospace | 5% | Tier-2 (5%) |
| XLE | Traditional Energy | 5% | Tier-2 (5%) |
| NLR | Nuclear Energy | 5% | Tier-2 (5%) |
Trade Instructions — Monday Open
Sell the tranche from 2020-01-24 (completing its 4-week hold). Buy the new tranche. Instructions show net portfolio changes — same-asset positions cancel, weight changes show the delta.
| Action | Ticker | Instruction |
|---|---|---|
| SELL | XLU | Sell 14% of XLU position (reduce 8.75% → 7.50%) |
| SELL | XAR | Sell entire XAR position (1.25% of portfolio) |
| SELL | SMH | Sell 20% of SMH position (reduce 6.25% → 5.00%) |
| SELL | PICK | Sell 50% of PICK position (reduce 2.50% → 1.25%) |
| SELL | INDA | Sell 33% of INDA position (reduce 3.75% → 2.50%) |
| BUY | GLD | Buy GLD — 20.00% of freed cash (adds 1.25% to portfolio) |
| BUY | ITA | Buy ITA — 20.00% of freed cash (adds 1.25% to portfolio) |
| BUY | NLR | Buy NLR — 20.00% of freed cash (adds 1.25% to portfolio) |
| BUY | BOTZ | Buy BOTZ — 20.00% of freed cash (adds 1.25% to portfolio) |
| BUY | IEMG | Buy IEMG — 20.00% of freed cash (adds 1.25% to portfolio) |
Current Portfolio After Trade
Combined holdings across all 4 active tranches. Each tranche is 25% of the portfolio.
| Ticker | % of Portfolio | Weight Bar |
|---|---|---|
| FBTC | 50.00% | |
| GLD | 7.50% | |
| XLU | 7.50% | |
| IGV | 6.25% | |
| SMH | 5.00% | |
| XLE | 5.00% | |
| ITA | 5.00% | |
| NLR | 3.75% | |
| INDA | 2.50% | |
| XLK | 2.50% | |
| PICK | 1.25% | |
| MOO | 1.25% | |
| BOTZ | 1.25% | |
| IEMG | 1.25% |
Macro Regime — Goldilocks
Macro Evidence Charts
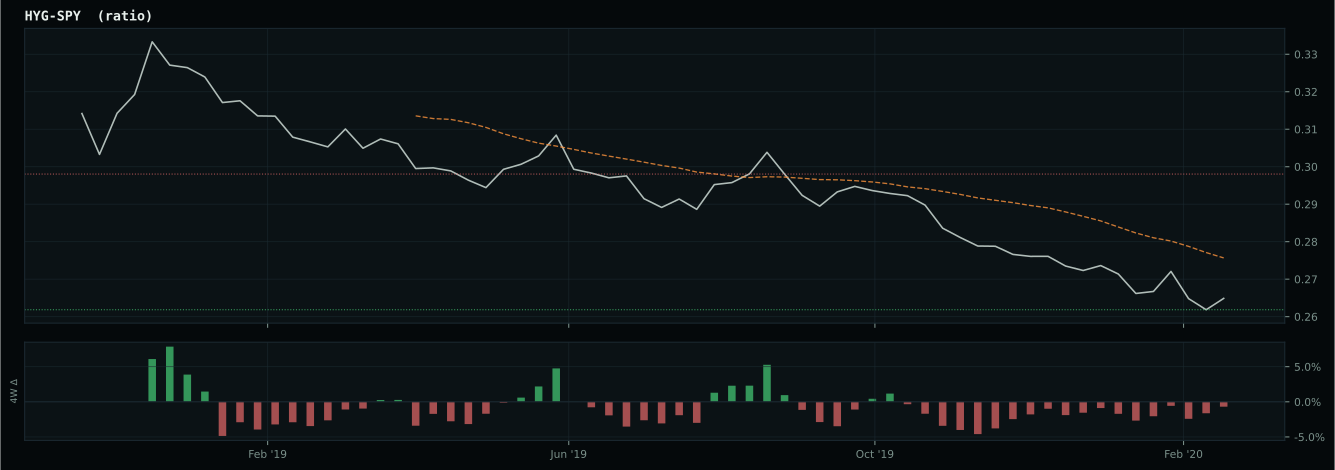
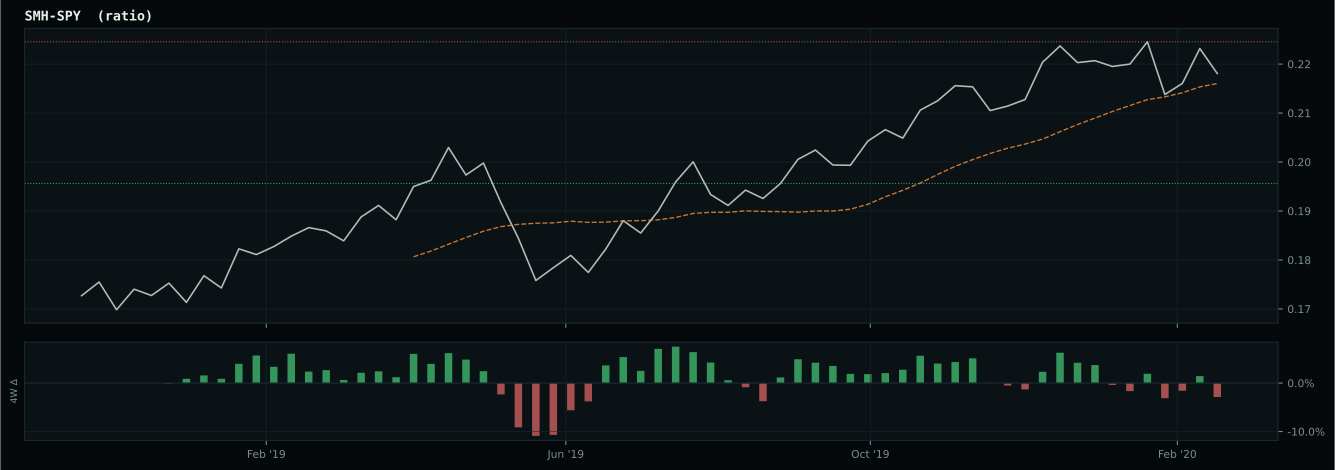
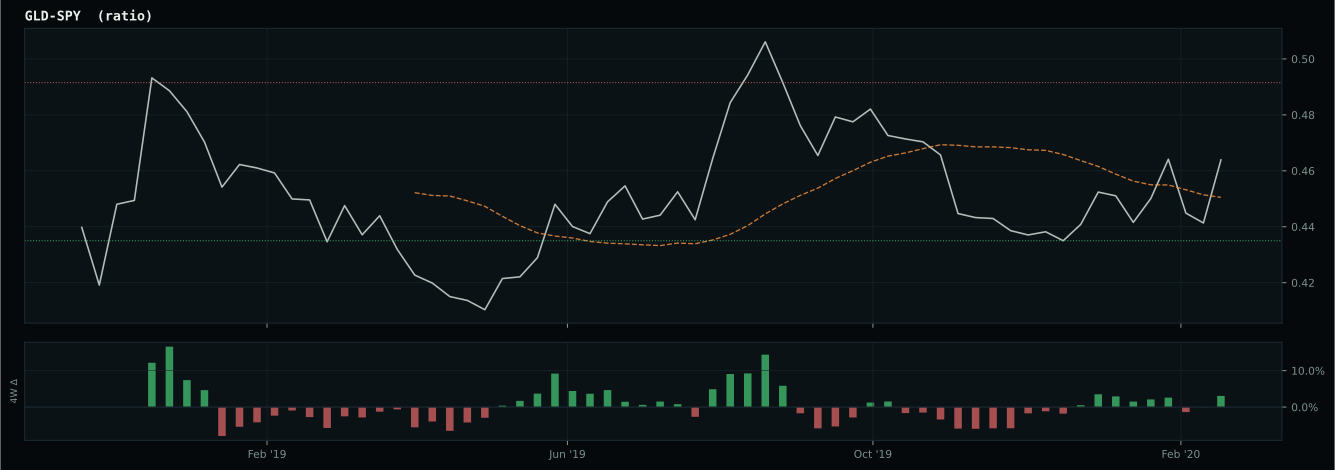
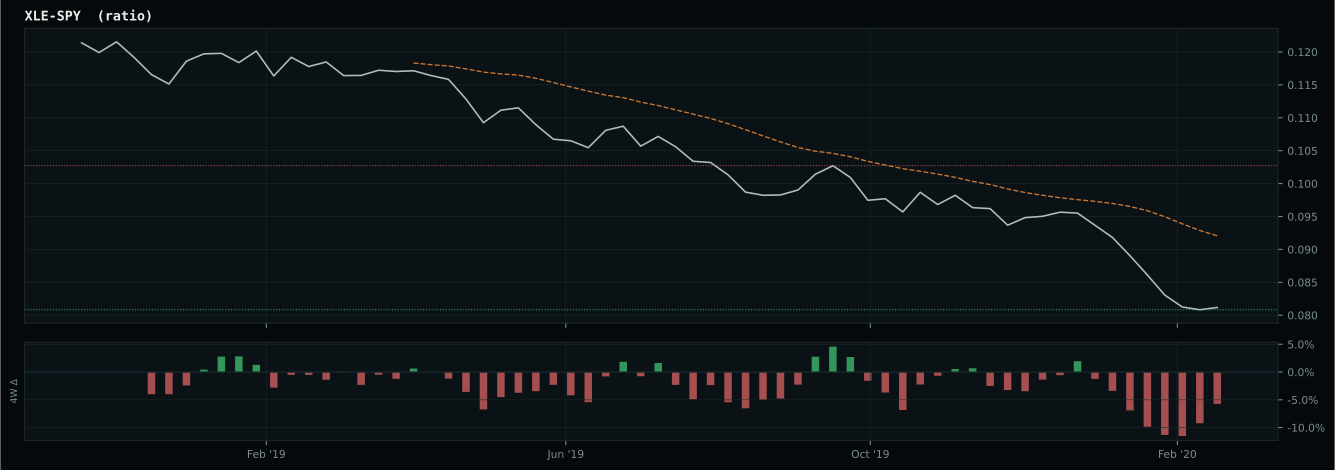
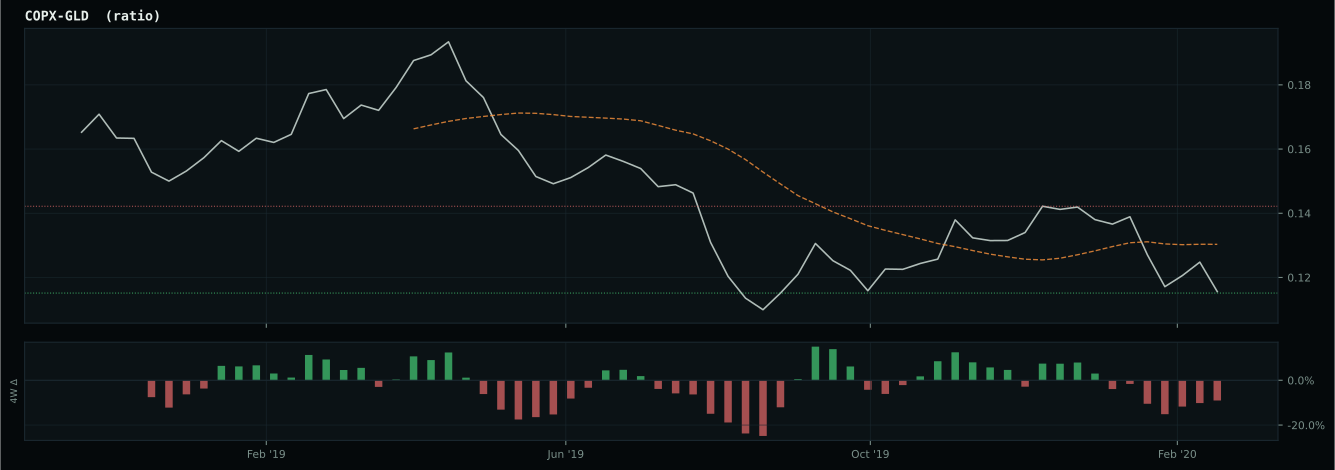
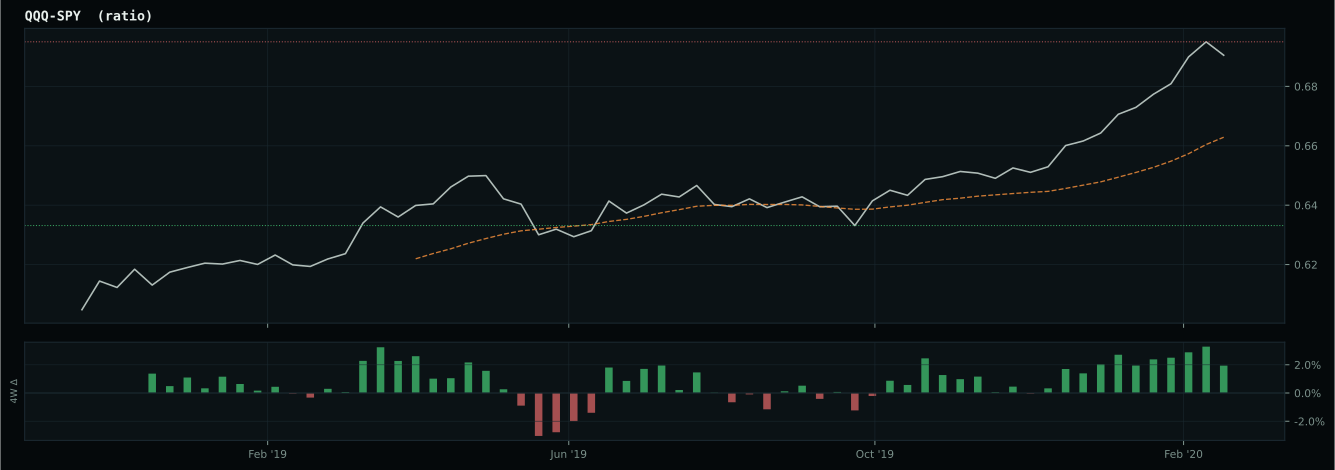
Market-implied signals behind the macro regime scores. Each ratio compares two assets; the direction and slope of the ratio is what the macro engine reads.
Crypto Regime — TrendBTC
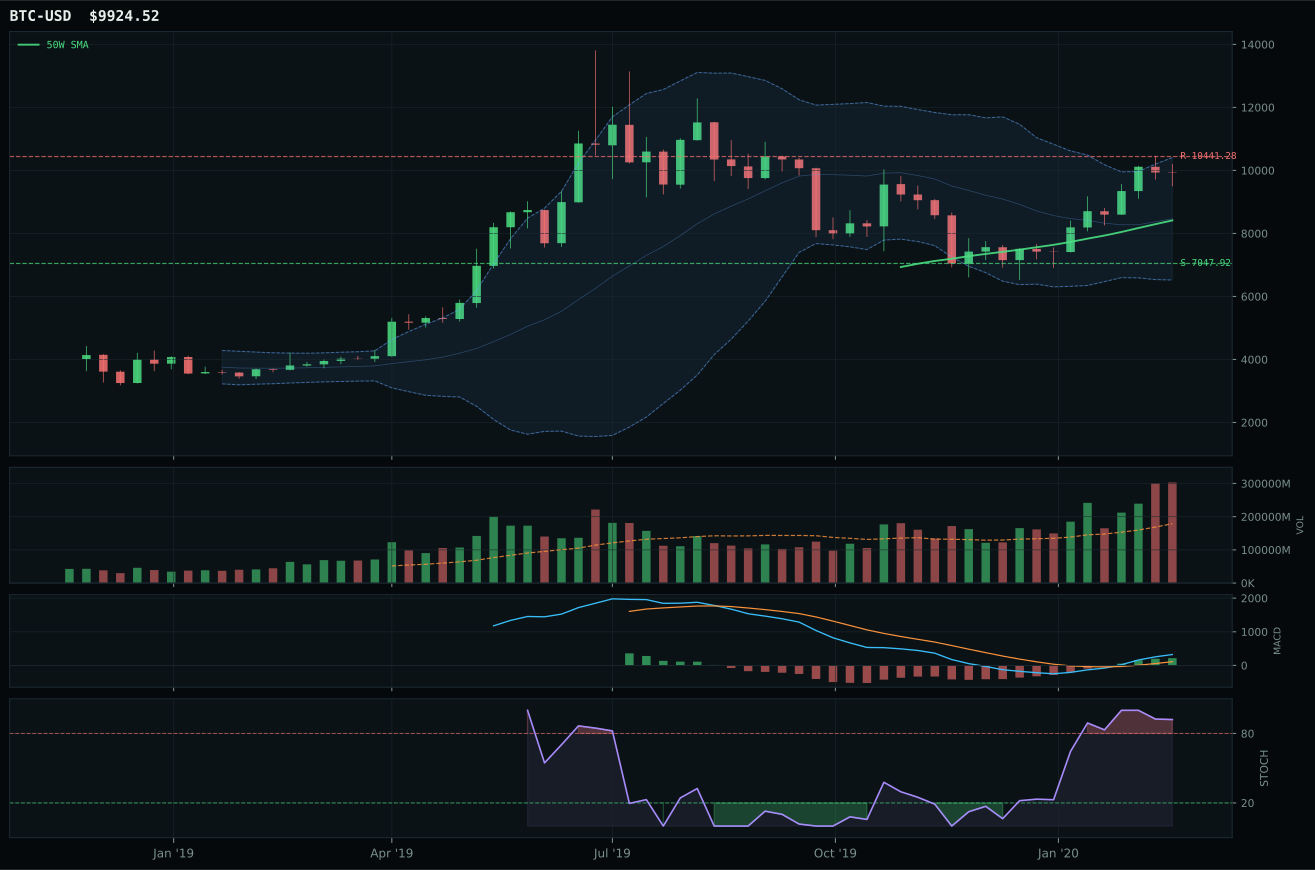
post-touch structure is too wide to count as a range; max/min close ratio is 3.33
TrendBTC confirmed: 2 consecutive closes above rising/flat 50W SMA
one or more available conditions failed

Category Rankings
| Rank | Category | Winner | Score | Alloc | 4W Ret | Peers (4W) |
|---|---|---|---|---|---|---|
| 1 | Precious Metals | GLD | 76.3 | 20% | -9.98% | GDX -31.9% · SLV -31.8% |
| 2 | Technology | IGV | 72.7 | 20% | -23.38% | XLK -25.3% · CIBR -26.2% |
| 3 | Utilities & Infrastructure | XLU | 60.6 | 10% | -32.61% | IGF -37.9% · PAVE -39.2% |
| 4 | AI | BOTZ | 53.5 | 10% | -26.60% | SMH -26.2% · AIQ -25.7% |
| 5 | Emerging Markets | IEMG | 45.3 | 10% | -25.99% | INDA -36.7% · ILF -45.2% |
| 6 | Defense & Aerospace | ITA | 44.8 | 10% | -46.57% | XAR -43.1% · ROKT -42.3% |
| 7 | Nuclear Energy | NLR | 21.2 | 10% | -31.88% | URA -30.0% |
| 8 | Industrial Metals | PICK | 13.7 | 10% | -36.52% | REMX -31.0% · COPX -38.5% |
| 9 | Agriculture & Livestock | MOO | 6.2 | 0% | -30.55% | VEGI -31.1% · WEAT +0.2% |
| 10 | Traditional Energy | XLE | — | 0% | -51.77% | XOP -54.6% · FCG -52.5% |
Precious Metals — GLD
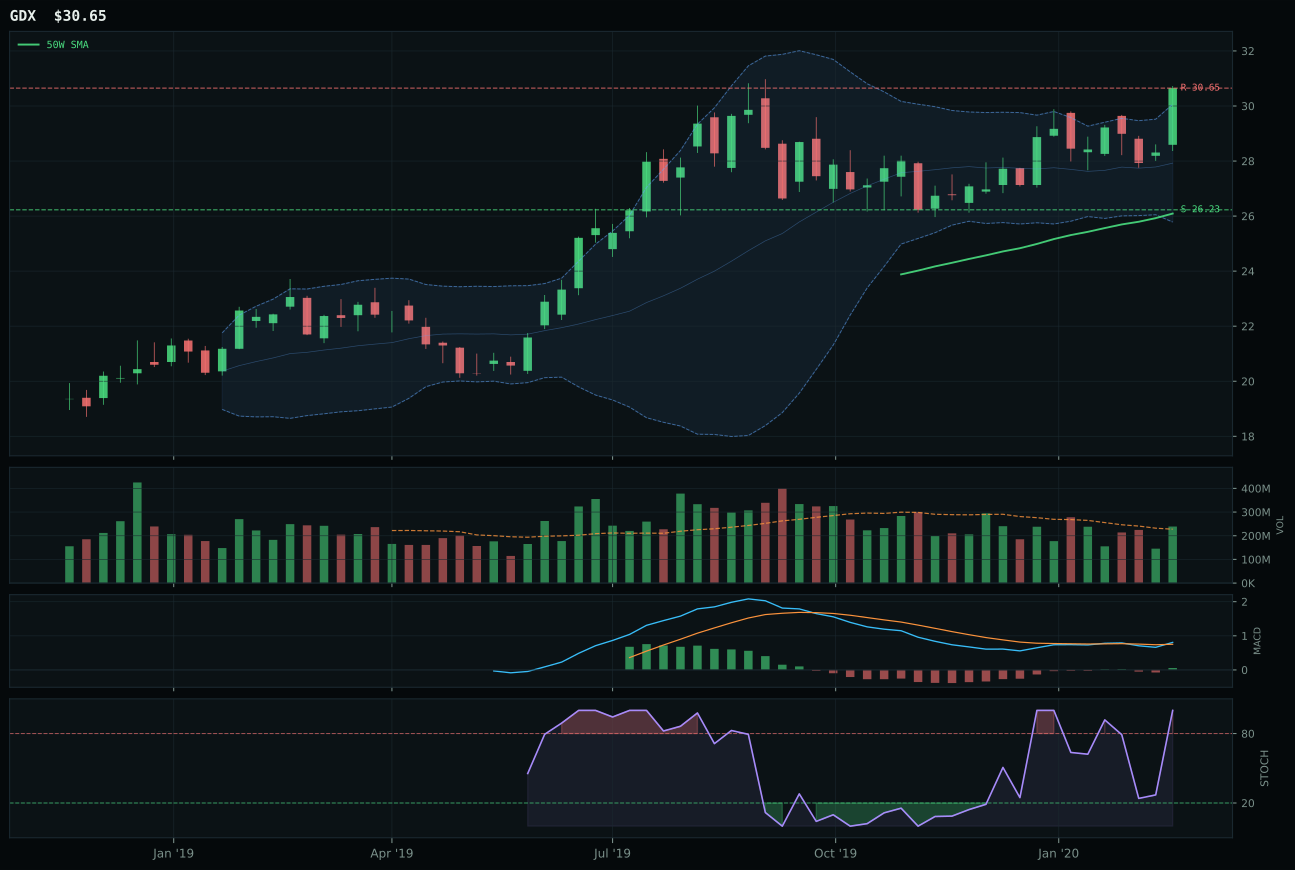
GDX has a vertical extension profile with 7.3% 13-week relative strength versus SPY.
A failed hold above support would weaken the setup.
Actionable but governed by invalidation levels.
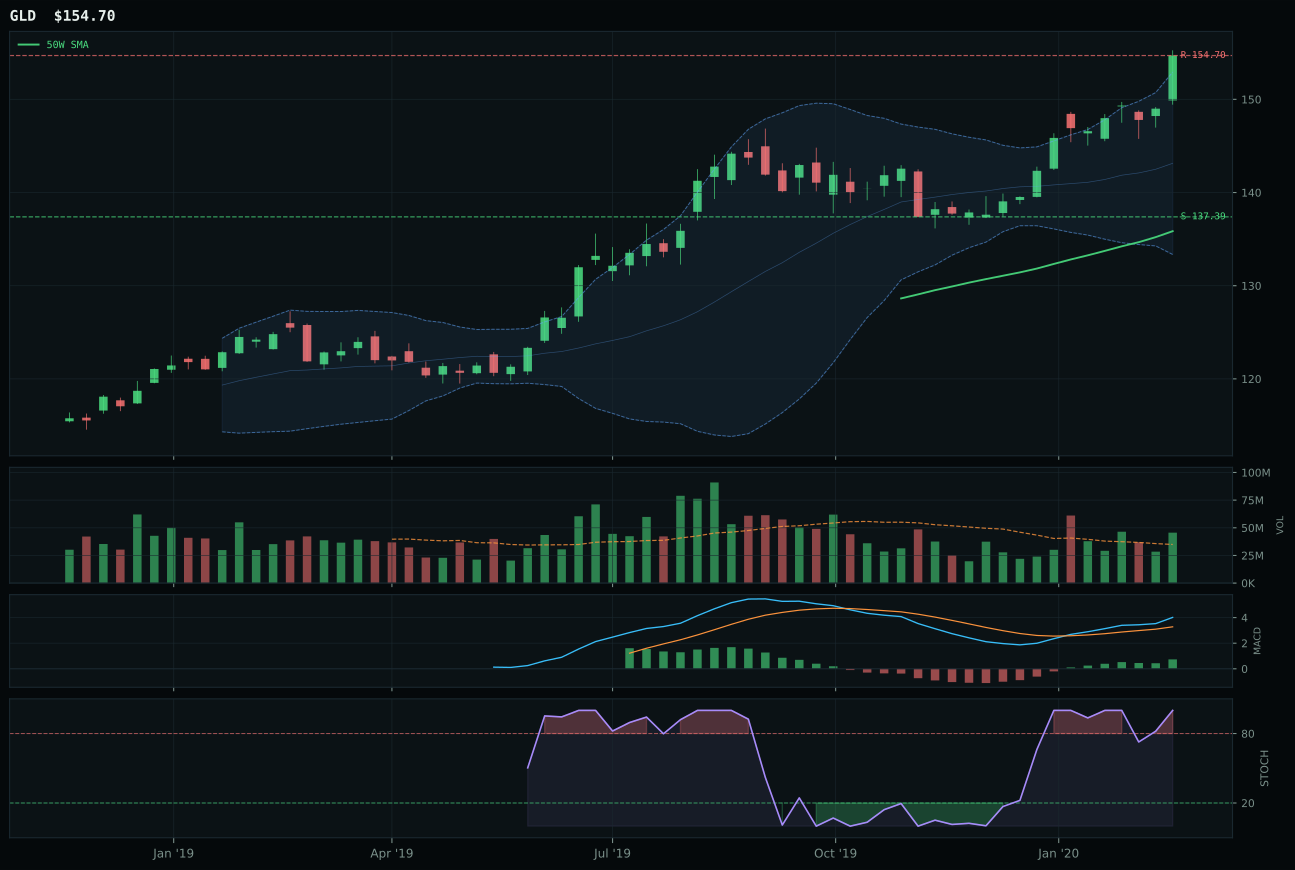
GLD has a neutral structure profile with 5.1% 13-week relative strength versus SPY.
A failed hold above support would weaken the setup.
Actionable but governed by invalidation levels.
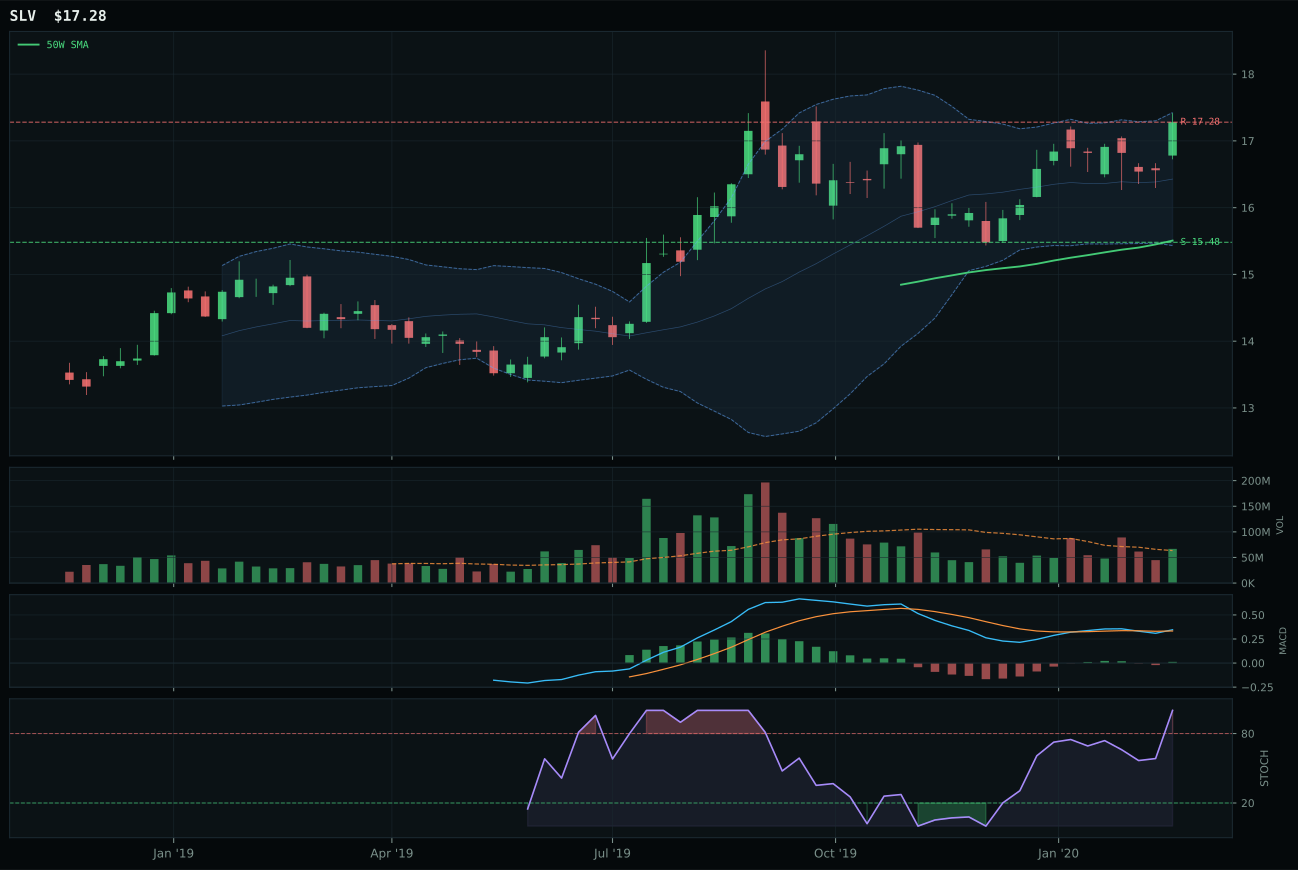
SLV has a neutral structure profile with 1.4% 13-week relative strength versus SPY.
A failed hold above support would weaken the setup.
Actionable but governed by invalidation levels.
GLD dominated the Precious Metals category with an 11.4-point lead over GDX because it combined perfect trend structure with the best macro sponsorship in the portfolio. Price is above both the 50W and 200W, the 50W slope remains positive at 0.5%, and the 5.1% relative strength advantage over SPY—paired with a 6.2% category-relative gain—proves this is a lead, not a lag. Volume participation at 1.31x the 20W average confirms accumulation, and MACD is bullish and improving, not rolling over like GDX. Stochastic RSI is at 1.00 (overbought), which normally would be a timing caution, but the neutral structure means this is a resting point, not an exhaustion signal. GDX stretched 19.1% above the 50W on weaker volume and flattening MACD—a classic setup for a whipsaw. The monetary hedge bid at +14, disinflation pressure at +8, and defensive rotation at +6 create the strongest macro backdrop in the basket, and GLD's cleaner structure at 84.3 versus GDX at 71.4 captures that sponsorship more durably.
Precious Metals is a top-2 overweight at 10% because it ranked second among all category scores at 76.3, earning its seat at the allocation table. The category's macro fit of 75.0 is exceptional: monetary hedge bid at +14 reflects the portfolio's recognition that credit stress, disinflation, and defensive rotation are all active. GLD's trend score of 100, momentum confirmation of 93.9, and volume-price confirmation of 79.9 prove the market is organizing behind this signal. The timing score of 59 reflects the 13.9% extension above the 50W and overbought stochastic, but those are the price of leadership, not a reason to exclude it. The Goldilocks macro regime supports real assets as insurance, and GLD's 12.3% 13W return with fresh volume sponsorship justifies holding despite being extended. If credit stress accelerates and risk-off deepens, this category would likely rotate from GLD to GDX for leverage; if risk-on reasserts, GLD could lose its top-2 seat to a sector with better upside asymmetry.
Technology — IGV
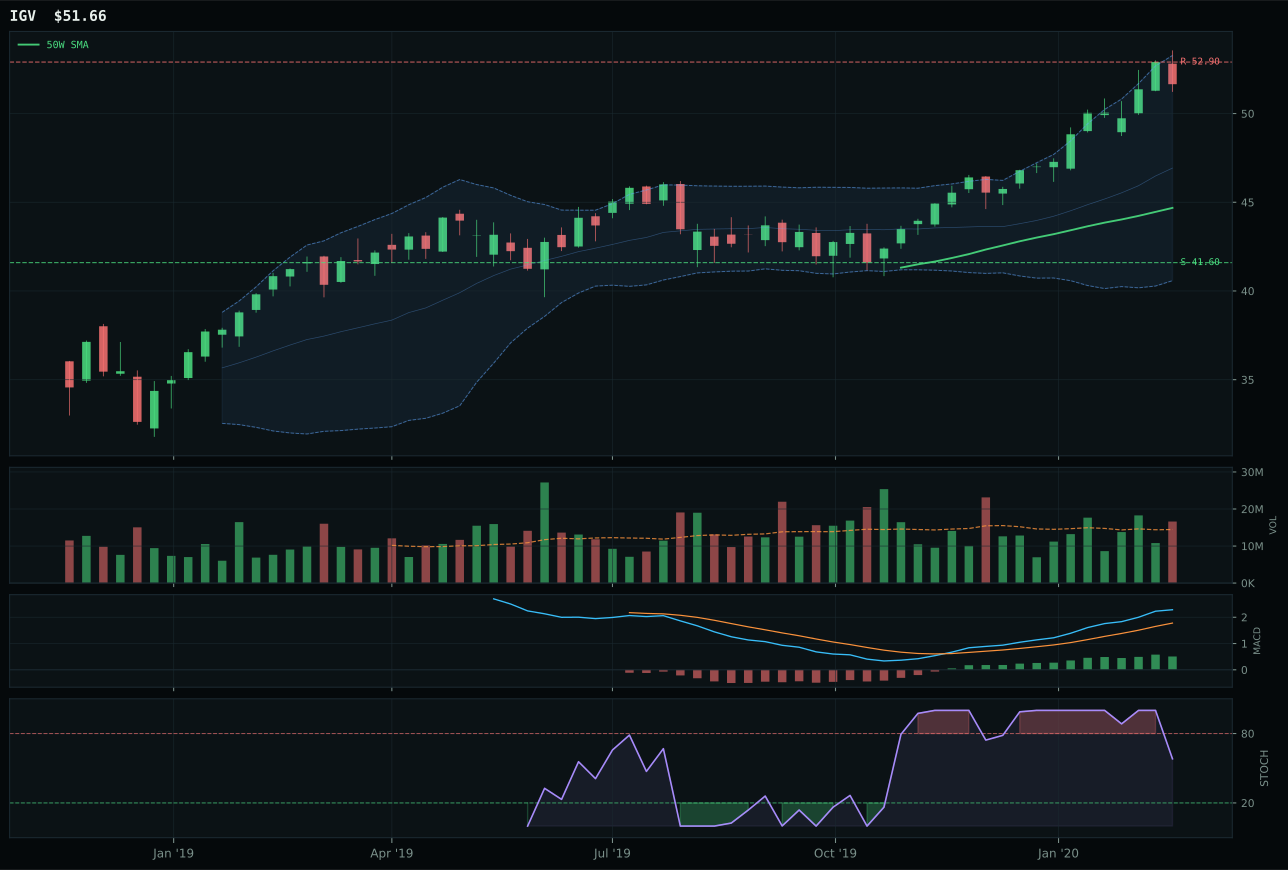
IGV has a vertical extension profile with 6.2% 13-week relative strength versus SPY.
A failed hold above support would weaken the setup.
Actionable but governed by invalidation levels.
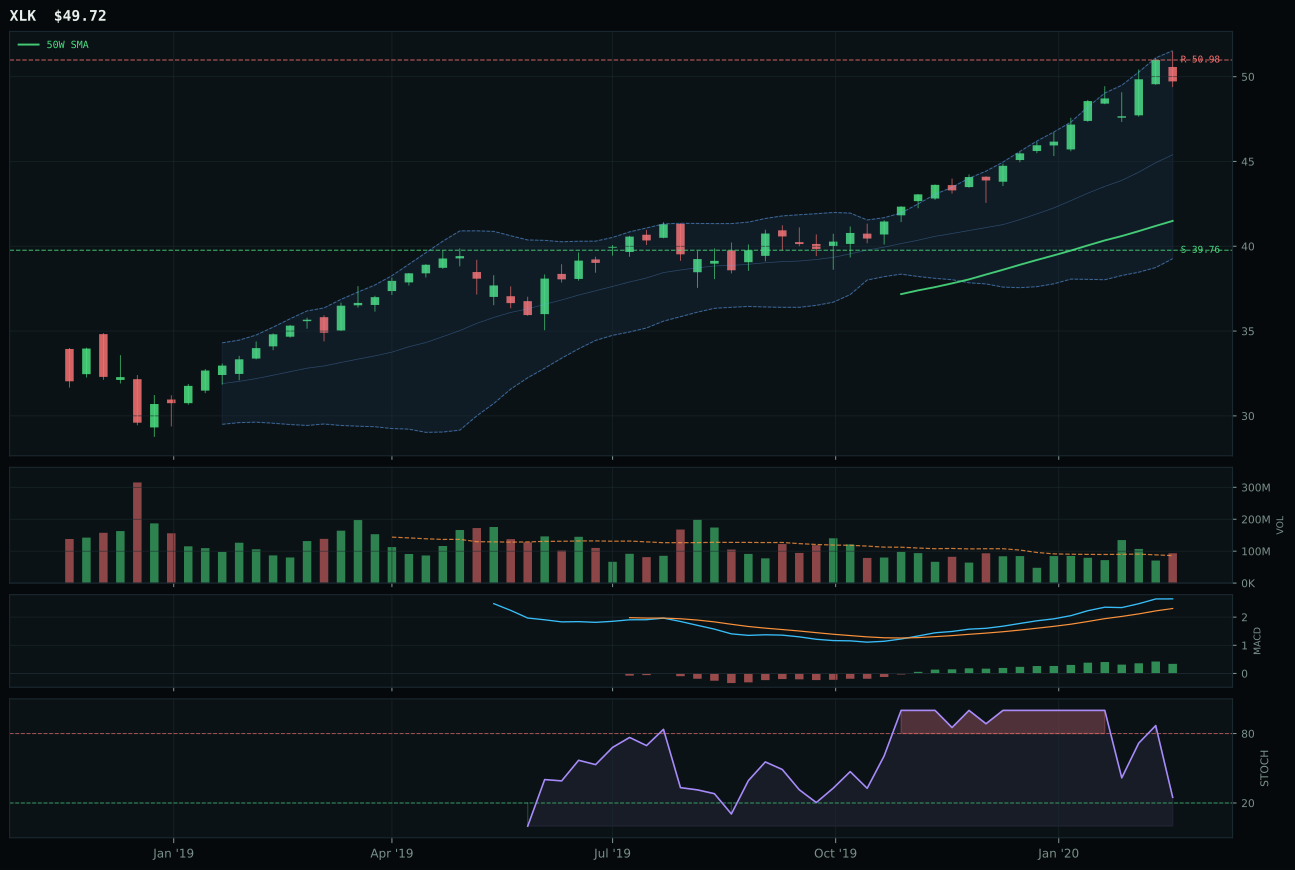
XLK has a vertical extension profile with 7.6% 13-week relative strength versus SPY.
A failed hold above support would weaken the setup.
Actionable but governed by invalidation levels.
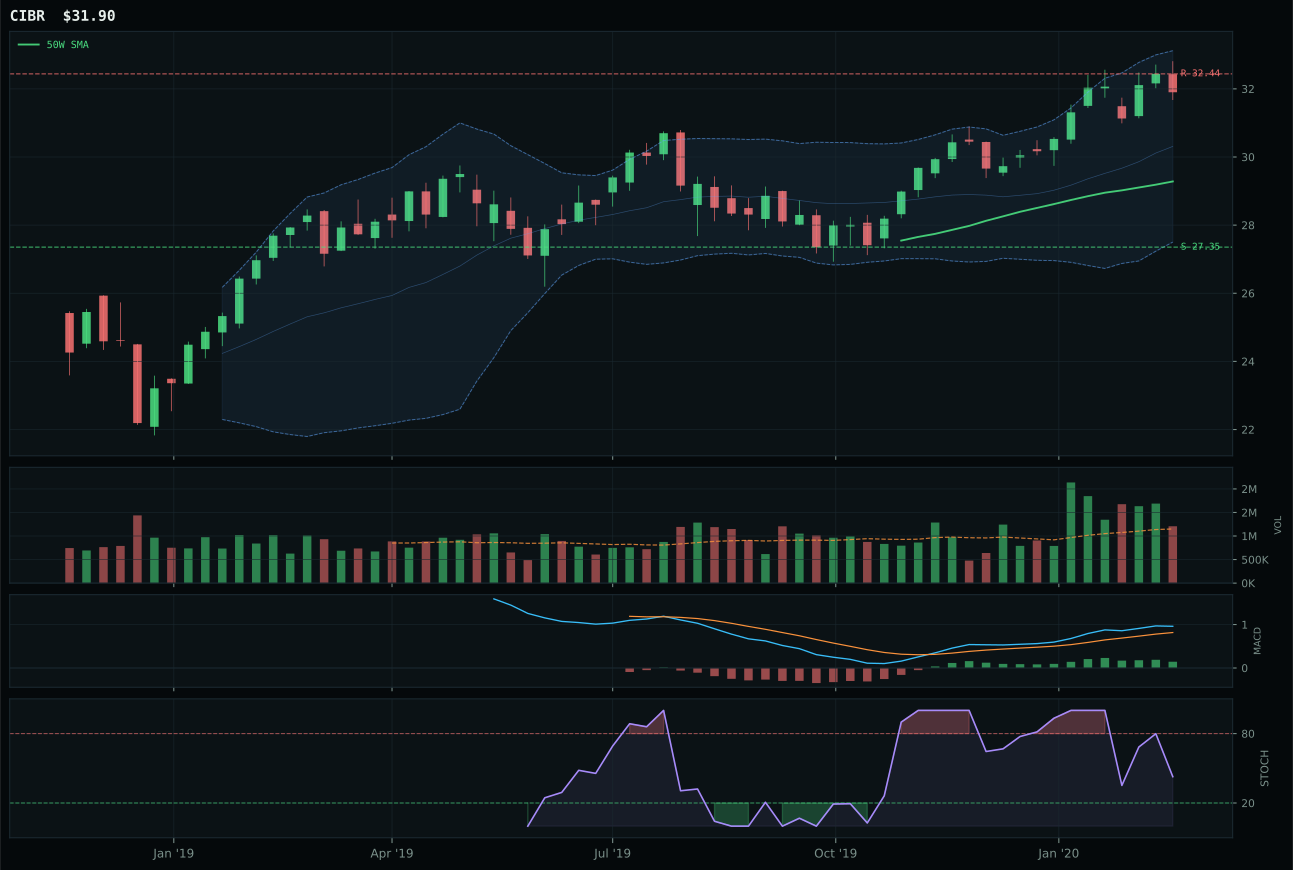
CIBR has a neutral structure profile with -2.4% 13-week relative strength versus SPY.
A failed hold above support would weaken the setup.
Actionable but governed by invalidation levels.
IGV won the category with a 3.0-point margin over XLK because its technical setup combined clean upside momentum with better timing confirmation. Price sits 15.6% above the 50W with MACD bullish and improving—not flattening like XLK—and volume participation at 1.15x the 20W average proves buyers are accumulating, not just bouncing. The 13W return of 13.4% paired with a 6.2% relative strength advantage over SPY shows this is a genuine shift in buyer behavior, not an extended chart late in a move. XLK's weaker timing score (48 vs 53) and neutral volume confirm that while both names are in vertical extension, IGV's sponsorship is fresher and more durable given the macro backdrop of liquidity expansion and AI growth.
Technology earned its position as a top-2 overweight at 10% because it ranked among the two highest eligible final category scores at 72.7. The Goldilocks regime supports duration-sensitive growth, and the active descriptors—liquidity expansion at +9, disinflation pressure at +8, and AI sponsorship at +6—create a favorable macro fit that reinforces the technical evidence. An overbought stochastic RSI and 15.6% extension above the 50W raise timing risk, yet the category's 72.0 macro fit and IGV's volume-price confirmation at 72.6 justify holding despite the stretched entry. The key tension is simple: this is a leader, not a bargain, but leaders compound when macro and technicals align. If credit stress accelerates or relative strength turns negative, the category would need to rotate toward laggards or lose its top-2 slot.
Utilities & Infrastructure — XLU
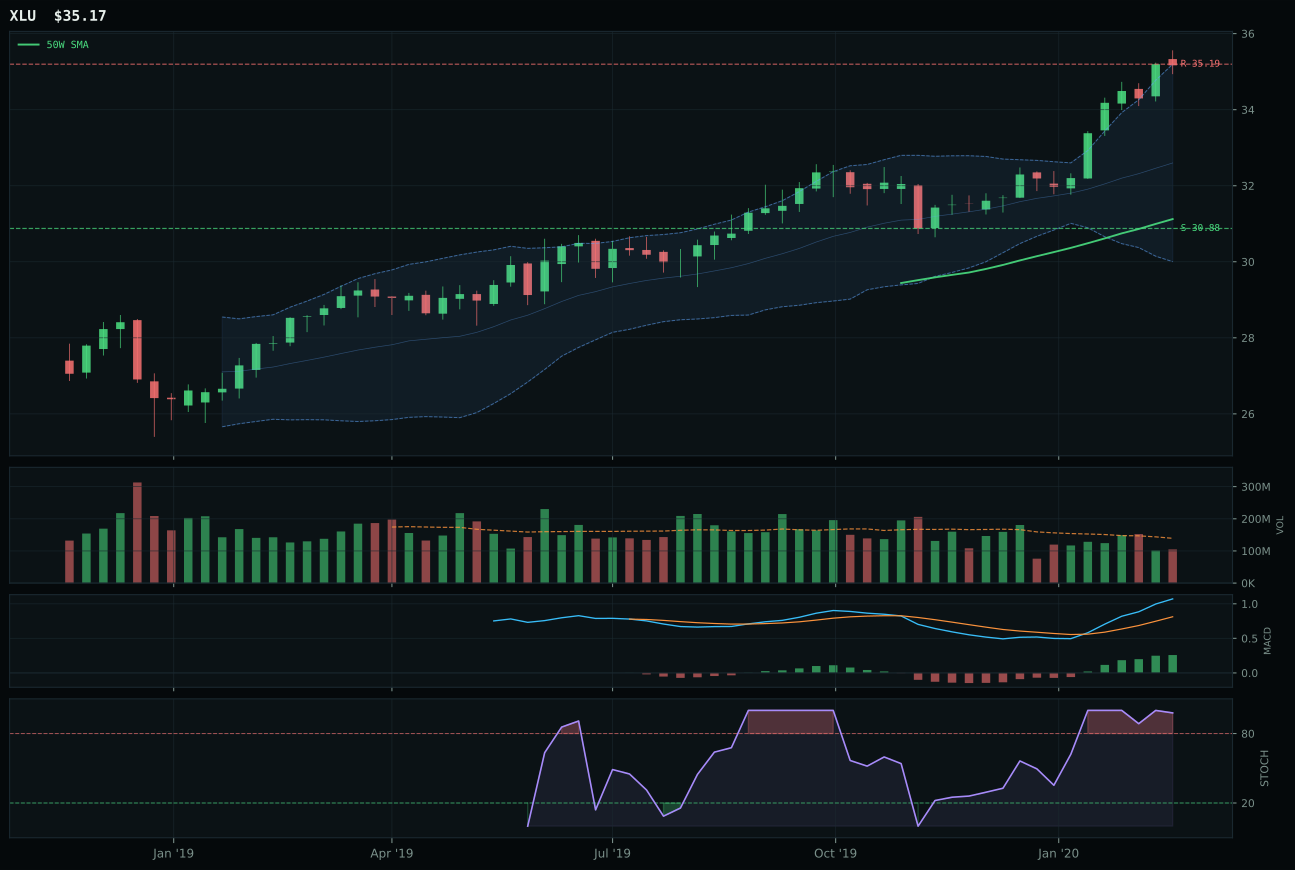
XLU has a neutral structure profile with 4.4% 13-week relative strength versus SPY.
A failed hold above support would weaken the setup.
Actionable but governed by invalidation levels.
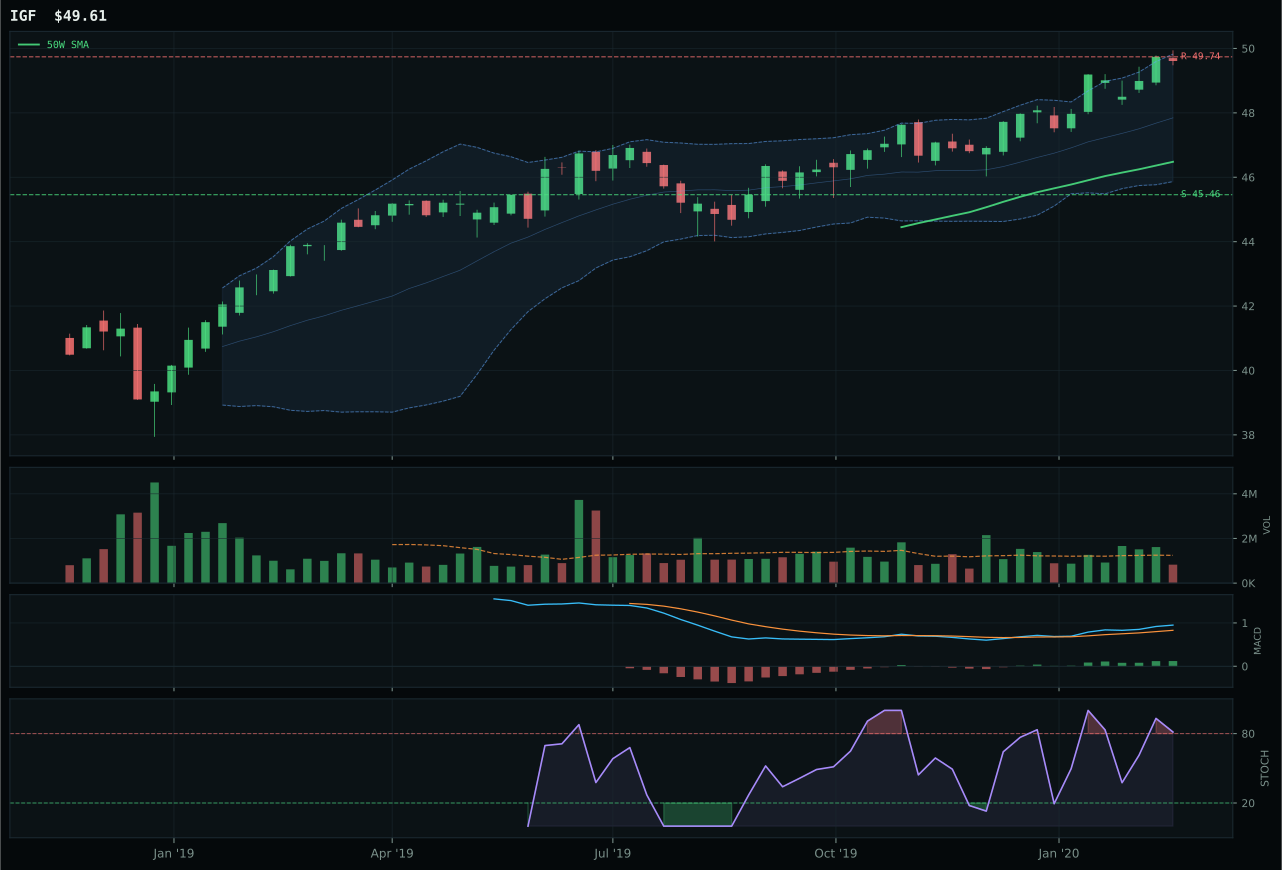
IGF has a neutral structure profile with -1.5% 13-week relative strength versus SPY.
A failed hold above support would weaken the setup.
Actionable but governed by invalidation levels.
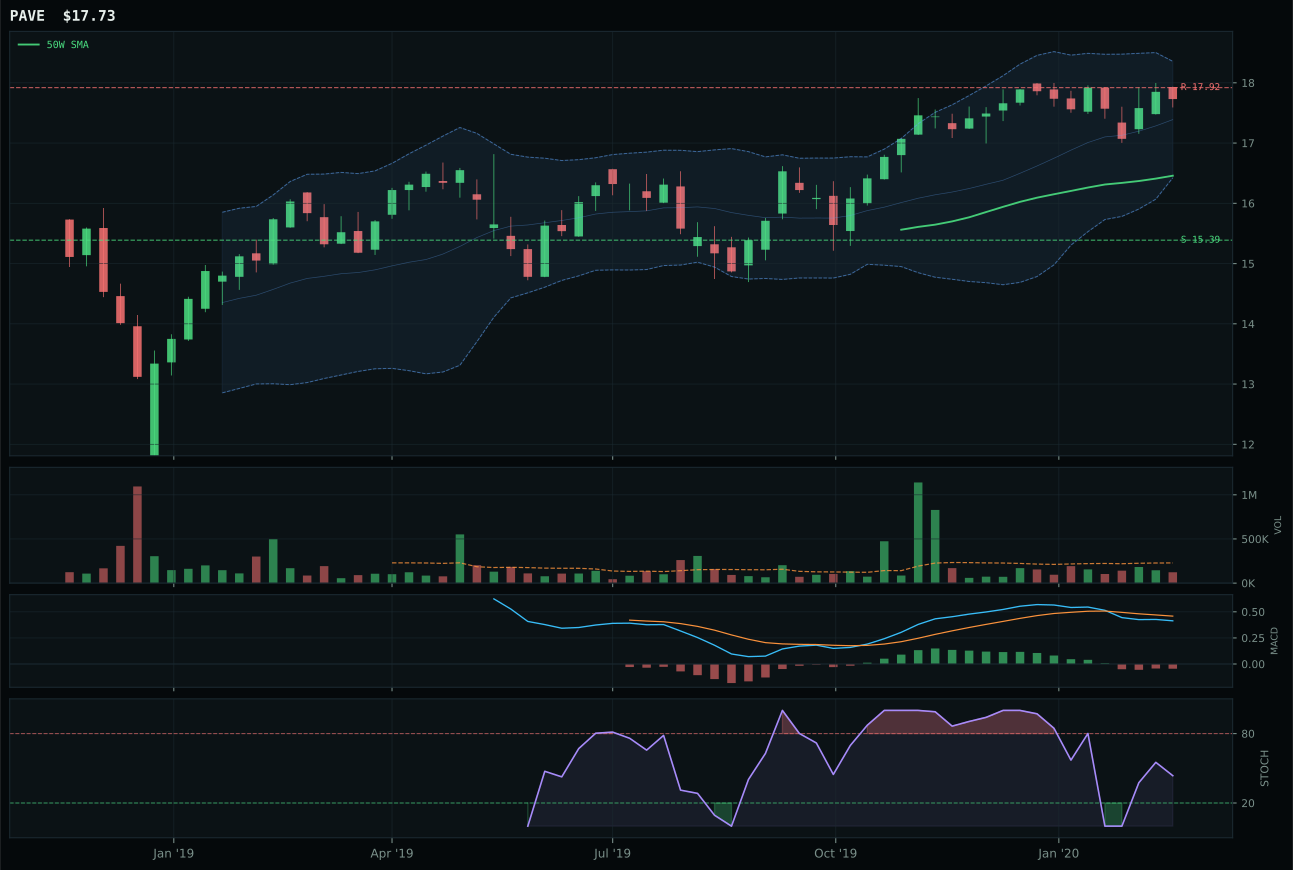
PAVE has a neutral structure profile with -4.3% 13-week relative strength versus SPY.
A failed hold above support would weaken the setup.
Tracked, but not top-2 eligible because: .
XLU beat IGF by 2.7 points through a combination of superior category-relative strength (5.9% vs 0.0%), neutral volume participation versus thin participation, and marginally cleaner structure (78.9 vs 77.6). Both names sit near the 52W high with bullish MACD and overbought stochastic, so the setup is symmetric—this is not a case where one is superior on the chart. The difference is in sponsorship: XLU's 11.6% 13W return and positive relative strength show this name is accumulating while IGF is neutral. Volume confirmation at 69.1 for XLU versus 63 for IGF is a small edge, but it matters when both are extended. XLU sits 13.0% above the 50W with MACD bullish and improving, and its momentum confirmation of 85.9 reflects real breadth. IGF's relative weakness at -1.5% versus SPY and thin participation at 0.63x signal less institutional interest.
Utilities & Infrastructure holds a tier-2 allocation of 5% with a final category score of 60.6 and eligible status of True. The category's macro fit of 72.0 is strong: defensive rotation at +12, disinflation pressure at +6, and Goldilocks support at +4 create real tailwinds. XLU's trend score of 100, momentum confirmation of 85.9, and relative strength of 4.4% versus SPY justify holding despite a timing score of only 49 and risk/reward of 37.1. The chart is extended at 13.0% above the 50W, and stochastic RSI is overbought rolling over, which typically signals a rest or consolidation phase. However, regulated utility income and defensive positioning resonate in this macro environment. The allocation survives because defensive rotation is legitimate and XLU's volume-price confirmation of 69.1 and persistence of 74.9 prove the move is being accumulated, not distributed. For utilities to earn top-2 status, it would need momentum confirmation to stay above 85 while timing improved through consolidation near the 50W, a multi-week retest that would reset the extended valuation while keeping MACD bullish. Currently the category is priced for the macro case, but not yet for expansion.
AI — BOTZ
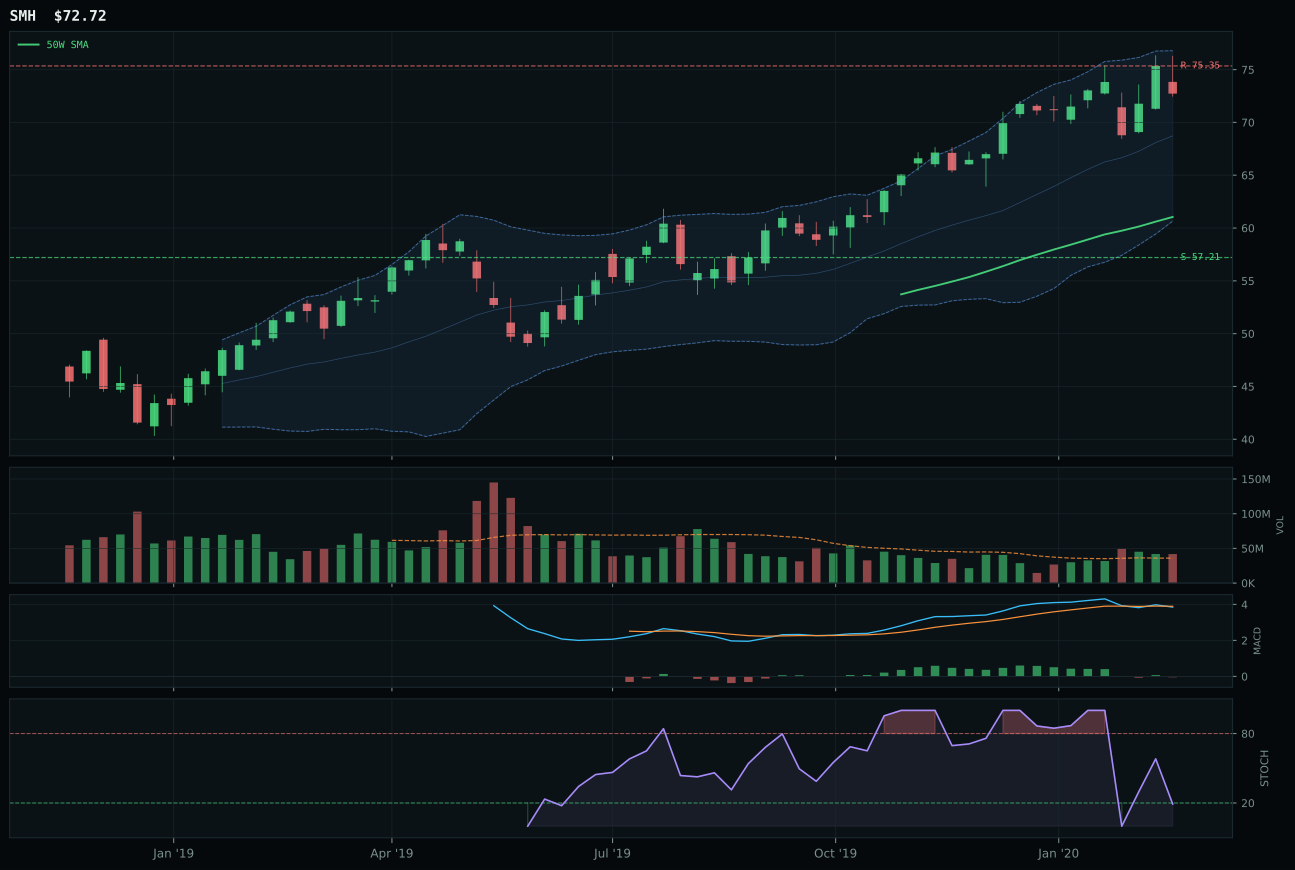
SMH has a vertical extension profile with 3.9% 13-week relative strength versus SPY.
A failed hold above support would weaken the setup.
Actionable but governed by invalidation levels.
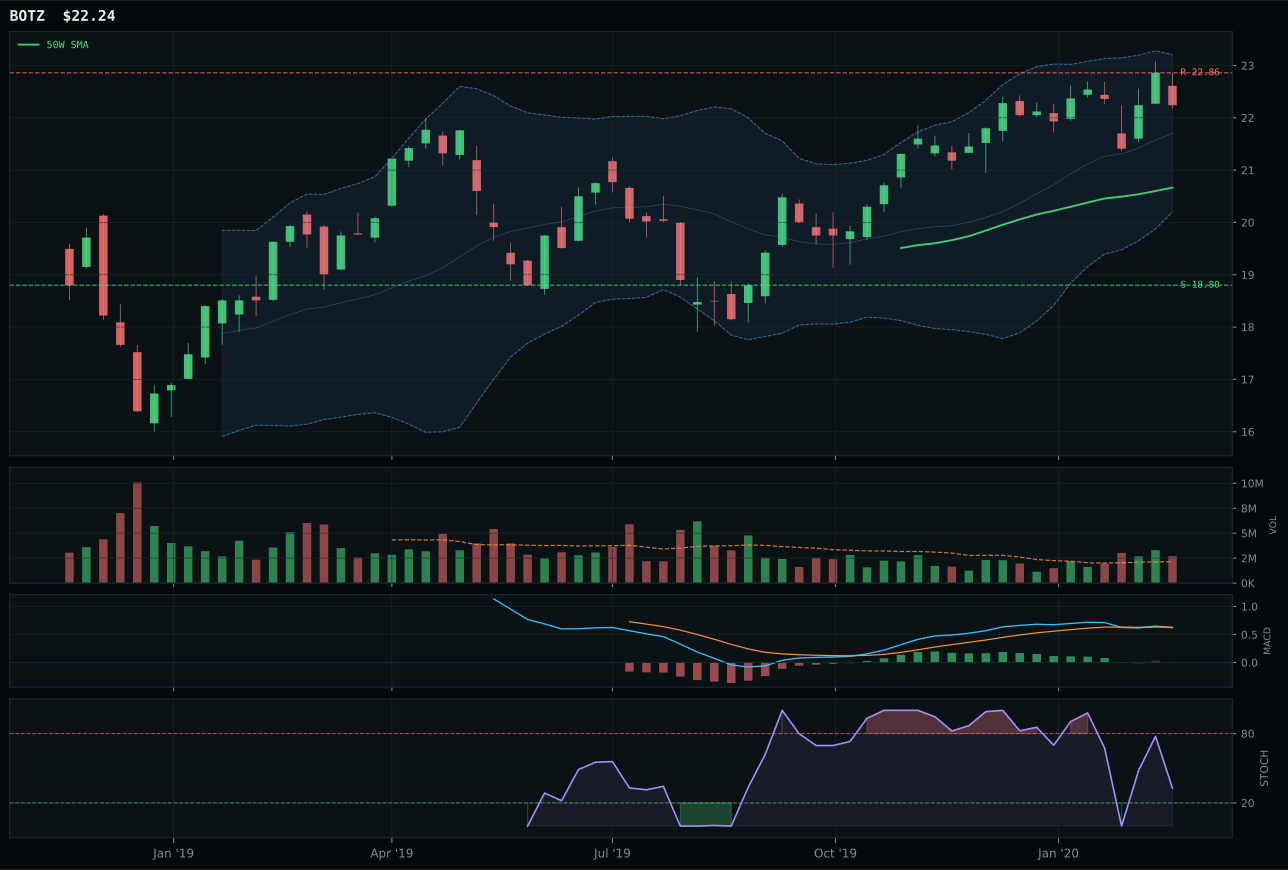
BOTZ has a neutral structure profile with -2.2% 13-week relative strength versus SPY.
A failed hold above support would weaken the setup.
Actionable but governed by invalidation levels.
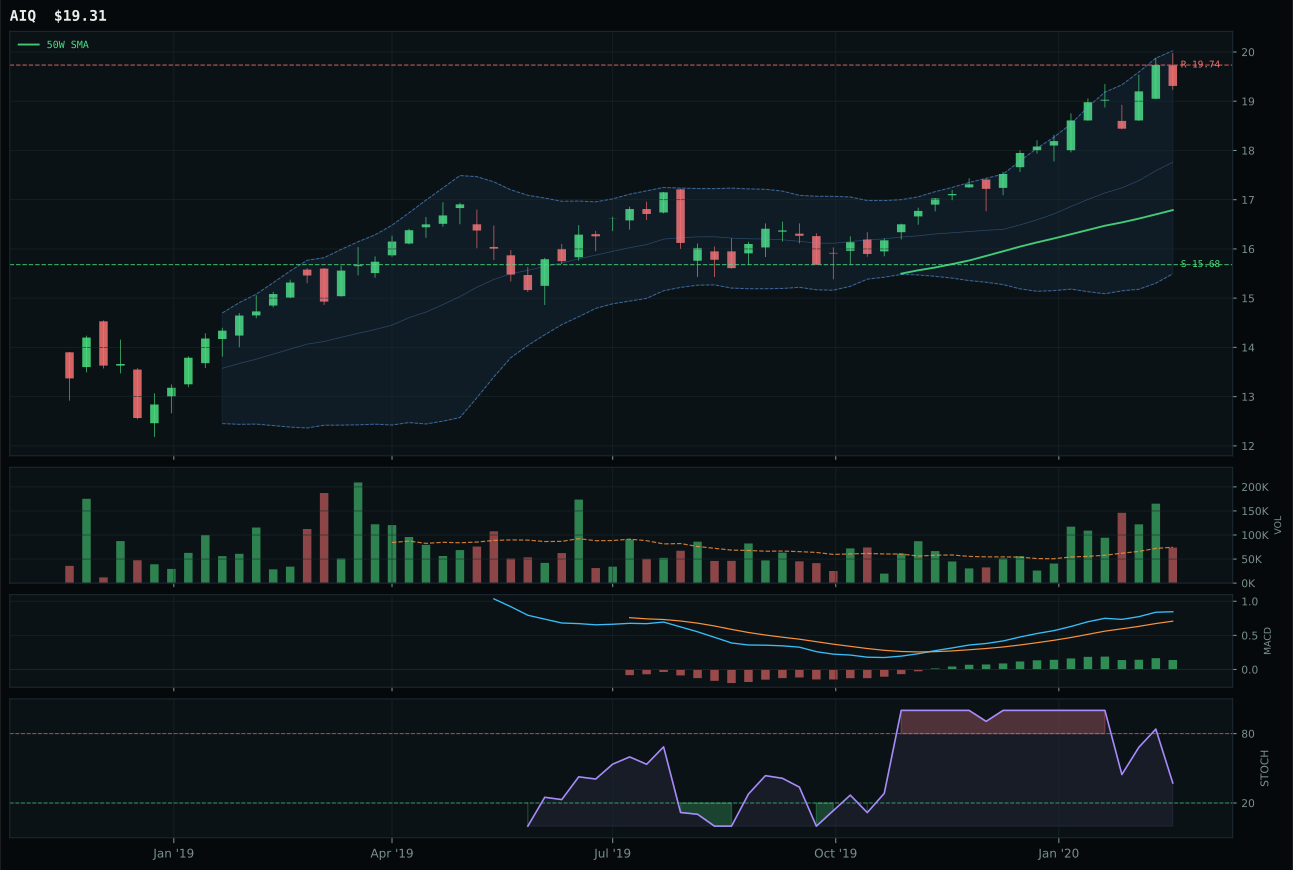
AIQ has a vertical extension profile with 5.6% 13-week relative strength versus SPY.
A failed hold above support would weaken the setup.
Tracked, but not top-2 eligible because: .
BOTZ narrowly beat SMH by 2.9 points despite being weaker on momentum and relative strength, which tells you everything about why it won: timing and risk asymmetry mattered more than raw strength. BOTZ sits only 7.6% from the 50W with MACD bullish but flattening and stochastic RSI in the rising mid-zone—a setup that rewards disciplined entries near support, not chasing extended rallies. SMH is 19.1% above the 50W with MACD already weakening and stochastic RSI oversold, meaning every new buyer is fighting gravity. Above-average volume participation of 1.26x in BOTZ confirms some accumulation, while SMH's setup is mechanically exhausted despite its stronger 13W return of 11.1%. The category's macro fit remains strong at 76.0 thanks to AI sponsorship at +14, but BOTZ's neutral structure and patient positioning beat SMH's vertical extension trap.
AI earned a tier-2 allocation of 5% because it ranked below the top-2 threshold at 53.5, placing it in the third tier eligible for capital. The category's macro fit of 76.0 is actually robust—AI growth sponsorship at +14 and liquidity expansion at +10 are powerful tailwinds—but the technical evidence at 48.8 to 61.6 across the basket is too weak to justify top-2 status. BOTZ's trend score of only 72.6 and momentum confirmation at 51.6 reflect the category's fundamental problem: relative strength is negative versus SPY and deteriorating within the basket. The allocation persists because the macro case for AI remains intact and BOTZ is positioning for a support hold rather than a breakdown. To earn promotion to top-2, this category would need momentum to confirm above the 50W with MACD improving across multiple names simultaneously—a reset that would require a two-week retest of support with accumulation volume.
Emerging Markets — IEMG
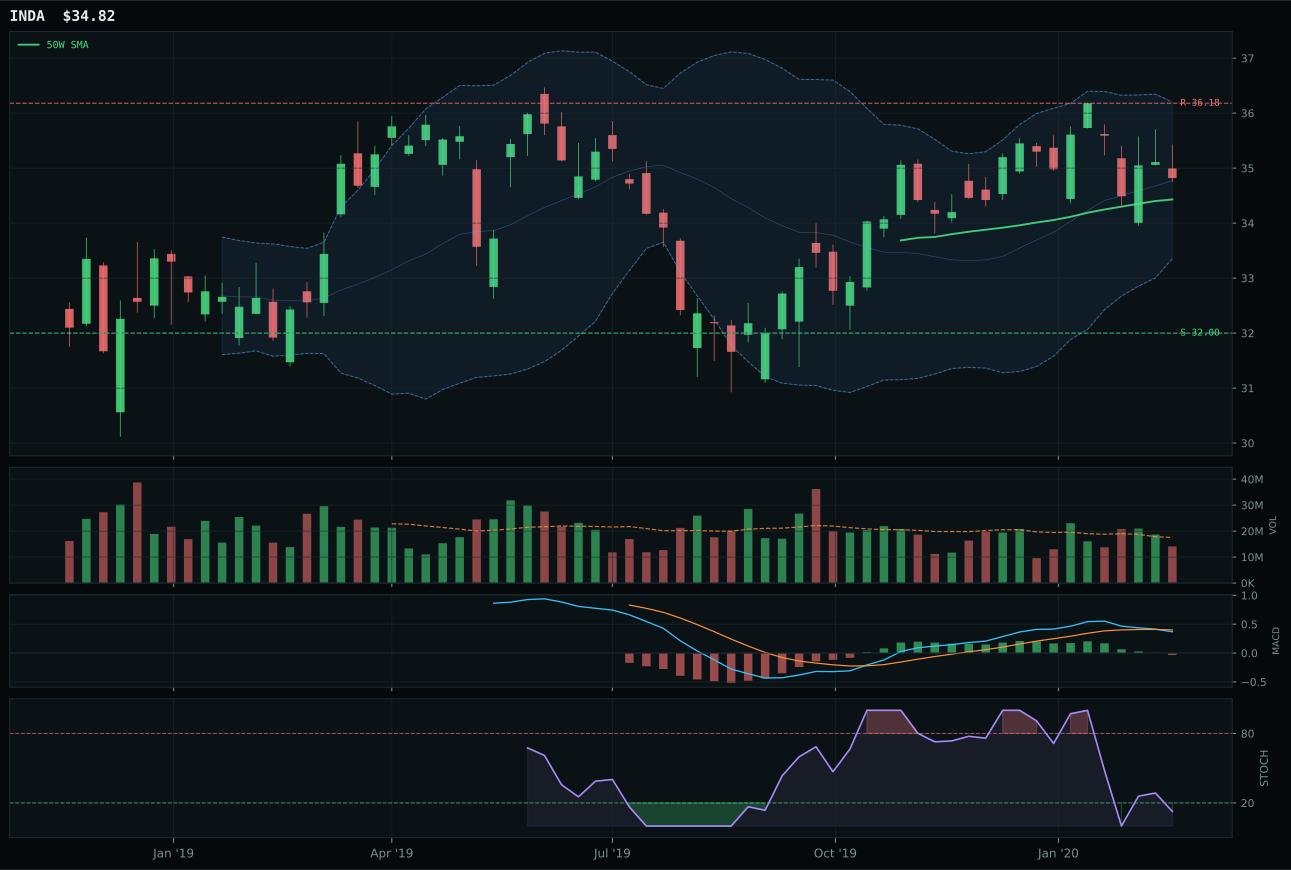
INDA has a compression near 50W profile with -5.4% 13-week relative strength versus SPY.
A failed hold above support would weaken the setup.
Actionable but governed by invalidation levels.
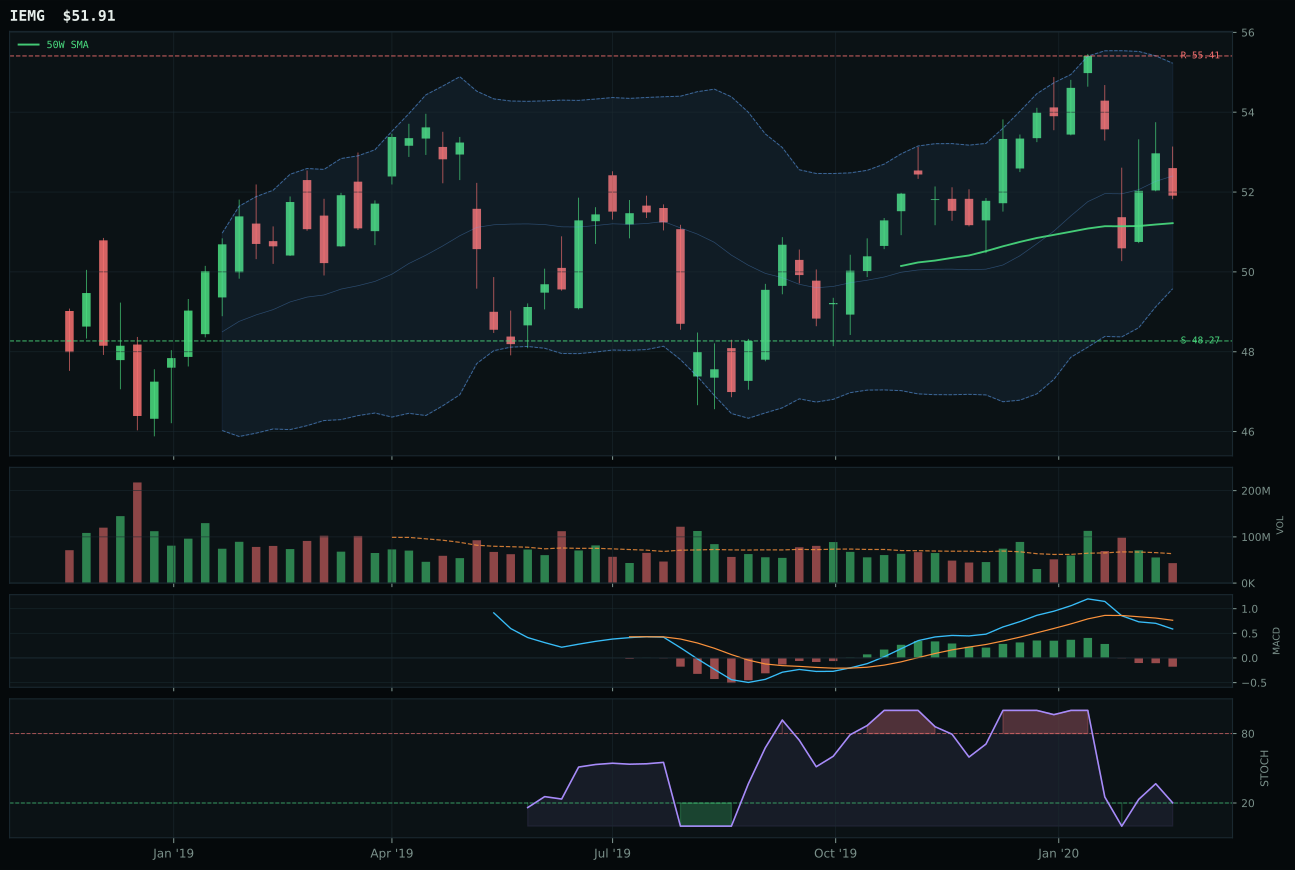
IEMG has a compression near 50W profile with -6.5% 13-week relative strength versus SPY.
A failed hold above support would weaken the setup.
Actionable but governed by invalidation levels.
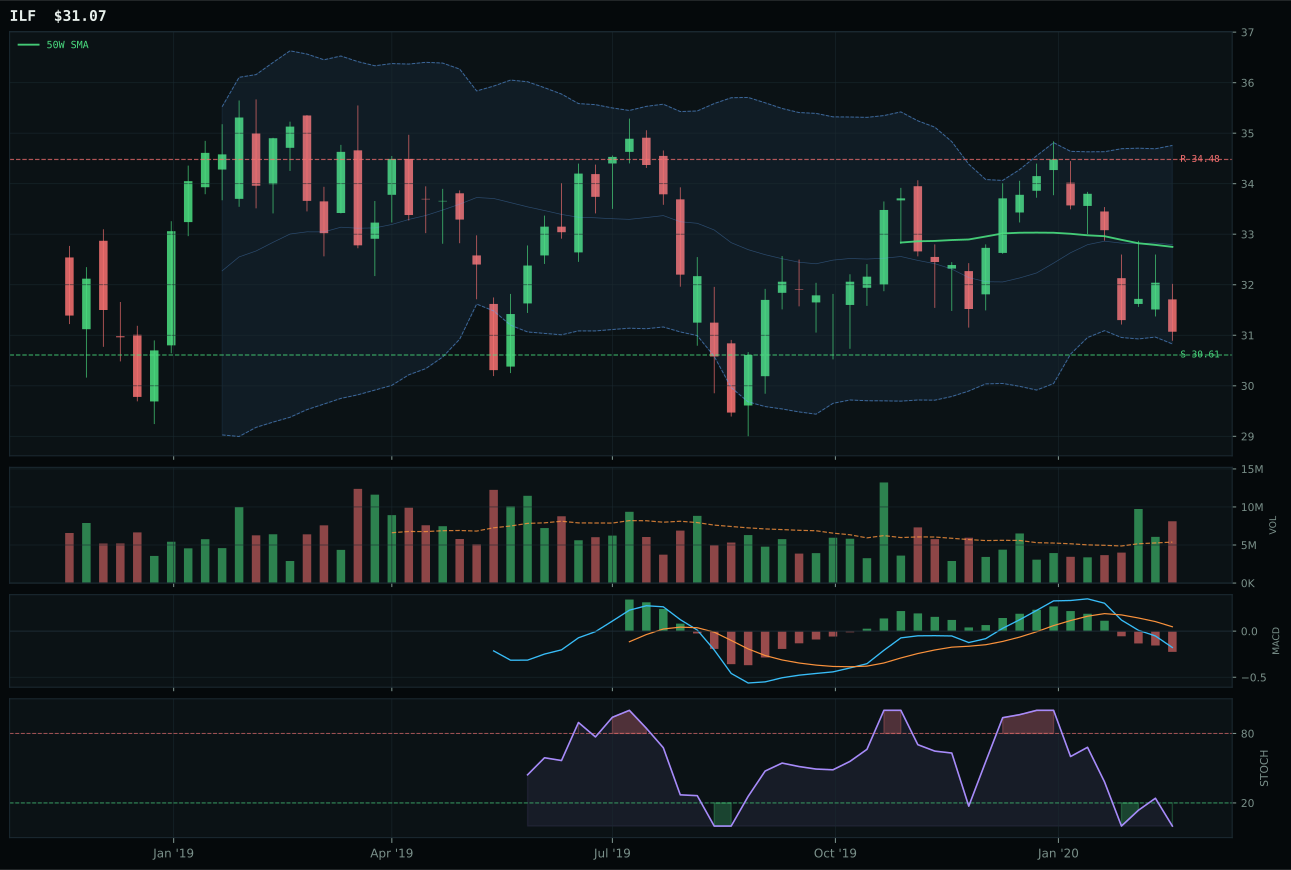
ILF has a pullback into support profile with -11.3% 13-week relative strength versus SPY.
A failed hold above support would weaken the setup.
Actionable but governed by invalidation levels.
IEMG beat INDA by matching its perfect timing score of 100 while delivering better risk/reward (68.1 vs 52.7) and structure quality (75.9 vs 73.4). Both names sit very close to the 50W—IEMG at 1.3% and INDA at similar compression—which creates identical timing scores, but IEMG's broader diversification gives it a cleaner technical structure and stronger Fibonacci zone location. INDA's stochastic RSI is oversold turn-up (0.0-range momentum), a more violent setup, while IEMG's is rising mid-zone, a steadier entry. The decisive factor is risk/reward: IEMG offers 7.5% downside to support versus 6.3% upside to resistance, creating asymmetry, while INDA is tighter. Both have weak momentum confirmation (15 and 31) and thin volume participation, but IEMG's compression near the 50W is less explosive and more sustainable than INDA's oversold turn-up.
Emerging Markets holds a tier-2 allocation of 5% with a final category score of 45.3 and eligible status of True. The category's macro fit of 70.0 is strong: Goldilocks supports risk assets at +8, EM liquidity support is active at +14, and liquidity expansion at +8 create genuine tailwinds. However, IEMG's momentum confirmation of 15.0 and the broader basket's momentum weakness (all three names have negative 4W momentum) prevent this from earning top-2 status. The 13W return of 0.7% for IEMG reflects a sector grinding sideways after a broader 10.5% 26W rally—this is consolidation, not breakout. IEMG's compression near the 50W at 1.3% with rising mid-zone stochastic and MACD bearish/weakening is a rest before expansion, but the market has not yet committed. The allocation persists because EM liquidity support and Goldilocks are real macro signals, and the compression zone offers low entry risk if buyers show up. For this category to earn promotion, MACD would need to turn bullish, volume would need to climb above 0.75x, and momentum confirmation would need to exceed 50—a reset that requires risk-on sentiment and EM capital inflows.
Defense & Aerospace — ITA
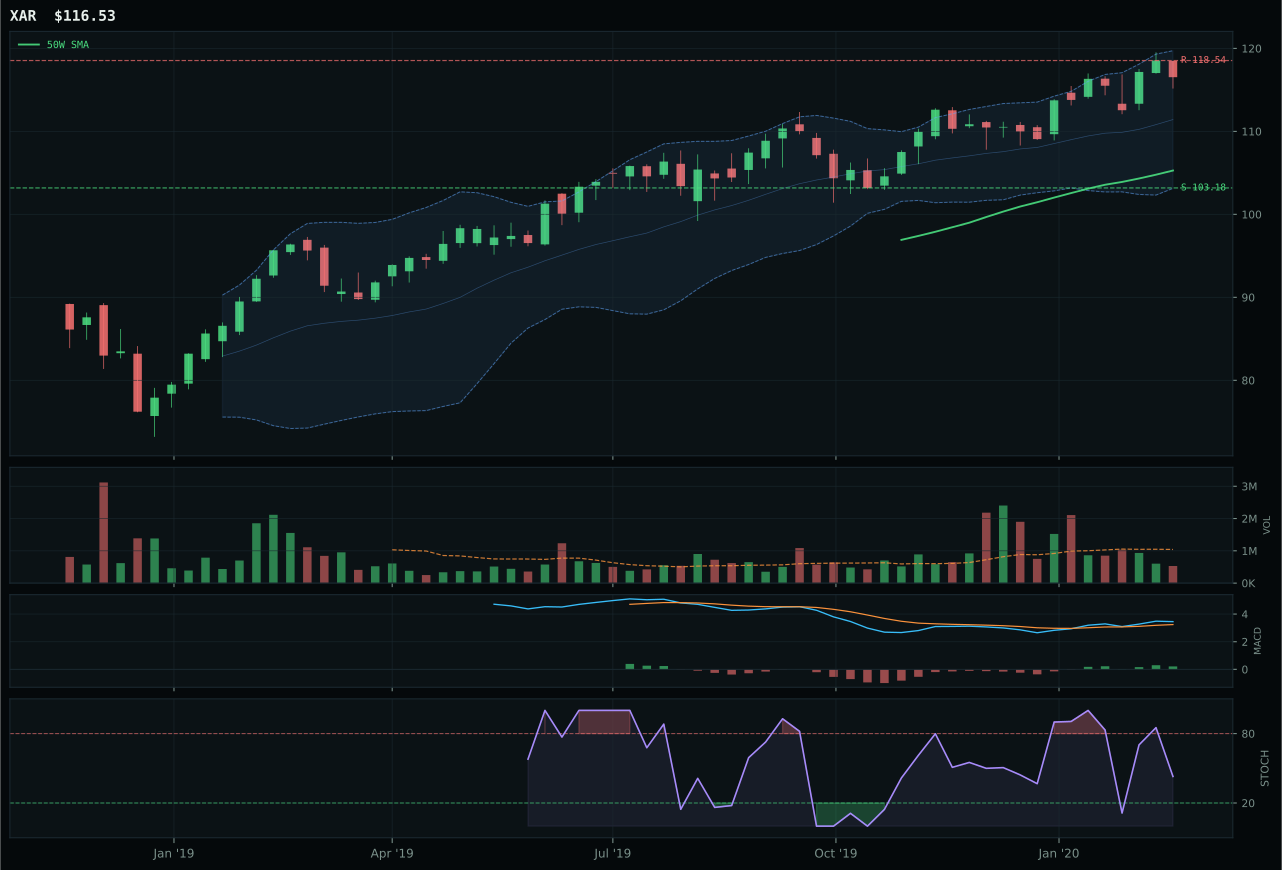
XAR has a neutral structure profile with -1.6% 13-week relative strength versus SPY.
A failed hold above support would weaken the setup.
Actionable but governed by invalidation levels.
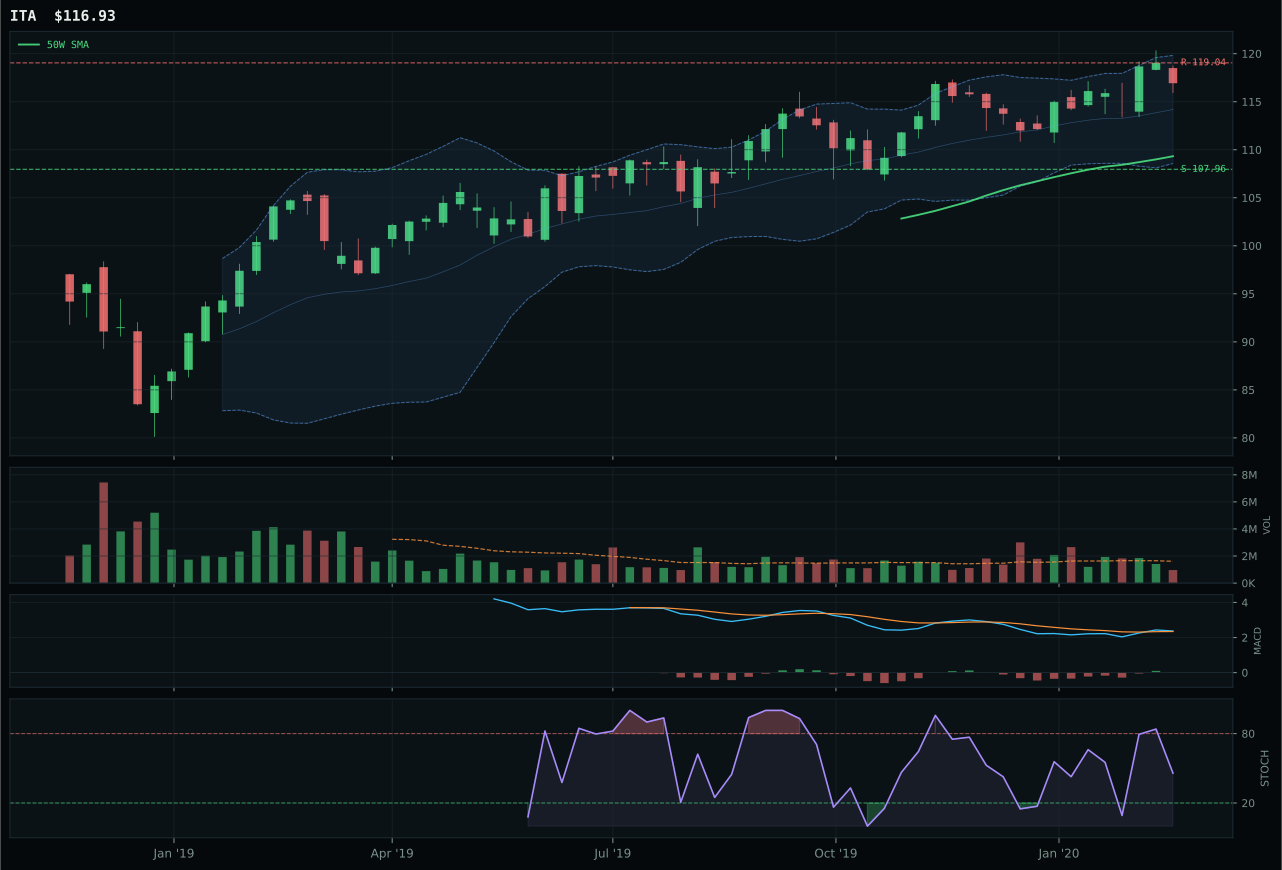
ITA has a neutral structure profile with -6.1% 13-week relative strength versus SPY.
A failed hold above support would weaken the setup.
Actionable but governed by invalidation levels.
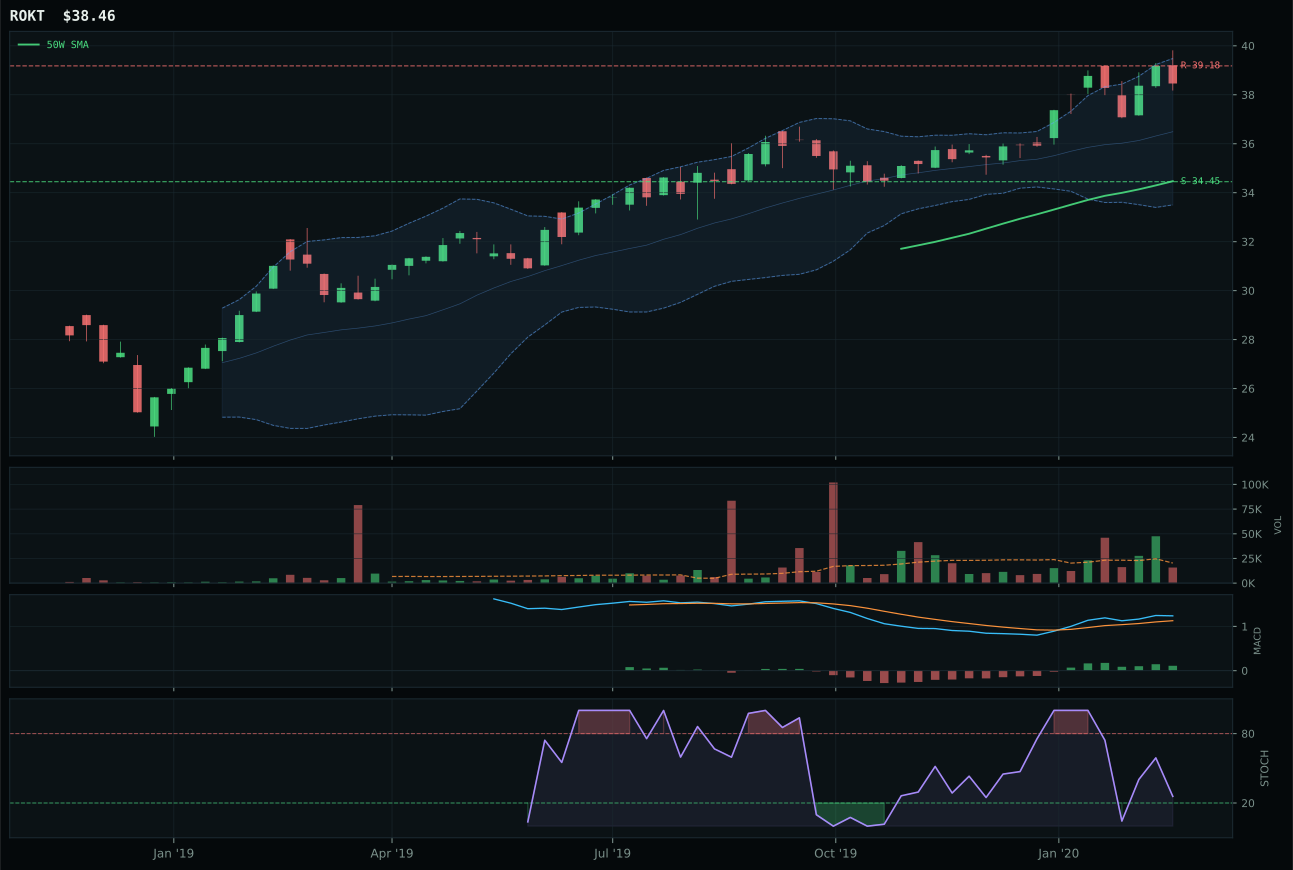
ROKT has a neutral structure profile with 1.5% 13-week relative strength versus SPY.
A failed hold above support would weaken the setup.
Tracked, but not top-2 eligible because: .
ITA won by a razor-thin 0.1-point margin over XAR, which means the decision hinged on execution quality rather than conviction. Both hold the same neutral structure and sit near support, but ITA's MACD is bullish and improving while XAR's is flattening, and ITA's timing score of 83 versus 70 reflects proximity to the 50W at just 7.0%—a zone where support can trigger a rotation. The 13W return gap is dramatic: ITA at 1.2% versus XAR at 5.6%, but that weakness proves the point. ITA is being accumulated at lower prices with improving momentum, while XAR has already run hard. The risk/reward differential of 48.9 versus 39.4 favors the quieter chart because downside to support is only 8.3%, leaving room for a failed hold without much pain. Thin volume participation at 0.60x the average is a caution, but it also means accumulation can happen without fanfare.
Defense & Aerospace holds a tier-2 allocation of 5% despite a final category score of 44.8 because it qualified as eligible and has defensive rotation active at +8 in a Goldilocks environment. This is a category held more for positioning than performance: the macro fit of 63.0 acknowledges that defensive names tend to compound when central banks are easing, but the technical evidence of 70.1 is moderate and the relative strength of -6.1% versus SPY shows this sector is lagging the broad market. ITA's trend score of 90.9 and timing of 83 are strong, but momentum confirmation at 42.6 and volume-price sponsorship at 53.0 reveal that buyers are not rushing in. The allocation survives because defensive rotation is a real macro signal and ITA's MACD is improving into support. For this category to earn promotion, it would need positive relative strength, above-average volume participation, and the momentum score to climb above 60—a shift that would require proof that institutions are rotating into durability.
Nuclear Energy — NLR
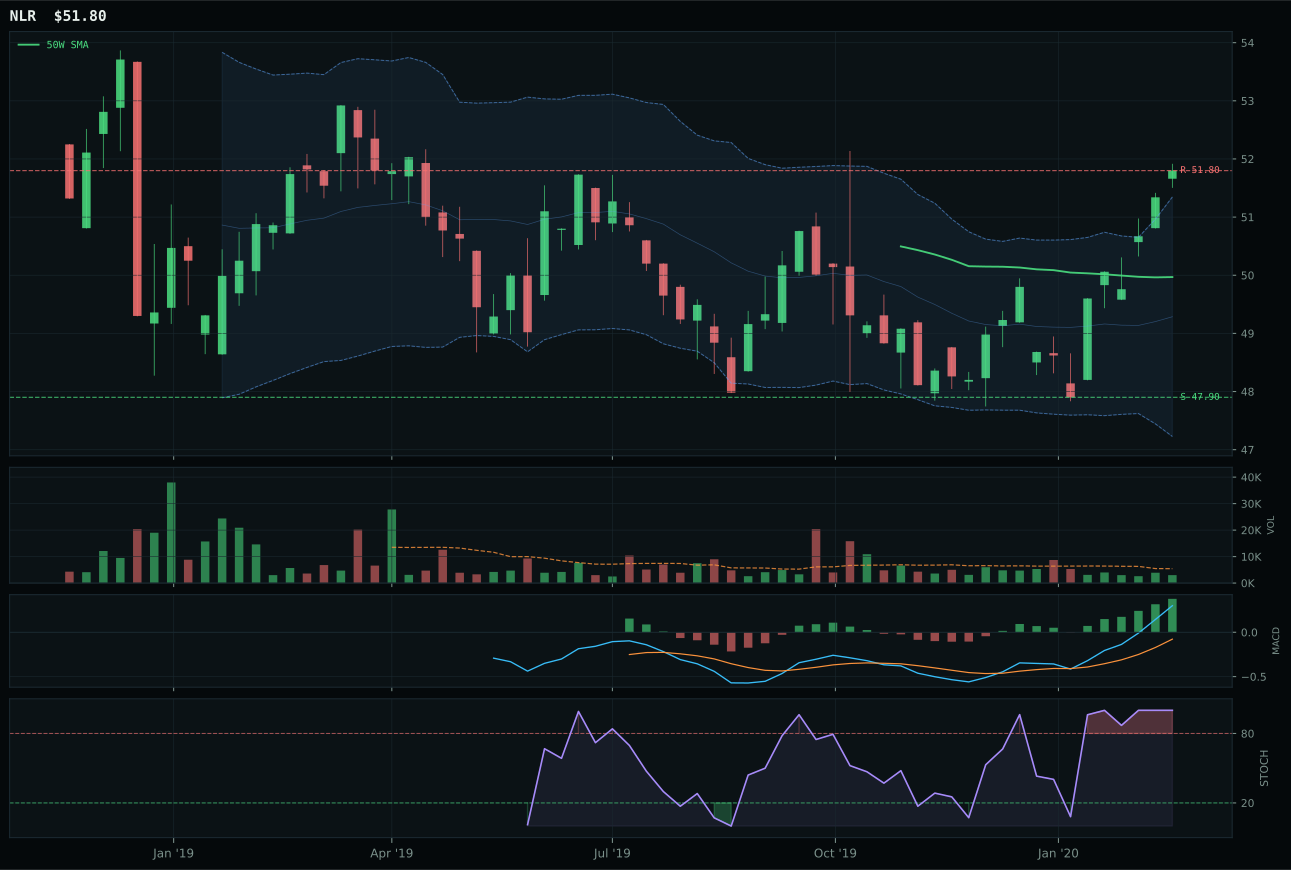
NLR has a neutral structure profile with 0.1% 13-week relative strength versus SPY.
A failed hold above support would weaken the setup.
Tracked, but not top-2 eligible because: .
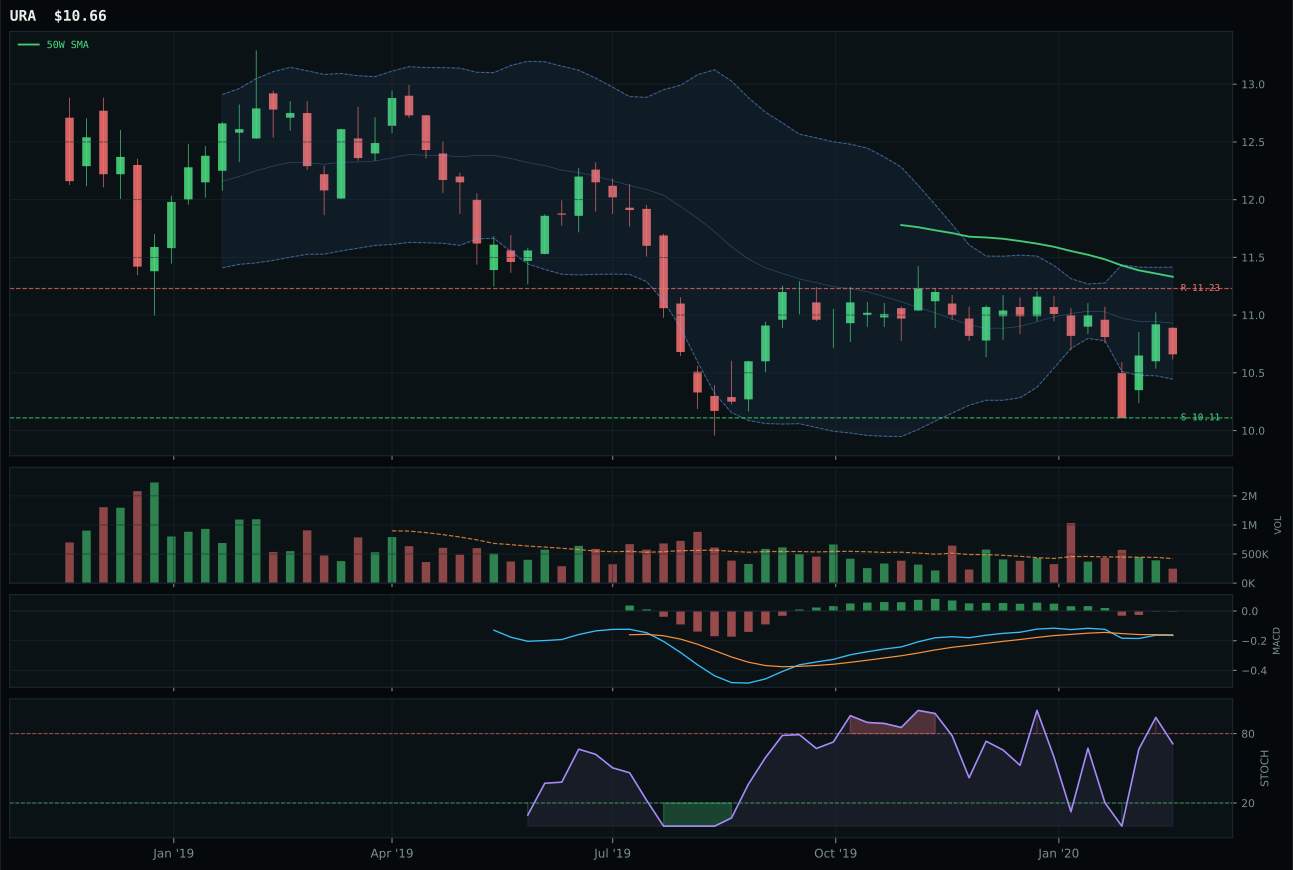
URA has a neutral structure profile with -10.3% 13-week relative strength versus SPY.
Extension and support failure are the main tactical risks.
Tracked, but not top-2 eligible because: structurally broken.
NLR won the Nuclear Energy category with a 63.3-point demolition of URA, though the win masks deeper problems with the category itself. NLR trades above both the 50W and 200W with a perfect trend score of 100, and its timing is excellent at 90 with price only 3.7% from the 50W and MACD bullish and improving. The 7.3% 13W return and 5.2% category-relative strength show NLR is accumulating while URA breaks down. However, momentum confirmation is 77.8 and volume participation is thin at 0.55x, which means this is not a genuine breakout—it is a quiet move with limited institutional sponsorship. Stochastic RSI at overbought momentum (1.00) confirms the setup is extended relative to its 50W. URA failed because it scored 0.0 on technical evidence with MACD bearish/weakening and -10.3% relative strength; it is structurally broken.
Nuclear Energy holds a tier-2 allocation of 5% with a final category score of 21.2 and ineligible status of False. The category's macro fit of 50.0 is neutral—defensive rotation at +6 helps, but credit stress at -5 and the absence of category-specific macro sponsorship limit the tailwind. NLR's technical evidence of 45.0 is moderate, and the macro/narrative fit of 56.0 cannot overcome the category's structural mediocrity. This allocation survives because NLR's trend and timing are locally strong and defensive rotation is real, but it is a low-conviction hold. The category's ineligibility reflects that momentum confirmation at 77.8 and volume-price confirmation at 70.4 are not convincing enough for a top-2 or tier-1 position. For nuclear to earn a better allocation, it would need to combine NLR's trend strength with broader institutional participation—meaning volume would need to climb above 0.75x, momentum confirmation would need to exceed 85, and category-relative strength would need to improve versus broader utilities. Currently it is a quiet accumulation, which is fine for tier-2 but insufficient for commitment.
Traditional Energy — XLE
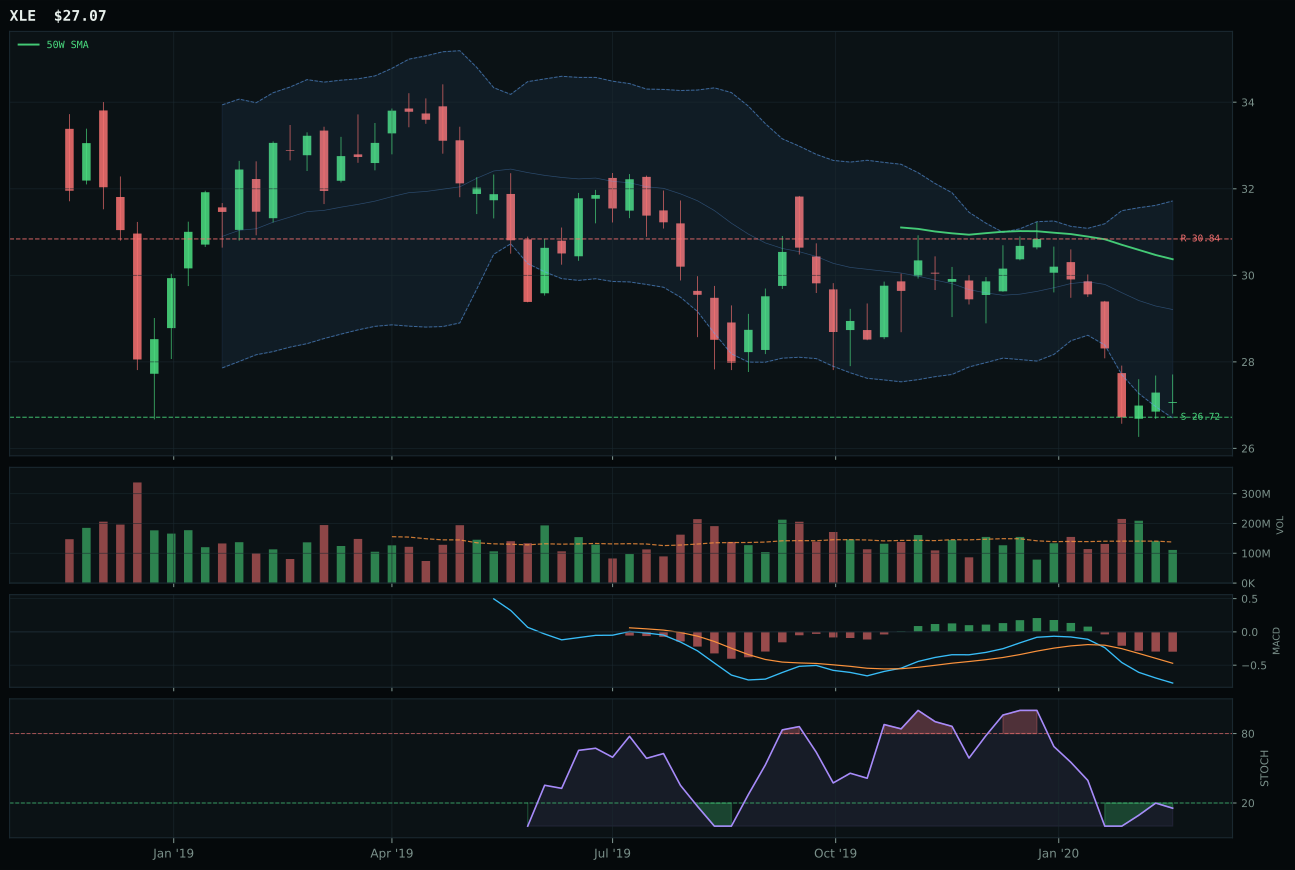
XLE has a pullback into support profile with -16.8% 13-week relative strength versus SPY.
Extension and support failure are the main tactical risks.
Tracked, but not top-2 eligible because: structurally broken.
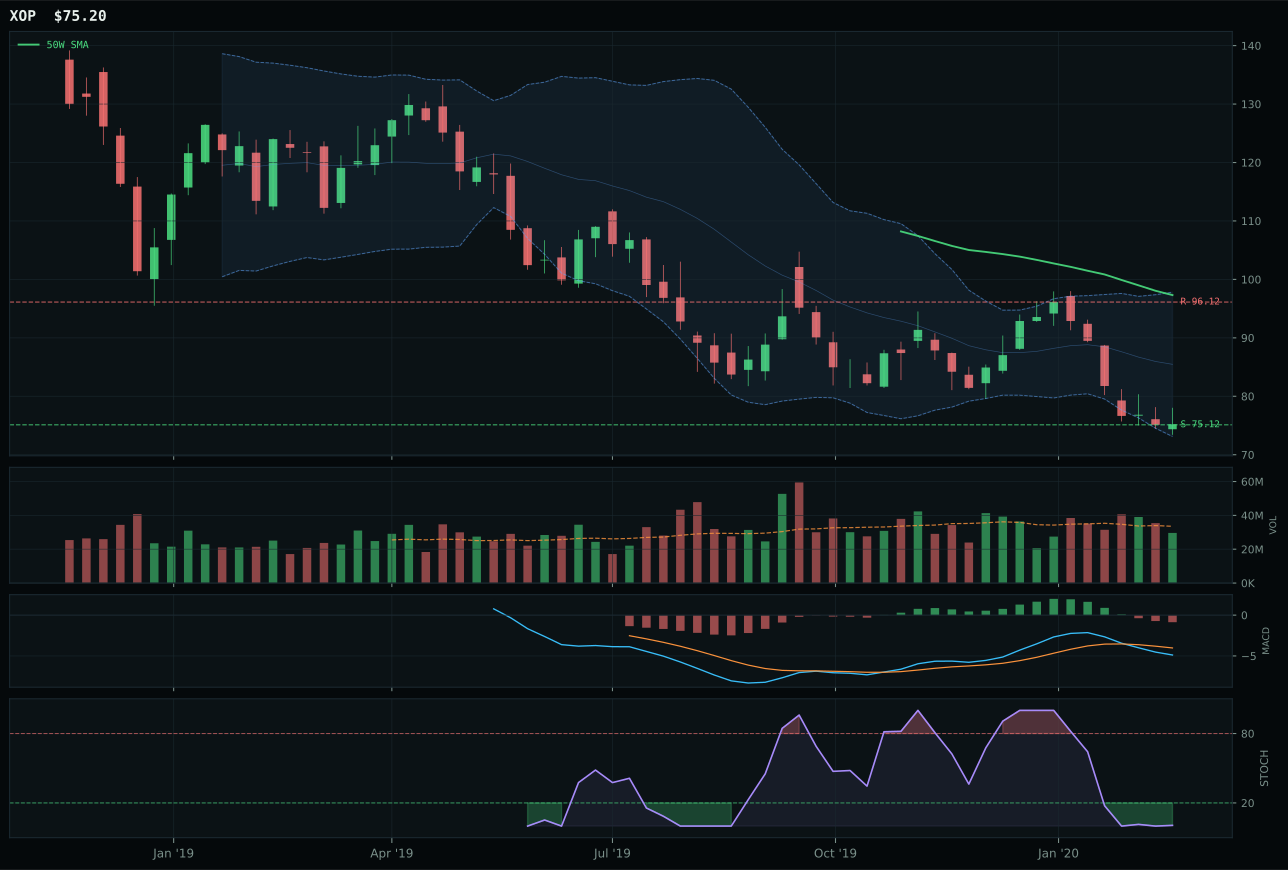
XOP has a pullback into support profile with -17.9% 13-week relative strength versus SPY.
Extension and support failure are the main tactical risks.
Tracked, but not top-2 eligible because: structurally broken.
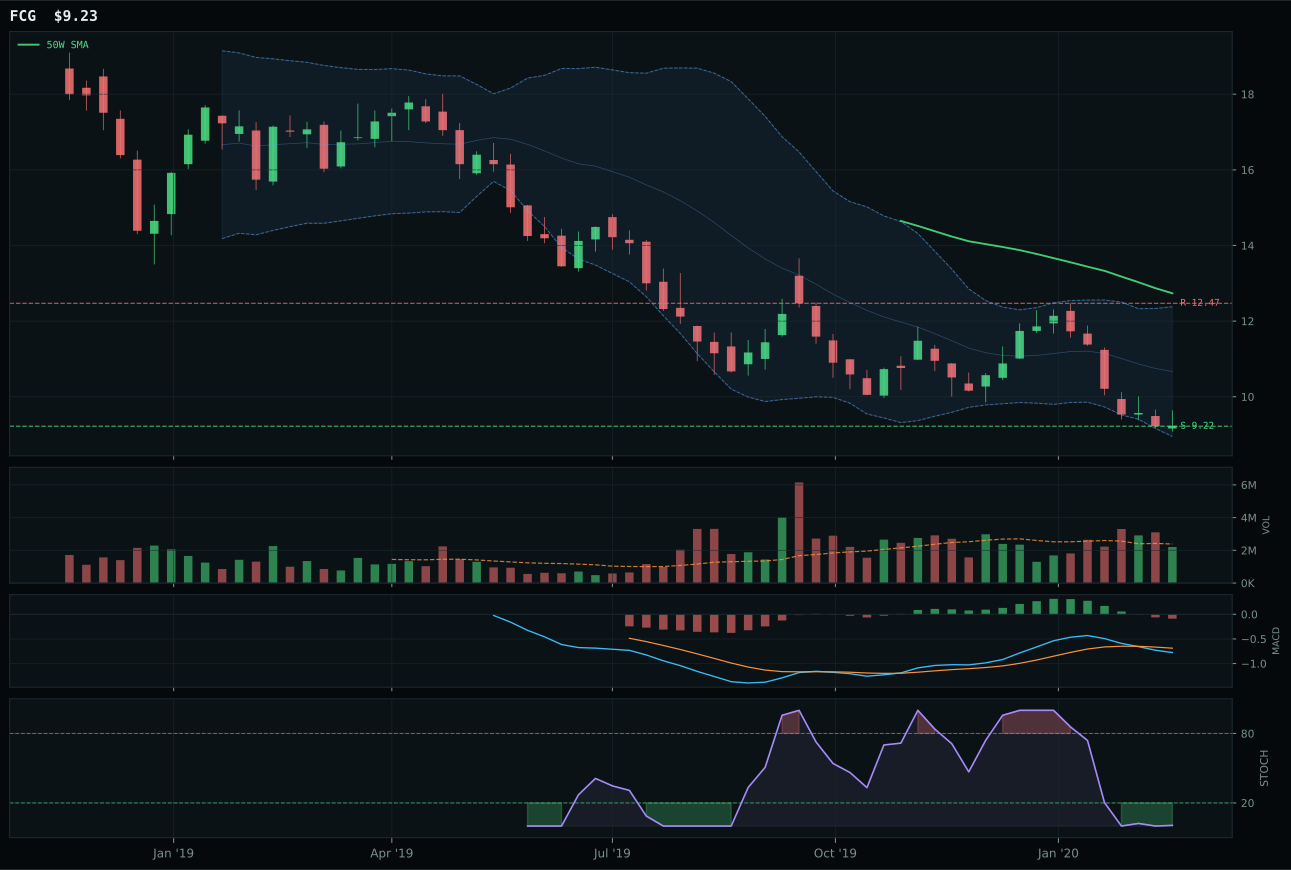
FCG has a pullback into support profile with -19.4% 13-week relative strength versus SPY.
Extension and support failure are the main tactical risks.
Tracked, but not top-2 eligible because: structurally broken.
XLE won a category so broken that the victory is almost meaningless: it scored 0.0 as the final category result, meaning it is allocated only because tier-2 ineligible categories still receive 5% in the allocation framework. XLE sits 10.9% below the 50W, deep underwater on the 200W, and has momentum confirmation of 0.0 with a 13W return of -9.5%. MACD is bearish/weakening, stochastic RSI is oversold turn-up, and volume is neutral—the textbook setup for capitulation, not accumulation. The only positive is a 90.0 risk/reward score into support at 26.72, but that is value in the wrong regime. XOP was even weaker at -17.9% relative strength versus SPY. This is not a category where you are picking winners; you are picking the least damaged name into a structural downtrend.
Traditional Energy receives a tier-2 allocation of 5% despite a final category score of 0.0 and ineligibility status of False. This is the portfolio's most damaged category allocation, held only because the overlay structure mandates tier-2 positions in every slot. The macro fit of 33.0 is the worst in the portfolio: disinflation pressure at -10 and credit stress at -7 are crushing headwinds. Energy demand is weak in a Goldilocks regime where growth is soft and inflation is absent. XLE's trend score of 12 and momentum confirmation of 0.0 reflect a sector in structural decline, not a tactical opportunity. The 5% slot survives because tier-2 allocations are mechanical—capital has to deploy somewhere—but this position is essentially a placeholder. For energy to earn a legitimate position, the category would need price to stabilize above the 200W, MACD to cross bullish, and relative strength to improve above -10%. A geopolitical event or OPEC production cut could trigger that reset, but currently this is dead money held only for structural completeness.
Industrial Metals — PICK
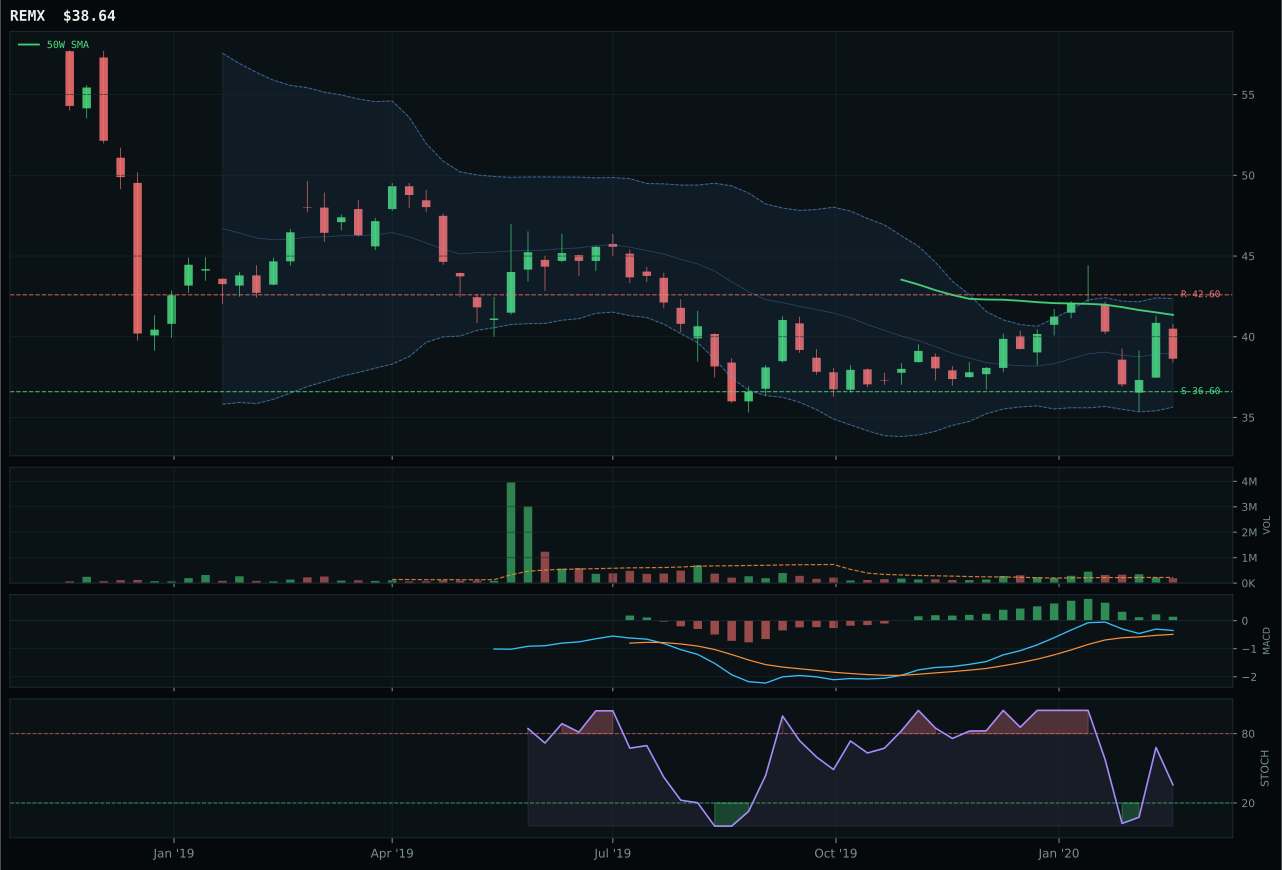
REMX has a neutral structure profile with -3.9% 13-week relative strength versus SPY.
Extension and support failure are the main tactical risks.
Tracked, but not top-2 eligible because: structurally broken.
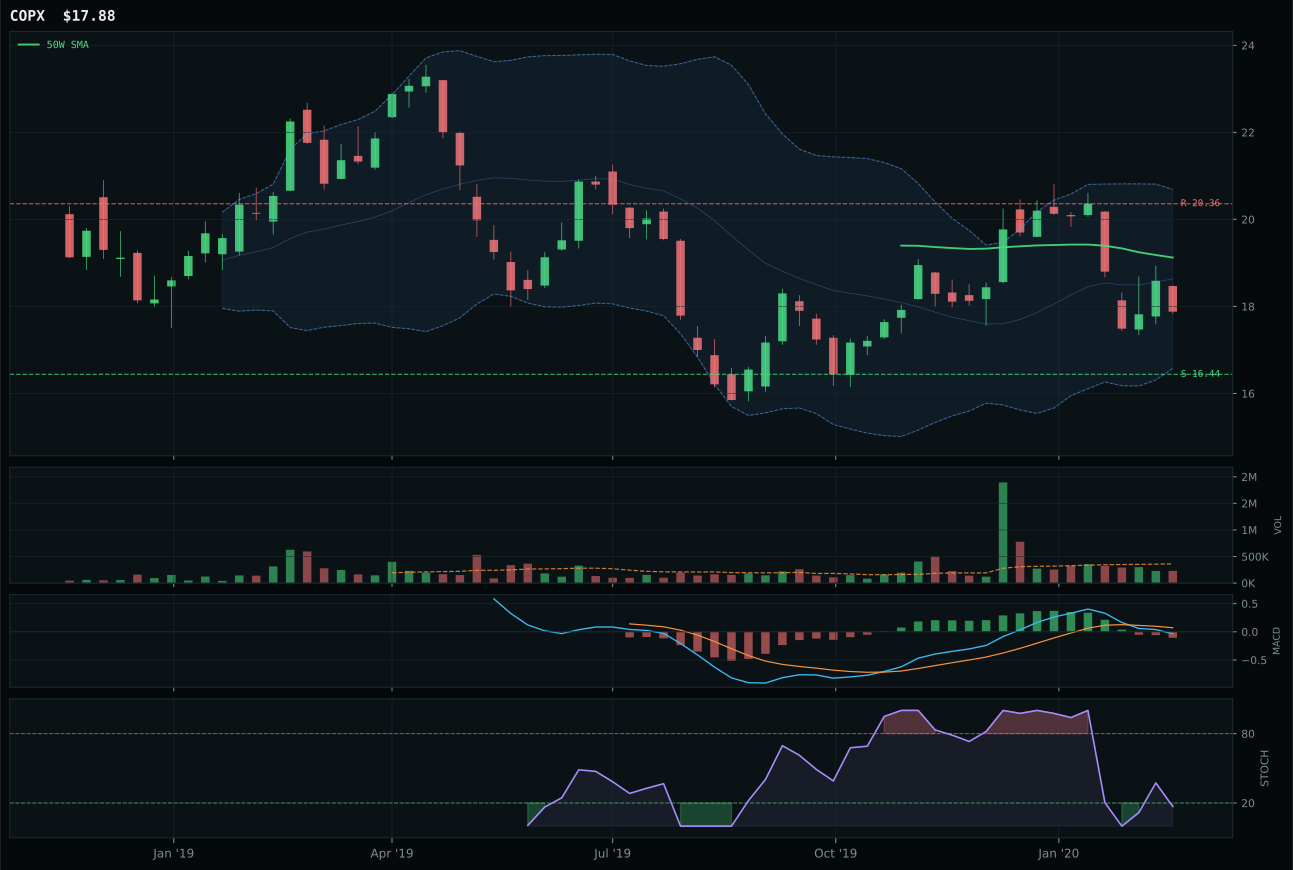
COPX has a neutral structure profile with -8.5% 13-week relative strength versus SPY.
Extension and support failure are the main tactical risks.
Tracked, but not top-2 eligible because: structurally broken.
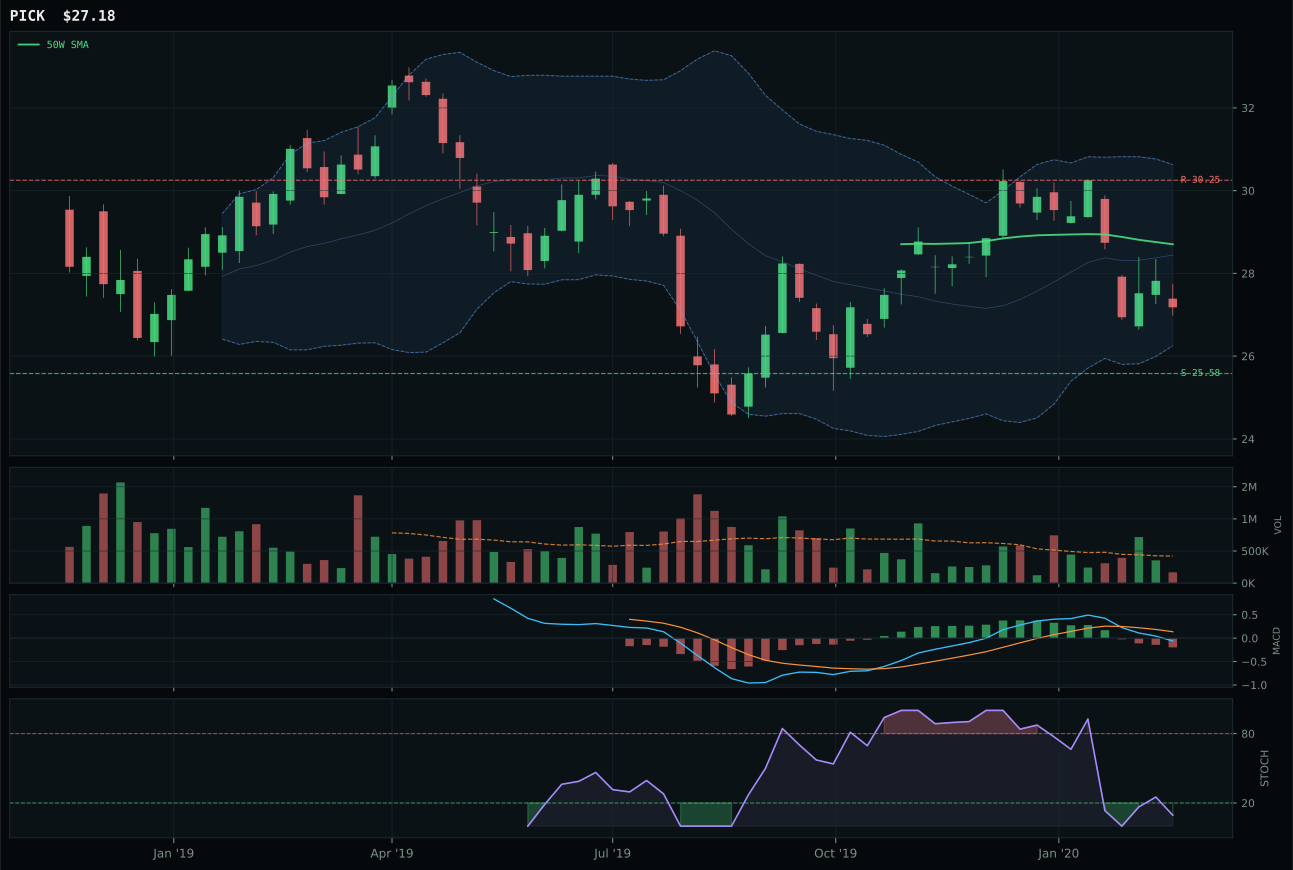
PICK has a neutral structure profile with -10.9% 13-week relative strength versus SPY.
Extension and support failure are the main tactical risks.
Tracked, but not top-2 eligible because: structurally broken.
PICK technically won the Industrial Metals category, but this is an academic point because the entire basket is ineligible due to structural failure. PICK sits 5.3% below the 50W, trades below the 200W, and has MACD bearish/weakening with a 13W return of -3.7% and -10.9% relative strength versus SPY. The only saving grace is an oversold stochastic RSI turn-up and a 82.2 risk/reward score to support—but momentum confirmation is 0.7 and volume-price confirmation is 8.3, meaning there is no market participation. The 0.0 technical evidence score and hard filter ineligibility mean this is a broken chart waiting for capitulation, not a valid setup. REMX offered 3.4% 13W returns and bullish MACD, but its structure and timing were also insufficient. This category lost because credit stress at -7 and industrial demand weakness overwhelmed Goldilocks support.
Industrial Metals is excluded entirely at 0% with a final category score of 13.7 and eligible status of False. This is a forced exclusion: the category's technical evidence is catastrophic across all three names, momentum confirmation is near-zero, and the hard filter for structural integrity rejected the representative. PICK's downtrend below the 50W and 200W, paired with bearish MACD and zero momentum confirmation, disqualifies the entire category from consideration. The macro fit of 49.0 provides some academic support—Goldilocks helps at +6—but credit stress at -7 is a headwind that overwhelms everything else. Industrial metals demand is tied to capex and growth, both of which are soft in this environment. For this category to earn a position, it would need MACD to cross bullish across at least two names, relative strength to improve above -5% versus SPY, and momentum confirmation to climb above 40. The hard filter reset would also require price to establish a base above the 200W with accumulation volume—a multi-week process that is not happening.
Agriculture & Livestock — MOO
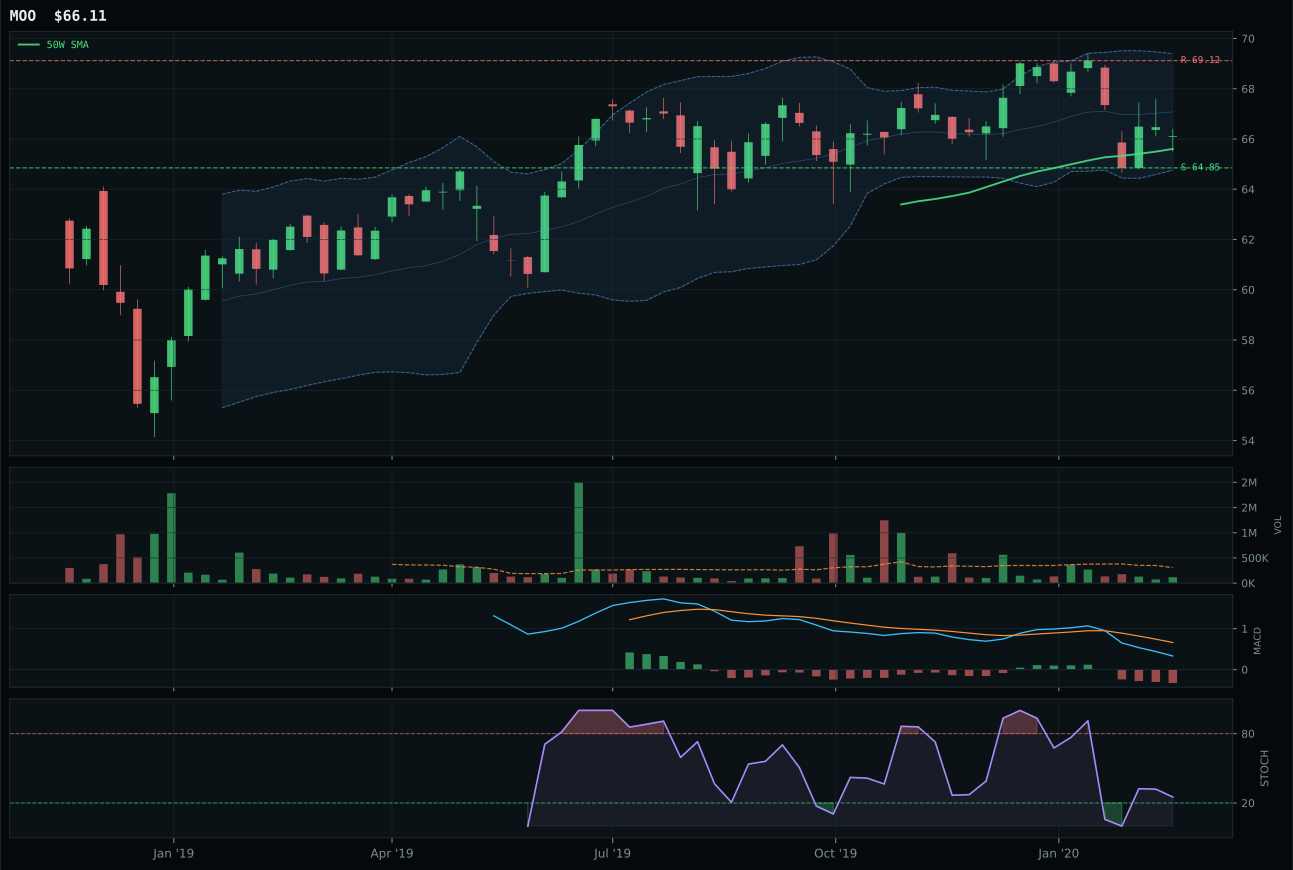
MOO has a pullback into support profile with -7.1% 13-week relative strength versus SPY.
A failed hold above support would weaken the setup.
Actionable but governed by invalidation levels.
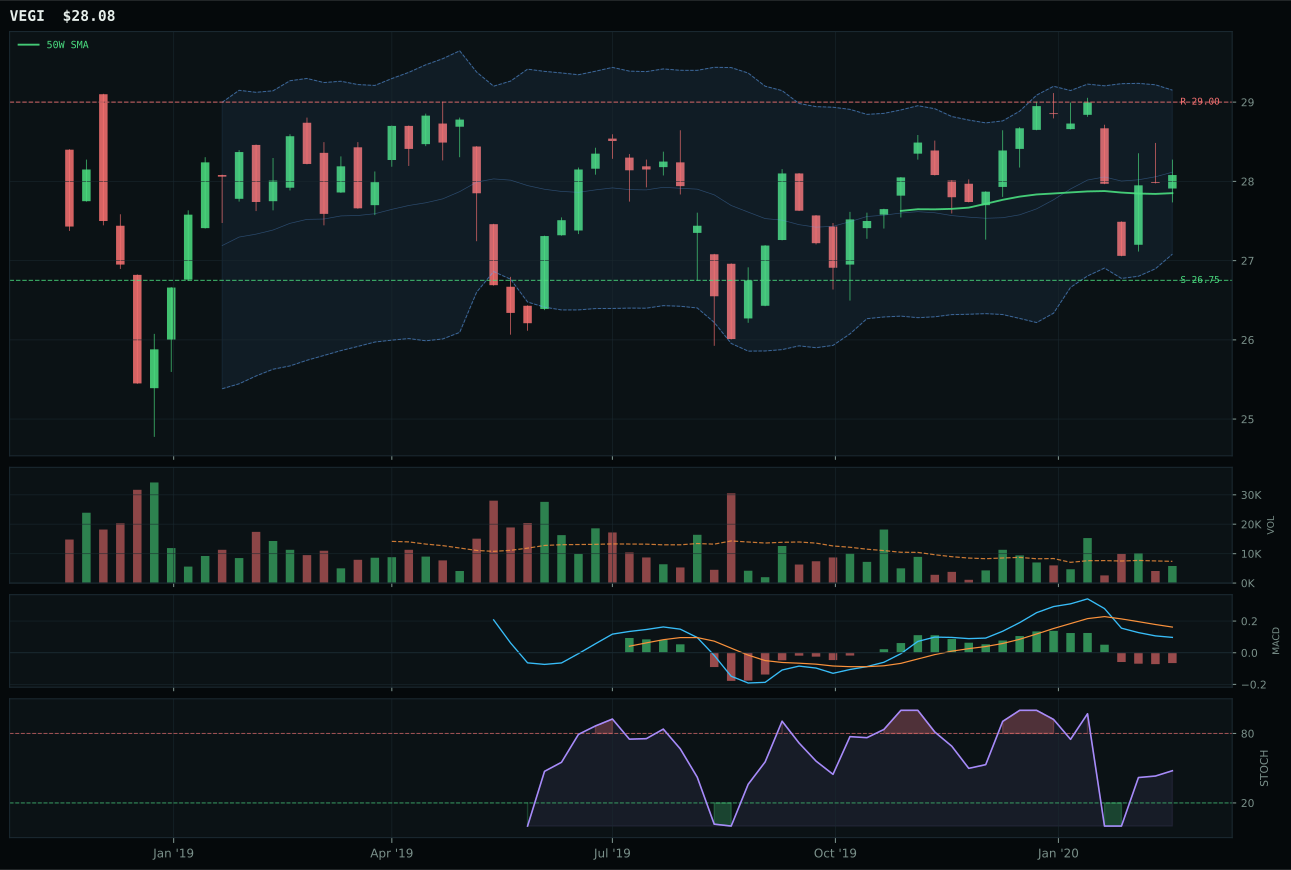
VEGI has a pullback into support profile with -6.2% 13-week relative strength versus SPY.
A failed hold above support would weaken the setup.
Tracked, but not top-2 eligible because: .
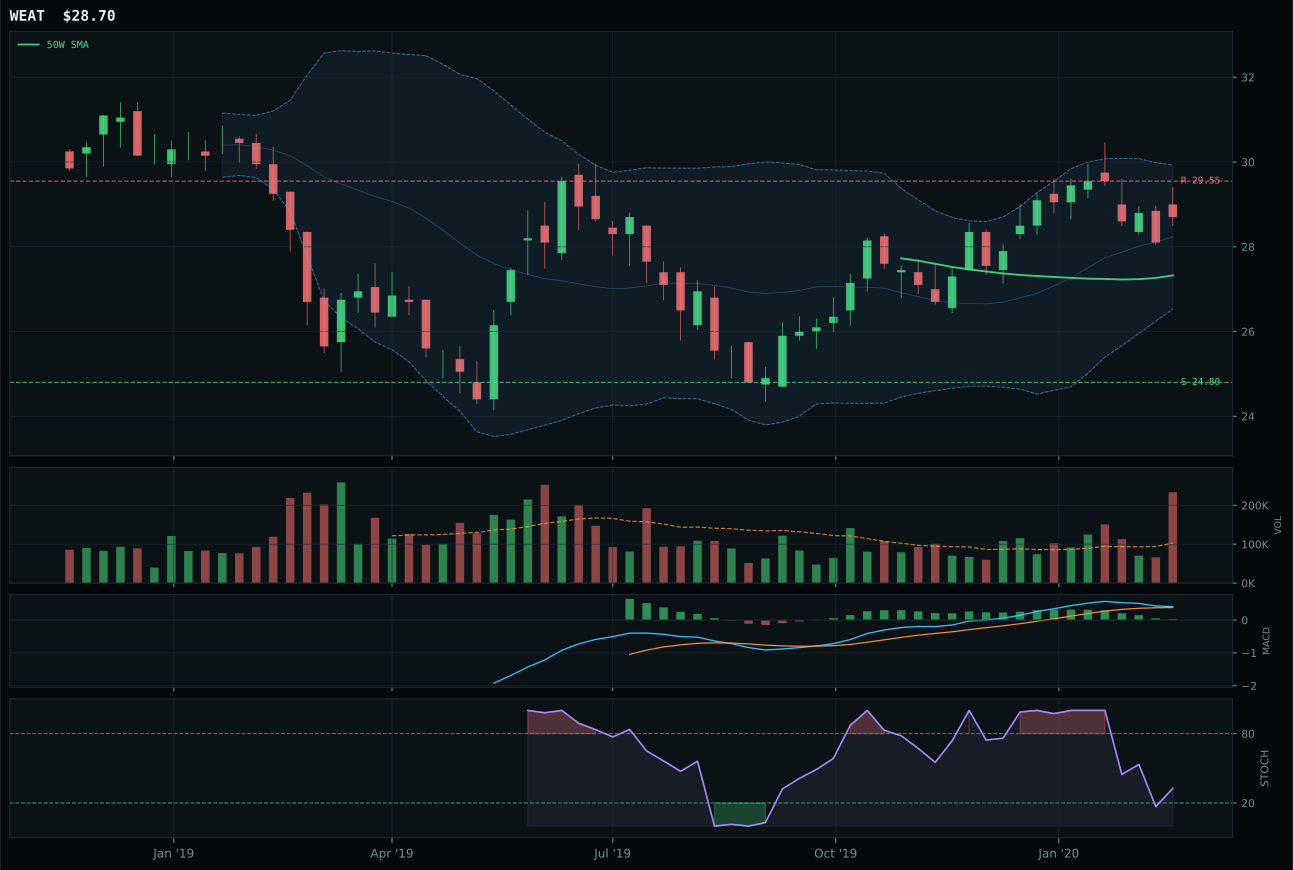
WEAT has a neutral structure profile with -2.1% 13-week relative strength versus SPY.
A failed hold above support would weaken the setup.
Tracked, but not top-2 eligible because: .
MOO won the category with a 24-point edge over VEGI, which sounds impressive until you realize it reflects how deeply broken this entire basket is. MOO's structure is pullback into support, its timing is perfect at 100 points because price is only 0.8% from the 50W, and its risk/reward is exceptional at 85.3—but none of that matters when the momentum confirmation score is 14.6 and MACD is bearish/weakening. This is a value trap, not a setup: the category has -7.1% relative strength versus SPY, a 13W return of 0.2%, and volume at thin participation of 0.38x. MOO 'wins' because it offers defined risk into support, but that does not make it investable. VEGI's weaker risk/reward of 56.5 ruled it out in a close race between two corpses.
Agriculture & Livestock is excluded from the allocation entirely this week at 0%, ranking outside the portfolio. The final category score of 6.2 reflects catastrophic technical failure: the basket's momentum confirmation is near-zero, MACD is bearish/weakening across all names, and relative strength of -7.1% shows this sector is structurally underperforming in the current regime. The macro fit of 42.0 and active disinflation pressure at -8 explain why—deflation in commodity prices is a headwind, not a tailwind. MOO's pullback into support with an 85.3 risk/reward score might seem attractive for a mean-reversion trade, but the absence of volume confirmation and the category's ineligibility filter confirm that this is a genuine exclusion, not a rotation. For agriculture to return to the allocation, the category would need MACD to turn bullish, relative strength to improve above -3%, and momentum confirmation to climb above 40—a complete technical reset that would require disinflation pressure to reverse or a sponsored shift in commodity demand.