
2020-02-14
Informational purposes only. The content in this report, including allocations, analysis, and commentary, is provided solely for informational and educational purposes. It does not constitute financial advice, investment advice, trading advice, or any other type of advice. Past performance does not guarantee future results. Always conduct your own research and consult a qualified financial professional before making investment decisions.
Some tracked tickers were excluded due to missing live weekly price data: SGOV: Historical cache SGOV has only 0 usable weekly bars; URNM: Historical cache URNM has only 11 usable weekly bars
Weekly Allocation
| Ticker | Category | Weight | Role |
|---|---|---|---|
| FBTC | 50% | Overlay | |
| IGV | Technology | 10% | Top-2 (10%) |
| SMH | AI | 10% | Top-2 (10%) |
| XLU | Utilities & Infrastructure | 5% | Tier-2 (5%) |
| ITA | Defense & Aerospace | 5% | Tier-2 (5%) |
| INDA | Emerging Markets | 5% | Tier-2 (5%) |
| GLD | Precious Metals | 5% | Tier-2 (5%) |
| XLE | Traditional Energy | 5% | Tier-2 (5%) |
| NLR | Nuclear Energy | 5% | Tier-2 (5%) |
Trade Instructions — Monday Open
Sell the tranche from 2020-01-17 (completing its 4-week hold). Buy the new tranche. Instructions show net portfolio changes — same-asset positions cancel, weight changes show the delta.
| Action | Ticker | Instruction |
|---|---|---|
| SELL | IEMG | Sell entire IEMG position (2.50% of portfolio) |
| SELL | BOTZ | Sell entire BOTZ position (1.25% of portfolio) |
| SELL | XAR | Sell 50% of XAR position (reduce 2.50% → 1.25%) |
| SELL | PICK | Sell 33% of PICK position (reduce 3.75% → 2.50%) |
| SELL | MOO | Sell 50% of MOO position (reduce 2.50% → 1.25%) |
| BUY | SMH | Buy SMH — 33.33% of freed cash (adds 2.50% to portfolio) |
| BUY | INDA | Buy INDA — 16.67% of freed cash (adds 1.25% to portfolio) |
| BUY | XLE | Buy XLE — 16.67% of freed cash (adds 1.25% to portfolio) |
| BUY | ITA | Buy ITA — 16.67% of freed cash (adds 1.25% to portfolio) |
| BUY | NLR | Buy NLR — 16.67% of freed cash (adds 1.25% to portfolio) |
Current Portfolio After Trade
Combined holdings across all 4 active tranches. Each tranche is 25% of the portfolio.
| Ticker | % of Portfolio | Weight Bar |
|---|---|---|
| FBTC | 50.00% | |
| XLU | 8.75% | |
| IGV | 6.25% | |
| GLD | 6.25% | |
| SMH | 6.25% | |
| XLE | 5.00% | |
| INDA | 3.75% | |
| ITA | 3.75% | |
| PICK | 2.50% | |
| XLK | 2.50% | |
| NLR | 2.50% | |
| XAR | 1.25% | |
| MOO | 1.25% |
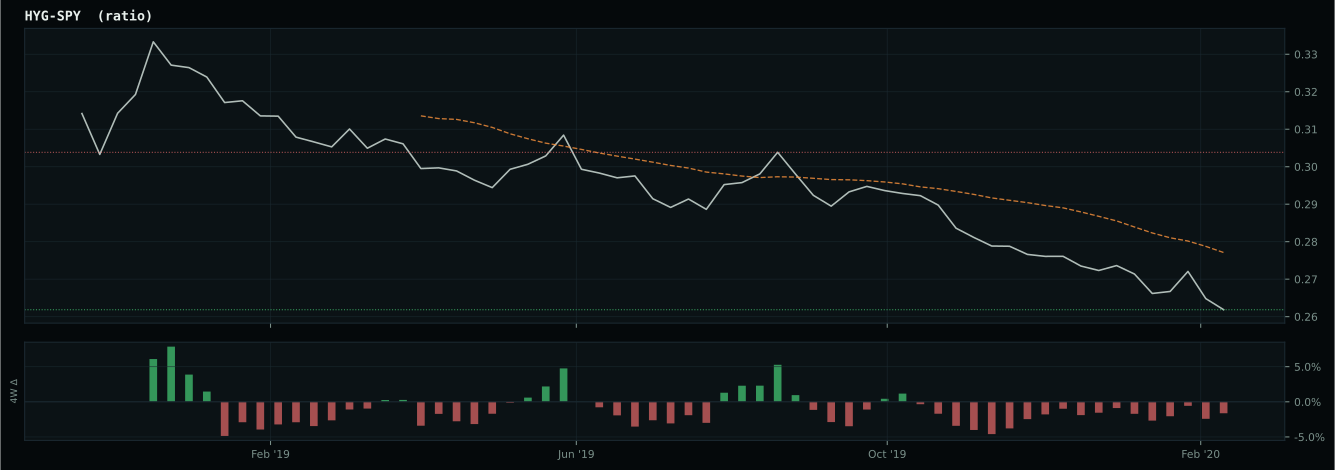
Macro Regime — Goldilocks
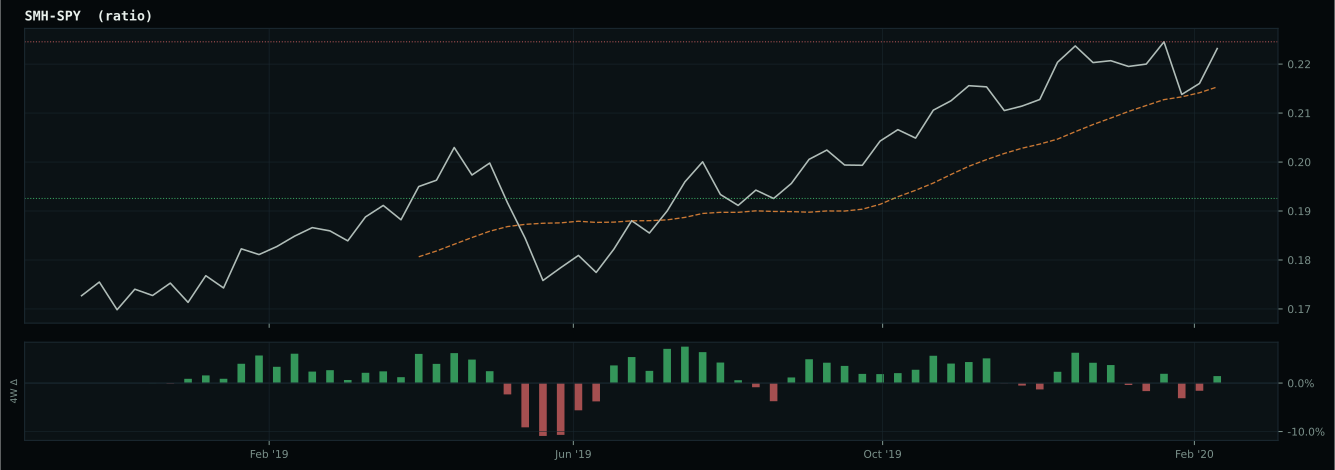
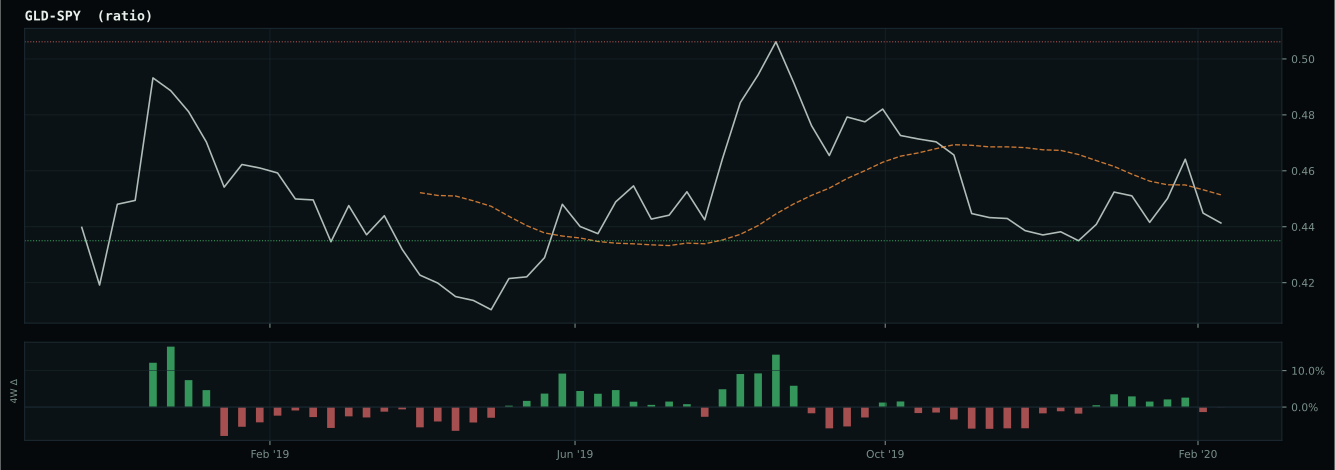
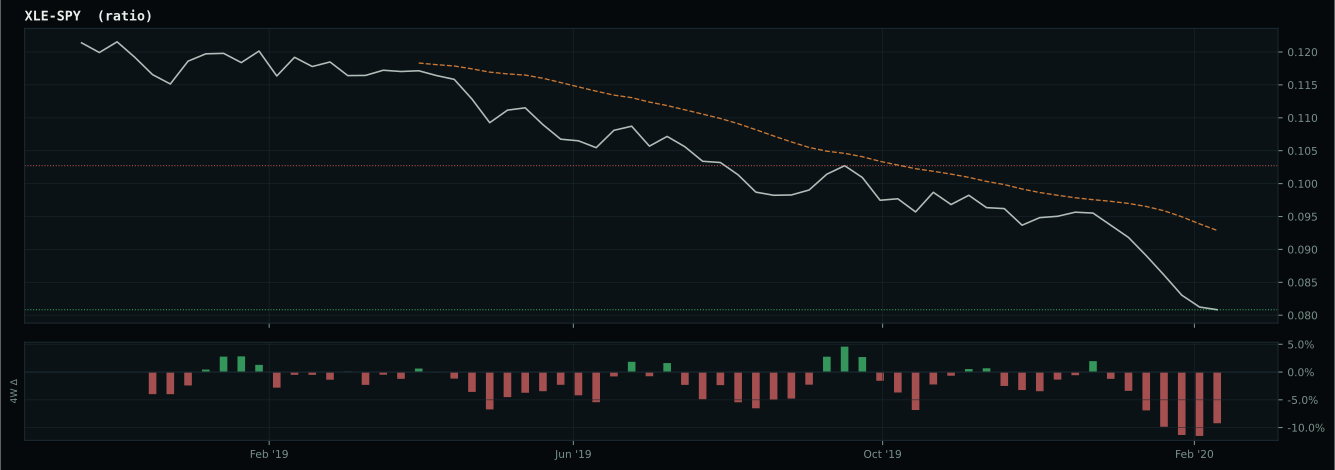
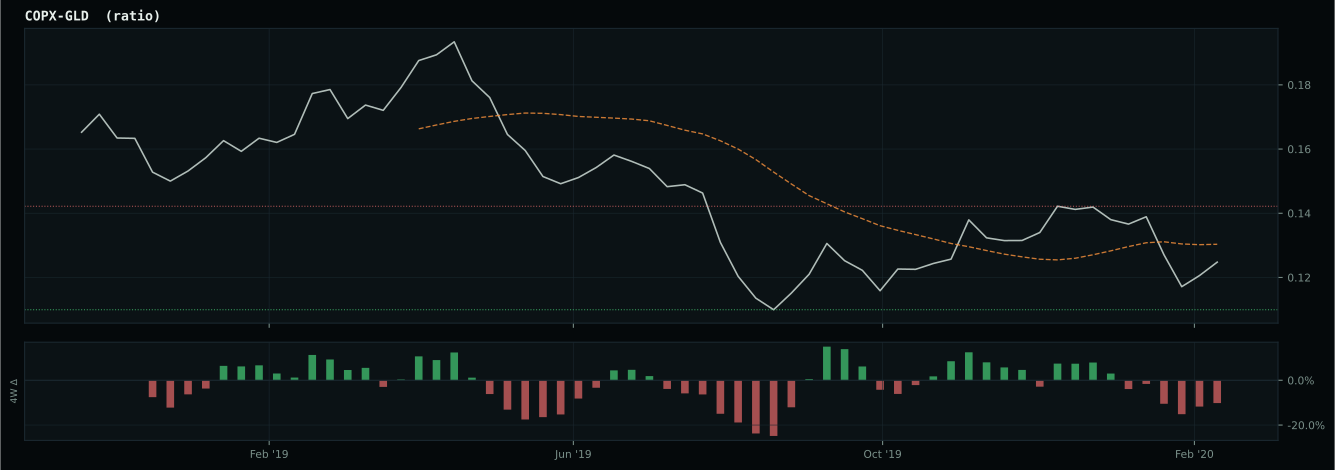
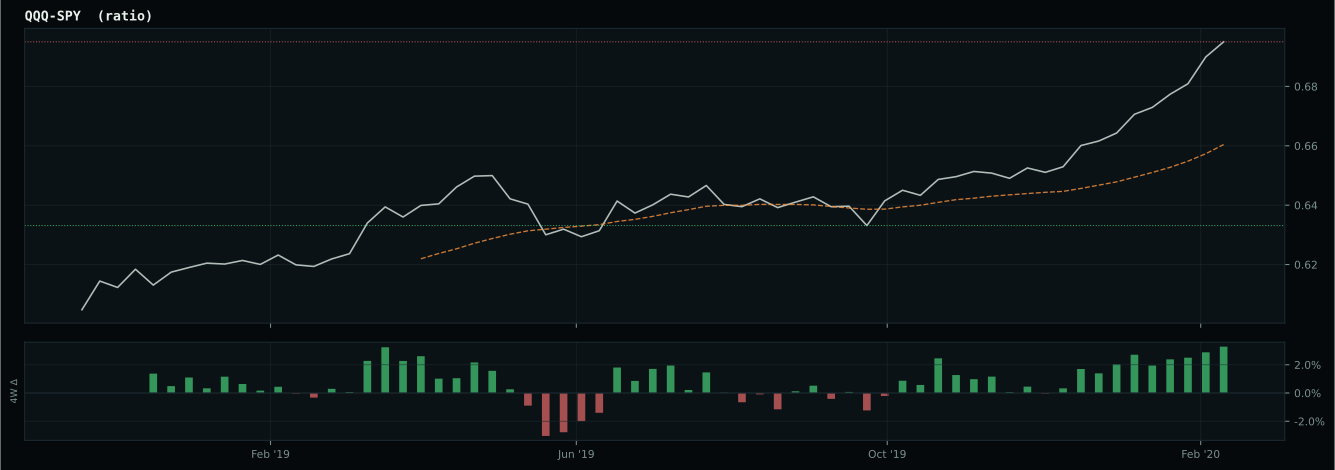
Macro Evidence Charts
Market-implied signals behind the macro regime scores. Each ratio compares two assets; the direction and slope of the ratio is what the macro engine reads.
Crypto Regime — TrendBTC
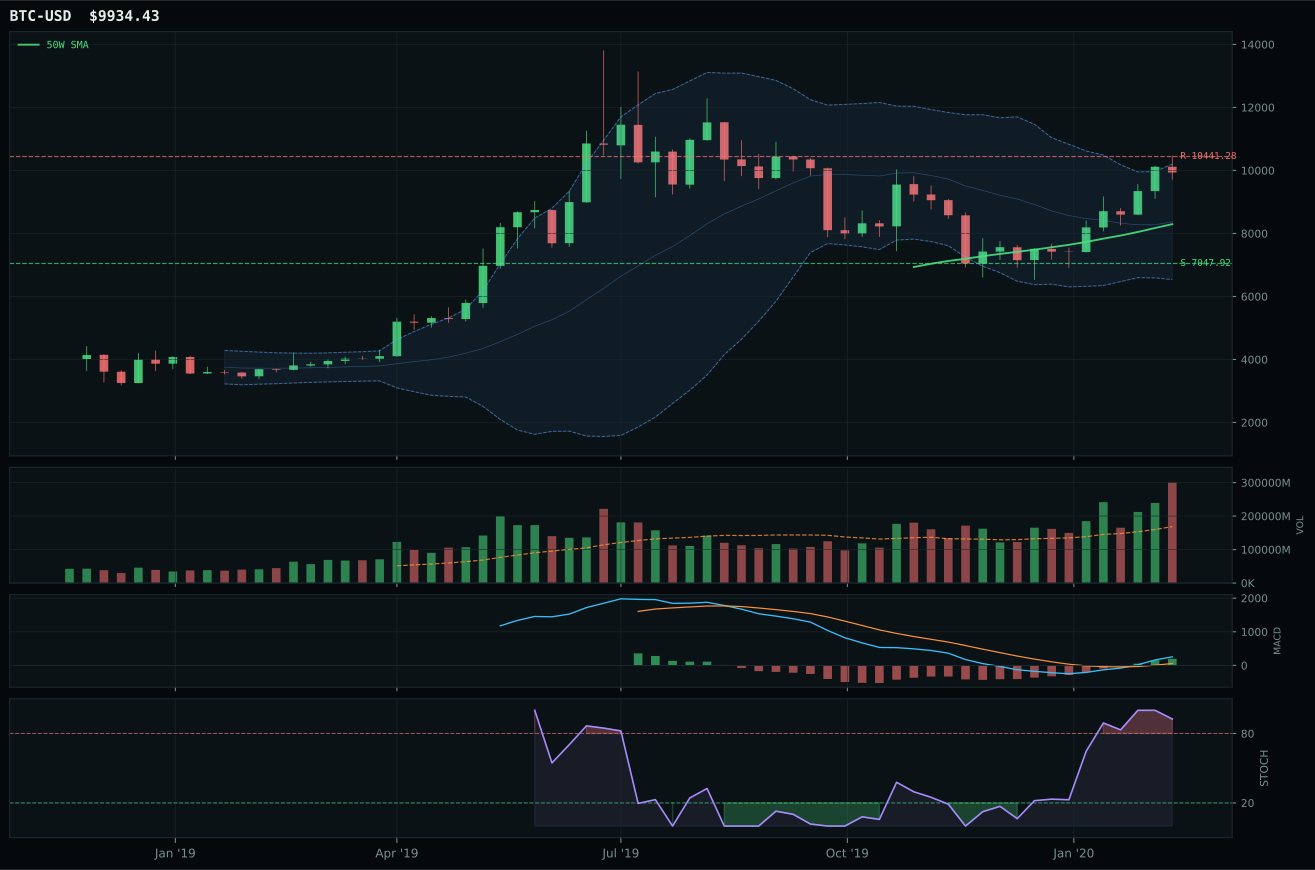
post-touch structure is too wide to count as a range; max/min close ratio is 3.33
TrendBTC confirmed: 2 consecutive closes above rising/flat 50W SMA
one or more available conditions failed

Category Rankings
| Rank | Category | Winner | Score | Alloc | 4W Ret | Peers (4W) |
|---|---|---|---|---|---|---|
| 1 | Technology | IGV | 65.4 | 20% | -22.40% | XLK -29.1% · CIBR -33.6% |
| 2 | AI | SMH | 64.8 | 20% | -28.76% | BOTZ -31.6% · AIQ -34.7% |
| 3 | Utilities & Infrastructure | XLU | 64.7 | 10% | -25.76% | IGF -41.8% · PAVE -34.9% |
| 4 | Defense & Aerospace | ITA | 60.3 | 10% | -39.09% | XAR -39.9% · ROKT -34.6% |
| 5 | Emerging Markets | INDA | 44.5 | 10% | -28.11% | IEMG -27.6% · ILF -41.4% |
| 6 | Precious Metals | GLD | 43.0 | 10% | -8.22% | GDX -41.4% · SLV -29.5% |
| 7 | Nuclear Energy | NLR | 20.9 | 10% | -28.65% | URA -31.1% |
| 8 | Industrial Metals | PICK | 14.8 | 10% | -35.27% | REMX -35.2% · COPX -37.2% |
| 9 | Agriculture & Livestock | MOO | 3.3 | 0% | -30.54% | VEGI -28.3% · WEAT -12.1% |
| 10 | Traditional Energy | XLE | — | 0% | -48.34% | XOP -55.9% · FCG -52.1% |
Technology — IGV
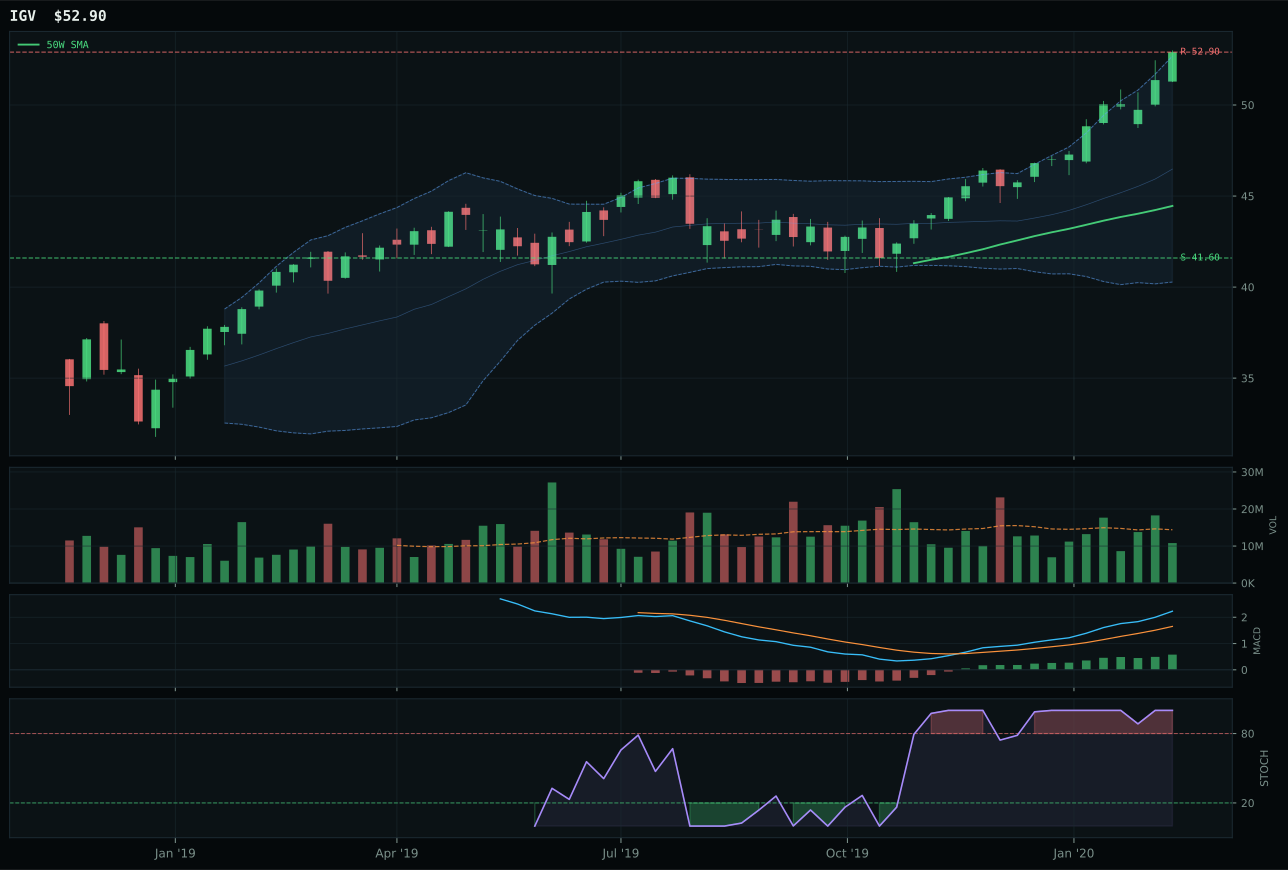
IGV has a vertical extension profile with 9.5% 13-week relative strength versus SPY.
A failed hold above support would weaken the setup.
Actionable but governed by invalidation levels.
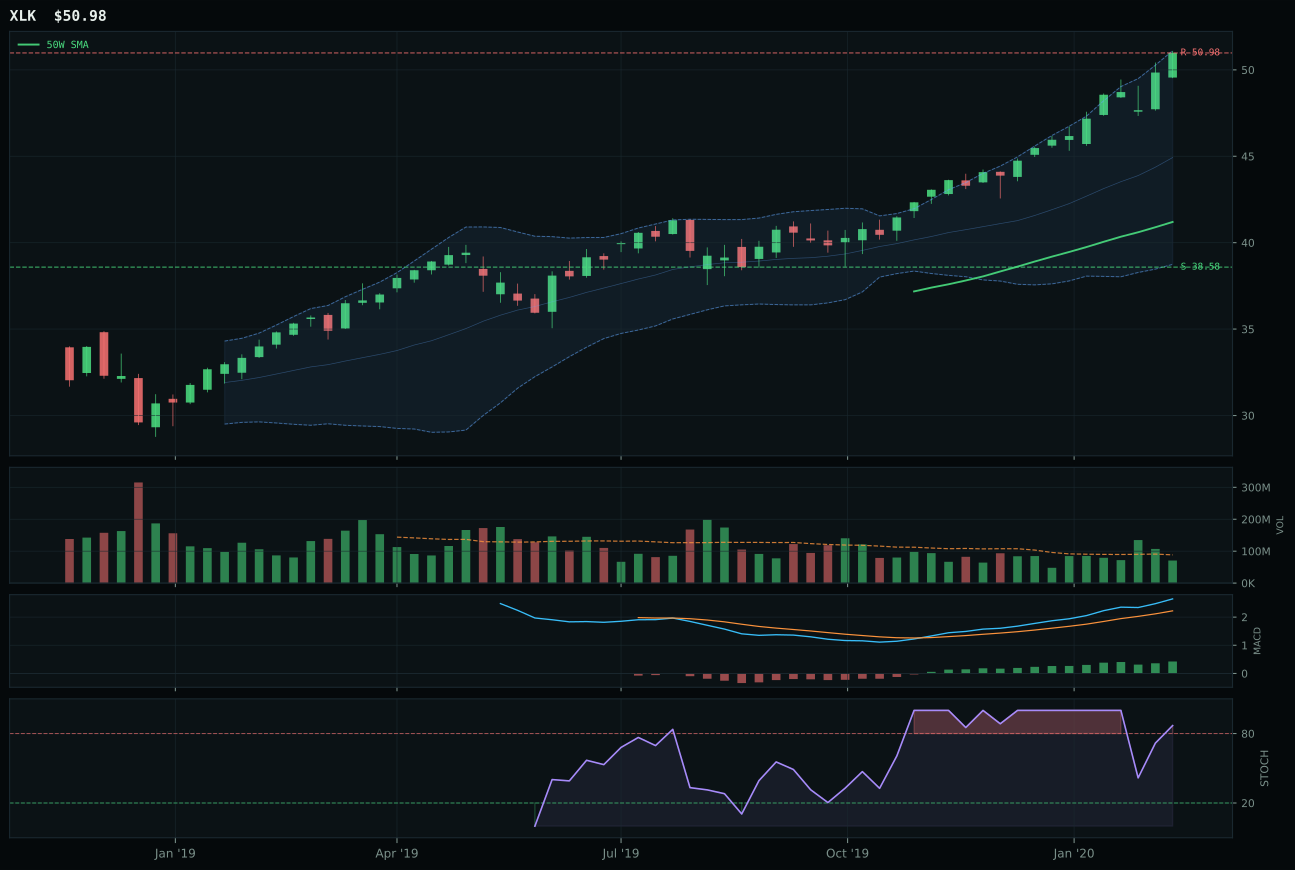
XLK has a vertical extension profile with 8.6% 13-week relative strength versus SPY.
A failed hold above support would weaken the setup.
Actionable but governed by invalidation levels.
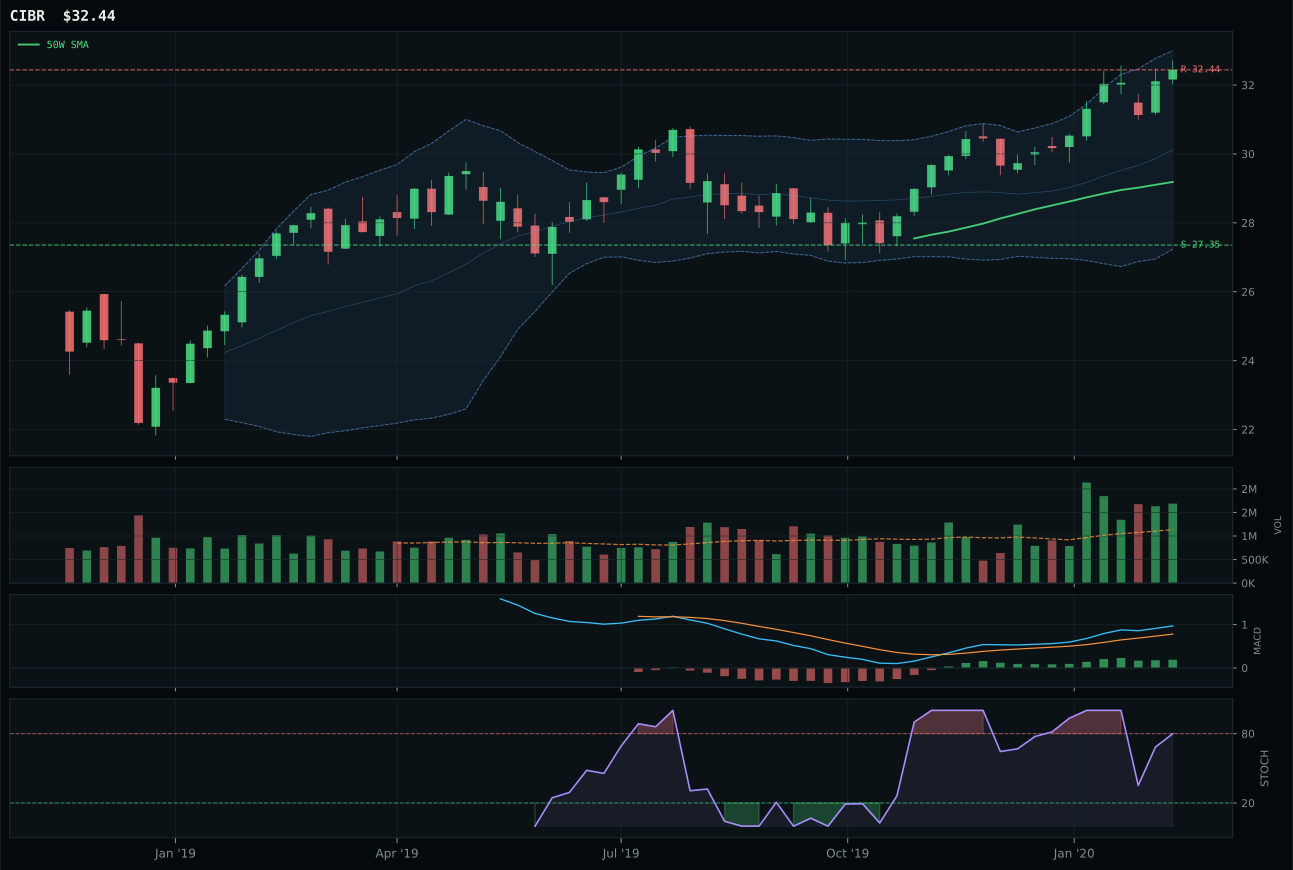
CIBR has a neutral structure profile with 0.1% 13-week relative strength versus SPY.
A failed hold above support would weaken the setup.
Actionable but governed by invalidation levels.
IGV claimed the category by combining price trend confirmation with superior relative strength discipline. The ETF sits 19.0% above its 50-week moving average with both MACD bullish and improving and stochastic RSI pinned at overbought momentum—a setup that rewards early conviction but penalizes late entry. Its 17.8% thirteen-week return and 9.5% relative strength versus SPY earned it a 0.9% edge over the category median, a meaningful lead in a cohort where XLK posted only 0.0% category-relative performance despite identical trend scores and nearly identical SPY-relative strength at 8.6%. The deciding difference was timing: IGV's 37.0 timing score versus XLK's 27.0 reflected tighter positioning near support and a fresher MACD inflection, while XLK's stochastic RSI had already begun rolling over from overbought. Volume at 0.75x the twenty-week average was neutral on both names, offering no rescue for the runner-up. This is a vertical extension setup where the trend is intact but the risk asymmetry has shifted decisively against new buyers.
Technology earned the 10% top-2 allocation slot because its 65.4 category score placed it among the two highest-ranked exposures in the portfolio. The Goldilocks macro regime actively supports growth at reasonable valuations, and the active descriptor checklist shows AI growth sponsorship providing a net positive offset to the credit stress headwind. IGV's technical evidence score of 74.2 and macro fit of 49.0 weighted at 62% and 38% respectively created a genuinely strong risk-adjusted profile relative to peers. The category's 63.0 category-level macro fit, anchored by the AI growth sponsorship boost of plus-six points, justified the overweight allocation despite the extended price structure. Defensive rotation and disinflation pressure are active tailwinds for technology duration, and the portfolio's 50% crypto overlay—which halves all tier sizes—means that a 10% allocation here represents the maximum defensible bet within the reduced capital envelope. This is conviction, not momentum chasing: IGV's superior timing score and category-relative strength over the basket made the allocation unambiguous.
AI — SMH
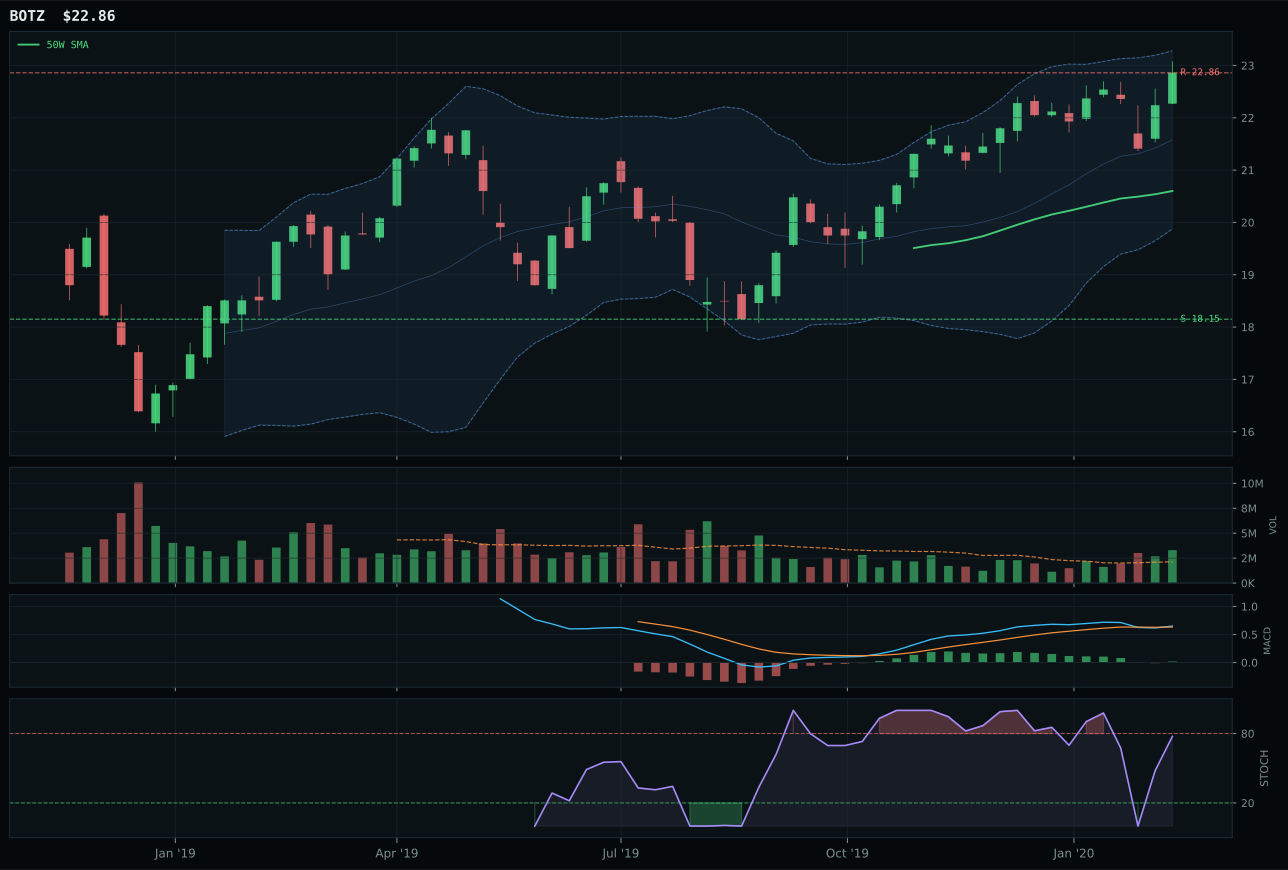
BOTZ has a neutral structure profile with -1.8% 13-week relative strength versus SPY.
A failed hold above support would weaken the setup.
Actionable but governed by invalidation levels.
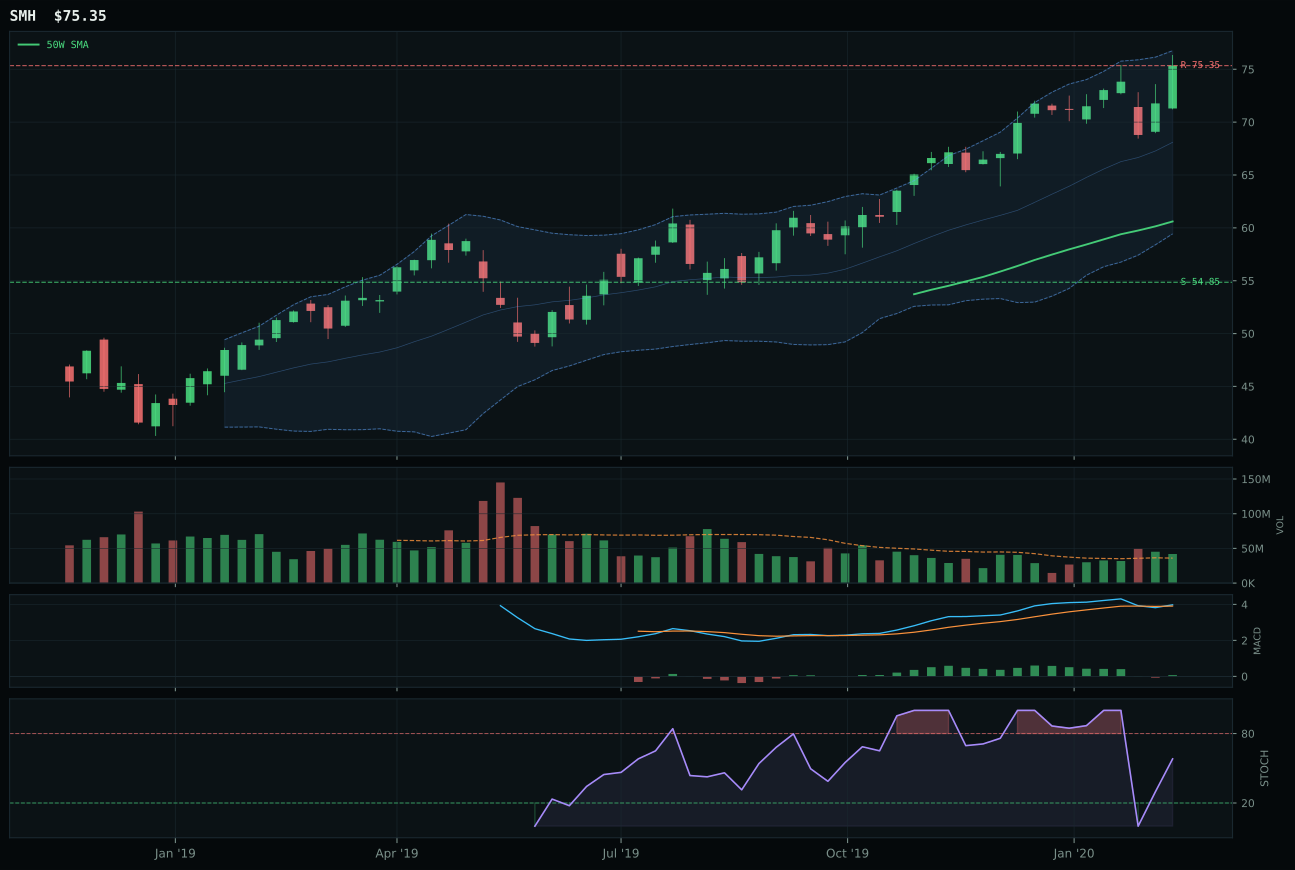
SMH has a vertical extension profile with 3.9% 13-week relative strength versus SPY.
A failed hold above support would weaken the setup.
Actionable but governed by invalidation levels.
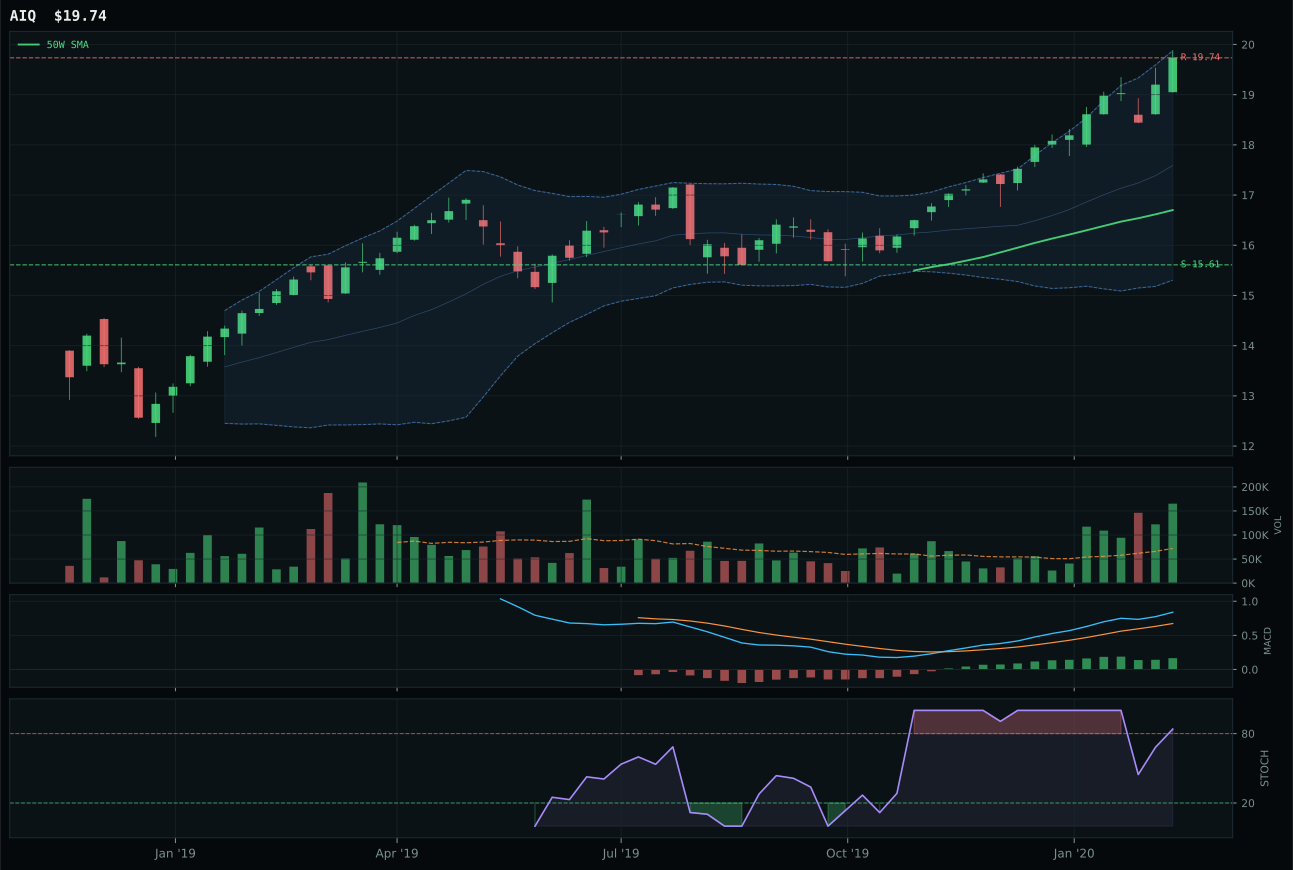
AIQ has a vertical extension profile with 7.6% 13-week relative strength versus SPY.
A failed hold above support would weaken the setup.
Tracked, but not top-2 eligible because: .
SMH won an exceptionally tight call against BOTZ, separated by only 0.1 points in the category score yet the gap mattered because SMH's structure and trend setup proved more durable. The semiconductor ETF extended 24.3% above its 50-week moving average with above-average participation at 1.16x the twenty-week average volume, giving the move institutional sponsorship despite the extended valuation. Its 12.2% thirteen-week return lagged BOTZ's 6.5%, but SMH's category-relative strength at 0.0% tied the robotics ETF and its 3.9% SPY-relative performance beat BOTZ's minus-1.8% decisively. MACD bullish but flattening and stochastic RSI falling from overbought offered technical warning signs that were milder than BOTZ's setup: robotics faced rising mid-zone momentum without clean trend follow-through from price. The 84.4 structure score for SMH versus 84.3 for BOTZ was negligible on paper, but SMH's vertical extension is a more natural bullish configuration than BOTZ's neutral structure holding up in a micro-rally. This is a narrow victory where leadership in relative strength and cleaner structure provided the tiebreaker.
AI earned the second 10% top-2 slot because its 64.8 category score ranked among the portfolio's two strongest opportunities, and the active AI growth sponsorship descriptor at plus-fourteen points provided exceptional macro tailwind despite the credit stress headwind. SMH's technical evidence of 74.1 combined with 58.0 macro fit—weighted 62% and 38%—created a balanced conviction case. Goldilocks macro helped at plus-ten points, and emerging-market liquidity support was neutral to positive. The semiconductor and compute thesis is currently the cleanest expression of AI growth within an extended but still-trending market structure. What holds this allocation at 10% rather than pushing it higher is the price extension penalty: SMH is 24.3% above the 50-week moving average with minimal upside to resistance, creating a situation where the setup is correct but entry risk is real. The portfolio's decision to allocate equal weight to Technology and AI at 10% each reflects the view that both categories represent the best risk-adjusted opportunities available, with defensive rotation and disinflation support providing additional stability to the growth bet.
Utilities & Infrastructure — XLU
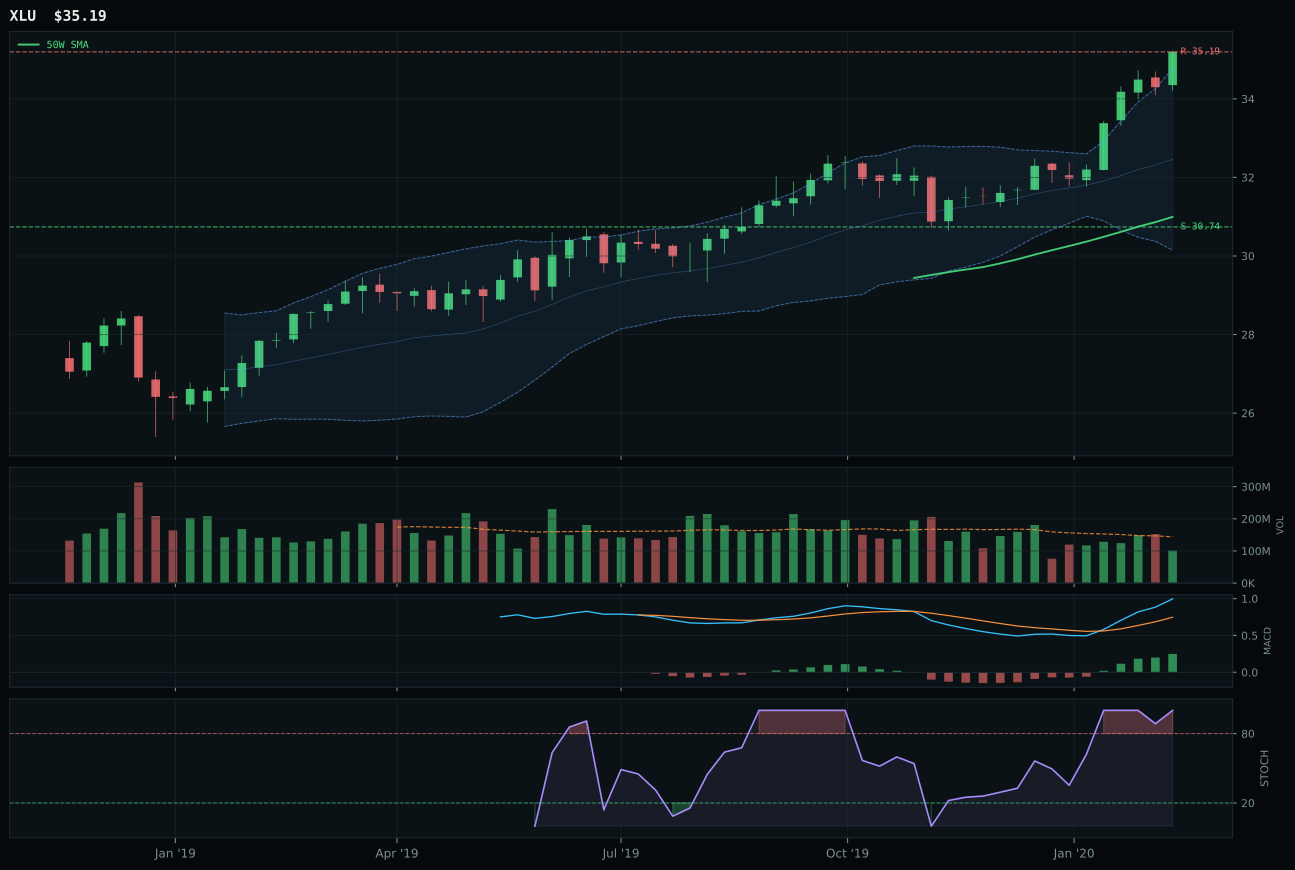
XLU has a neutral structure profile with 3.7% 13-week relative strength versus SPY.
A failed hold above support would weaken the setup.
Actionable but governed by invalidation levels.
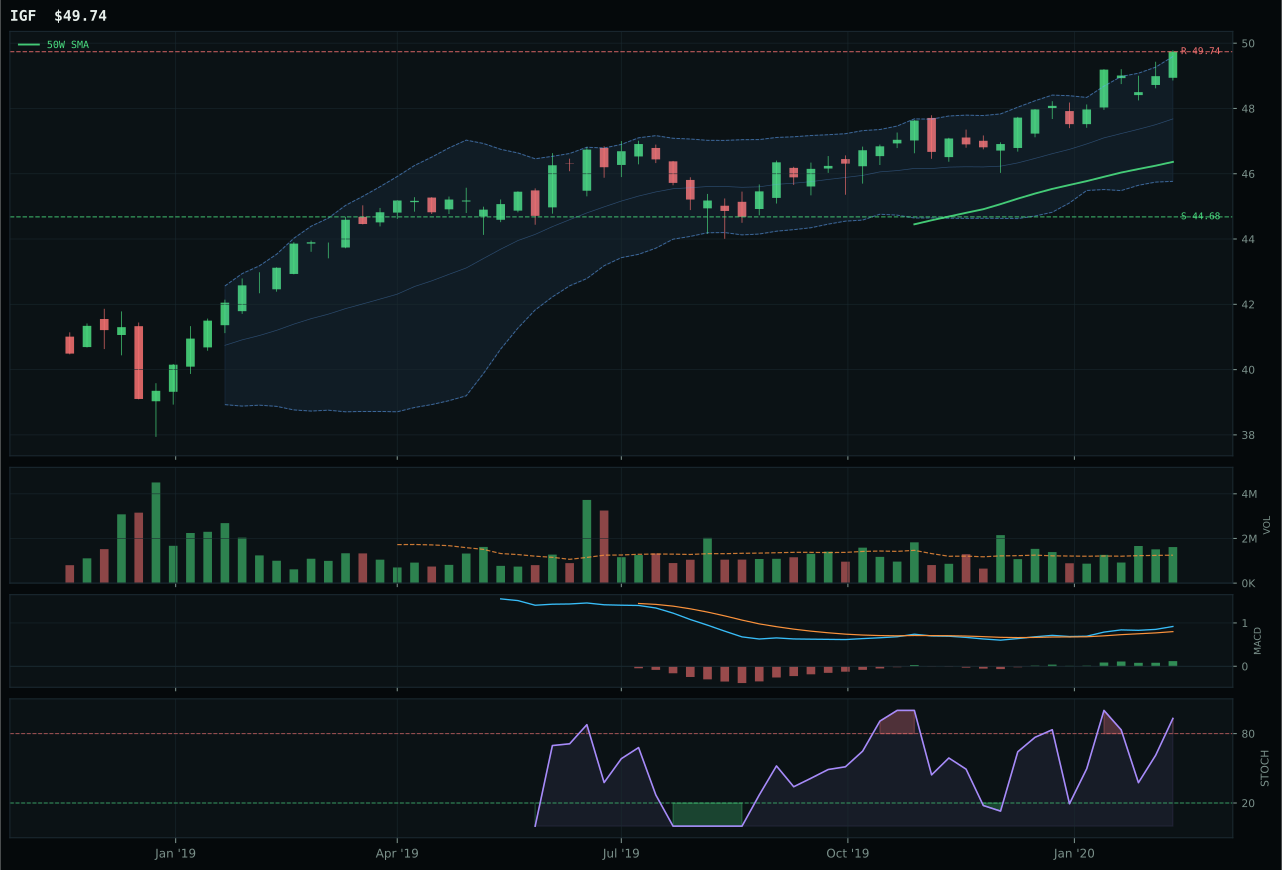
IGF has a neutral structure profile with -2.6% 13-week relative strength versus SPY.
A failed hold above support would weaken the setup.
Actionable but governed by invalidation levels.
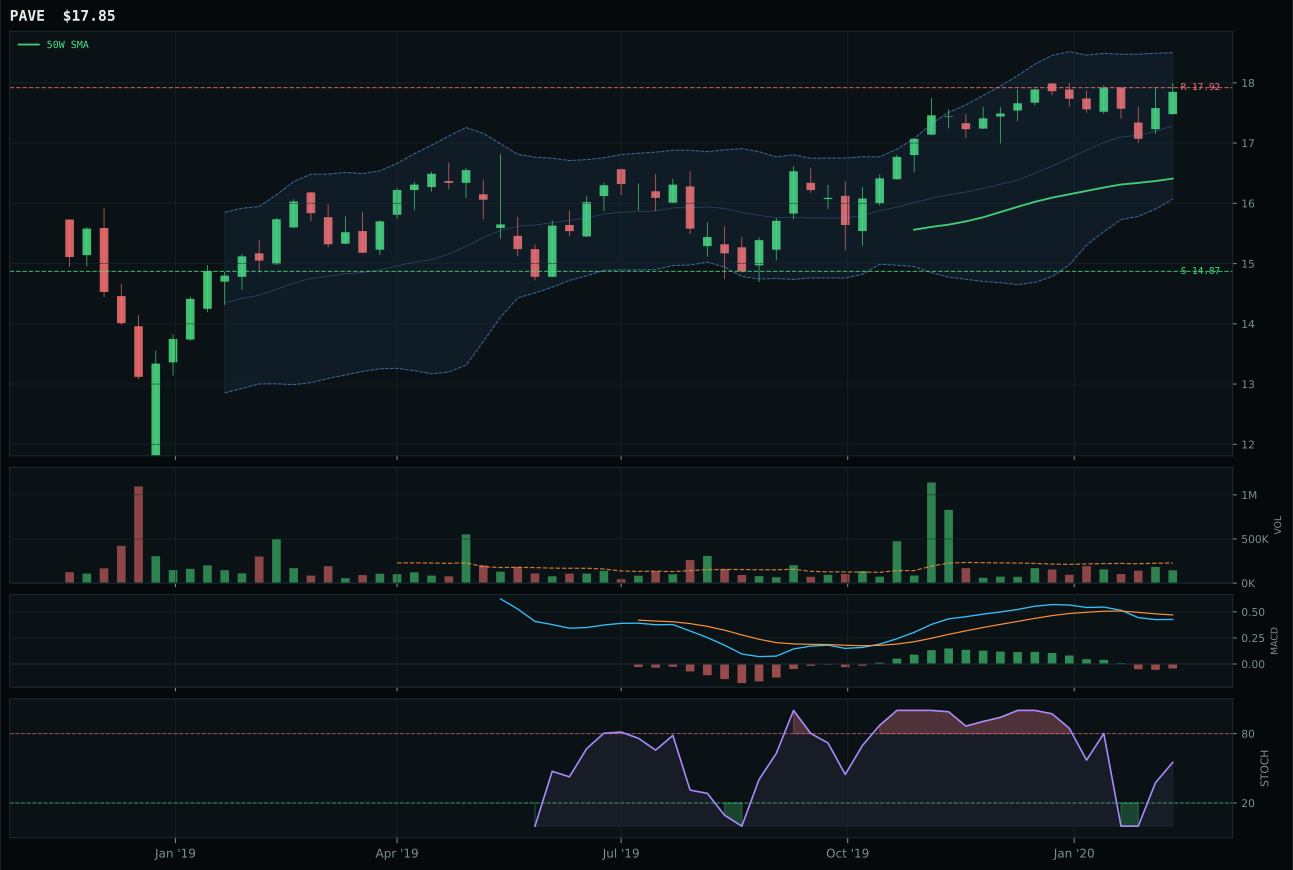
PAVE has a neutral structure profile with -5.9% 13-week relative strength versus SPY.
A failed hold above support would weaken the setup.
Tracked, but not top-2 eligible because: .
XLU edged IGF by leveraging superior category-relative strength despite nearly identical trend structures and only marginal timing differences. Both names were bullish and improving on MACD with overbought momentum on stochastic RSI, both sat in near 52-week high territory, and both posted double-digit thirteen-week returns. The deciding factor was category-relative strength: XLU posted 6.3% relative to the median versus IGF's 0.0%, a meaningful gap that reflected utilities (XLU) outpacing global infrastructure (IGF) within the defensive rotation theme. XLU's trend score of 100.0 matched IGF's 96.0, timing was nearly identical at 59.0 versus 75.0, and momentum was both strong at 93.4 versus 69.0. The 3.5-point score gap was narrow, but relative strength in a category ranking defensive rotation as the primary macro driver created the meaningful tiebreaker. Volume at 0.70x thin participation for XLU meant the uptrend lacked broad sponsorship, but that was a feature rather than a bug: regulated utilities typically extend into thin volume during defensive rotations because the buyers are income-focused, not momentum-chasing.
Utilities & Infrastructure earned the 5% tier-2 allocation because XLU's 64.7 category score ranked among the stronger non-top-2 categories, benefiting substantially from defensive rotation active at plus-twelve points and disinflation pressure at plus-six. XLU's technical evidence of 76.1 and macro fit of 68.0 created the strongest macro conviction among tier-2 categories: the category-level macro fit at 72.0 reflected aligned tailwinds. The Goldilocks regime actually supports utilities well because steady-cash-flow defensiveness with modest growth can command reasonable valuations when credit stress remains contained. What prevents Utilities from top-2: the price extension penalty is real at 13.6% above the 50-week, and relative strength versus SPY at 3.7% is merely respectable, not exceptional. Additionally, XLU's volume at 0.70x thin participation suggests the move lacks broad institutional sponsorship. The allocation to XLU at 5% appropriately sizes it as a stabilizer rather than a conviction bet, with the understanding that its primary role is volatility dampening and steady return generation rather than capital appreciation. This is the second-best tier-2 category after Defense & Aerospace, reflecting a portfolio structure where defensive rotation is acknowledged but not yet dominant—the transition from growth to utility defensiveness is underway but incomplete.
Defense & Aerospace — ITA
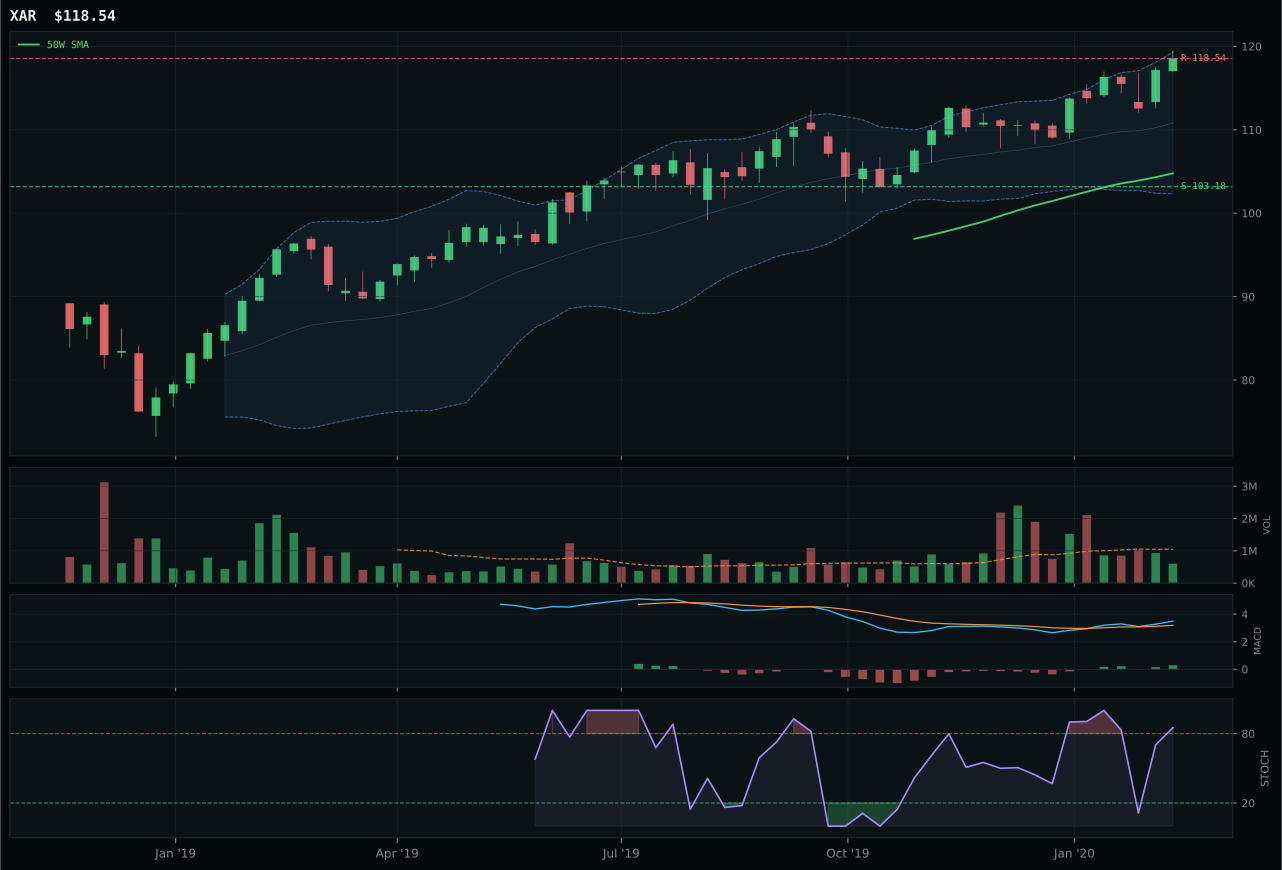
XAR has a neutral structure profile with -3.0% 13-week relative strength versus SPY.
A failed hold above support would weaken the setup.
Actionable but governed by invalidation levels.
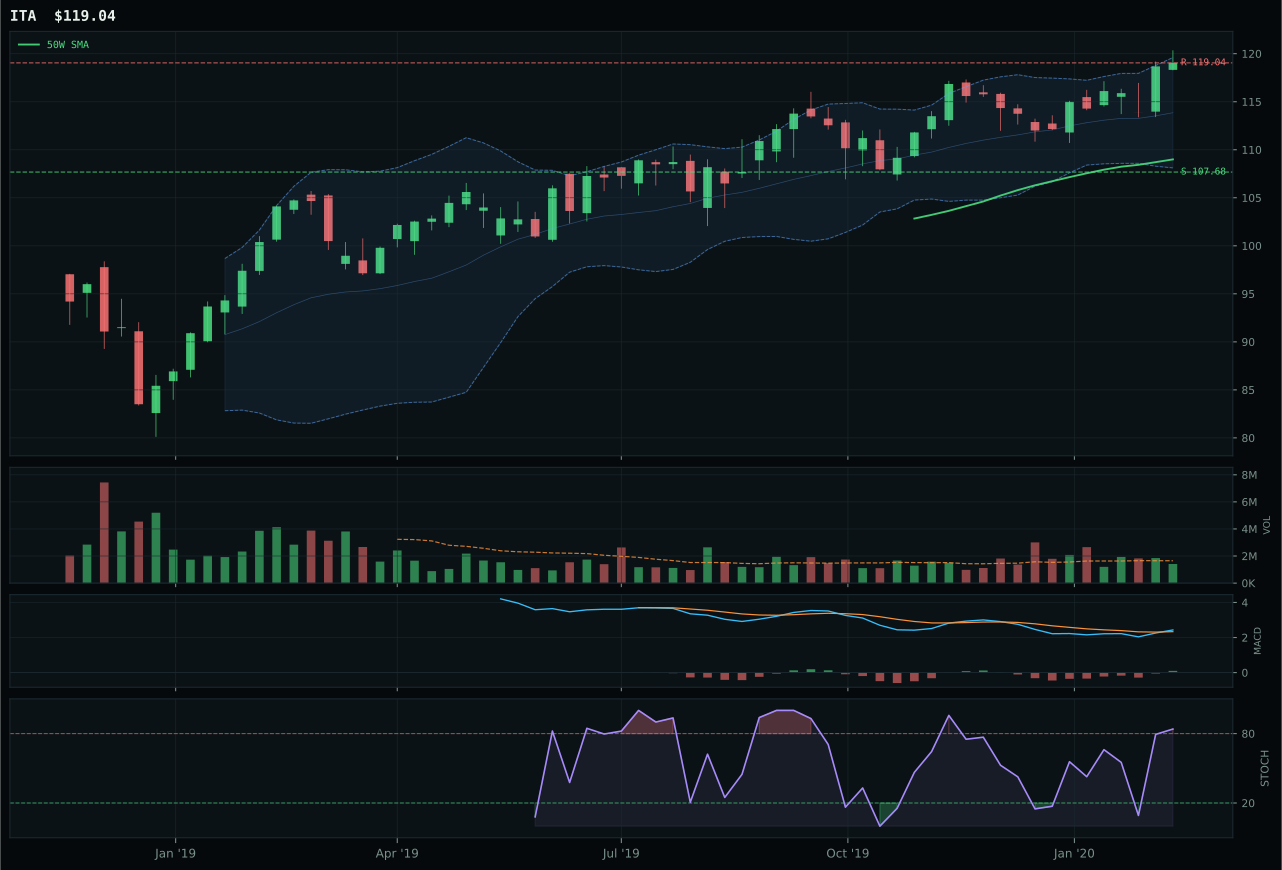
ITA has a neutral structure profile with -6.4% 13-week relative strength versus SPY.
A failed hold above support would weaken the setup.
Actionable but governed by invalidation levels.
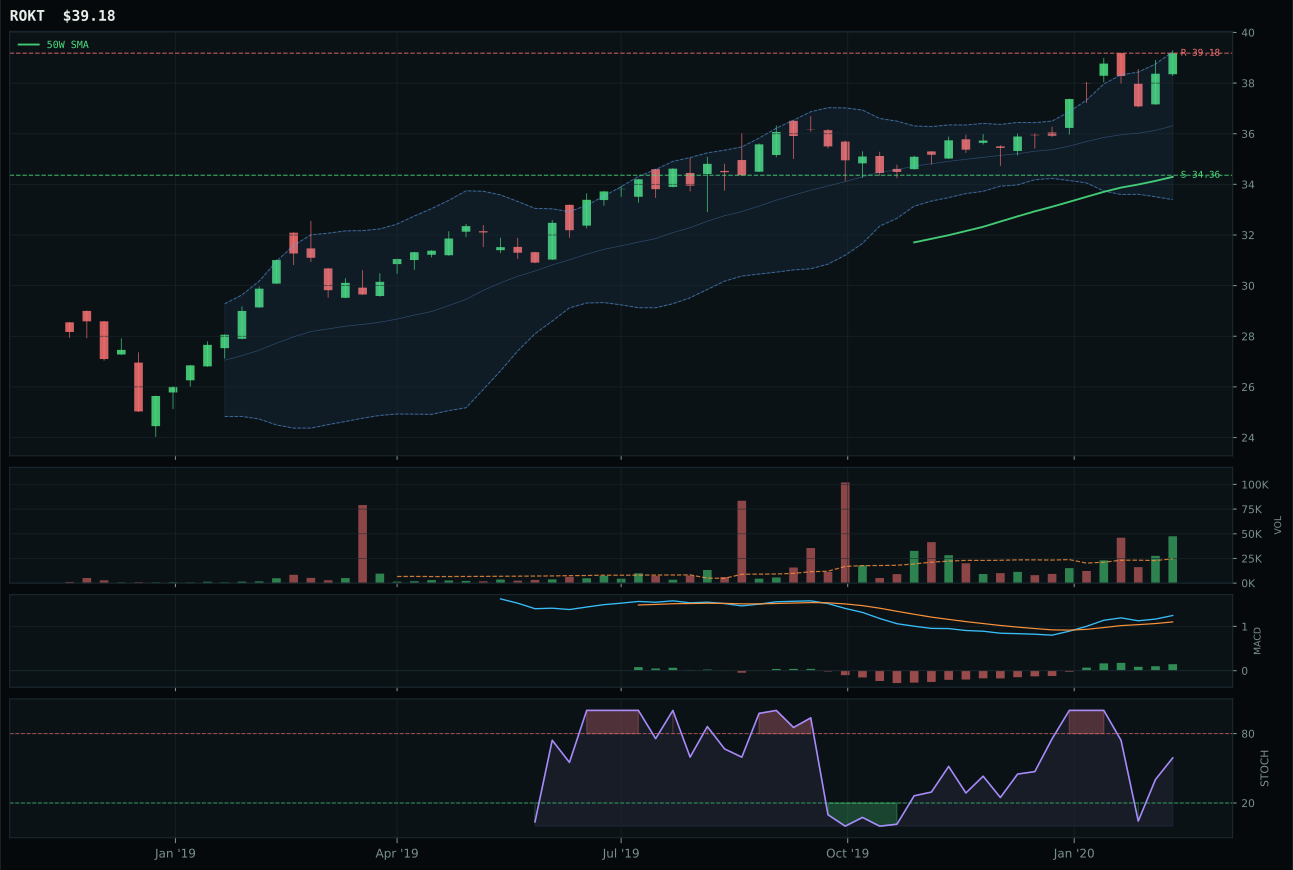
ROKT has a neutral structure profile with 1.3% 13-week relative strength versus SPY.
A failed hold above support would weaken the setup.
Tracked, but not top-2 eligible because: .
ITA edged XAR by a single point despite XAR's superior trend score, the margin coming entirely from timing and risk-reward calibration. ITA posted a 75.0 timing score versus XAR's 59.0, with both showing price just 9-10% from the 50-week moving average and sitting in near 52-week high territory. The difference: ITA's MACD was bullish and improving while XAR's matched that signal, but XAR's stochastic RSI showed overbought momentum rolling over, a divergence that cost XAR fourteen timing points. Risk-reward favored ITA at 50.6 versus 46.7 because volume at 0.86x neutral participation was cleaner than XAR's thin participation quality. Both names showed price weakness on a relative basis with ITA at minus-6.4% and XAR at minus-3.0% versus SPY, but ITA's minus-3.4% category-relative strength beat XAR's 0.0%, a sign that accumulation was happening within the basket structure. The 0.1-point total gap masks deeper decisiveness: ITA's timing advantage reflected better technical setup persistence, not random statistical noise.
Defense & Aerospace received the 5% tier-2 allocation because its 60.3 category score fell below the top-2 threshold despite defensive rotation active at plus-eight points providing genuine macro support. ITA's technical evidence of 68.6 and macro fit of 57.0 created a respectable but not compelling case, with the category-level macro fit at 63.0 showing defensive rotation benefits offset partially by credit stress negatives. The allocation remains justified because tier-2 categories serve portfolio stabilization during Goldilocks regimes where growth may outrun fundamentals: defense primes like ITA offer defined business models, steady cash flow, and relative insulation from disinflation pressure on high-growth multiples. However, the 60.3 score places this category well behind Technology and AI, meaning it holds a defensive holding slot rather than a conviction position. What would elevate Defense & Aerospace to top-2 would be cleaner momentum confirmation—XAR's technical evidence of 71.6 nearly matched ITA's 68.6, indicating the entire category lacks the leadership strength of SMH or IGV—or a material deterioration in growth momentum that increases demand for defensive rotation positioning. For now, the 5% allocation appropriately sizes it as a stabilizer rather than a portfolio driver.
Emerging Markets — INDA
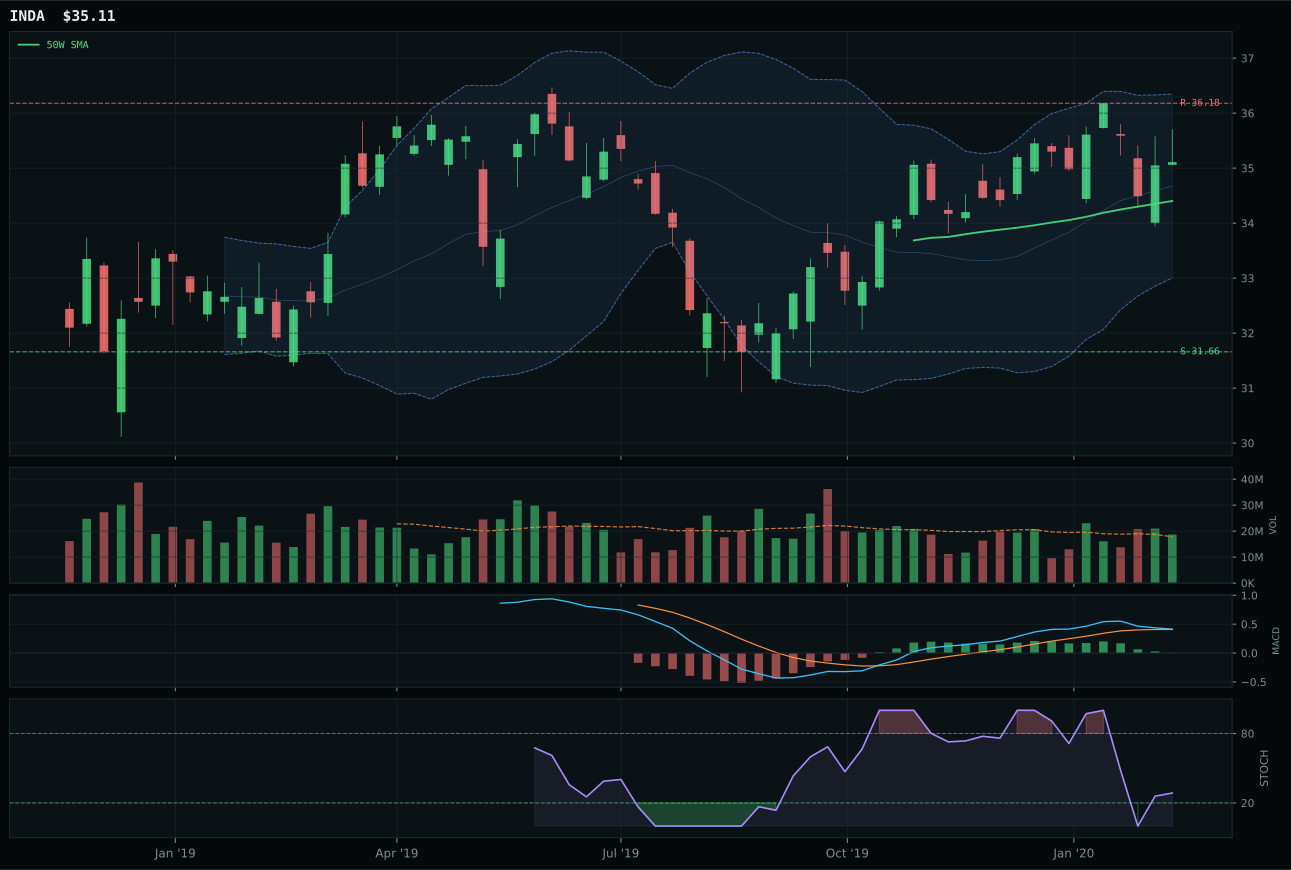
INDA has a compression near 50W profile with -5.5% 13-week relative strength versus SPY.
A failed hold above support would weaken the setup.
Actionable but governed by invalidation levels.
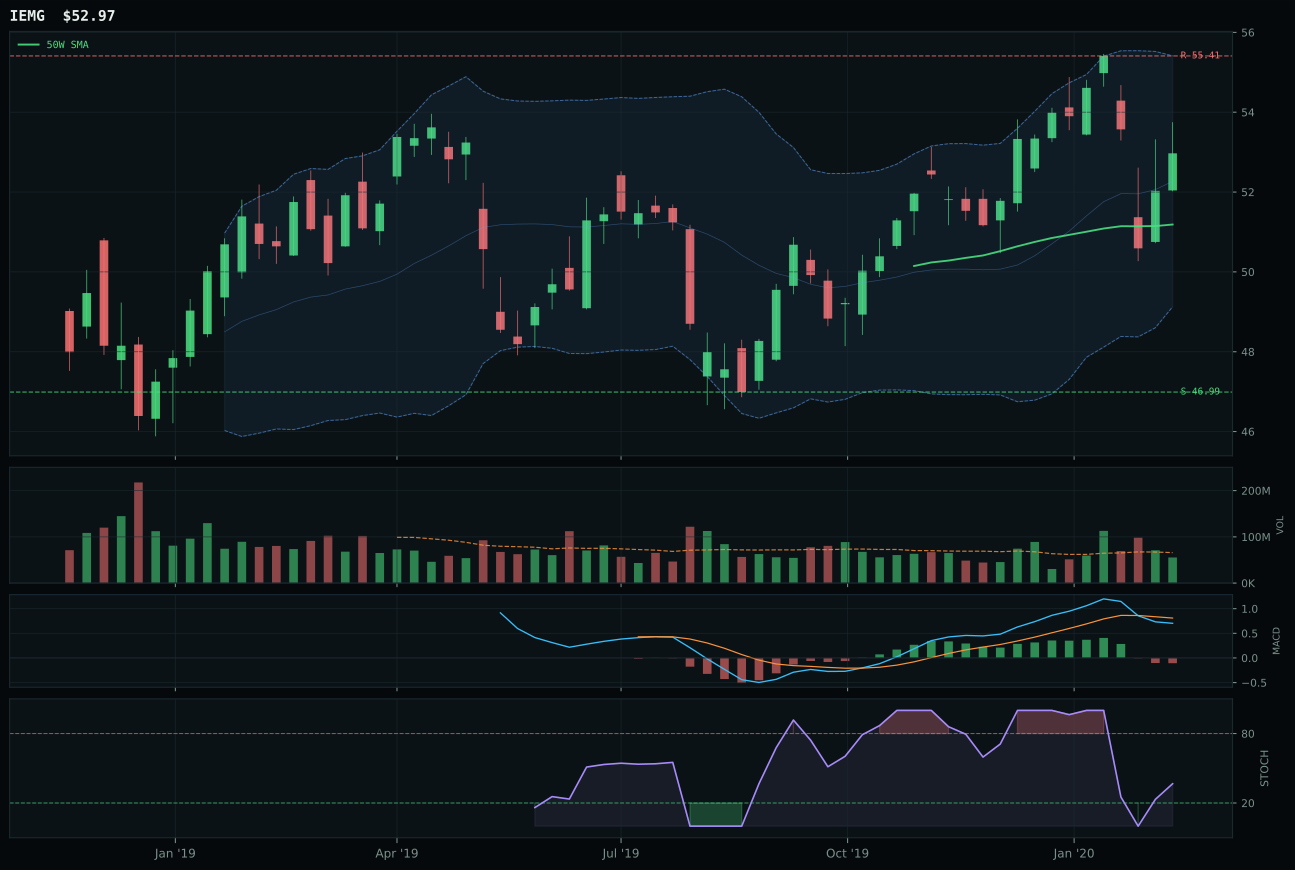
IEMG has a neutral structure profile with -6.1% 13-week relative strength versus SPY.
A failed hold above support would weaken the setup.
Actionable but governed by invalidation levels.
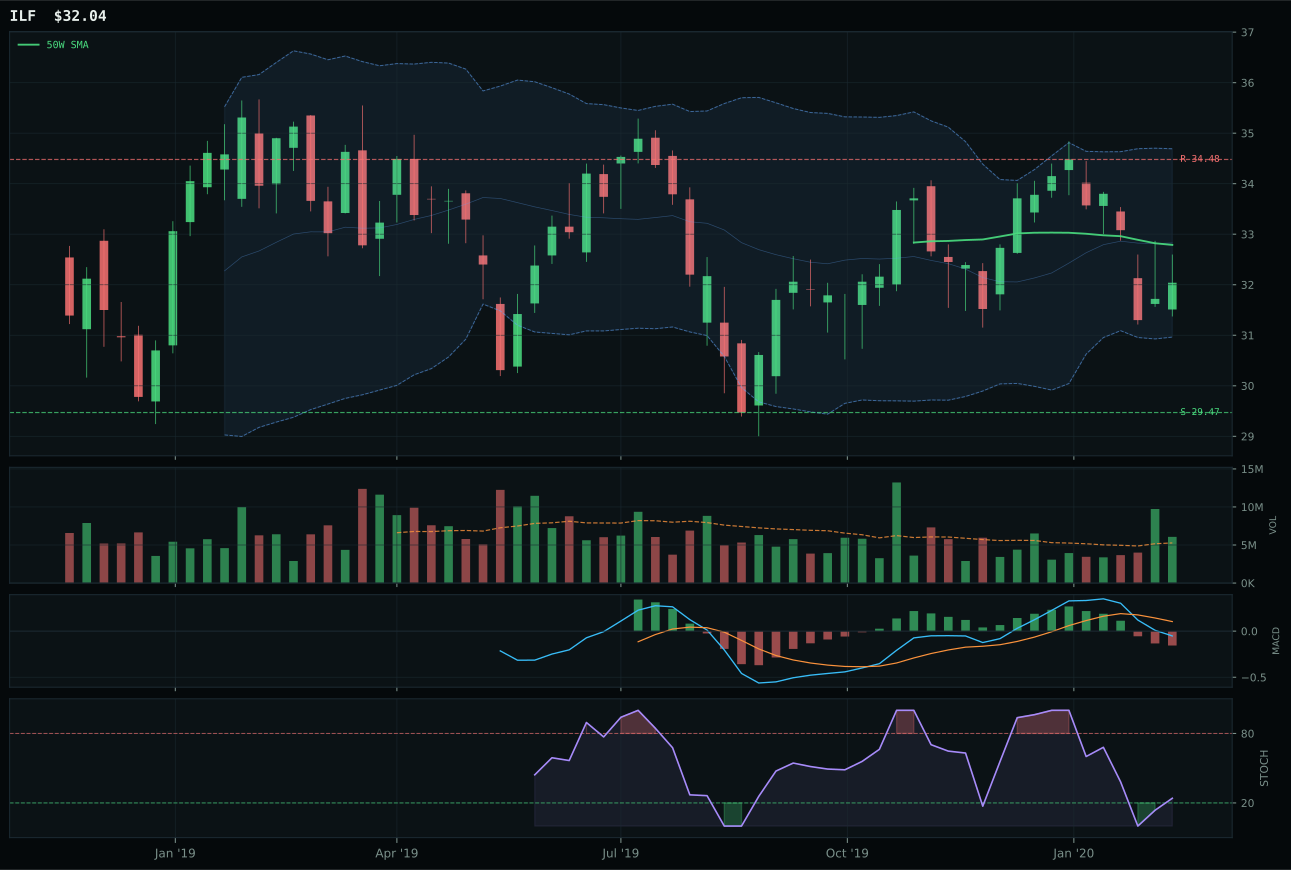
ILF has a compression near 50W profile with -9.5% 13-week relative strength versus SPY.
A failed hold above support would weaken the setup.
Actionable but governed by invalidation levels.
INDA defeated IEMG by winning the timing battle despite nearly identical trend structures, a victory that reflected the Indian market's superior near-term technical setup. INDA's timing score of 95.0 versus IEMG's 93.0 came from INDA sitting tighter to the 50-week moving average at 2.1% versus IEMG's broader pullback structure, combined with INDA's MACD bullish but flattening versus IEMG's bearish and weakening. Both showed compression near the 50-week, but INDA's stochastic RSI was falling and neutral at 0.29, indicating a fresher overshoot from buyers, while IEMG's was rising mid-zone, suggesting earlier in its cycle. INDA's thirteen-week return of 2.8% lagged IEMG's 2.2% only marginally, but category-relative strength at 0.5% beat IEMG's 0.0%, reflecting India's ability to outpace broader emerging-market consensus. Structure was nearly identical at 75.9 and 71.8 respectively, so the win came from timing and relative strength—a setup where INDA's compression was fresher and more disciplined. The 12.4-point score gap indicates leadership, but both names remained weak on absolute technical metrics.
Emerging Markets earned the 5% tier-2 allocation because INDA's 44.5 category score, while below top-2, benefited from emerging-market liquidity support active at plus-fourteen points, a macro tailwind that offset credit stress headwinds. INDA's technical evidence of 68.6 and macro fit of 50.0 created a balanced case: the category-level macro fit at 62.0 showed genuine support from Goldilocks macro at plus-eight points combined with EM-specific liquidity tailwinds. The allocation reflects the view that India as a higher-quality EM expression, combined with broad-based liquidity support from global central banks, justifies maintaining exposure despite the technical setups being compressed rather than extended. What prevents Emerging Markets from top-2: the relative strength remains weak at minus-5.5% for INDA versus SPY, indicating that even within a supportive macro regime, the category is not yet attracting relative buying interest. The timing setup in INDA is clean but not explosive—compression near the 50-week offers upside potential but requires new buying to confirm. The 5% allocation is appropriately sized as a recovery position rather than a conviction opportunity, with the understanding that elevated EM liquidity support provides downside insurance even if near-term technicals disappoint.
Precious Metals — GLD
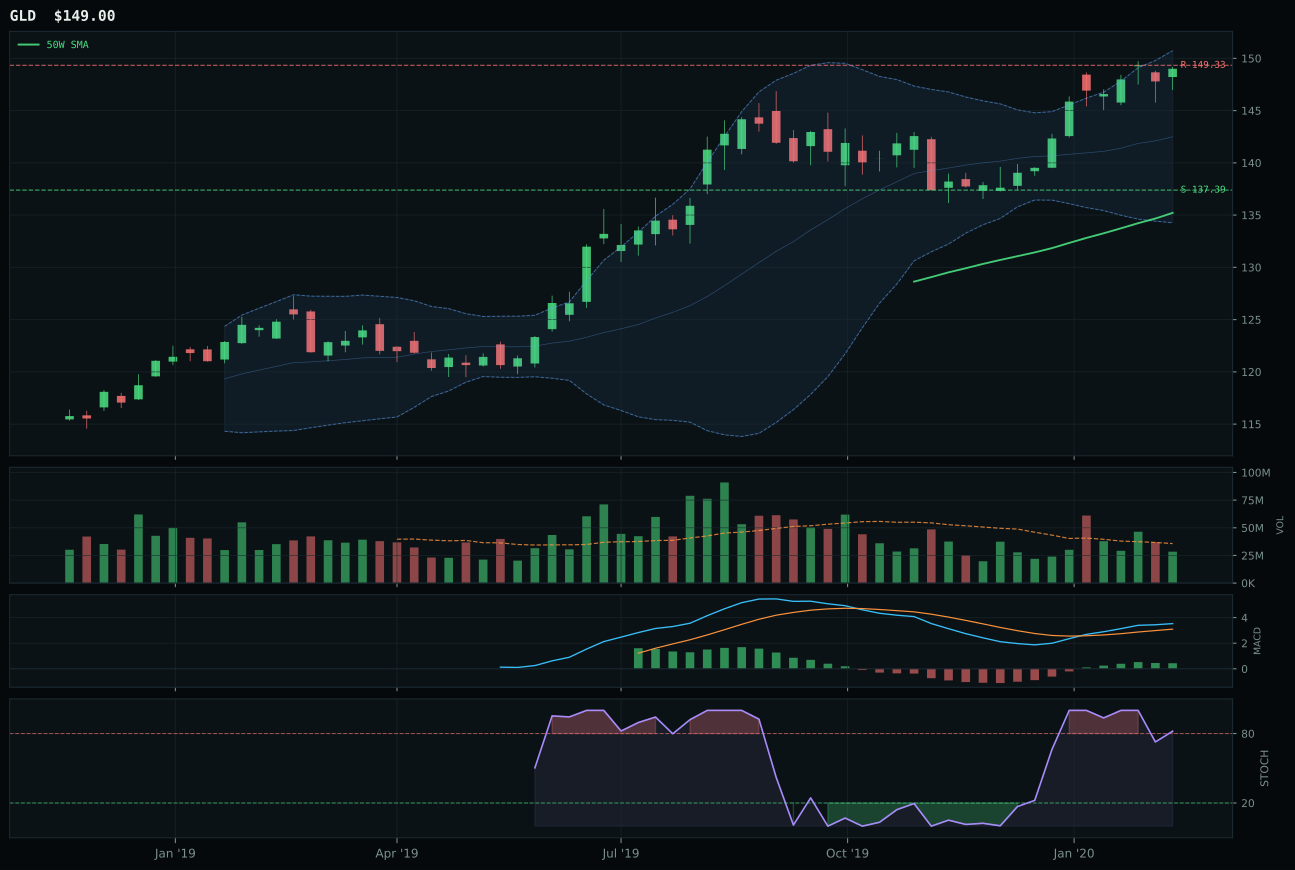
GLD has a neutral structure profile with -0.5% 13-week relative strength versus SPY.
A failed hold above support would weaken the setup.
Actionable but governed by invalidation levels.
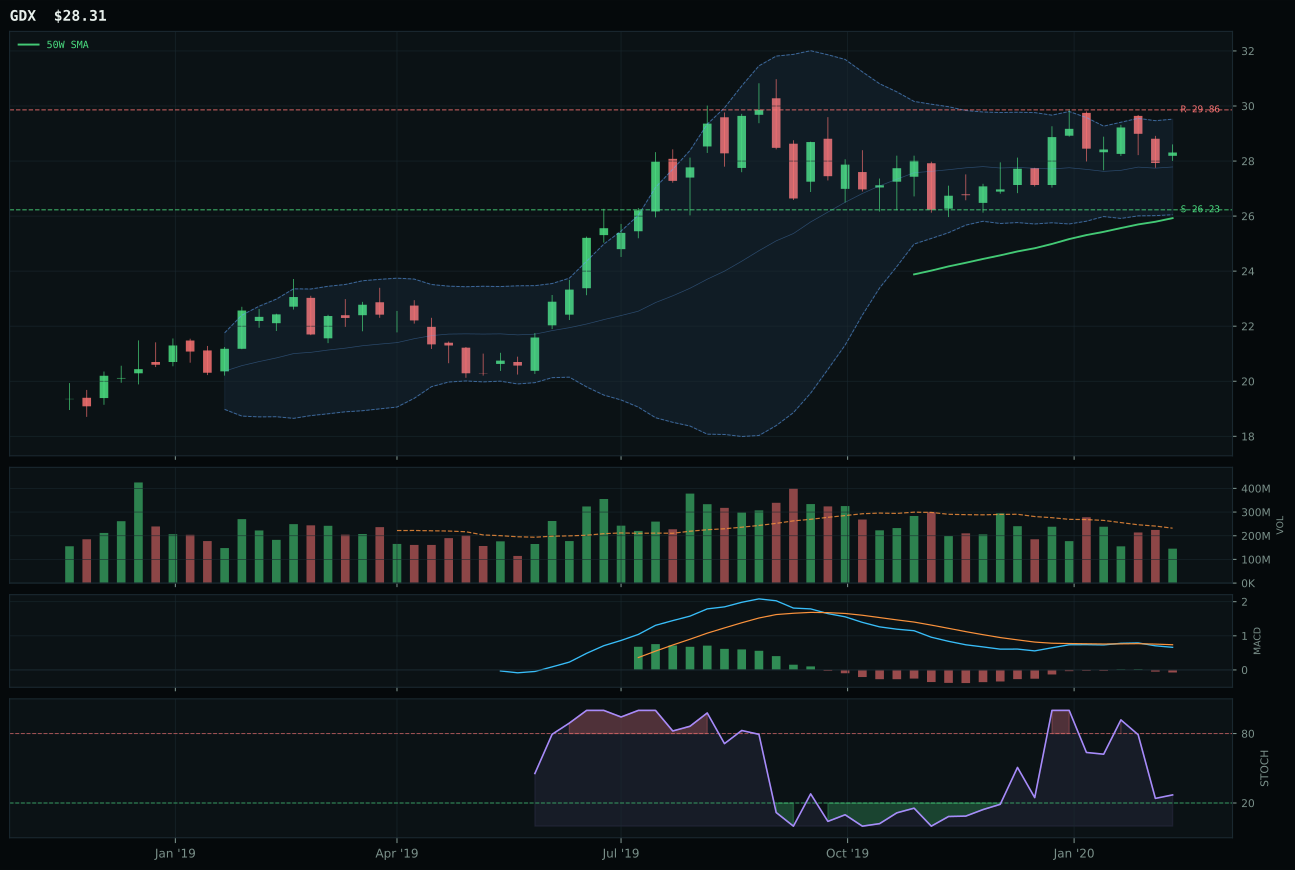
GDX has a neutral structure profile with -2.4% 13-week relative strength versus SPY.
A failed hold above support would weaken the setup.
Actionable but governed by invalidation levels.
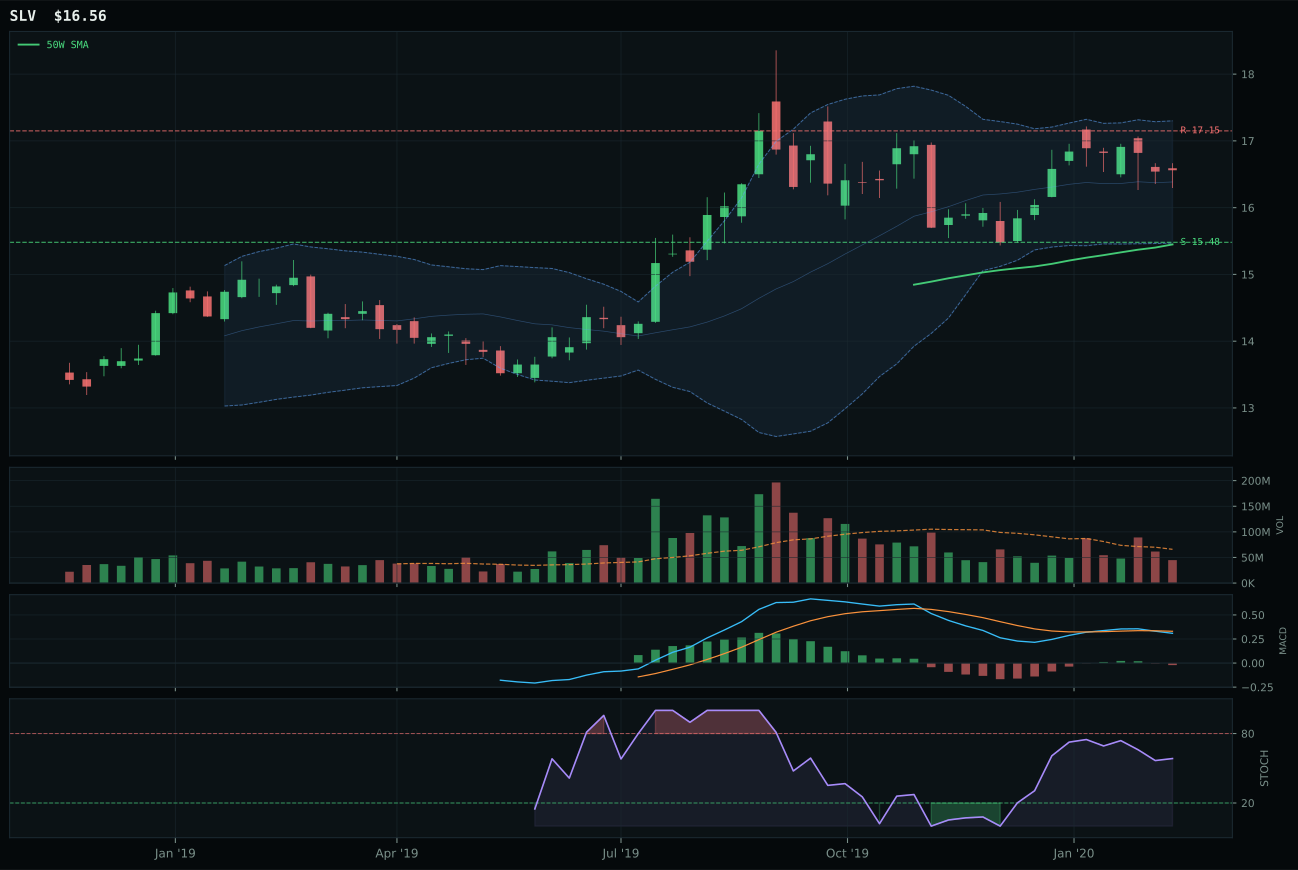
SLV has a neutral structure profile with -3.8% 13-week relative strength versus SPY.
A failed hold above support would weaken the setup.
Actionable but governed by invalidation levels.
GLD defeated GDX by 8.0 points through superior structure and MACD confirmation, a clean but not dominant victory in a category where both names benefited from defensive rotation tailwinds. GLD's structure score of 81.7 beat GDX's 69.6 because the bullion ETF maintained cleanliness at 75.0 versus GDX's structure deterioration. More critically, GLD's MACD was bullish and improving while GDX's was bearish and weakening—a technical fork that reflected divergent sponsor behavior despite both sitting in near 52-week high territory. GLD's 7.8% thirteen-week return beat GDX's 5.9%, and category-relative strength at 1.9% showed gold itself gaining ground on miners, a signal that the monetary hedge narrative was winning over the leveraged cyclical play. Volume at 0.80x neutral for GLD versus thin participation for GDX reinforced the cleanliness advantage: GLD was being accumulated steadily while GDX faced selling pressure even as commodities prices held up. This victory is meaningful because it indicates the portfolio should express defensive rotation through clean monetary hedges rather than leveraged bets, a subtle but important risk management decision.
Precious Metals earned the 5% tier-2 allocation despite GLD's 43.0 category score ranking well below top-2 because defensive rotation active at plus-seven points and disinflation pressure active at plus-six created genuine macro conviction. GLD's technical evidence of 63.0 was modest but its macro fit of 64.0 showed category-level sensitivity to the current regime. The 63.0 category-level macro fit reflected Goldilocks conditions actually supporting metals as inflation-hedge insurance rather than as carry trades, a distinction that matters when credit stress is active at minus-seven points. The allocation to GLD rather than broader precious metals exposure acknowledges that in deflationary cycles, pure bullion outperforms miners because leverage works against you—investors pay for optionality, not leverage. What would elevate Precious Metals to top-2 would be explicit inflation acceleration in the descriptor checklist or a breakdown in equity momentum that forces portfolio rotation toward hard assets. Currently the 5% allocation serves as defensive insurance and a tactical lever for responding to credit stress deterioration, not as a conviction position. The category ranked below Defense & Aerospace and ahead of Industrial Metals, reflecting a tier structure where defensiveness has value but is not the portfolio's primary allocation driver.
Nuclear Energy — NLR
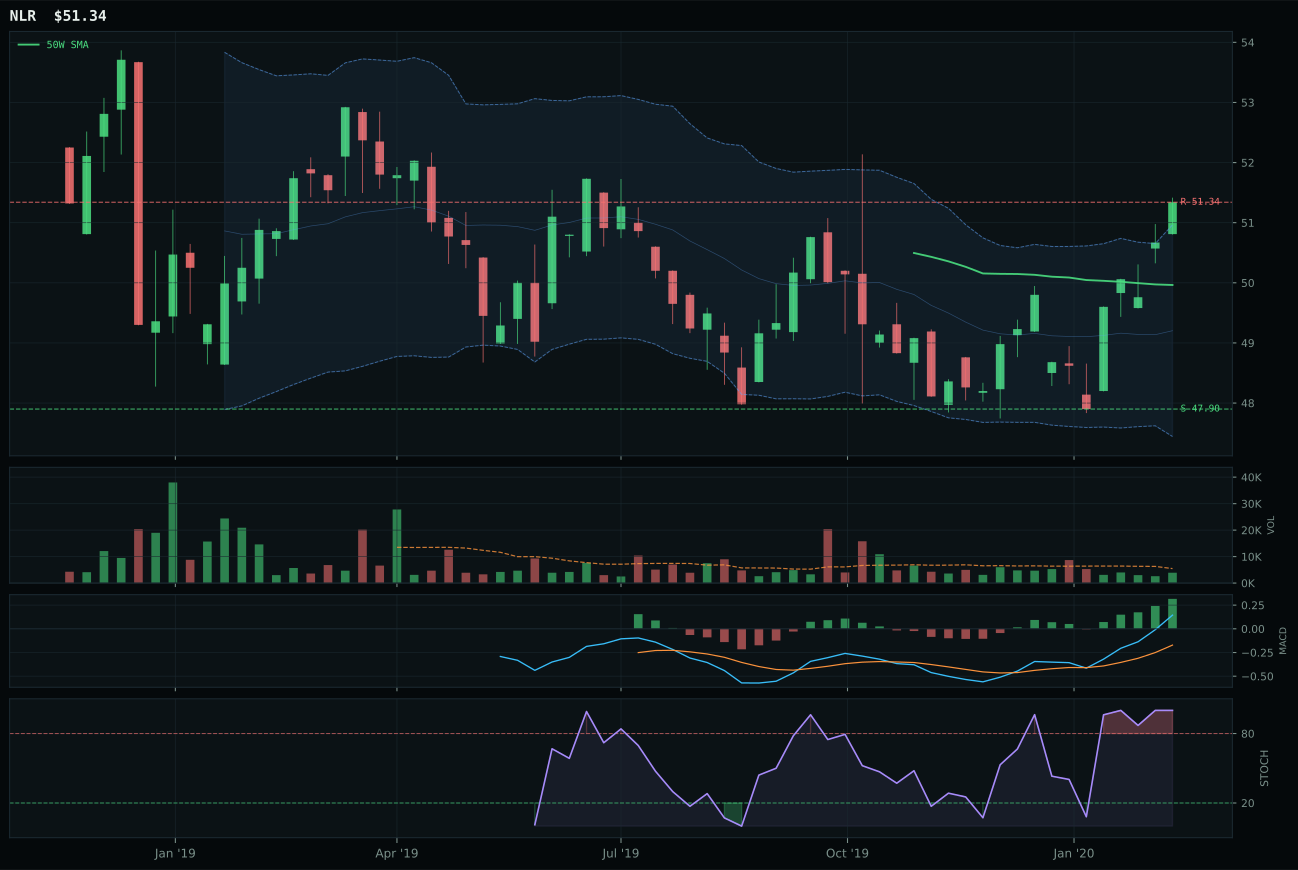
NLR has a compression near 50W profile with -2.1% 13-week relative strength versus SPY.
A failed hold above support would weaken the setup.
Tracked, but not top-2 eligible because: .
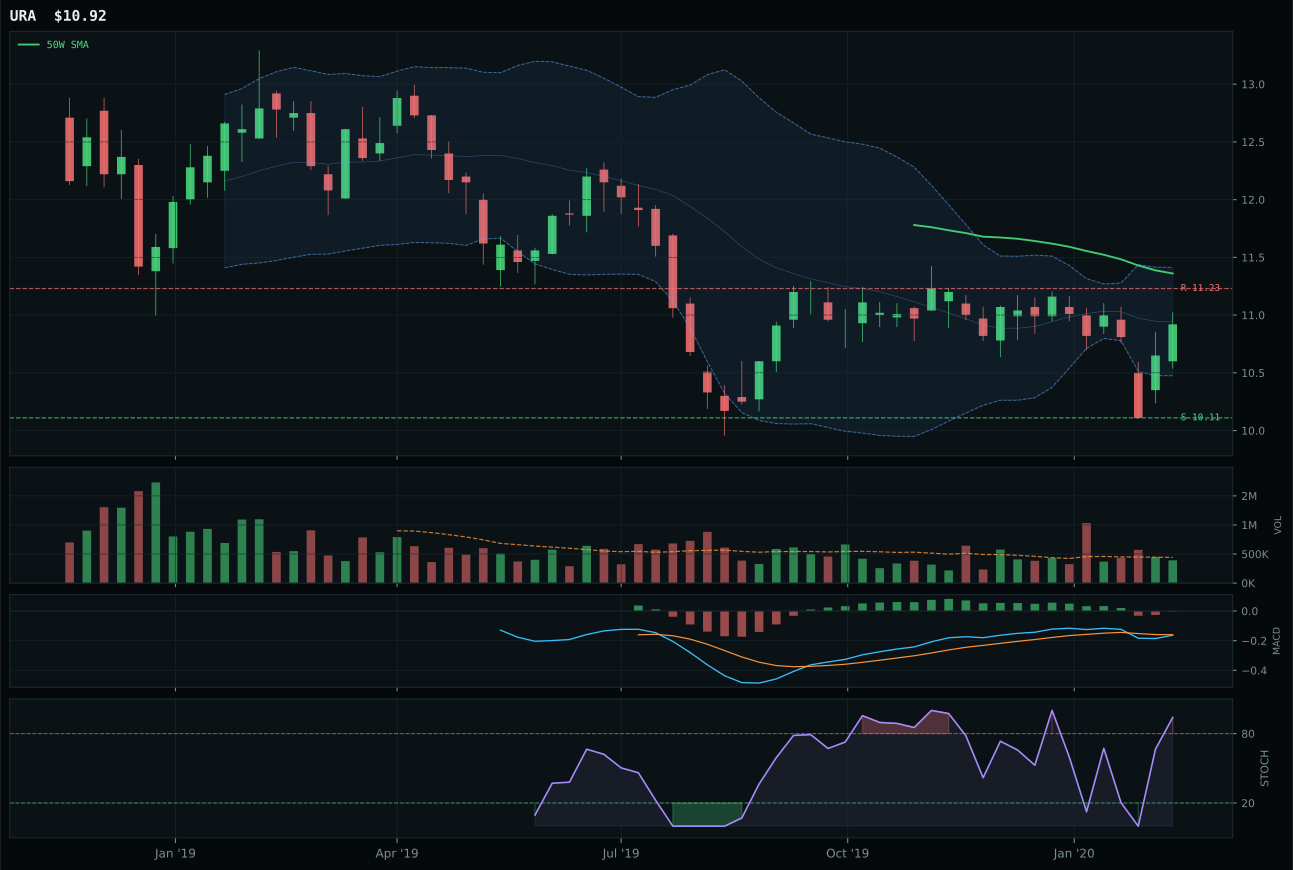
URA has a neutral structure profile with -10.8% 13-week relative strength versus SPY.
Extension and support failure are the main tactical risks.
Tracked, but not top-2 eligible because: structurally broken.
NLR claimed Nuclear Energy by being the only name that maintained uptrend structure, a win that carried substantially more conviction than the tight marginal victories in other categories. Price sat 2.8% above the 50-week moving average with MACD bullish and improving and stochastic RSI overbought momentum at 1.00, a textbook compression-near-moving-average setup that offered genuine expansion potential if buyers defended the level. URA fell to a 0.0 technical evidence score because price had fallen minus-10.8% from its thirteen-week relative strength perspective and MACD was bearish and weakening—a complete structural break despite the overbought stochastic reading. NLR's timing score of 100.0 reflected tight positioning near support, while URA's 85.0 timing only partially offset its failed trend confirmation. The 63.5-point score gap between NLR and URA was the largest advantage for any category winner, indicating that even within a weak category, NLR possessed clear leadership. Structure at 74.8 for NLR versus 39.7 for URA showed price compression near the 50-week creating a clean setup versus URA's deteriorated neutral structure.
Nuclear Energy received the 5% tier-2 allocation despite NLR's 20.9 category score falling well below top-2 because AI growth sponsorship active at plus-five points and the nascent defensive rotation narrative created a small but real conviction case. NLR's technical evidence of 45.0 and macro fit of 56.0 were modest in isolation, but the alignment mattered: nuclear utilities offer exposure to both clean energy and steady-cash-flow defensiveness, a dual benefit in a Goldilocks regime where growth needs stabilization. The category-level macro fit of 50.0 showed the entire nuclear complex at a pivot point rather than a strong conviction—too weak to be top-2, but defensible as tier-2 because the narrative is nascent rather than exhausted. What holds this allocation back from top-2: the technical evidence is simply weak relative to Technology and AI, with NLR's 45.0 score well behind IGV's 73 and SMH's 68. Additionally, the category's hard-filter eligibility at false indicates that URA's breakdown creates a ceiling on conviction. The 5% allocation is positioned to capture the early stages of an AI/nuclear-power thesis if it gains momentum, with the understanding that this is a long-dated positioning trade rather than a near-term technical opportunity. URA's technical failure suggests institutional capital has not yet rotated into nuclear, making this a patient allocation awaiting confirmation.
Traditional Energy — XLE
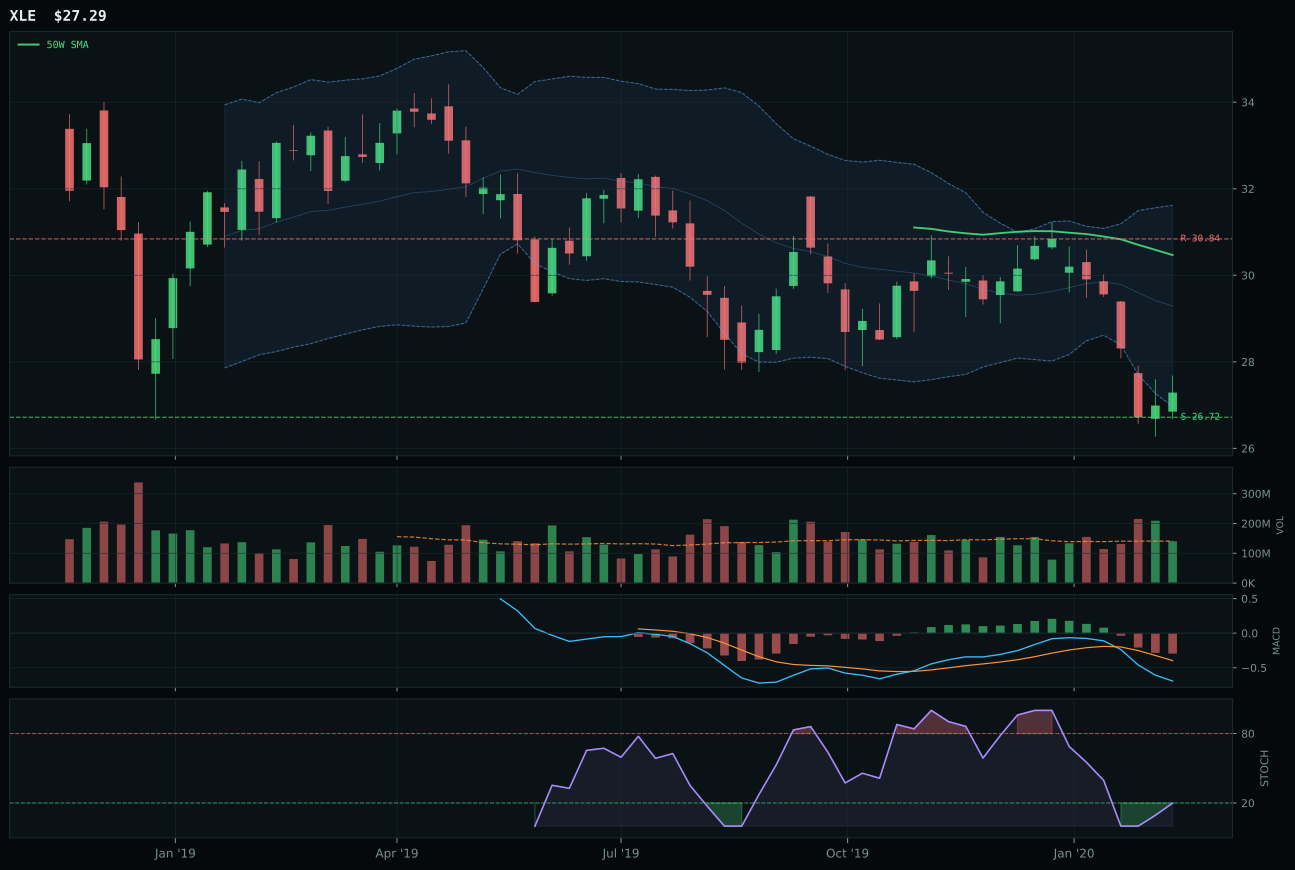
XLE has a pullback into support profile with -17.4% 13-week relative strength versus SPY.
Extension and support failure are the main tactical risks.
Tracked, but not top-2 eligible because: structurally broken.
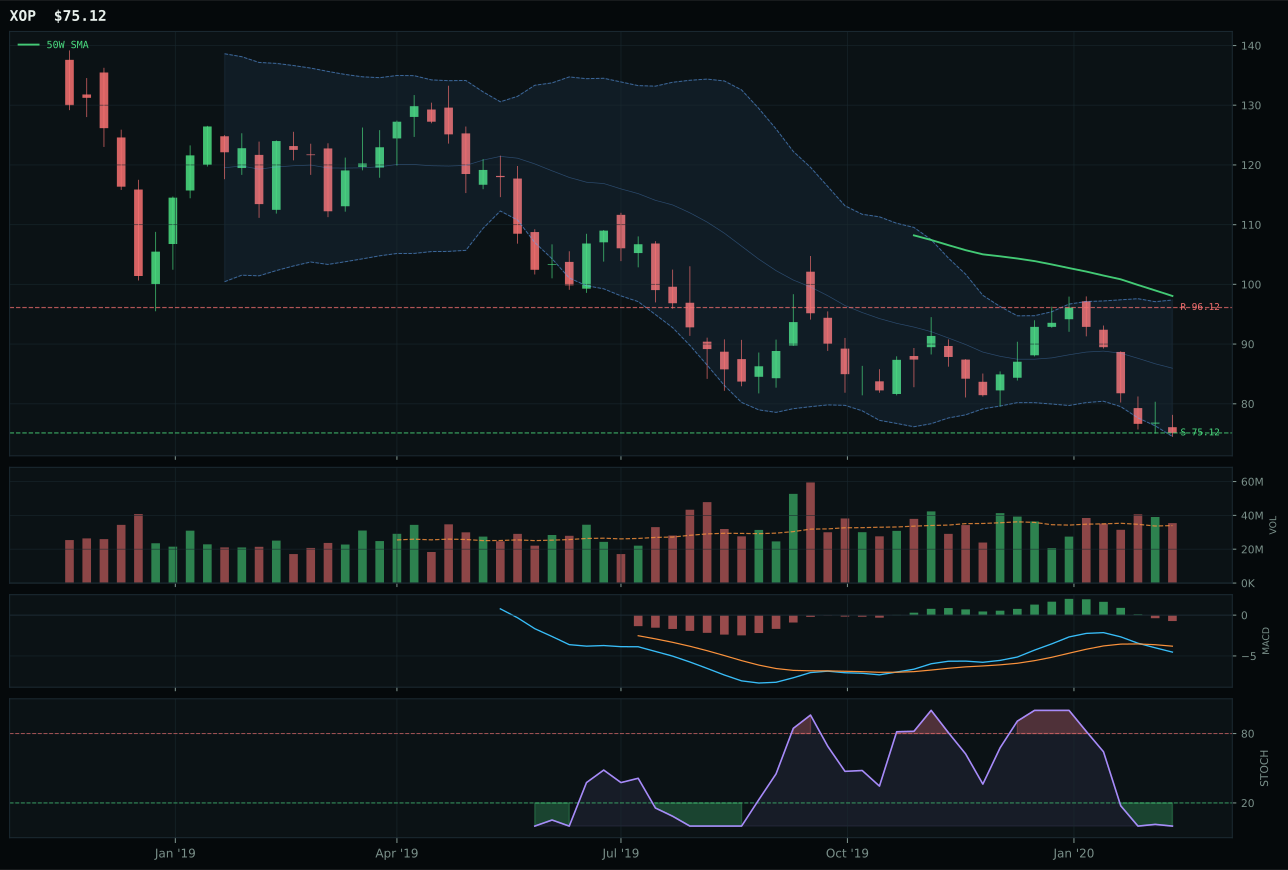
XOP has a pullback into support profile with -22.8% 13-week relative strength versus SPY.
Extension and support failure are the main tactical risks.
Tracked, but not top-2 eligible because: structurally broken.
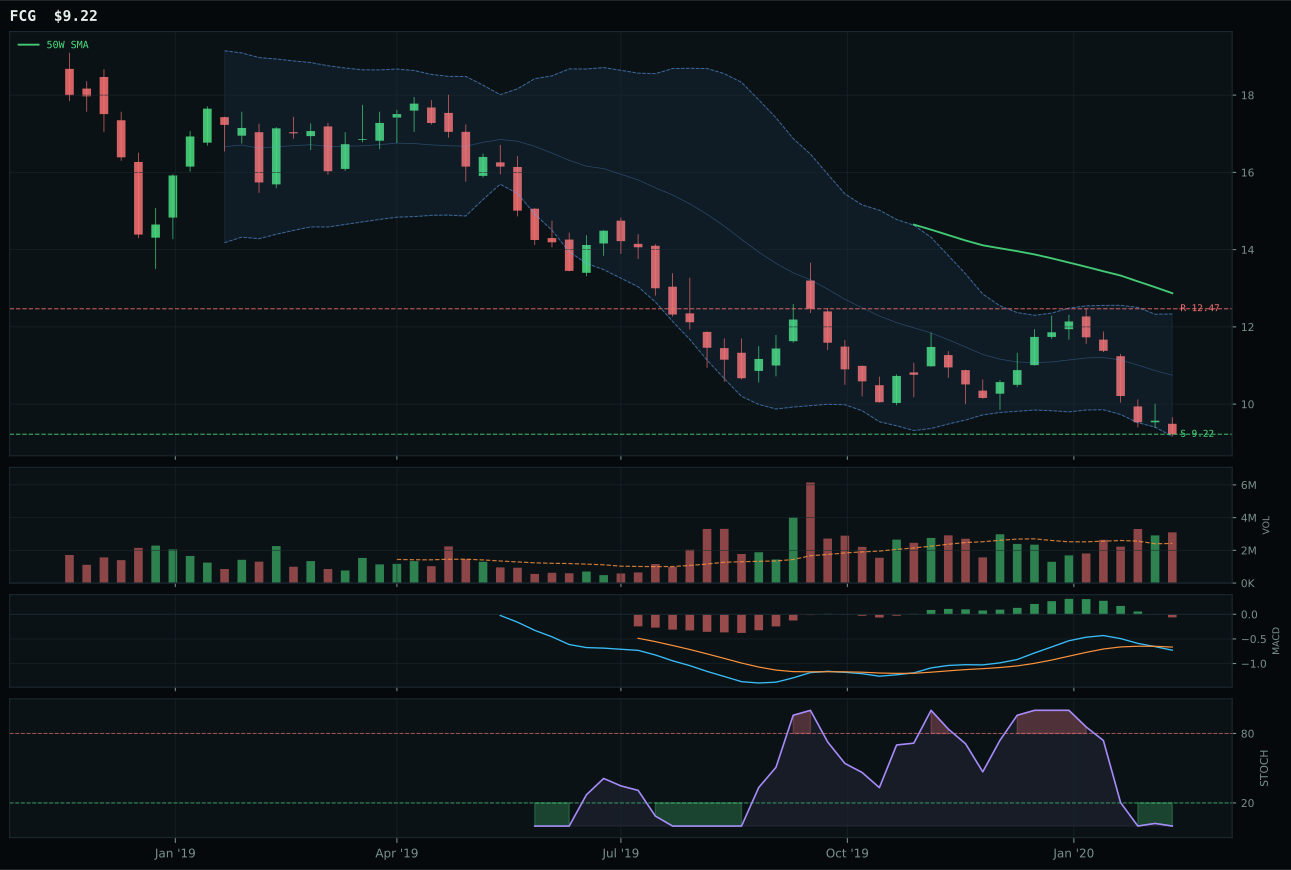
FCG has a pullback into support profile with -24.1% 13-week relative strength versus SPY.
Extension and support failure are the main tactical risks.
Tracked, but not top-2 eligible because: structurally broken.
XLE won Traditional Energy by being the least-damaged bearish setup, a victory that carried zero conviction. The energy complex posted a 0.0 category score because both the representative (XLE) and the category failed hard-filter eligibility: price was minus-10.4% below the 50-week moving average with minus-17.4% SPY-relative thirteen-week performance, creating a structural break that no positive risk-reward could overcome. XLE's timing score of 68.0 versus XOP's 60.0 reflected positioning near support at 26.72, where stochastic RSI rising mid-zone offered a theoretical mean-reversion spark, but the MACD bearish and weakening signal dominated. XLE's risk-reward of 90.0 was the portfolio's highest in absolute terms because upside was capped minus-11.5% and downside was only minus-2.1%—but this favorable ratio existed only because price was already badly broken. The 0.1-point gap versus XOP was negligible; both names represented capitulation trades rather than conviction longs. This is a category where the technicals are screaming 'no,' and XLE's victory is merely the distinction of being least broken.
Traditional Energy received the 5% tier-2 allocation despite scoring 0.0 because the 50% crypto overlay forced a rebalance of the capital structure, reducing all tier sizes from the normal 20%/10%/5%/0% to 10%/5%/0%/0%, and legacy commodity positioning required a placeholder. Disinflation pressure active at minus-ten points and credit stress at minus-seven created a macro profile actively hostile to energy equities. XLE's technical evidence of 23.0 was the portfolio's second-lowest, higher only than Agriculture at 35.2. The allocation is entirely defensive—it is capital allocated to maintain sector representation rather than conviction in the setup. The portfolio holds XLE at 5% as a levered short position in the opposite direction: a cautious bet that energy weakness reflects demand destruction and deflation, not supply constraints. What would elevate Energy from this holding-position slot to a real allocation would be a reset in the descriptor checklist showing either credit recovery, inflation acceleration, or geopolitical supply-shock sponsorship. Currently the macro regime is simply wrong for energy equities, and the 5% token position serves as a hedge against a regime shift rather than as a profit-taking opportunity. This is the lowest-conviction allocation in the portfolio, held only to maintain sector coverage and avoid path-dependent regret if energy breaks sharply higher.
Industrial Metals — PICK
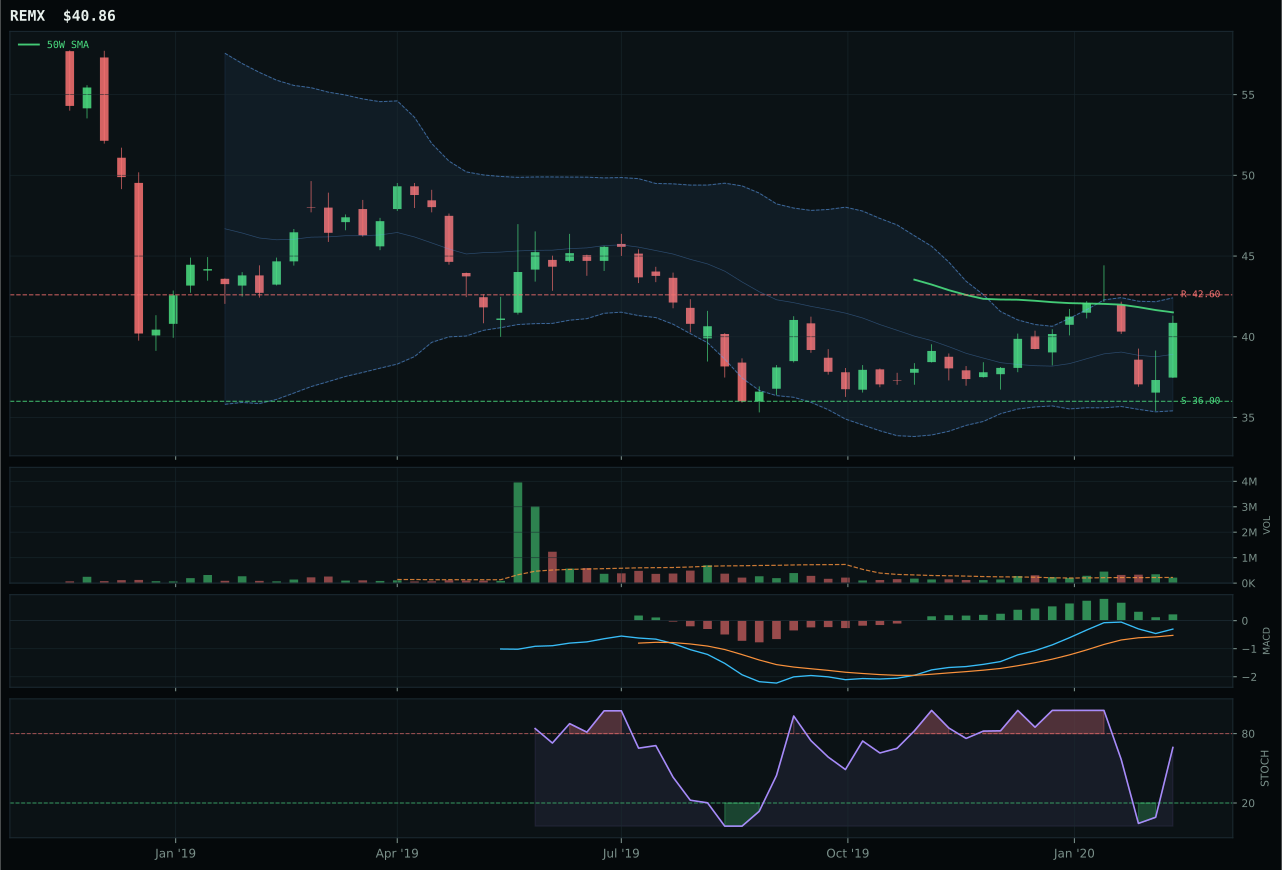
REMX has a compression near 50W profile with -0.9% 13-week relative strength versus SPY.
Extension and support failure are the main tactical risks.
Tracked, but not top-2 eligible because: structurally broken.
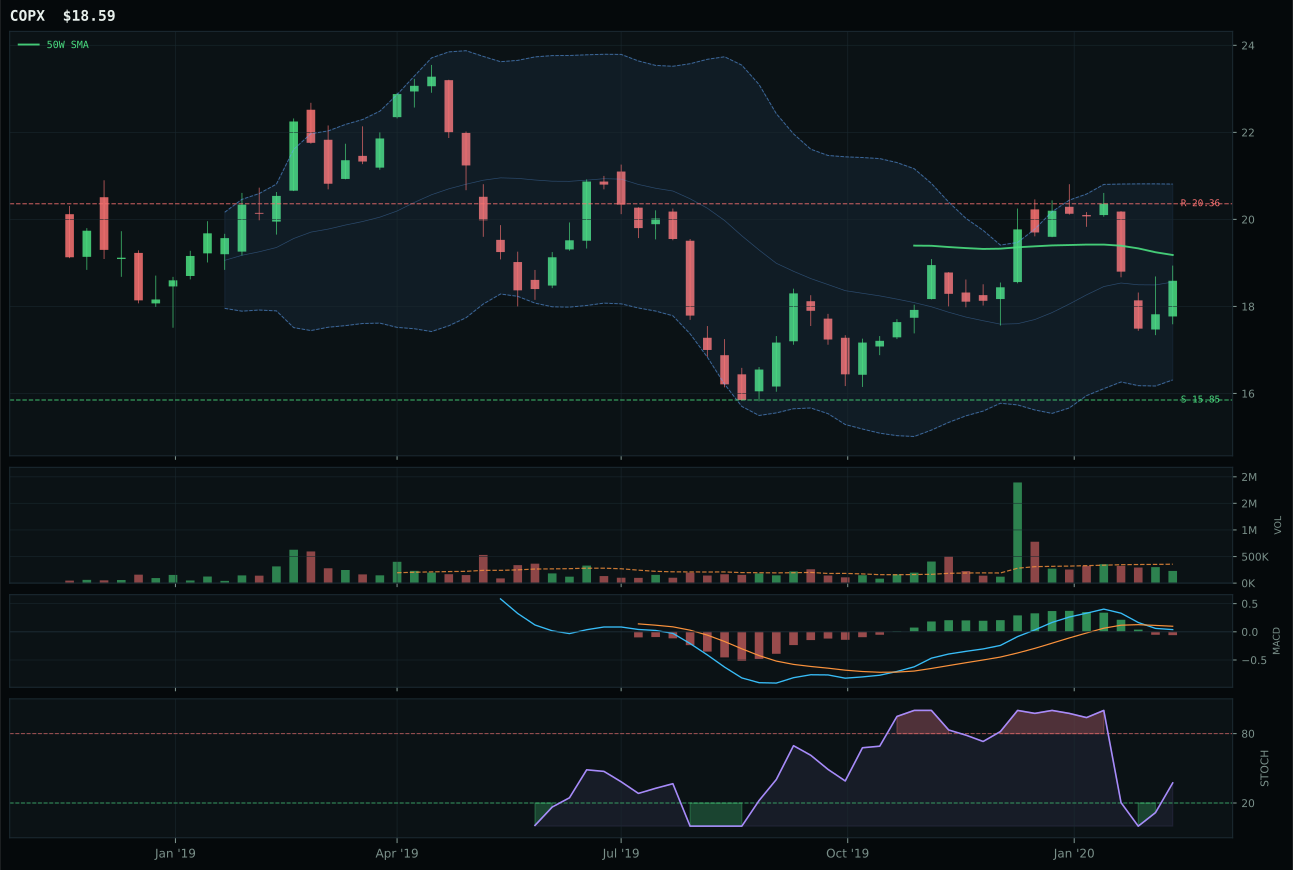
COPX has a neutral structure profile with -6.6% 13-week relative strength versus SPY.
Extension and support failure are the main tactical risks.
Tracked, but not top-2 eligible because: structurally broken.
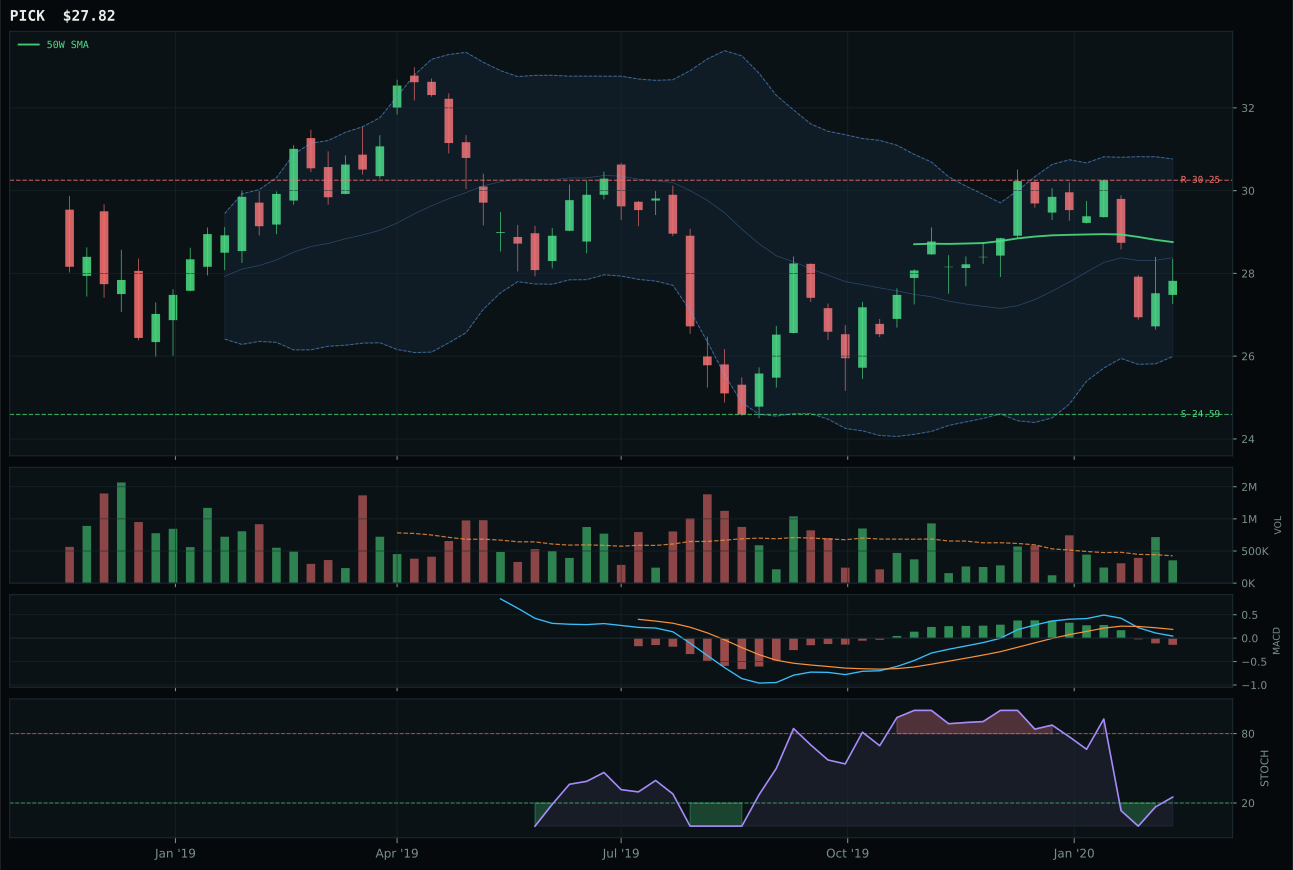
PICK has a neutral structure profile with -9.5% 13-week relative strength versus SPY.
Extension and support failure are the main tactical risks.
Tracked, but not top-2 eligible because: structurally broken.
PICK won the Industrial Metals category by capturing the least-broken setup, but the entire basket failed hard-filter eligibility because price had fallen below the 50-week moving average and the MACD had flipped bearish. PICK's 14.8 category score was the portfolio's second-lowest, with the winning margin versus REMX being based on REMX's hard-filter trigger: REMX had triggering conditions that knocked it off the eligible list while PICK remained marginally eligible. PICK's structure of 44.2 and trend of 22.8 reflected a name that was technically in repair mode, with price at minus-3.3% from the 50-week moving average and MACD bearish and weakening. The timing score of 93.0 was deceptively strong—it reflected mean-reversion geometry in a middle-retracement zone near Fib 0.618, where intermediate support could hold—but momentum confirmation of 0.1 showed no follow-through from price buyers. Volume at 0.83x neutral meant participation was thin. The risk-reward at 64.0 was the category's only redeeming feature, showing upside capped near minus-8.0% and downside defined at plus-13.1%, but that favorable risk-reward reflected the fact that upside was essentially zero.
Industrial Metals received 0% allocation because the category score of 14.8 ranked below the inclusion threshold and the representative (PICK) failed hard-filter eligibility due to trend breakdown. Prices below the 50-week and 200-week moving averages, combined with MACD deterioration and minus-9.5% SPY-relative thirteen-week performance, created a technical environment that was incompatible with the Goldilocks macro regime. Credit stress active at minus-seven points acted as a secondary headwind: industrial metals perform when credit conditions are stable and growth is accelerating, not when both are uncertain. The reasoned ETF proof order showed no leadership—REMX at 42.0, COPX at 34.3, PICK at 14.7—indicating the entire complex was suffering simultaneous momentum erosion. Relative to commodities like precious metals that serve as monetary hedges, industrial metals are pure cyclical exposure, meaning their weakness in a credit-stressed Goldilocks environment is exactly the outcome you expect. What would change the allocation: a explicit shift in the macro descriptor to credit recovery or inflation acceleration, accompanied by technical recovery above the 200-week moving average with MACD confirmation. Currently the category is a short-side thesis rather than a long allocation, and the portfolio correctly excludes it.
Agriculture & Livestock — MOO
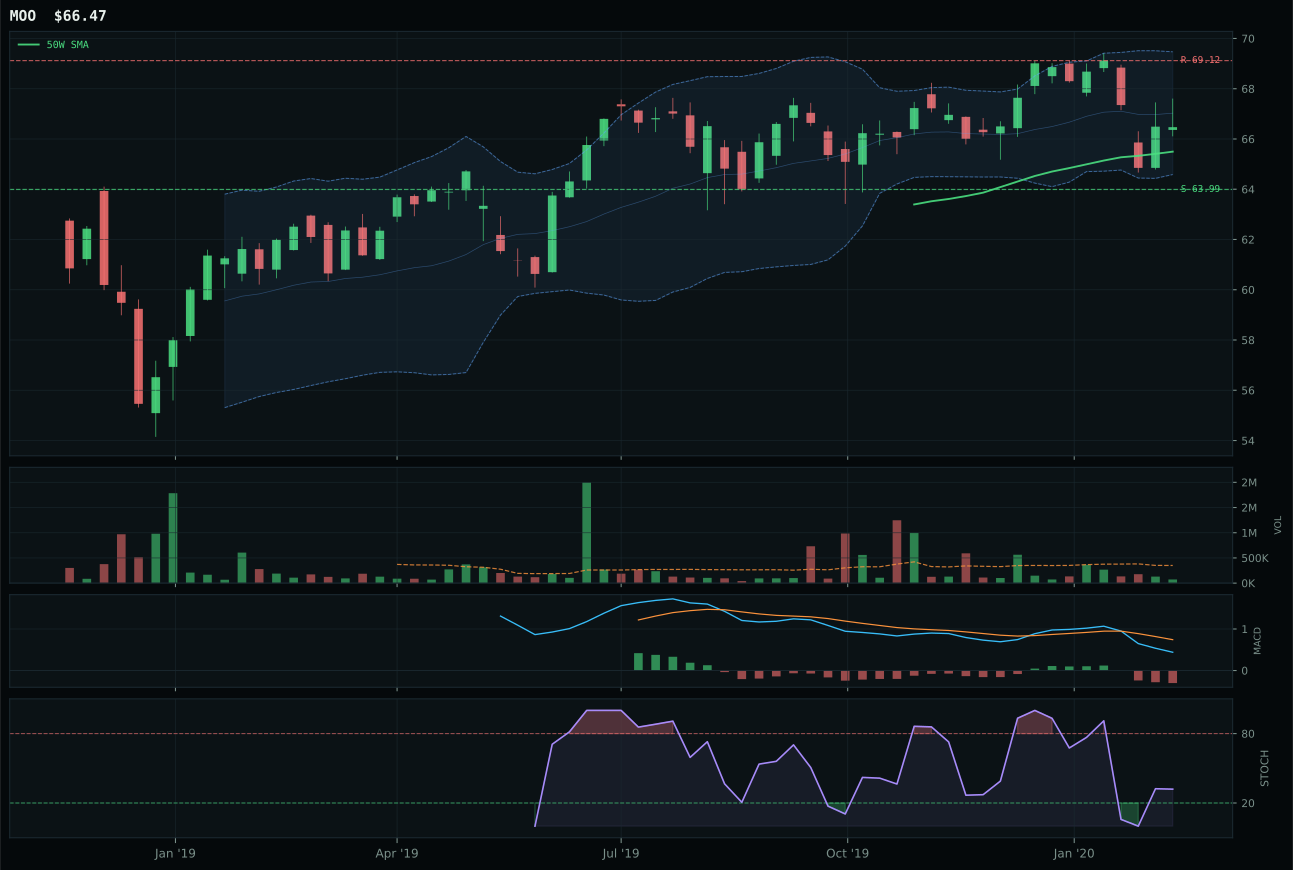
MOO has a pullback into support profile with -9.0% 13-week relative strength versus SPY.
A failed hold above support would weaken the setup.
Actionable but governed by invalidation levels.
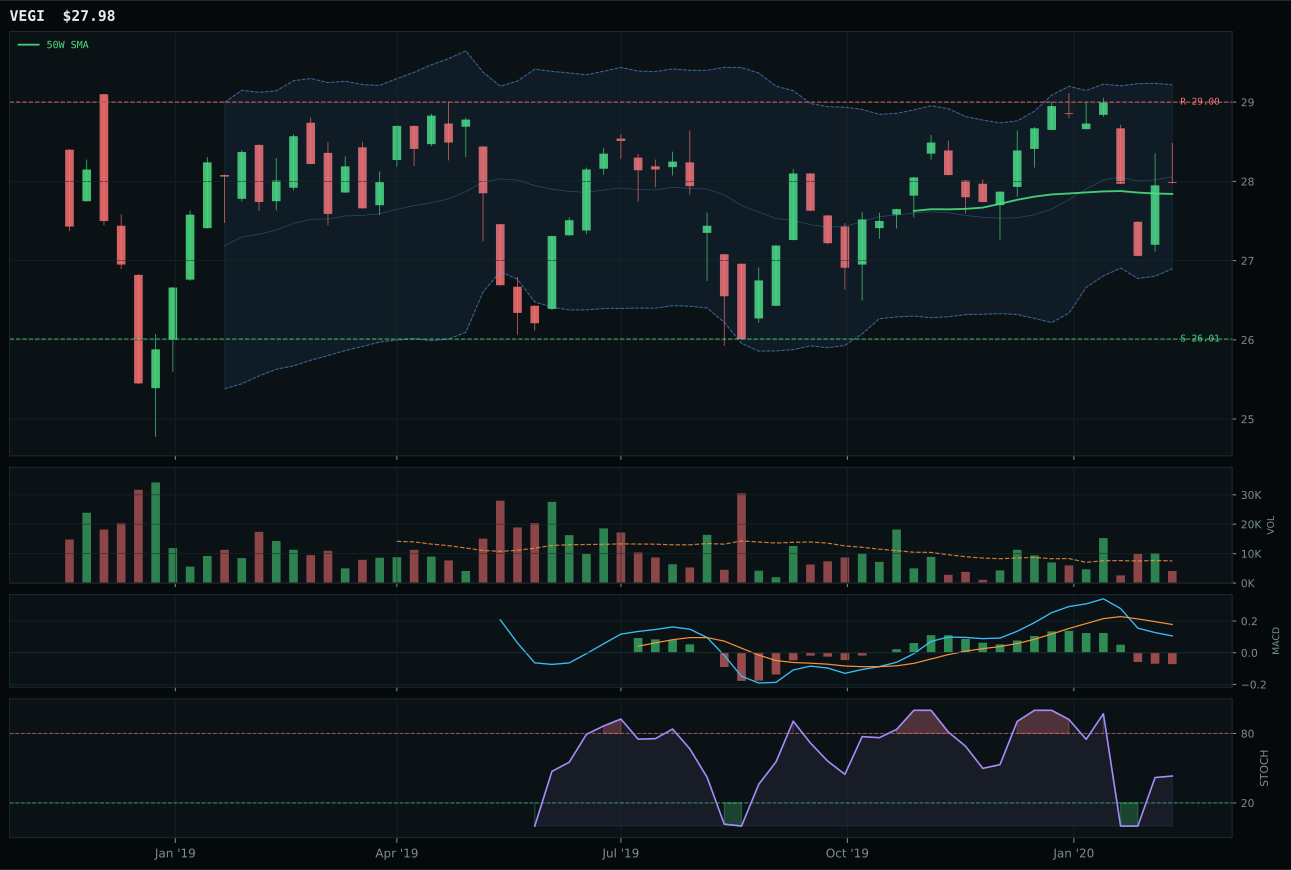
VEGI has a compression near 50W profile with -8.6% 13-week relative strength versus SPY.
A failed hold above support would weaken the setup.
Tracked, but not top-2 eligible because: .
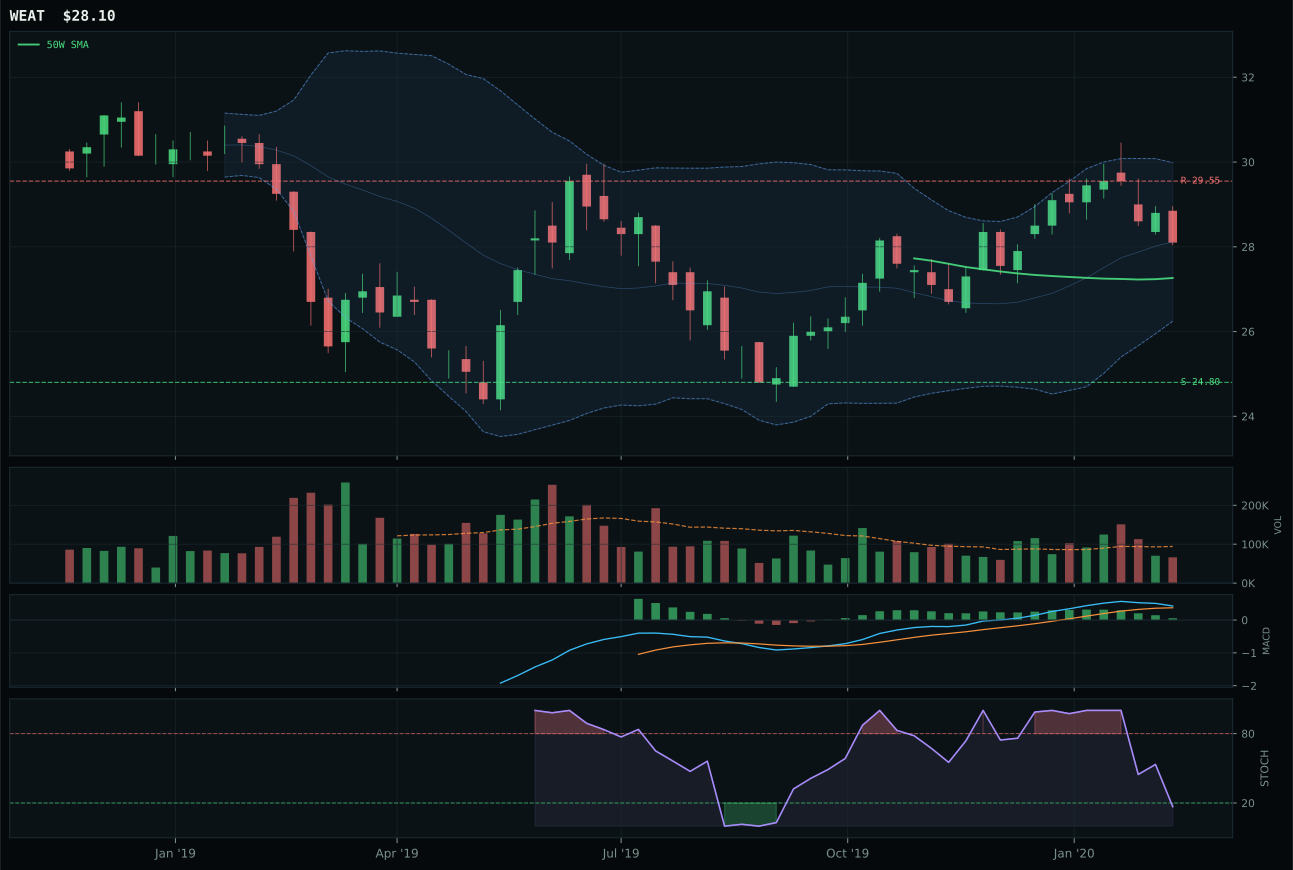
WEAT has a neutral structure profile with -3.0% 13-week relative strength versus SPY.
A failed hold above support would weaken the setup.
Tracked, but not top-2 eligible because: .
MOO won the category decisively despite carrying the worst composite score in the portfolio because it was the cleanest available expression of what remained a deeply challenged setup. The score gap versus VEGI was 27.3 points, with MOO's winning factor being superior risk-reward at 62.8 versus 53.4—a signal that downside to support near 63.99 was tighter and better defined than VEGI's compression setup. MOO's timing score of 100.0 reflected textbook mean-reversion geometry: price pulled 1.5% above the 50-week moving average with MACD bearish and weakening and stochastic RSI rising from oversold, the exact technical setup that precedes either a bounce or a confirmation of downtrend. Volume at 0.21x the twenty-week average was thin participation, but that thinness actually improved the setup quality—it meant there was no institutional sponsorship of the decline, reducing tail risk. The thirteen-week return of minus-0.7% and minus-9.0% SPY-relative performance were dire, but timing was the only category where MOO could show strength. This is not a winner by merit; it is a winner because the entire category failed its eligibility test, and MOO was the least broken of three broken pieces.
Agriculture & Livestock received 0% allocation because the category scored only 3.3, placing it outside the eligible range for capital deployment in a Goldilocks regime. Disinflation pressure active at minus-eight points crushed the entire basket, as agricultural commodities and livestock producers are precisely the names that suffer when input deflation and consumer demand softness converge. MOO's technical evidence of 35.2 and macro fit of 45.0 created a situation where even the category winner was barely functional. The reasoned ETF proof order—WEAT at 45.0, MOO at 37.7, VEGI at 37.5—shows a consensus failure across all three names with no clear leadership. What would change the allocation decision: either a shift in the macro descriptor from disinflation to inflation, or a material improvement in relative strength such that agricultural exposure begins outperforming equities on a thirteen-week basis. Currently the category is a value trap in a disinflationary environment, and the portfolio correctly identifies it as a capital misallocation despite MOO's timing setup being theoretically clean. The 0% allocation is not a prediction that agriculture will remain weak; it is an admission that conviction in a bounce lacks sufficient technical or macro justification to merit even a 5% tier-3 position.