
2020-02-07
Informational purposes only. The content in this report, including allocations, analysis, and commentary, is provided solely for informational and educational purposes. It does not constitute financial advice, investment advice, trading advice, or any other type of advice. Past performance does not guarantee future results. Always conduct your own research and consult a qualified financial professional before making investment decisions.
Some tracked tickers were excluded due to missing live weekly price data: SGOV: Historical cache SGOV has only 0 usable weekly bars; URNM: Historical cache URNM has only 10 usable weekly bars
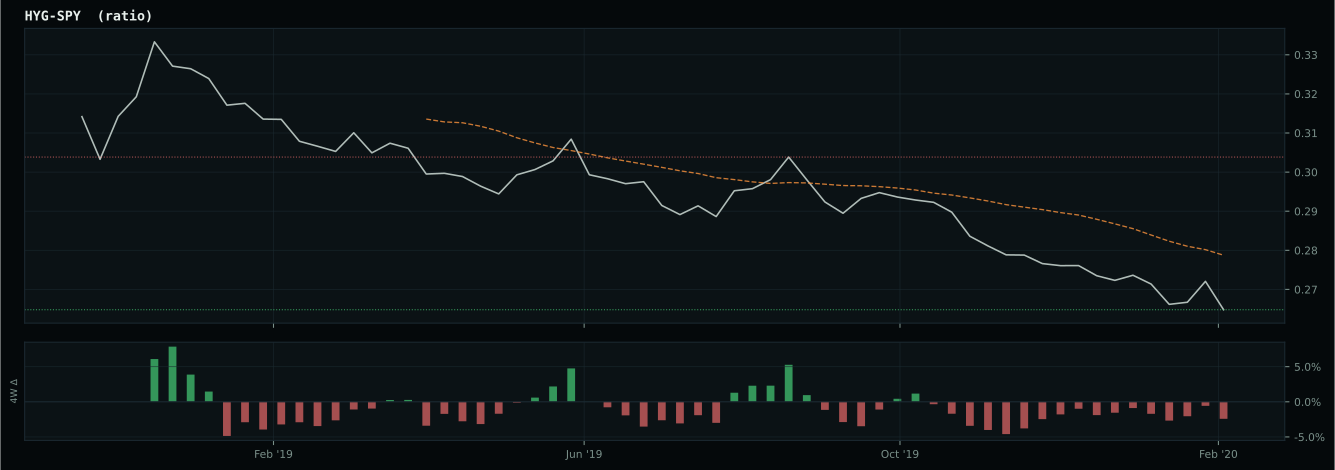
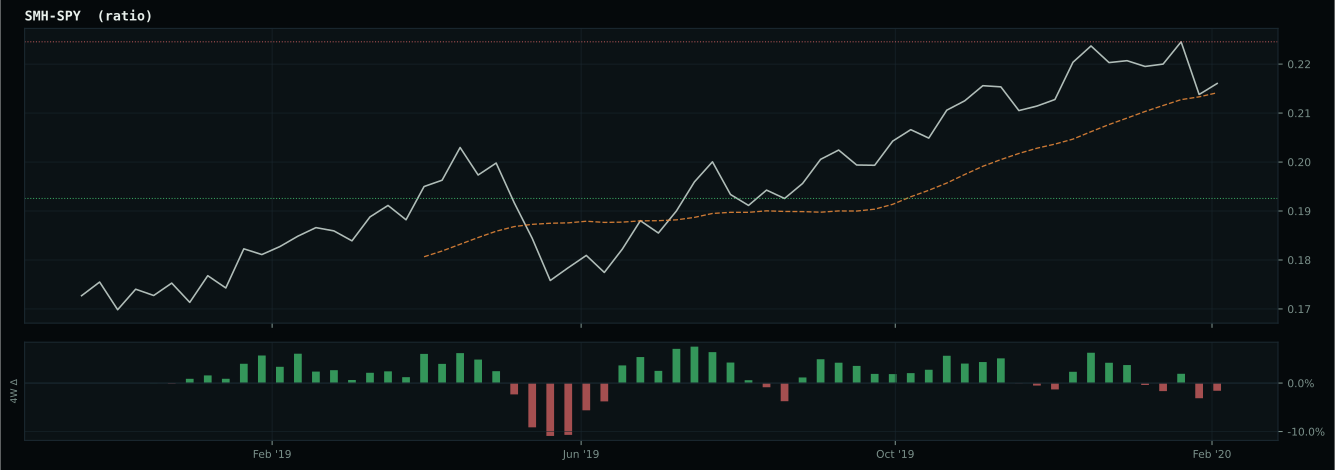
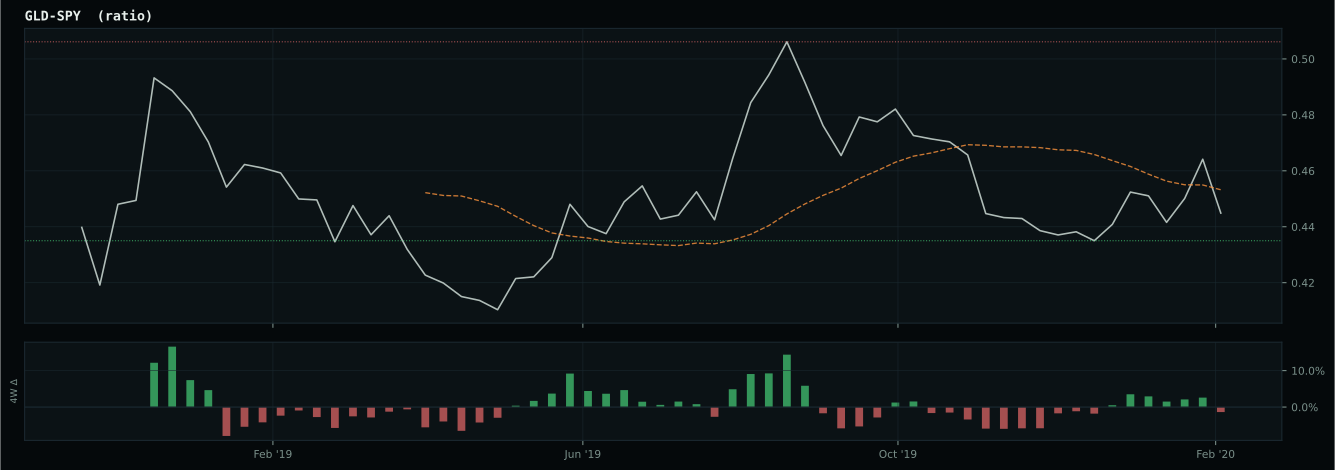
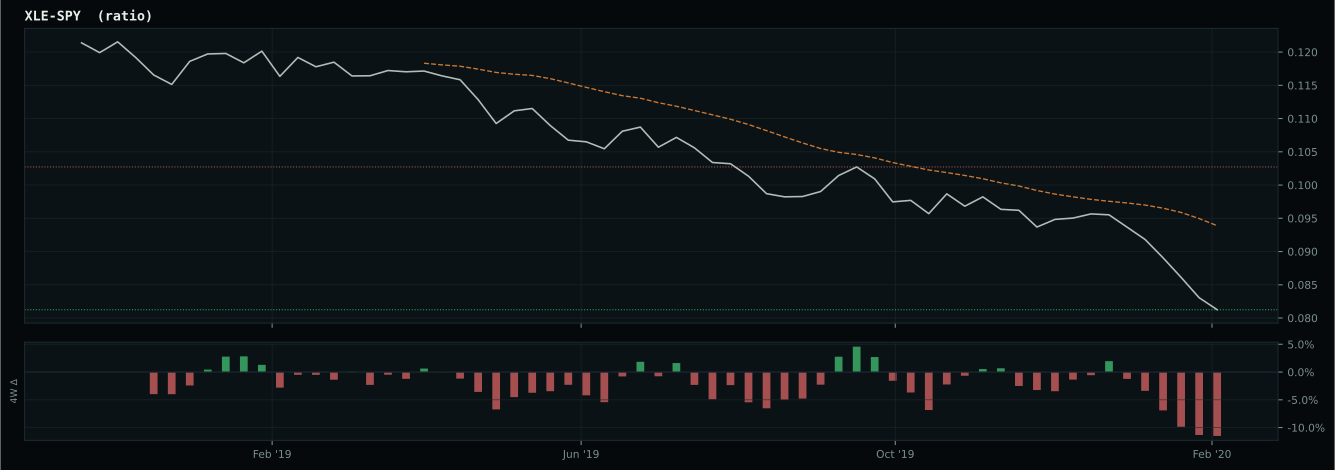
AltSeason was blocked by macro risk gating: The macro engine classifies the structural regime as Goldilocks with a tactical overlay of Transition / Mixed. Growth score is 50.0, inflation pressure is 12.3, liquidity is 62.0, credit stress is 59.3, and macro risk is 50.8. Cash is not required because crisis macro risk is inactive and bear-defense structure has 1/5 required checks. The active Defensive trigger is none and the Defensive cause is none.
Weekly Allocation
| Ticker | Category | Weight | Role |
|---|---|---|---|
| FBTC | 50% | Overlay | |
| XLK | Technology | 10% | Top-2 (10%) |
| XLU | Utilities & Infrastructure | 10% | Top-2 (10%) |
| ITA | Defense & Aerospace | 5% | Tier-2 (5%) |
| SMH | AI | 5% | Tier-2 (5%) |
| INDA | Emerging Markets | 5% | Tier-2 (5%) |
| GLD | Precious Metals | 5% | Tier-2 (5%) |
| XLE | Traditional Energy | 5% | Tier-2 (5%) |
| NLR | Nuclear Energy | 5% | Tier-2 (5%) |
Trade Instructions — Monday Open
Sell the tranche from 2020-01-10 (completing its 4-week hold). Buy the new tranche. Instructions show net portfolio changes — same-asset positions cancel, weight changes show the delta.
| Action | Ticker | Instruction |
|---|---|---|
| SELL | IGV | Sell 44% of IGV position (reduce 11.25% → 6.25%) |
| SELL | IEMG | Sell 67% of IEMG position (reduce 7.50% → 2.50%) |
| SELL | GLD | Sell 17% of GLD position (reduce 7.50% → 6.25%) |
| SELL | SMH | Sell 25% of SMH position (reduce 5.00% → 3.75%) |
| SELL | PICK | Sell 40% of PICK position (reduce 6.25% → 3.75%) |
| SELL | MOO | Sell 50% of MOO position (reduce 5.00% → 2.50%) |
| SELL | XAR | Sell 50% of XAR position (reduce 5.00% → 2.50%) |
| BUY | FBTC | Buy FBTC — 62.50% of freed cash (adds 12.50% to portfolio) |
| BUY | INDA | Buy INDA — 6.25% of freed cash (adds 1.25% to portfolio) |
| BUY | XLE | Buy XLE — 6.25% of freed cash (adds 1.25% to portfolio) |
| BUY | ITA | Buy ITA — 6.25% of freed cash (adds 1.25% to portfolio) |
| BUY | XLK | Buy XLK — 12.50% of freed cash (adds 2.50% to portfolio) |
| BUY | NLR | Buy NLR — 6.25% of freed cash (adds 1.25% to portfolio) |
Current Portfolio After Trade
Combined holdings across all 4 active tranches. Each tranche is 25% of the portfolio.
| Ticker | % of Portfolio | Weight Bar |
|---|---|---|
| FBTC | 50.00% | |
| XLU | 8.75% | |
| GLD | 6.25% | |
| IGV | 6.25% | |
| SMH | 3.75% | |
| XLE | 3.75% | |
| PICK | 3.75% | |
| IEMG | 2.50% | |
| MOO | 2.50% | |
| XAR | 2.50% | |
| INDA | 2.50% | |
| ITA | 2.50% | |
| XLK | 2.50% | |
| BOTZ | 1.25% | |
| NLR | 1.25% |
Macro Regime — Goldilocks
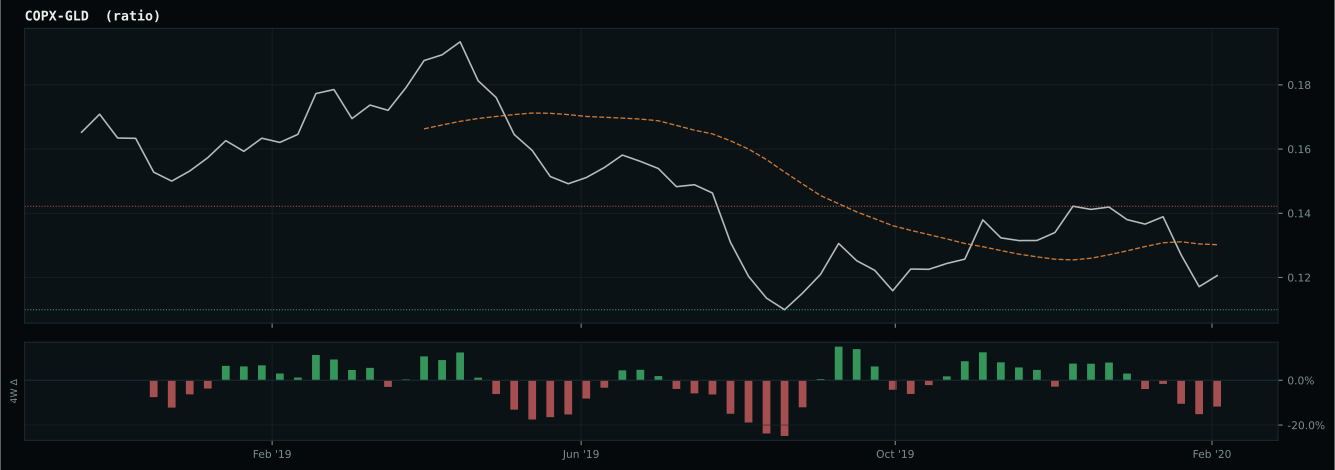
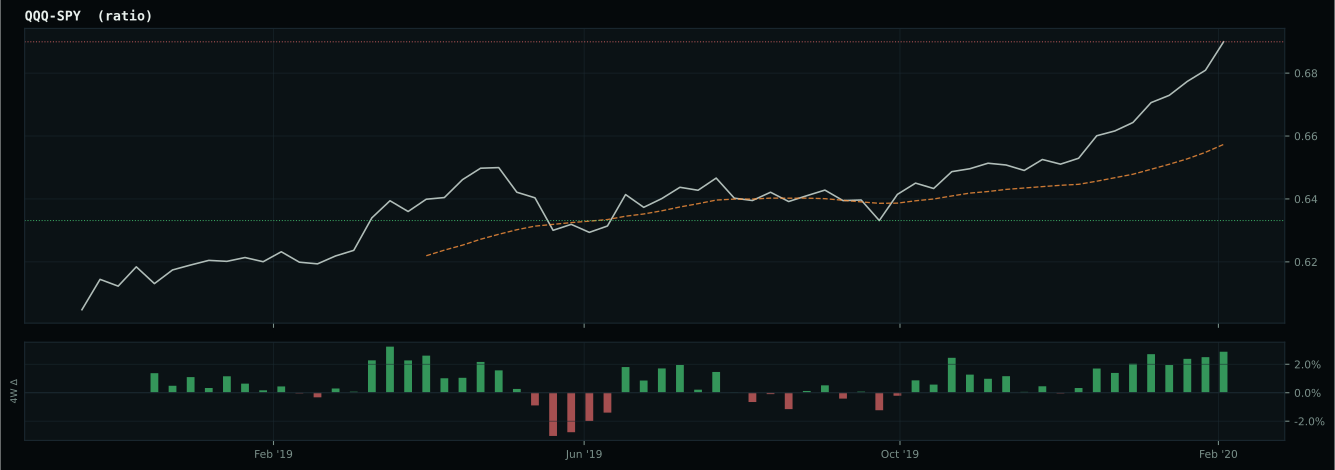
Macro Evidence Charts
Market-implied signals behind the macro regime scores. Each ratio compares two assets; the direction and slope of the ratio is what the macro engine reads.
Crypto Regime — TrendBTC
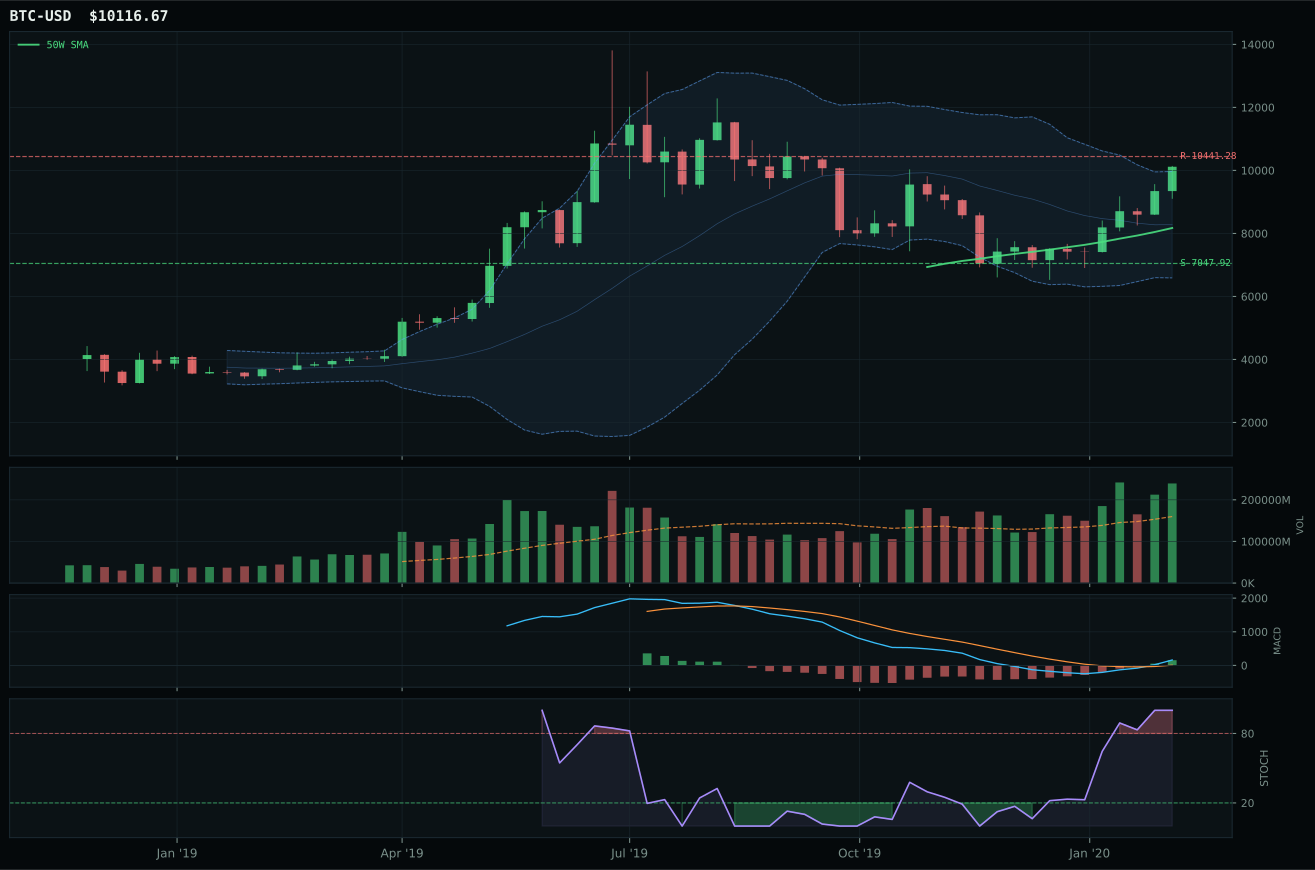
post-touch structure is too wide to count as a range; max/min close ratio is 3.54
TrendBTC confirmed: 2 consecutive closes above rising/flat 50W SMA
all available AltSeason conditions pass; missing optional confirmations skipped Macro gate failed, so AltSeason was downgraded.

Category Rankings
| Rank | Category | Winner | Score | Alloc | 4W Ret | Peers (4W) |
|---|---|---|---|---|---|---|
| 1 | Technology | XLK | 68.0 | 20% | -17.69% | IGV -17.4% · CIBR -20.0% |
| 2 | Utilities & Infrastructure | XLU | 63.7 | 20% | -7.50% | IGF -13.5% · PAVE -18.3% |
| 3 | Defense & Aerospace | ITA | 62.4 | 10% | -25.12% | XAR -25.8% · ROKT -16.2% |
| 4 | AI | SMH | 47.5 | 10% | -15.37% | BOTZ -16.6% · AIQ -17.2% |
| 5 | Emerging Markets | INDA | 42.8 | 10% | -18.91% | IEMG -14.3% · ILF -25.3% |
| 6 | Precious Metals | GLD | 42.5 | 10% | +7.01% | GDX +0.7% · SLV -4.9% |
| 7 | Nuclear Energy | NLR | 18.2 | 10% | -8.94% | URA -9.4% |
| 8 | Industrial Metals | PICK | 13.4 | 10% | -25.07% | REMX -19.1% · COPX -21.0% |
| 9 | Agriculture & Livestock | MOO | 10.1 | 0% | -17.50% | WEAT -8.3% · VEGI -12.4% |
| 10 | Traditional Energy | XLE | — | 0% | -34.69% | FCG -47.0% · XOP -48.6% |
Technology — XLK
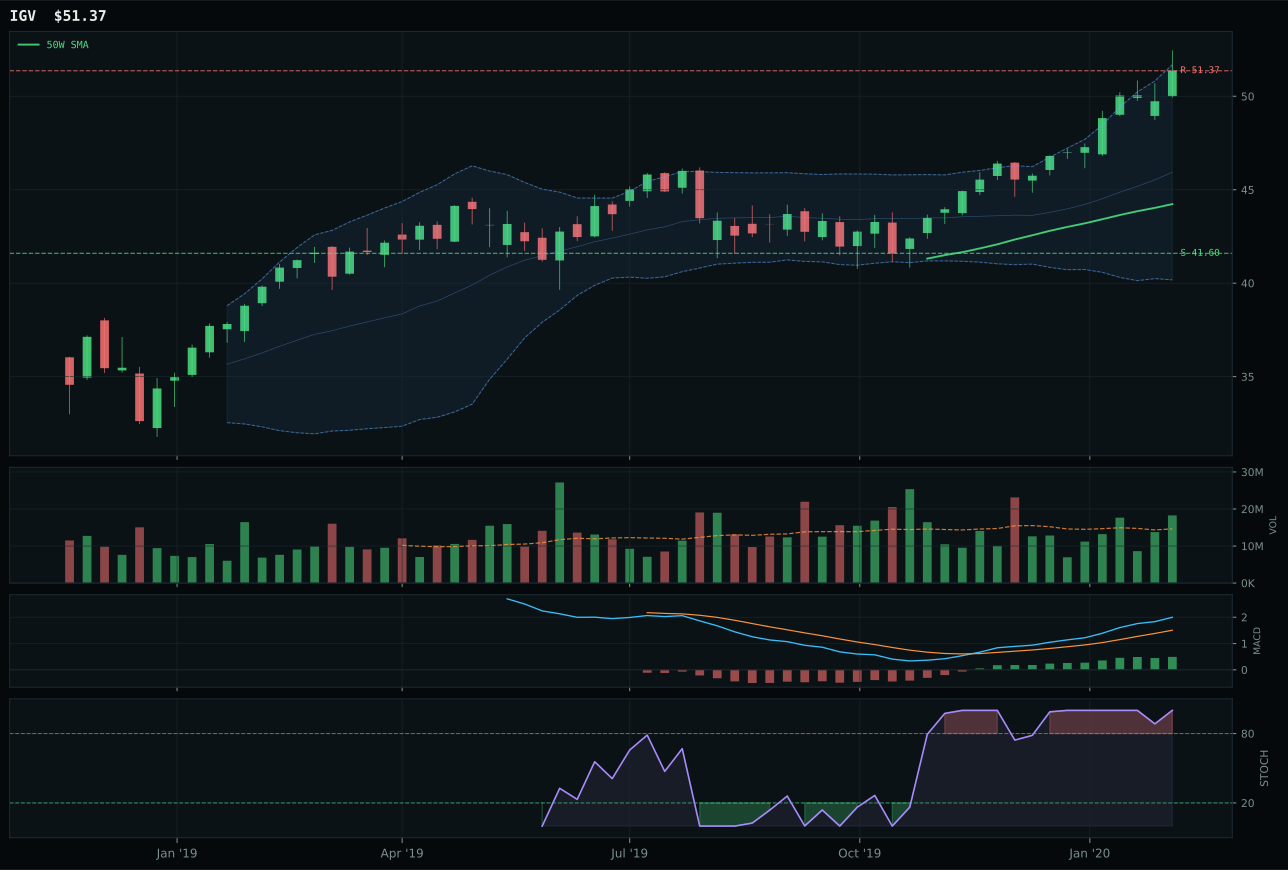
IGV has a vertical extension profile with 9.3% 13-week relative strength versus SPY.
A failed hold above support would weaken the setup.
Actionable but governed by invalidation levels.
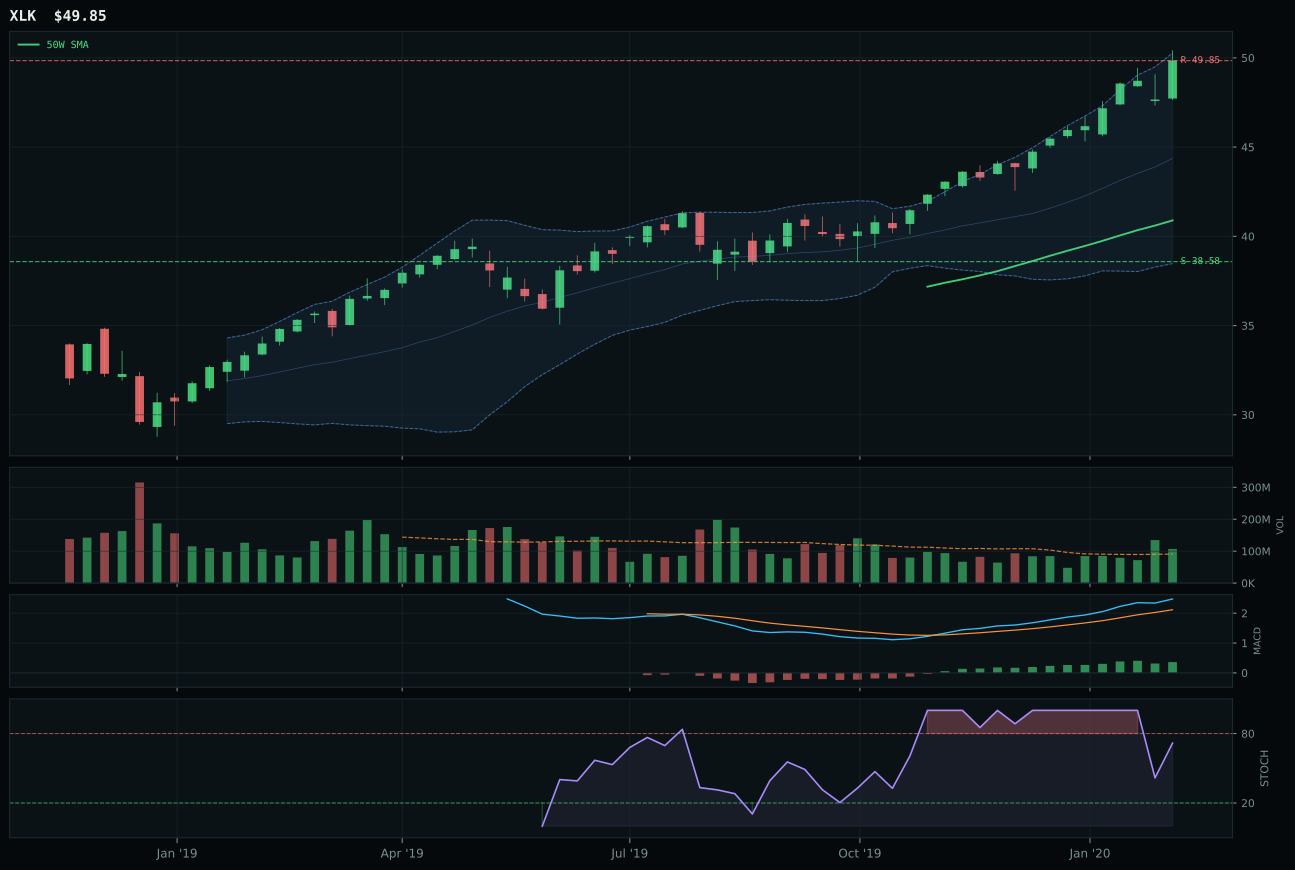
XLK has a vertical extension profile with 8.2% 13-week relative strength versus SPY.
A failed hold above support would weaken the setup.
Actionable but governed by invalidation levels.
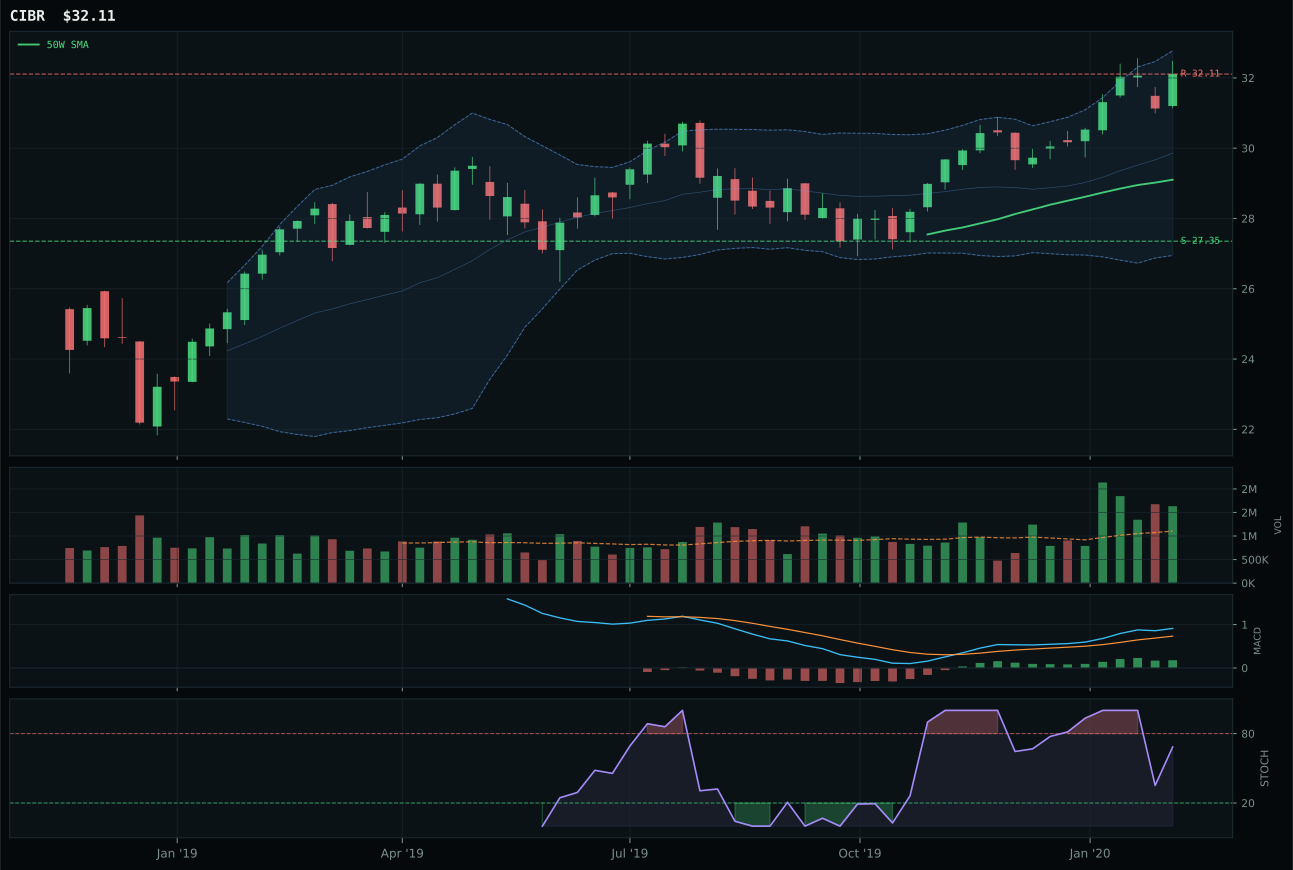
CIBR has a neutral structure profile with 0.7% 13-week relative strength versus SPY.
A failed hold above support would weaken the setup.
Actionable but governed by invalidation levels.
XLK wins the category on superior timing discipline despite matching trend strength with IGV. Price sits 21.9% above the 50-week moving average in a clean vertical extension with MACD bullish and improving, but the stochastic RSI is falling neutral at 0.72 rather than overbought momentum—a subtle but critical distinction that marks genuine accumulation over late-stage chase. The 8.2% relative strength versus SPY and category-relative parity (0.0%) confirm XLK is leading on breadth rather than isolated momentum; at 1.18x average volume, buyers are present but measured. IGV's superior SPY RS of 9.3% and 16.9% thirteen-week return are offset by its overbought stochastic reading and weaker timing score of 37 versus XLK's 45, signaling that enterprise software has extended further on duration positioning rather than on fresh accumulation. This matters in a Goldilocks regime where credit stress is active: cleaner setups with falling momentum indicators tend to hold support better than those riding overbought reads.
Technology earns the 10% top-two allocation slot by ranking among the two highest eligible category scores at 68.0, driven by strong technical evidence at 85.6 and macro fit of 44.0 in an environment where Goldilocks helps defensive leadership while credit stress selectively penalizes growth. XLK's perfect trend score of 100, coupled with 74.7 volume-price confirmation and 70.4 persistence, reflects genuine institutional participation in broad profitable tech rather than speculative concentration. The category's macro alignment is mixed: disinflation pressure and defensive rotation both favor steady earners, yet credit stress cost the category 7 points at the reasoning layer, preventing it from scoring higher. Positioning at 10% reflects confidence that technology will remain a structural beneficiary of rate stability and business confidence even if growth narratives face near-term skepticism; this is leadership through resilience rather than momentum.
Utilities & Infrastructure — XLU
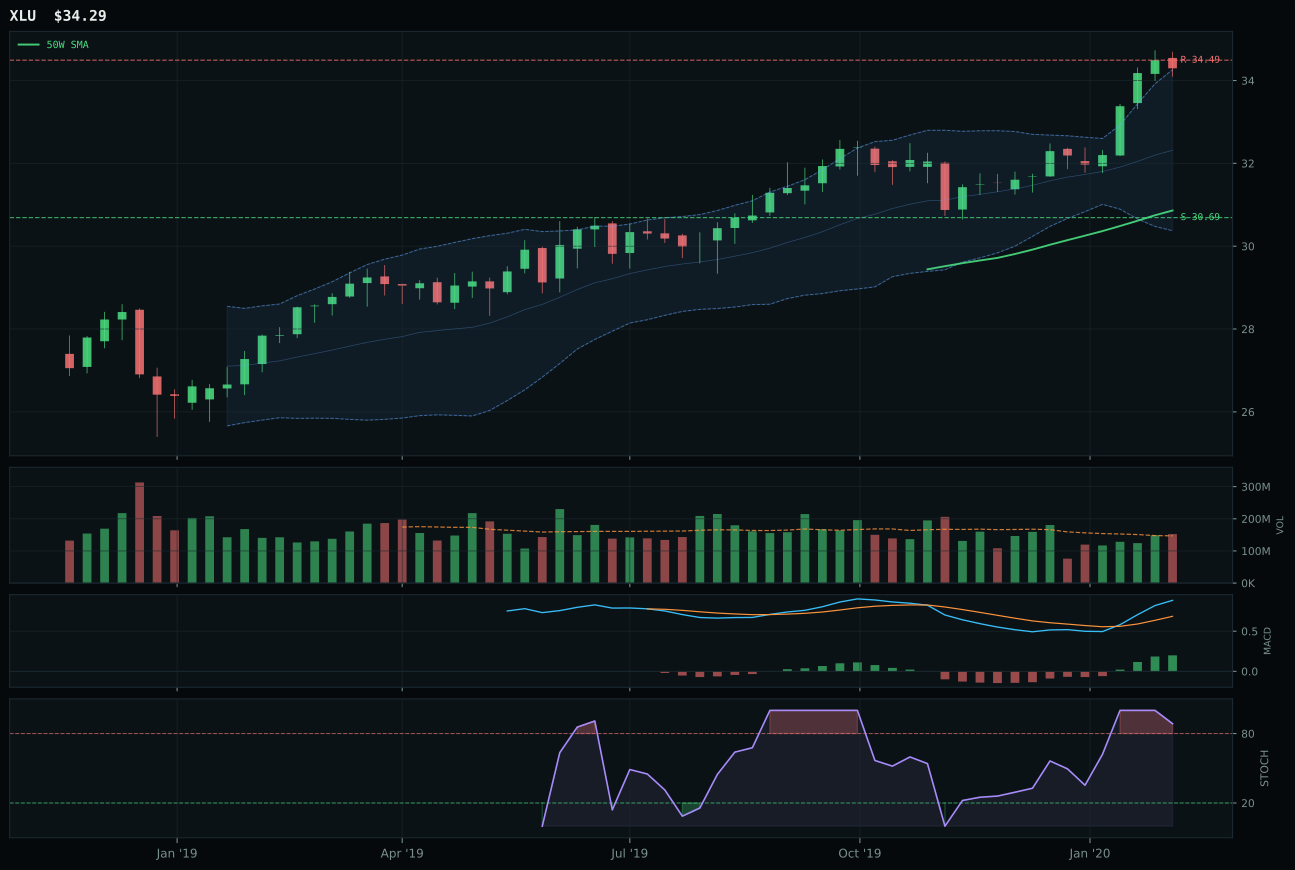
XLU has a neutral structure profile with 3.5% 13-week relative strength versus SPY.
A failed hold above support would weaken the setup.
Actionable but governed by invalidation levels.
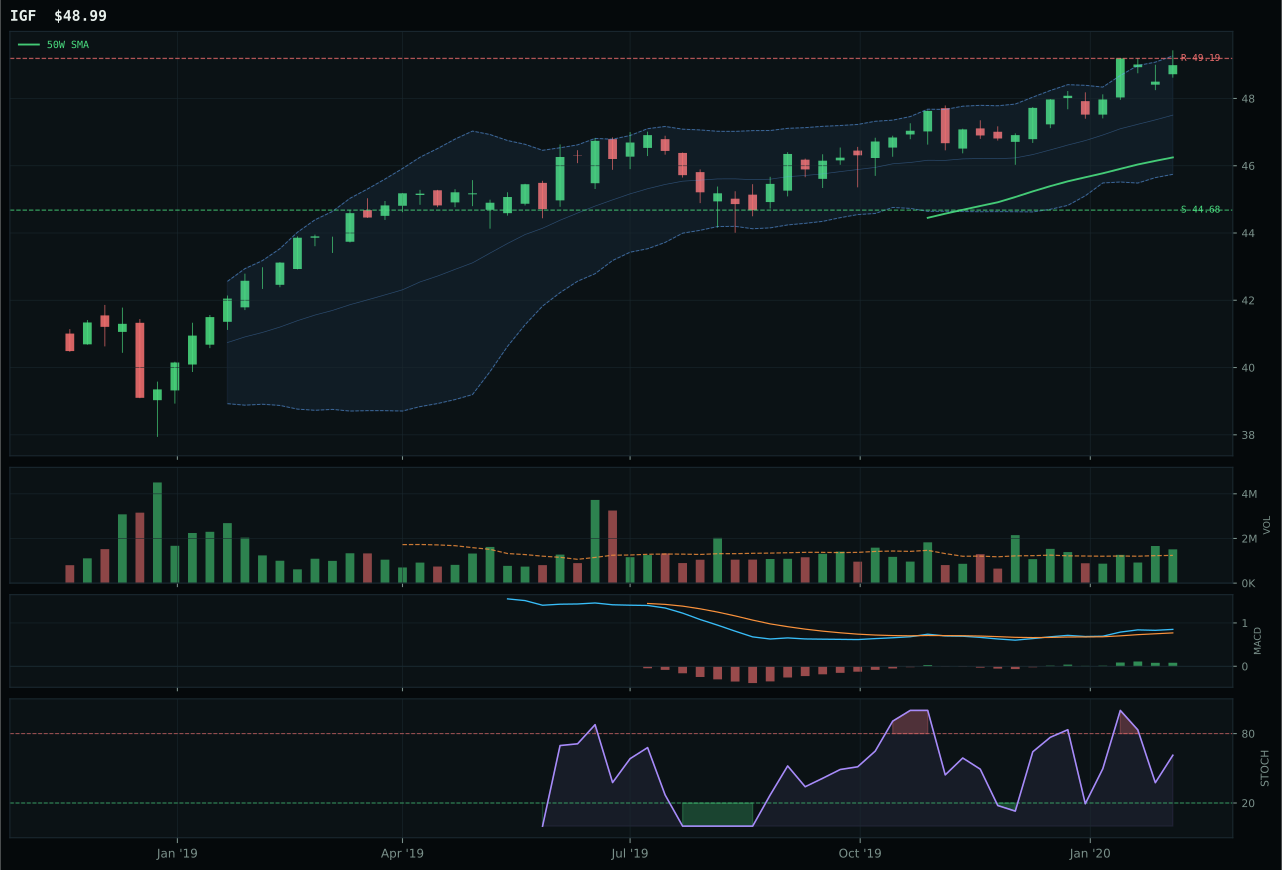
IGF has a neutral structure profile with -2.6% 13-week relative strength versus SPY.
A failed hold above support would weaken the setup.
Actionable but governed by invalidation levels.
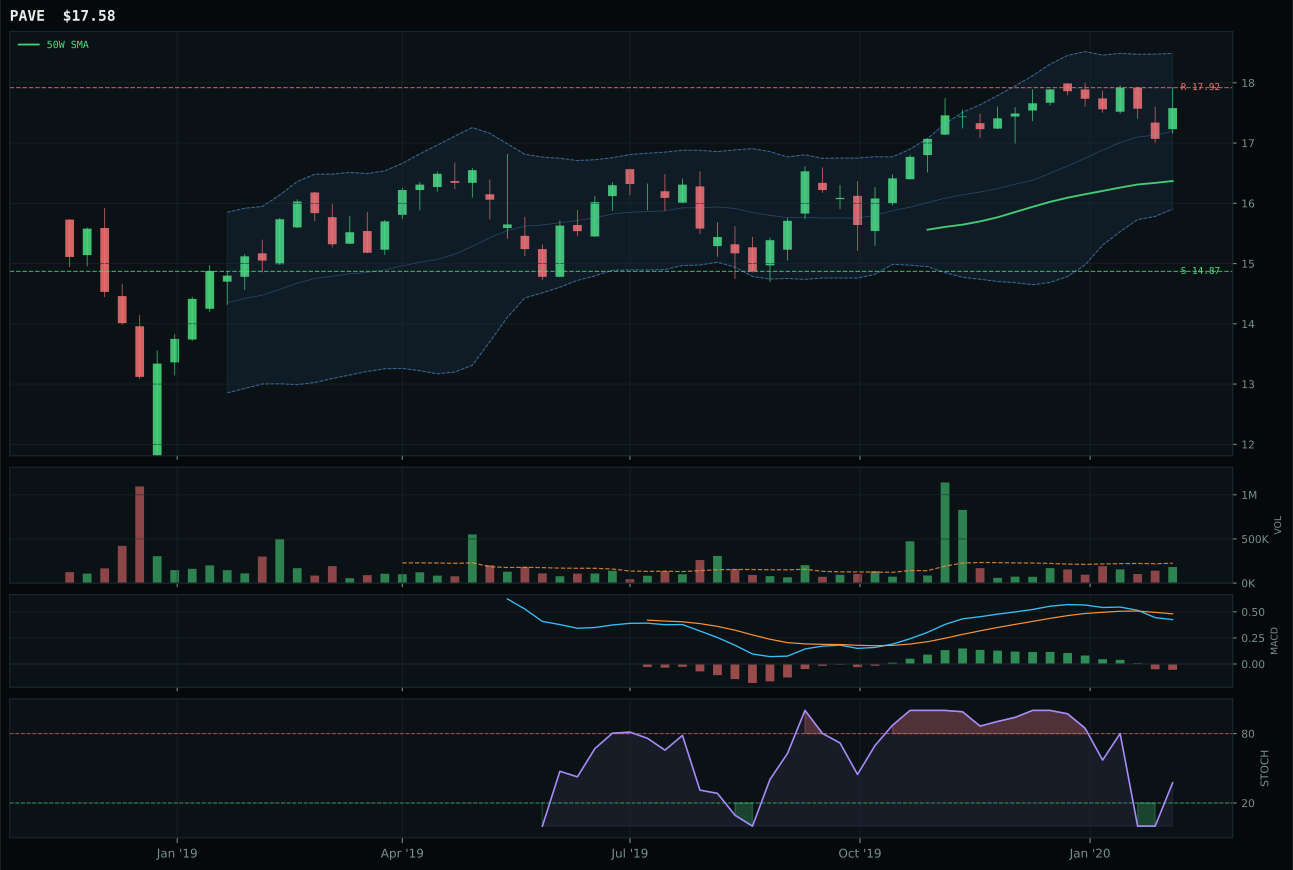
PAVE has a neutral structure profile with -6.8% 13-week relative strength versus SPY.
A failed hold above support would weaken the setup.
Tracked, but not top-2 eligible because: .
XLU wins the top-two allocation by combining perfect trend score (100.0) with genuine category-relative momentum at positive 6.1% and strong momentum confirmation at 90.9. Price above both moving averages at 11.1% distance with the 50W slope of positive 0.4% marks steady institutional accumulation, confirmed by neutral (not thin) volume at 1.04x and MACD bullish and improving. The thirteen-week return of 11.1% with positive 3.5% RS to SPY reflects that regulated utilities are winning in a Goldilocks regime where disinflation pressure favors steady cash-generating assets and defensive rotation is actively supporting the thesis. Structure at 81.2 and persistence at 74.1 confirm the move is not a bounce but a sustained institutional re-rating. IGF's superior technical evidence (79.7) is offset by its negative 2.6% RS to SPY and zero category-relative strength, revealing global infrastructure is a technical follower rather than a category leader; this matters because the macro driver (defensive rotation, disinflation) favors domestic utility stability over global asset diversity. The 2.5 point margin is tight, but the category-relative strength tiebreaker goes decisively to XLU.
Utilities & Infrastructure earned top-2 status at 10% allocation because the category scored 63.7 and ranked among the two highest final category scores, backed by strong macro fit (72.0). Defensive rotation is active at +12 and disinflation pressure at +6, creating a regime where dividend-paying, rate-sensitive equities compound quietly. Goldilocks at +4 (Transition/Mixed) adds further support without creating an overheating risk. The 3/2/1 weighted basket (IGF, XLU, PAVE) started at 67.5, and XLU's 11.1% 13W return with category-relative dominance confirmed the leadership claim. This allocation slot is earned on the basis that Utilities provides both defensive ballast and positive momentum in a market that's neither excited nor terrified—a textbook Goldilocks setup. The position should shrink only if MACD deteriorates to bearish or credit stress activates as a hard limiter.
Defense & Aerospace — ITA
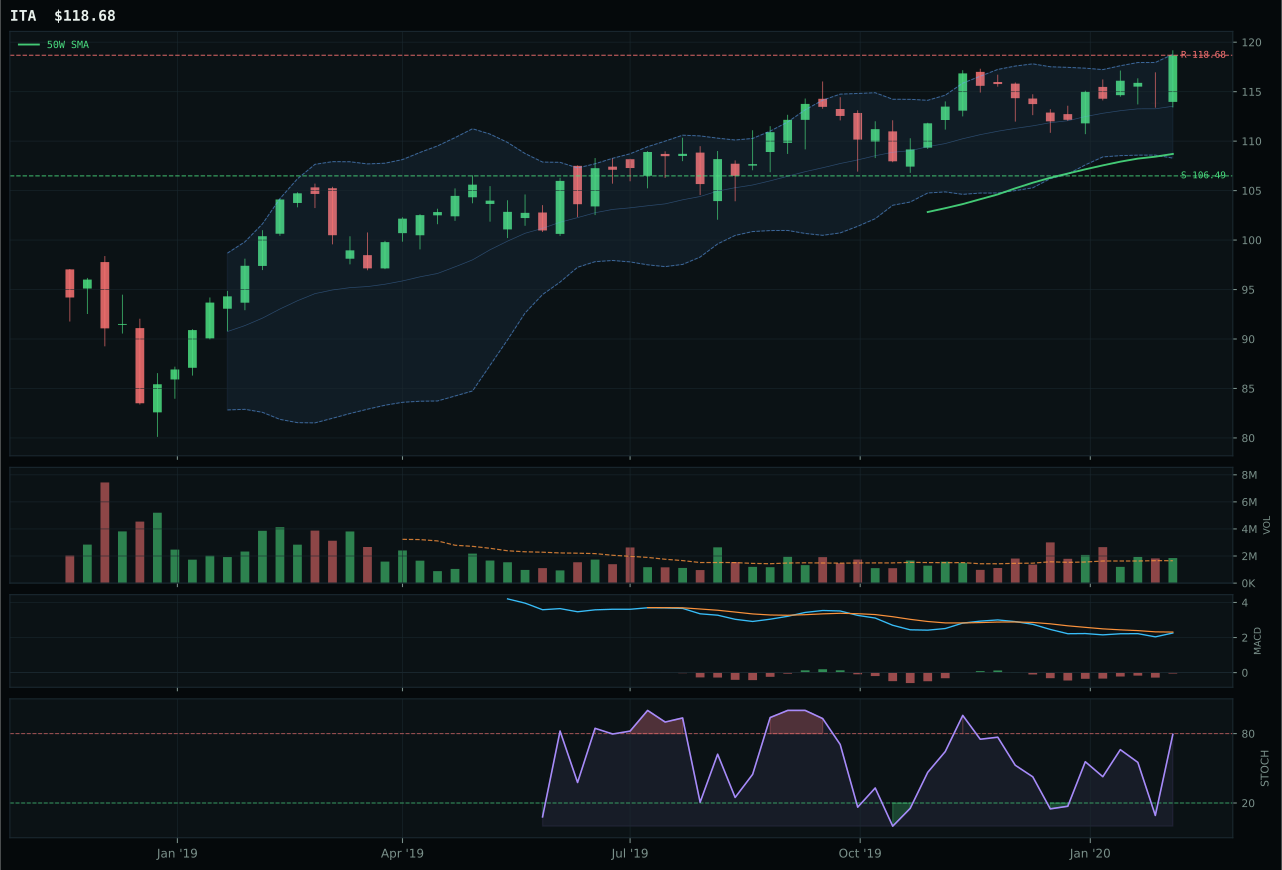
ITA has a neutral structure profile with -3.0% 13-week relative strength versus SPY.
A failed hold above support would weaken the setup.
Actionable but governed by invalidation levels.
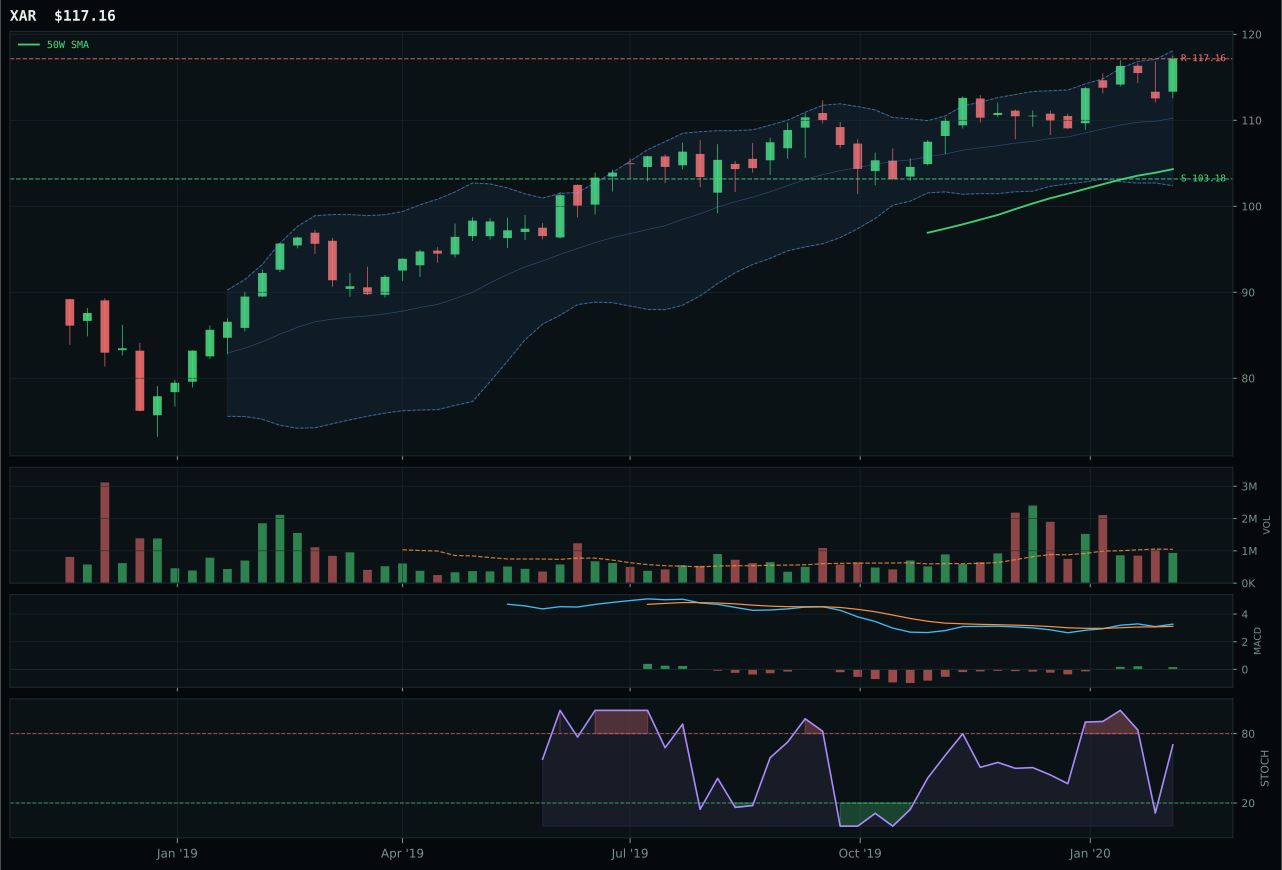
XAR has a neutral structure profile with -1.0% 13-week relative strength versus SPY.
A failed hold above support would weaken the setup.
Actionable but governed by invalidation levels.
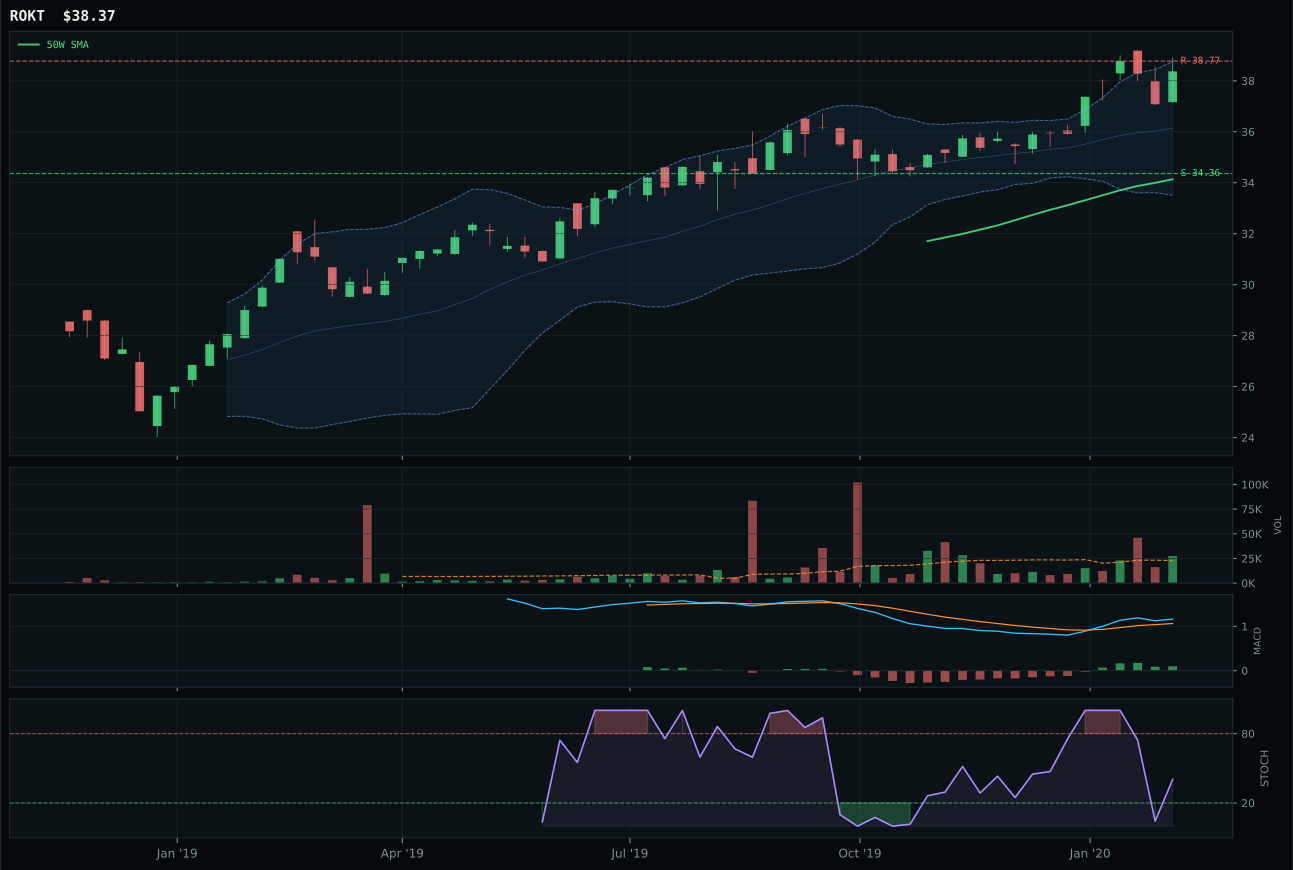
ROKT has a neutral structure profile with 1.6% 13-week relative strength versus SPY.
A failed hold above support would weaken the setup.
Tracked, but not top-2 eligible because: .
ITA wins on cleaner structure and superior timing despite a near-tie with XAR at only 0.2 points of separation. Neutral structure with 9.2% distance to the 50W puts price in the decision zone rather than extended territory, and the timing score of 75 reflects MACD bullish/improving plus overbought stochastic momentum that sits naturally near resistance—a setup that can add if buyers persist. Momentum confirmation at 69 and volume at 1.12x average participation mark accumulation rather than distribution, and the crucial factor is category-relative strength at negative 2.0% versus XAR's flat reading: ITA holds a small relative advantage despite SPY RS of negative 3.0%, meaning it is winning share within the defense complex. XAR's timing of 67 and neutral volume participation reveal a more passive structure; while the falling stochastic RSI is technically cleaner, it reflects a lack of sponsorship rather than disciplined accumulation. The 0.2 point margin is narrow, but in a consolidated sector, the tiebreaker goes to the name attracting actual new money.
Defense & Aerospace received a 5% allocation despite a 62.4 score because the category failed to crack the top-2 eligibility bar. Defensive rotation is active at +8 and helped the category land at 63.0 macro fit, but credit stress imposed a +2 (not -) penalty here—suggesting some structural resilience in defense spending. The real issue is portfolio efficiency: two higher-scoring categories (Technology at 68.0, Utilities at 63.7) already capture defensive exposure with cleaner setups. ITA's advantage here is durability, not explosive momentum. The allocation holds it in the portfolio as a conviction play on de-risking—military budgets don't contract in Goldilocks—but expansion would require either a sharper macro rotation or ITA breaking above its 118.68 resistance cleanly.
AI — SMH
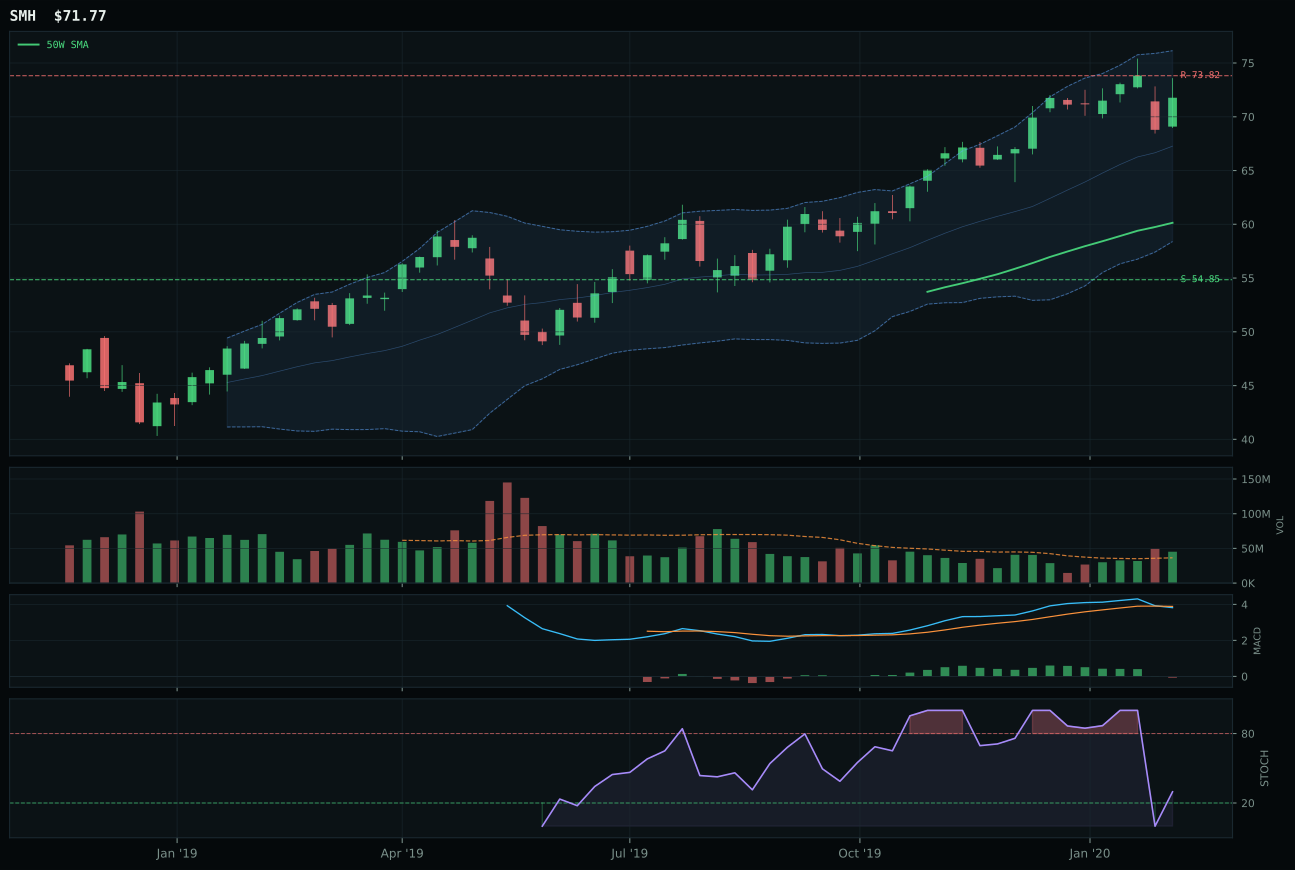
SMH has a vertical extension profile with 0.2% 13-week relative strength versus SPY.
A failed hold above support would weaken the setup.
Actionable but governed by invalidation levels.
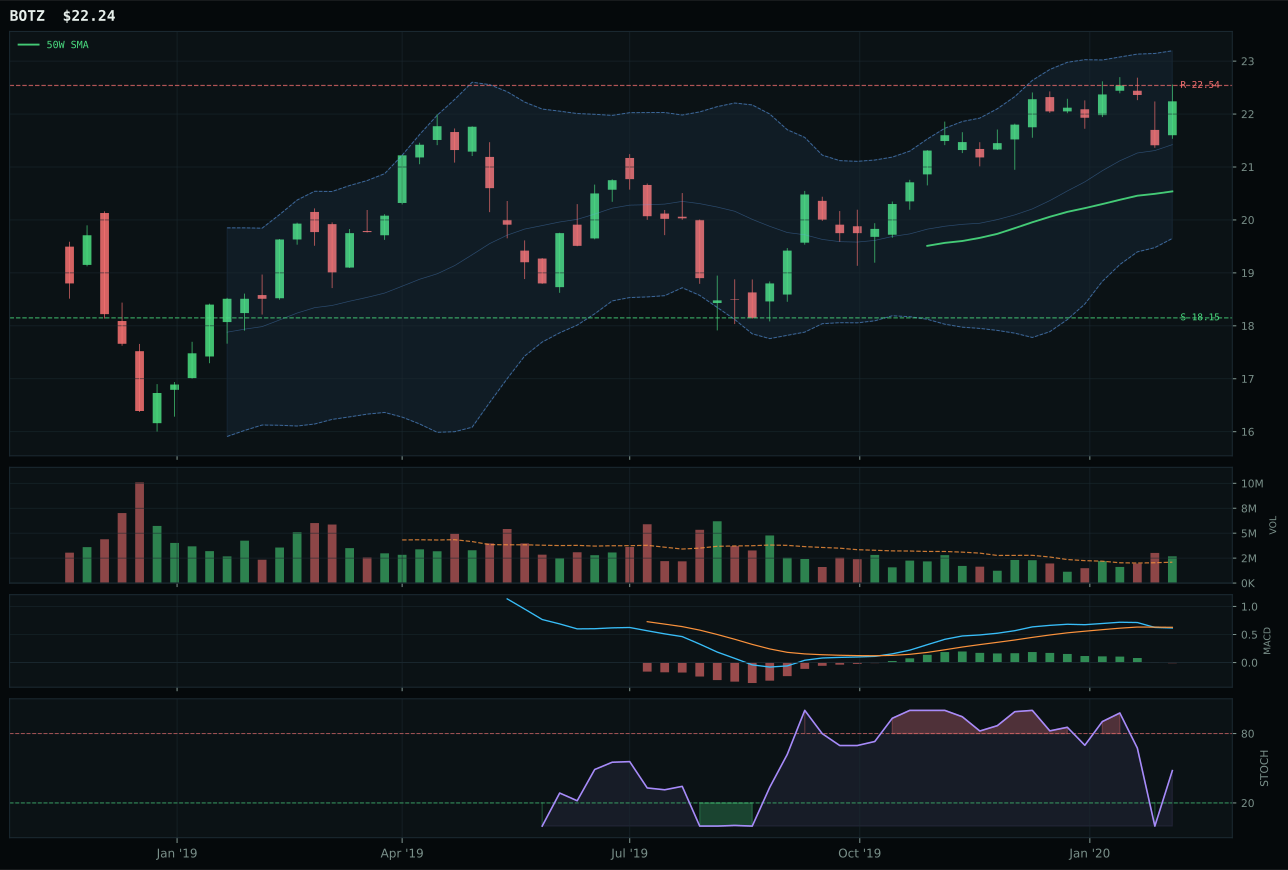
BOTZ has a neutral structure profile with -4.6% 13-week relative strength versus SPY.
A failed hold above support would weaken the setup.
Actionable but governed by invalidation levels.
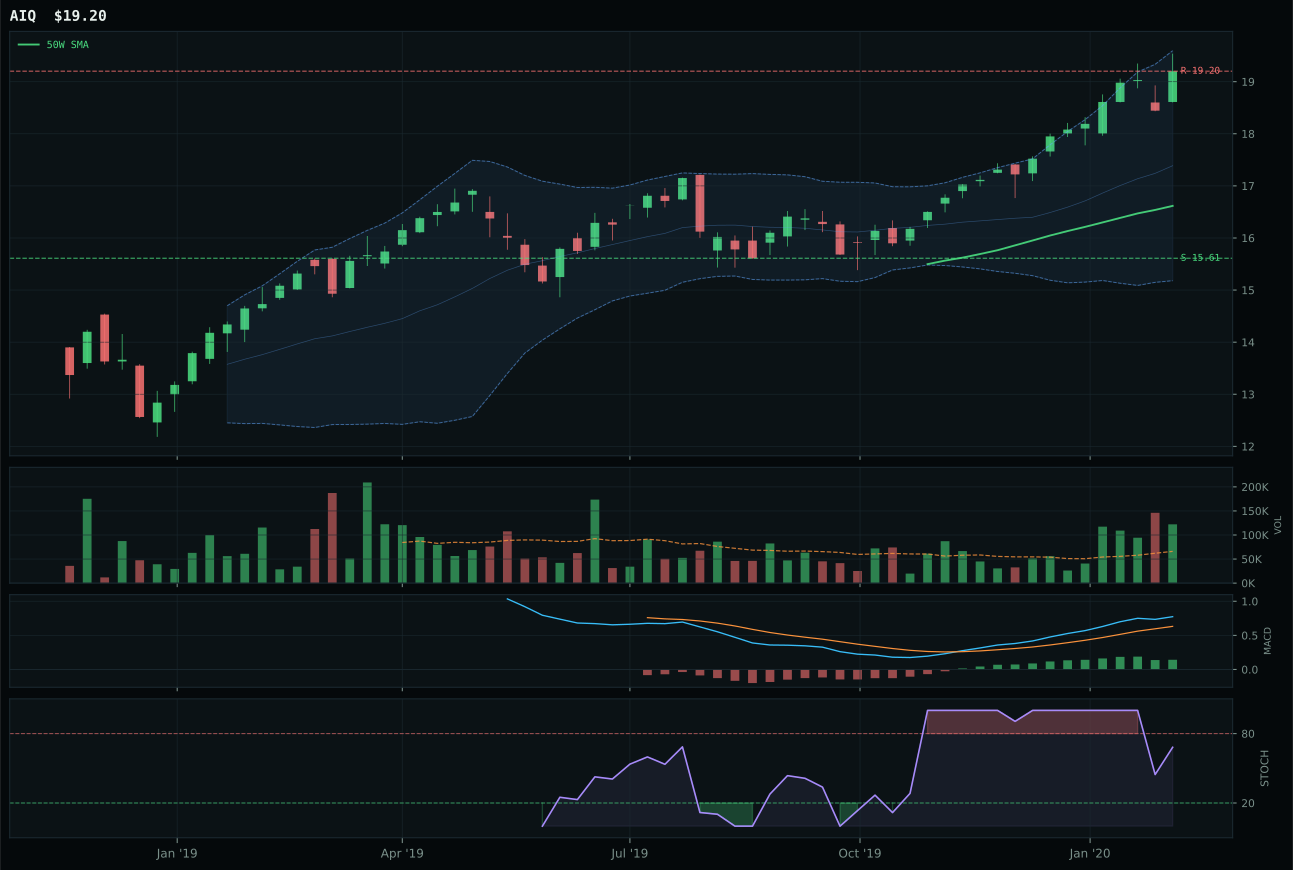
AIQ has a vertical extension profile with 6.9% 13-week relative strength versus SPY.
A failed hold above support would weaken the setup.
Tracked, but not top-2 eligible because: .
SMH wins a weak category by avoiding the structural deterioration that broke BOTZ. Price above the 50W and 200W with MACD bearish/weakening and stochastic RSI falling neutral at 0.30 creates a benign setup for a meandering position that isn't forced to defend at support. Thirteen-week return of 7.8% with RS flat to SPY (0.2%) means the semiconductor basket has generated steady gains without outrun momentum, and at 19.3% above the 50W, the risk asymmetry is beginning to penalize fresh entry. BOTZ's neutral structure setup, negative RS of 4.6% versus SPY, and weaker 38.1 risk/reward score reveal robotics exposure is losing relative traction; the flattening MACD confirms mechanical momentum peaked without corresponding volume confirmation. The scoring gap of 4.1 points is decisive in a category scoring only 47.5 overall—SMH simply decays less steeply than its alternatives.
AI earned only a 5% allocation (10% slot depth) because the category scored 47.5, placing it well outside the top-2 tier and reflecting genuine macro headwinds. Credit stress penalized the entire category at -8 points, and Goldilocks at +10 wasn't enough to offset that tension. The reasoned ETF proof order itself reveals instability: BOTZ ranked first at 52.8 on technical evidence, but the category reasoner demoted it when testing the basket against volume-price sponsorship and persistence metrics. This is a category where the macro regime is fighting against tactical opportunity; buyers should hold 5% as a volatility hedge against a late-cycle AI surprise, but expansion to 10% requires either MACD improvement in the leaders or explicit credit stress relief.
Emerging Markets — INDA
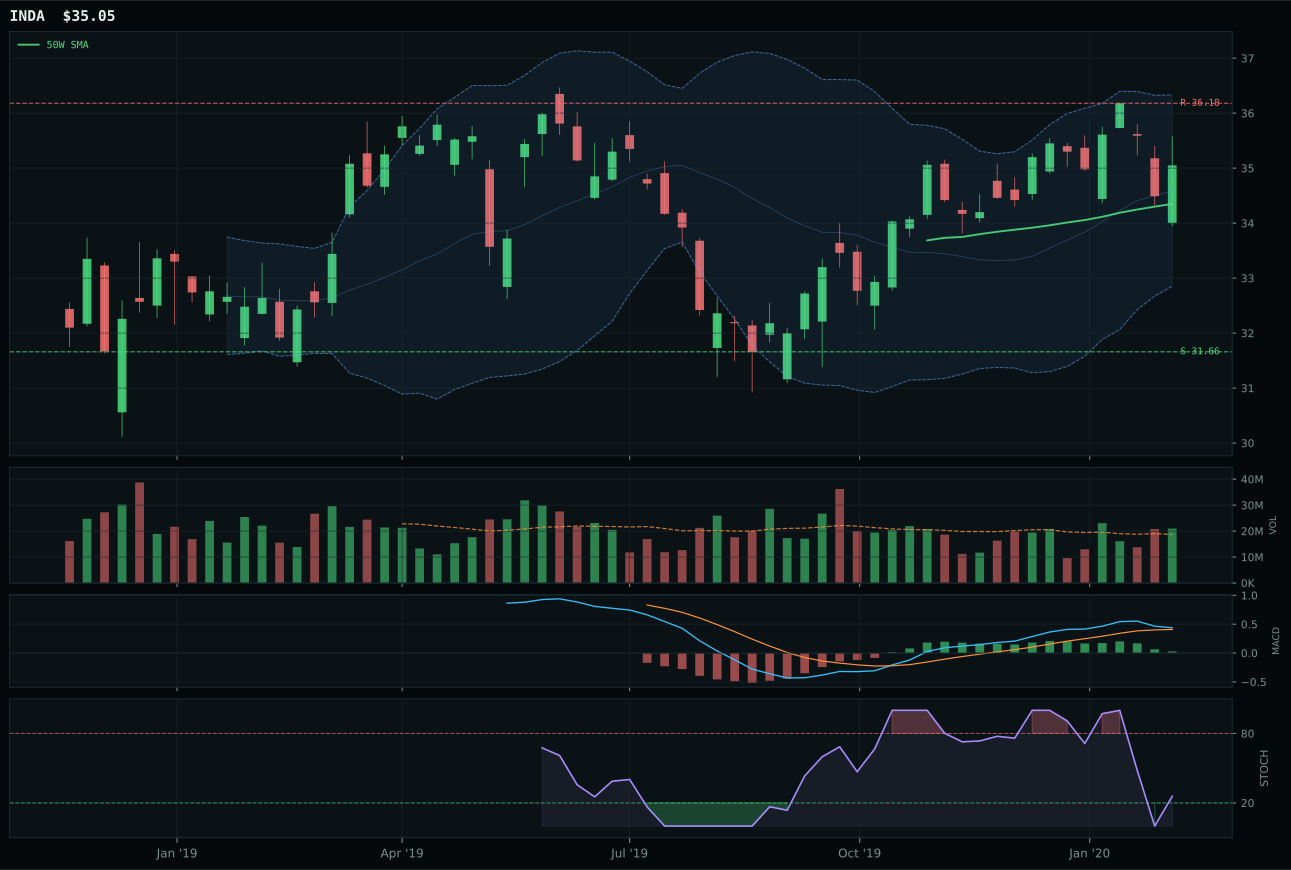
INDA has a compression near 50W profile with -5.7% 13-week relative strength versus SPY.
A failed hold above support would weaken the setup.
Actionable but governed by invalidation levels.
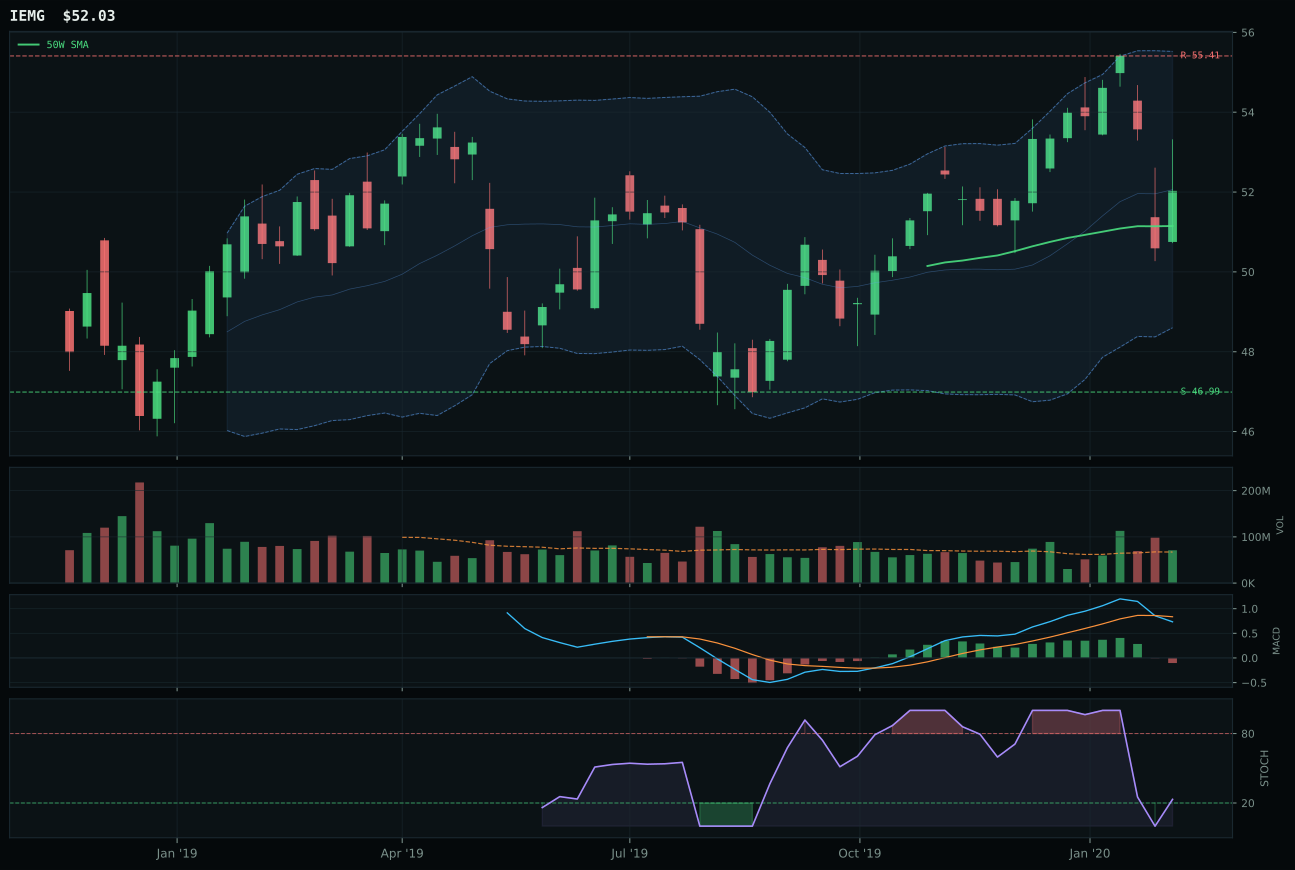
IEMG has a compression near 50W profile with -8.3% 13-week relative strength versus SPY.
A failed hold above support would weaken the setup.
Actionable but governed by invalidation levels.
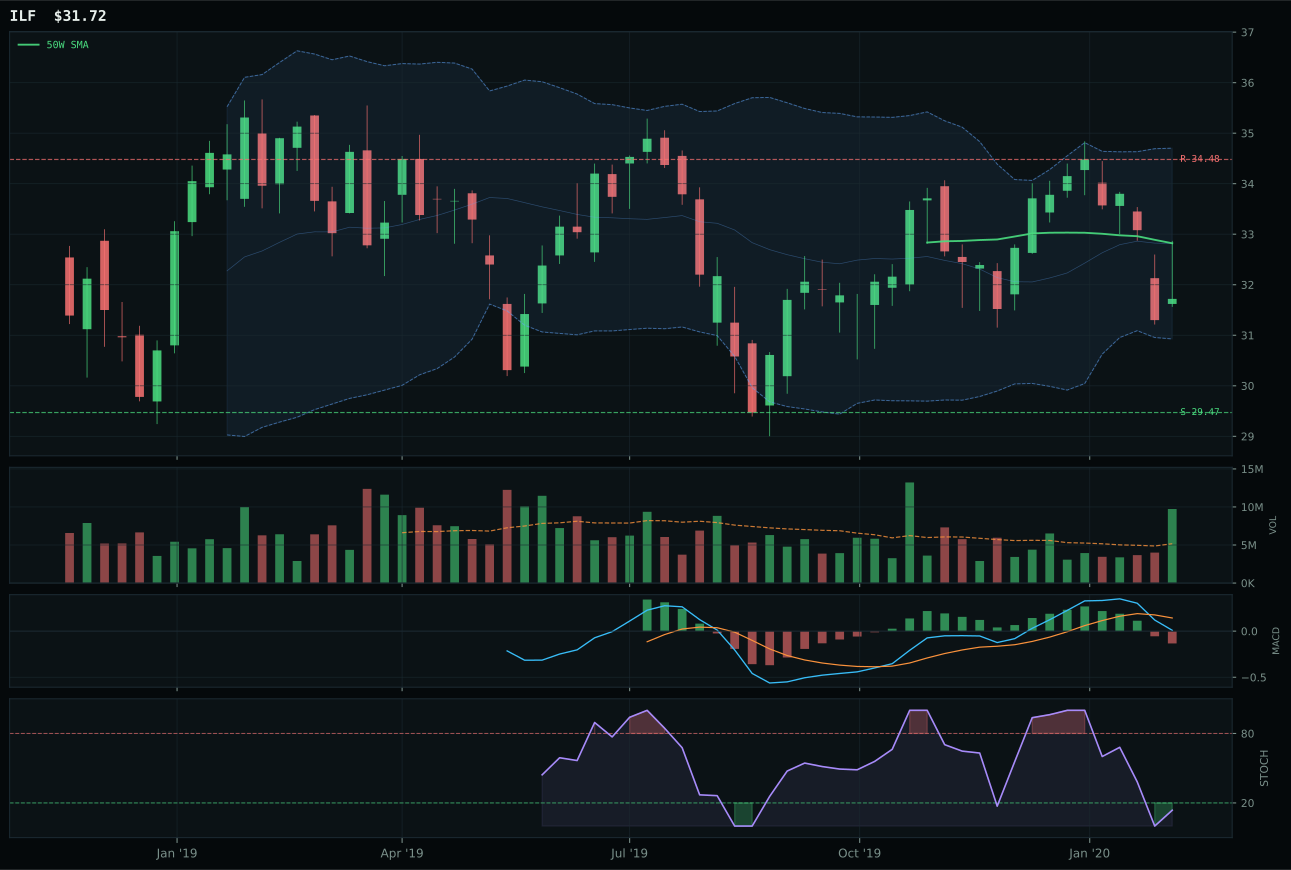
ILF has a neutral structure profile with -10.4% 13-week relative strength versus SPY.
A failed hold above support would weaken the setup.
Actionable but governed by invalidation levels.
INDA wins by showing the only compressed structure with bullish MACD sponsorship in the emerging market cohort. Price at positive 2.0% above the 50W in a compression-near-50W setup with bullish but flattening MACD marks a coil awaiting expansion; the 95.0 timing score reflects this discipline. Thirteen-week return of 1.8% with positive category-relative strength of 2.6% and above-average 1.12x volume participation confirm that accumulation is occurring within the EM basket specifically around India quality growth. IEMG's superior 100 timing score is a mirage created by its distance to the 50W, but the bearish/weakening MACD and neutral volume reveal it is a technical breakout on declining sponsorship; the broad EM beta is extending without accumulation, a classic late-stage momentum setup. The 9.5 point gap between INDA and IEMG reflects the fundamental difference between a name that is coiling (INDA) versus one that is extending (IEMG). In a Goldilocks regime with EM liquidity support active, the coil offers better risk/reward than the extension.
Emerging Markets earned a 5% allocation because the category scored 42.8, placing it in the middle-tier pack alongside Precious Metals and Utilities. EM liquidity support is active at +14, providing powerful macro tailwind, but credit stress at -10 and Goldilocks at +8 create a mixed picture: emerging markets are supported by carry-trade flows but vulnerable to a sudden risk-off that tightens credit. INDA's technical advantage (70.4/100 evidence) is meaningful here—it's the only peer offering both compression near the 50W and bullish-but-controlled MACD. The allocation should expand to 10% if INDA breaks above 36.18 resistance on volume, confirming that institutional buyers are committing through technical breakout rather than narrative-driven rotation. Until then, 5% is the correct size for a category with supportive macro but unclear technical leadership.
Precious Metals — GLD
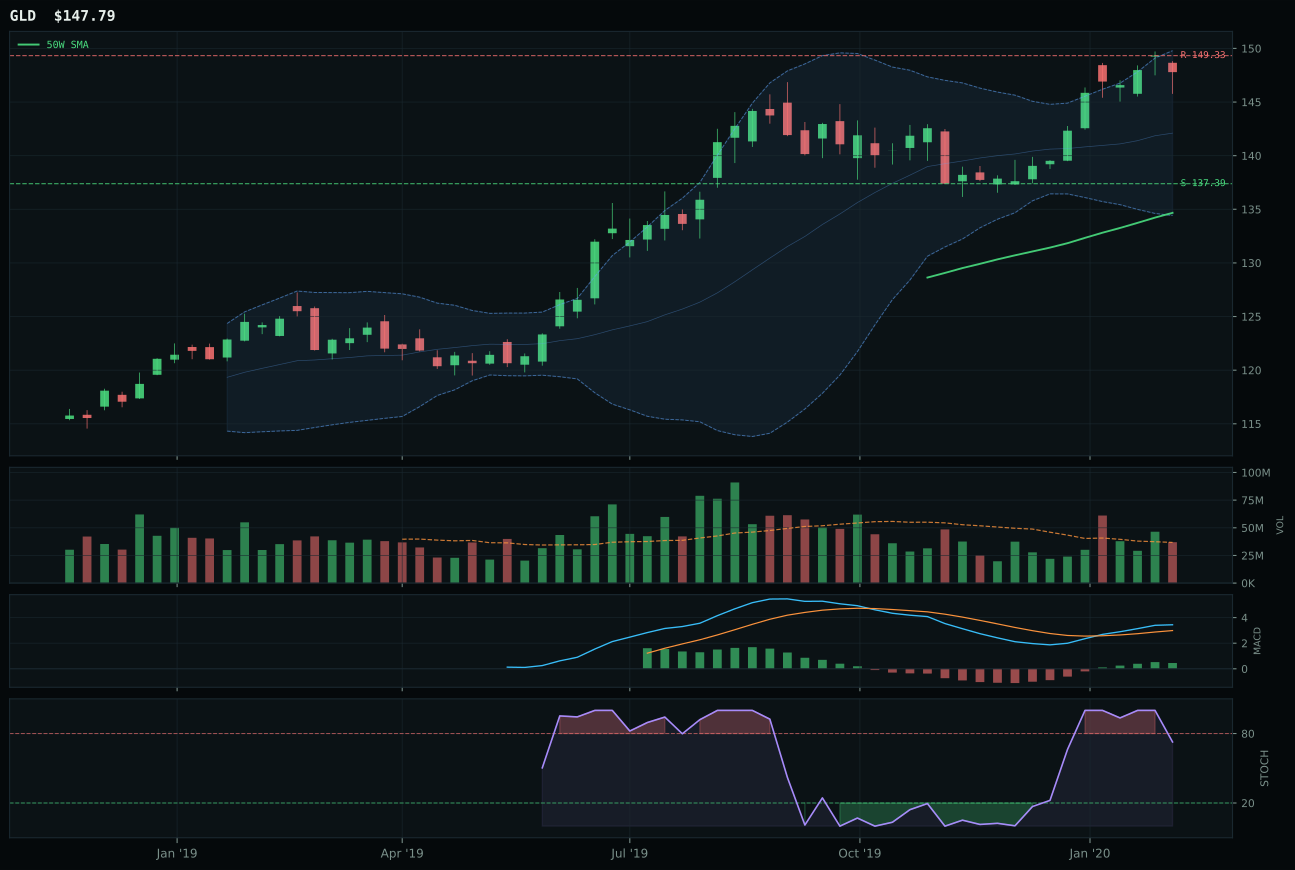
GLD has a neutral structure profile with 0.0% 13-week relative strength versus SPY.
A failed hold above support would weaken the setup.
Actionable but governed by invalidation levels.
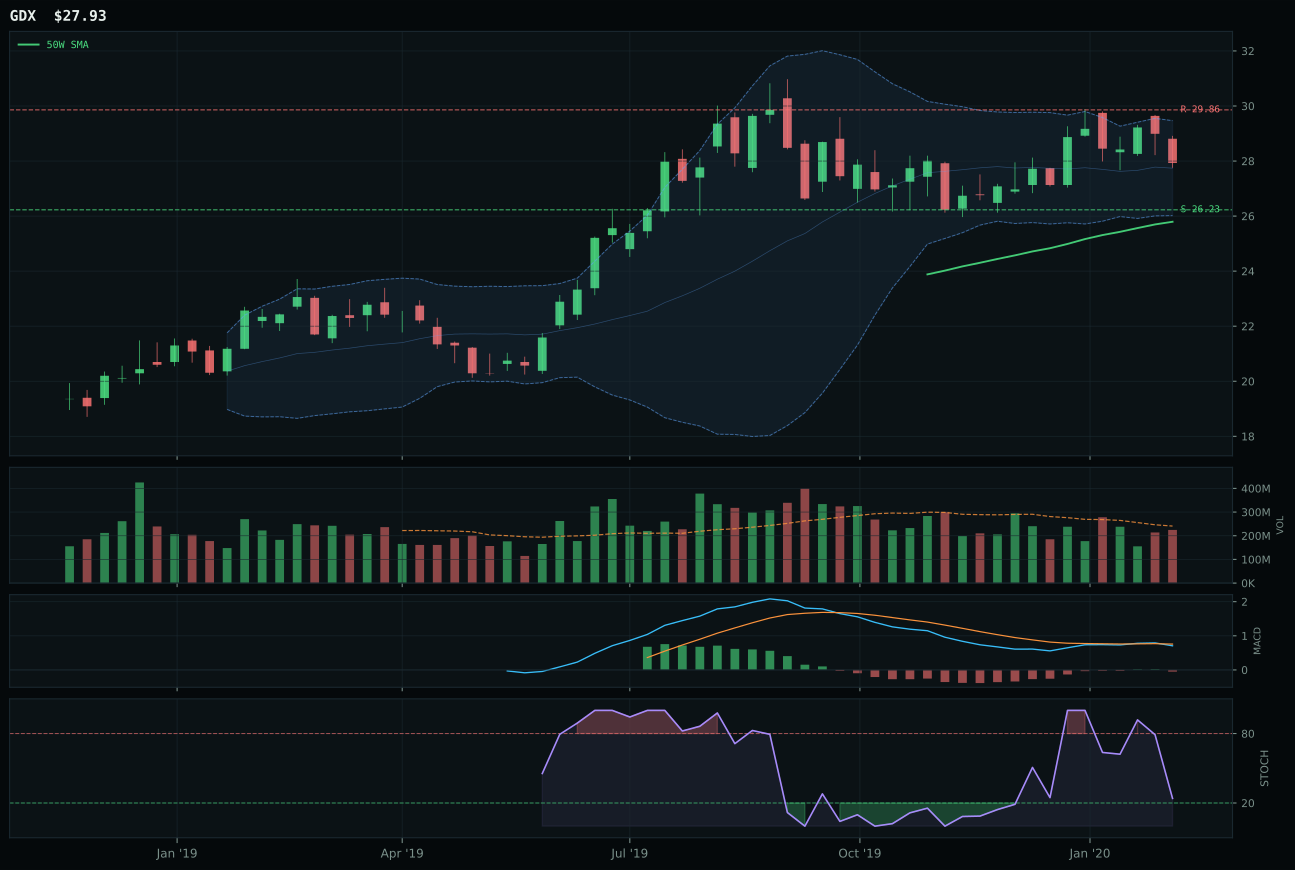
GDX has a neutral structure profile with -1.0% 13-week relative strength versus SPY.
A failed hold above support would weaken the setup.
Actionable but governed by invalidation levels.
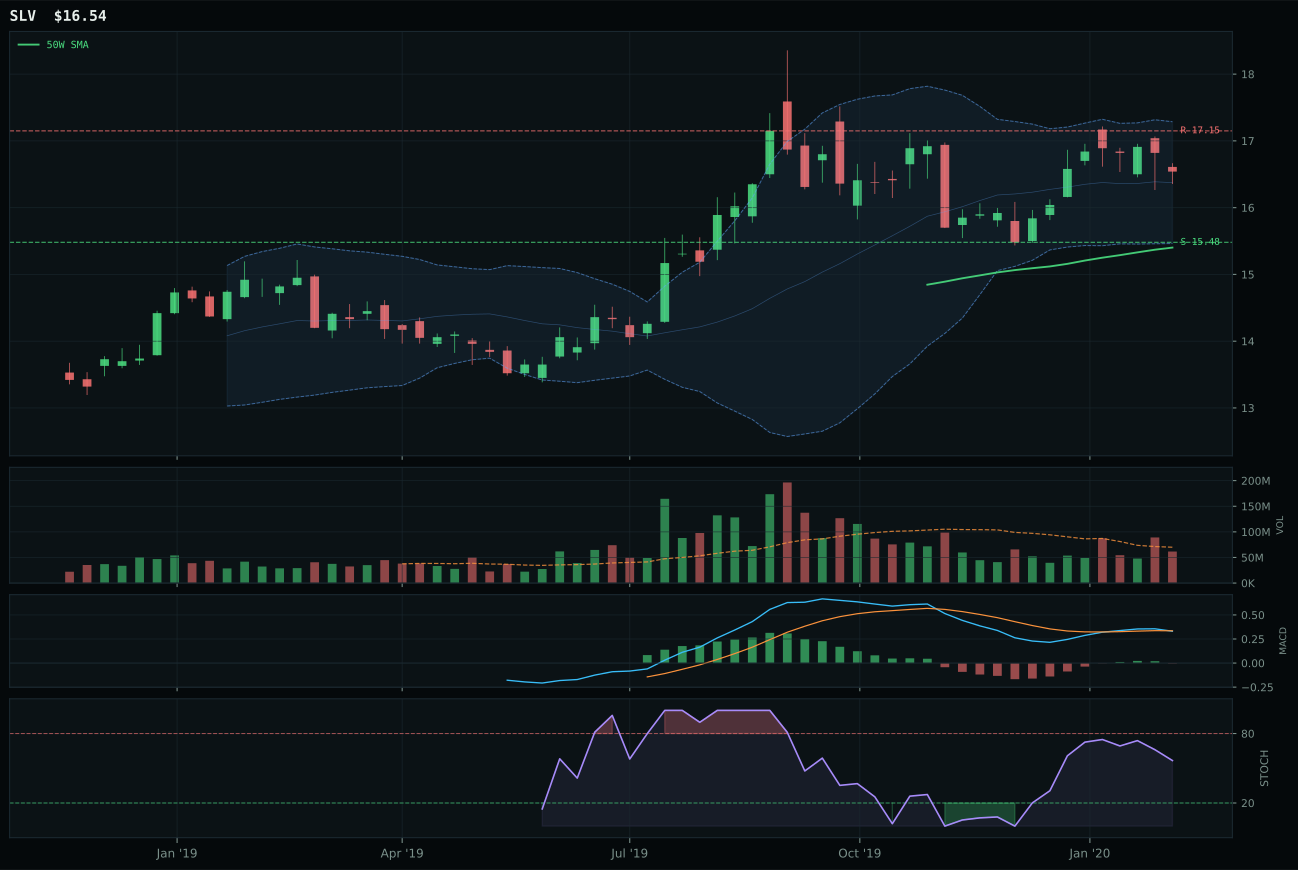
SLV has a neutral structure profile with -2.2% 13-week relative strength versus SPY.
A failed hold above support would weaken the setup.
Actionable but governed by invalidation levels.
GLD wins on superior MACD confirmation and category-relative strength despite both names carrying extended valuations. Gold is 9.7% above the 50W with bullish and improving MACD plus falling neutral stochastic RSI at 0.73, marking a textbook extended trend with discipline at the momentum level; the 1.1% category-relative edge over GDX confirms GLD is winning the accumulation race inside the precious metals complex. Thirteen-week return of 7.6% with neutral volume participation indicates the move has been sustained without panic or exhaustion, and the perfect 100 trend score anchors the setup. GDX's negative MACD picture (bearish/weakening) combined with negative 1.0% RS to SPY exposes miners as a deteriorating leverage play on gold; the 10.2 point scoring gap reflects the chemical difference between momentum in the base asset versus momentum in the leveraged derivative. In a disinflation-plus-defensive-rotation regime, pure gold outperforms gold leverage because buyers are hedging duration risk rather than betting on inflation breakout.
Precious Metals earned only a 5% allocation because the category scored 42.5, placing it firmly in mid-tier with limited growth runway. Disinflation pressure at +6 and defensive rotation at +7 created a 63.0 macro fit, helping the category stay off the bench, but the technical evidence (77.3/100 for GLD) isn't strong enough to justify more capital in a crowded portfolio. The setup is valid—Goldilocks with safe-haven hedges—but it's a hedge position, not a return source. Expansion to 10% would require either GLD to break above 149.33 resistance cleanly (indicating a shift from tactical hedging to strategic allocation) or a sharp deterioration in credit markets that makes defensive rotation turn into panic rotation.
Nuclear Energy — NLR
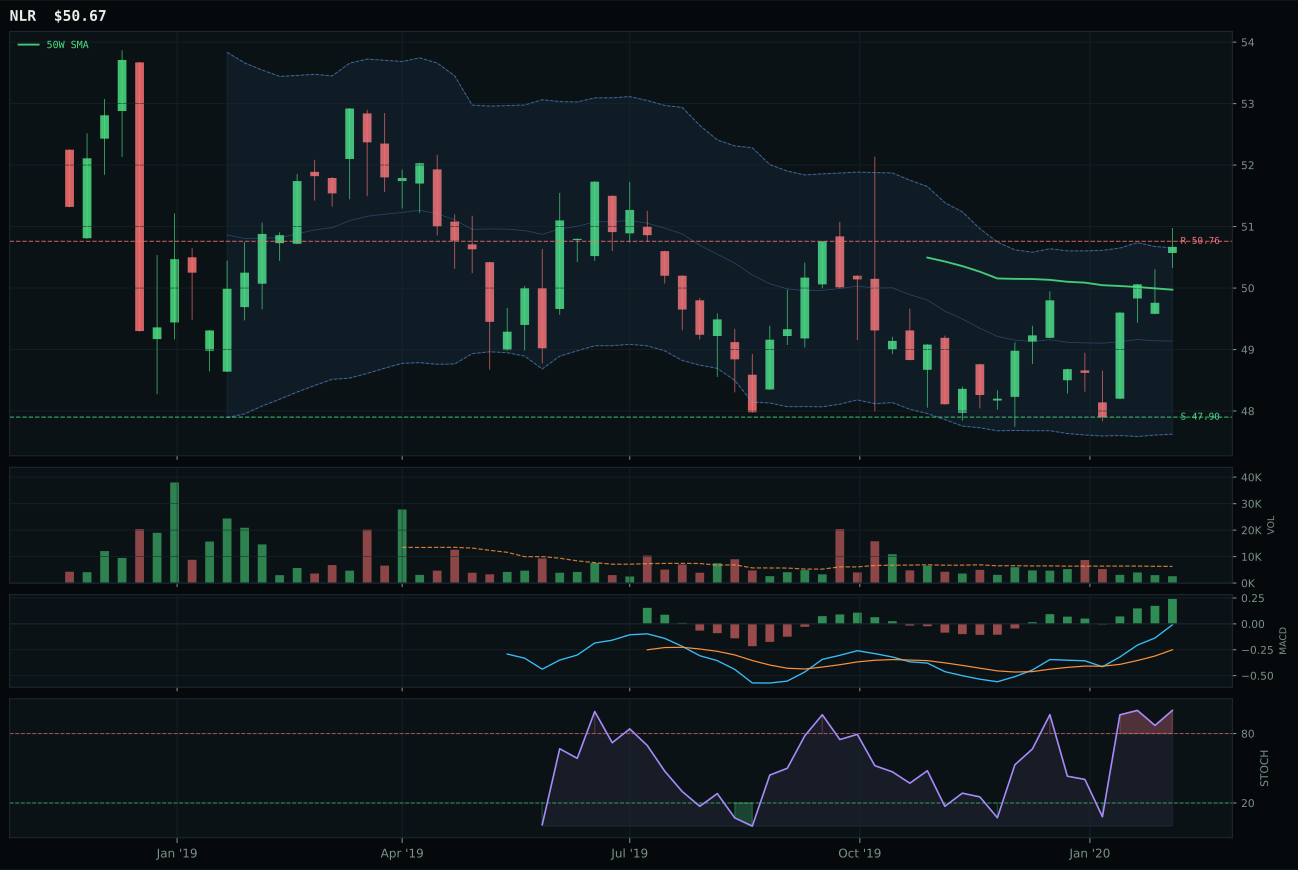
NLR has a compression near 50W profile with -2.2% 13-week relative strength versus SPY.
A failed hold above support would weaken the setup.
Tracked, but not top-2 eligible because: .
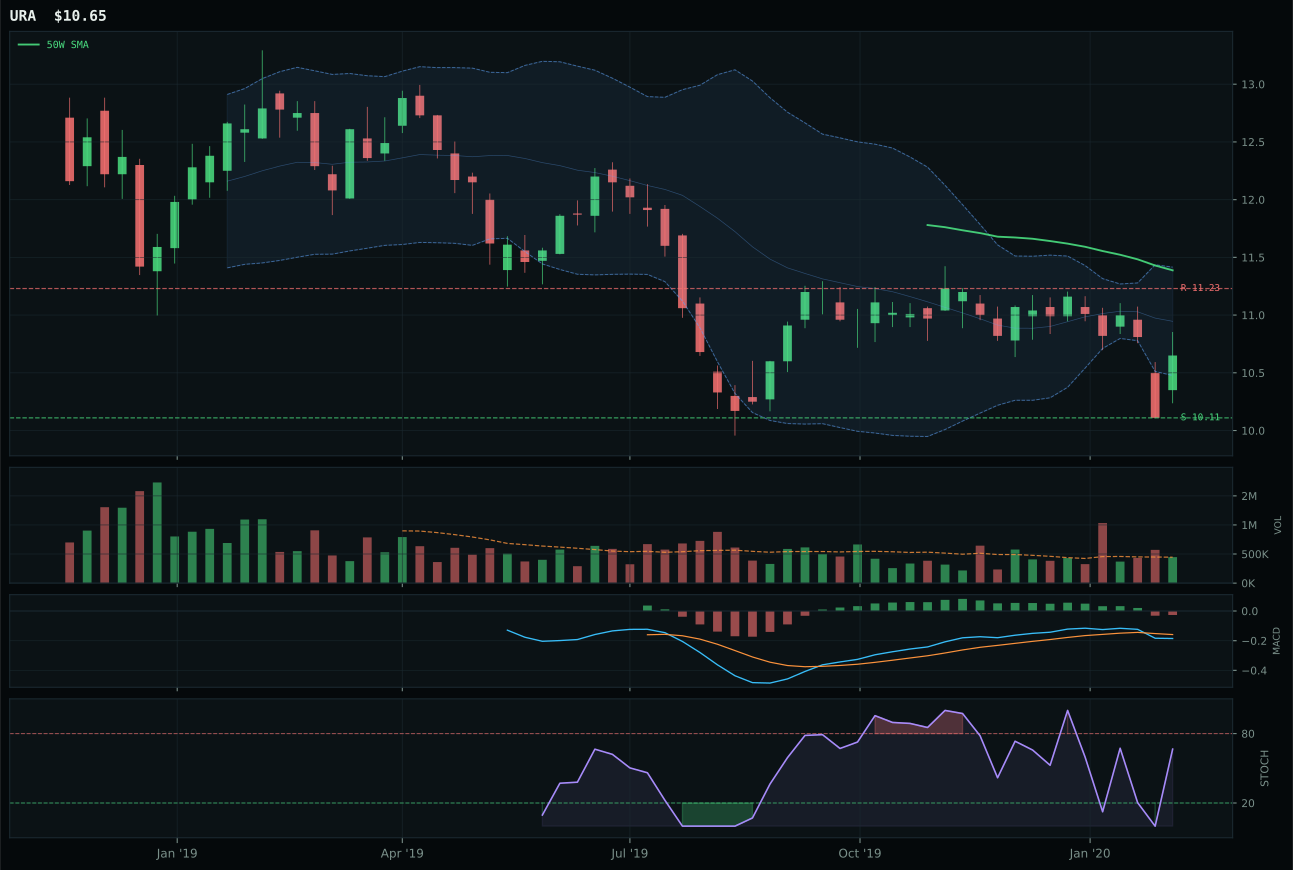
URA has a neutral structure profile with -12.7% 13-week relative strength versus SPY.
Extension and support failure are the main tactical risks.
Tracked, but not top-2 eligible because: structurally broken.
NLR wins a damaged category by showing the only sign of fresh sponsorship despite weak absolute momentum. Price above both moving averages but compressed at only 1.4% above the 50W creates a coil setup where tight range activity marks preparation for expansion rather than exhaustion. The timing score of 100.0—driven by proximity to the 50W, bullish and improving MACD, and overbought stochastic at 1.00—reveals this is the cleanest technical setup in the energy complex, a name where buyers are defending a level rather than capitulating. Category-relative strength at positive 5.2% and thirteen-week return of 5.3% confirm NLR is the only name in the energy cohort actually attracting accumulation. URA's catastrophic trend score of 12.0, zero technical evidence, and negative 12.7% RS to SPY mark it as structurally broken; the 63 point gap between NLR and URA is the largest in the entire portfolio, indicating complete separation between what's working and what's dead. NLR's thin participation at 0.41x volume is a caution flag, but it reflects the small float and specialist dynamics of nuclear utilities rather than lack of sponsorship.
Nuclear Energy received only a 5% allocation because the category scored 18.2 and failed hard-filter eligibility; URA's structural breakdown disqualified the entire category from top-2 consideration. Defensive rotation is active at +6, helping the category stay off the bench, but credit stress imposed a -5 penalty, and the technical evidence (45.0/100 for NLR) is weak relative to portfolio peers. This is a conviction position on energy security and climate policy tailwinds, not technical strength. NLR's placement reflects a belief that the macro narrative (clean energy in Goldilocks) will eventually drive technical confirmation, but current volume (thin) and 13W return (5.3%) offer no evidence that institutional capital is committing yet. The allocation should shrink if NLR fails to hold 47.90 or expand if it breaks above 50.76 on volume—until then, it's a lottery ticket, not a core holding.
Traditional Energy — XLE
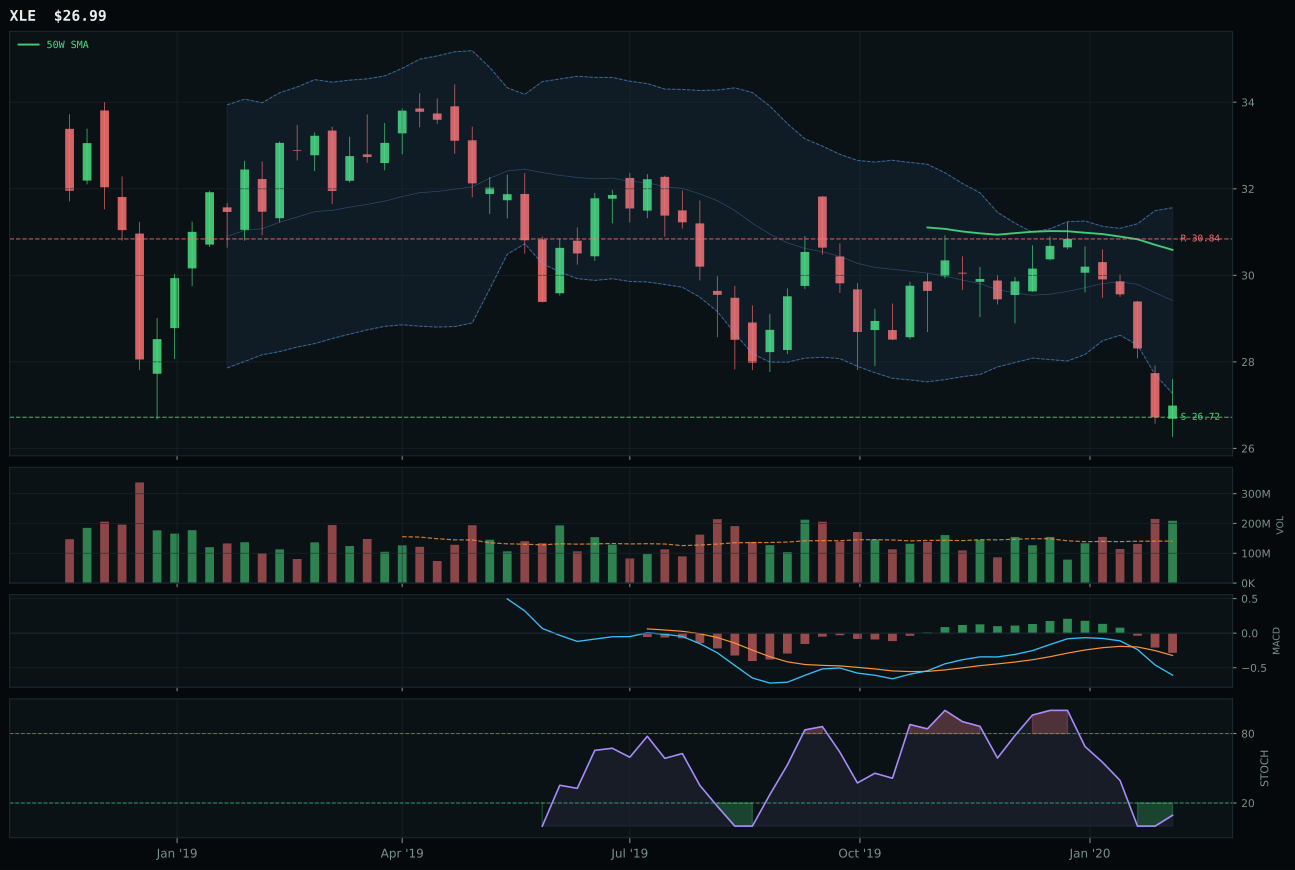
XLE has a pullback into support profile with -18.6% 13-week relative strength versus SPY.
Extension and support failure are the main tactical risks.
Tracked, but not top-2 eligible because: structurally broken.
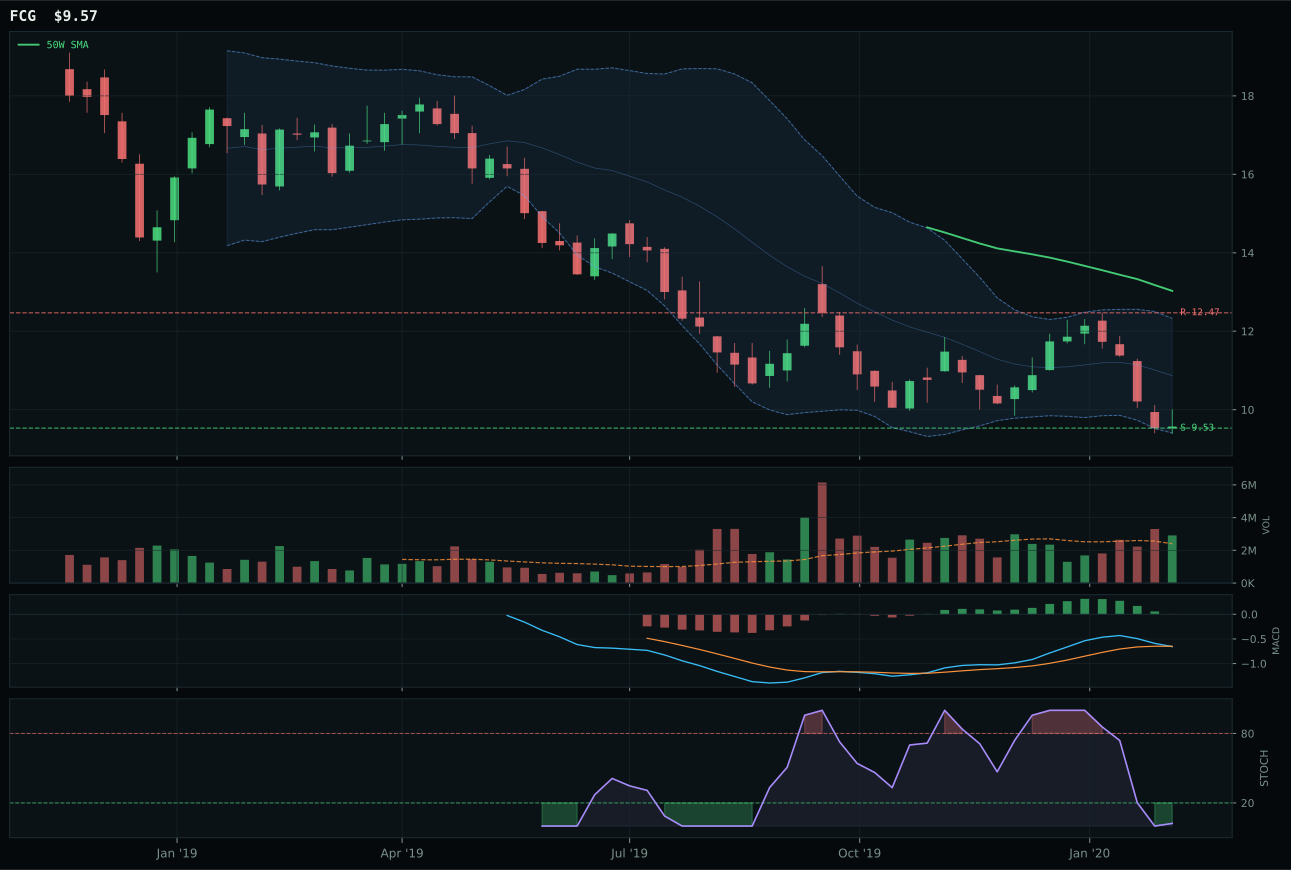
FCG has a pullback into support profile with -24.2% 13-week relative strength versus SPY.
Extension and support failure are the main tactical risks.
Tracked, but not top-2 eligible because: structurally broken.
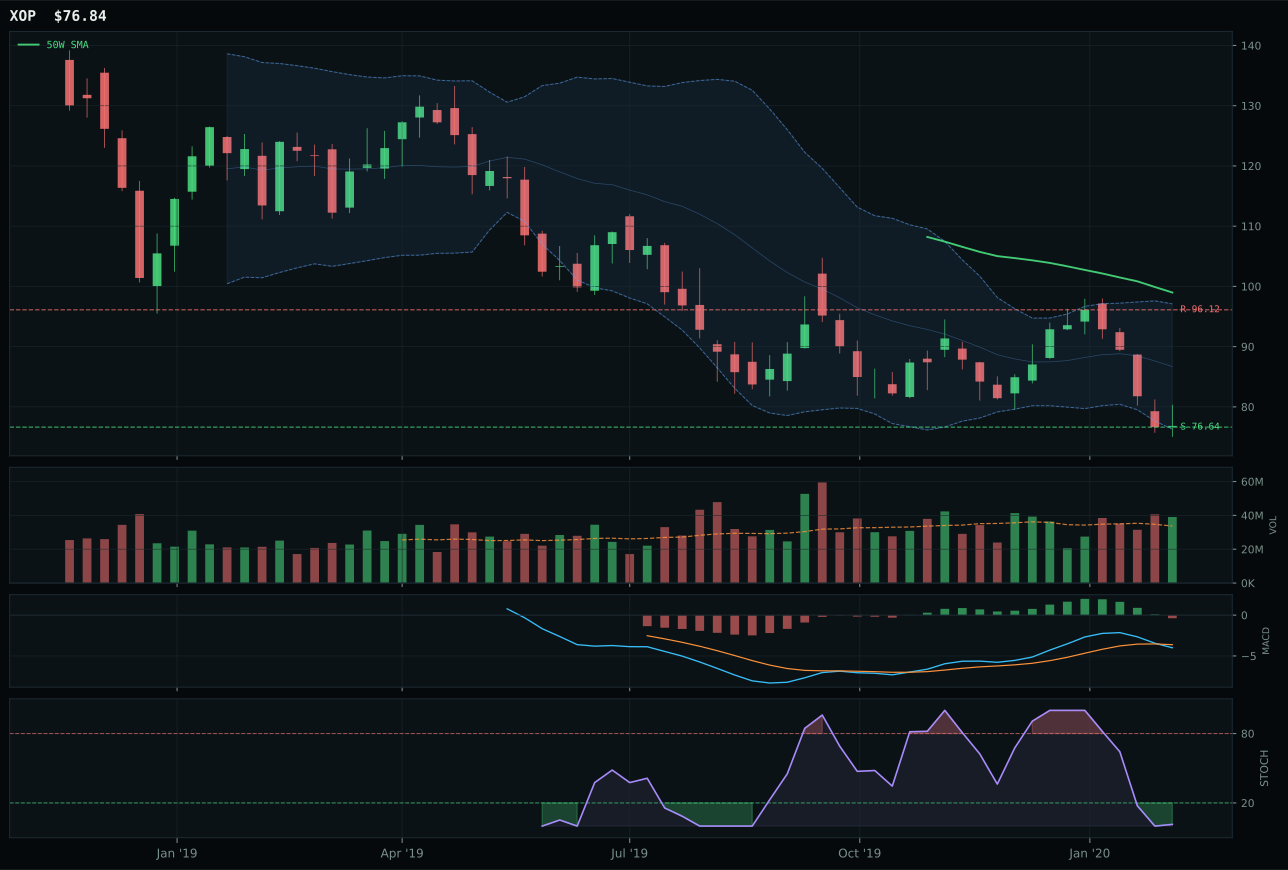
XOP has a pullback into support profile with -23.4% 13-week relative strength versus SPY.
Extension and support failure are the main tactical risks.
Tracked, but not top-2 eligible because: structurally broken.
XLE wins by virtue of being the sole remaining name with measurable volume participation in a category characterized by systemic abandonment. Price at negative 11.8% from the 50W in deep repair zone (Fib 0.786) with MACD bearish/weakening and oversold stochastic at 0.09 reflects capitulation, but XLE's 1.49x volume participation marks actual liquidation rather than passive decay. The risk/reward score of 90.0 is a double-edged metric: negative 12.5% to resistance and only positive 1.0% to support means the asymmetry favors shorting, yet the active volume at support suggests capitulation may be near. Thirteen-week return of negative 11.1% with negative 18.6% RS to SPY confirms energy is in structural bear market, and MACD shows no signs of reversal. FCG's weaker risk/reward (75.0) and inferior RS of negative 24.2% reveal natural gas is collapsing faster than integrated oil; the 1.8 point margin between XLE and FCG is immaterial because both are insolvent from a momentum perspective.
Traditional Energy earned only a 5% allocation because the category scored 0.0 and failed hard-filter eligibility—this is a distressed category fighting both disinflation pressure at -10 and credit stress at -7. XLE's allocation exists purely as a tail-risk hedge against a geopolitical shock that jams global supply, not as a conviction position. The reasoned ETF proof order (XLE 23.0, XOP 20.2, FCG 19.3) shows how thin the margin is; all three sit in single digits relative to baseline. A 5% position captures any capitulation reversal if support at 26.72 holds and volume sustains, but scaling to 10% requires explicit evidence that credit stress is abating or that a military conflict is triggering an energy premium. Until then, this is emergency optionality, not alpha.
Industrial Metals — PICK
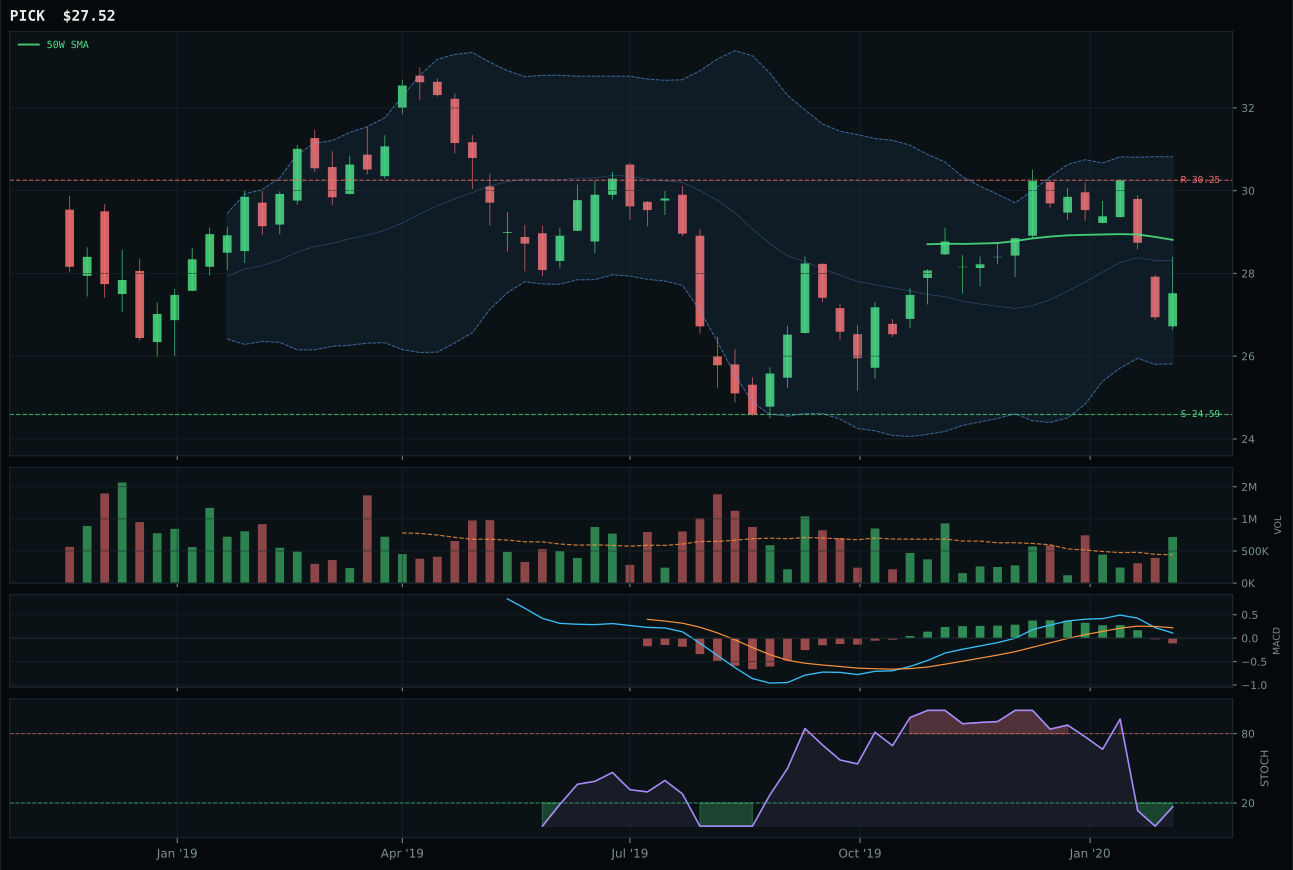
PICK has a neutral structure profile with -11.9% 13-week relative strength versus SPY.
Extension and support failure are the main tactical risks.
Tracked, but not top-2 eligible because: structurally broken.
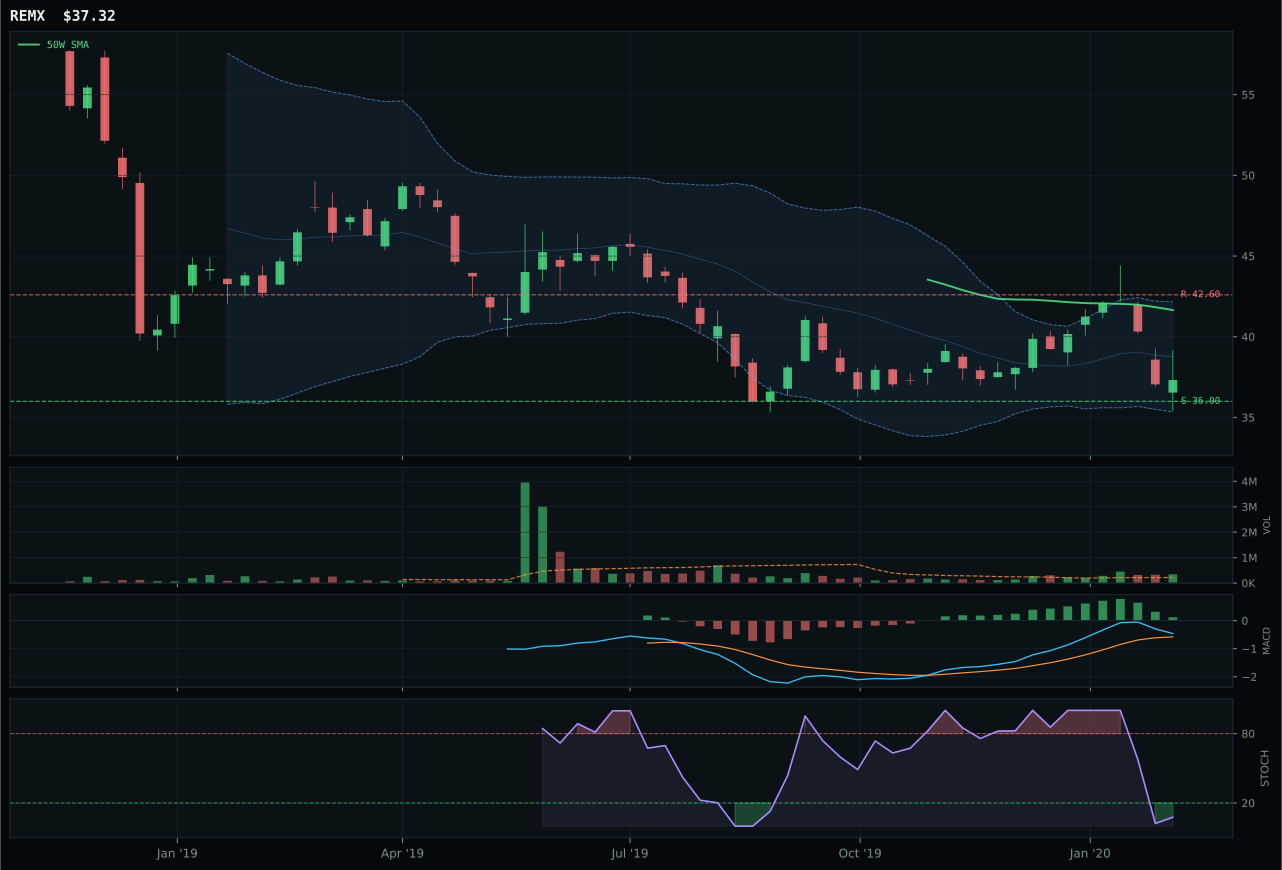
REMX has a pullback into support profile with -12.1% 13-week relative strength versus SPY.
Extension and support failure are the main tactical risks.
Tracked, but not top-2 eligible because: structurally broken.
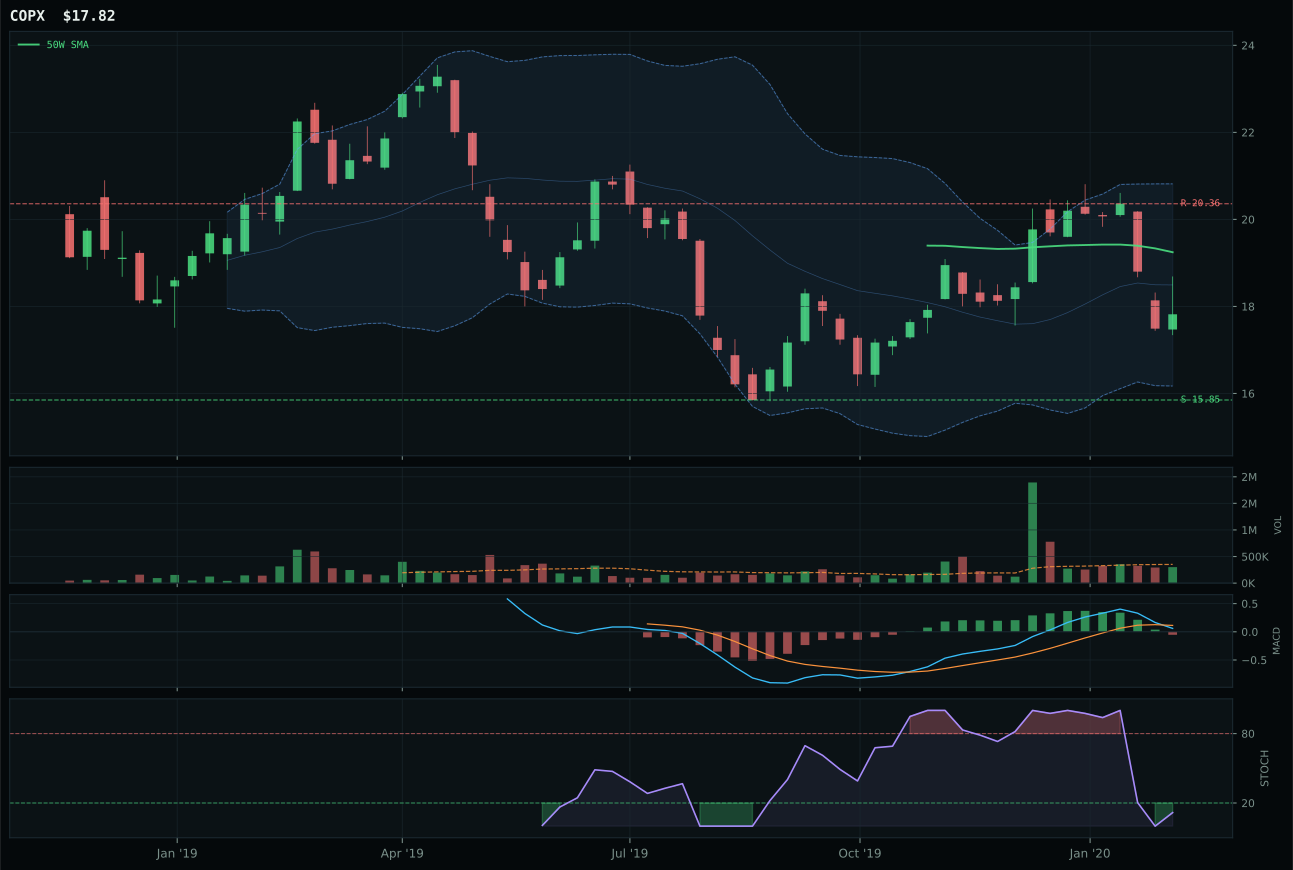
COPX has a neutral structure profile with -13.5% 13-week relative strength versus SPY.
Extension and support failure are the main tactical risks.
Tracked, but not top-2 eligible because: structurally broken.
PICK wins a non-allocated category by representing the least broken setup in a structurally collapsed complex. Price below the 50W and 200W by 4.5% with oversold stochastic at 0.17 creates the deepest value zone in the database (Fib 0.618), and MACD bearish/weakening confirms the move lacks support. What separates PICK from REMX is timing: at 85.0, PICK's proximity to support (negative 4.5% from 50W) offers the best defined invalidation point if buyers don't show; REMX's 60 timing score reflects its pullback-into-support setup, which sounds similar but carries less conviction because the stochastic and MACD are less decisive. Thirteen-week return of negative 4.3% versus REMX's negative 4.6% confirms the performance is statistically identical, but PICK's 1.62x volume participation (accumulation/confirmation) marginally exceeds REMX, signaling that at least some buyers are defending the current level. The 3.1 point gap is tiny because both setups are technically insolvent.
Industrial Metals earned zero allocation and is structurally ineligible (eligible: False) because the category failed hard-filter tests—both winners and runners-up are broken below their 200W with SPY relative weakness exceeding -11%, which in a Goldilocks regime signals complete relative underperformance. Credit stress at -7 is actively penalizing this space, and the category macro fit of 49.0 is barely above neutral. PICK's 22.0 trend score is disqualifying: there is no upside thesis here, only a hope that oversold stochastic reversals into value. The 3/2/1 weighted basket started at 34.6 and collapsed to 13.4 after the category reasoner tested for leadership persistence and found none. This category will earn a 5% allocation only when either (a) credit stress flips off the descriptor list, (b) price recovers above the 200W with confirmed volume, or (c) SPY relative strength turns positive. Until one of those resets occurs, industrial metals are a capital trap—the allocation is better preserved for categories with genuine momentum and macro tailwinds.
Agriculture & Livestock — MOO
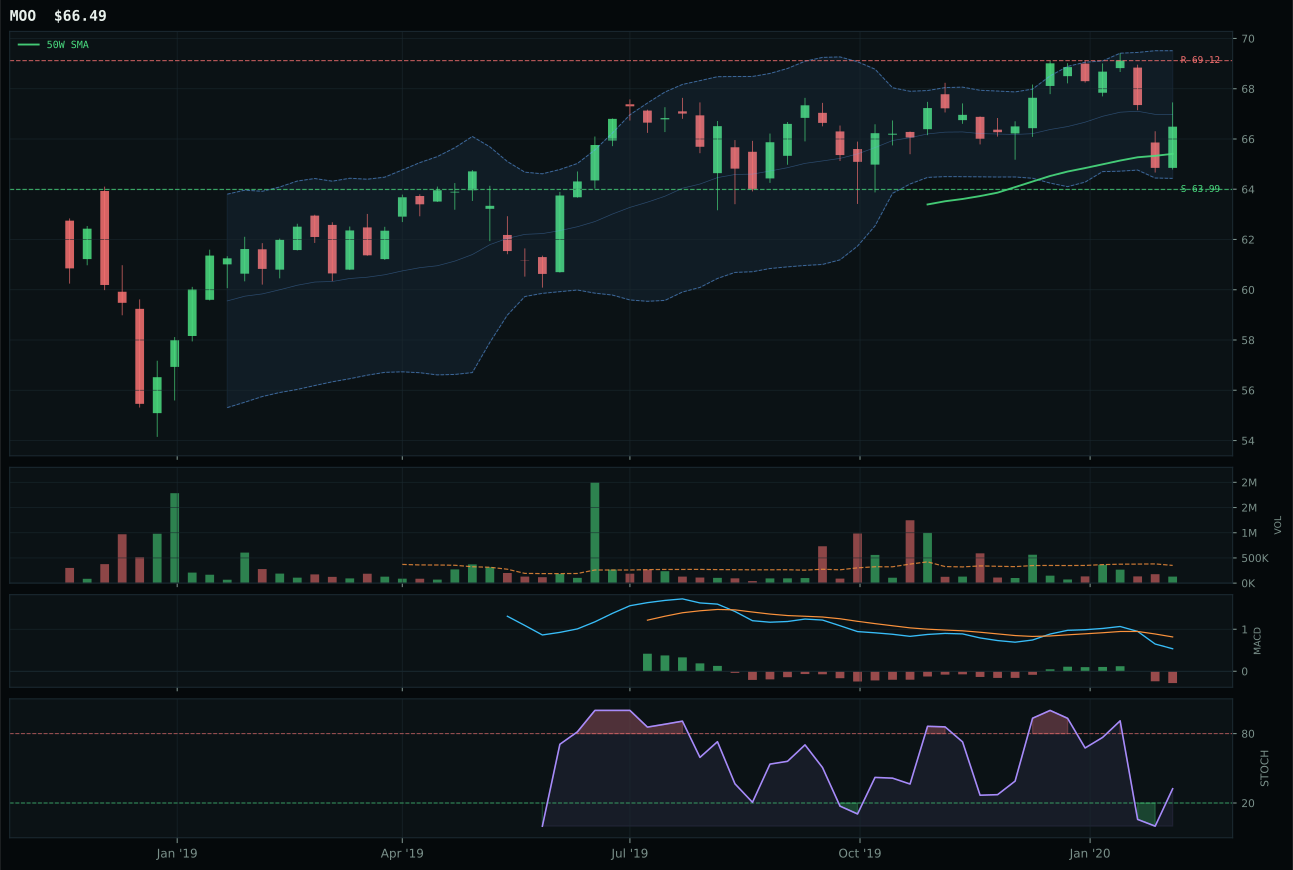
MOO has a pullback into support profile with -8.6% 13-week relative strength versus SPY.
A failed hold above support would weaken the setup.
Actionable but governed by invalidation levels.
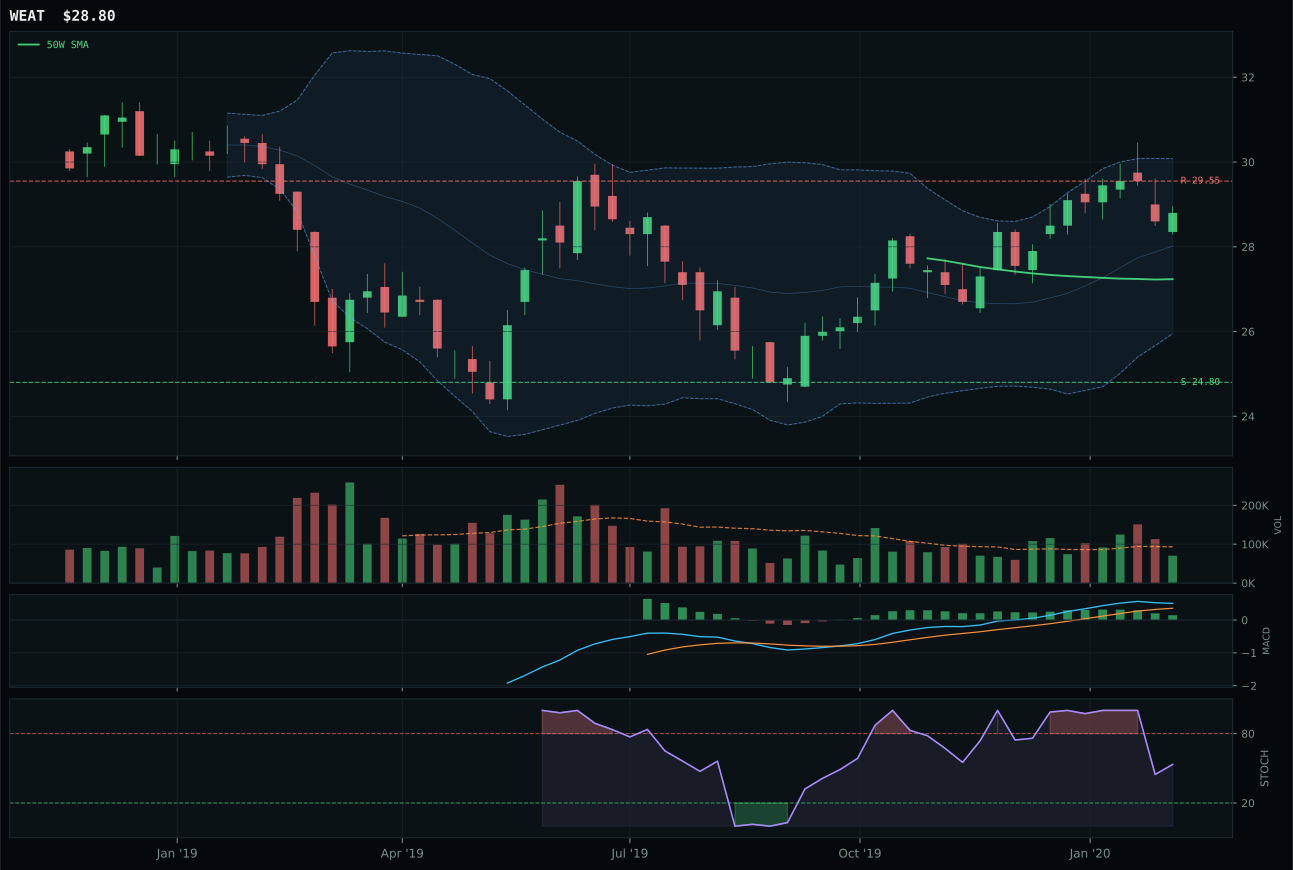
WEAT has a neutral structure profile with -1.3% 13-week relative strength versus SPY.
A failed hold above support would weaken the setup.
Tracked, but not top-2 eligible because: .
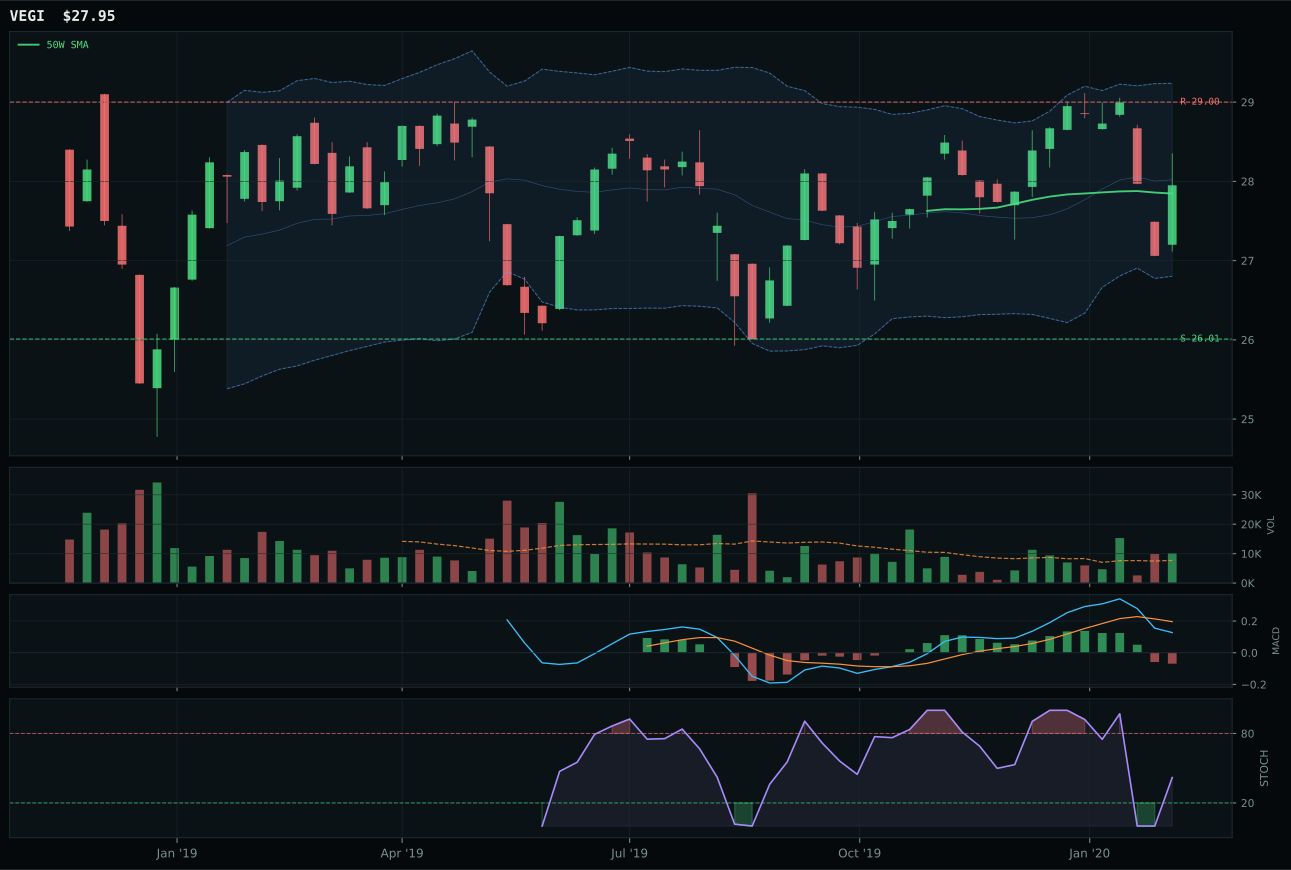
VEGI has a compression near 50W profile with -9.4% 13-week relative strength versus SPY.
A failed hold above support would weaken the setup.
Tracked, but not top-2 eligible because: .
MOO wins a category excluded entirely from allocation by being the least bad option in a fundamentally broken setup. Price above the 50W and 200W by only 1.7% with MACD bearish/weakening and thin 0.37x volume participation marks a corpse bounce rather than accumulation; the setup's only redeeming quality is the proximity to support at 63.99, which at least provides a defined invalidation point. Thirteen-week return of negative 1.1% and RS of negative 8.6% to SPY confirm the entire cohort is in structural decline tied to disinflation pressure (active, costing the category 8 points). WEAT's superior 6.3% thirteen-week return is technically a false signal: its bullish but flattening MACD and neutral volume reveal it rallied on technicals rather than on accumulation, and neutral volume at support is exactly the setup that fails when real selling resumes. The 21.9 point gap between MOO and WEAT is immaterial because both fail the basic test: no volume participation and no MACD commitment to upside.
Agriculture & Livestock earned zero allocation and ranked 9th or 10th because the final category score of 10.1 collapsed under the weight of active disinflation pressure at -8 and universal momentum failure across all three holdings. MOO's -1.1% 13W return and WEAT's flattening MACD are both red flags in a macro environment where falling commodity prices are being discounted aggressively. The category technical evidence of 35.5 for the winner is below the portfolio floor, and the macro fit of 42.0 is driven almost entirely by neutral or absent descriptors rather than active support. Volume participation is either thin (MOO at 0.37x) or genuinely disinterested (WEAT and VEGI), which in a Goldilocks regime screams relative weakness. This category will re-enter the allocation only if disinflation pressure flips off the descriptor list—when inflation expectations stabilize or commodities show genuine demand recovery—or if one name breaks above its 200W with confirmed volume. Until then, capital is better deployed to defensive rotation and utilities.