
2020-01-31
Informational purposes only. The content in this report, including allocations, analysis, and commentary, is provided solely for informational and educational purposes. It does not constitute financial advice, investment advice, trading advice, or any other type of advice. Past performance does not guarantee future results. Always conduct your own research and consult a qualified financial professional before making investment decisions.
Some tracked tickers were excluded due to missing live weekly price data: SGOV: Historical cache SGOV has only 0 usable weekly bars; URNM: Historical cache URNM has only 9 usable weekly bars
Weekly Allocation
| Ticker | Category | Weight | Role |
|---|---|---|---|
| FBTC | 50% | Overlay | |
| GLD | Precious Metals | 10% | Top-2 (10%) |
| XLU | Utilities & Infrastructure | 10% | Top-2 (10%) |
| IGV | Technology | 5% | Tier-2 (5%) |
| ITA | Defense & Aerospace | 5% | Tier-2 (5%) |
| MOO | Agriculture & Livestock | 5% | Tier-2 (5%) |
| SMH | AI | 5% | Tier-2 (5%) |
| PICK | Industrial Metals | 5% | Tier-2 (5%) |
| XLE | Traditional Energy | 5% | Tier-2 (5%) |
Trade Instructions — Monday Open
Sell the tranche from 2020-01-03 (completing its 4-week hold). Buy the new tranche. Instructions show net portfolio changes — same-asset positions cancel, weight changes show the delta.
| Action | Ticker | Instruction |
|---|---|---|
| SELL | ILF | Sell entire ILF position (5.00% of portfolio) |
| SELL | XLK | Sell entire XLK position (5.00% of portfolio) |
| SELL | SMH | Sell 20% of SMH position (reduce 6.25% → 5.00%) |
| SELL | XAR | Sell 33% of XAR position (reduce 7.50% → 5.00%) |
| SELL | IGF | Sell entire IGF position (2.50% of portfolio) |
| SELL | MOO | Sell 20% of MOO position (reduce 6.25% → 5.00%) |
| SELL | PICK | Sell 17% of PICK position (reduce 7.50% → 6.25%) |
| BUY | IGV | Buy IGV — 6.67% of freed cash (adds 1.25% to portfolio) |
| BUY | XLU | Buy XLU — 13.33% of freed cash (adds 2.50% to portfolio) |
| BUY | FBTC | Buy FBTC — 66.67% of freed cash (adds 12.50% to portfolio) |
| BUY | XLE | Buy XLE — 6.67% of freed cash (adds 1.25% to portfolio) |
| BUY | ITA | Buy ITA — 6.67% of freed cash (adds 1.25% to portfolio) |
Current Portfolio After Trade
Combined holdings across all 4 active tranches. Each tranche is 25% of the portfolio.
| Ticker | % of Portfolio | Weight Bar |
|---|---|---|
| FBTC | 37.50% | |
| IGV | 11.25% | |
| XLU | 8.75% | |
| IEMG | 7.50% | |
| GLD | 7.50% | |
| PICK | 6.25% | |
| SMH | 5.00% | |
| MOO | 5.00% | |
| XAR | 5.00% | |
| XLE | 2.50% | |
| BOTZ | 1.25% | |
| INDA | 1.25% | |
| ITA | 1.25% |
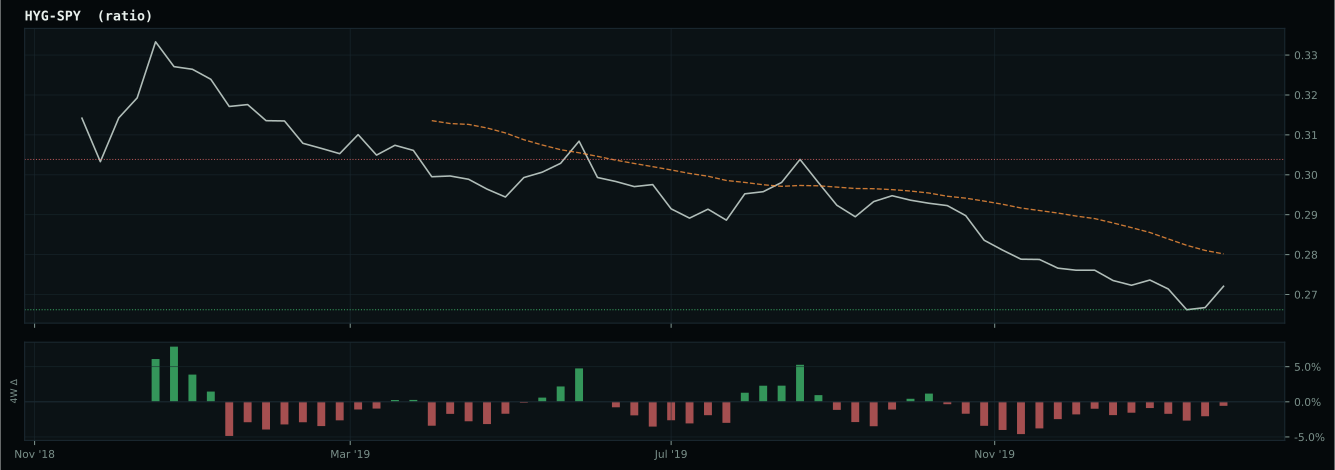
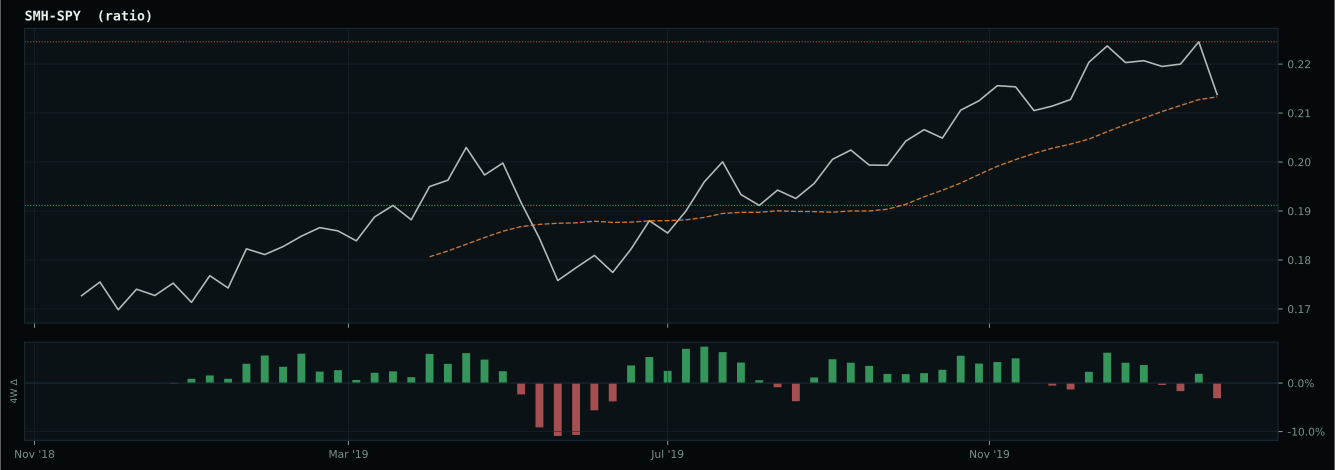
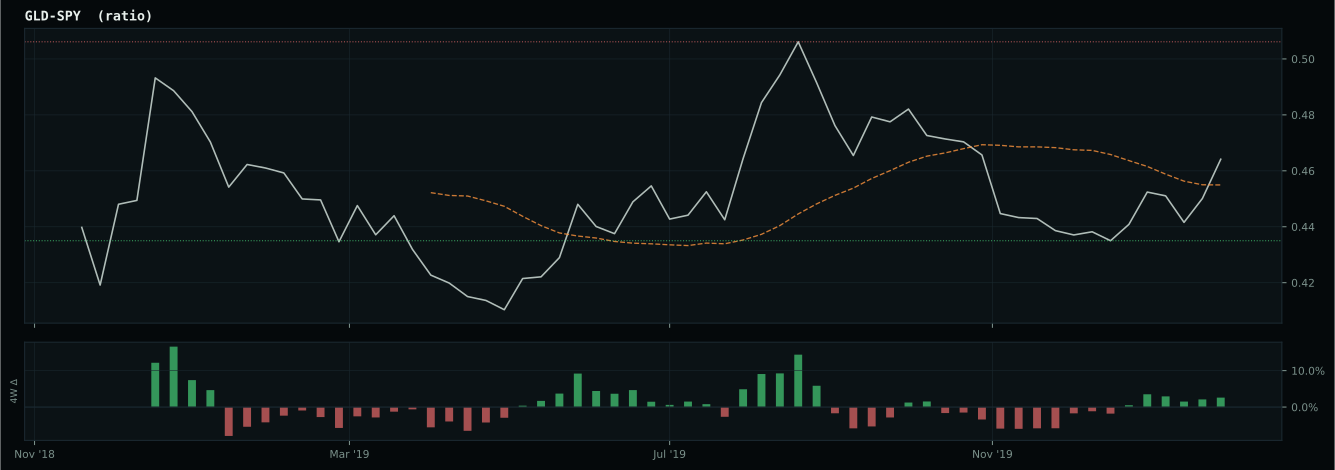
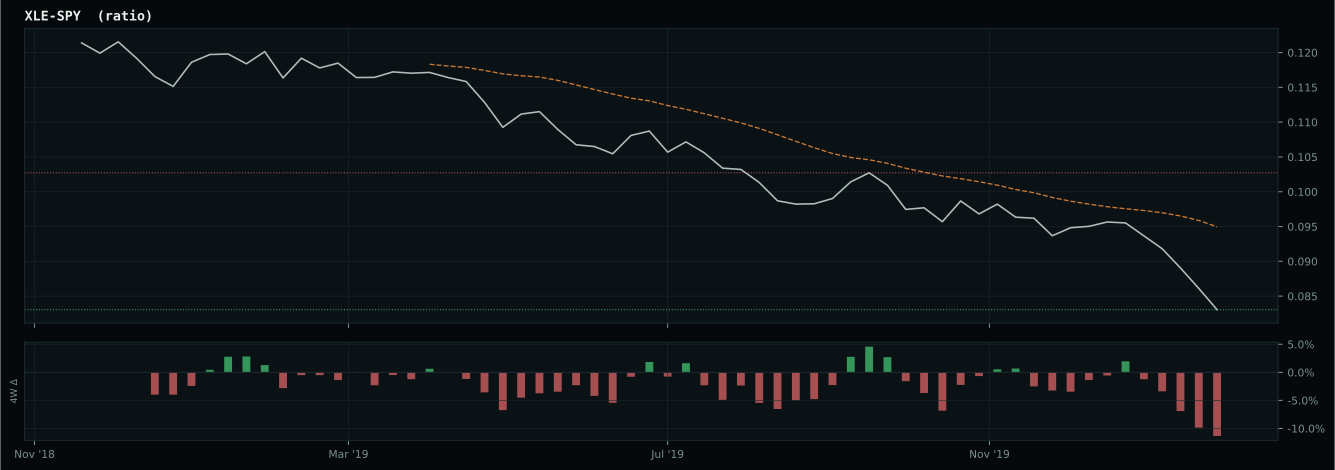
Macro Regime — Disinflation
Macro Evidence Charts
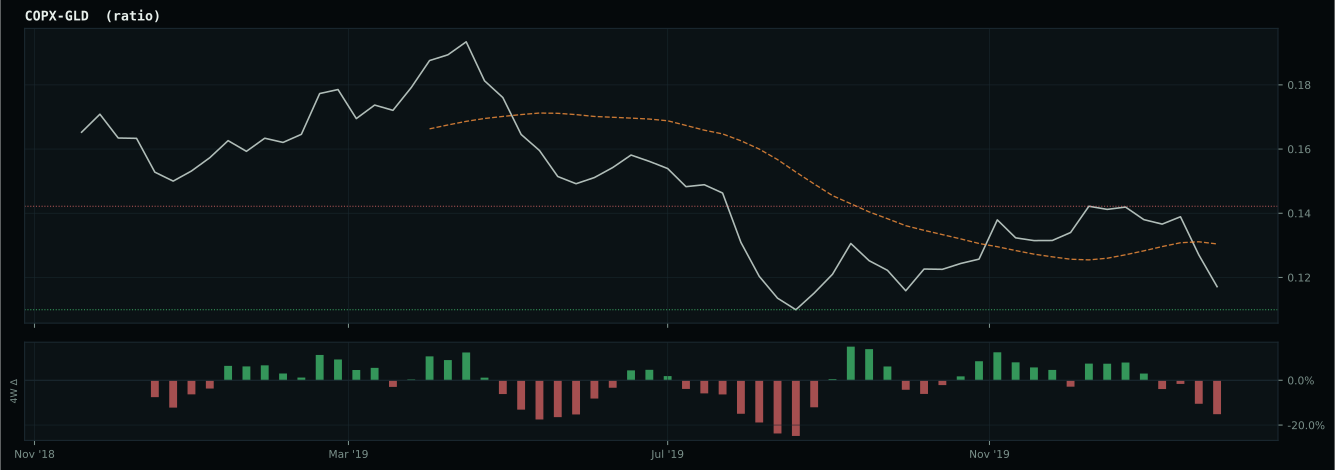
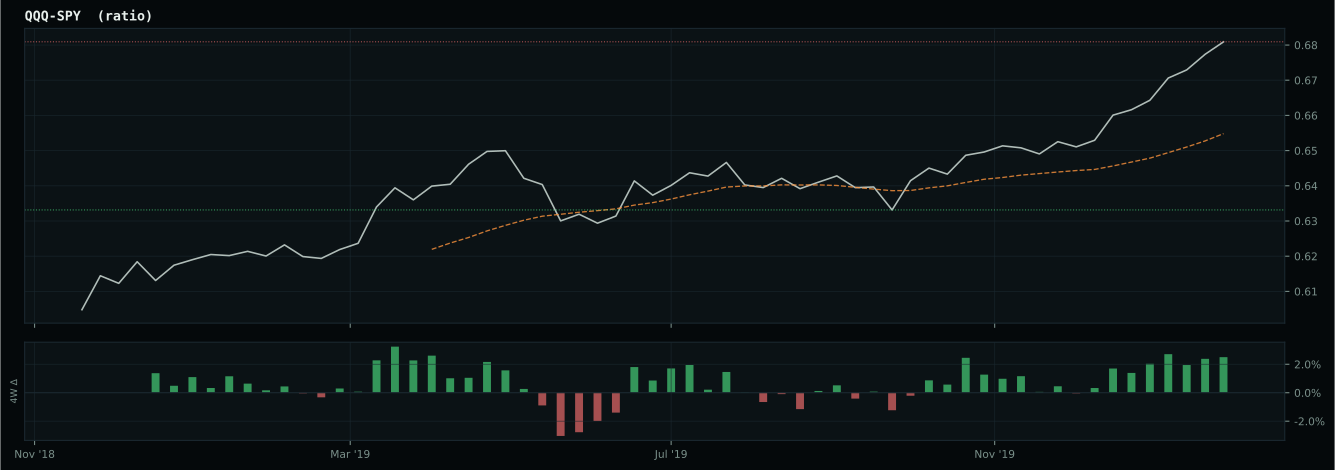
Market-implied signals behind the macro regime scores. Each ratio compares two assets; the direction and slope of the ratio is what the macro engine reads.
Crypto Regime — TrendBTC
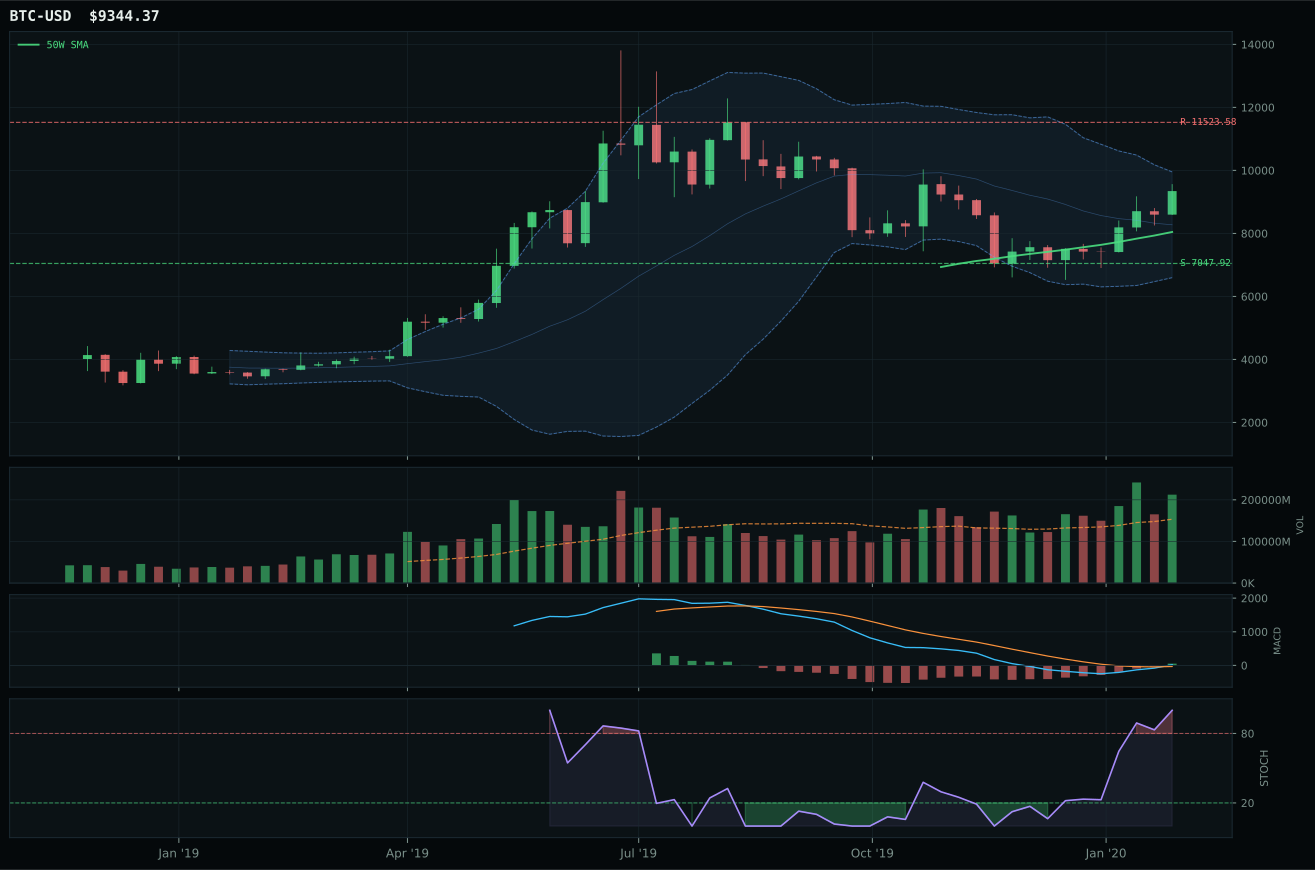
post-touch structure is too wide to count as a range; max/min close ratio is 3.54
TrendBTC confirmed: 2 consecutive closes above rising/flat 50W SMA
one or more available conditions failed

Category Rankings
| Rank | Category | Winner | Score | Alloc | 4W Ret | Peers (4W) |
|---|---|---|---|---|---|---|
| 1 | Precious Metals | GLD | 71.6 | 20% | +0.90% | GDX -6.0% · SLV -6.0% |
| 2 | Utilities & Infrastructure | XLU | 66.8 | 20% | -9.54% | IGF -9.2% · PAVE -9.9% |
| 3 | Technology | IGV | 56.2 | 10% | -5.11% | XLK -5.7% · CIBR -8.7% |
| 4 | Defense & Aerospace | ITA | 48.6 | 10% | -10.99% | XAR -11.2% · ROKT -7.9% |
| 5 | AI | SMH | 29.6 | 10% | -3.25% | BOTZ -6.0% · AIQ -5.4% |
| 6 | Emerging Markets | INDA | 16.6 | 10% | -7.00% | IEMG -4.1% · ILF -11.3% |
| 7 | Nuclear Energy | NLR | 3.8 | 10% | -8.38% | URA -5.8% |
| 8 | Agriculture & Livestock | MOO | — | 10% | -7.57% | WEAT -4.2% · VEGI -5.8% |
| 9 | Industrial Metals | PICK | — | 0% | -12.01% | COPX -10.9% · REMX -8.0% |
| 10 | Traditional Energy | XLE | — | 0% | -13.28% | FCG -17.9% · XOP -17.9% |
Precious Metals — GLD
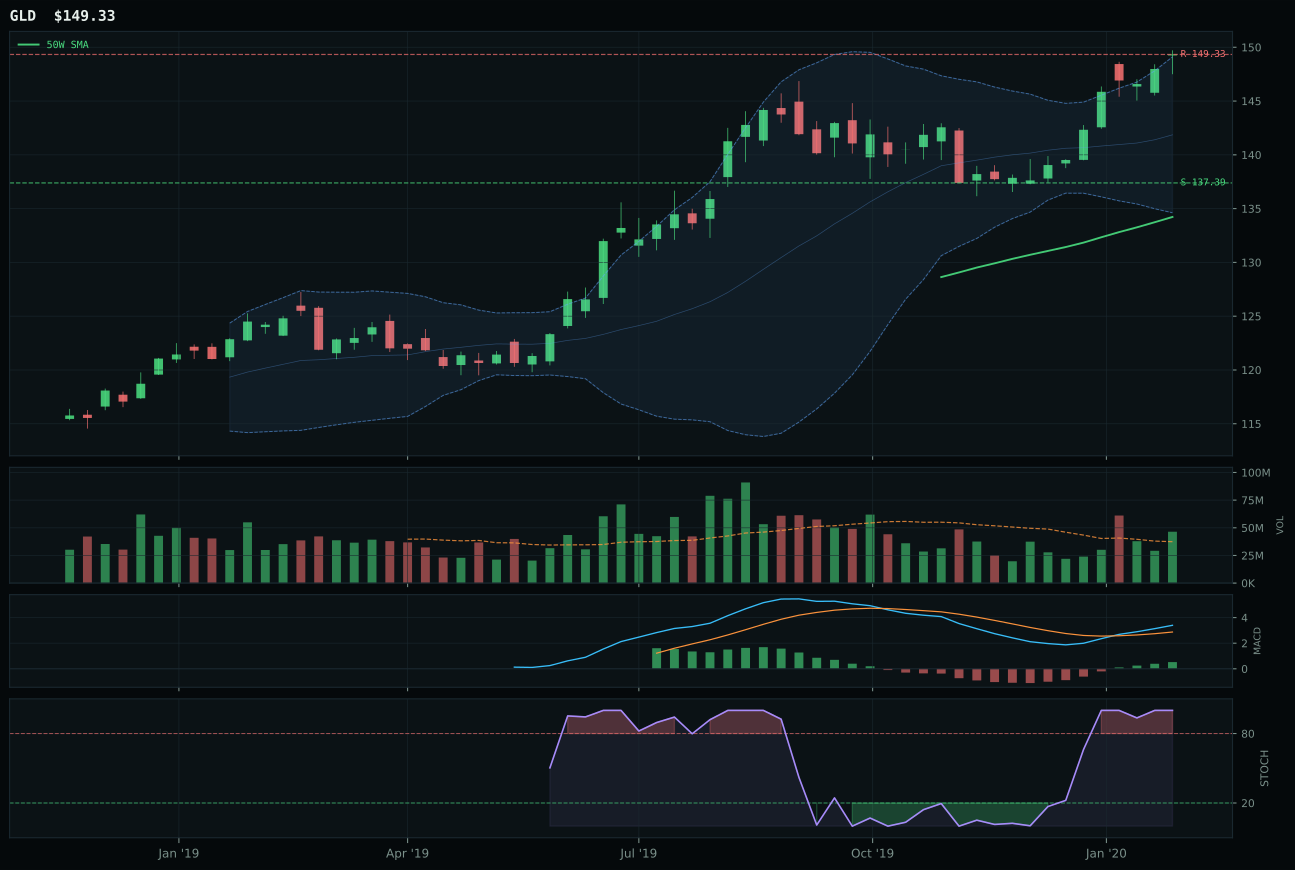
GLD has a neutral structure profile with -0.3% 13-week relative strength versus SPY.
A failed hold above support would weaken the setup.
Actionable but governed by invalidation levels.
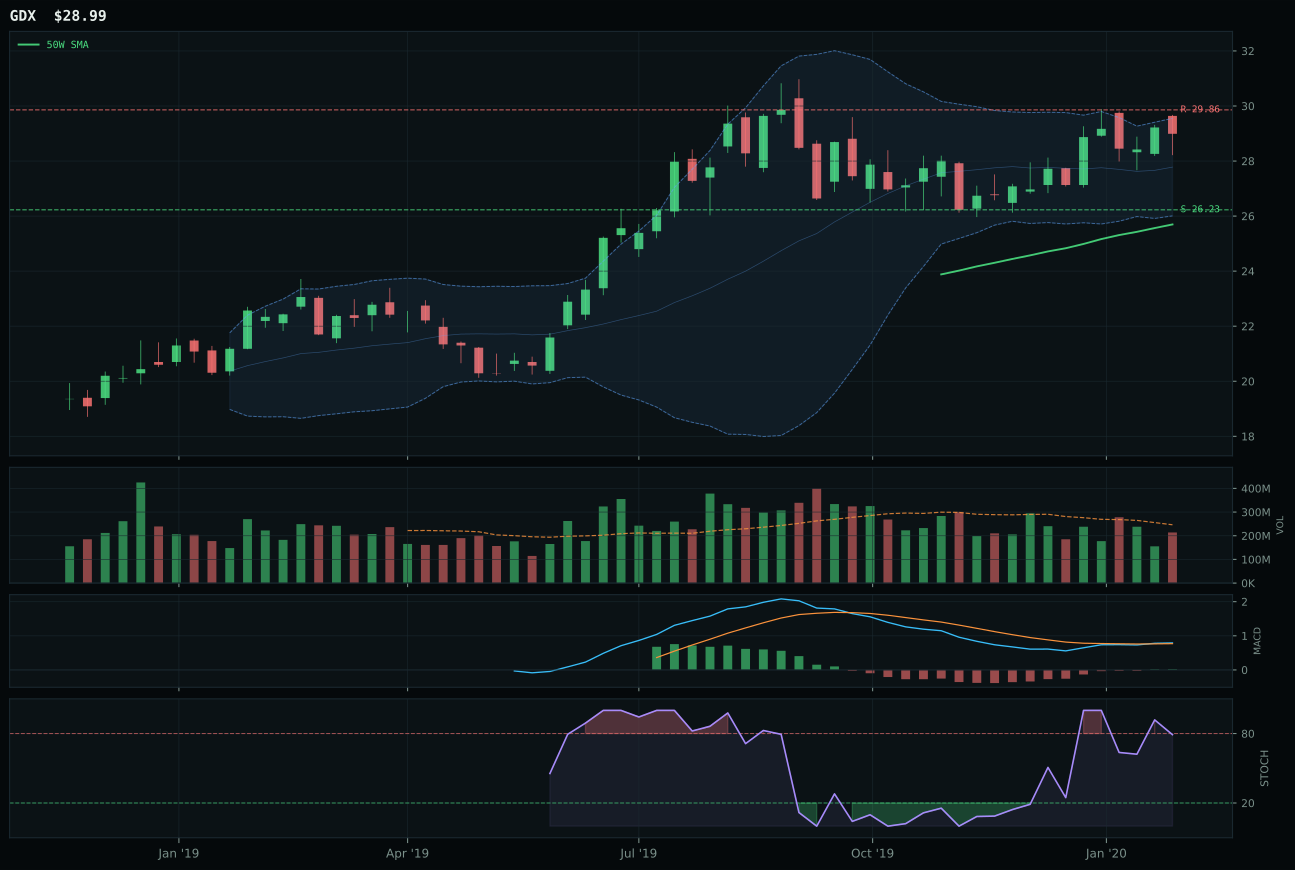
GDX has a neutral structure profile with -1.6% 13-week relative strength versus SPY.
A failed hold above support would weaken the setup.
Actionable but governed by invalidation levels.
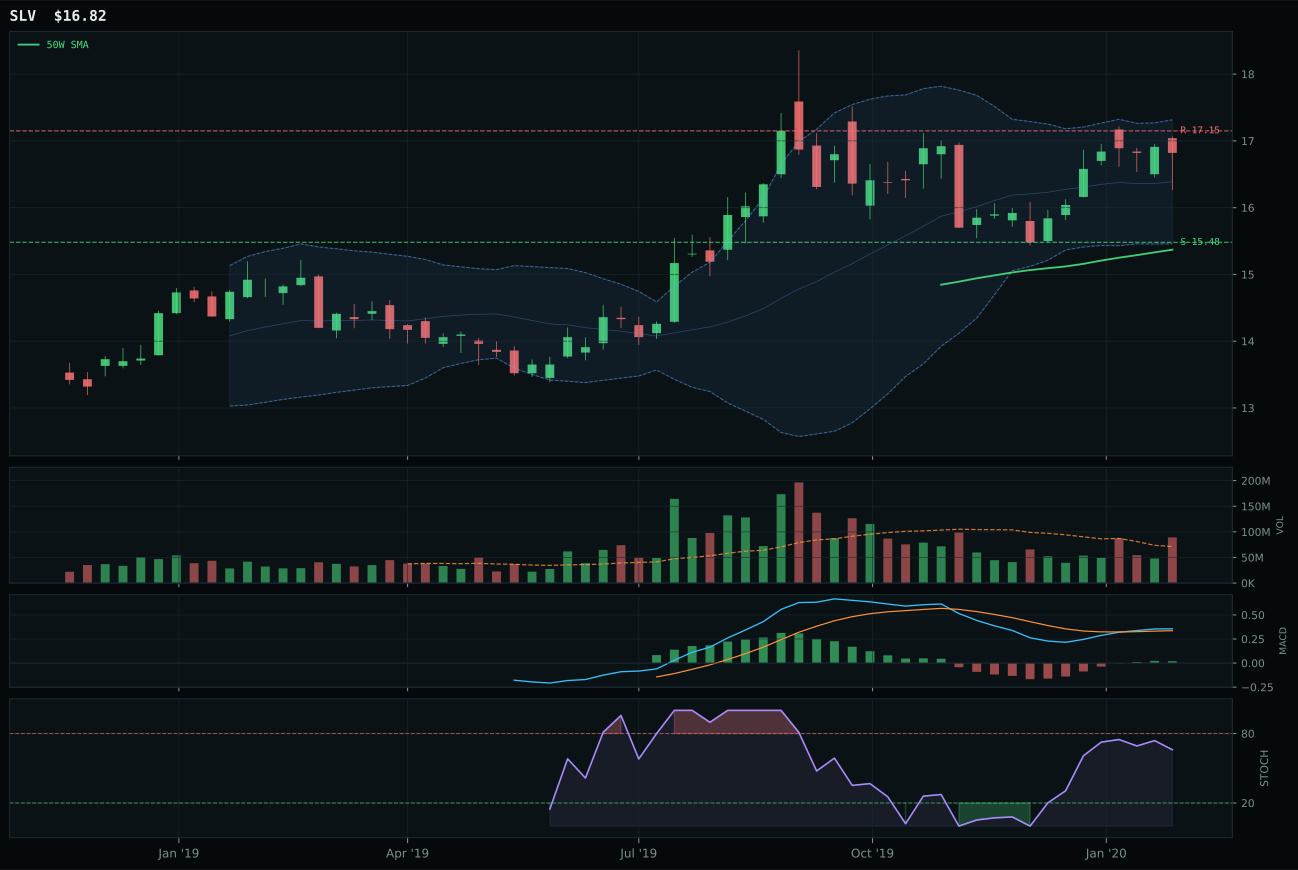
SLV has a neutral structure profile with -5.7% 13-week relative strength versus SPY.
A failed hold above support would weaken the setup.
Actionable but governed by invalidation levels.
GLD wins because it combines macro alignment with genuine sponsor participation: 4.7% thirteen-week returns and 1.3% category-relative strength establish that gold is being accumulated, not mechanically bid. Price sits 11.3% above the 50W with neutral structure—neither compressed nor extended—and stochastic RSI reaches full overbought at 1.00 while MACD remains bullish and improving, a rare combination suggesting momentum has room to run before exhaustion. GDX lost despite neutral setup because its 0.0% category-relative strength reveals miners are lagging gold itself, and neutralization of that spread often precedes mean reversion. Volume at 1.24x average confirms accumulation, and the risk/reward of 53.6 is balanced: 8.7% downside protection versus 0.0% upside constraint to resistance.
Precious Metals receives 10% allocation as a top-2 overweight, ranked among the two highest-scoring eligible categories at 71.6. Disinflation regime (+8 macro support) combined with active defensive rotation (+7) makes gold the portfolio's macro hedge: it performs when rates fall and credit stress rises, precisely the scenarios this regime surfaces. GLD's 82.8 technical evidence score is strong without being stretched, and macro/narrative fit of 64.0 reflects genuine alignment rather than narrative hope. The category earned top-2 status because it offers both momentum confirmation (7.6 momentum confirmation score) and macro tailwind simultaneously—rare in this portfolio. This is capital allocated for insurance, not alpha. Maintain the 10% unless defensive rotation becomes less active or disinflation reverses; those shifts would drop Precious Metals to tier-2 immediately.
Utilities & Infrastructure — XLU
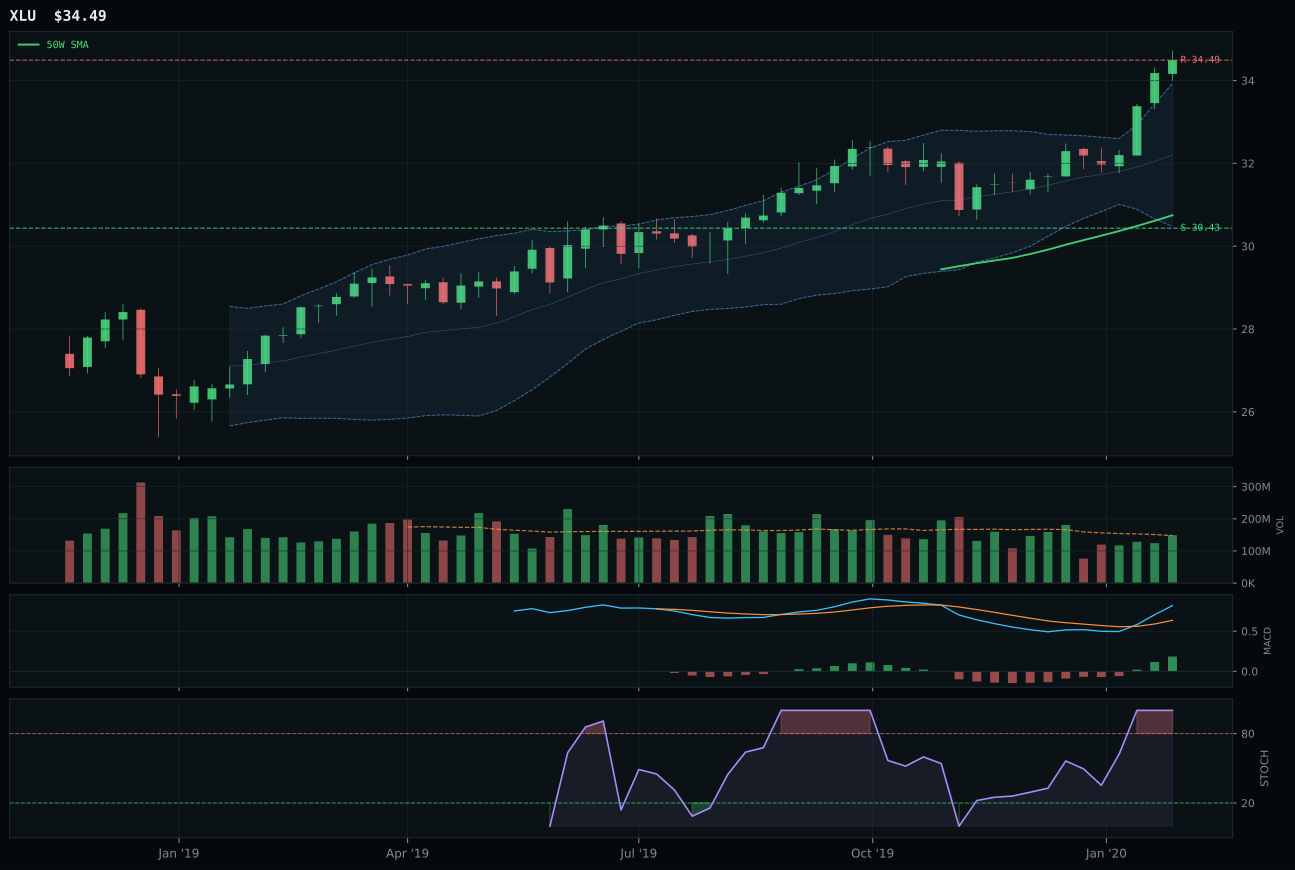
XLU has a neutral structure profile with 2.5% 13-week relative strength versus SPY.
A failed hold above support would weaken the setup.
Actionable but governed by invalidation levels.
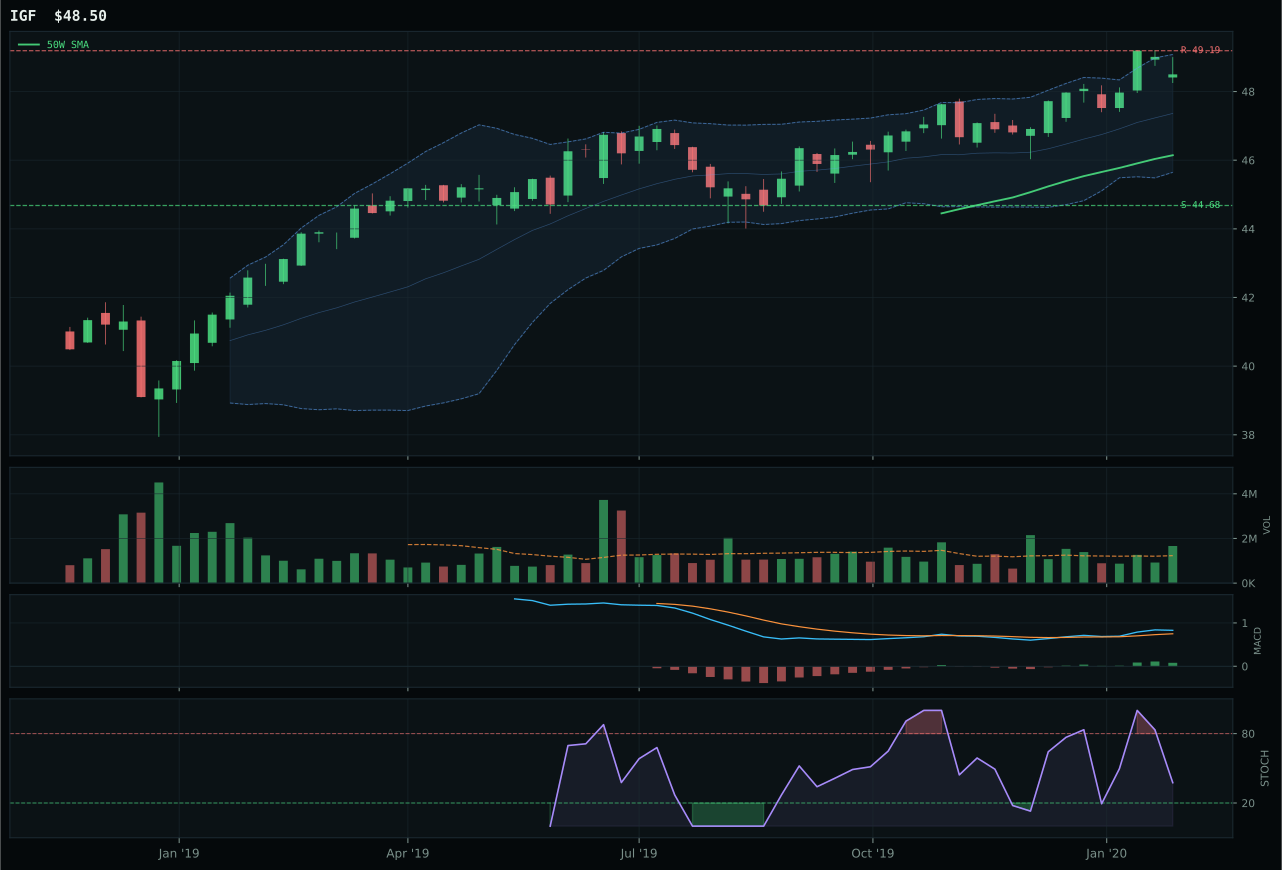
IGF has a neutral structure profile with -3.3% 13-week relative strength versus SPY.
A failed hold above support would weaken the setup.
Actionable but governed by invalidation levels.
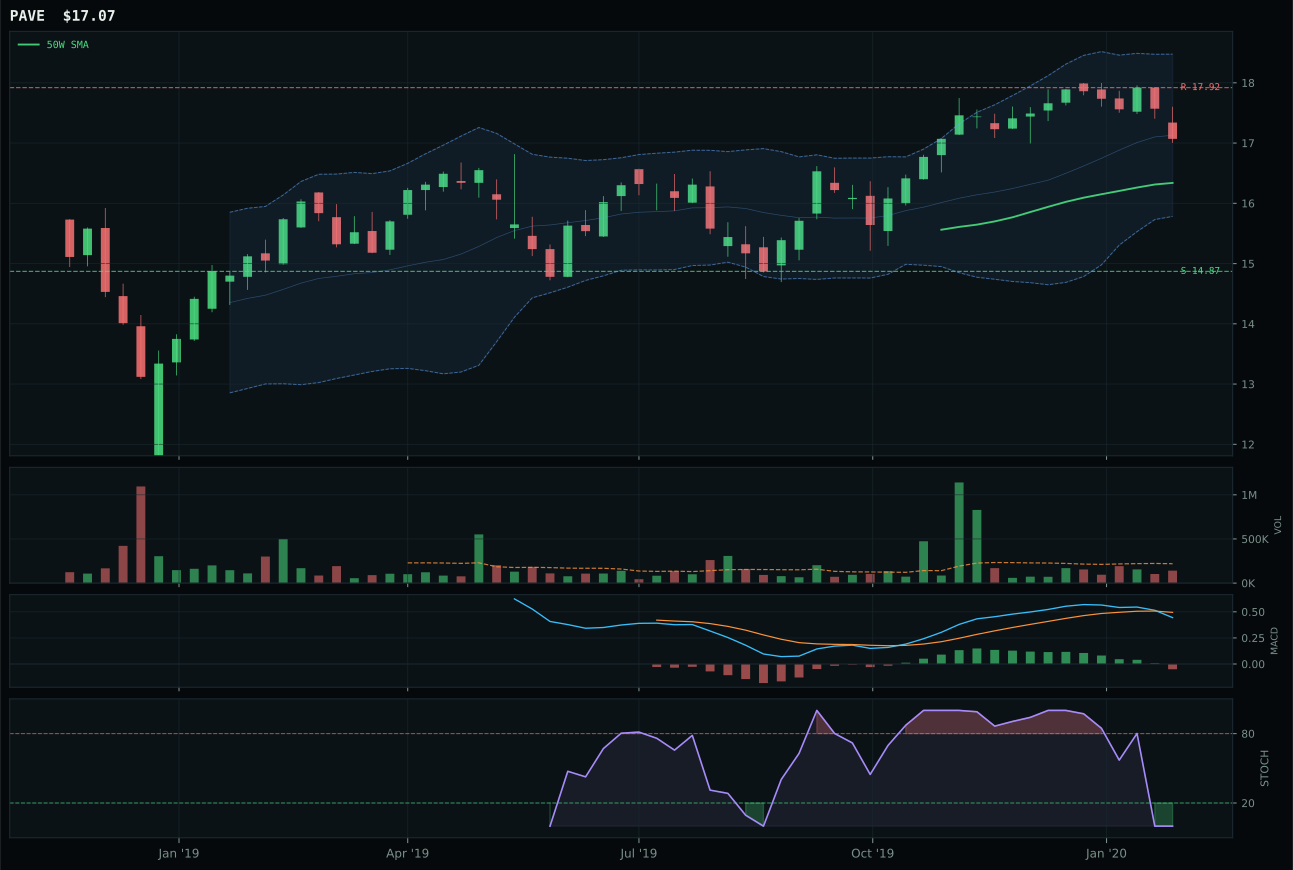
PAVE has a neutral structure profile with -5.1% 13-week relative strength versus SPY.
A failed hold above support would weaken the setup.
Tracked, but not top-2 eligible because: .
XLU wins because it combines the portfolio's highest trend score at 100.0 with 7.6% thirteen-week returns and 5.8% category-relative strength, demonstrating that defensive buyers have systematized accumulation rather than dabbled tactically. Price sits 12.2% above the 50W with neutral structure, and stochastic RSI reaches full overbought at 1.00 while MACD remains bullish and improving—signals of strength without yet showing exhaustion. IGF lost despite 95 trend score because its -3.3% SPY-relative weakness reveals it is lagging the category, and cleanliness at 79.4 trails XLU's 83.3. Volume at 1.01x average is neutral rather than above-average, yet momentum confirmation of 96.1 reflects genuine four-week buying at 7.9% returns. Risk/reward is tight at 47.8, but that reflects the defensive sleeve's nature: asymmetry favors holding existing positions over hunting new entry.
Utilities & Infrastructure receives 10% allocation as a top-2 overweight, ranked among the two highest-scoring eligible categories at 66.8. This is the portfolio's second-largest allocation sleeve alongside FBTC 50% crypto tier, driven by active defensive rotation (+12 macro) and disinflation support (+7), combining for +19 points of tailwind. XLU's 84.5 technical evidence combined with 68.0 macro/narrative fit creates the tightest alignment in the portfolio: the regime wants defensive income, buyers want regulated utility utilities, and the chart shows accumulation rather than distribution. Maintain the 10% unless defensive rotation deactivates (would drop to 5% immediately) or disinflation reverses to inflation acceleration (would drop to 0%). This allocation represents the portfolio's core defensive anchor and should be protected. Rebalance into XLU weakness near the 50W at 29-30.43 range if pullbacks materialize.
Technology — IGV
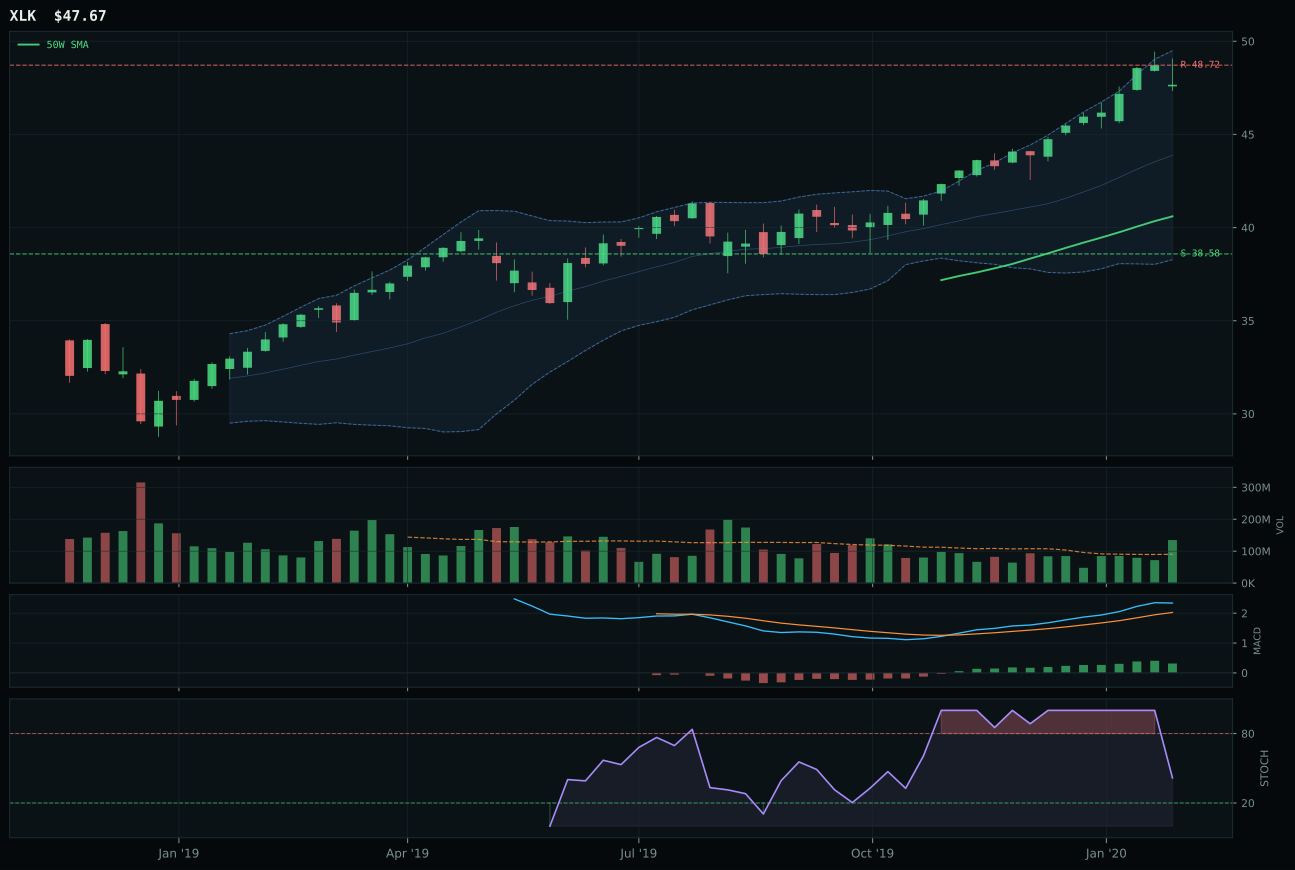
XLK has a vertical extension profile with 7.5% 13-week relative strength versus SPY.
A failed hold above support would weaken the setup.
Actionable but governed by invalidation levels.
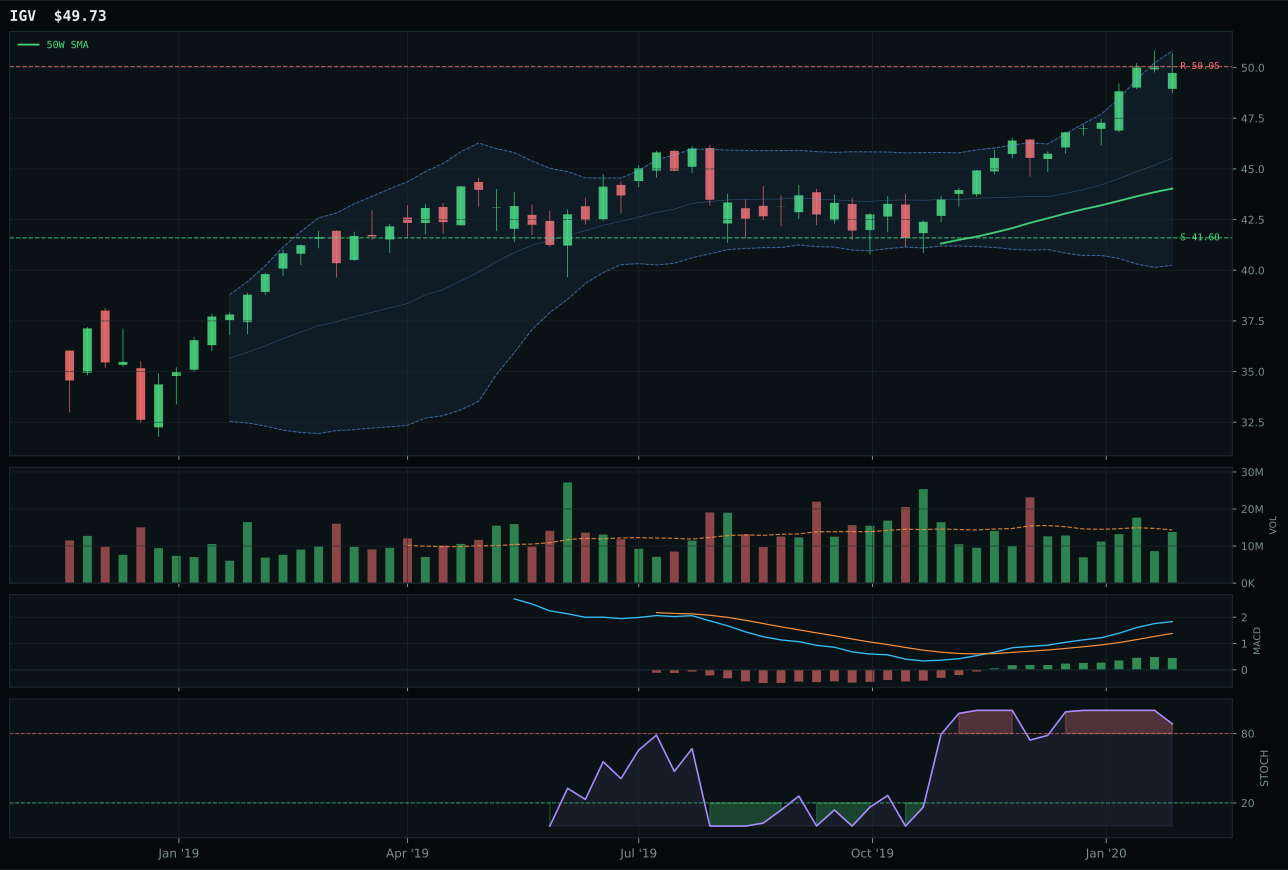
IGV has a neutral structure profile with 9.3% 13-week relative strength versus SPY.
A failed hold above support would weaken the setup.
Actionable but governed by invalidation levels.
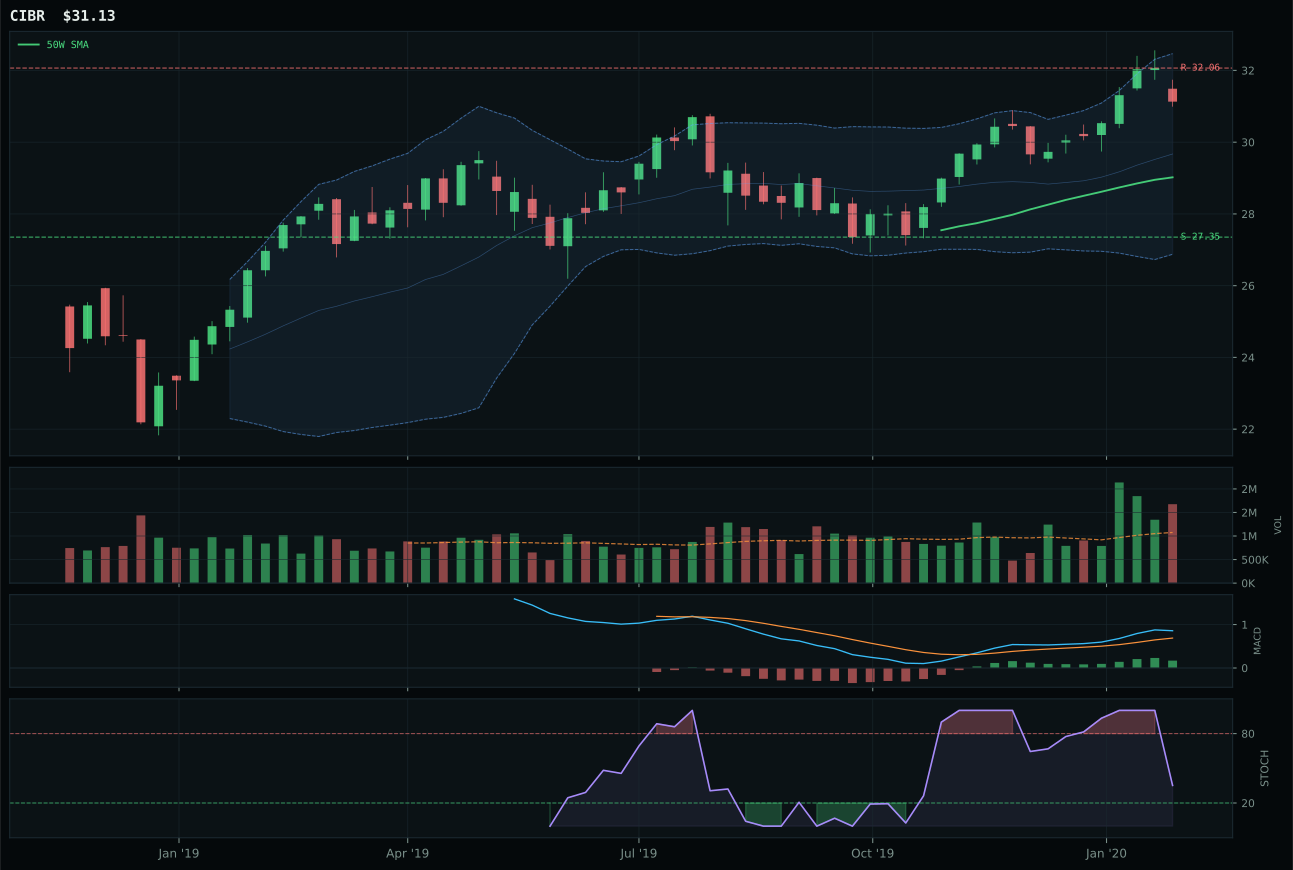
CIBR has a neutral structure profile with 2.3% 13-week relative strength versus SPY.
A failed hold above support would weaken the setup.
Actionable but governed by invalidation levels.
IGV wins the category because its 1.8% relative strength versus the category median—combined with a 9.3% outperformance against SPY over thirteen weeks—demonstrates genuine accumulation rather than a reflexive bounce off the 50-week moving average. Price sits 13.0% above support at neutral distance, with MACD bullish and improving while stochastic RSI rolls over from overbought at 0.89, a textbook combination for exhaustion without breakdown. XLK lost despite superior timing and vertical extension because it lagged in category-relative strength at 0.0%, ceding leadership to IGV's cleaner structure score of 83.2 versus 83.2 and neutral volume confirmation at 0.96x average. The setup is neither extended nor compressed—it is a clean, sponsored move with 14.4% thirteen-week returns and 75.3 persistence, meaning buyers are showing up methodically rather than capitulating.
Technology receives 5% allocation as a tier-2 category, ranking third through eighth among all ten categories this week. The disinflation regime supports duration-sensitive growth equities, and GLD and XLU's top-2 selection left room for quality technology exposure without overweighting risk assets. However, IGV's 49.0 timing score—driven by extended positioning 13.0% above the 50W and overbought stochastics—creates a structural tension: the chart is paid for and buyers are fatigued. For Technology to earn promotion to top-2, IGV would need either a fresh consolidation near the 50W to reset entry risk or SPY-relative strength to break decisively above 10%, proving the move is structural rather than tactical.
Defense & Aerospace — ITA
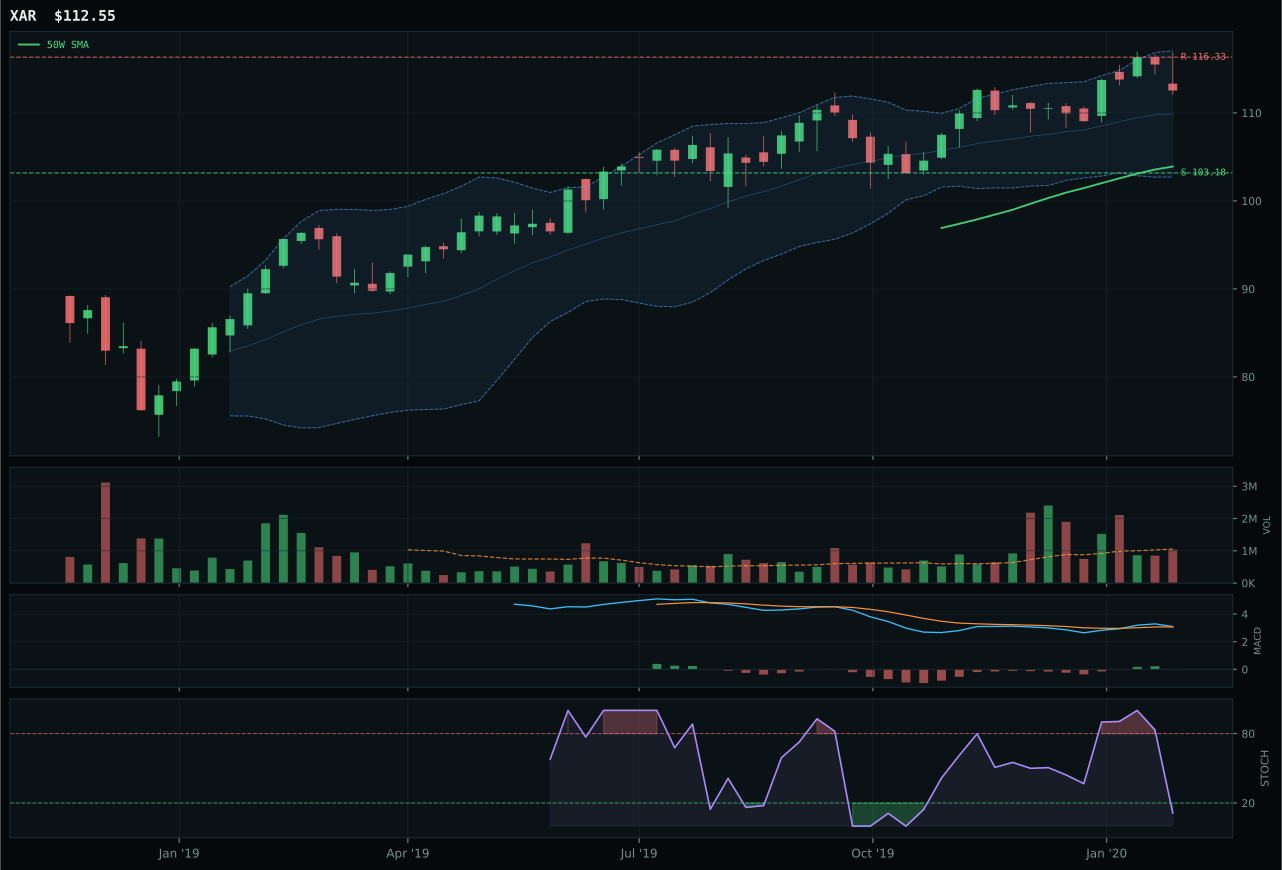
XAR has a neutral structure profile with -0.4% 13-week relative strength versus SPY.
A failed hold above support would weaken the setup.
Actionable but governed by invalidation levels.
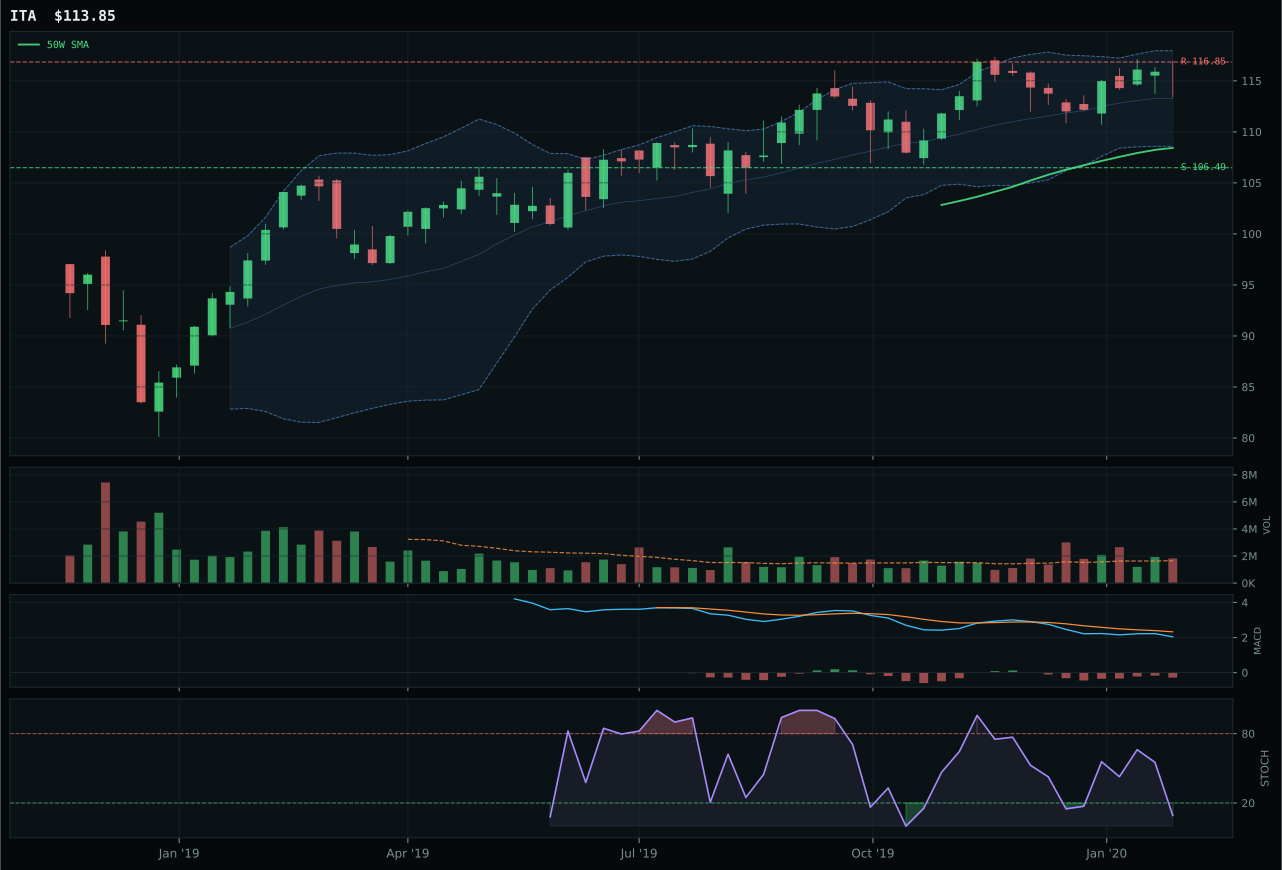
ITA has a neutral structure profile with -3.3% 13-week relative strength versus SPY.
A failed hold above support would weaken the setup.
Actionable but governed by invalidation levels.
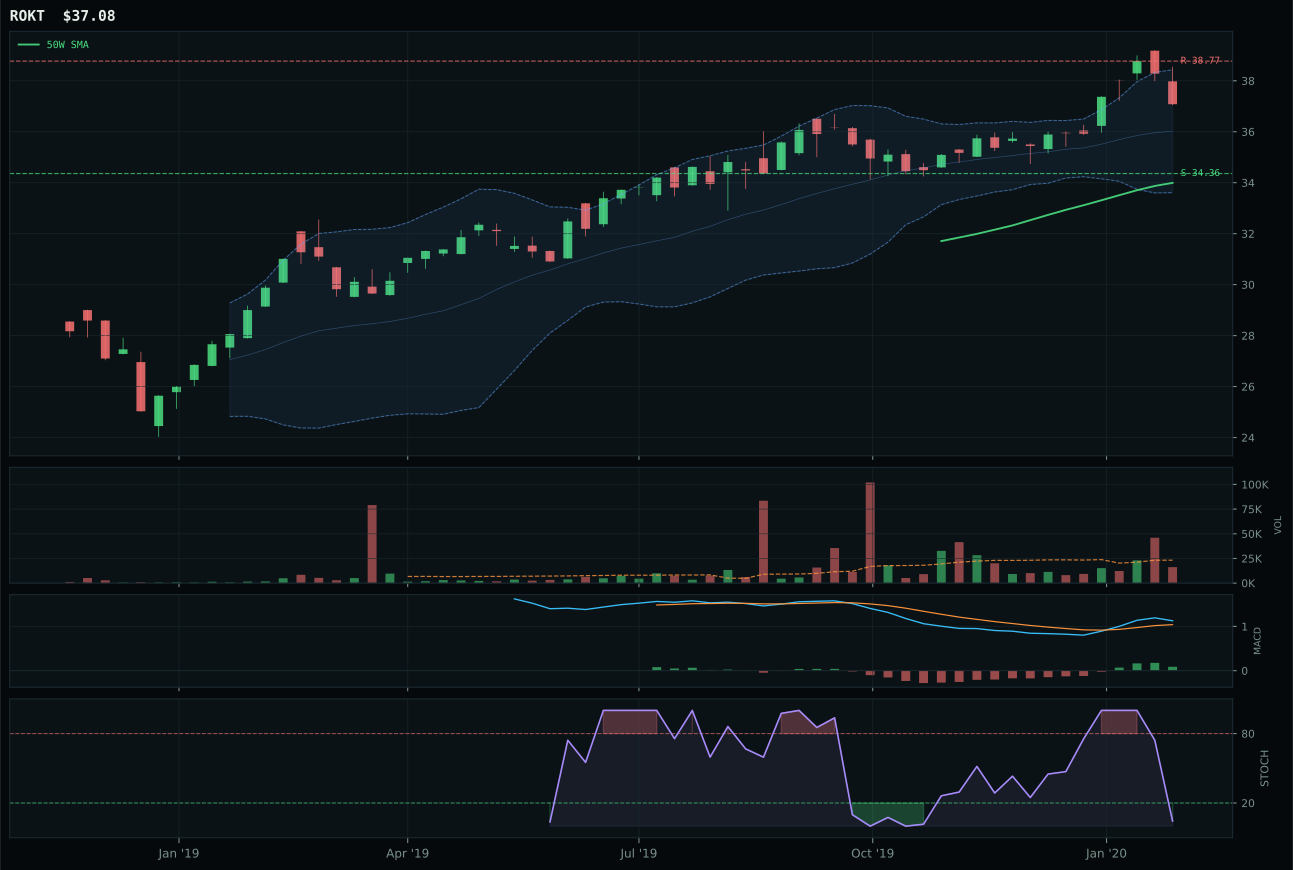
ROKT has a neutral structure profile with 0.6% 13-week relative strength versus SPY.
A failed hold above support would weaken the setup.
Tracked, but not top-2 eligible because: .
ITA wins because its 1.8% thirteen-week return, though modest, comes with above-average volume participation at 1.10x average—the only evidence of accumulation in a category where MACD is bearish but improving and support sits just 6.9% downside away. XAR lost despite stronger trend evidence (99 versus 88) because ITA's volume sponsorship and defensive rotation backdrop (+7 macro tailwind) proved decisive over pure technical scorecard wins. Price compresses near the 50W just 5.0% away, and while MACD shows weakness, stochastic RSI sits oversold at 0.10, offering a defined entry invalidation if support breaks. Risk/reward of 51.7 reflects the setup's tightness: 2.6% upside to resistance against 6.9% downside, appropriate for a category where buyers are wading in rather than rushing.
Defense & Aerospace receives 5% allocation as a tier-2 category, ranked third through eighth this week. The category score of 48.6 sits comfortably above exclusion, benefiting from active defensive rotation (+8 macro tailwind) that compensates for weak technical evidence across the board. ITA's 59.5 technical evidence score is below 62% technical weight threshold, yet macro/narrative fit of 54.0 lifts the category into tier-2 standing. Credit stress is actually slightly positive (+2), a rarity in this week's regime. For Defense to earn top-2 status, it would need ITA to break cleanly above resistance at 116.85 with confirming volume, signaling that defensive buyers have shifted from tactical nibbles to strategic accumulation. Currently, the category is a defensive placeholder rather than a core conviction play.
AI — SMH
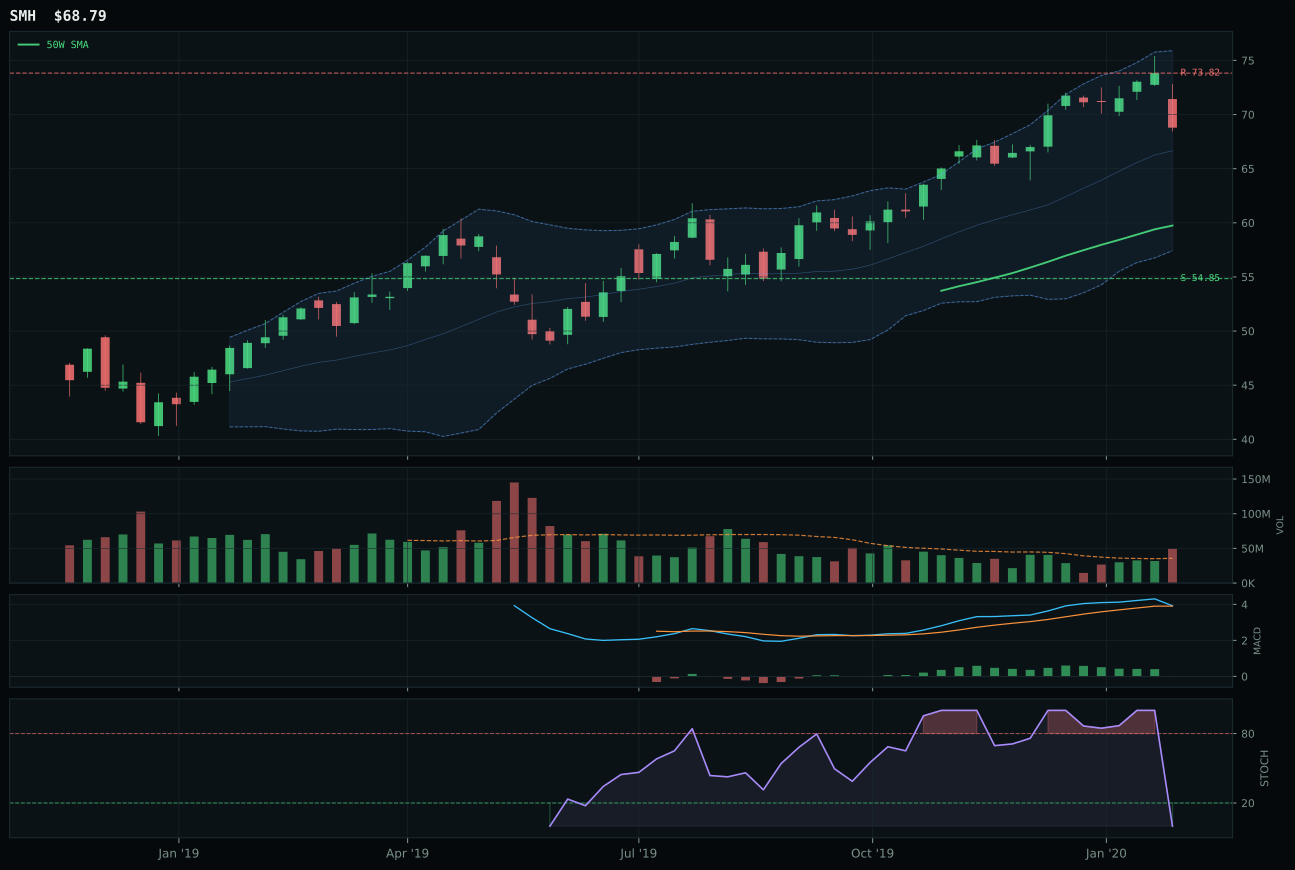
SMH has a vertical extension profile with 0.6% 13-week relative strength versus SPY.
A failed hold above support would weaken the setup.
Actionable but governed by invalidation levels.
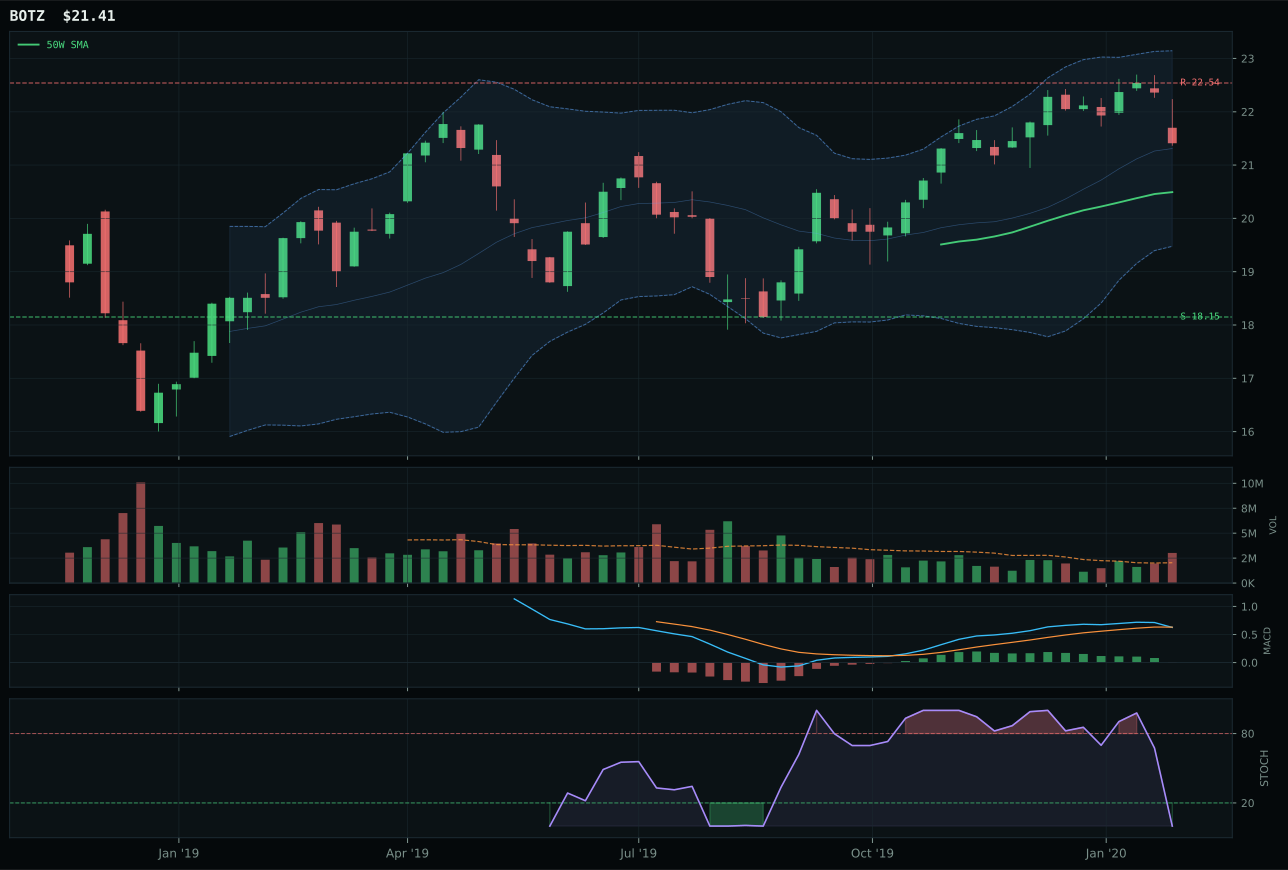
BOTZ has a neutral structure profile with -4.6% 13-week relative strength versus SPY.
A failed hold above support would weaken the setup.
Actionable but governed by invalidation levels.
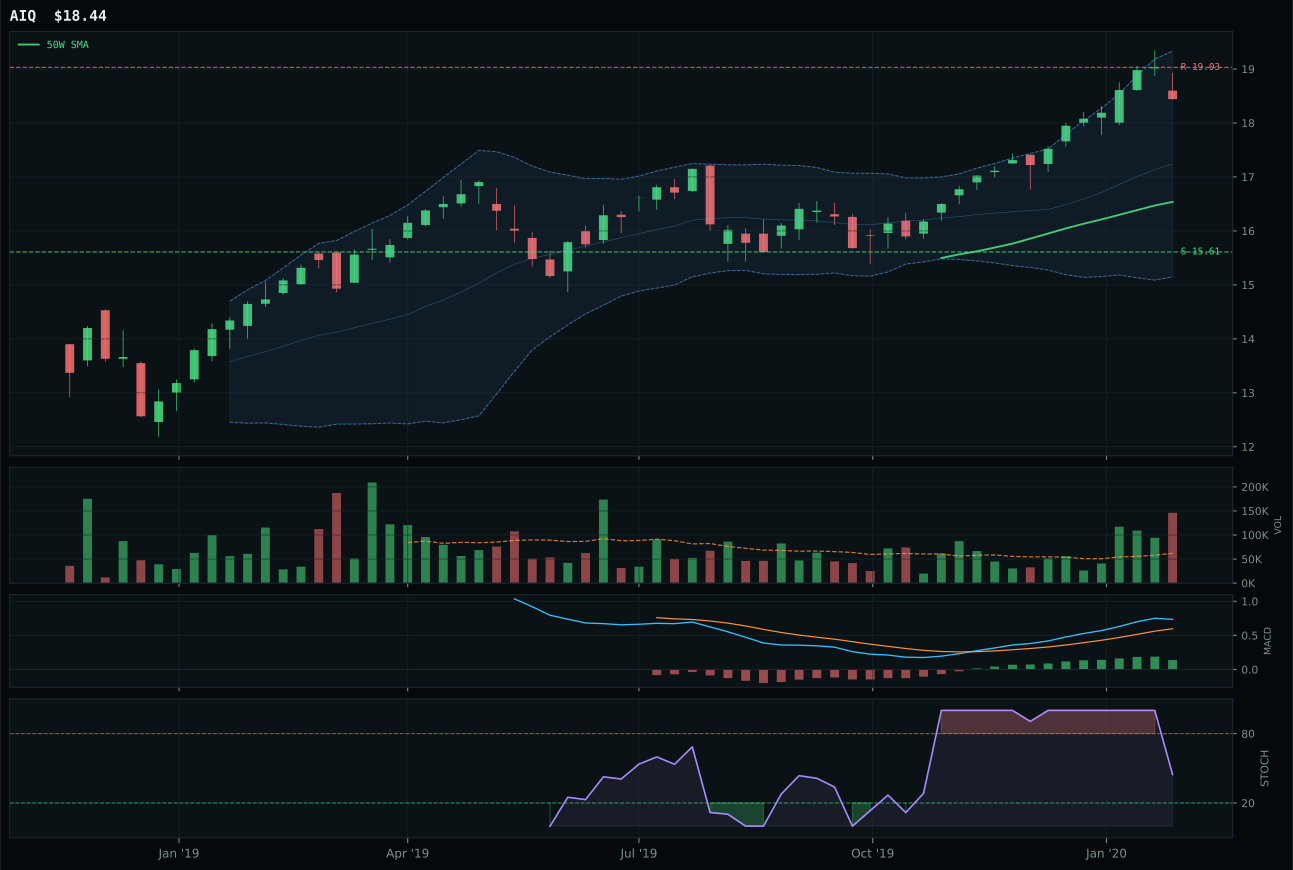
AIQ has a neutral structure profile with 6.7% 13-week relative strength versus SPY.
A failed hold above support would weaken the setup.
Tracked, but not top-2 eligible because: .
SMH wins a razor-thin decision over BOTZ, separated by just 0.5 points, because it held category-relative strength at 0.0% while BOTZ deteriorated to -5.3%, demonstrating marginally better peer positioning in a collapsing category. Price sits 15.1% above the 50W—deeply extended—yet SMH's structure remains vertical rather than compressed, keeping cleanliness at 75.0 and compression at 81.5; BOTZ's neutral setup was less clean at 75.8. Volume participation is above-average at 1.38x average for SMH, and crucially, MACD is bullish but flattening while stochastic RSI sits oversold at 0.00, suggesting buyers have run out of air. The 5.7% thirteen-week return masks a -3.3% four-week return, revealing momentum is mechanical rather than driven by fresh capital conviction.
AI receives 5% allocation as a tier-2 category, ranked third through eighth this week. The category's final score of 29.6 reflects structural weakness: liquidity stress and credit stress are both active, each penalizing the basket by double digits. Disinflation adds only 5 points of support. Unlike GLD and XLU, which earned top-2 status through macro alignment and sponsor participation, AI is here because it still represents the highest-ranked eligible representative within a heavily damaged peer group. For AI to move up, SMH or BOTZ would need to break decisively above the 50W with renewed volume participation, or emerging buyers would need to establish cleaner compression setups. Right now, the category is mechanically extended, and the allocation reflects duty rather than conviction.
Agriculture & Livestock — MOO
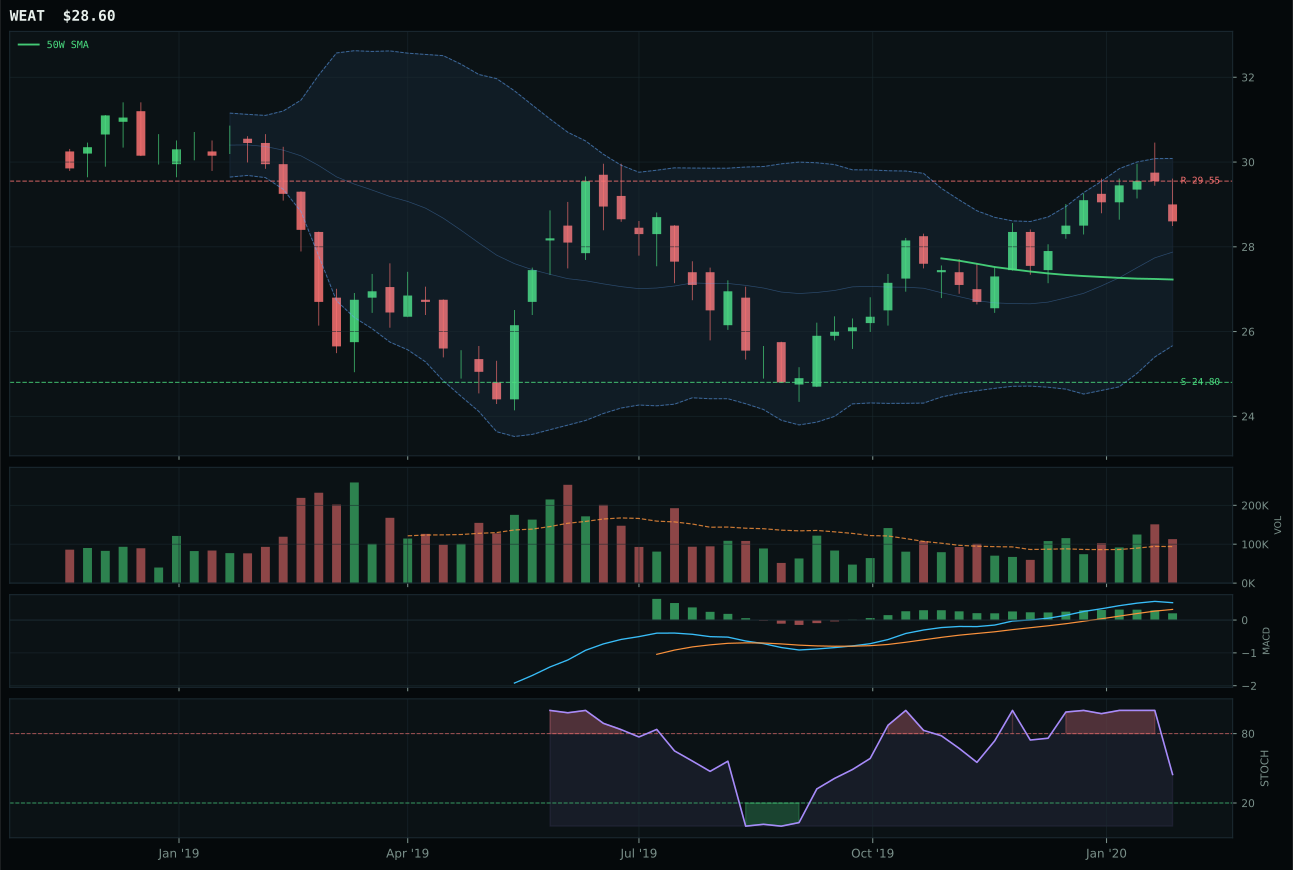
WEAT has a neutral structure profile with -0.9% 13-week relative strength versus SPY.
A failed hold above support would weaken the setup.
Tracked, but not top-2 eligible because: .
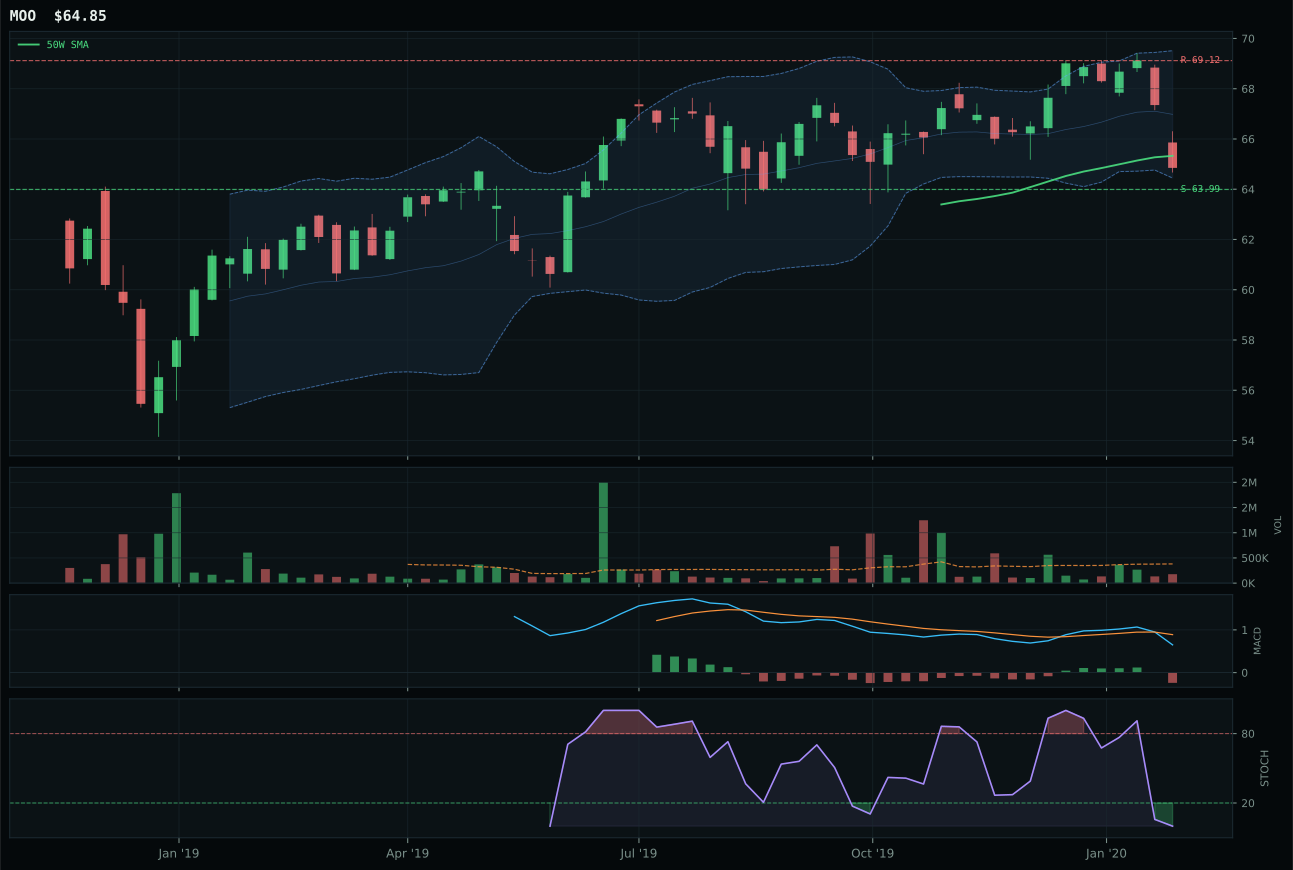
MOO has a pullback into support profile with -8.6% 13-week relative strength versus SPY.
A failed hold above support would weaken the setup.
Actionable but governed by invalidation levels.
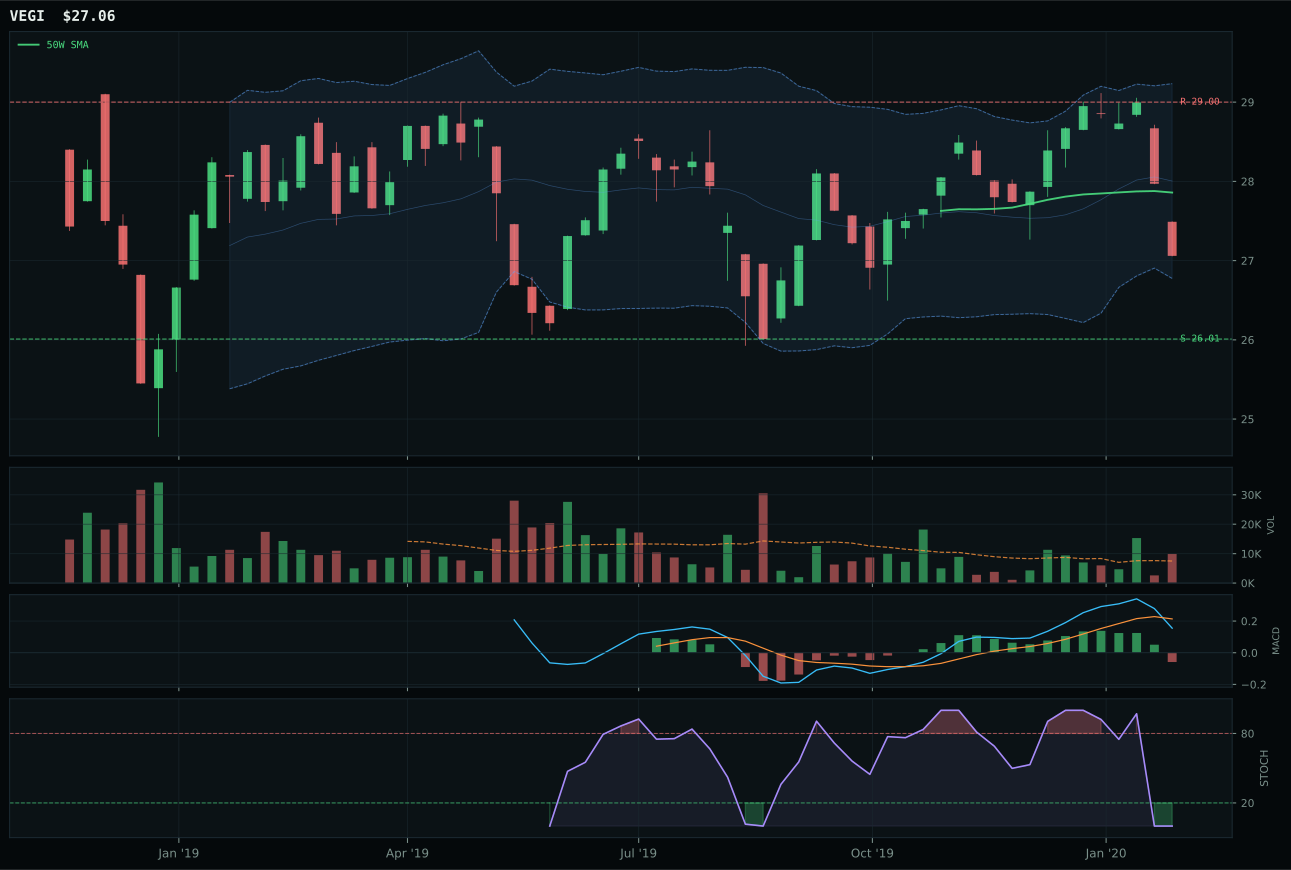
VEGI has a pullback into support profile with -8.6% 13-week relative strength versus SPY.
A failed hold above support would weaken the setup.
Tracked, but not top-2 eligible because: .
MOO wins a dead category entirely on setup quality rather than any technical strength: it sits just -0.7% from the 50W with perfect timing of 100.0 and extraordinary risk/reward of 98.0, offering 1.3% downside risk to support versus 6.2% upside to resistance. WEAT lost because it is stretched 5.0% above the 50W and sits in upper retracement territory, doubling down on entry risk. Yet MOO's victory is hollow: MACD is bearish/weakening, stochastic RSI is deep oversold at 0.00, volume is thin participation at 0.46x average, and thirteen-week returns are -3.5%, worst in the three-ETF basket. This is a coil trade, not a momentum trade—support at 63.99 must hold or the structure invalidates entirely.
Agriculture & Livestock receives 5% allocation as a tier-2 category, ranked third through eighth, though the final category score of 0.0 reflects near-zero conviction. Disinflation pressure is actively negative (-8), and the category's macro/narrative fit is just 32.0, the lowest in the portfolio. MOO's technical evidence is only 10.2/100, dragged down by -8.6% SPY-relative weakness and -3.5% momentum over thirteen weeks. This is neither a growth sleeve nor a defensive sleeve—it is a pure contrarian value coil where buyers have deserted entirely. Allocation is held only to maintain category diversification. For Agriculture to earn genuine consideration above 5%, buyers would need to establish a base with rising volume near support, or macro catalysts (crop supply disruption, currency shifts) would need to shift the narrative from price-decline timing to fundamental scarcity. Without either signal, MOO remains a tactical placeholder.
Industrial Metals — PICK
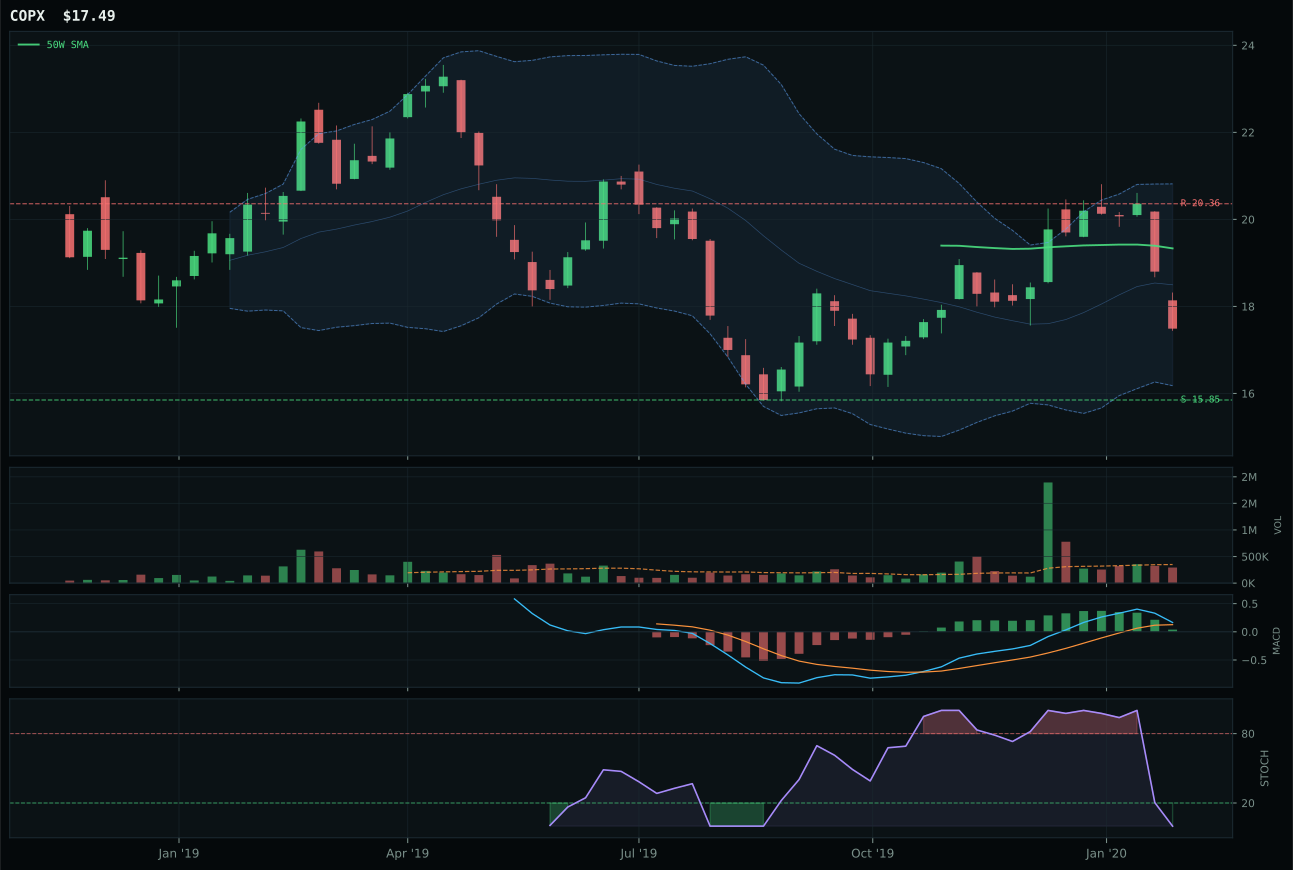
COPX has a neutral structure profile with -7.5% 13-week relative strength versus SPY.
Extension and support failure are the main tactical risks.
Tracked, but not top-2 eligible because: structurally broken.
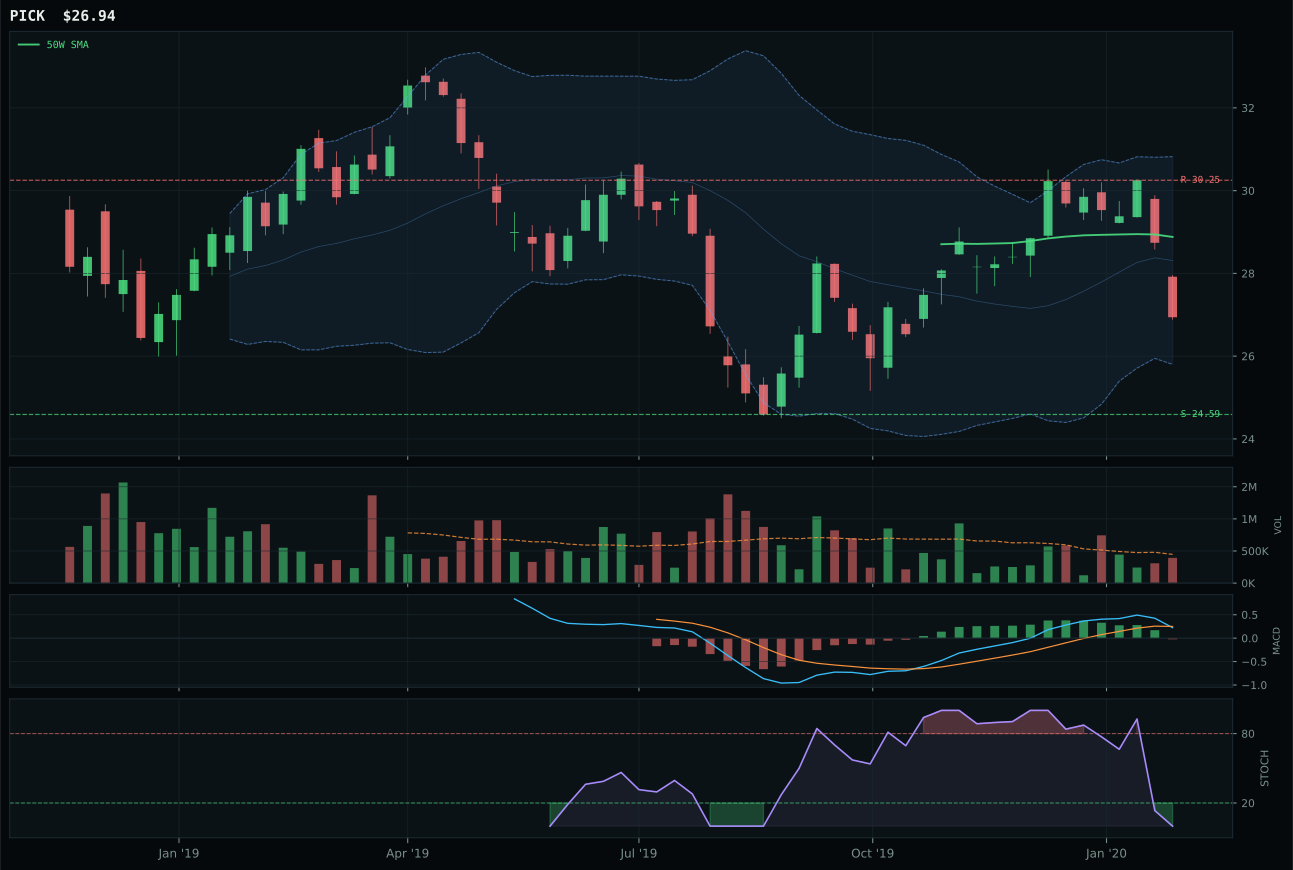
PICK has a neutral structure profile with -9.1% 13-week relative strength versus SPY.
A failed hold above support would weaken the setup.
Actionable but governed by invalidation levels.
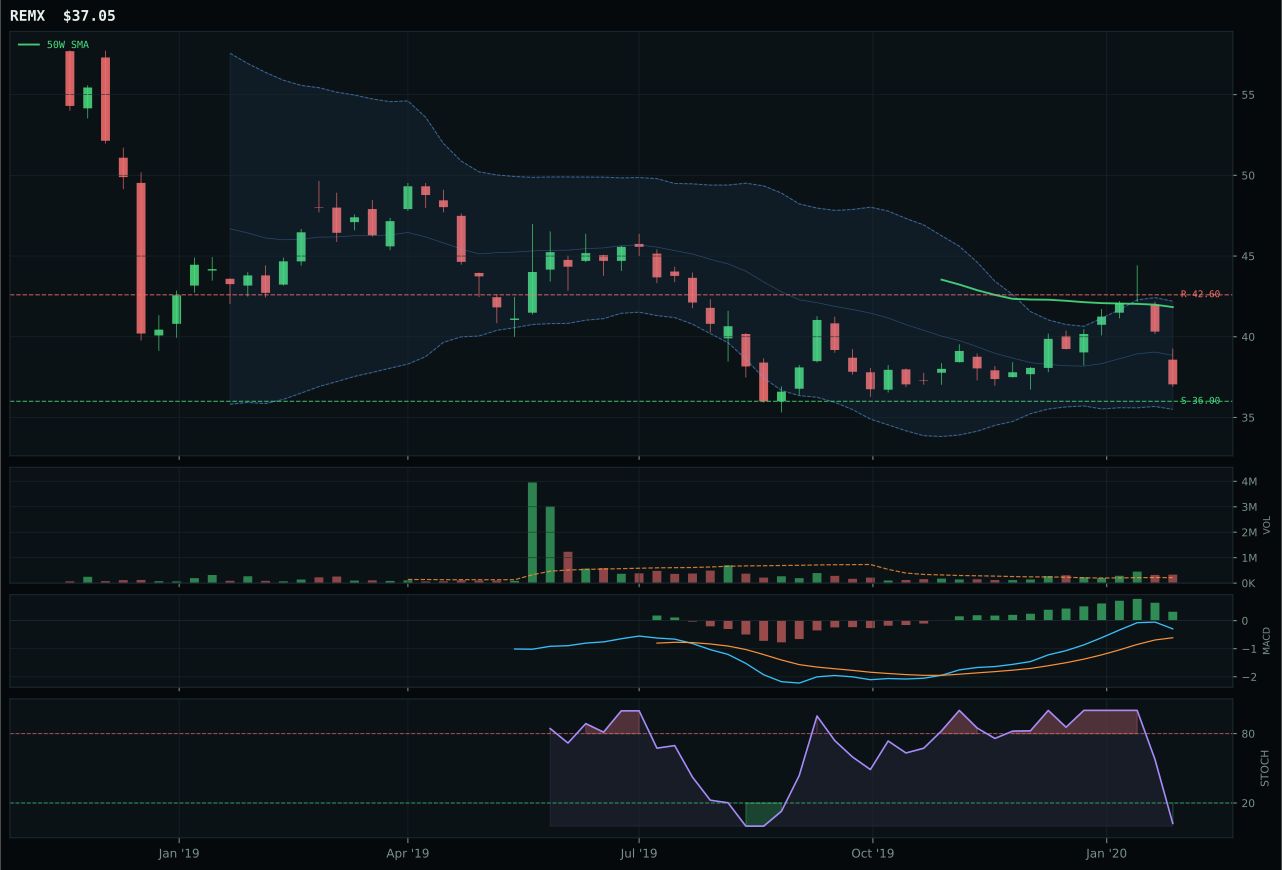
REMX has a pullback into support profile with -7.6% 13-week relative strength versus SPY.
Extension and support failure are the main tactical risks.
Tracked, but not top-2 eligible because: structurally broken.
PICK wins by process of elimination in a structurally broken category: price is below both the 50W and 200W, momentum confirmation is 0.0, and volume-price confirmation is 10.8—effectively no accumulation. Yet PICK's deep retracement at Fib 0.786 near 26.32 and timing score of 70.0 provide at least a defined invalidation zone, where support at 24.59 sits just 9.6% downside away. COPX lost because hard filters flagged it as structurally broken, and its neutral setup structure and neutral volume add no tactical advantage to PICK's coil positioning. This is a category holding its ground on technicals alone: stochastic RSI oversold, MACD bearish/weakening, and four-week returns at -8.8% all scream capitulation, but the risk/reward of 73.6 reflects potential overshooting.
Industrial Metals receives 5% allocation as a tier-2 category, ranked third through eighth, but the category score of 0.0 reflects complete technical breakdown. Liquidity stress (-8) and credit stress (-7) are both active, penalizing cyclical metals by 15 points combined. PICK's technical evidence is 0.0/100, and only macro/narrative fit of 45.0 prevents the category from earning full exclusion. This is a defensive hold—do not add. The category is allocated entirely on the principle that mining bottoms eventually, and given the extreme oversold conditions and 73.6 risk/reward in PICK, the position provides portfolio rebalance opportunity if metals reverse. For Industrial Metals to earn tier-2 demotion out of the 5% sleeve, buyers would need to establish a two-week base above the 50W at 28.50+ with rising volume. Until then, treat PICK as a shadow position awaiting either structure repair or further capitulation.
Traditional Energy — XLE
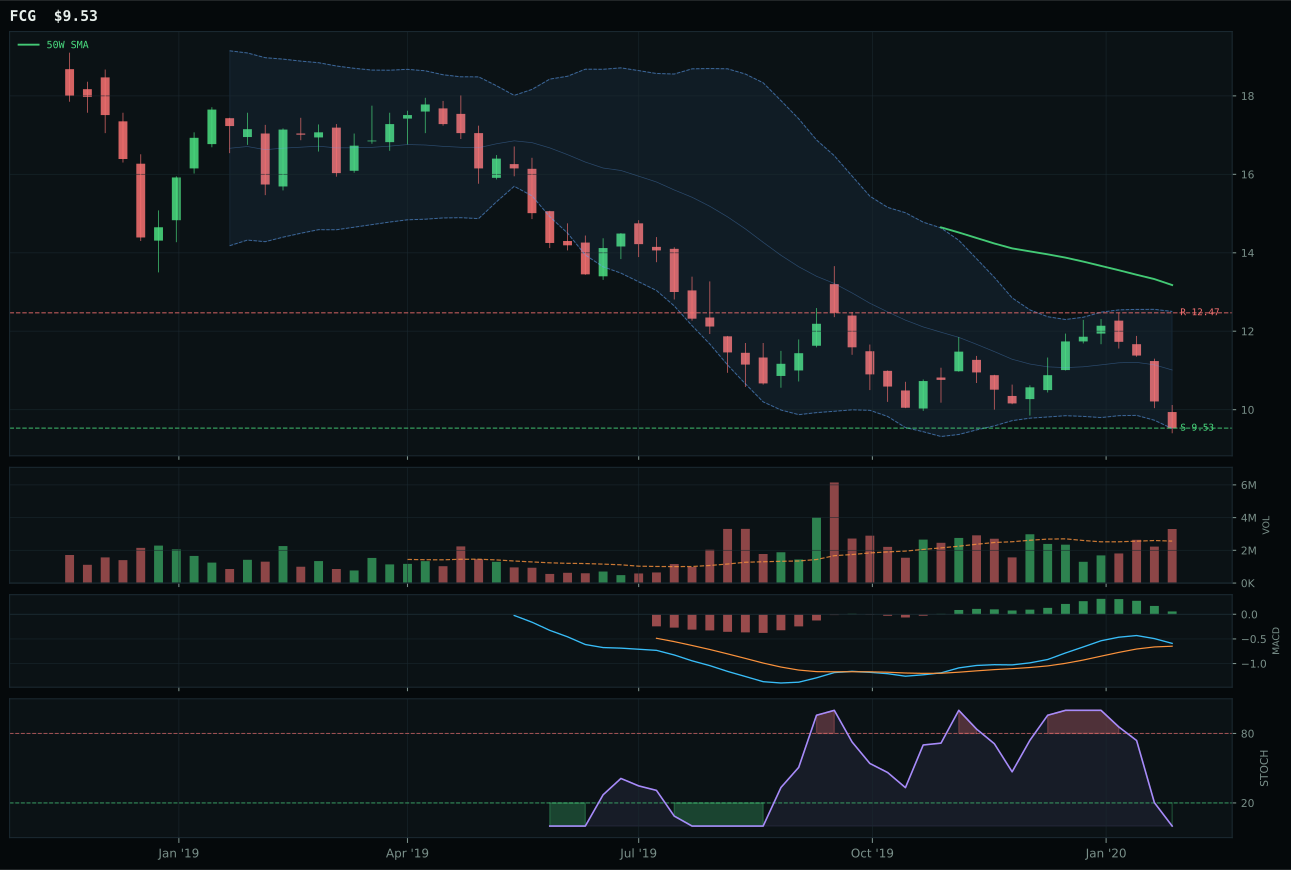
FCG has a pullback into support profile with -16.5% 13-week relative strength versus SPY.
Extension and support failure are the main tactical risks.
Tracked, but not top-2 eligible because: structurally broken.
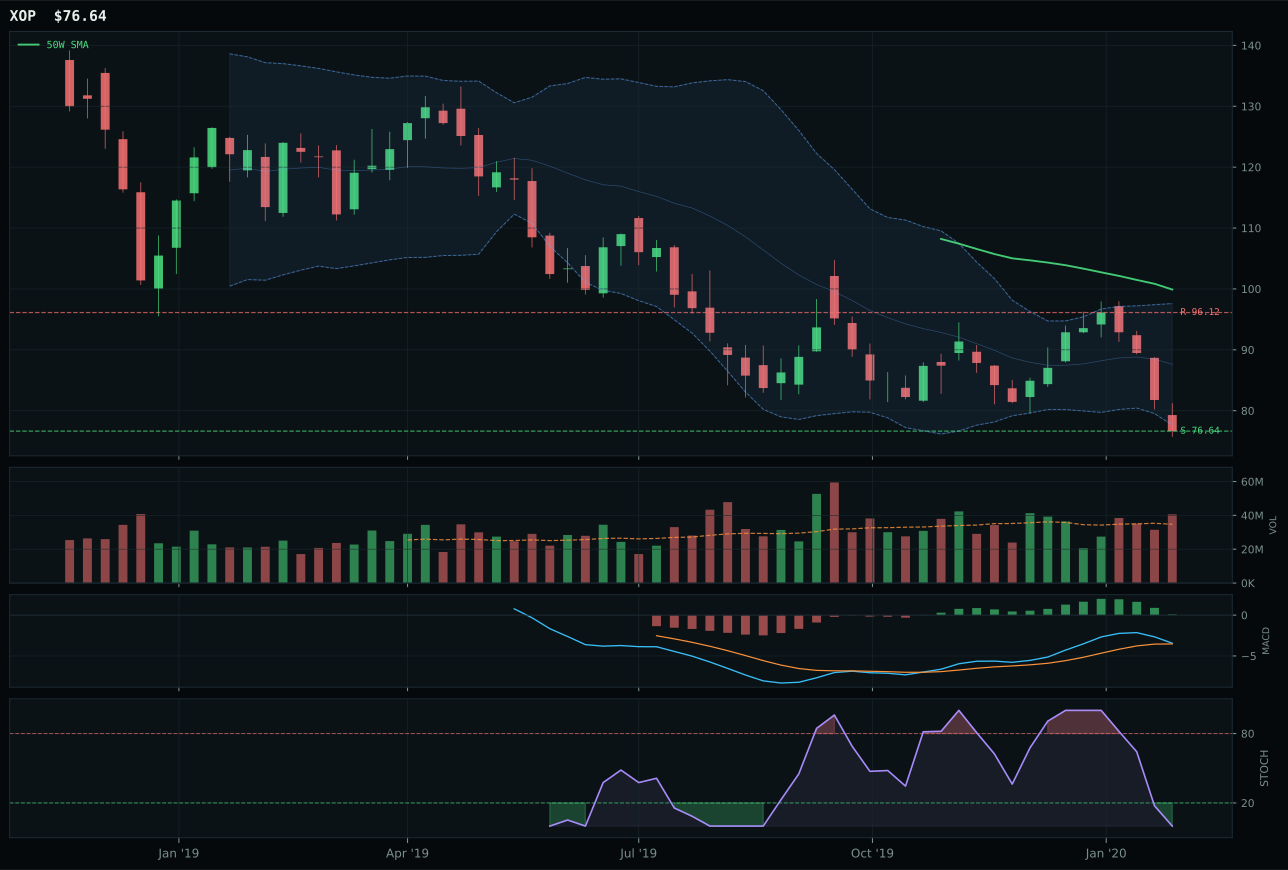
XOP has a pullback into support profile with -17.4% 13-week relative strength versus SPY.
Extension and support failure are the main tactical risks.
Tracked, but not top-2 eligible because: structurally broken.
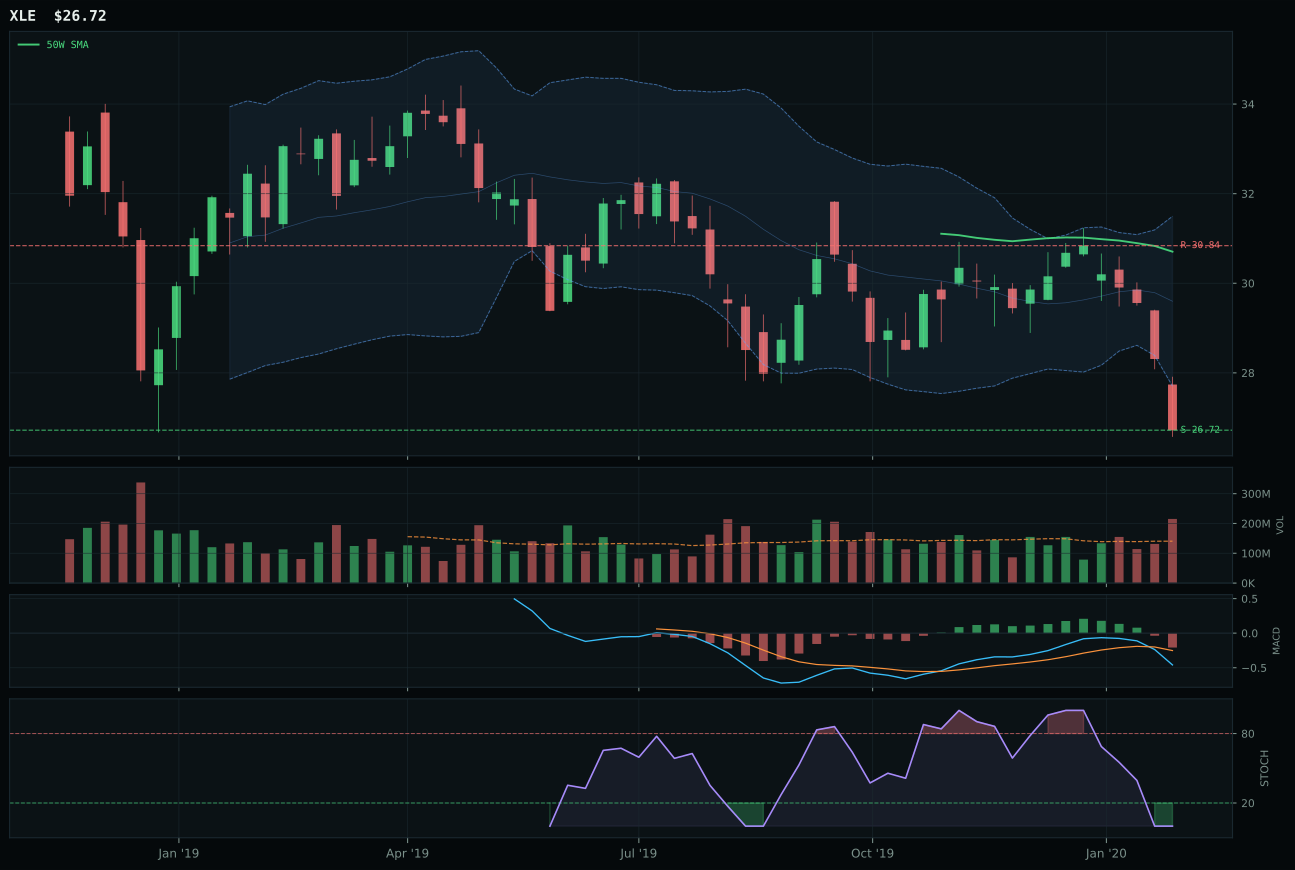
XLE has a pullback into support profile with -14.9% 13-week relative strength versus SPY.
Extension and support failure are the main tactical risks.
Tracked, but not top-2 eligible because: structurally broken.
XLE wins a fully ineligible category because it loses less badly than FCG and XOP: all three are structurally broken, yet XLE's 1.6% category-relative strength versus FCG's 0.0% establishes relative leadership, however hollow. Price is 13.0% below the 50W, below the 200W, with MACD bearish/weakening, stochastic RSI oversold, and crucially, distribution pressure at 1.53x volume indicates capitulation is ongoing rather than complete. Four-week returns of -11.5% and thirteen-week returns of -9.9% show declining price momentum. Yet XLE earned the representative slot because FCG failed hard filter checks for structural repair, and XOP's -17.4% thirteen-week SPY-relative weakness was worst in class. This is a category where no ETF qualifies for allocation; XLE represents the least-damaged choice only.
Traditional Energy receives 5% allocation as a tier-2 category, ranked third through eighth, though the final category score of 0.0 and ineligibility flag reveal this is a forced allocation with zero conviction. Disinflation regime is catastrophic here: -10 macro headwind, active disinflation pressure (-10), credit stress (-7), and liquidity stress (-7) combine for -34 structural penalization. XLE's technical evidence is 0.0/100—below the hard floor for consideration. This allocation exists only because the portfolio framework requires 5% tier-2 capacity and no better candidates materialized. Do not interpret this as energy exposure; interpret it as capital warehoused pending either a macro regime shift (inflation acceleration) or complete structure repair in crude/energy equities. If XLE breaks below support at 26.72, reduce immediately to 0%. If XLE establishes a base near support with three weeks of rising volume, the position may merit fresh entry consideration.
Emerging Markets — INDA
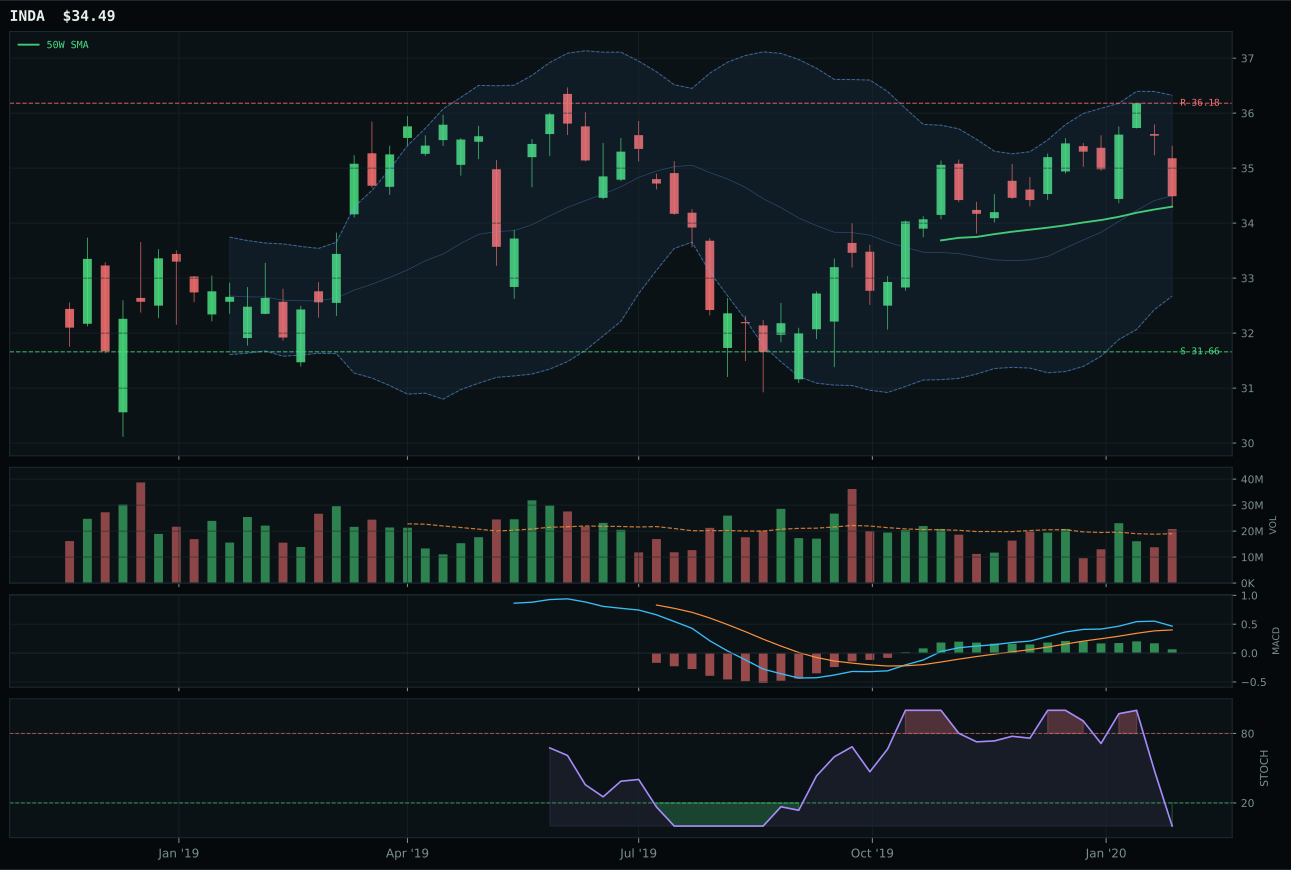
INDA has a compression near 50W profile with -6.7% 13-week relative strength versus SPY.
A failed hold above support would weaken the setup.
Actionable but governed by invalidation levels.
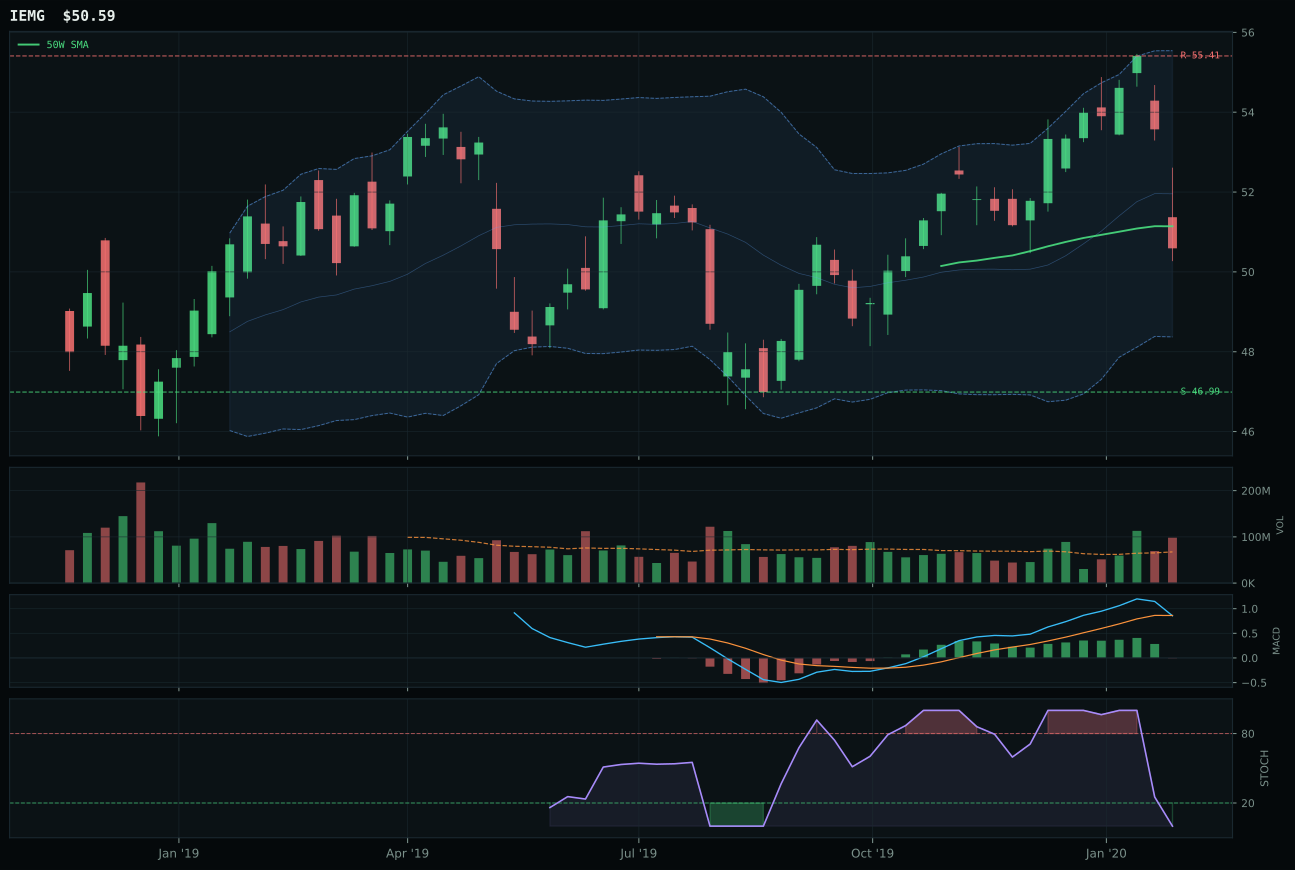
IEMG has a compression near 50W profile with -7.7% 13-week relative strength versus SPY.
A failed hold above support would weaken the setup.
Actionable but governed by invalidation levels.
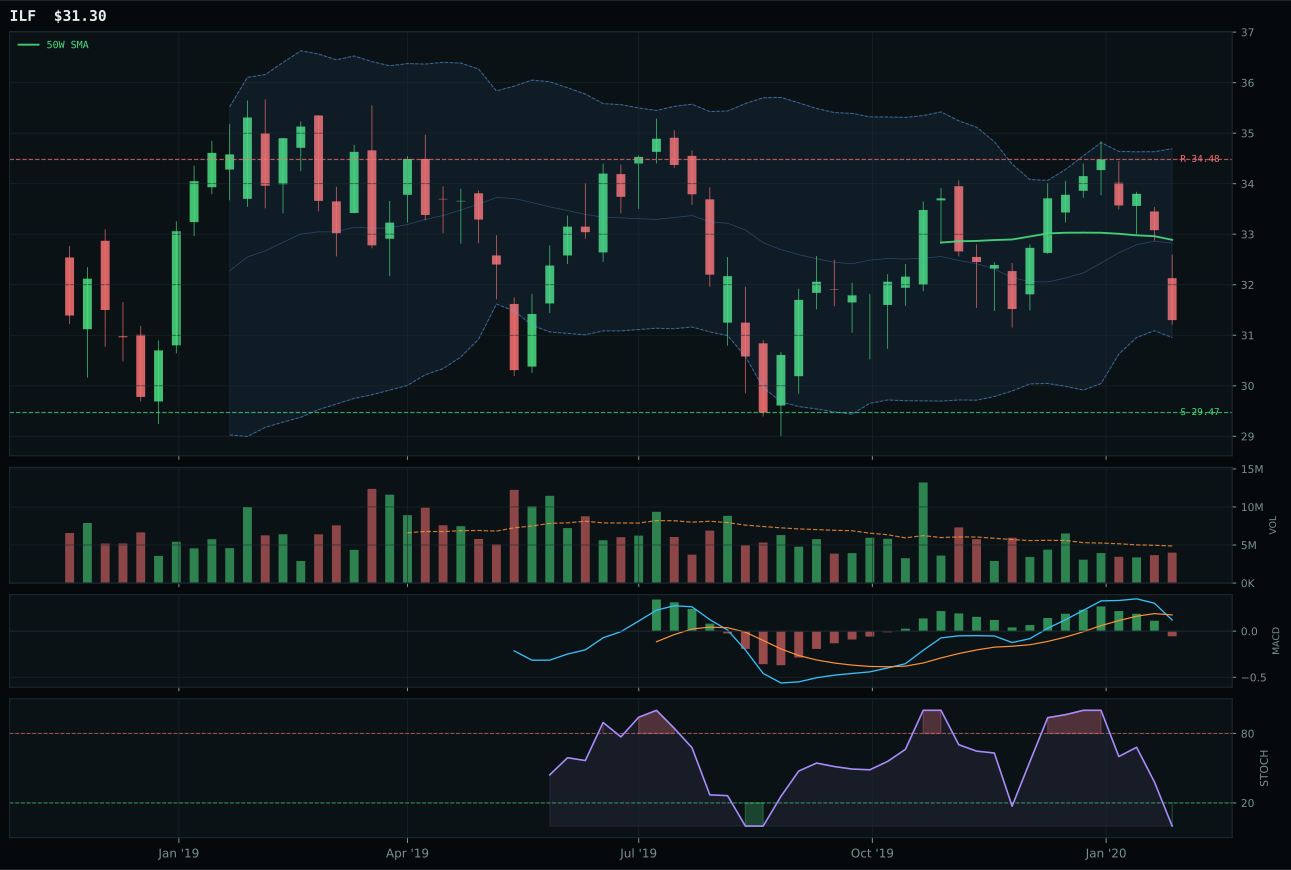
ILF has a neutral structure profile with -12.2% 13-week relative strength versus SPY.
A failed hold above support would weaken the setup.
Actionable but governed by invalidation levels.
INDA wins because it holds 1.0% category-relative strength where IEMG and ILF fall to 0.0% and collapse to -12.2% respectively, a meaningful differential in a weak peer group. Price compresses near the 50W just 0.6% away with timing of 95.0, and stochastic RSI sits oversold at 0.00—classic coil setup. IEMG lost because category-relative strength lagged at 0.0%, and while its 100.0 timing score matches INDA's upper hand, IEMG's volume participation at above-average doesn't confirm buying pressure as cleanly. Thirteen-week returns are -1.6%, a mild decline showing buyers have defended the level. Structure is compression near the 50W at 73.5 cleanliness, but persistence of just 58.5 reveals the move is fragile rather than anchored.
Emerging Markets receives 0% allocation and is excluded from the portfolio this week, ranked 9th or 10th among all categories. The final category score of 16.6 reflects weak macro support and insufficient technical conviction. Credit stress (-10) and liquidity stress (-10) combine to penalize this category by 20 points, and macro/narrative fit is just 30.0—the portfolio's poorest fit to the disinflation regime. INDA's 67.5 technical evidence would normally support tier-2 standing, yet the category reasoner's hard filters assessed persistence at 58.5 and determined that compression near the 50W lacks sponsor footprint to hold. For Emerging Markets to earn 5% allocation, two conditions must align: credit stress must deactivate or swing positive, and INDA must break above the 50W with confirmed volume participation rising to 1.2x+ average, signaling institutional buyers rather than trapped longs. Without both, the category remains outside.
Nuclear Energy — NLR
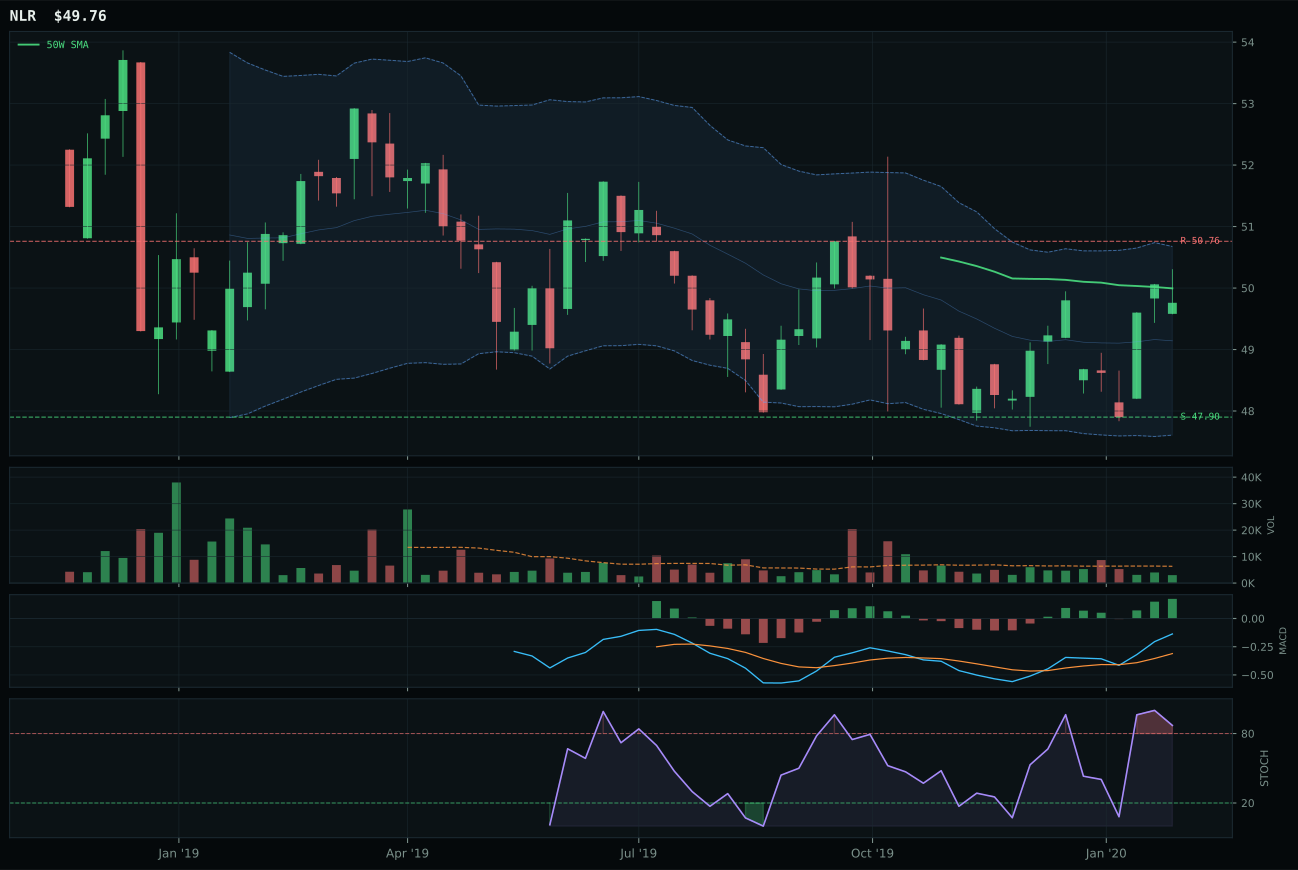
NLR has a pullback into support profile with -3.7% 13-week relative strength versus SPY.
A failed hold above support would weaken the setup.
Tracked, but not top-2 eligible because: .
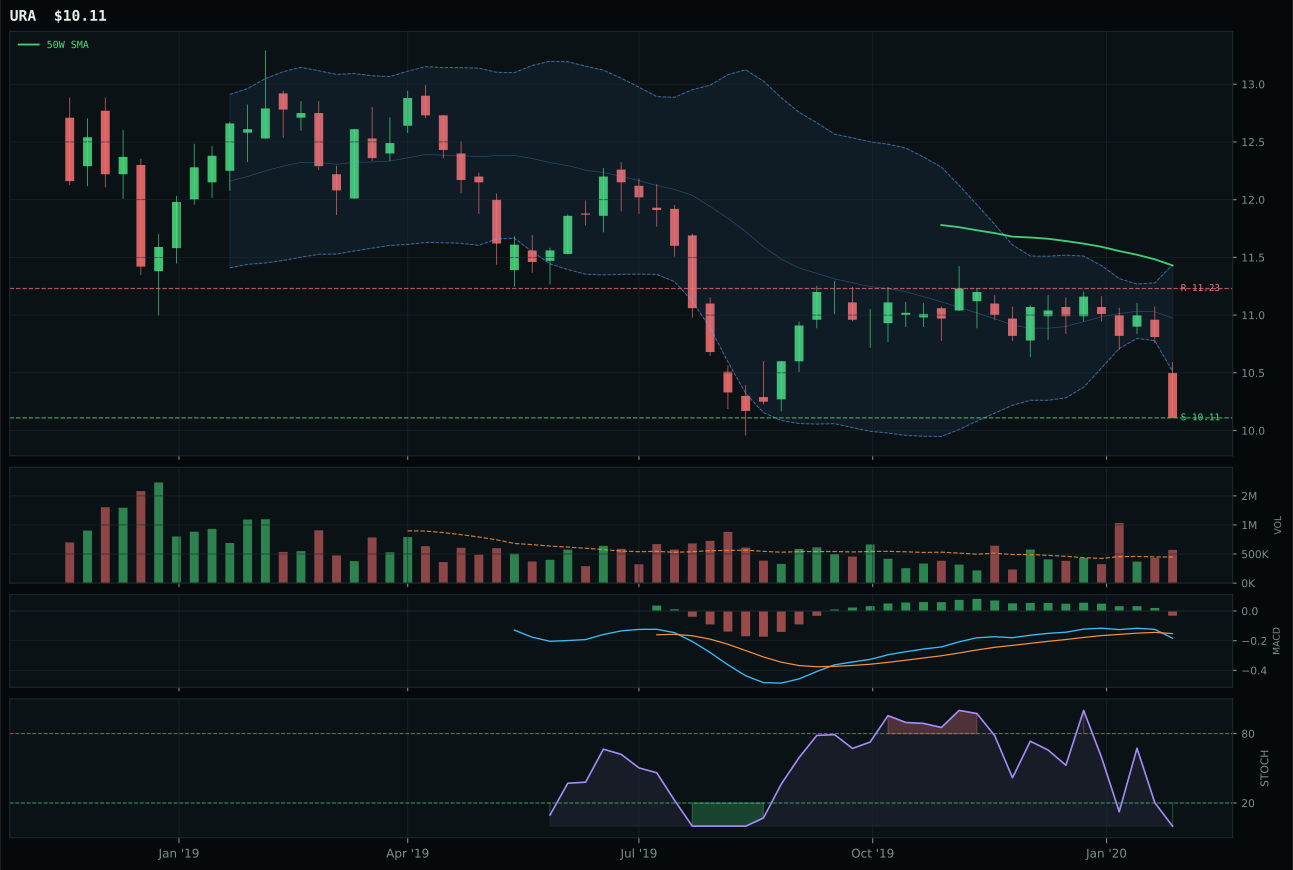
URA has a pullback into support profile with -12.9% 13-week relative strength versus SPY.
Extension and support failure are the main tactical risks.
Tracked, but not top-2 eligible because: structurally broken.
NLR wins a 0%-allocation category because its 100.0 timing score—driven by price sitting -0.5% from the 50W near the Fib 0.618 zone—creates a defined decision point despite structural weakness. Stochastic RSI reaches overbought momentum at 0.87 while MACD remains bullish and improving, a bullish divergence in a oversold chart that hints at base formation. URA lost because MACD shifted bearish/weakening, timing collapsed to 60.0, and hard filters flagged structural breakage. Price sits just 3.9% from support at 47.90, making the downside risk contained. Yet category-relative strength is only 4.6% over thirteen weeks, and momentum confirmation at 63.1 reflects mostly timing rather than volume conviction. Volume participation is thin at 0.47x average.
Nuclear Energy receives 0% allocation and is excluded from the portfolio this week, ranked 9th or 10th among all categories. The final category score of 3.8 reflects ineligibility triggered by hard filters: neither NLR nor URA cleared technical sufficiency thresholds despite NLR's clean timing setup. Credit stress (-5) and liquidity stress (-7) both penalize this category, and macro/narrative fit is just 38.0, well below the portfolio baseline. NLR's 45.0 technical evidence and 56.0 macro/narrative fit would ordinarily support tier-2 consideration, yet the category reasoner's hard filters—testing leadership, volume-price sponsorship, persistence, timing, and risk/reward in aggregate—rejected the basket. For Nuclear to earn re-entry at 5% tier-2 or higher, NLR would need to establish sustained accumulation above the 50W with volume expanding to 0.75x+ average. Until then, this category remains outside the allocation entirely.