
2020-01-24
Informational purposes only. The content in this report, including allocations, analysis, and commentary, is provided solely for informational and educational purposes. It does not constitute financial advice, investment advice, trading advice, or any other type of advice. Past performance does not guarantee future results. Always conduct your own research and consult a qualified financial professional before making investment decisions.
Some tracked tickers were excluded due to missing live weekly price data: SGOV: Historical cache SGOV has only 0 usable weekly bars; URNM: Historical cache URNM has only 8 usable weekly bars
Weekly Allocation
| Ticker | Category | Weight | Role |
|---|---|---|---|
| FBTC | 50% | Overlay | |
| IGV | Technology | 10% | Top-2 (10%) |
| XLU | Utilities & Infrastructure | 10% | Top-2 (10%) |
| GLD | Precious Metals | 5% | Tier-2 (5%) |
| XAR | Defense & Aerospace | 5% | Tier-2 (5%) |
| SMH | AI | 5% | Tier-2 (5%) |
| PICK | Industrial Metals | 5% | Tier-2 (5%) |
| INDA | Emerging Markets | 5% | Tier-2 (5%) |
| XLE | Traditional Energy | 5% | Tier-2 (5%) |
Trade Instructions — Monday Open
Sell the tranche from 5 weeks ago (completing its 4-week hold). Buy the new tranche. Instructions show net portfolio changes — same-asset positions cancel, weight changes show the delta.
| Action | Ticker | Instruction |
|---|---|---|
| BUY | SMH | Buy SMH — 1.25% of freed cash (adds 1.25% to portfolio) |
| BUY | XAR | Buy XAR — 1.25% of freed cash (adds 1.25% to portfolio) |
| BUY | GLD | Buy GLD — 1.25% of freed cash (adds 1.25% to portfolio) |
| BUY | PICK | Buy PICK — 1.25% of freed cash (adds 1.25% to portfolio) |
| BUY | IGV | Buy IGV — 2.50% of freed cash (adds 2.50% to portfolio) |
| BUY | XLU | Buy XLU — 2.50% of freed cash (adds 2.50% to portfolio) |
| BUY | FBTC | Buy FBTC — 12.50% of freed cash (adds 12.50% to portfolio) |
| BUY | INDA | Buy INDA — 1.25% of freed cash (adds 1.25% to portfolio) |
| BUY | XLE | Buy XLE — 1.25% of freed cash (adds 1.25% to portfolio) |
Current Portfolio After Trade
Combined holdings across all 4 active tranches. Each tranche is 25% of the portfolio.
| Ticker | % of Portfolio | Weight Bar |
|---|---|---|
| FBTC | 25.00% | |
| IGV | 10.00% | |
| IEMG | 7.50% | |
| XAR | 7.50% | |
| GLD | 7.50% | |
| PICK | 7.50% | |
| SMH | 6.25% | |
| MOO | 6.25% | |
| XLU | 6.25% | |
| ILF | 5.00% | |
| XLK | 5.00% | |
| IGF | 2.50% | |
| BOTZ | 1.25% | |
| INDA | 1.25% | |
| XLE | 1.25% |
Macro Regime — Disinflation
Macro Evidence Charts
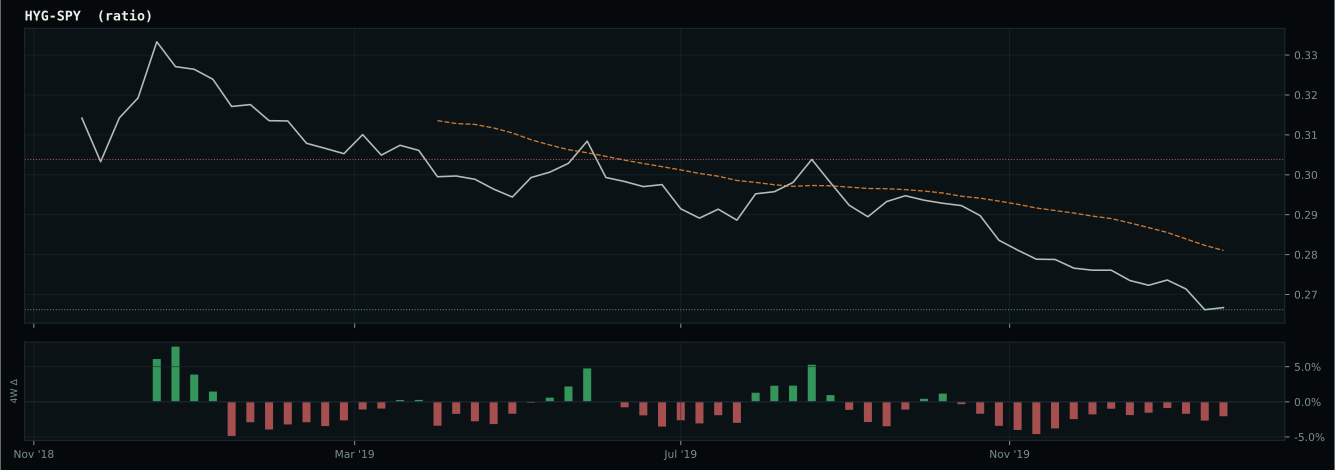
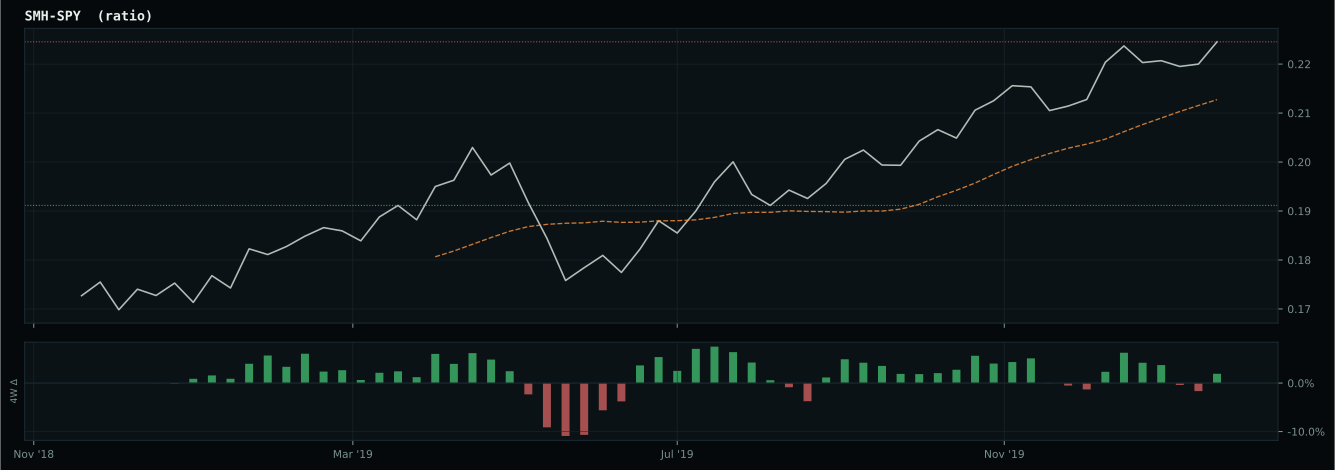
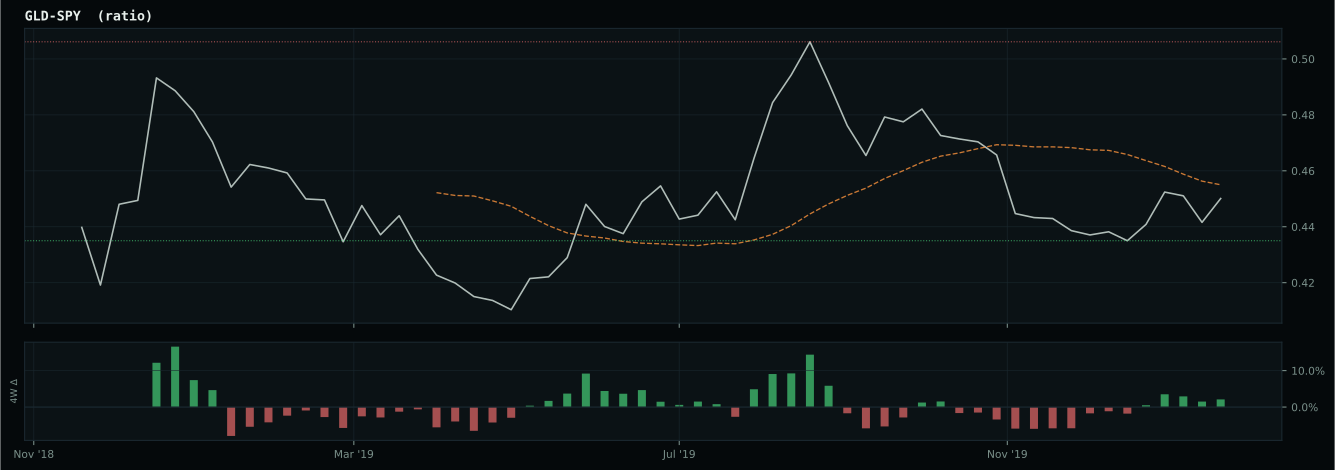
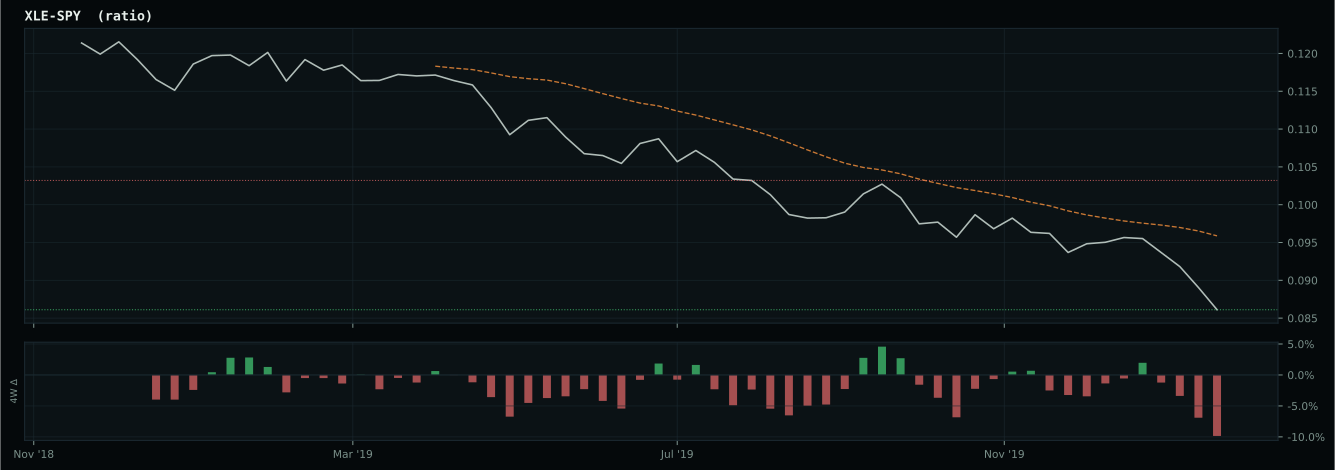
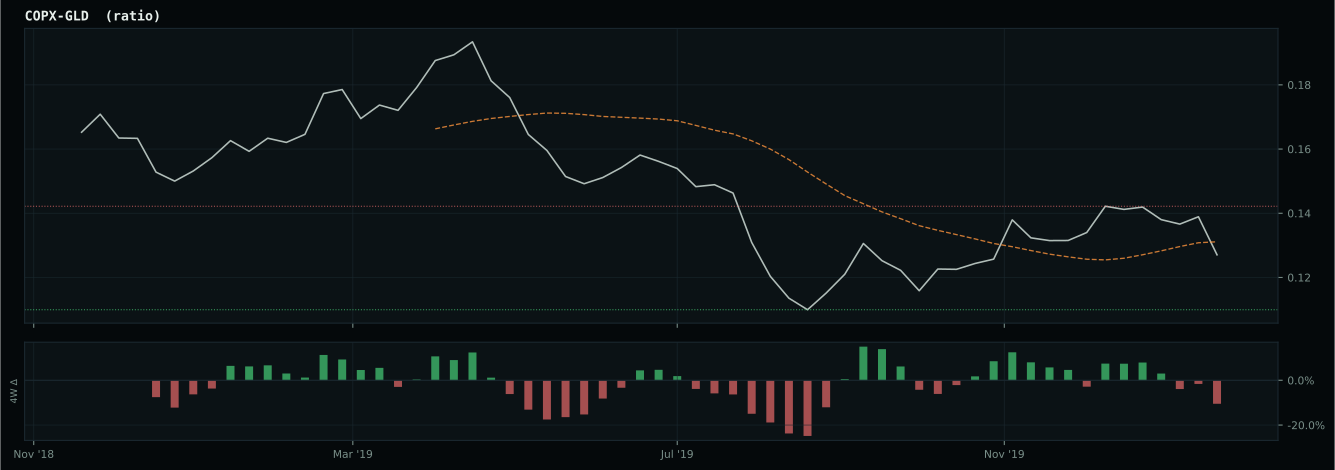
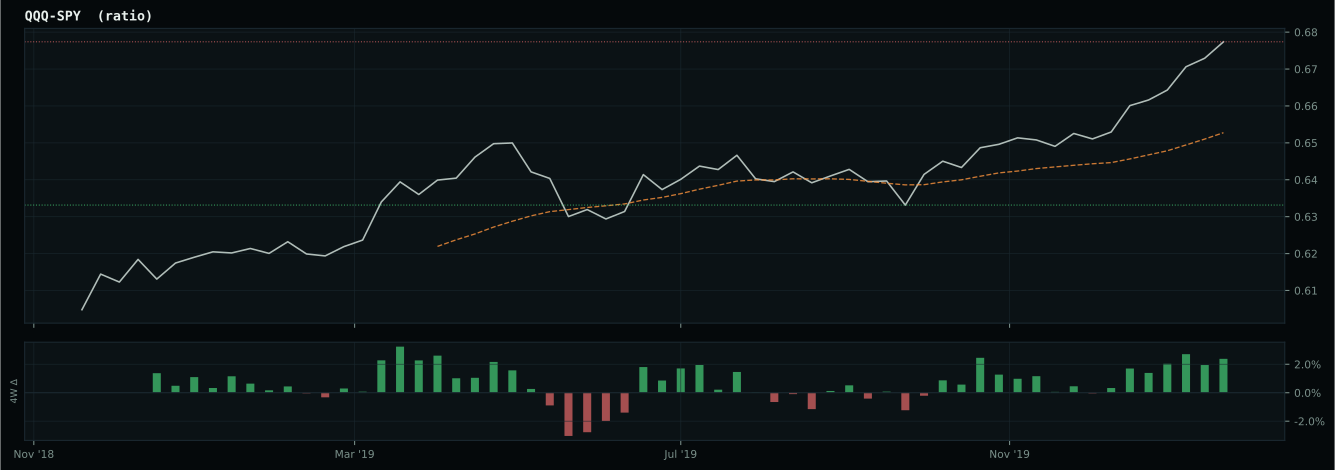
Market-implied signals behind the macro regime scores. Each ratio compares two assets; the direction and slope of the ratio is what the macro engine reads.
Crypto Regime — TrendBTC
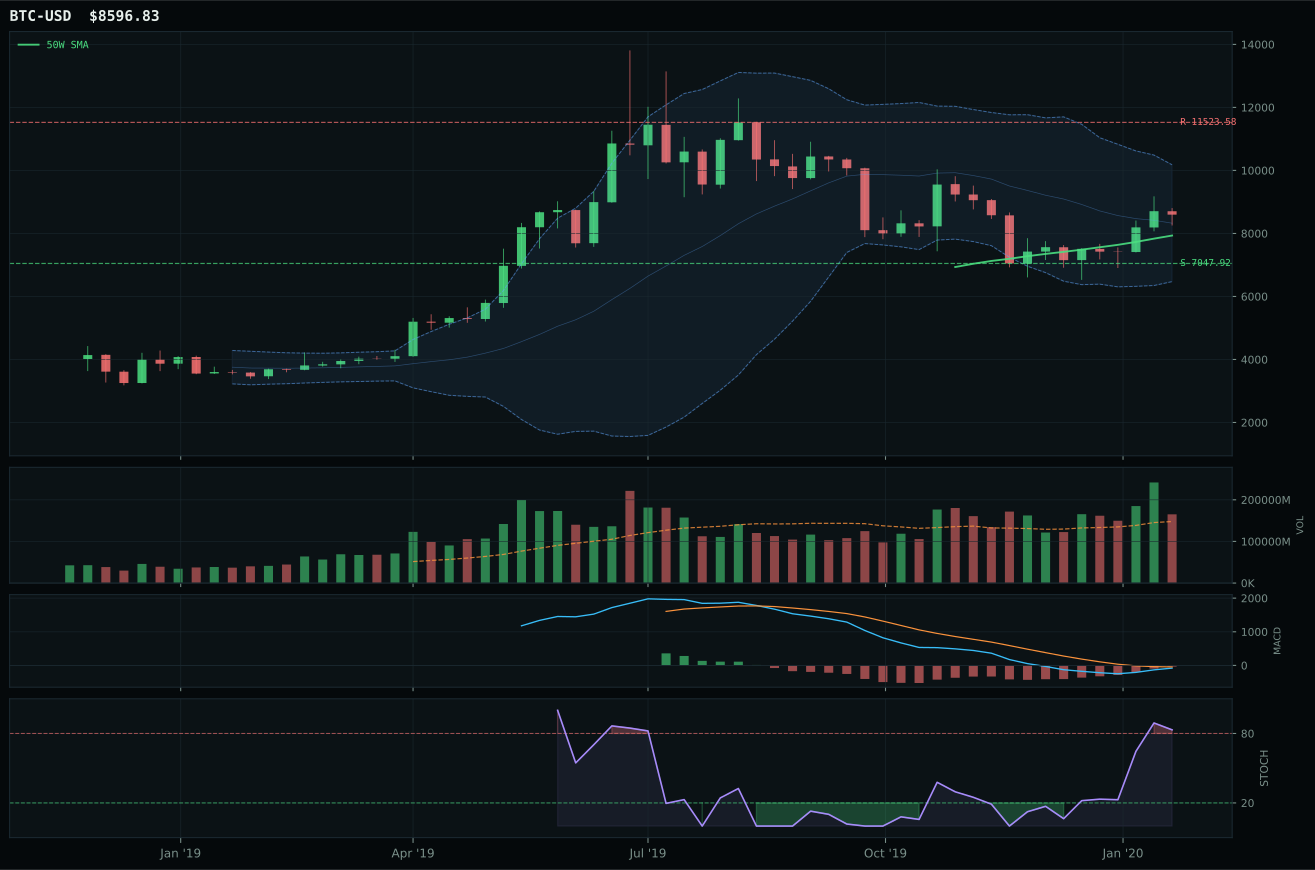
post-touch structure is too wide to count as a range; max/min close ratio is 3.54
TrendBTC confirmed: 2 consecutive closes above rising/flat 50W SMA
one or more available conditions failed

Category Rankings
| Rank | Category | Winner | Score | Alloc | 4W Ret | Peers (4W) |
|---|---|---|---|---|---|---|
| 1 | Technology | IGV | 70.4 | 20% | +1.06% | XLK -0.5% · CIBR -2.0% |
| 2 | Utilities & Infrastructure | XLU | 56.7 | 20% | +2.50% | IGF -0.1% · PAVE -1.7% |
| 3 | Precious Metals | GLD | 54.2 | 10% | +6.20% | SLV +3.1% · GDX +7.2% |
| 4 | Defense & Aerospace | XAR | 50.5 | 10% | -0.41% | ITA -0.7% · ROKT +0.0% |
| 5 | AI | SMH | 49.3 | 10% | -2.86% | BOTZ -2.3% · AIQ -0.1% |
| 6 | Industrial Metals | PICK | 30.7 | 10% | -7.81% | REMX -5.5% · COPX -6.7% |
| 7 | Emerging Markets | INDA | 28.1 | 10% | -3.84% | IEMG -3.2% · ILF -7.4% |
| 8 | Nuclear Energy | NLR | 25.9 | 10% | +3.05% | URA -1.0% |
| 9 | Agriculture & Livestock | MOO | 15.1 | 0% | -2.78% | WEAT -2.8% · VEGI -0.8% |
| 10 | Traditional Energy | XLE | — | 0% | -6.09% | FCG -10.7% · XOP -9.4% |
Technology — IGV
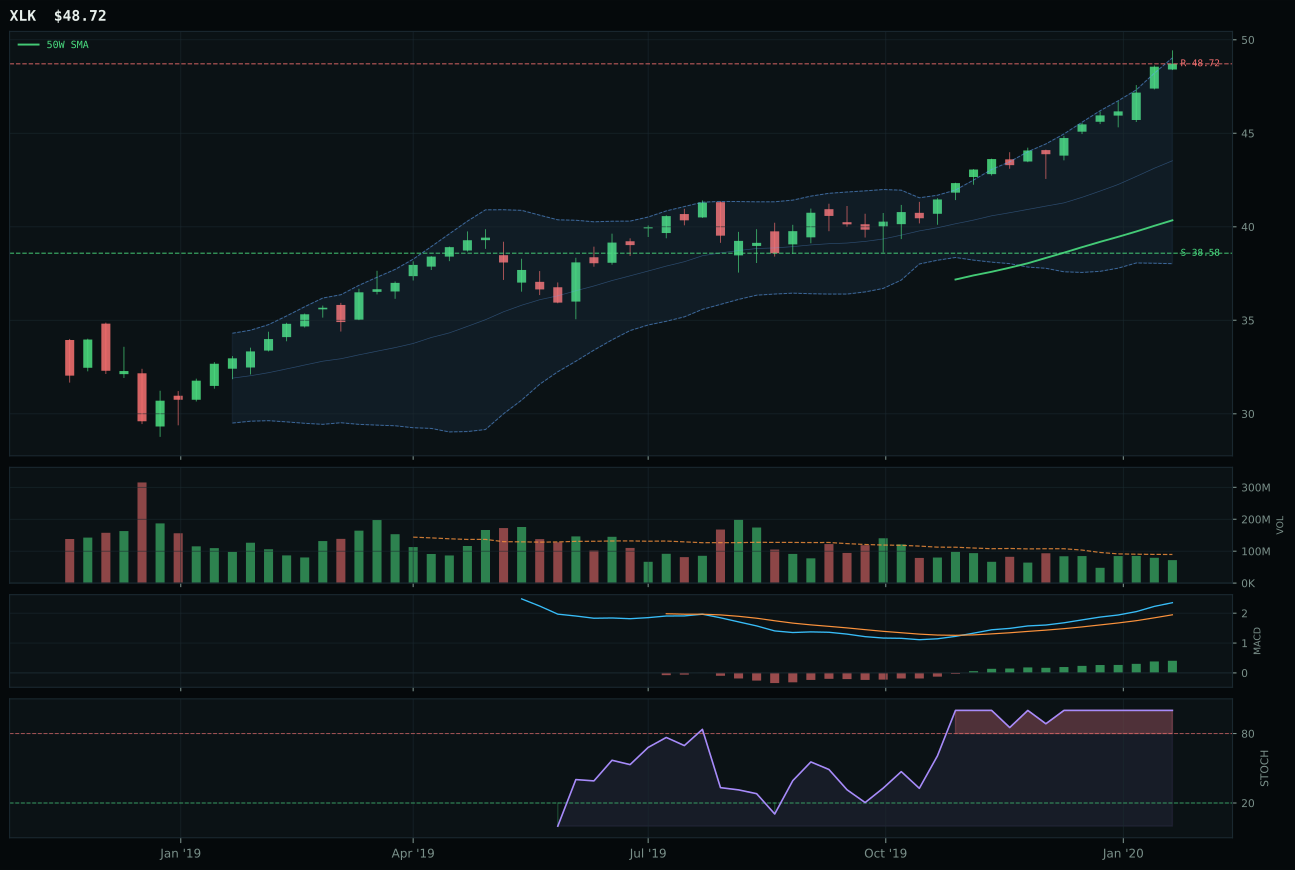
XLK has a vertical extension profile with 8.5% 13-week relative strength versus SPY.
A failed hold above support would weaken the setup.
Actionable but governed by invalidation levels.
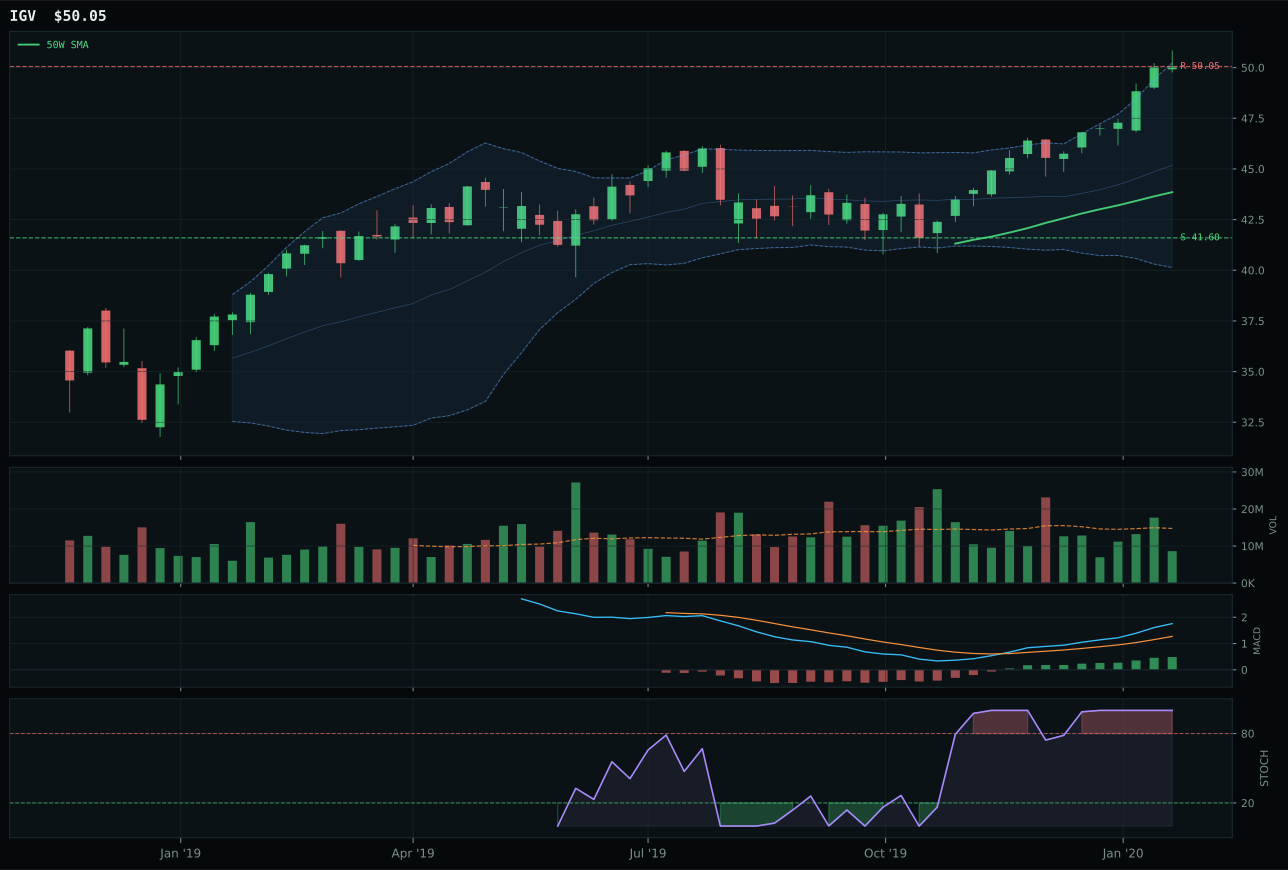
IGV has a neutral structure profile with 9.1% 13-week relative strength versus SPY.
A failed hold above support would weaken the setup.
Actionable but governed by invalidation levels.
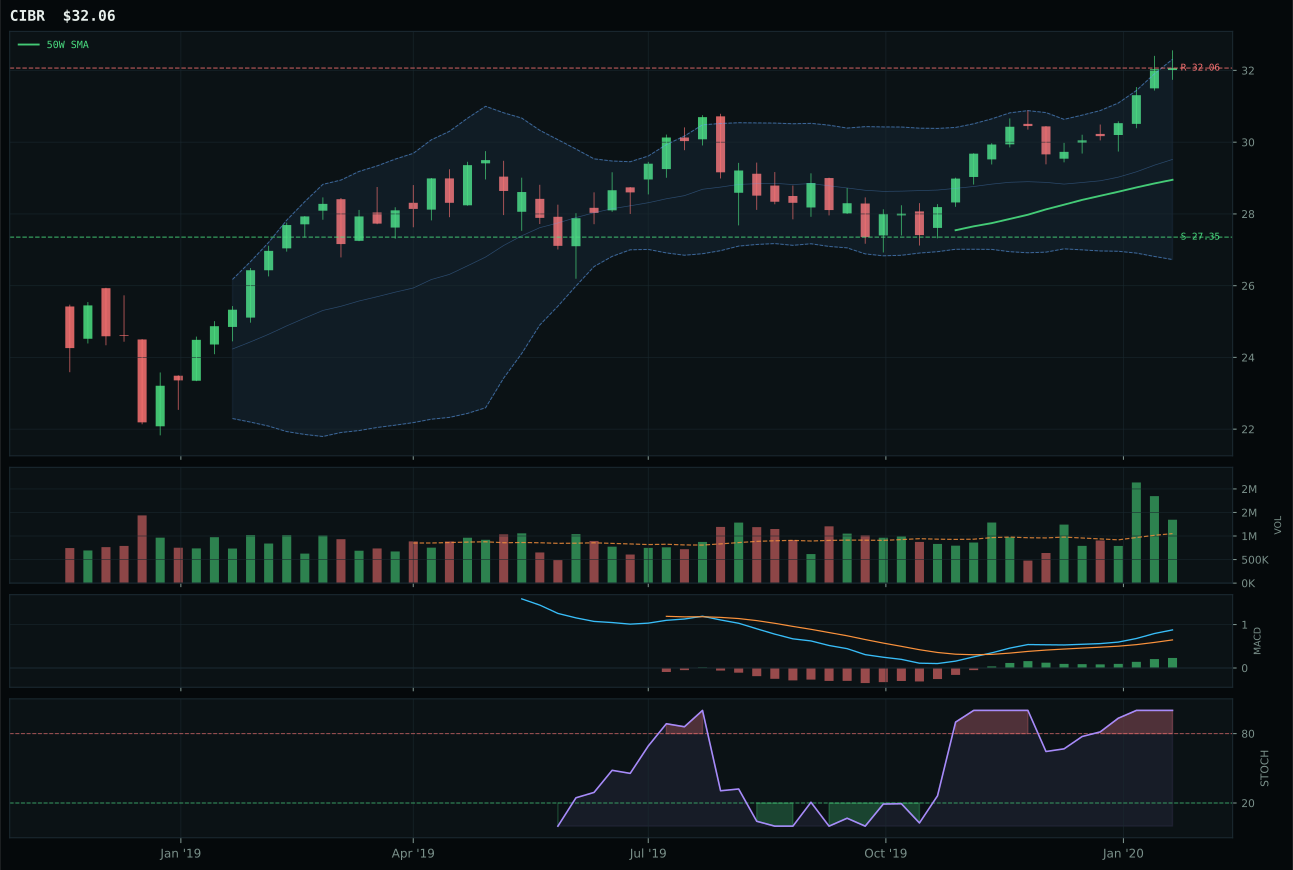
CIBR has a neutral structure profile with 4.7% 13-week relative strength versus SPY.
A failed hold above support would weaken the setup.
Actionable but governed by invalidation levels.
IGV wins on superior timing and risk-asymmetry discipline. While both IGV and XLK sit in confirmed uptrends above their 50W and 200W, IGV's 14.1% extension from the 50W leaves more margin for error than XLK's 20.7% stretch—a critical distinction when stochastic RSI is already overbought at 1.00 across both. IGV's timing score of 59 versus XLK's 37 reflects this positioning advantage: at 14.1% away, buyers still have room to accumulate without chasing a vertical spike. The category-relative strength gap favors IGV at 0.6% versus XLK's flat 0.0%, signaling that enterprise software is capturing share within the tech basket itself. MACD remains bullish and improving for both, but IGV's neutral structure setup and clean 83.9 structural score beat XLK's vertical extension and 83.5 structural weakness. The 10.6-point composite gap between them is not a photo finish—it reflects a meaningful difference in setup quality and entry risk.
Technology earns the top-2 slot at 10% because it sits atop the category rankings with a 70.4 score and offers the highest technical quality in a disinflation regime. Disinflation (+7) and active risk-appetite support (+9) provide tailwinds, though credit stress (-9) and liquidity stress (-8) present real headwinds that keep the macro fit modest at 60.0. The opportunity here is clean: a trend-driven category with overbought momentum but still-forming higher lows, led by a representative (IGV) that has room to extend without invalidating the thesis. AI growth sponsorship (+6) and disinflation pressure (+5) are active descriptors that support duration-sensitive growth assets, making this category's rank justified despite the macro friction. The portfolio needs growth leadership with some defensive characteristics, and Technology delivers both—a bias toward quality earnings multiples benefit from falling real yields in a disinflation backdrop.
Utilities & Infrastructure — XLU
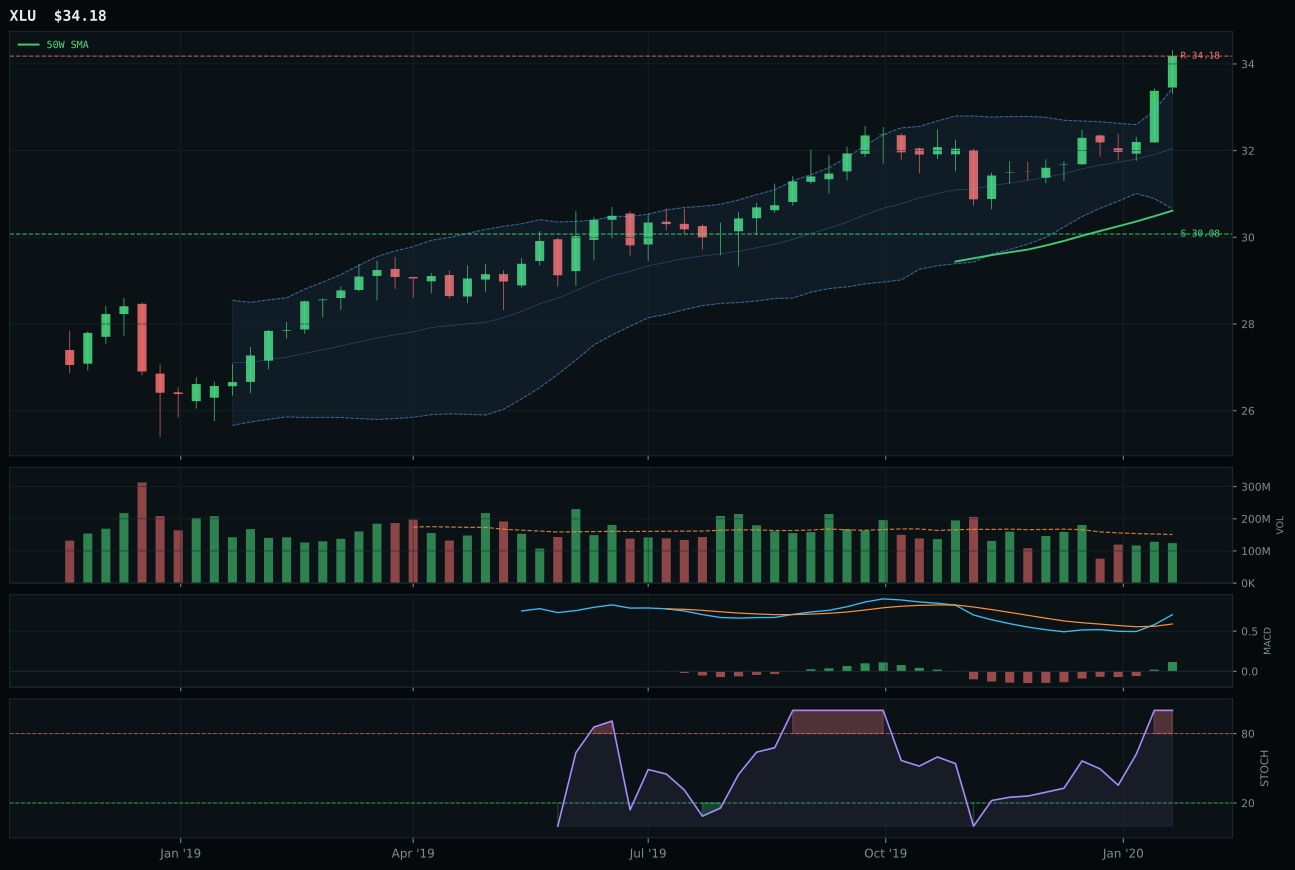
XLU has a neutral structure profile with -2.5% 13-week relative strength versus SPY.
A failed hold above support would weaken the setup.
Actionable but governed by invalidation levels.
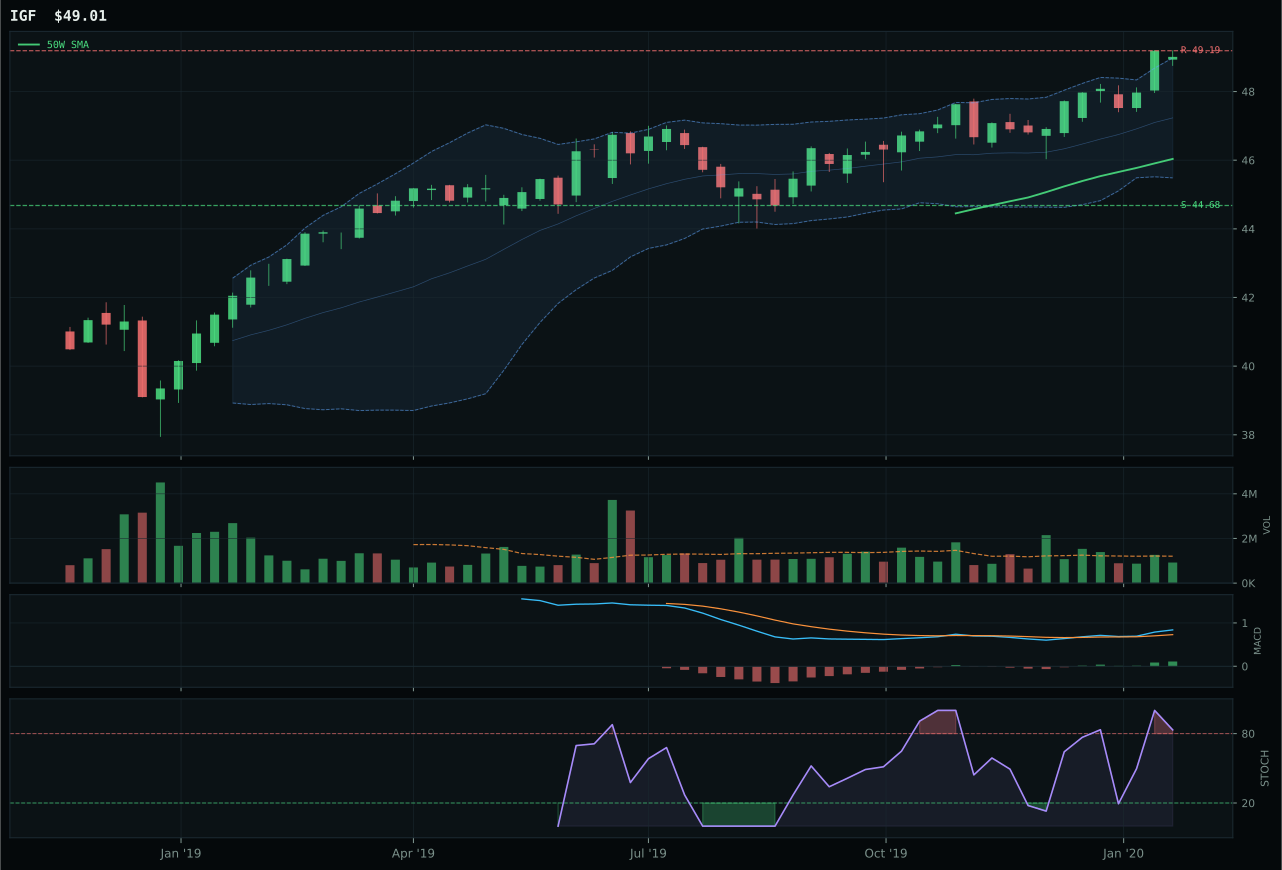
IGF has a neutral structure profile with -4.8% 13-week relative strength versus SPY.
A failed hold above support would weaken the setup.
Actionable but governed by invalidation levels.
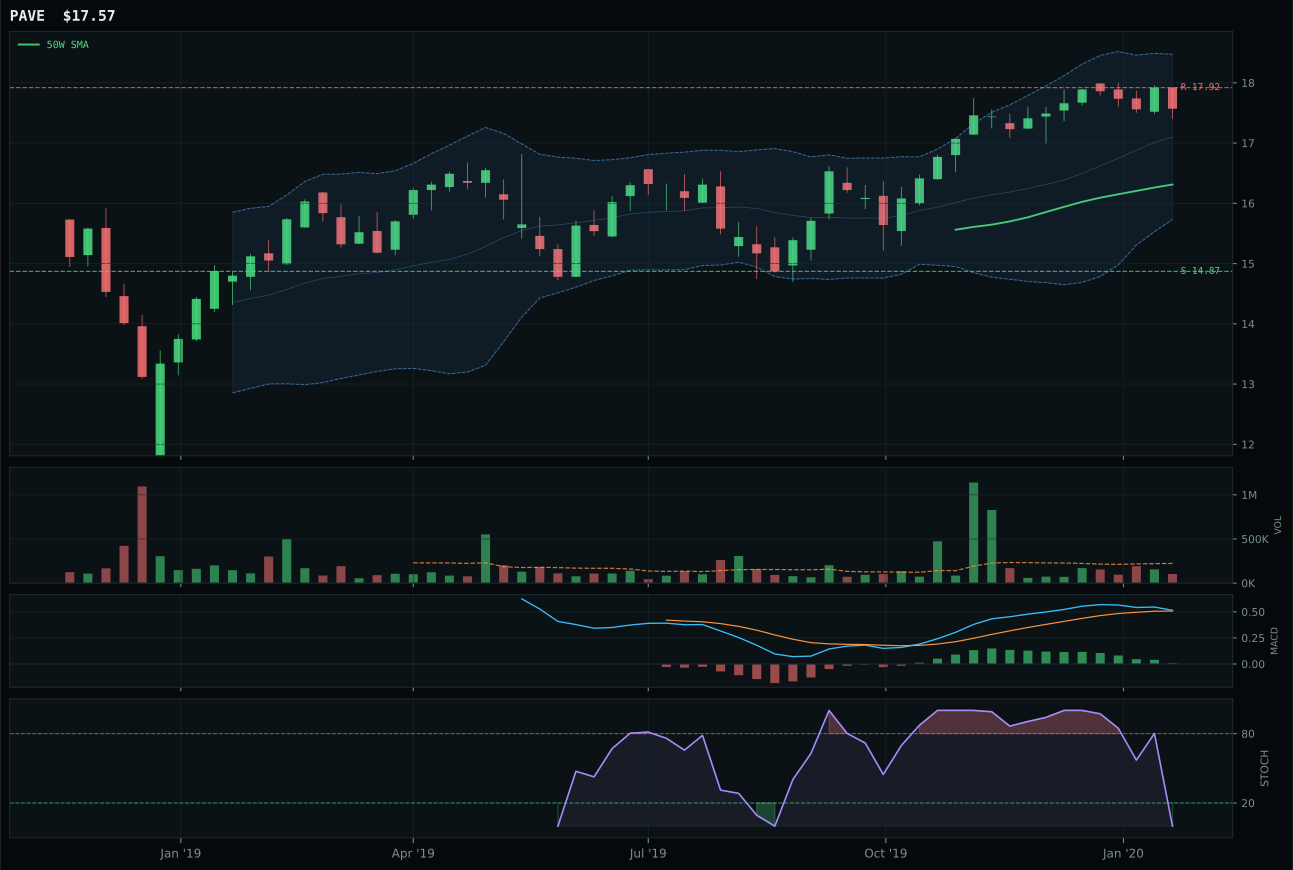
PAVE has a neutral structure profile with -4.2% 13-week relative strength versus SPY.
A failed hold above support would weaken the setup.
Tracked, but not top-2 eligible because: .
XLU takes the top-2 slot with a 3.6-point lead over IGF, a decisive category win driven by superior risk-reward discipline. XLU's 47.5 risk-reward score beats IGF's 37.7 because XLU has tighter downside to support (13.6% vs a wider margin for IGF) while maintaining equivalent upside potential—the asymmetry favors XLU. XLU's trend score is 96.3 versus IGF's 93, and its structure score of 81.2 beats IGF's 76.8, confirming that regulated utilities have a cleaner technical picture than global infrastructure. Category-relative strength is the tiebreaker: XLU at +1.8% shows peer leadership while IGF is -0.6%, confirming utilities are outperforming within the portfolio's diversified infrastructure exposure. Both have MACD bullish and improving, stochastic RSI overbought momentum, and neutral volume participation. The 11.6% distance from the 50W is identical (actually both extended), but XLU's superior structure cleanliness earns the nod for top-2 representation.
Utilities & Infrastructure earns the top-2 slot at 10% because it ranks among the two highest category scores at 56.7 and offers the most attractive risk-adjusted setup in a disinflation regime. The macro fit is strong at 62.0: disinflation helps this exposure (+7), the transition/mixed regime is active (+4), and disinflation pressure (+6) directly supports defensive yield plays like utilities. XLU's 77.0 technical evidence combines strong trend (96), solid momentum (78), and stable volume (70), providing conviction that regulated utilities can extend the rally. Credit stress (-3) and risk appetite sentiment (-2) create modest friction, but the tailwinds from falling real rates in a disinflation backdrop outweigh the headwinds. Portfolio construction benefits from utilities' defensive characteristics: in a lower-rate environment, regulated utilities with contracted cash flows become more valuable, making XLU's 10% allocation appropriate for reducing portfolio volatility while maintaining equity exposure. The top-2 status signals confidence that utilities will continue outperforming in a risk-off disinflation regime, a conviction call on regime persistence.
Precious Metals — GLD
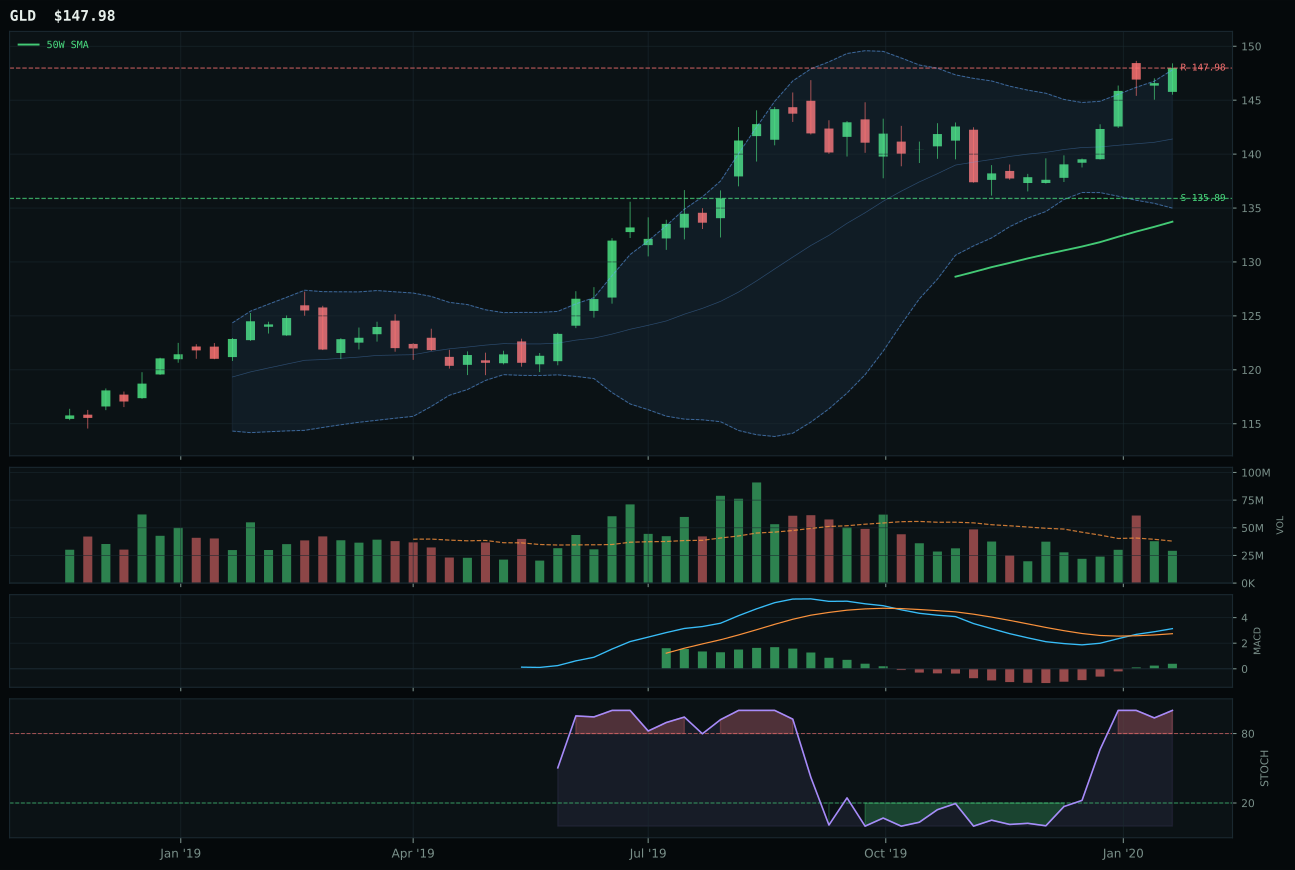
GLD has a neutral structure profile with -4.7% 13-week relative strength versus SPY.
A failed hold above support would weaken the setup.
Actionable but governed by invalidation levels.
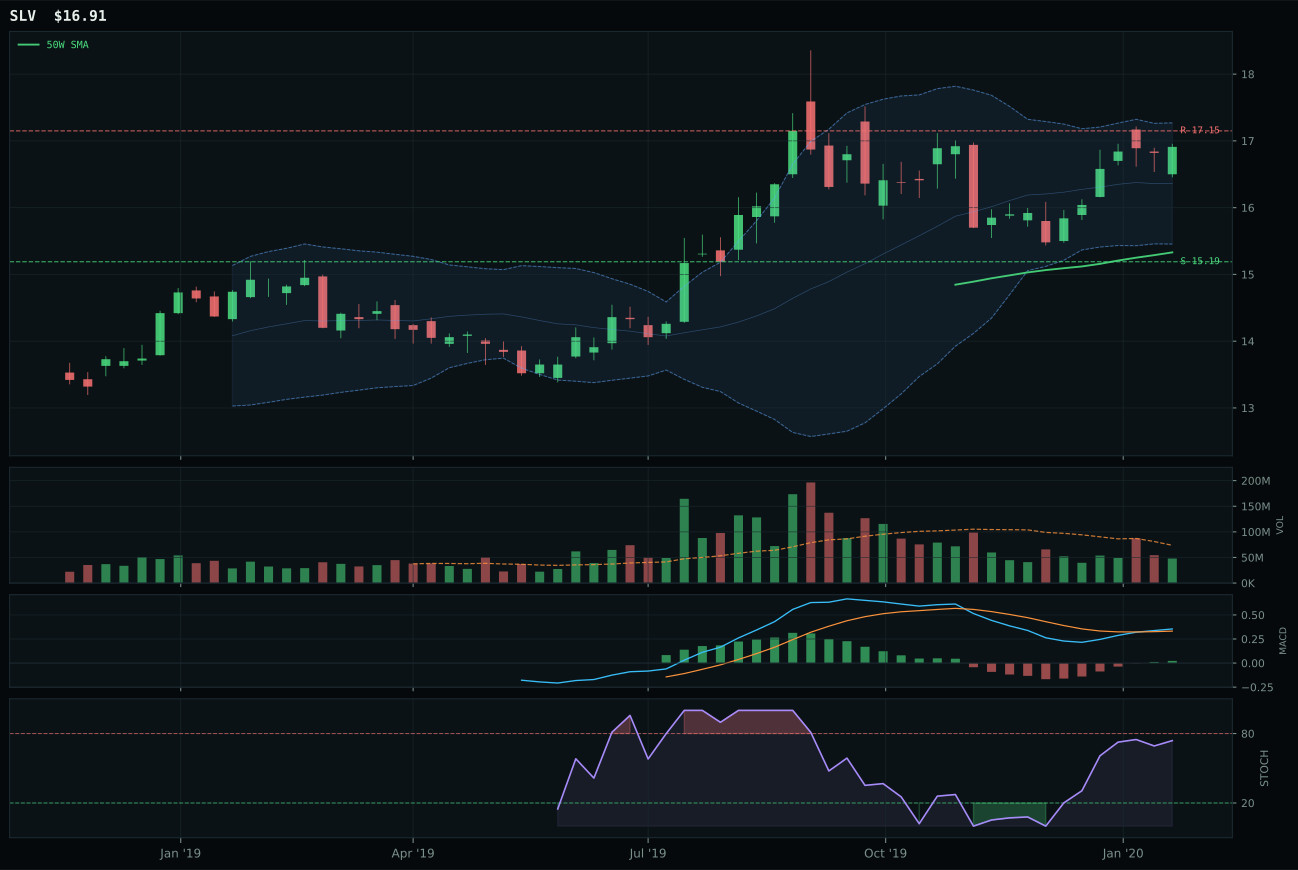
SLV has a neutral structure profile with -8.9% 13-week relative strength versus SPY.
A failed hold above support would weaken the setup.
Actionable but governed by invalidation levels.
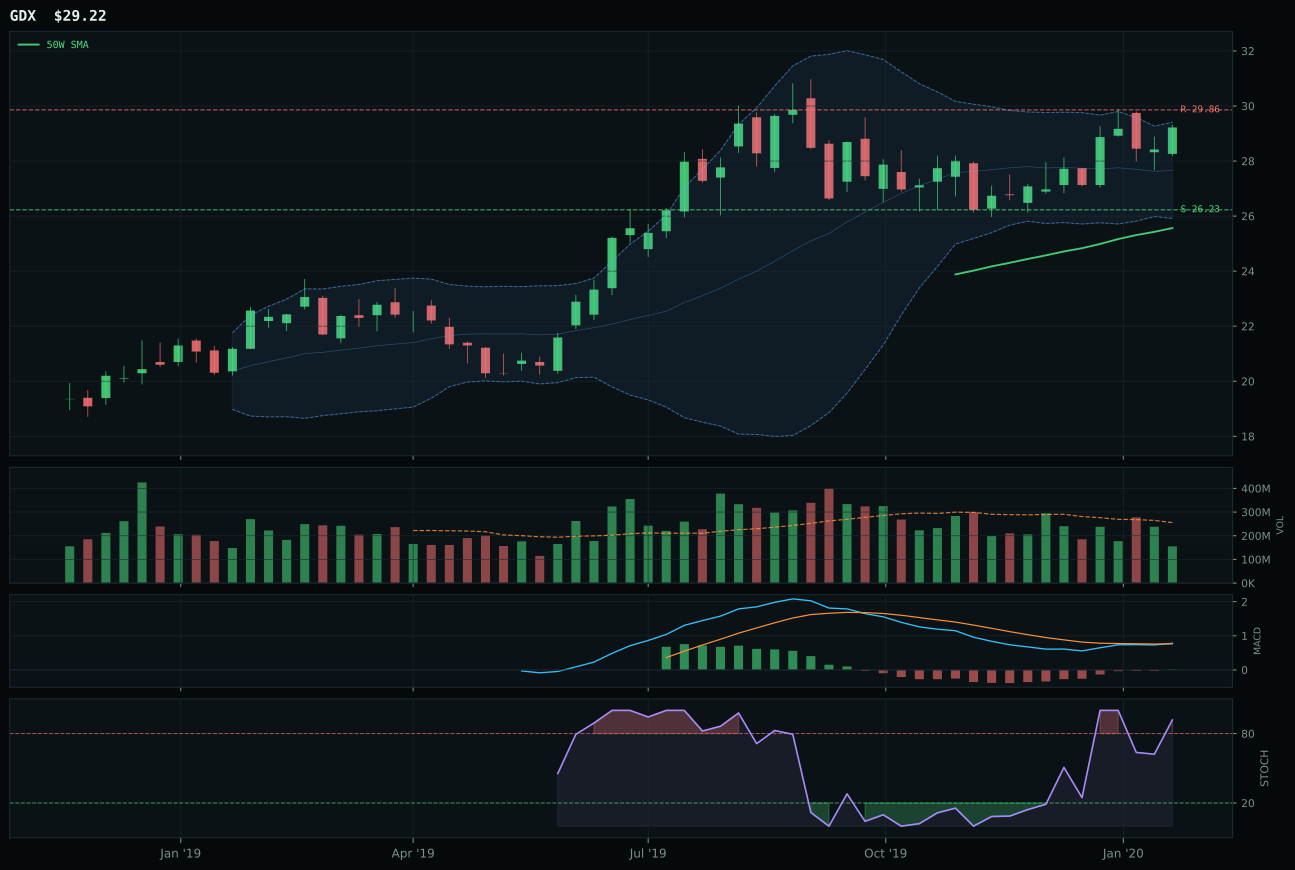
GDX has a neutral structure profile with -3.7% 13-week relative strength versus SPY.
A failed hold above support would weaken the setup.
Actionable but governed by invalidation levels.
GLD wins Precious Metals with a 3.3-point margin over SLV, a decisive but not dominant separation. GLD's advantage lies in cleaner risk-reward: at 53.2 versus SLV's 47.2, GLD's downside to support is tighter at 8.9% while maintaining the same zero upside to resistance. Both have MACD bullish and improving and sit in near 52W highs, but GLD's stochastic RSI is fully overbought at 1.00 while SLV's is rising mid-zone—GLD is extended but still accelerating, while SLV is moderating. Volume participation tells the story: GLD at neutral (0.77x) versus SLV at thin (below neutral)—GLD has actual buyers showing up, while SLV is being driven higher on thinner fuel. The 13W return gap (4.3% vs 0.1%) confirms GLD is capturing the upside while SLV treads water. Both benefit from disinflation tailwind (+8), but GLD's superior structure score (79.0 vs 78.2) and volume-price confirmation edge out SLV's industrial-demand optionality.
Precious Metals earns 5% as a tier-2 category on a 54.2 score, held primarily for diversification and macro hedge value rather than tactical momentum. The macro fit is solid at 60.0: disinflation helps this exposure (+8) and disinflation pressure (+6) is active, meaning lower real rates are tailwind for precious metals that bear no yield. Risk appetite is mixed (positive active, but -4 bleed-through), confirming metals are rallying more on macro anxiety than greed. GLD's technical evidence is strong at 72.8, but the category-level macro fit is what justifies the allocation—in a disinflation regime with credit stress and liquidity stress active, gold serves as both inflation hedge and volatility absorber. The 5% slot reflects conviction that gold should hold 10% upside and 9% downside even if risk assets soften. To upgrade Precious Metals to top-2, the portfolio would need GLD to break above resistance cleanly on volume acceleration, or for macro conditions to shift toward outright deflation fears. For now, it's a defensive allocation at the tier-2 size.
Defense & Aerospace — XAR
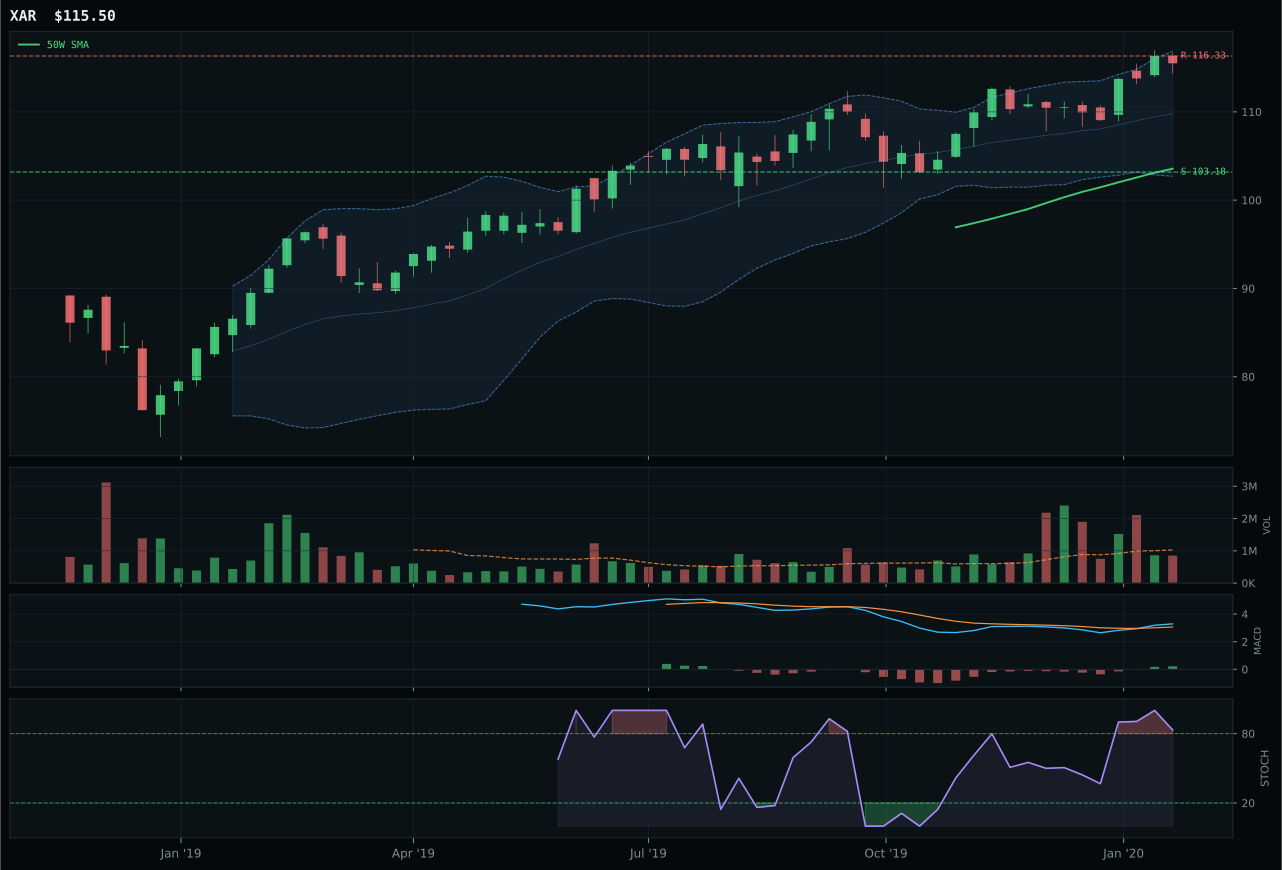
XAR has a neutral structure profile with 1.4% 13-week relative strength versus SPY.
A failed hold above support would weaken the setup.
Actionable but governed by invalidation levels.
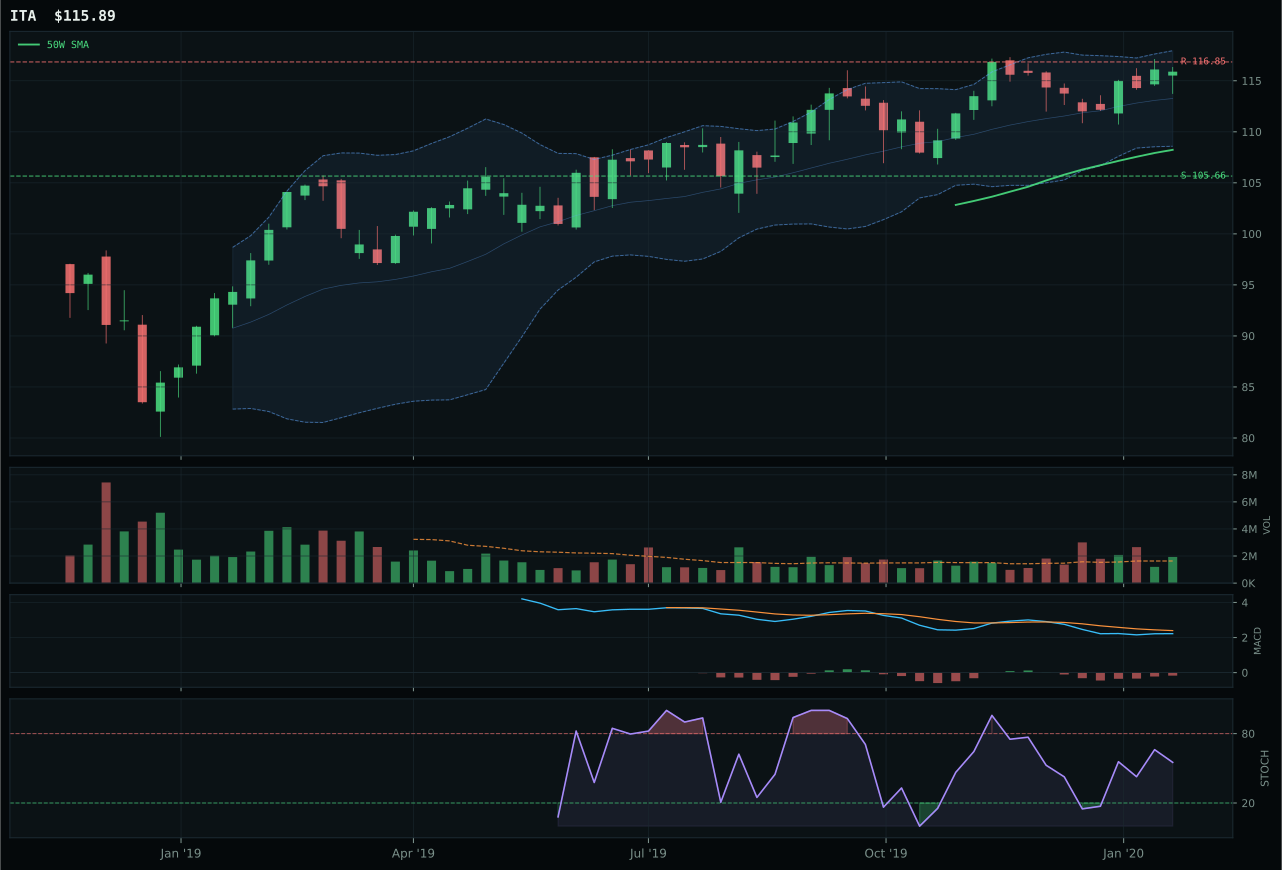
ITA has a neutral structure profile with -2.8% 13-week relative strength versus SPY.
A failed hold above support would weaken the setup.
Actionable but governed by invalidation levels.
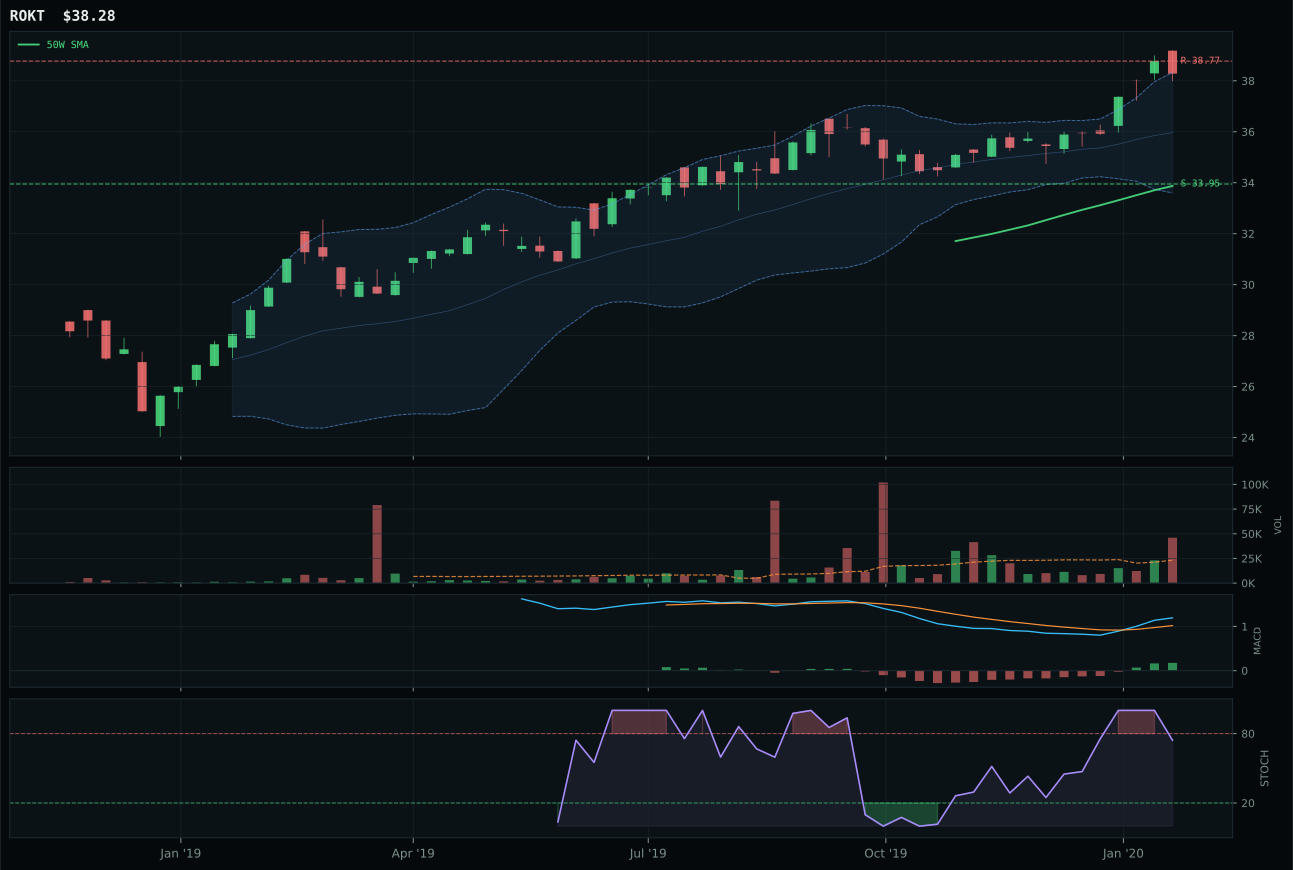
ROKT has a neutral structure profile with 2.0% 13-week relative strength versus SPY.
A failed hold above support would weaken the setup.
Tracked, but not top-2 eligible because: .
XAR takes Defense & Aerospace with a narrow 3.3-point lead over ITA, a margin that reflects technical nuance rather than conviction. XAR's 50W slope is holding at 0.5% and price sits just 11.5% from the 50W—not extended, just steady—with MACD bullish and improving. ITA's setback is simpler: its MACD is bearish but improving, a state of repair rather than confirmation, and its -2.8% relative strength versus SPY lags XAR's 1.4%. Both sit in neutral structures with similar support/resistance zones, so the decision hinges on momentum confirmation. XAR's overbought stochastic rolling over at 0.83 is superior positioning to ITA's falling/neutral state—when the oscillator is already neutral, a slight push higher can confirm the bounce, but when it's already extended and rolling, it provides safety. The category-relative strength is identical at 0.0%, meaning neither dominates peers, but XAR's improving MACD wins the tiebreaker.
Defense & Aerospace receives 5% as a tier-2 hold despite a 50.5 category score. Macro fit is structurally weak at 51.0: credit stress is active (+2) but liquidity stress (-4) creates friction, and the category itself lacks a strong narrative descriptor profile to anchor conviction. Technical evidence sits at 64.5 for XAR, which is respectable but not compelling—trend at 100 is offset by timing at 49 and risk-reward at 38. The case for holding this at 5% is defensive and opportunistic: with disinflation active, defense spending typically remains resilient, and XAR's buyback-friendly structure appeals in a lower-rate environment. However, the lack of relative strength leadership and neutral momentum confirmation mean this is a placeholder allocation rather than a conviction bet. If liquidity stress eases or risk appetite fully reverses, Defense would become more attractive; for now, it holds its tier-2 seat because it doesn't break the portfolio, but it offers limited upside catalysts.
AI — SMH
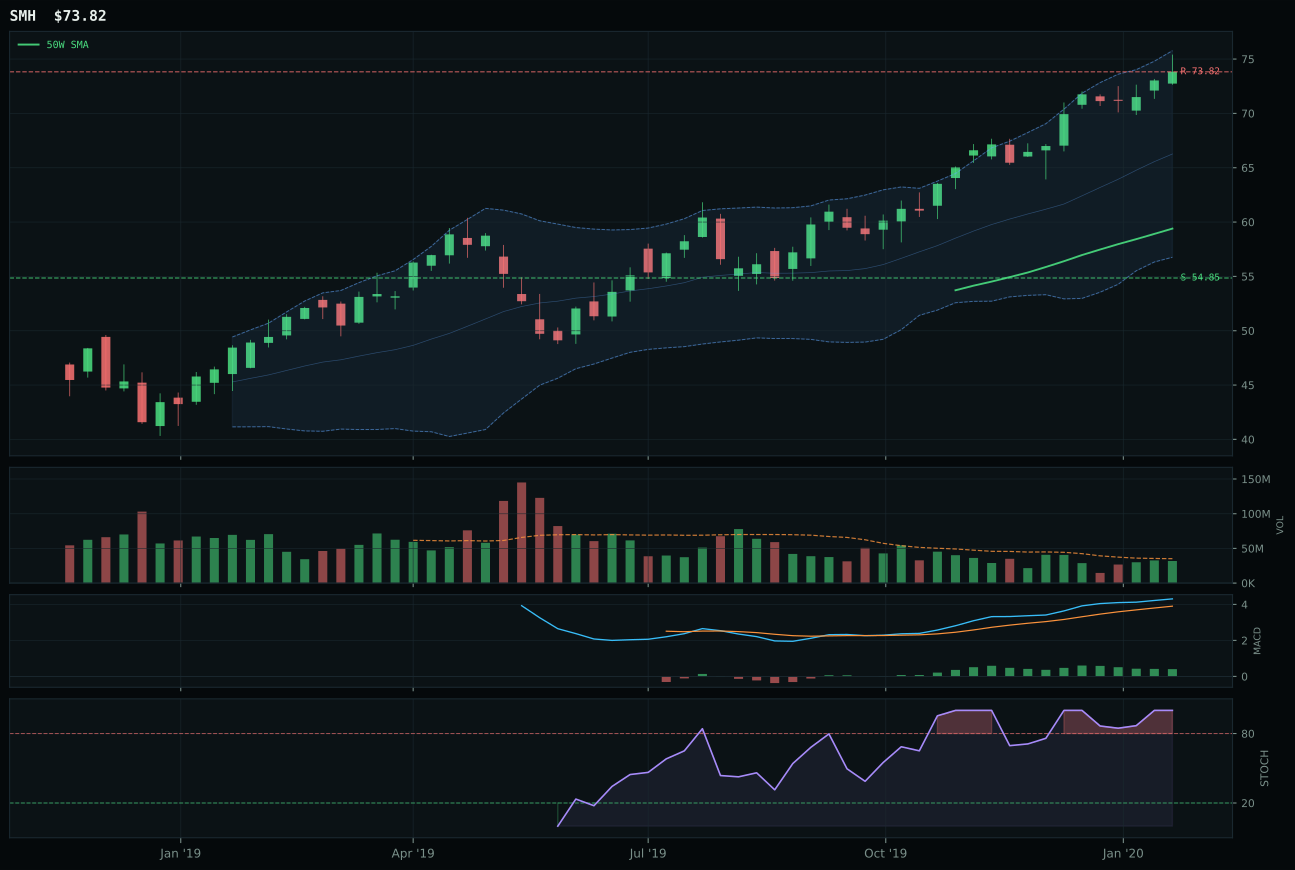
SMH has a vertical extension profile with 7.2% 13-week relative strength versus SPY.
A failed hold above support would weaken the setup.
Actionable but governed by invalidation levels.
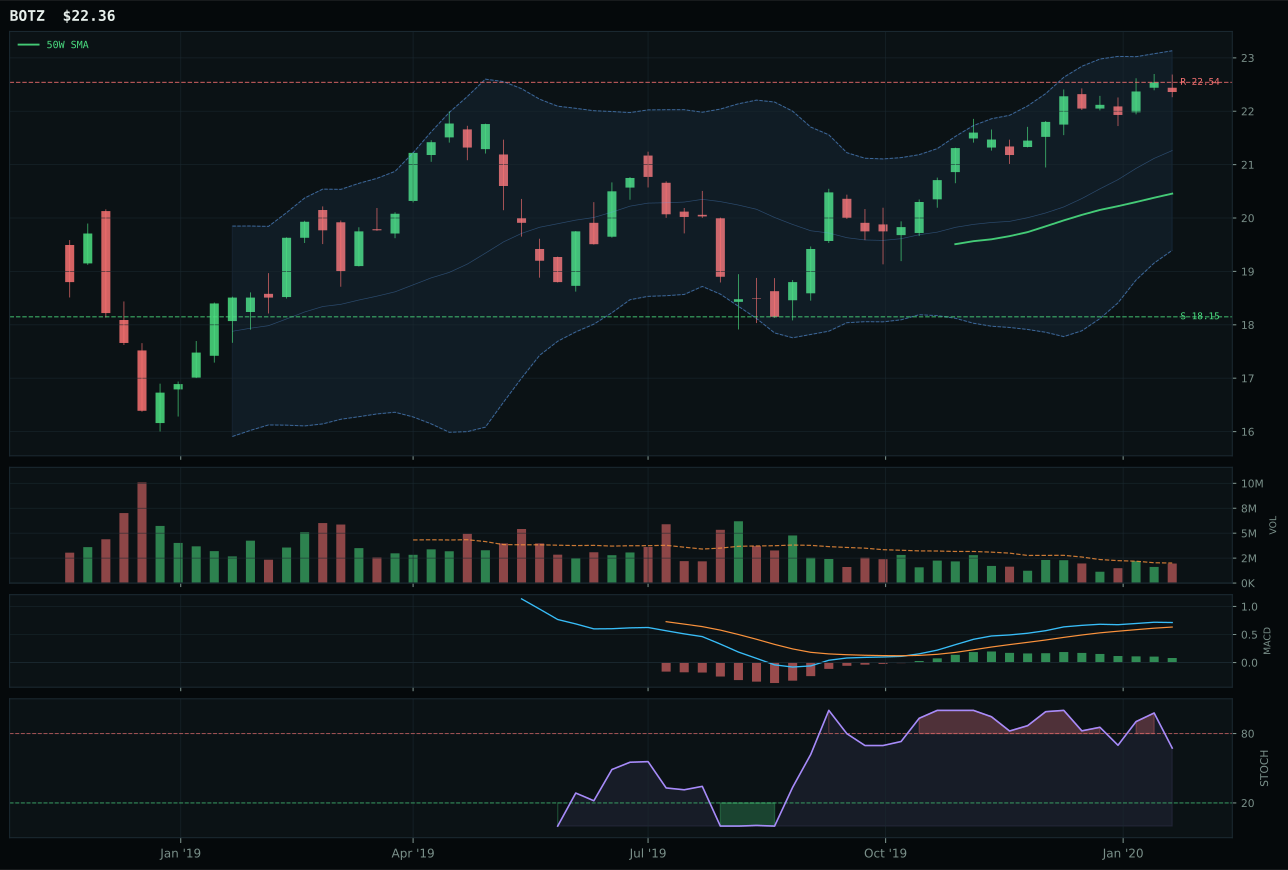
BOTZ has a neutral structure profile with -1.0% 13-week relative strength versus SPY.
A failed hold above support would weaken the setup.
Actionable but governed by invalidation levels.
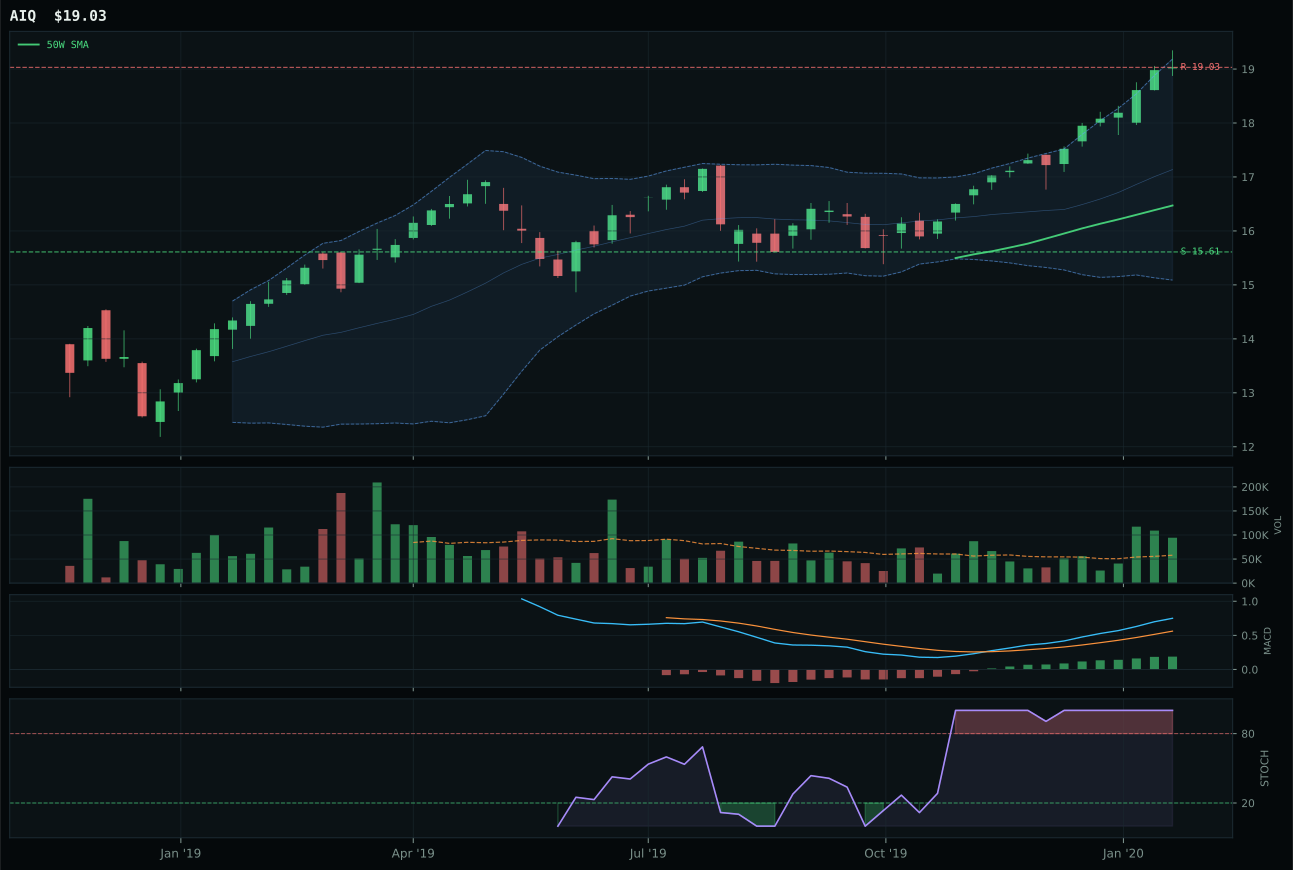
AIQ has a vertical extension profile with 8.6% 13-week relative strength versus SPY.
A failed hold above support would weaken the setup.
Tracked, but not top-2 eligible because: .
SMH wins the AI category despite being priced 24.3% above its 50W, a vertical extension that normally triggers caution—but the win is narrower than it first appears. SMH's 16.2% thirteen-week return and 7.2% relative strength versus SPY justify the premium, and its neutral volume participation at 0.91x keeps the setup from screaming distribution. BOTZ, the runner-up, stumbles on two fronts: its -8.3% category-relative strength exposes a breakdown in peer leadership (it's lagging the median within its own three-ETF basket), and its falling stochastic RSI signals momentum is rolling over while SMH remains overbought. Risk-reward is nearly equal (41.2 vs 37.6), so the tiebreaker is timing: SMH's MACD is bullish and improving versus BOTZ's bullish but flattening, a subtle but important divergence. The 4.9-point score gap reflects SMH's ability to hold the extended position with improving confirmation, while BOTZ is showing stress signals at the same price levels.
AI earns 5% as a tier-2 category despite a 49.3 score that trails both top-2 slots. AI growth sponsorship (+14) is the strongest active descriptor in the entire macro checklist, providing powerful tailwind, but liquidity stress (-12) and credit stress (-8) create real drags. The macro fit is solid at 59.0, but technical evidence is softer at 62.5 for the representative—SMH is extended, MACD is flattening, and volume-price confirmation at 68.2 is adequate but not clean. What keeps AI in the portfolio rather than on the bench is the strength of the AI growth narrative and SMH's ability to lead semiconductor demand. The category would need better timing and cooler positioning to earn top-2: if SMH pulls back to the 50W and MACD resets into a fresh bull signal, AI could easily swap places with a weakening tier-2 peer. For now, it's a conviction hold at the smaller size, betting that semiconductor leadership persists through a disinflation cycle.
Industrial Metals — PICK
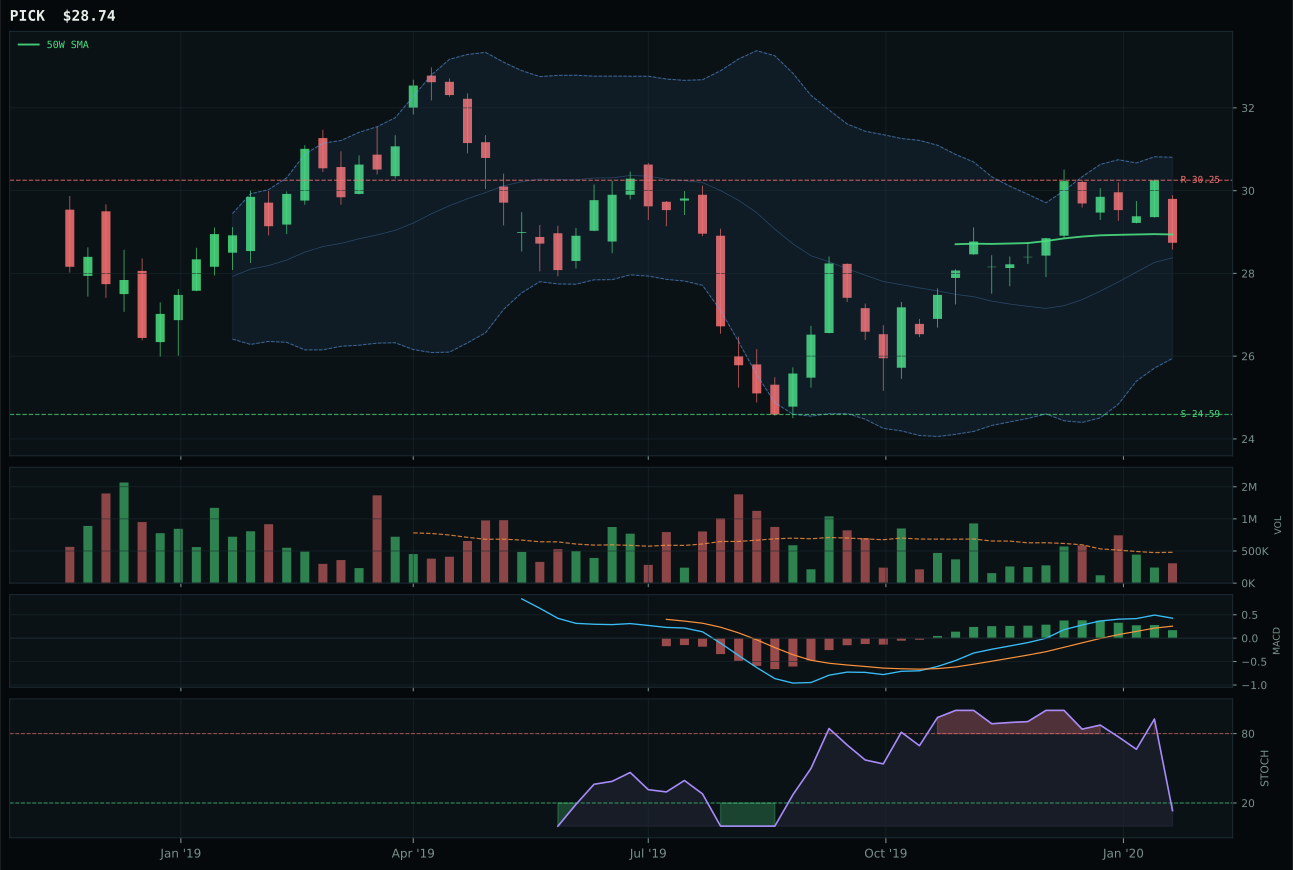
PICK has a compression near 50W profile with -4.4% 13-week relative strength versus SPY.
A failed hold above support would weaken the setup.
Actionable but governed by invalidation levels.
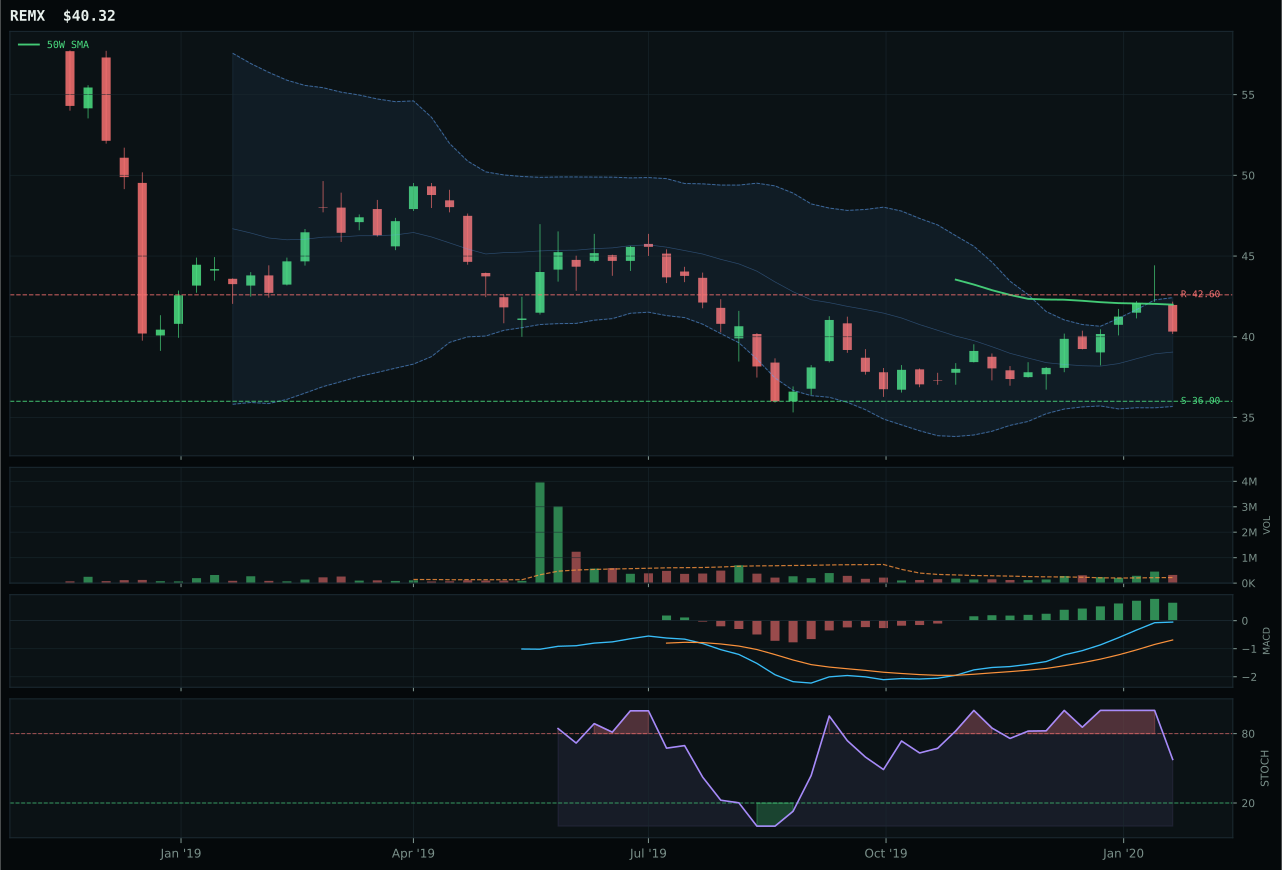
REMX has a neutral structure profile with -0.8% 13-week relative strength versus SPY.
Extension and support failure are the main tactical risks.
Tracked, but not top-2 eligible because: structurally broken.
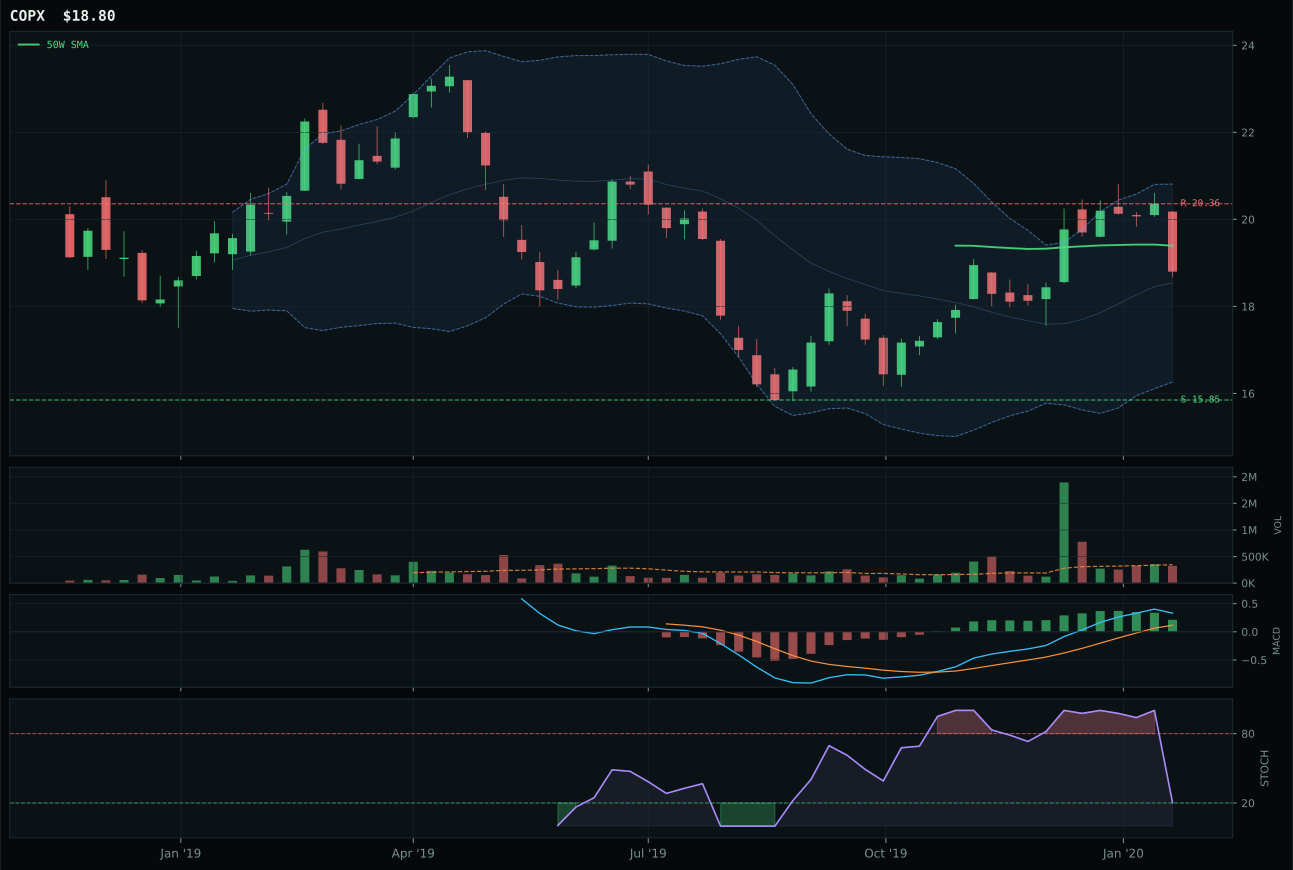
COPX has a neutral structure profile with -2.4% 13-week relative strength versus SPY.
Extension and support failure are the main tactical risks.
Tracked, but not top-2 eligible because: structurally broken.
PICK wins Industrial Metals despite price being below the 50W and 200W—a losing trend backdrop that disqualifies most entries, but PICK's timing score of 95 saves it. Price is almost exactly at the 50W (just -0.7% away), MACD is bullish but flattening, and stochastic RSI is deeply oversold at 0.16, creating textbook mean-reversion conditions. REMX, the runner-up, has better trend (price above the 50W and 200W) and stronger momentum confirmation, but timing is weaker (90 vs 95) because REMX sits deeper in the decision zone rather than right at the pivot point. Structure is where PICK decisively wins: PICK is compression near the 50W (73.0 structure score) with perfect invalidation levels, while REMX is neutral structure (49.5) with ambiguous directional setup. The risk-reward appears equal (58.3 vs 61), but PICK's thin participation and REMX's above-average participation flip the risk calculus—PICK is coiling, REMX is distributing. This is a trade on oversold mean reversion, not a trend continuation.
Industrial Metals receives 5% despite a low 30.7 category score, held as a metals-scarcity convex bet rather than a technical trade. Metals scarcity is active at +14 in the macro checklist, the strongest positive descriptor the category carries, reflecting AI-driven semiconductor and battery-metal demand. Credit stress (-7) and liquidity stress (-8) create friction, bringing category-level macro fit to 49.0—neutral at best. PICK's technical evidence is weak at 49.1, with a broken trend and thin volume participation, yet it sits in the portfolio because the macro narrative (scarcity) is uncrowded and the timing setup (oversold at the 50W) has defined downside. The 5% allocation is speculation on a rebound from support; if PICK breaks below 24.59 or stochastic RSI falls below 0.10, the thesis breaks. To earn a larger allocation, Industrial Metals would need PICK to clear resistance at 30.25 on volume acceleration, confirming the compression breakout rather than remaining a near-term bounce. For now, it's a small-size tactical hold hedged by its low category rank.
Emerging Markets — INDA
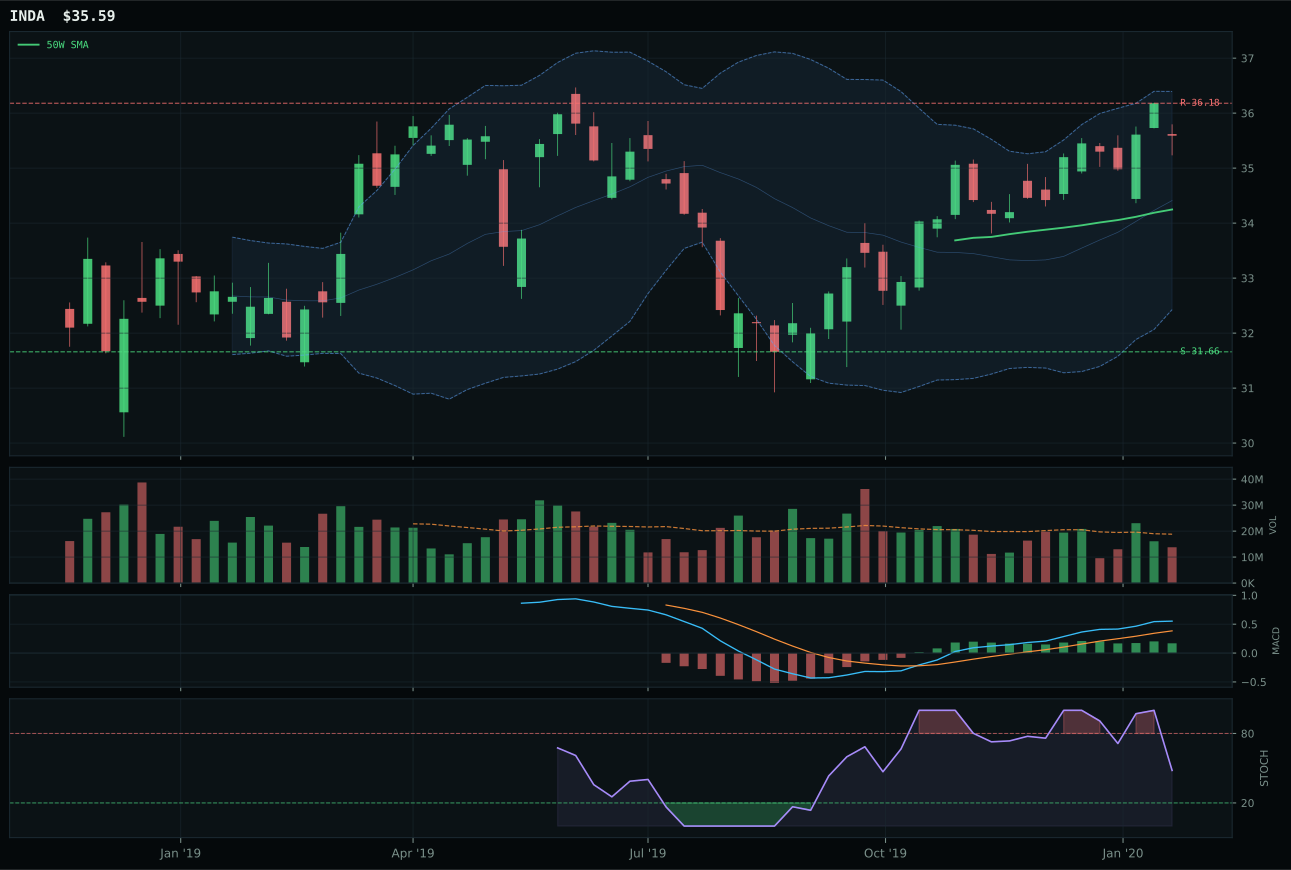
INDA has a neutral structure profile with -4.5% 13-week relative strength versus SPY.
A failed hold above support would weaken the setup.
Actionable but governed by invalidation levels.
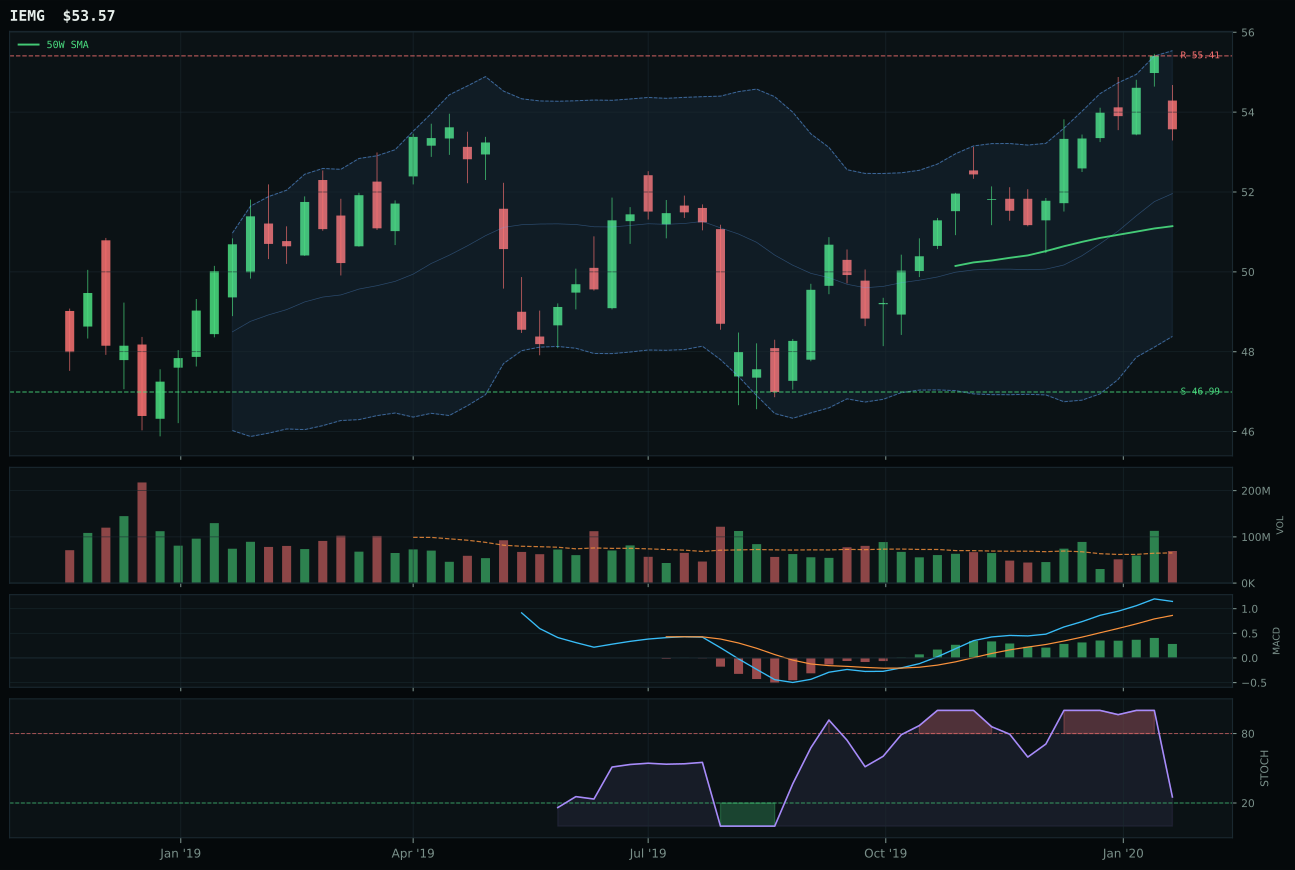
IEMG has a neutral structure profile with -4.6% 13-week relative strength versus SPY.
A failed hold above support would weaken the setup.
Actionable but governed by invalidation levels.
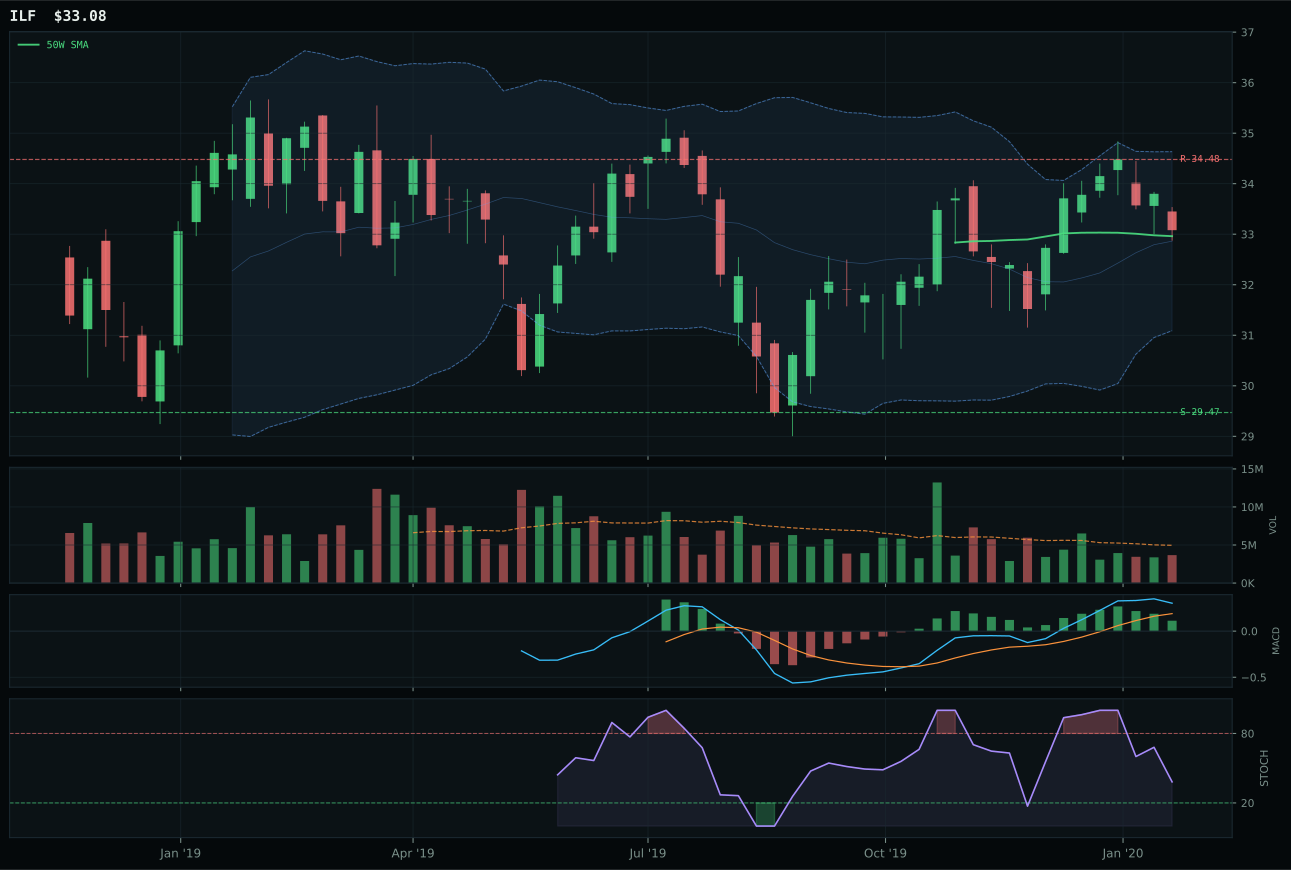
ILF has a compression near 50W profile with -10.2% 13-week relative strength versus SPY.
A failed hold above support would weaken the setup.
Actionable but governed by invalidation levels.
INDA wins Emerging Markets with a razor-thin -1.3-point edge over IEMG—a nearly statistical tie that reflects strong peer competition rather than dominant leadership. Both have identical category-relative strength (0.0%), both are in neutral structures above their 50W and 200W, both have bullish-flattening MACD and falling-neutral stochastic RSI. INDA's technical evidence is 62.8 versus IEMG's 64.1, a reversal, yet INDA is ranked first because IEMG's macro fit is weaker at 40.0 versus INDA's 48.0. The differentiator is INDA's thin volume participation (0.73x) versus IEMG's neutral (neutral participation)—INDA's move is being absorbed with less volume, suggesting less downside risk in the event of a reversal. Both 13W returns are nearly identical (4.5% vs 4.4%), confirming the category is very evenly split. This is a case where portfolio convention (pick the ranked first) matters more than technical superiority. Either would serve equally well.
Emerging Markets earns 5% as a tier-2 category on a 28.1 score, held primarily for equity beta diversification rather than tactical conviction. Category-level macro fit is only 38.0, weighed down by active credit stress (-10) and liquidity stress (-10) headwinds; INDA's +8 risk appetite tailwind is overshadowed by macro friction. Technical evidence for INDA is 62.8, a respectable but not dominant score, with momentum confirmation at 49.8 reflecting muted 4W performance (0.8%) despite better 13W returns (4.5%). The allocation is justified by two factors: first, to maintain emerging-market equity exposure as a diversifier to developed-market growth; second, to capture the tail risk that risk appetite remains positive despite disinflation headwinds. INDA's quality-growth profile (higher earnings stability than IEMG's broader beta) makes it the safer EM sleeve in a regime where credit stress is active. To upgrade this to tier-1, Emerging Markets would need a clearer macro catalyst—either a reversal away from disinflation or a sharp drop that created true value. For now, it is a hold at 5%, providing portfolio balance without betting the farm on emerging-market outperformance.
Traditional Energy — XLE
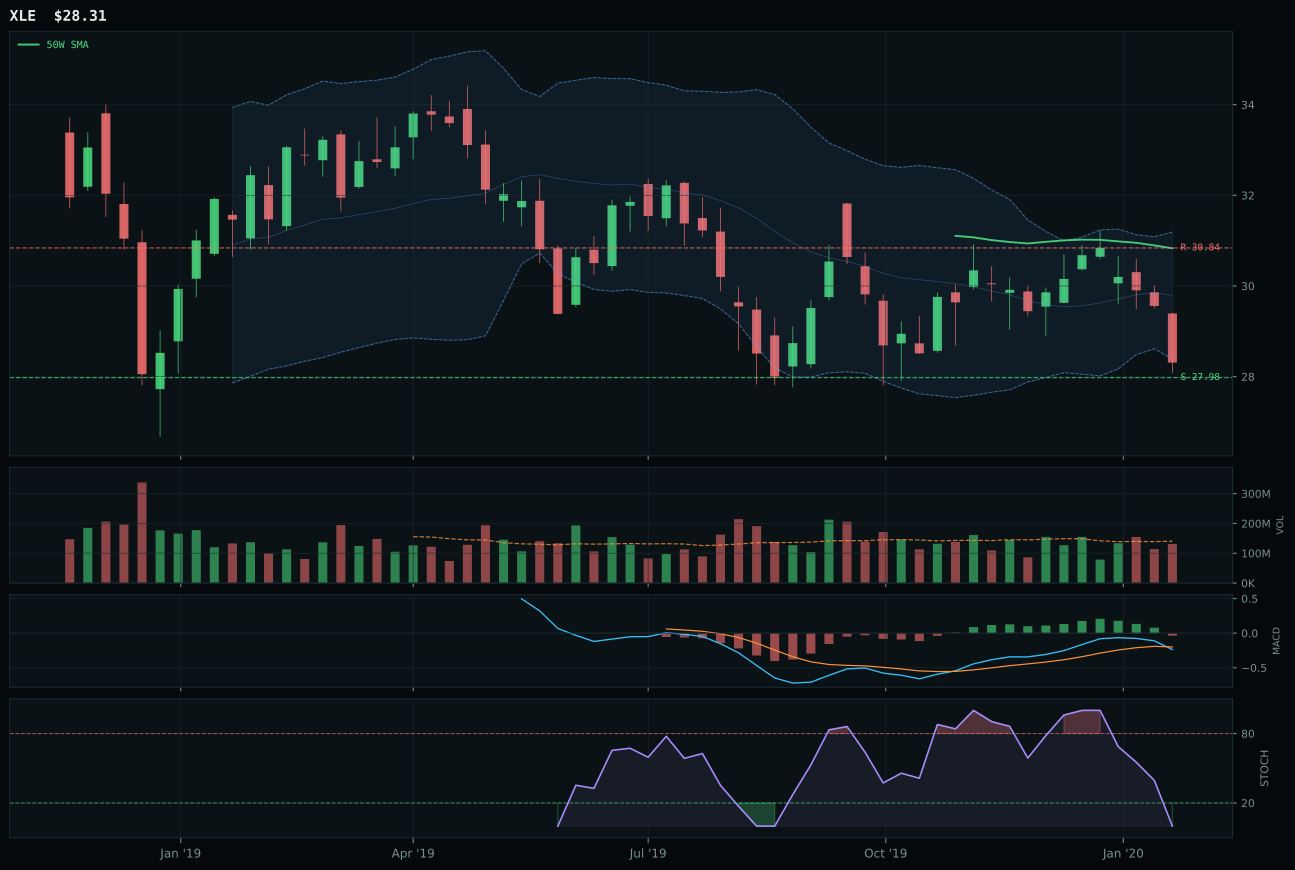
XLE has a pullback into support profile with -13.9% 13-week relative strength versus SPY.
Extension and support failure are the main tactical risks.
Tracked, but not top-2 eligible because: structurally broken.
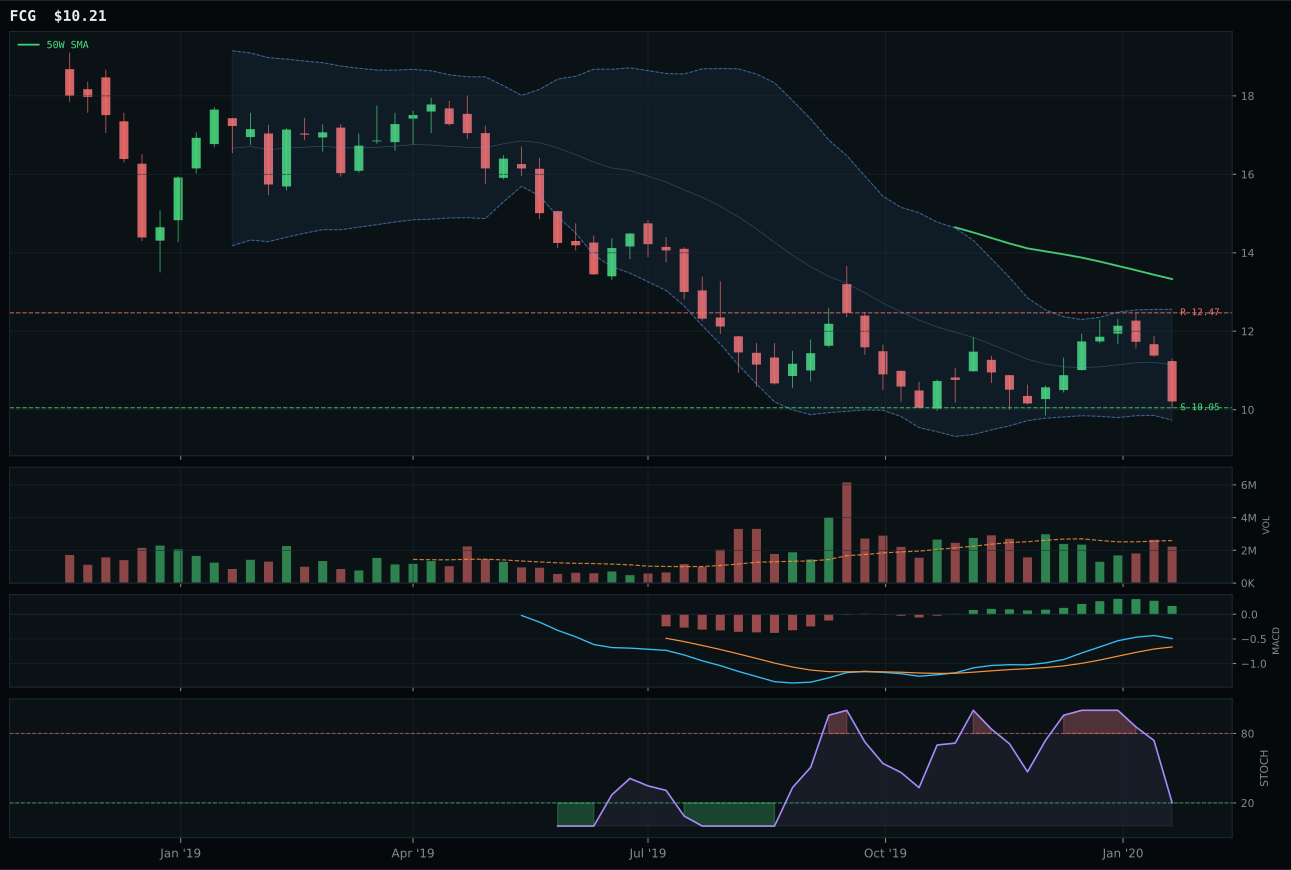
FCG has a pullback into support profile with -13.9% 13-week relative strength versus SPY.
Extension and support failure are the main tactical risks.
Tracked, but not top-2 eligible because: structurally broken.
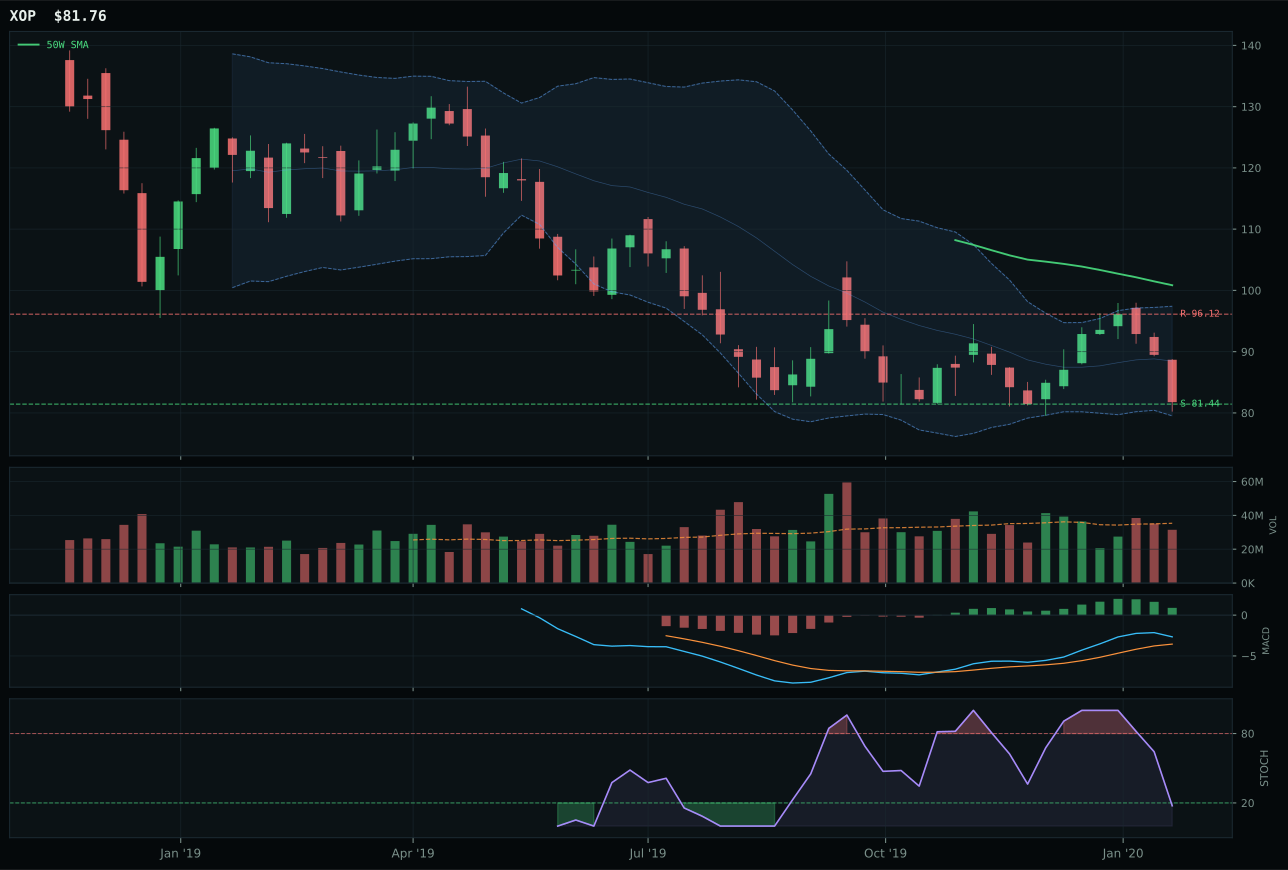
XOP has a pullback into support profile with -15.4% 13-week relative strength versus SPY.
Extension and support failure are the main tactical risks.
Tracked, but not top-2 eligible because: structurally broken.
XLE wins Traditional Energy by -9.4 points over FCG—a negative category score battle where the winner is simply the least broken. XLE's 80 timing score reflects price at support (27.98) with stochastic RSI fully oversold at 0.00, a textbook oversold reversal setup, while FCG's 60 timing score places it deeper in the weakness zone. Both have bearish momentum confirmation (XLE at 0.0, FCG at 4), both are down over 13 weeks (-4.9% and -4.8%), and both are massively negative on relative strength to SPY (-13.9% each). XLE's only advantage is structure: at pullback into support (39.5) rather than FCG's similar state, but XLE's MACD is bearish/weakening versus FCG's bullish but flattening—XLE admits the weakness while FCG denies it, making XLE's setup more honest. Risk-reward is identical at 90 upside/1.2 downside because both are pinned at support. This is not a win—it is the least ugly entry in a category that is fundamentally broken.
Traditional Energy receives 5% allocation despite an ineligible 0.0 category score and a ranking outside the top-2 tiers. This is a forced allocation driven by the 50% crypto overlay tier sizing: with the overlay in place, tier-2 slots are shrunk from 10% to 5%, requiring the system to hold six tier-2 categories at 5% each to fill the portfolio. XLE is structurally broken and technically negative, with a category-level macro fit of only 16.0 because disinflation actively hurts energy (-10) and disinflation pressure is active (-10). However, the system must allocate to maintain portfolio construction rules. The 5% in XLE is not a conviction hold—it is a placeholder that breaks the moment energy macro conditions improve or the overlay unwinds. If oil prices stabilize above 50 and energy stocks recapture their 50W, XLE could shift into a tier-2 technical setup with actual upside. For now, the allocation is a forced trade on oversold support, nothing more. This category should be at 0% in a discretionary regime; it earns 5% only because of portfolio construction constraints.
Nuclear Energy — NLR
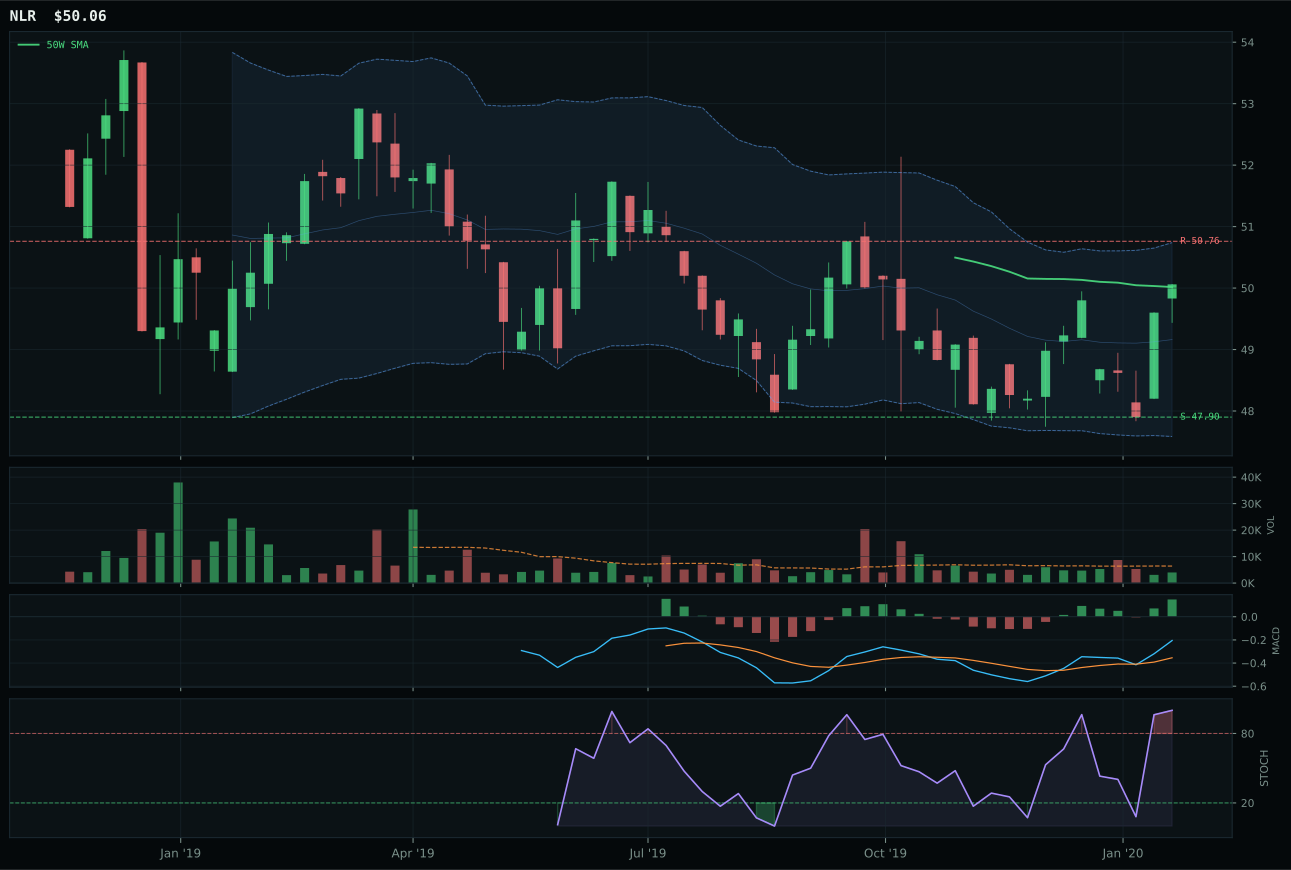
NLR has a pullback into support profile with -6.5% 13-week relative strength versus SPY.
A failed hold above support would weaken the setup.
Tracked, but not top-2 eligible because: .
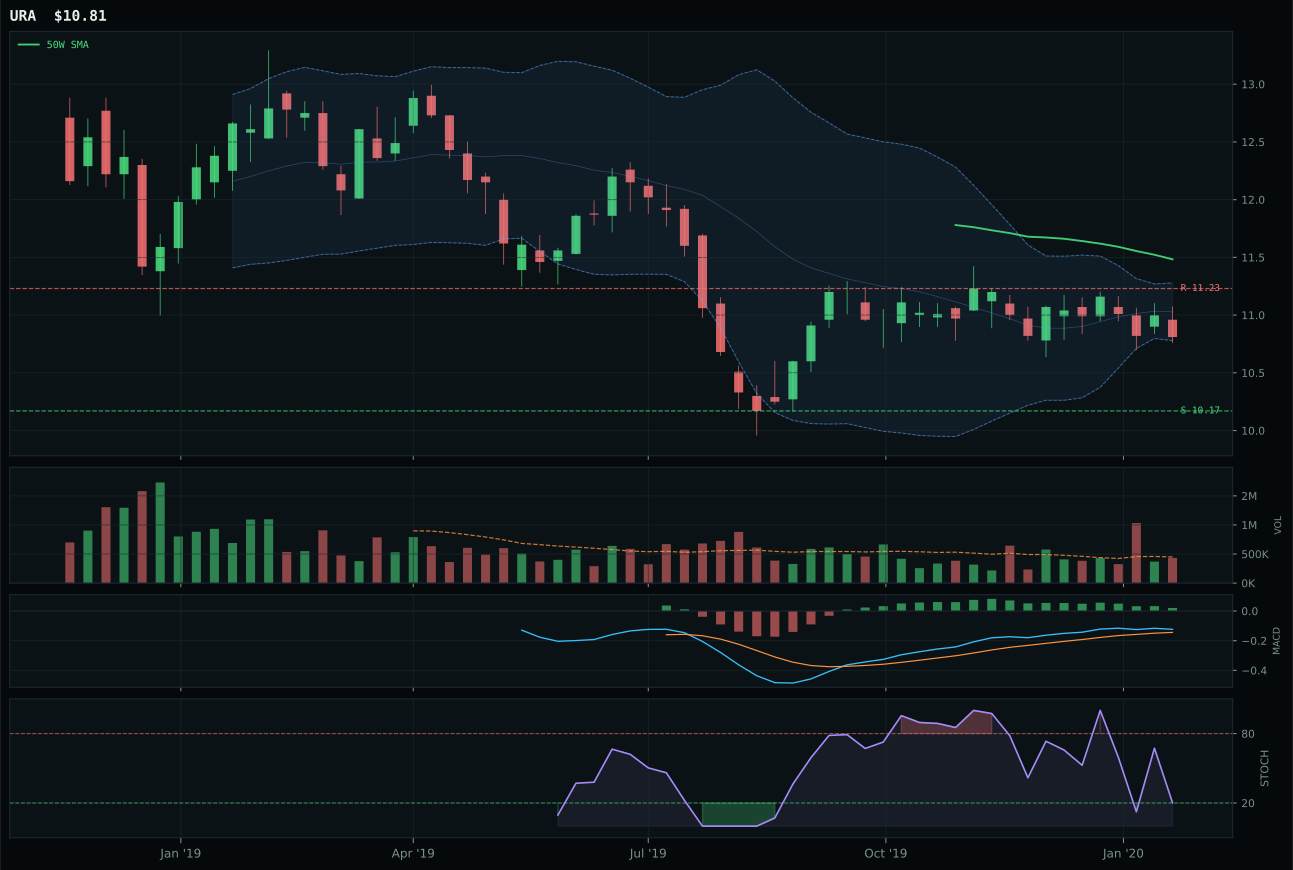
URA has a neutral structure profile with -10.8% 13-week relative strength versus SPY.
Extension and support failure are the main tactical risks.
Tracked, but not top-2 eligible because: structurally broken.
NLR wins Nuclear Energy with a 55.5-point demolition over URA, but the victory masks a category that is too structurally weak to earn portfolio inclusion. NLR's timing is perfect at 100 (price just 0.1% from the 50W) and MACD is bullish and improving, but price is still only at the 50W—not above it. The chart shows a pullback into support at 47.90 with stochastic RSI overbought momentum, creating a coiled setup waiting for direction. URA, by contrast, is deep in a broken downtrend well below the 50W (-10.8% RS vs SPY) with bearish-flattening MACD and falling stochastic RSI—it is structurally broken and disqualified by hard filters. NLR wins by being not broken, but that is not enough to warrant conviction. The score gap is driven by NLR's superior timing (100 vs 70), not fundamental strength.
Nuclear Energy receives 0% allocation this week, excluded from the portfolio despite NLR's winning the category. The 25.9 category score and ineligible status reflect a structural breakdown: NLR is at the 50W but not yet confirmed above it, URA is structurally broken by hard filters, and the category macro fit is only 43.0. AI growth sponsorship is active (+5), but liquidity stress (-7) and credit stress (-5) provide friction. The real issue is that Nuclear lacks any meaningful macro tailwind in a disinflation regime and sits in a pullback-into-support setup that requires a breakout confirmation to justify holding. NLR's perfectly timed placement at the 50W means it could trigger a buy signal the moment price closes above 50.76 with volume, but until that happens, allocation is unjustified. To earn even a 5% slot, NLR would need to break resistance on volume, demonstrate that MACD has room to extend higher, and show that category-relative strength is turning positive. None of those conditions have been met. Nuclear is on watch, not in portfolio.
Agriculture & Livestock — MOO
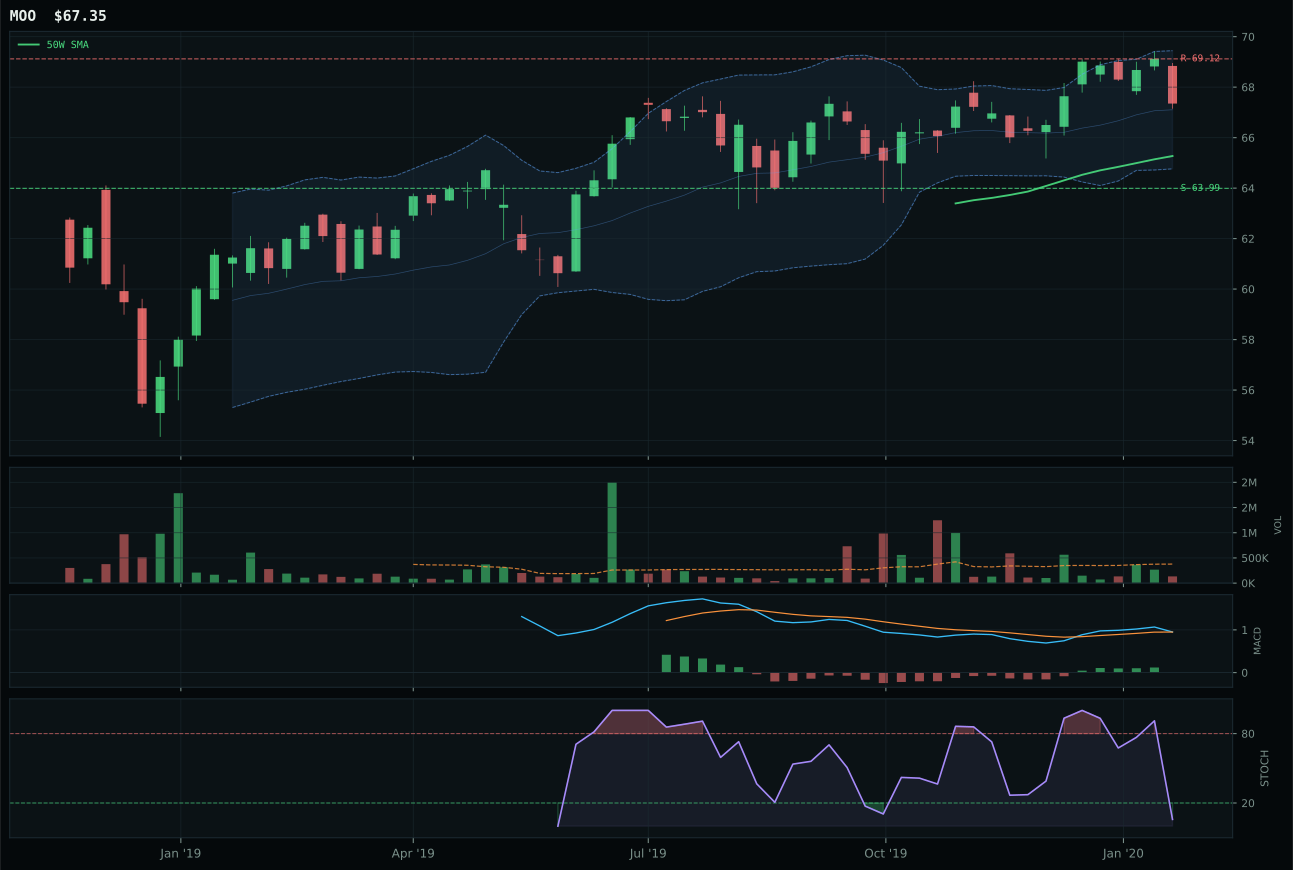
MOO has a neutral structure profile with -7.1% 13-week relative strength versus SPY.
A failed hold above support would weaken the setup.
Actionable but governed by invalidation levels.
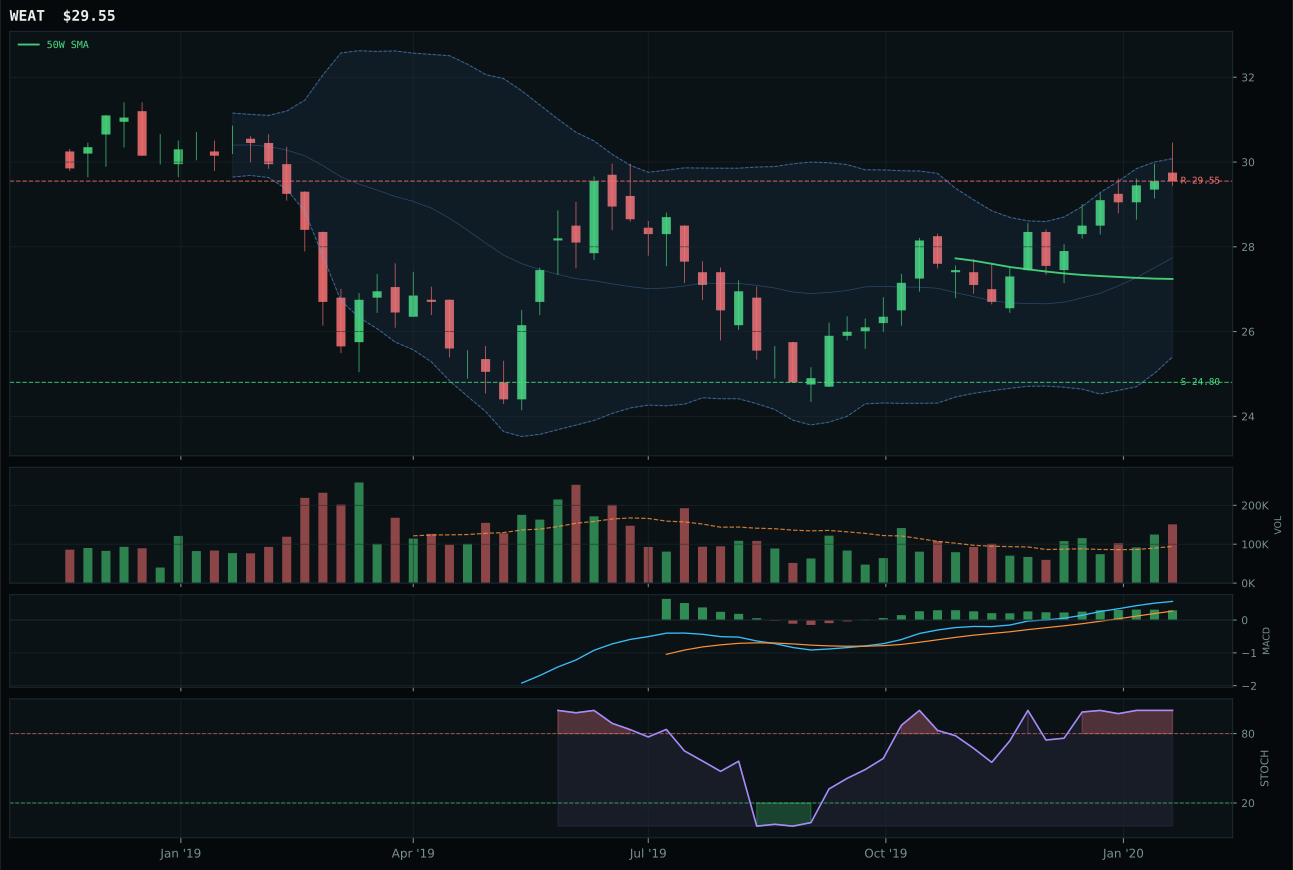
WEAT has a neutral structure profile with -1.9% 13-week relative strength versus SPY.
A failed hold above support would weaken the setup.
Tracked, but not top-2 eligible because: .
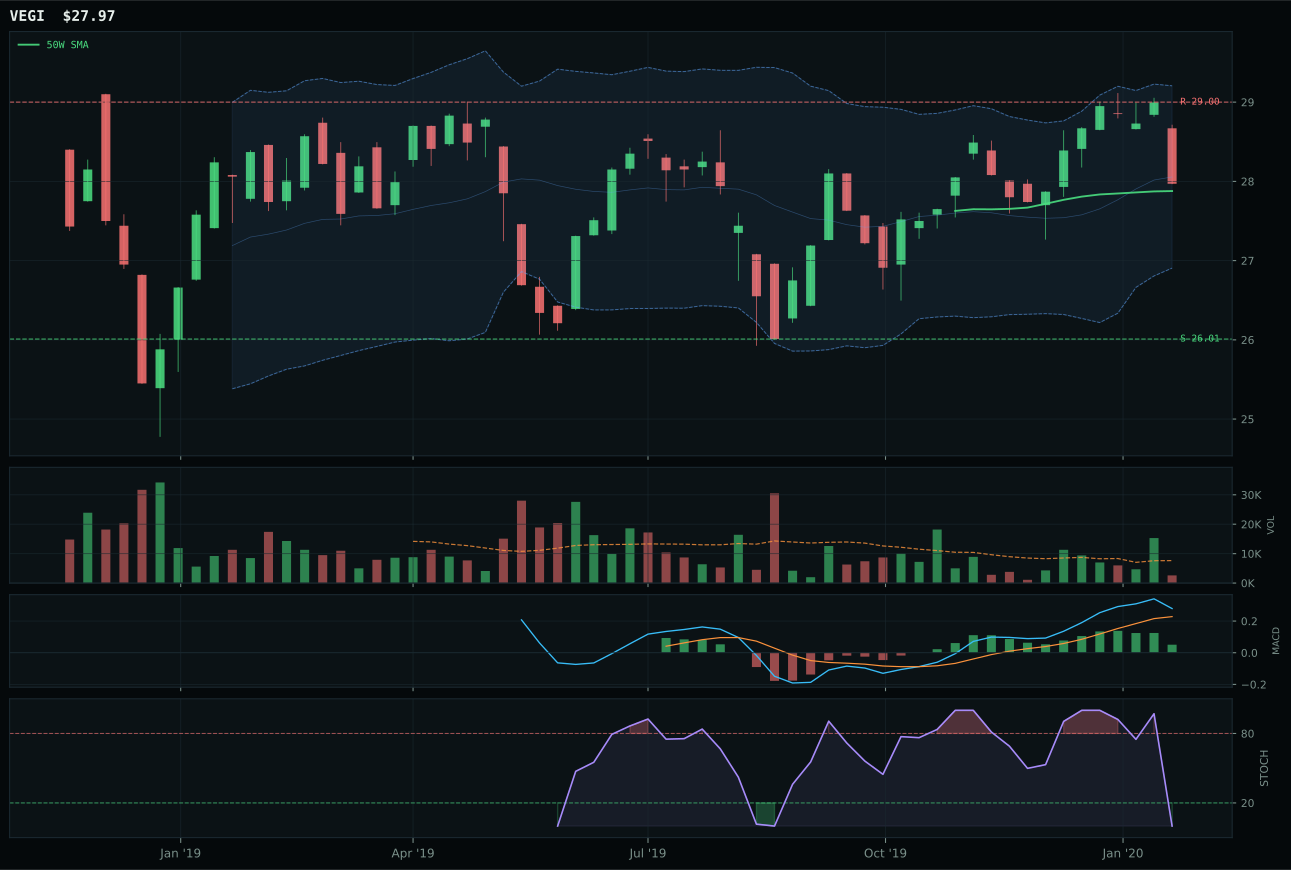
VEGI has a compression near 50W profile with -7.9% 13-week relative strength versus SPY.
A failed hold above support would weaken the setup.
Tracked, but not top-2 eligible because: .
MOO wins Agriculture by 23.1 points over WEAT, a demolition rather than a close call. MOO's only strength is timing: at just 3.2% from the 50W, it sits in the sweet spot for mean-reversion buyers, with MACD bullish but flattening and stochastic RSI deeply oversold at 0.06. WEAT, by contrast, is extended 8.5% from the 50W with overbought stochastic RSI and bullish-improving MACD—it looks more dangerous despite its higher 13W return. MOO's 4W return of -2.2% confirms the weakness, while WEAT's 7.1% suggests the move is still attracting buyers, yet MOO wins because the system rewards pullbacks into support over extensions into resistance in low-momentum markets. Volume is thin for both (0.35x and above-average participation respectively), so neither has sponsorship conviction. The category-median relative strength is zero for both, confirming this is a leadership vacuum. MOO's setup proximity to the 50W is the only technical argument, and in a weak category, technical argument wins by default.
Agriculture & Livestock receives 0% allocation this week, excluded entirely from the portfolio. The category score collapsed to 15.1, ranking 9th or 10th depending on final tie-breaking, because disinflation actively hurts this category (-6 at the macro level, -8 for the disinflation pressure descriptor specifically). Agricultural commodities typically rally in inflationary regimes and suffer as real yields rise and demand cools; a disinflation backdrop is a structural headwind. MOO's momentum confirmation score of 37.8 reflects genuine weakness in buying participation—the 4W return is negative, volume is thin, and MACD is flattening rather than accelerating. To earn even a 5% allocation, this category would need to demonstrate relative strength leadership, a reset of volume-price confirmation back above 65, and either a macro regime shift away from disinflation or a counter-narrative of supply-side pressure from metals scarcity. None of those conditions are present. Agriculture is on the sidelines.