
2020-01-17
Informational purposes only. The content in this report, including allocations, analysis, and commentary, is provided solely for informational and educational purposes. It does not constitute financial advice, investment advice, trading advice, or any other type of advice. Past performance does not guarantee future results. Always conduct your own research and consult a qualified financial professional before making investment decisions.
Some tracked tickers were excluded due to missing live weekly price data: SGOV: Historical cache SGOV has only 0 usable weekly bars; URNM: Historical cache URNM has only 7 usable weekly bars
Weekly Allocation
| Ticker | Category | Weight | Role |
|---|---|---|---|
| FBTC | 50% | Overlay | |
| IGV | Technology | 10% | Top-2 (10%) |
| IEMG | Emerging Markets | 10% | Top-2 (10%) |
| BOTZ | AI | 5% | Tier-2 (5%) |
| XAR | Defense & Aerospace | 5% | Tier-2 (5%) |
| GLD | Precious Metals | 5% | Tier-2 (5%) |
| XLU | Utilities & Infrastructure | 5% | Tier-2 (5%) |
| PICK | Industrial Metals | 5% | Tier-2 (5%) |
| MOO | Agriculture & Livestock | 5% | Tier-2 (5%) |
Trade Instructions — Monday Open
Sell the tranche from 5 weeks ago (completing its 4-week hold). Buy the new tranche. Instructions show net portfolio changes — same-asset positions cancel, weight changes show the delta.
| Action | Ticker | Instruction |
|---|---|---|
| BUY | XAR | Buy XAR — 1.25% of freed cash (adds 1.25% to portfolio) |
| BUY | GLD | Buy GLD — 1.25% of freed cash (adds 1.25% to portfolio) |
| BUY | MOO | Buy MOO — 1.25% of freed cash (adds 1.25% to portfolio) |
| BUY | PICK | Buy PICK — 1.25% of freed cash (adds 1.25% to portfolio) |
| BUY | IGV | Buy IGV — 2.50% of freed cash (adds 2.50% to portfolio) |
| BUY | IEMG | Buy IEMG — 2.50% of freed cash (adds 2.50% to portfolio) |
| BUY | XLU | Buy XLU — 1.25% of freed cash (adds 1.25% to portfolio) |
| BUY | FBTC | Buy FBTC — 12.50% of freed cash (adds 12.50% to portfolio) |
| BUY | BOTZ | Buy BOTZ — 1.25% of freed cash (adds 1.25% to portfolio) |
Current Portfolio After Trade
Combined holdings across all 4 active tranches. Each tranche is 25% of the portfolio.
| Ticker | % of Portfolio | Weight Bar |
|---|---|---|
| FBTC | 12.50% | |
| IGV | 7.50% | |
| IEMG | 7.50% | |
| XAR | 6.25% | |
| GLD | 6.25% | |
| MOO | 6.25% | |
| PICK | 6.25% | |
| ILF | 5.00% | |
| XLK | 5.00% | |
| SMH | 5.00% | |
| XLU | 3.75% | |
| IGF | 2.50% | |
| BOTZ | 1.25% |
Macro Regime — Transition / Mixed
Macro Evidence Charts
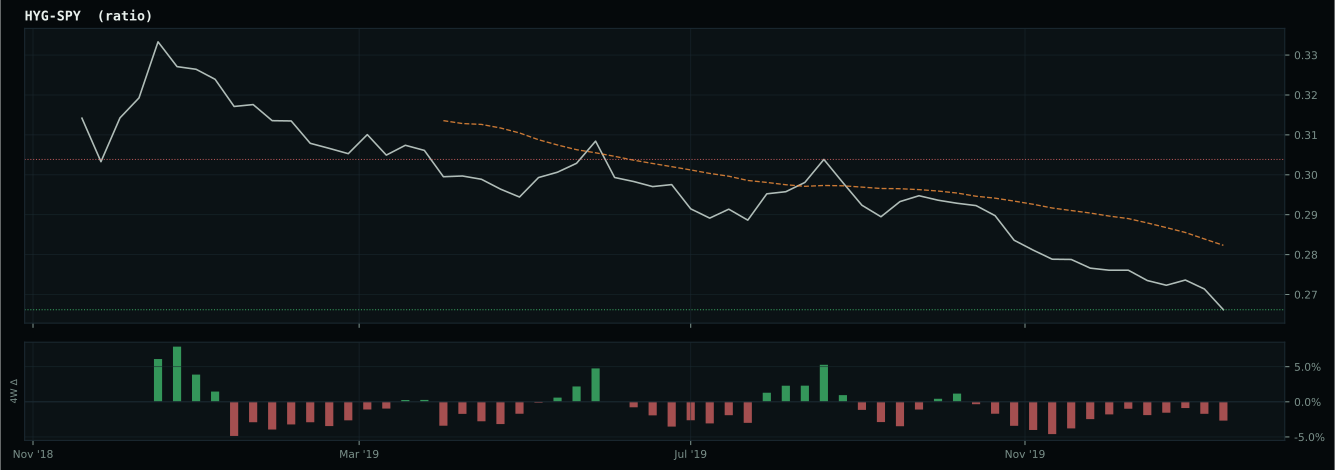
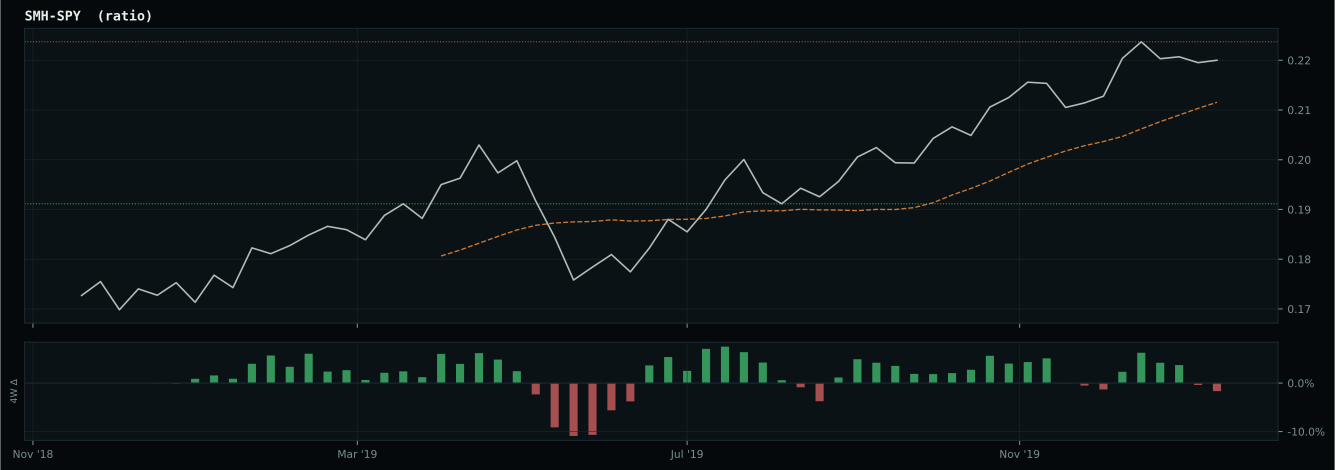
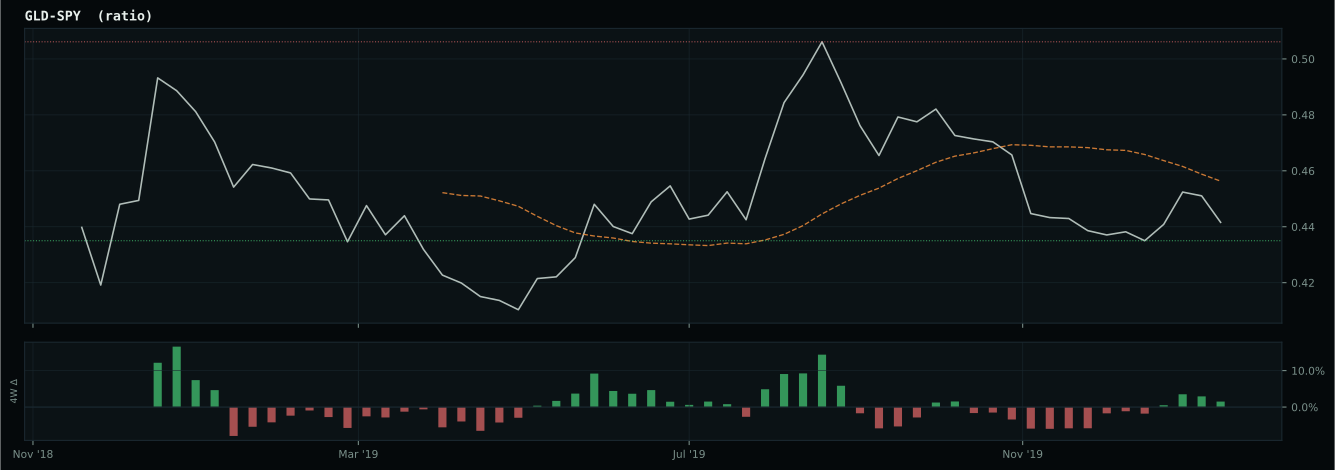
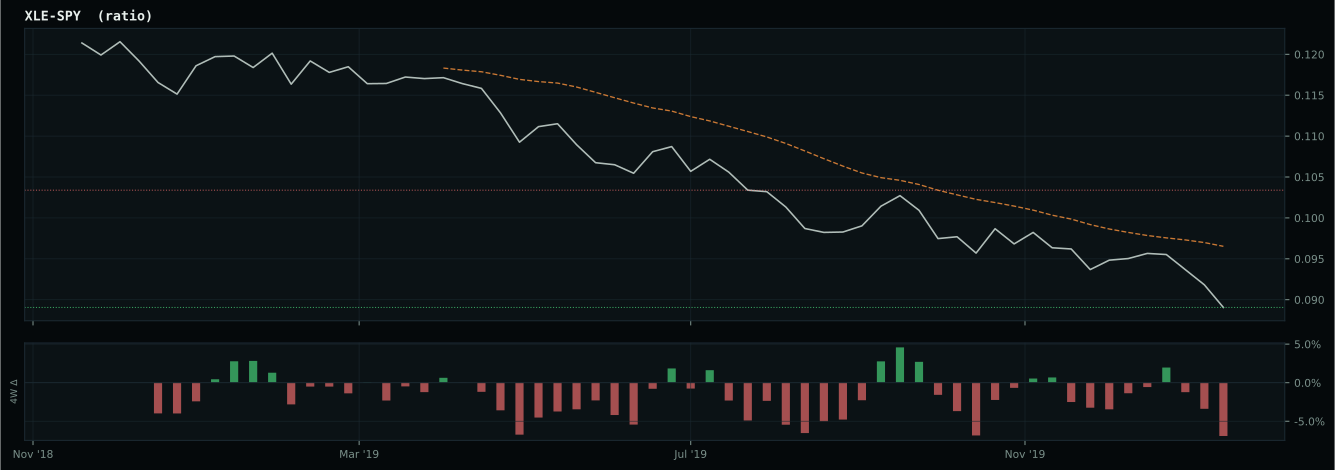
Market-implied signals behind the macro regime scores. Each ratio compares two assets; the direction and slope of the ratio is what the macro engine reads.
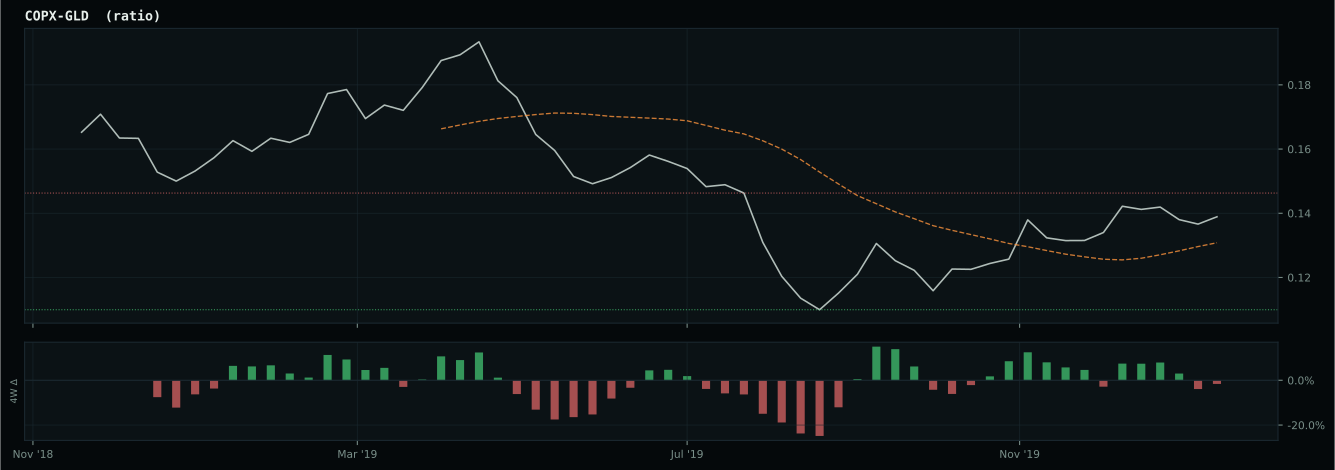
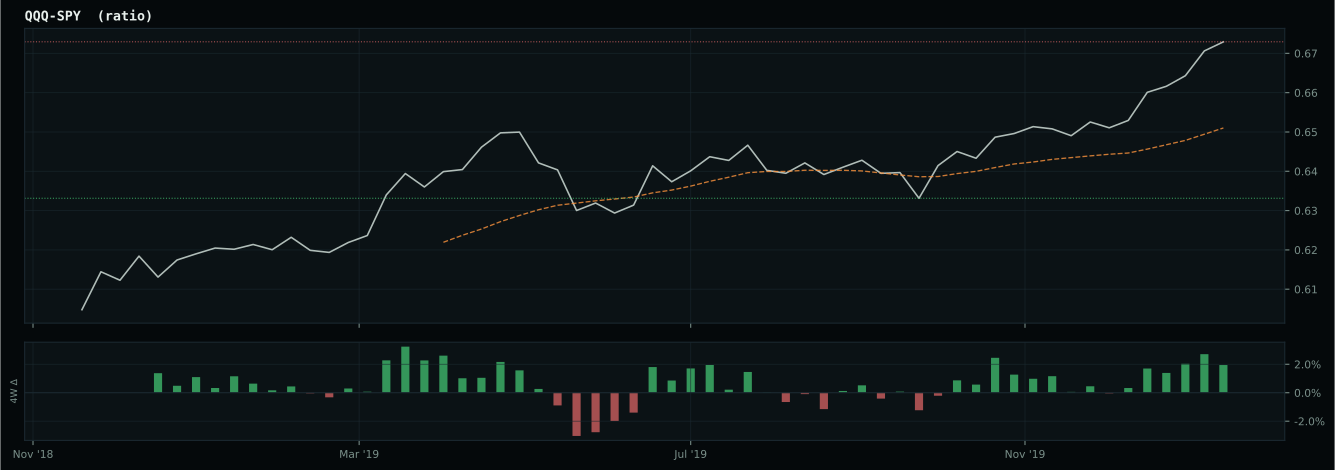
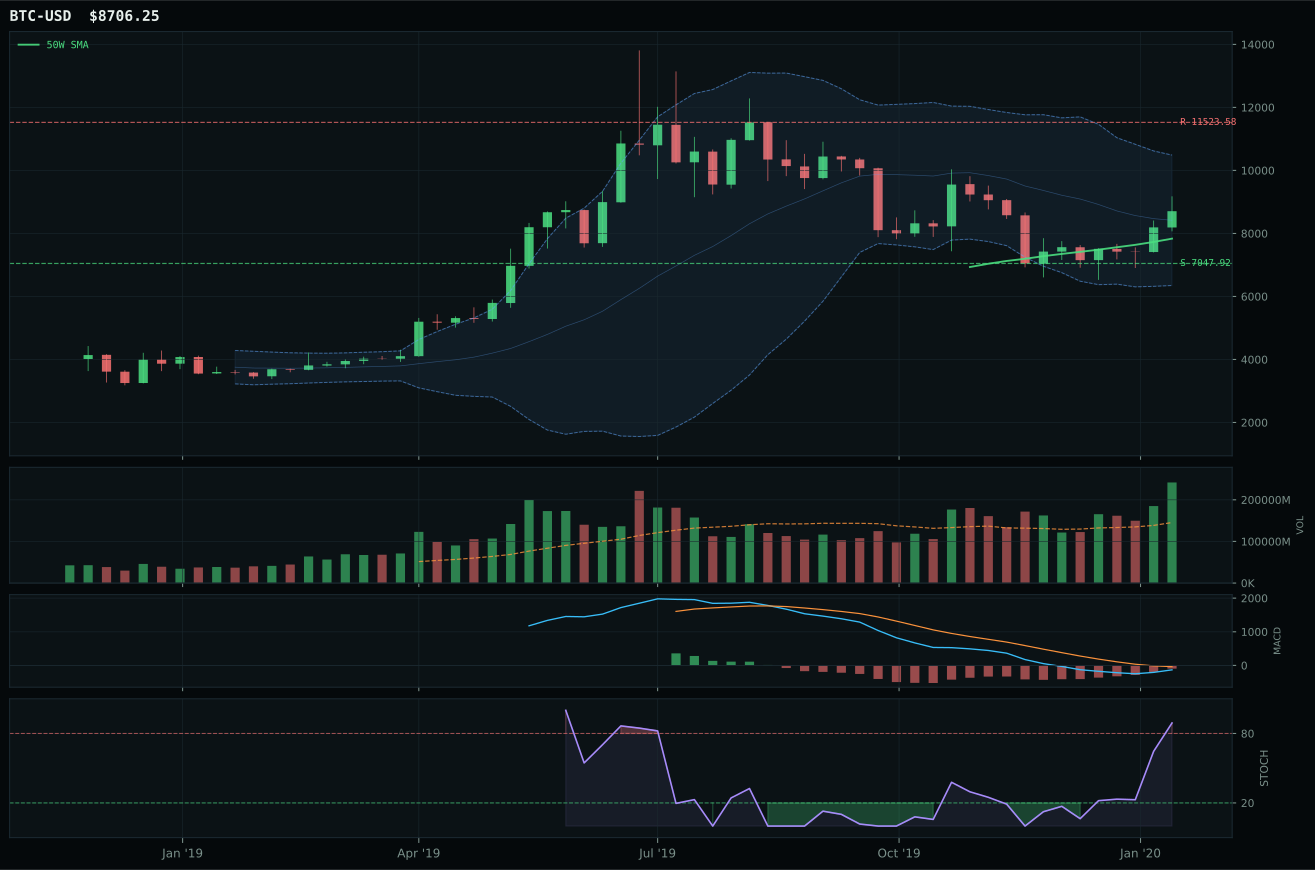
Crypto Regime — TrendBTC
post-touch structure is too wide to count as a range; max/min close ratio is 3.54
TrendBTC confirmed: 2 consecutive closes above rising/flat 50W SMA
one or more available conditions failed

Category Rankings
| Rank | Category | Winner | Score | Alloc | 4W Ret | Peers (4W) |
|---|---|---|---|---|---|---|
| 1 | Technology | IGV | 73.5 | 20% | +5.81% | CIBR +1.3% · XLK +4.5% |
| 2 | Emerging Markets | IEMG | 67.0 | 20% | -3.11% | INDA -1.7% · ILF -5.2% |
| 3 | AI | BOTZ | 61.4 | 10% | +0.76% | SMH +1.5% · AIQ +3.8% |
| 4 | Defense & Aerospace | XAR | 53.5 | 10% | +1.83% | ITA +2.6% · ROKT +0.1% |
| 5 | Precious Metals | GLD | 52.7 | 10% | +2.82% | SLV +1.7% · GDX +1.2% |
| 6 | Utilities & Infrastructure | XLU | 51.5 | 10% | +5.60% | IGF +1.6% · PAVE +0.1% |
| 7 | Industrial Metals | PICK | 48.0 | 10% | -8.09% | REMX -3.5% · COPX -8.5% |
| 8 | Agriculture & Livestock | MOO | 41.0 | 10% | -4.01% | WEAT -2.5% · VEGI -2.7% |
| 9 | Nuclear Energy | URA | 31.8 | 0% | -0.64% | NLR +3.7% |
| 10 | Traditional Energy | XLE | 15.1 | 0% | -7.98% | FCG -18.5% · XOP -16.1% |
Technology — IGV
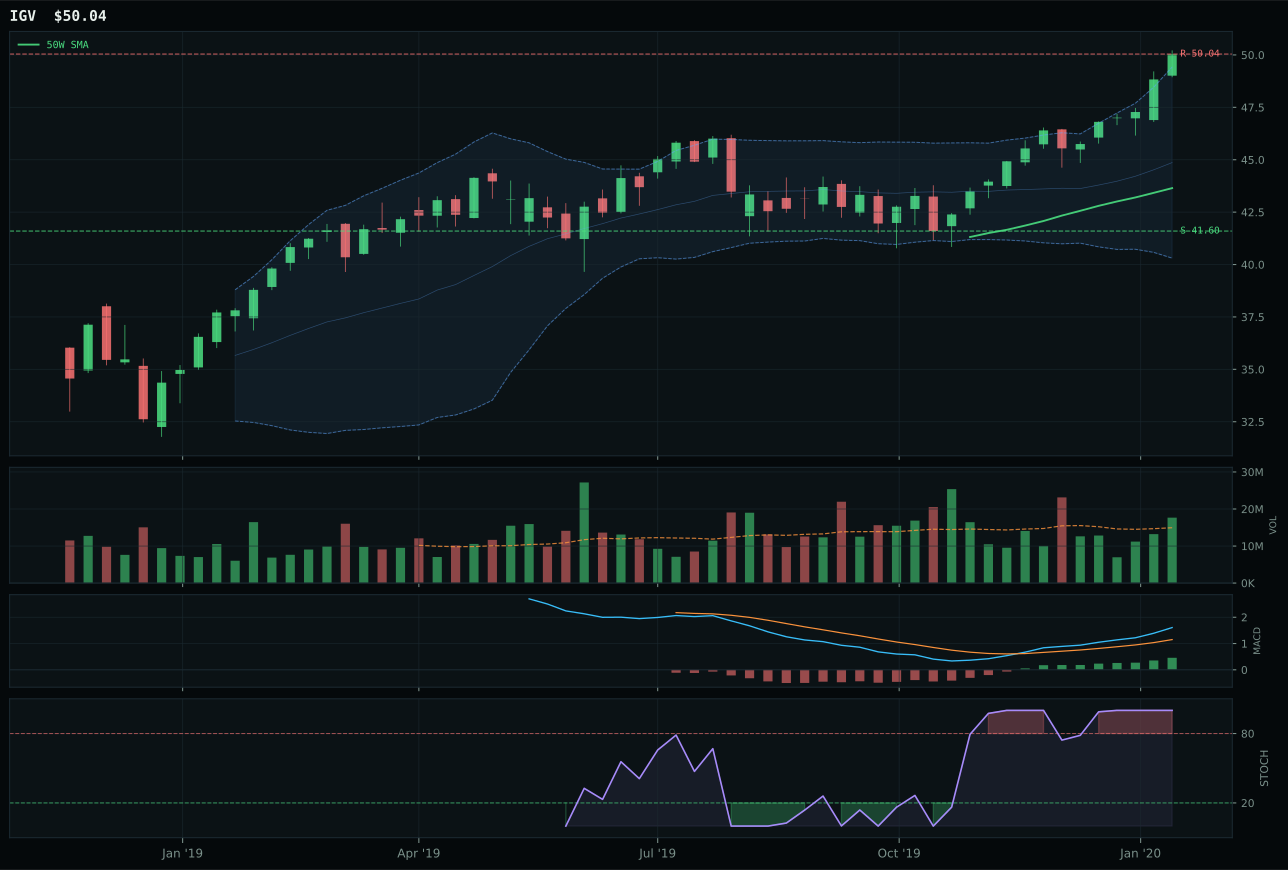
IGV has a neutral structure profile with 8.9% 13-week relative strength versus SPY.
A failed hold above support would weaken the setup.
Actionable but governed by invalidation levels.
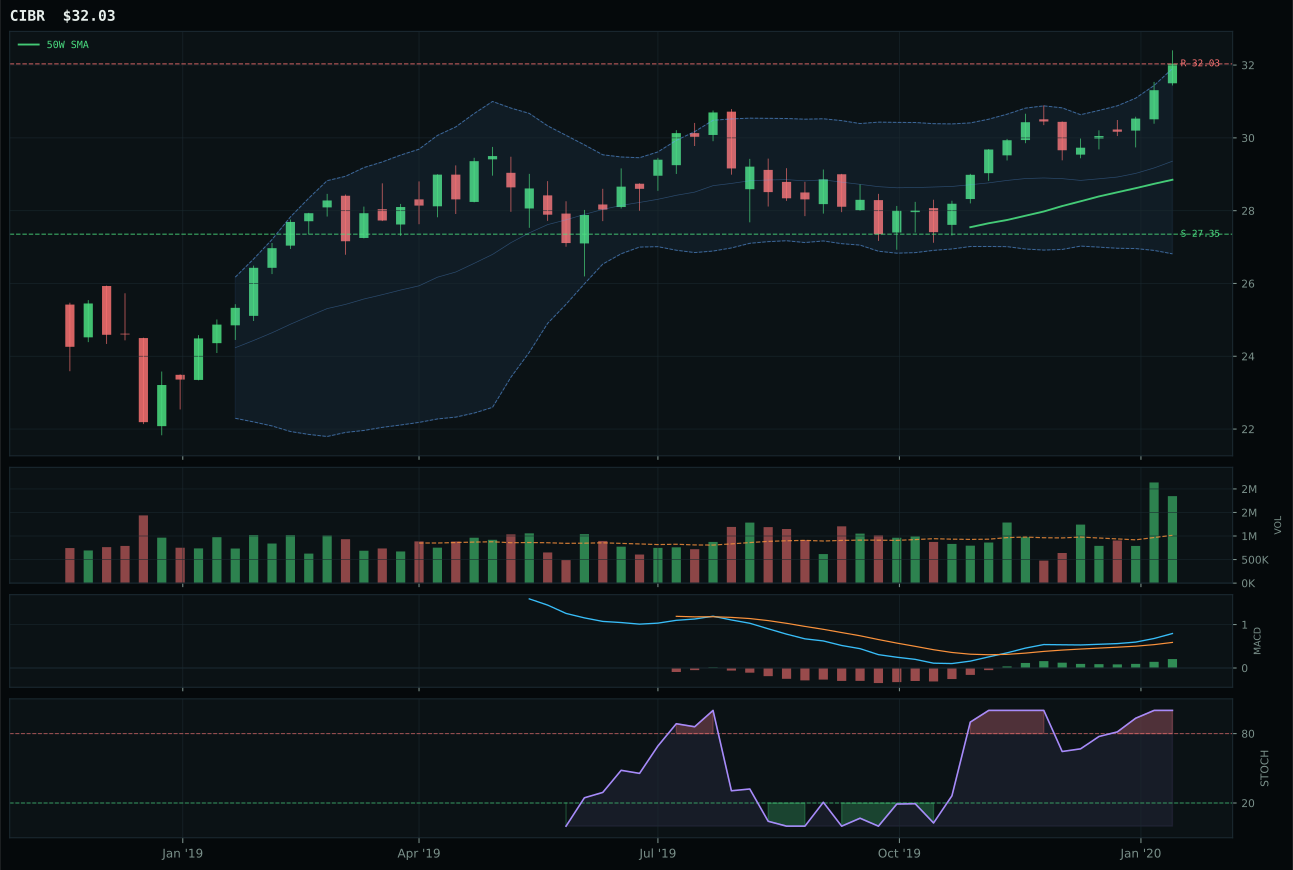
CIBR has a neutral structure profile with 5.5% 13-week relative strength versus SPY.
A failed hold above support would weaken the setup.
Actionable but governed by invalidation levels.
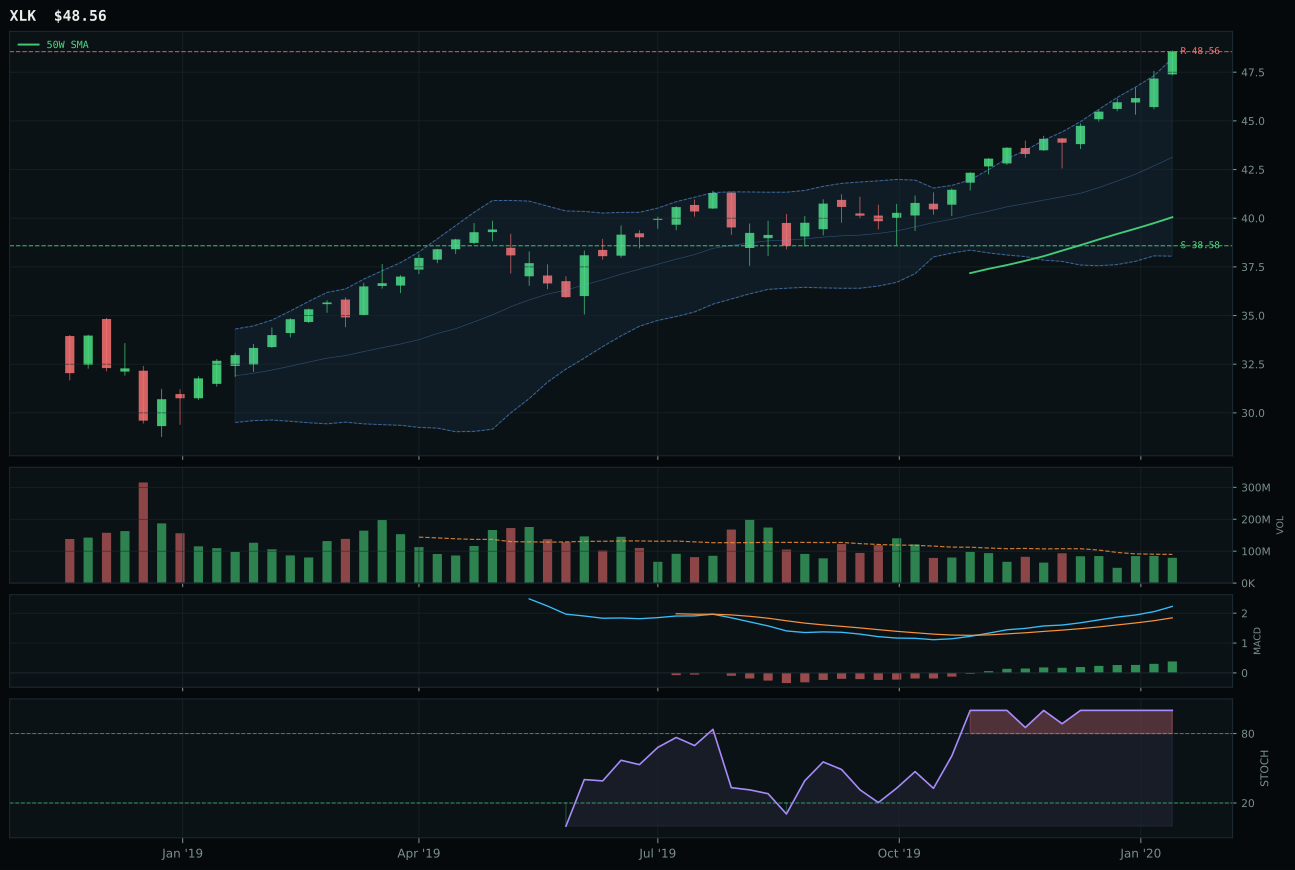
XLK has a vertical extension profile with 8.6% 13-week relative strength versus SPY.
A failed hold above support would weaken the setup.
Actionable but governed by invalidation levels.
IGV wins the category by capturing category-relative strength of 0.3% versus CIBR's -3.2%, a decisive edge that reflects where institutional accumulation is actually occurring within enterprise software versus cybersecurity. Price sits 14.7% above the 50W moving average with a neutral structure and above-average volume participation at 1.18x the 20-week baseline, signaling that buyers are stepping in to confirm the 20.3% thirteen-week return rather than fading it. MACD is bullish and improving with stochastic RSI in overbought territory at 1.00, the technical confirmation IGV needs to justify its relative strength proof over CIBR. Support sits at 41.60 and resistance at 50.04, leaving risk asymmetry measured as 20.3% downside to support versus minimal upside to resistance—a setup that rewards holding existing positions but penalizes fresh entries at current extension. The 8.9% relative strength versus SPY justifies the category weighting despite the tight score gap of only 1.1 points, because technical evidence at 90.2/100 outweighs CIBR's marginally superior macro fit of 52.0 versus 47.0.
Technology earned 10% allocation as one of the two highest-ranking categories this week, placing it in the top-2 overweight tier. The 73.5 final category score was built on bullish momentum confirmation across the three-ETF basket weighted 3/2/1 and tested against leadership, volume-price sponsorship, and persistence metrics in a Transition/Mixed macro regime. Risk appetite positive descriptor remains active at +9 weighting, and AI growth sponsorship adds another +6, offsetting the -7 penalty from active credit stress; this balanced macro tailwind kept the category competitive despite the extended technical setup. The allocation reflects that enterprise software and duration-sensitive growth have superior volume-price confirmation and relative strength profile versus peer categories ranked 3–8, even though every new buyer here is fighting against the 14.7% extension above the 50W moving average. Category-level macro fit of 58.0/100 supports the tier-2 positioning because the technical evidence at 62% weighting dominates over the mixed macro narrative at 38%, and that technical strength alone justifies committing capital against a crowded tape.
Emerging Markets — IEMG
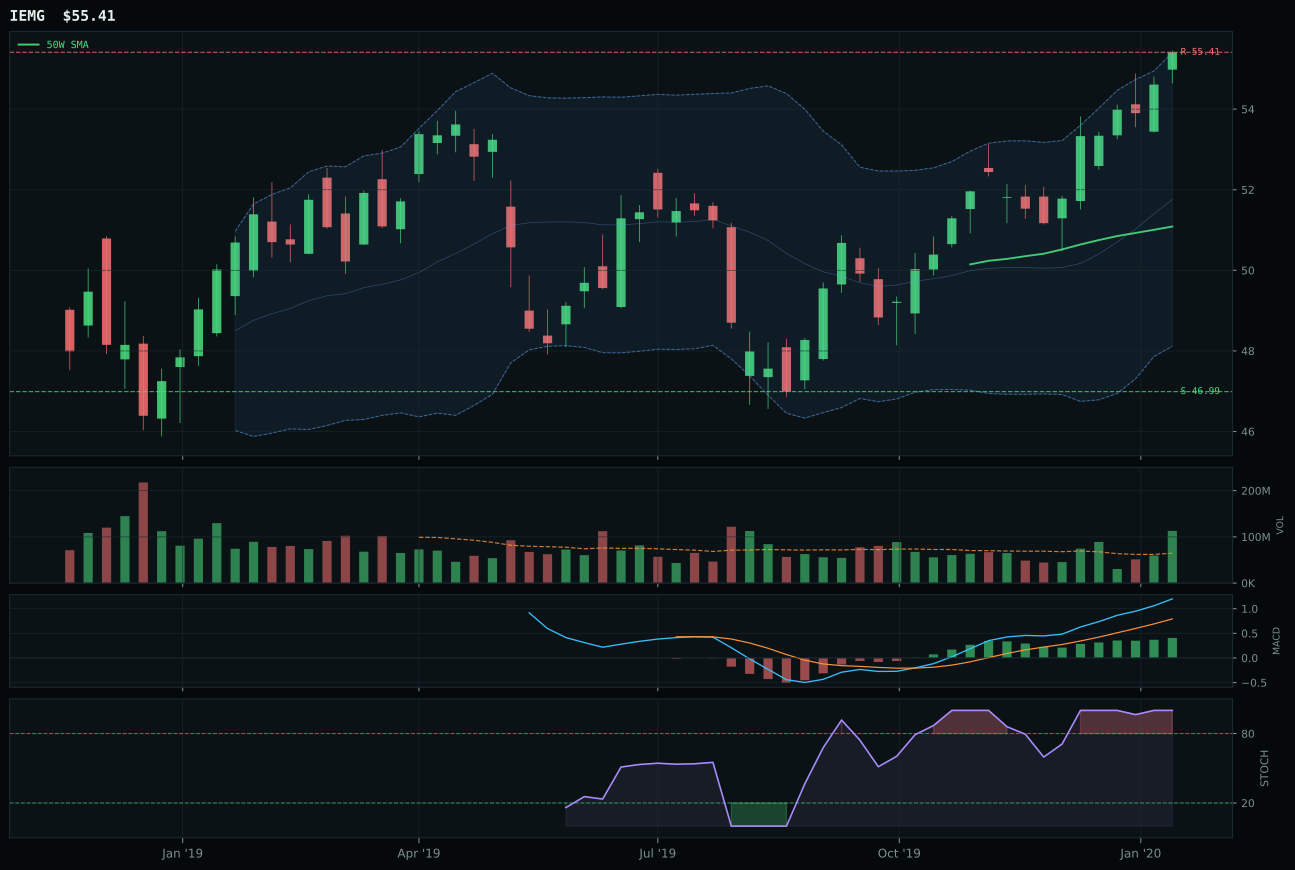
IEMG has a neutral structure profile with -1.4% 13-week relative strength versus SPY.
A failed hold above support would weaken the setup.
Actionable but governed by invalidation levels.
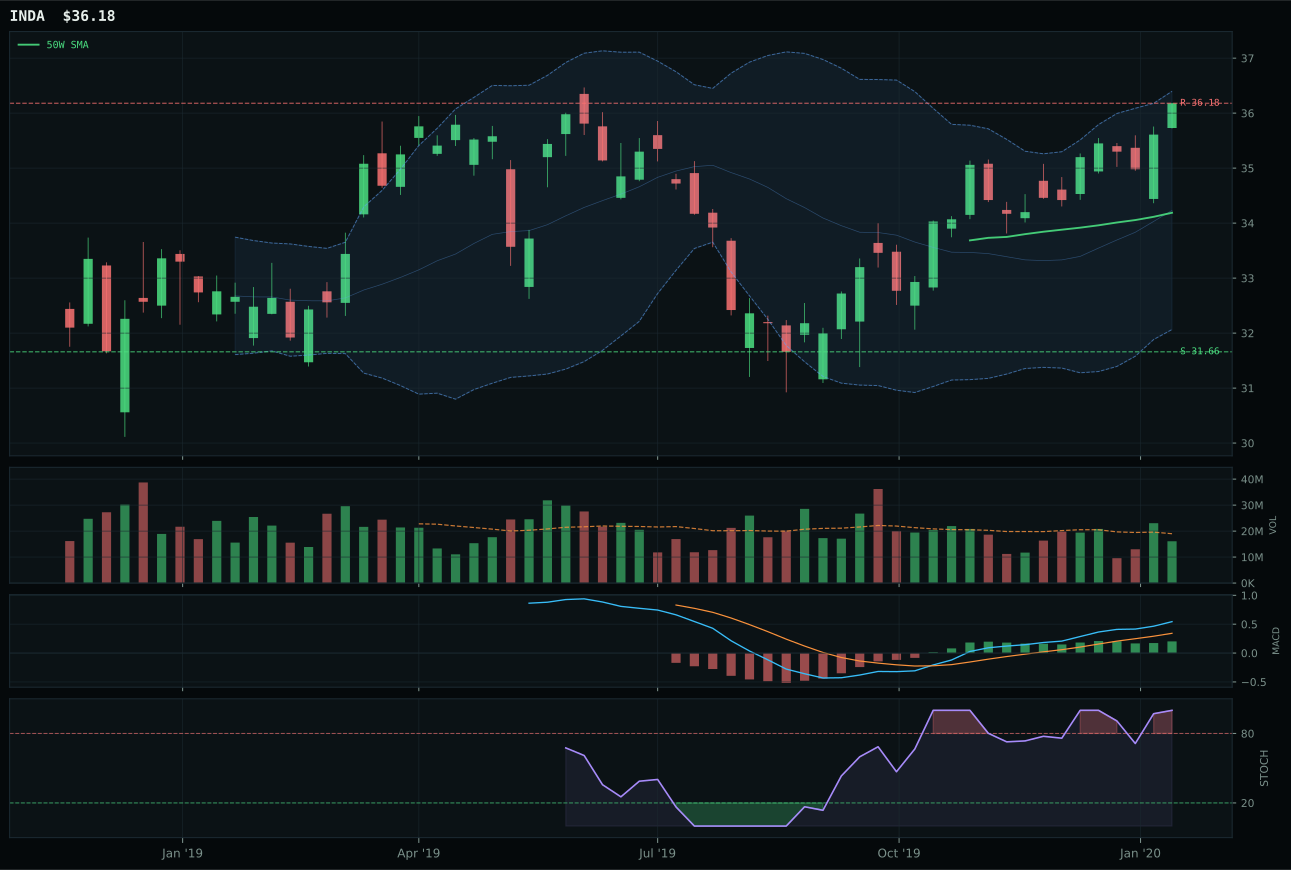
INDA has a neutral structure profile with -5.1% 13-week relative strength versus SPY.
A failed hold above support would weaken the setup.
Actionable but governed by invalidation levels.
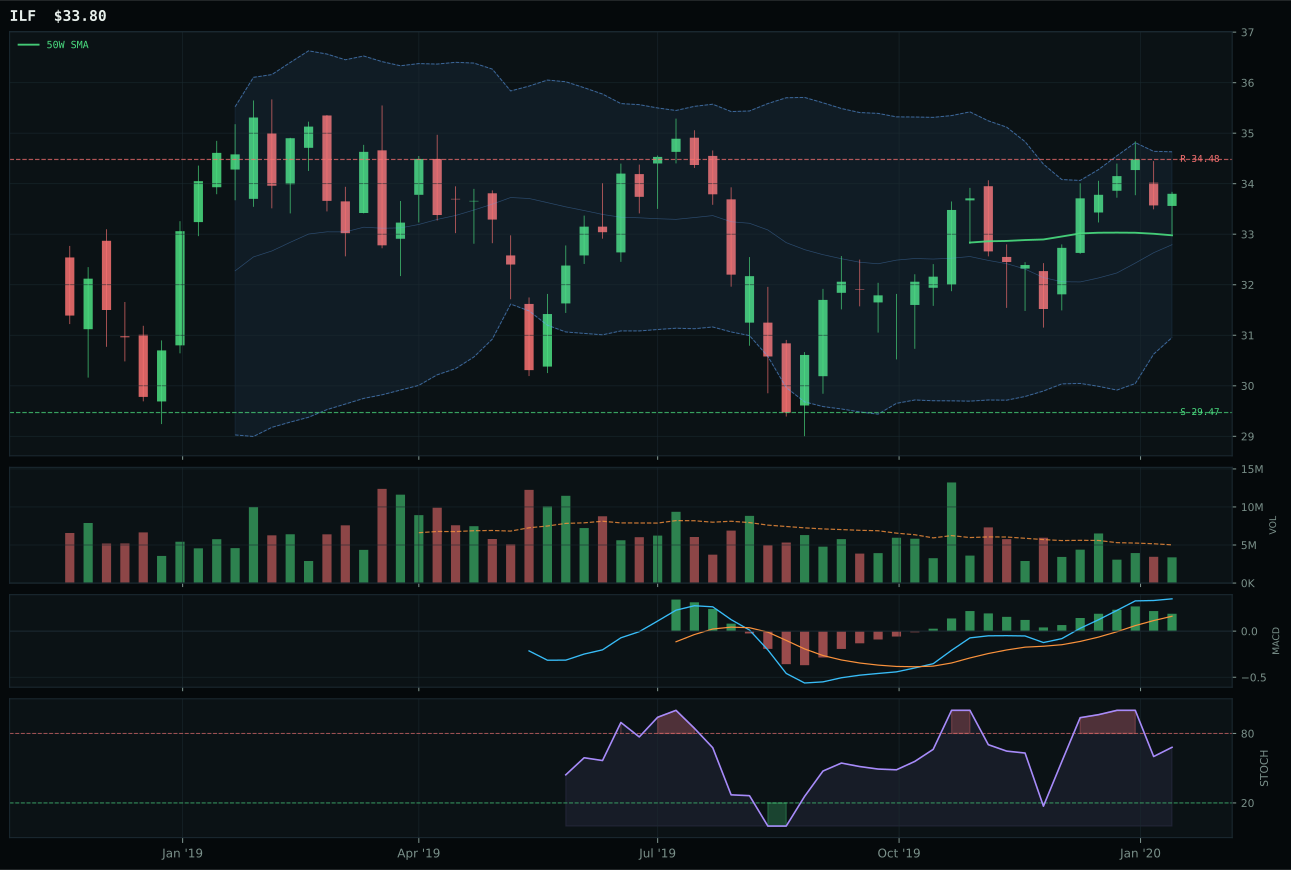
ILF has a compression near 50W profile with -6.3% 13-week relative strength versus SPY.
A failed hold above support would weaken the setup.
Actionable but governed by invalidation levels.
IEMG wins decisively by combining superior volume-price confirmation with category-relative strength that matters: accumulation at 1.75x the 20W baseline and +3.6% category-relative strength versus INDA's neutral volume and dead-even 0.0% relative performance within the basket. Price sits only 8.5% above the 50W with MACD bullish and improving and stochastic RSI overbought at 1.00, a far tighter extension than INDA's implied further-out positioning; timing score of 75.0 reflects this architectural advantage. Momentum confirmation for IEMG reaches 89.0/100 versus INDA's weaker 58, driven by the 10.0% thirteen-week return paired with fresh accumulation in volume—the holy trinity of uptrend proof. Structure at 85.0 is superior to INDA's 76.2, and volume-price confirmation reaches 89.7 versus INDA's 62, painting a picture of genuine institutional adoption rather than technical momentum. The 10.5-point gap to INDA is decisive because broad emerging-market beta is gathering more capital than India-focused quality exposure, a shift that technical measures capture and allocators must respect.
Emerging Markets earned 10% allocation as one of the two highest-ranking categories this week, joining Technology in the top-2 overweight tier. The 67.0 final score reflects IEMG's superior technical evidence of 98.8/100—the highest composite technical score in the portfolio—combined with macro support from EM liquidity support active at +14 weighting and risk appetite positive at +8. Credit stress active at -8 creates headwind, but the net macro score of 62.0/100 at category level provides genuine structural support. IEMG's accumulation/confirmation volume and 10.0% thirteen-week return prove that capital is actively rotating into EM exposure in a mixed regime where risk appetite remains positive; the 3/2/1 weighted basket score of 76.2 before final testing shows broad health across the category. The 10% allocation captures the highest-quality setup in the portfolio: price near 52-week highs but with fresh accumulation, bullish-and-improving MACD, clean structure, and genuine macro sponsorship. What would sustain this top-2 positioning: continued accumulation on any pullback and sustained EM liquidity support descriptor active. This category earned its seat at the table.
AI — BOTZ
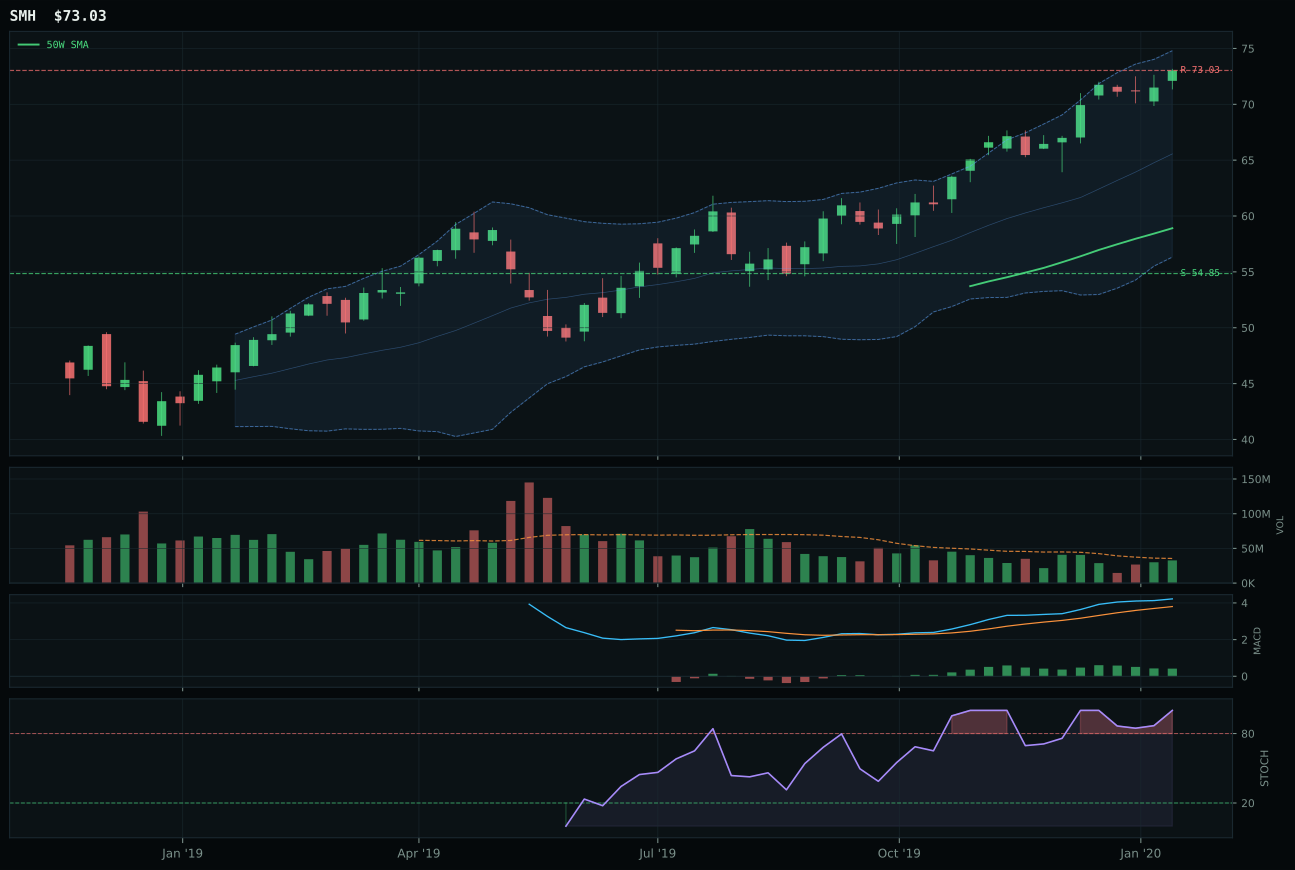
SMH has a vertical extension profile with 8.2% 13-week relative strength versus SPY.
A failed hold above support would weaken the setup.
Actionable but governed by invalidation levels.
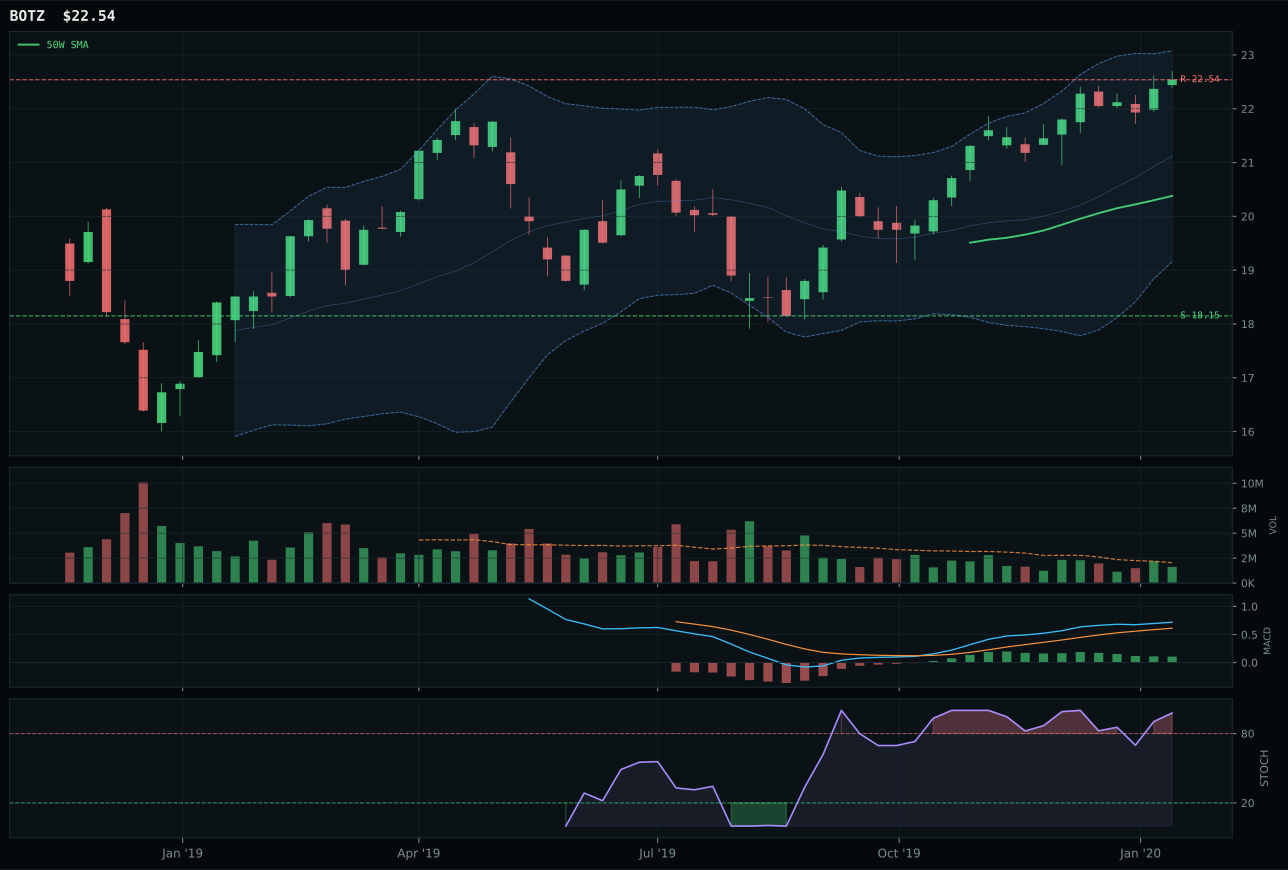
BOTZ has a neutral structure profile with -0.4% 13-week relative strength versus SPY.
A failed hold above support would weaken the setup.
Actionable but governed by invalidation levels.
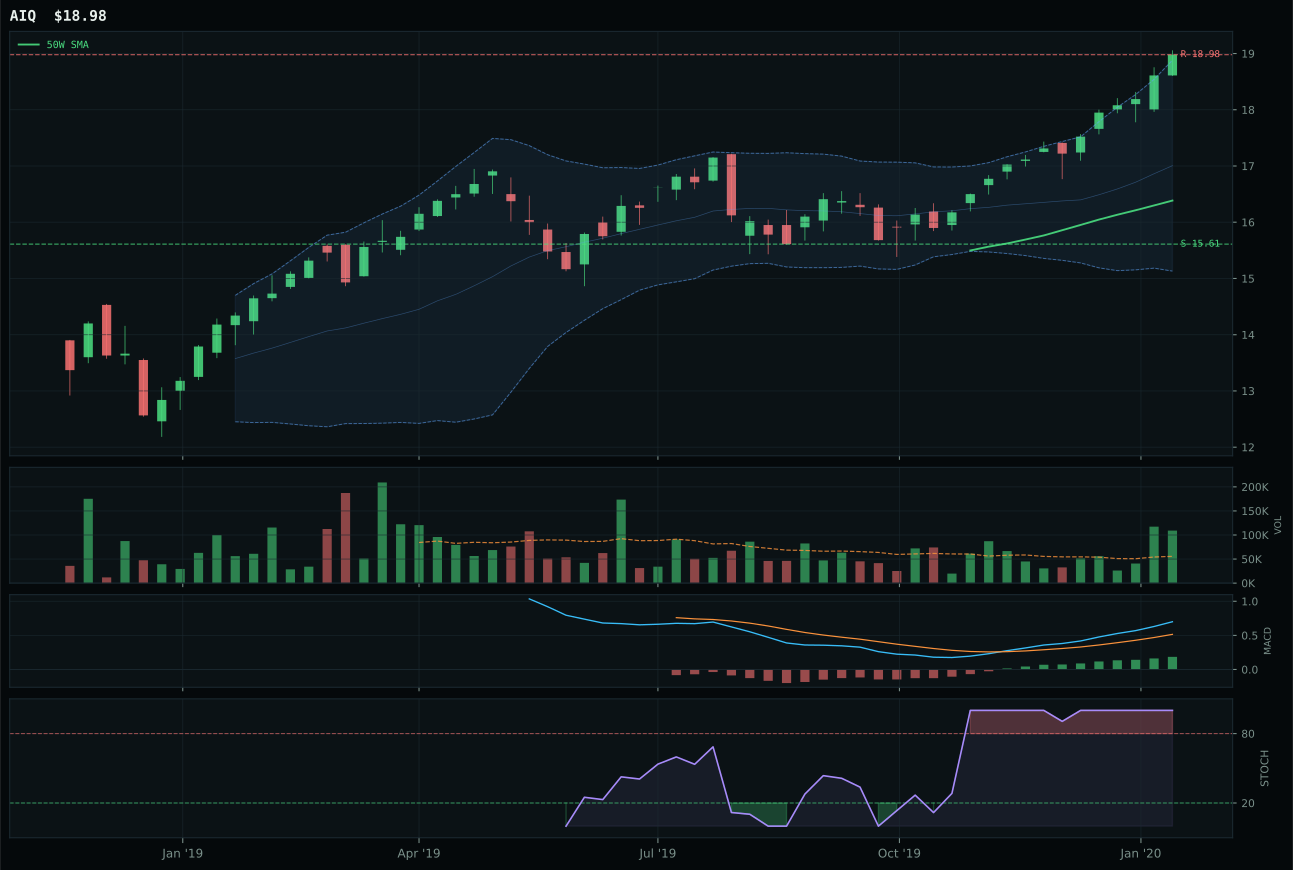
AIQ has a vertical extension profile with 8.0% 13-week relative strength versus SPY.
A failed hold above support would weaken the setup.
Tracked, but not top-2 eligible because: .
BOTZ wins despite being the structurally weaker setup of the category because its neutral structure and -8.4% category-relative strength underperformance force the allocator to demand proof of accumulation rather than mere momentum extension. Price sits only 10.6% above the 50W with MACD bullish but flattening—a clear deterioration signal—and stochastic RSI overbought at 0.98, yet neutral volume at 0.79x the 20-week baseline means the rally is being held by technicians, not fresh money. SMH runs 24.0% above the 50W into vertical extension, a far more dangerous setup despite stronger near-term returns of 19.6% over thirteen weeks; that extended position costs SMH 22 points of timing score relative to BOTZ (32.0 versus 54.0), a gap that cannot be bridged by SPY-relative strength of 8.2% alone. Support sits at 18.15 and resistance at 22.54, offering 24.2% downside cushion versus minimal upside, making this category's risk/reward mathematics untenable for new capital at week-end pricing. The 5.1-point gap to SMH reflects SMH's stronger macro narrative around AI growth sponsorship at +14 weighting, but technical evidence at 57.3 for BOTZ versus 63.5 for SMH proves that the category structure is simply too extended for either to be a tier-1 allocation.
AI received 5% allocation as a tier-2 category, ranked below Technology and Emerging Markets but still eligible for capital commitment in a mixed macro regime. The 61.4 final score came from testing the 3/2/1 weighted basket of SMH, BOTZ, and AIQ against persistence, volume-price confirmation, and timing quality; the category failed to crack top-2 because both IGV and IEMG posted higher composite scores with superior setup architecture. AI growth sponsorship is active at +14 and risk appetite positive at +10, providing macro tailwind, but those descriptors could not overcome the structural reality that every ETF in the category sits in or near 52-week highs with overbought momentum and flattening MACD—the hallmark of an extension that has already paid holders generously but punishes new entry. What would elevate AI to top-2 status: a pullback into the 50W moving average with volume that dried up rather than confirmed, followed by fresh accumulation above that level with MACD reacceleration. Until that setup materializes, holding the 5% position acknowledges that AI exposure deserves portfolio representation for growth sponsors, but the technical setup forbids overweight concentration.
Defense & Aerospace — XAR
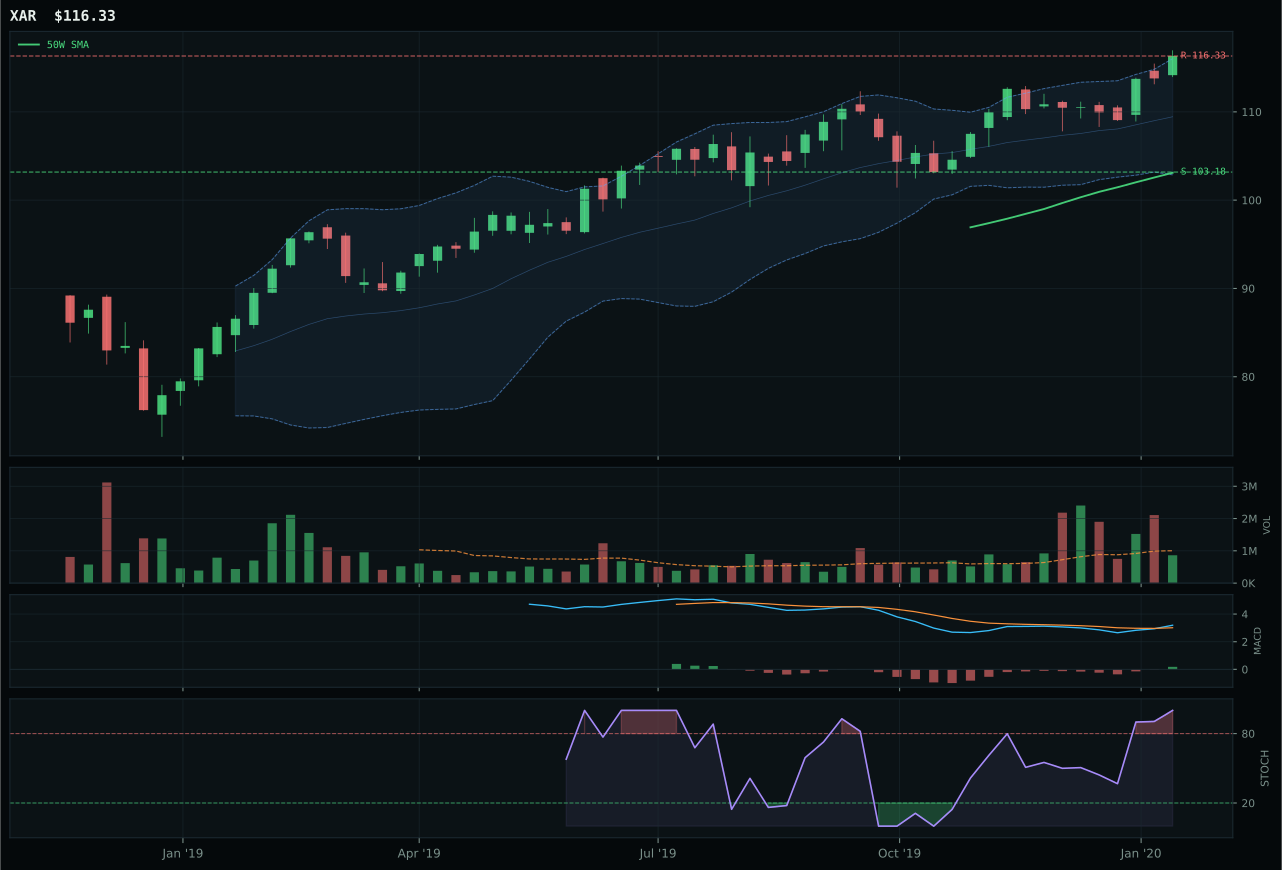
XAR has a neutral structure profile with 1.3% 13-week relative strength versus SPY.
A failed hold above support would weaken the setup.
Actionable but governed by invalidation levels.
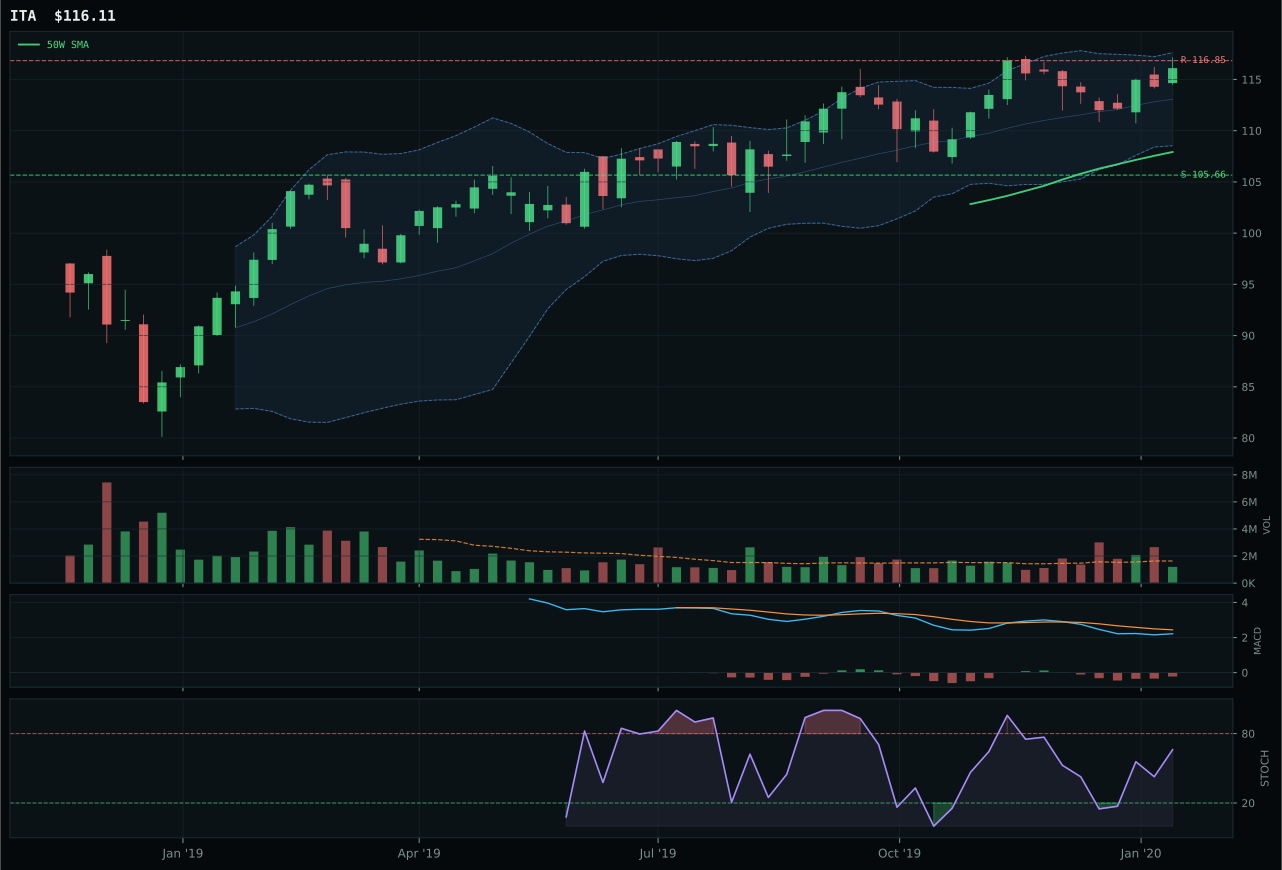
ITA has a neutral structure profile with -3.9% 13-week relative strength versus SPY.
A failed hold above support would weaken the setup.
Actionable but governed by invalidation levels.
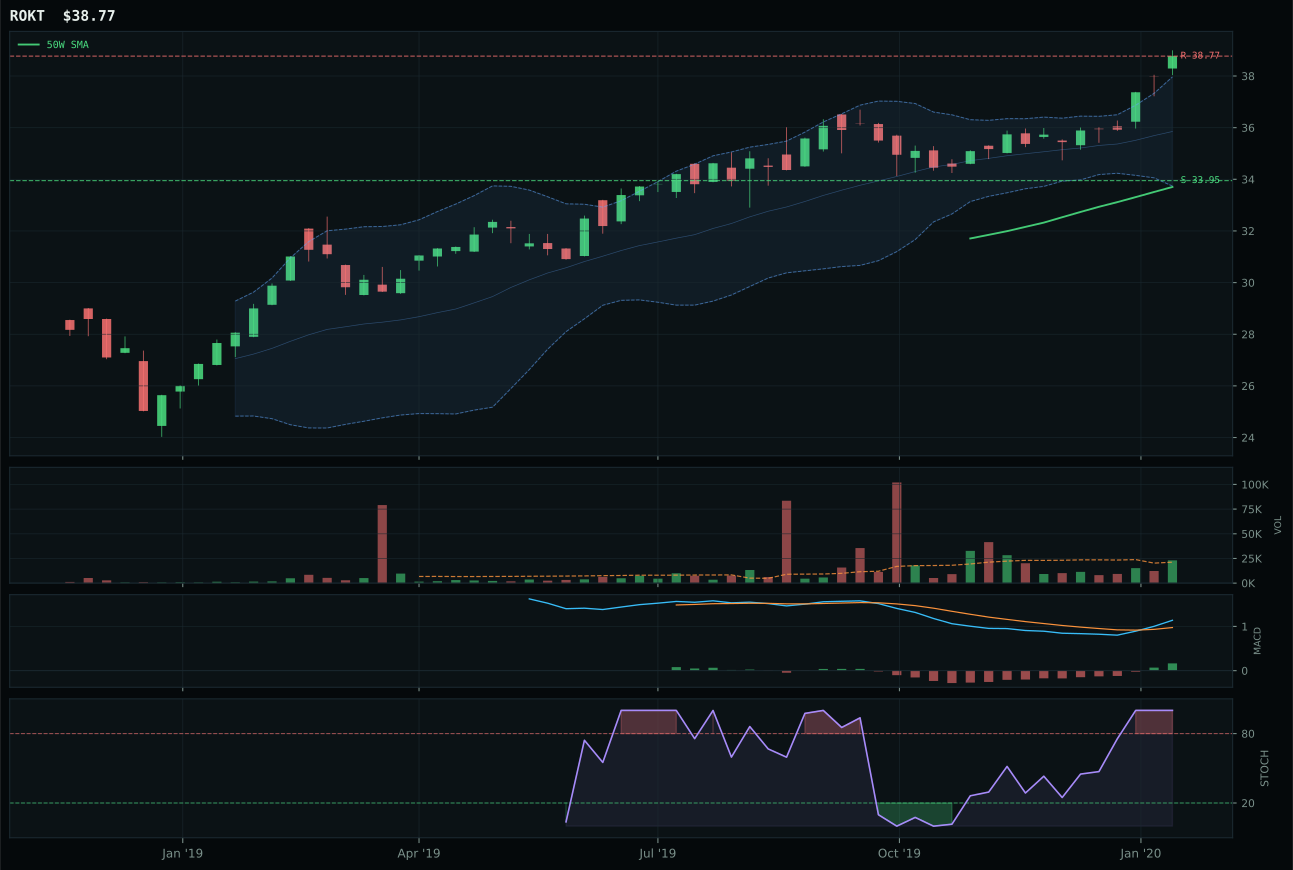
ROKT has a vertical extension profile with 1.1% 13-week relative strength versus SPY.
A failed hold above support would weaken the setup.
Tracked, but not top-2 eligible because: .
XAR wins by posting a clean bullish-and-improving MACD with risk/reward of 48.3 versus ITA's bearish-but-improving MACD and inferior risk/reward of 38.1, a meaningful divergence in confirmation quality that matters when both ETFs sit in neutral structure near 52-week highs. Price sits 12.8% above the 50W with neutral volume at 0.86x the 20-week average and stochastic RSI overbought at 1.00, generating a clean trend score of 100.0 from price above both the 50W and 200W; ITA's negative category-relative strength of -5.0% versus XAR's 0.2% signals that accumulation is rotating into the broader defense index rather than defense primes. Structure cleanliness favors XAR at 78.2 versus ITA's 74.0, and momentum confirmation reaches 86.5 for XAR versus only 46 for ITA—a gap so wide it reflects ITA's deteriorating participation and stochastic RSI stuck in the mid-zone rather than confirming new highs. Support at 103.18 offers 12.7% downside cushion, and the 9.5-point gap to ITA reflects ITA's macro headwinds rather than technical evidence, since a defensive-prime narrative does not benefit from risk-appetite-positive or AI-growth-sponsorship descriptors active this week.
Defense & Aerospace earned 5% allocation as a tier-2 category, outside top-2 because its 53.5 final score ranked lower than both Technology and Emerging Markets in the current selection cycle. The category's macro fit of 55.0/100 was neutral on balance—Transition/Mixed helps by +3, and credit stress active adds +2, but no strong thematic tailwind pushed this exposure above the tier-2 line. XAR's technical evidence of 79.9/100 carries weight, and neutral volume at category level means capital is neither flooding in nor fleeing, a steady-state that suits infrastructure allocations in choppy regimes. The 5% position holds because defense contractors retain structural durability when credit stress is active and sentiment remains mixed; what would push this category to top-2: a sustained rotation out of growth categories like Technology into defense names with fresh accumulation and MACD reacceleration. For now, the tier-2 allocation acknowledges the setup is clean but not compelling—XAR's price near 52-week highs leaves limited margin for error, and the category's macro profile offers no tailwind strong enough to justify outsize positioning.
Precious Metals — GLD
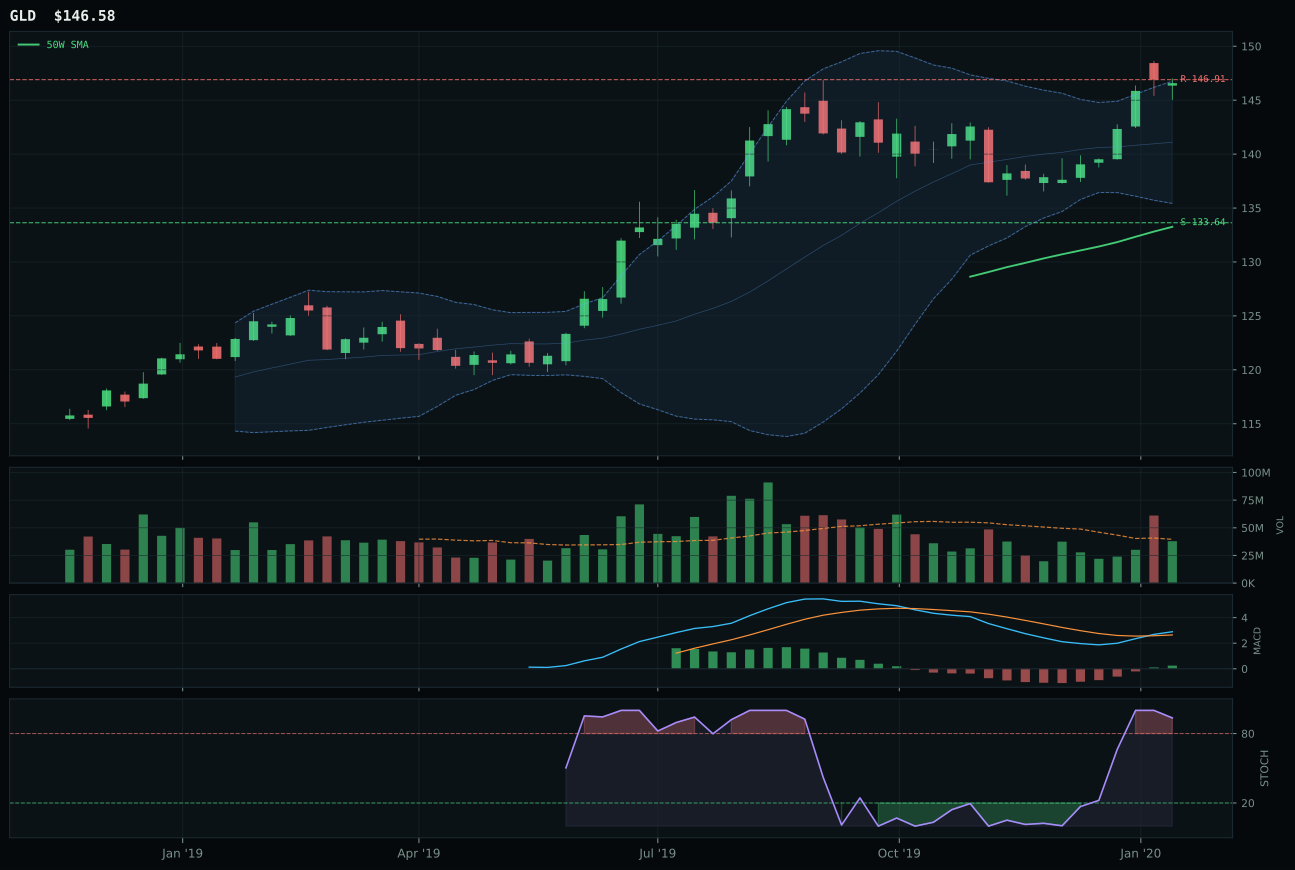
GLD has a neutral structure profile with -7.0% 13-week relative strength versus SPY.
A failed hold above support would weaken the setup.
Actionable but governed by invalidation levels.
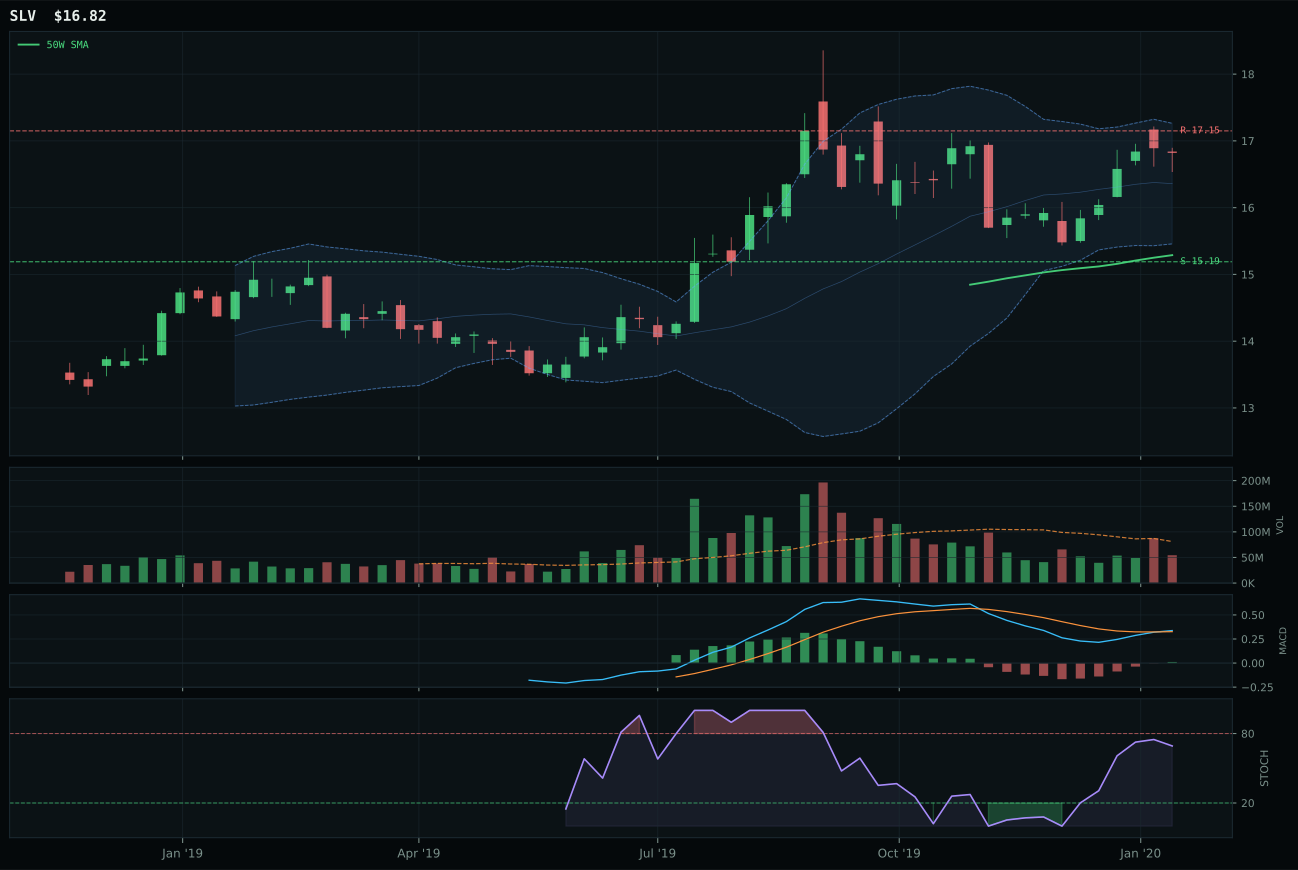
SLV has a neutral structure profile with -8.9% 13-week relative strength versus SPY.
A failed hold above support would weaken the setup.
Actionable but governed by invalidation levels.
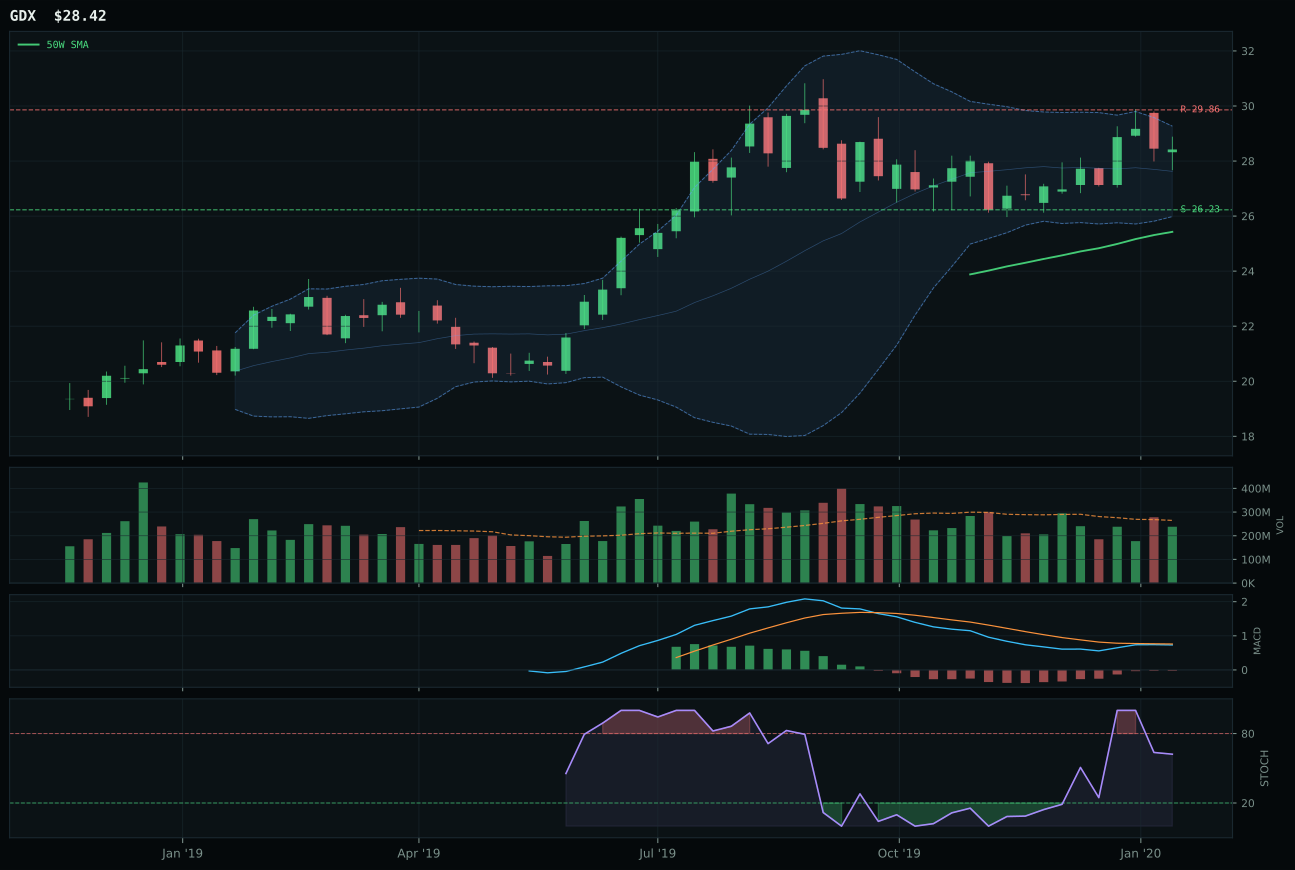
GDX has a neutral structure profile with -6.6% 13-week relative strength versus SPY.
A failed hold above support would weaken the setup.
Actionable but governed by invalidation levels.
GLD wins over SLV by a hair—only 0.2 points separate them—because structure cleanliness favors gold at 79.0 versus silver's 78.2, and volume confirmation holds neutral at 0.96x the 20-week baseline versus SLV's thin participation. Both sit in neutral structure with MACD bullish and improving and stochastic RSI overbought, but GLD's superior timing score of 75.0 reflects the 10.0% distance to the 50W versus SLV's implied greater extension, and gold's near-52-week-high setup near Fib 0.236 is cleaner than silver's upper retracement zone. Risk/reward is compressed across both names—GLD offers -0.2% upside to resistance and 9.7% downside to support, while SLV trades even tighter—but GLD's category-relative strength of 0.0% versus SLV's -1.9% underperformance proves that accumulation has chosen the monetary hedge narrative over the hybrid industrial story. The close score gap reflects active credit stress at -4 weighting for gold, a macro headwind that counterbalances the metals scarcity active signal, leaving both names in a technical holding pattern rather than a fresh accumulation signal.
Precious Metals earned 5% allocation as a tier-2 category, ranked below all top-2 and most peer tier-2 names because its 52.7 final score reflects weak momentum confirmation and compressed risk/reward across the basket. Category-level macro fit of 46.0/100 is the lowest among tier-2 allocations, dragged down by risk-appetite-positive active at -4 weighting—a signal that improving sentiment works against defensive metals positioning. GLD's technical evidence of 71.2/100 is respectable but not exceptional, and the category's 3/2/1 basket score of 61.4 before final testing shows that neither gold nor silver is firing on all cylinders. The 5% position holds because precious metals remain the cleanest monetary hedge when credit stress is active, a theme that cannot be fully negated by improving risk appetite; what would upgrade this category: a confirmed breakdown below the 50W moving average with volume acceleration and MACD rolling over, signaling fresh capital rotation into metals. For now, the tier-2 allocation treats metals as a portfolio ballast that works when sentiment turns sharply negative—a position to hold, not to add to at current valuations near 52-week highs.
Utilities & Infrastructure — XLU
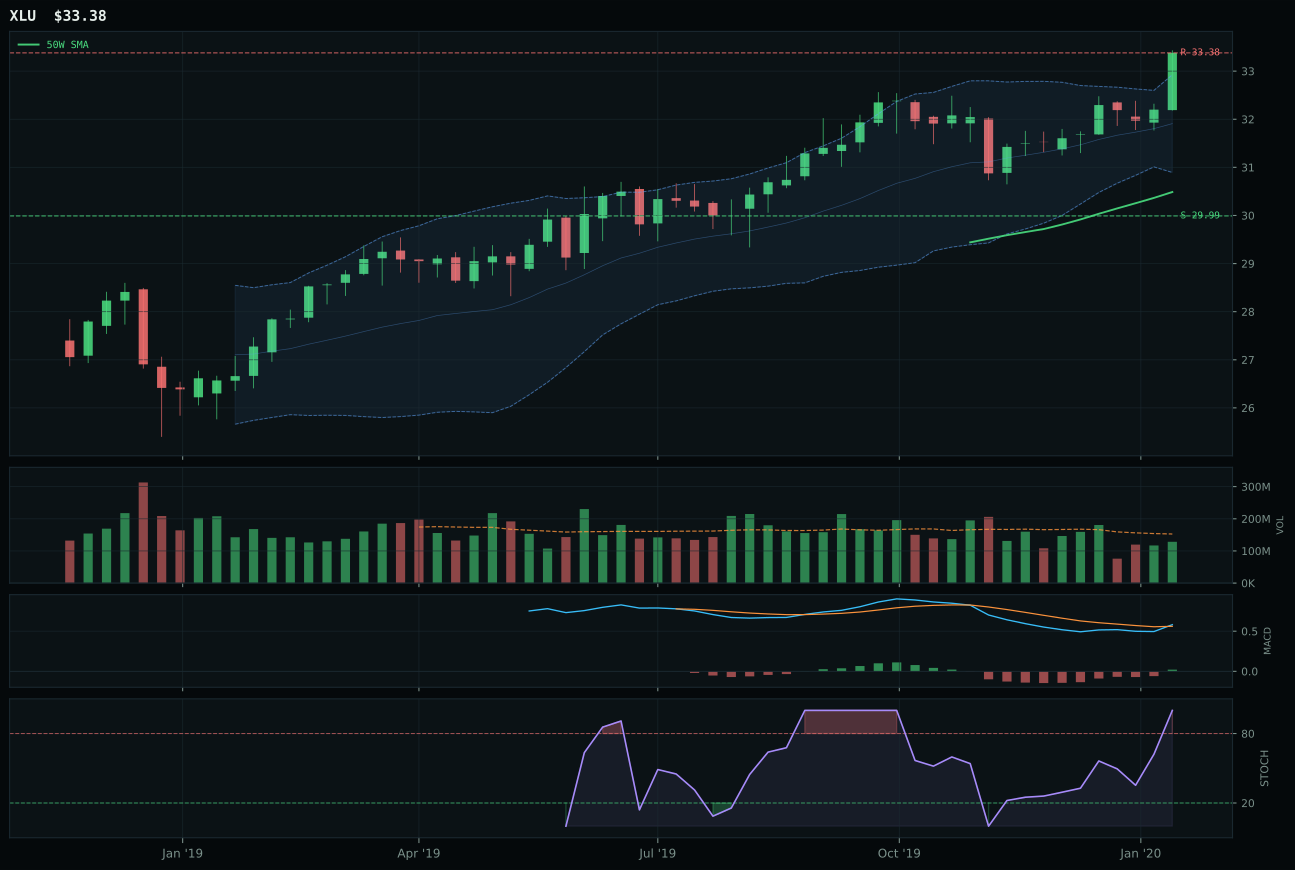
XLU has a neutral structure profile with -6.8% 13-week relative strength versus SPY.
A failed hold above support would weaken the setup.
Actionable but governed by invalidation levels.
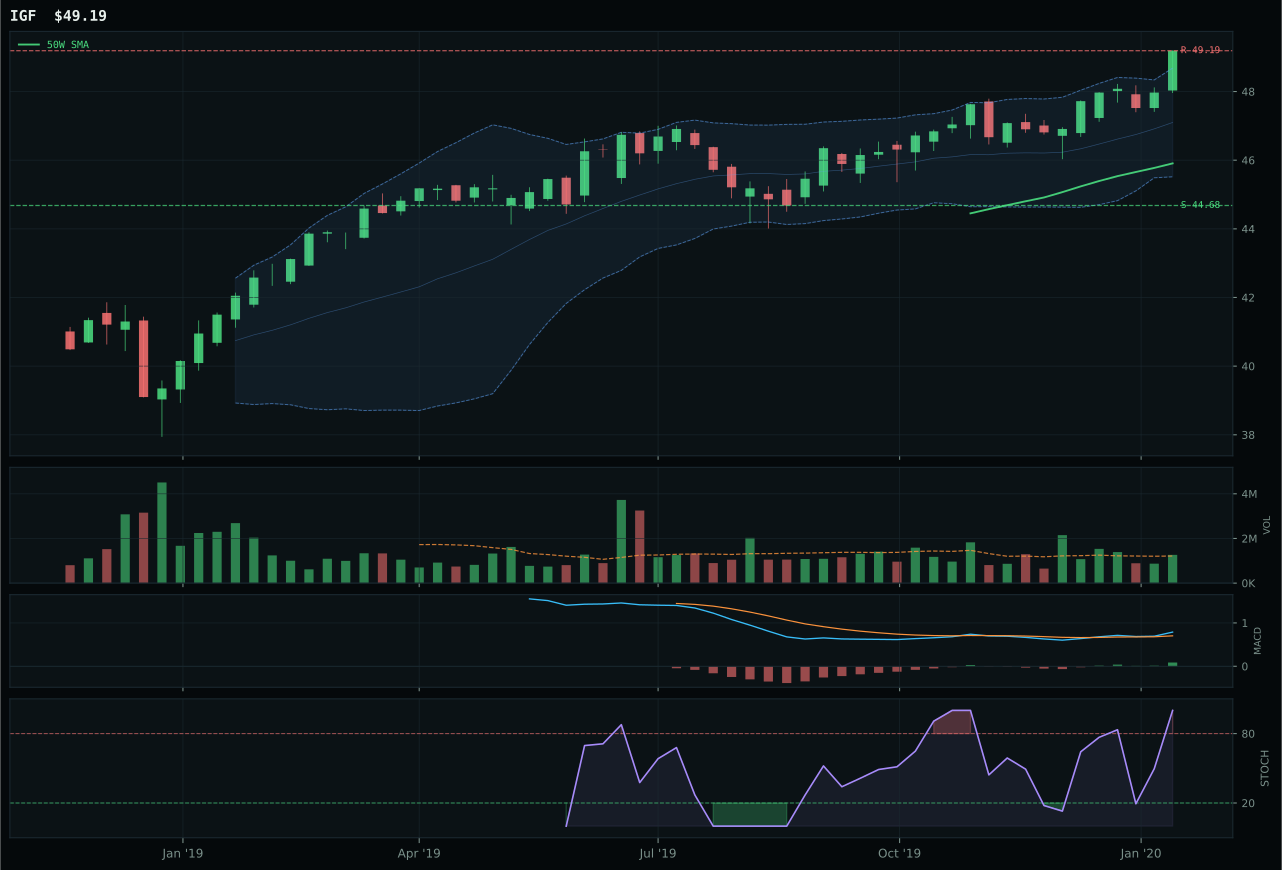
IGF has a neutral structure profile with -6.4% 13-week relative strength versus SPY.
A failed hold above support would weaken the setup.
Actionable but governed by invalidation levels.
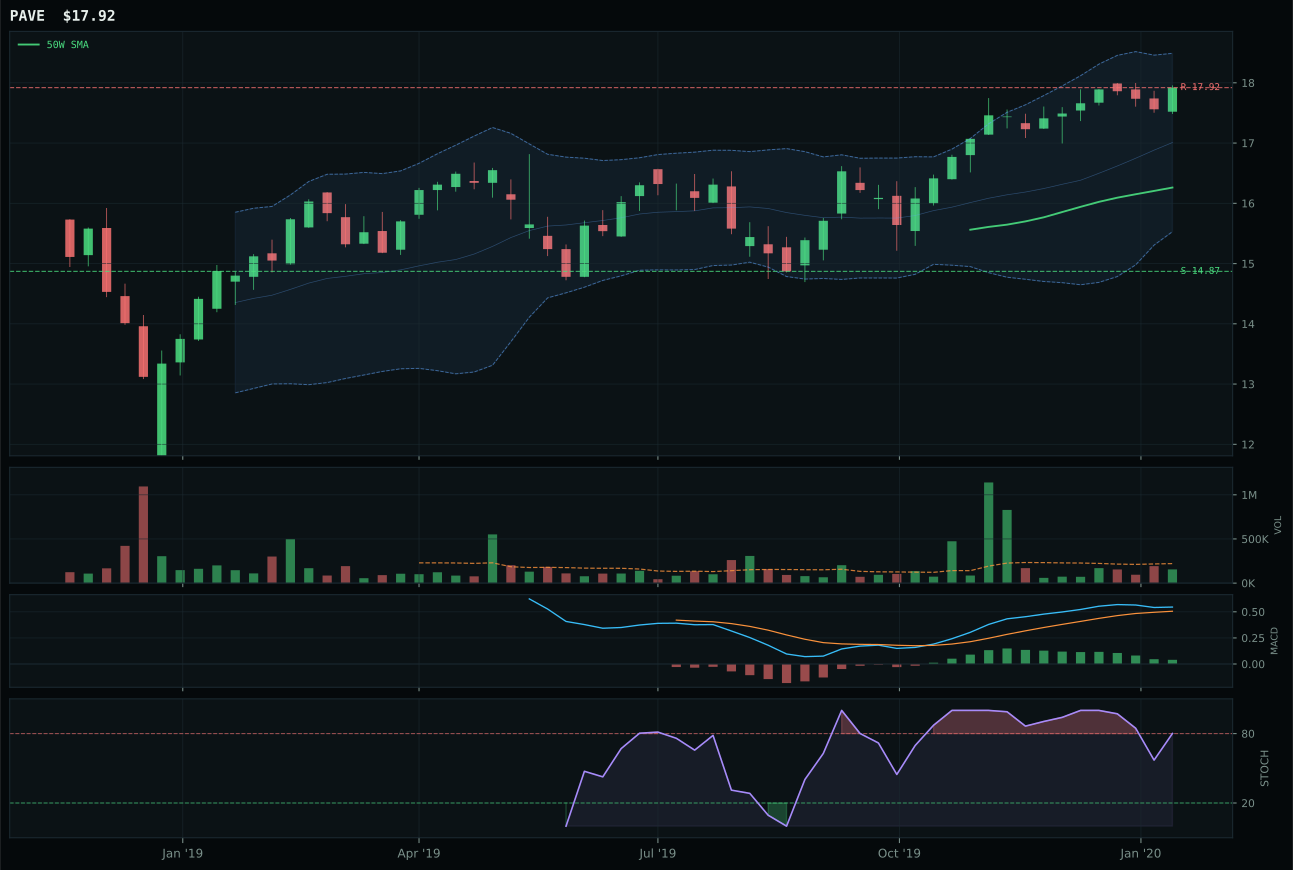
PAVE has a neutral structure profile with -2.2% 13-week relative strength versus SPY.
A failed hold above support would weaken the setup.
Tracked, but not top-2 eligible because: .
XLU wins by a margin of 0.6 points over IGF—the closest call in the tier-2 tier—because its risk/reward of 49.7 edges IGF's 51.0 by a marginal amount, and technical blending across trend, structure, and timing produces a marginally superior composite. Both sit in neutral structure near 52W highs with MACD bullish and improving, stochastic RSI overbought at 1.00, and neutral volume around 0.84x the 20W baseline for XLU and 0.80x for IGF, but XLU's trend score of 89.8 versus IGF's 90.0 and identical timing of 75.0 mean this is a tie-break decided by risk/reward architecture. XLU's support at 29.99 offers 11.3% downside cushion versus IGF's 11.9%, a negligible difference; upside to resistance is 0% for both names. The category-relative strength of -0.4% for XLU versus 0.0% for IGF proves that capital is not flooding into either position—this is a steady-state allocation where technician enthusiasm holds the line. The fractional margin illustrates that both setups are equally valid, and portfolio managers could reasonably hold either one.
Utilities & Infrastructure received 5% allocation as a tier-2 category, ranked outside top-2 because its 51.5 final score lagged Technology and Emerging Markets despite offering clean, defensible technical setups. Category-level macro fit of 52.0/100 is neutral—Transition/Mixed regime helps by +4, but risk appetite positive is active at -2, creating a wash. XLU's technical evidence of 71.7/100 is solid but not exceptional, and the category's macro fit of 47.0/100 at the representative level shows this is a defensive holding without strong thematic tailwind. The 5% position holds because regulated utilities and infrastructure remain structural portfolio staples in mixed regimes, especially when credit stress is active; the neutral volume and setup near 52W highs creates a non-stretched allocation that can be held without fear of immediate reversal. What would elevate Utilities to top-2: a confirmed pullback to the 50W moving average with volume that contracts rather than confirms, followed by fresh accumulation back above that level with MACD and stochastic RSI reaccelerating. Until that setup materializes, treat the tier-2 allocation as steady ballast rather than a growth opportunity—a position to hold and add into weakness, not to scale out of at current valuations.
Industrial Metals — PICK
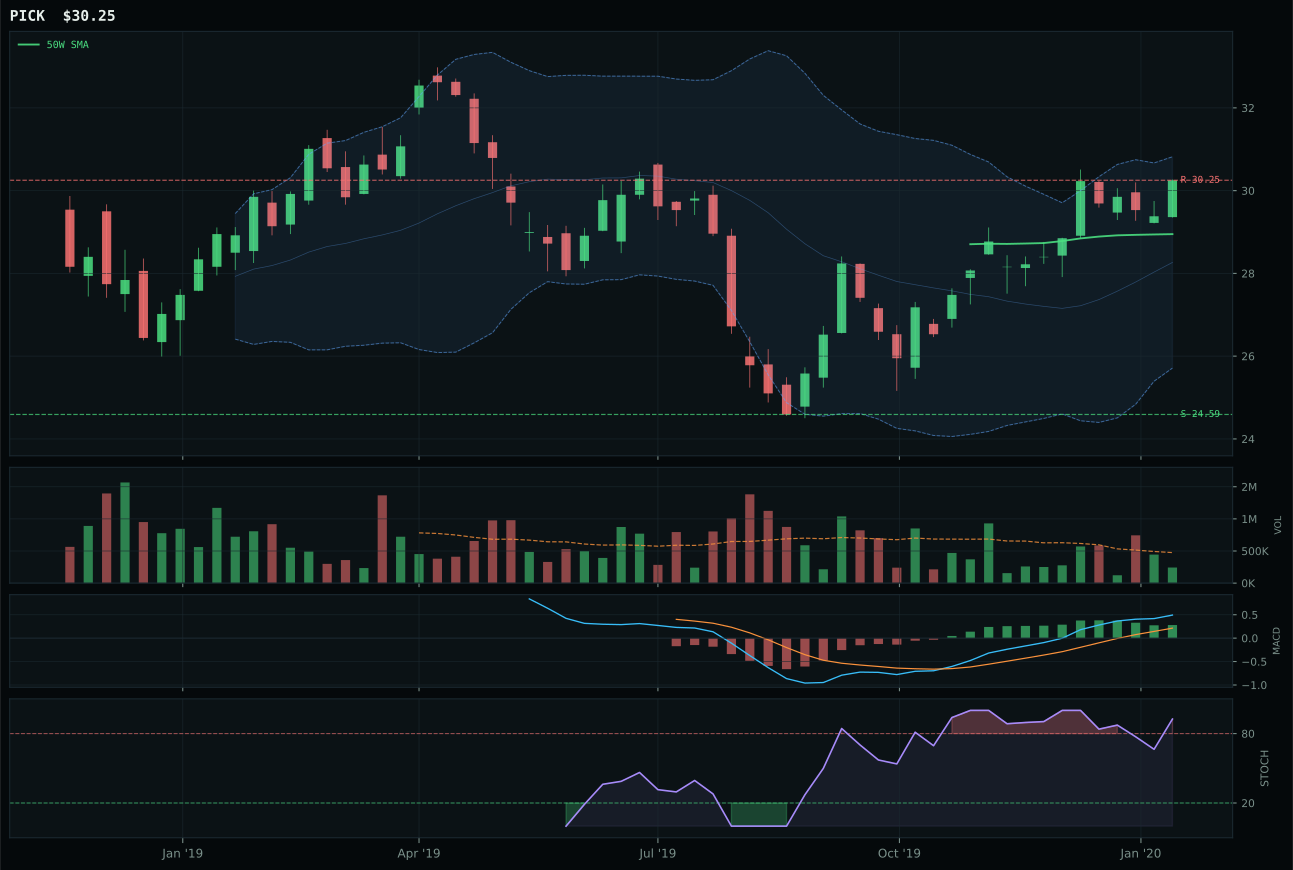
PICK has a neutral structure profile with 2.6% 13-week relative strength versus SPY.
A failed hold above support would weaken the setup.
Actionable but governed by invalidation levels.
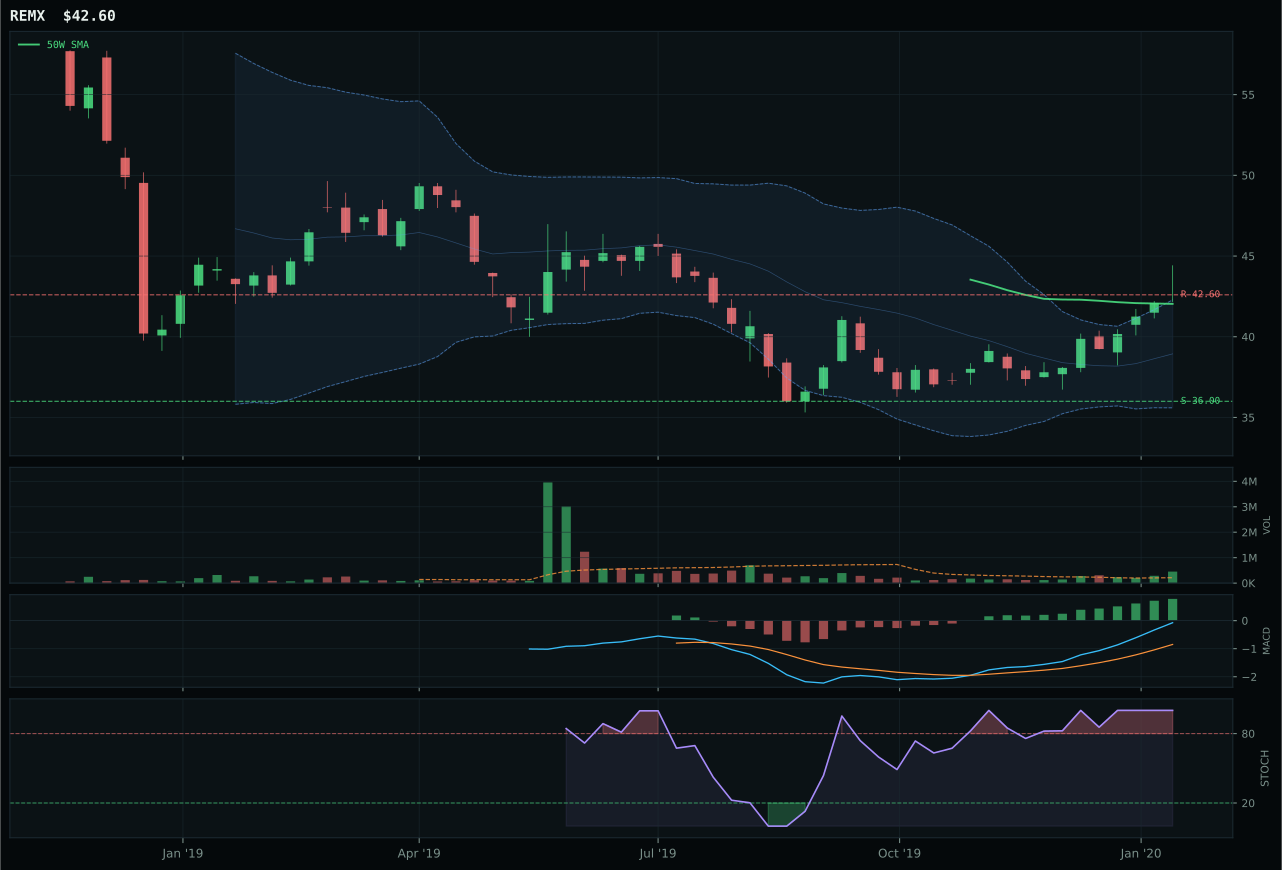
REMX has a compression near 50W profile with 3.6% 13-week relative strength versus SPY.
A failed hold above support would weaken the setup.
Tracked, but not top-2 eligible because: .
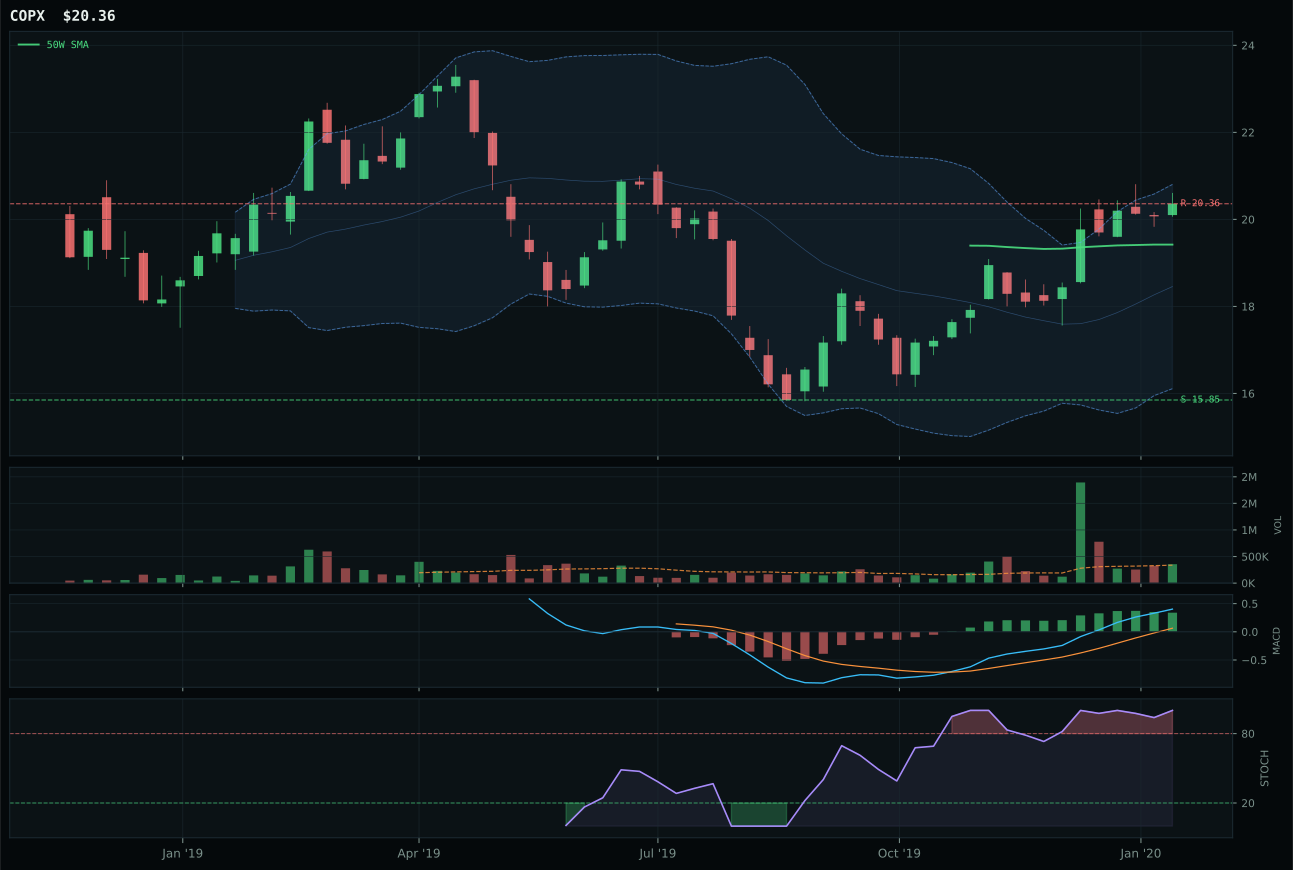
COPX has a neutral structure profile with 6.9% 13-week relative strength versus SPY.
A failed hold above support would weaken the setup.
Tracked, but not top-2 eligible because: .
PICK wins by posting the highest timing score of 85.0/100, a reflection of its position only 4.5% above the 50W in the upper retracement/momentum zone near Fib 0.382, whereas REMX sits in compression and COPX is likely in vertical extension. MACD is bullish but flattening—a deterioration signal—yet this matters far less than PICK's superior architecture: thin volume at 0.51x the 20W baseline means the move is running on technician enthusiasm rather than fresh accumulation, a setup that timing captures and risk/reward respects at 51.3 points. The 13W return of 14.0% and positive SPY-relative strength of 2.6% prove the diversified mining breadth narrative has worked, but PICK's category-relative strength of -1.0% versus REMX's dead-even suggests the better setup has already been arbitraged. REMX's 15.0% thirteen-week return and accumulation-level volume confirm it has better recent participation, yet REMX sits in compression near the 50W with overbought momentum—exactly where mean reversion risk peaks. The 13.3-point gap to REMX reflects that timing quality and structure cleanliness matter more than raw recent performance when evaluating next-week opportunity.
Industrial Metals received 5% allocation as a tier-2 category, earning its position because metals scarcity is active at +14 weighting and commodity breadth positive at +10, providing the strongest macro tailwind of any tier-2 category. PICK's technical evidence of 69.1/100 supports this macro backdrop, and the category-level macro fit of 73.0/100 is exceptional—real asset sponsorship active at +6 joins the two commodity themes to create genuine structural support. Credit stress active at -7 creates headwind, but the net macro score is firmly positive. The 5% position exists because diversified mining breadth and rare-earth supply-chain scarcity are legitimate portfolio themes in a Transition/Mixed regime; what would elevate Industrial Metals to top-2: a confirmed breakout above 30.25 resistance with volume acceleration and MACD reacceleration, combined with improved relative strength versus SPY. Until that catalyzes, treat the tier-2 allocation as exposure to the metals scarcity narrative without betting on immediate outperformance. The thin volume at category level warns that this setup can reverse quickly if macro sentiment shifts.
Agriculture & Livestock — MOO
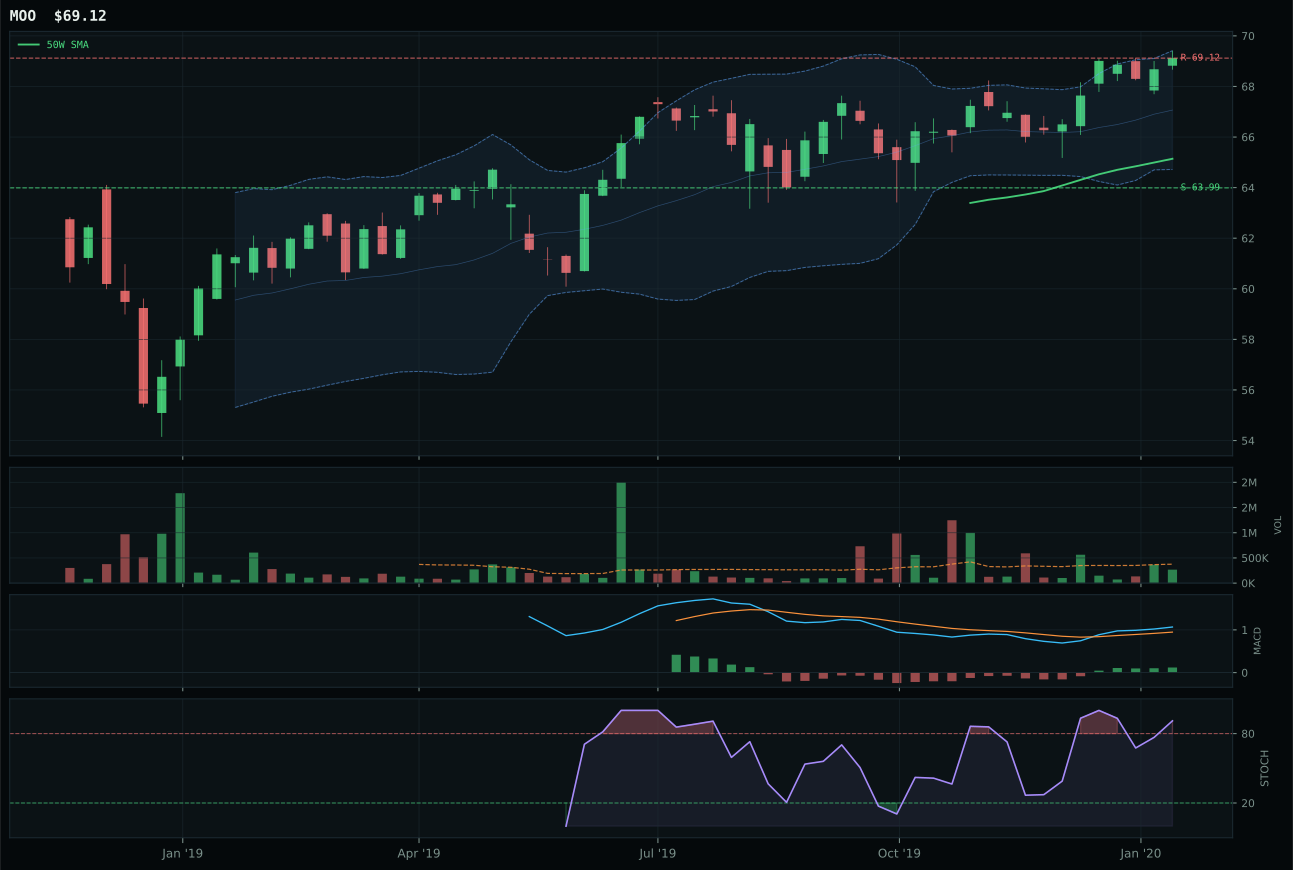
MOO has a neutral structure profile with -7.0% 13-week relative strength versus SPY.
A failed hold above support would weaken the setup.
Actionable but governed by invalidation levels.
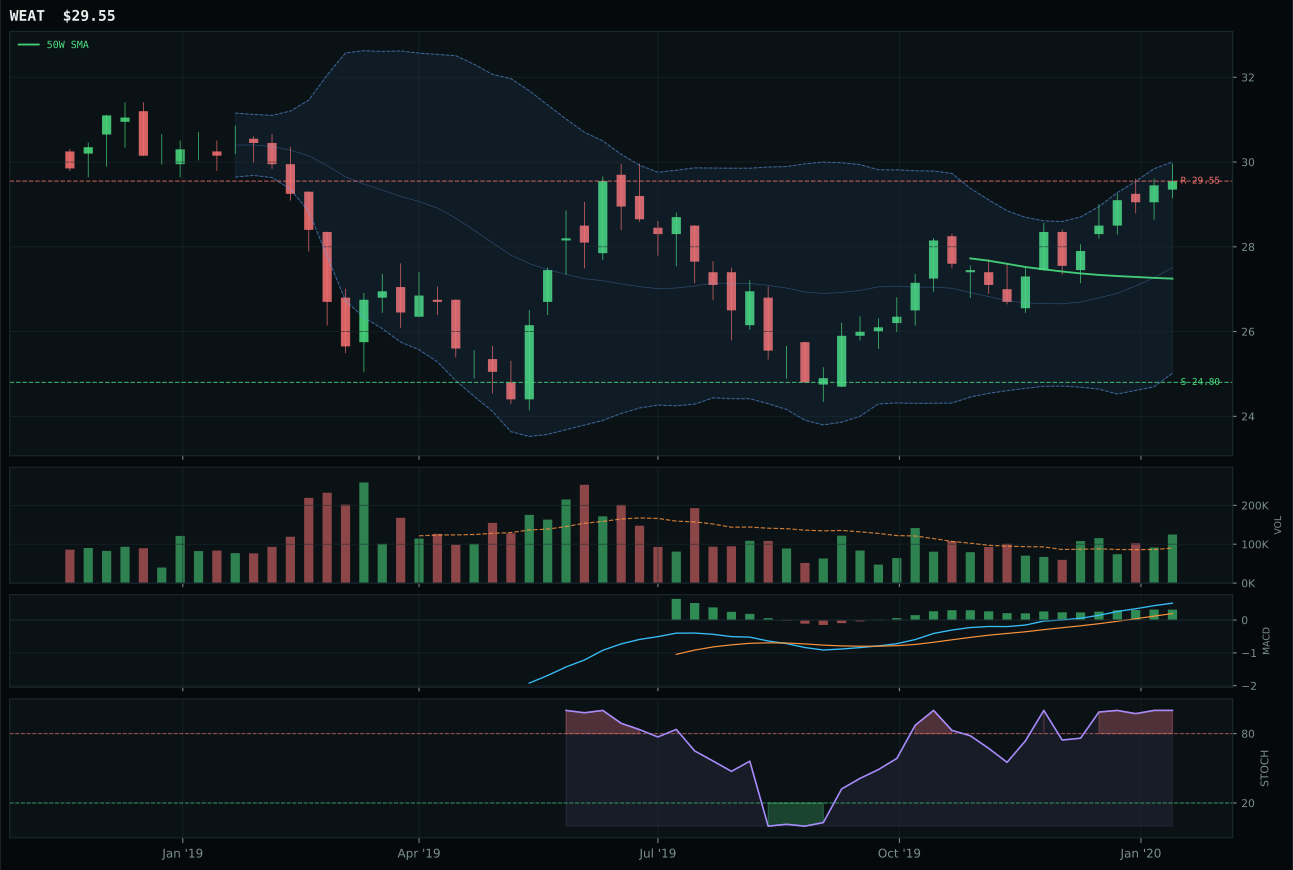
WEAT has a neutral structure profile with -6.4% 13-week relative strength versus SPY.
A failed hold above support would weaken the setup.
Tracked, but not top-2 eligible because: .
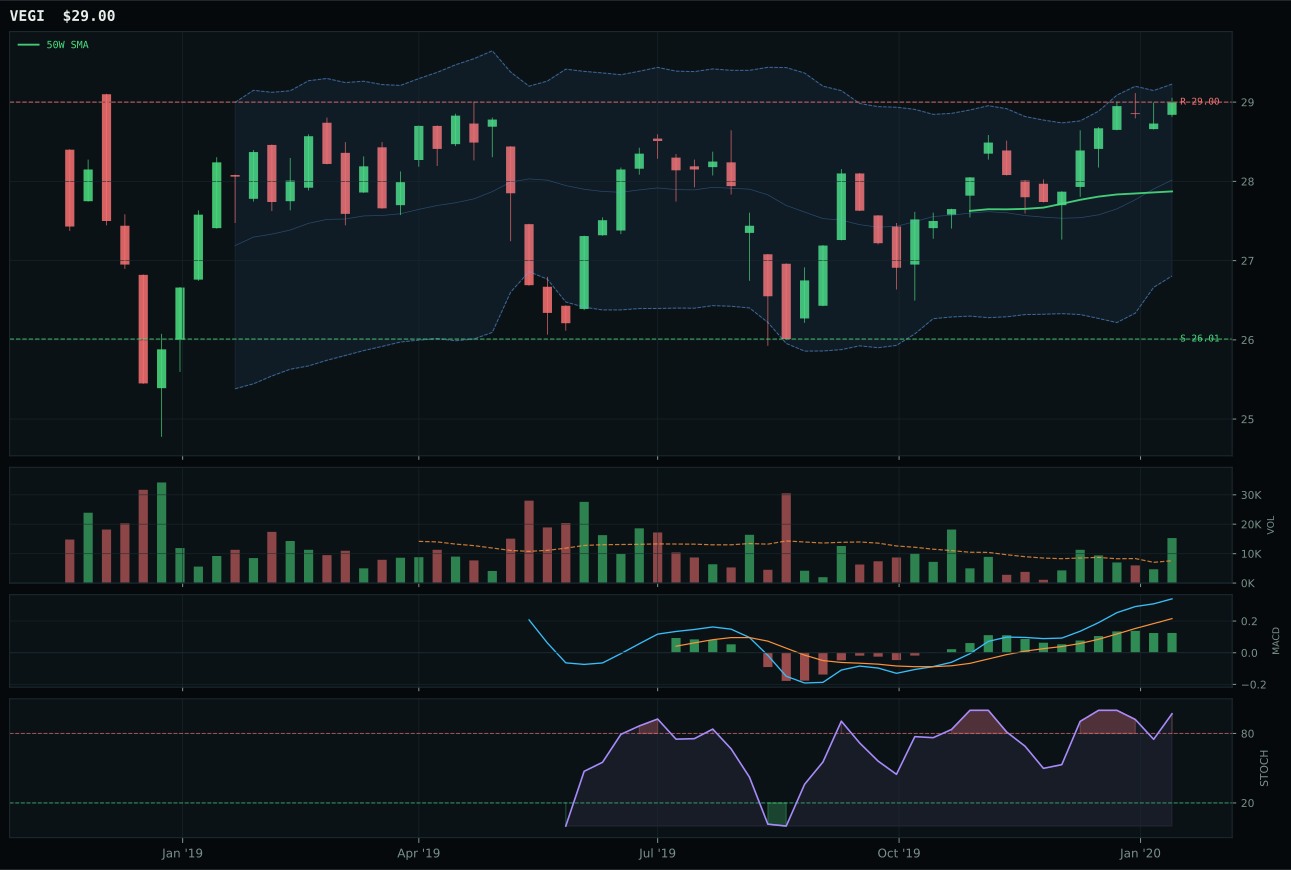
VEGI has a neutral structure profile with -5.9% 13-week relative strength versus SPY.
A failed hold above support would weaken the setup.
Tracked, but not top-2 eligible because: .
MOO wins the category by posting the highest technical evidence score of 54.6/100 despite the widest SPY-relative underperformance in the basket at -7.0%, a paradox that reveals why MOO's neutral-structure setup with stochastic RSI rolling over at 0.91 is technically superior to WEAT's configuration. Price sits only 6.1% above the 50W with thin volume participation at 0.71x the 20-week baseline, meaning the rally is running on exhaustion rather than fresh accumulation—exactly the setup where rolling-over momentum outperforms overbought momentum caught in the upper range. MACD is bullish and improving, structure is clean at 74.9, and the compression zone near support creates a lower-risk entry architecture than WEAT's upper retracement zone, even though WEAT's above-average volume suggests more participation. Risk/reward favors MOO at 55.0 versus WEAT's 52.5, and category-relative strength is only -0.6% versus WEAT's dead-even 0.0%, meaning MOO's underperformance versus SPY masks outperformance within its peer set. The 25.8-point gap to WEAT reflects the technical superiority of a setup that is rolling over into support rather than one stretched into momentum zone.
Agriculture & Livestock received 5% allocation as a tier-2 category, positioned outside top-2 because its 41.0 final score was compressed by weak momentum confirmation and thin volume. Real asset sponsorship is active at +8 weighting and commodity breadth positive at +5, providing macro support that helped the category avoid 5% allocation, but the technical evidence across the basket is uniformly weak at 54.6 for MOO versus 45.0 for both VEGI and WEAT. The thirteen-week return of only 4.4% for MOO and 5.0% for WEAT tells the story: this category is lagging SPY by 7% and has no clear accumulation signal despite bullish MACD structures. The 5% position exists because real-asset themes matter in mixed regimes, and a stationary allocation prevents portfolio drift into pure equities; what would elevate Agriculture to top-2: a confirmed breakout above 52-week highs with volume acceleration and improved relative strength versus SPY, plus momentum confirmation with MACD truly accelerating rather than merely improving. Until that happens, treat this as a satellite holding that acknowledges real-asset positioning without betting on near-term outperformance.
Nuclear Energy — URA
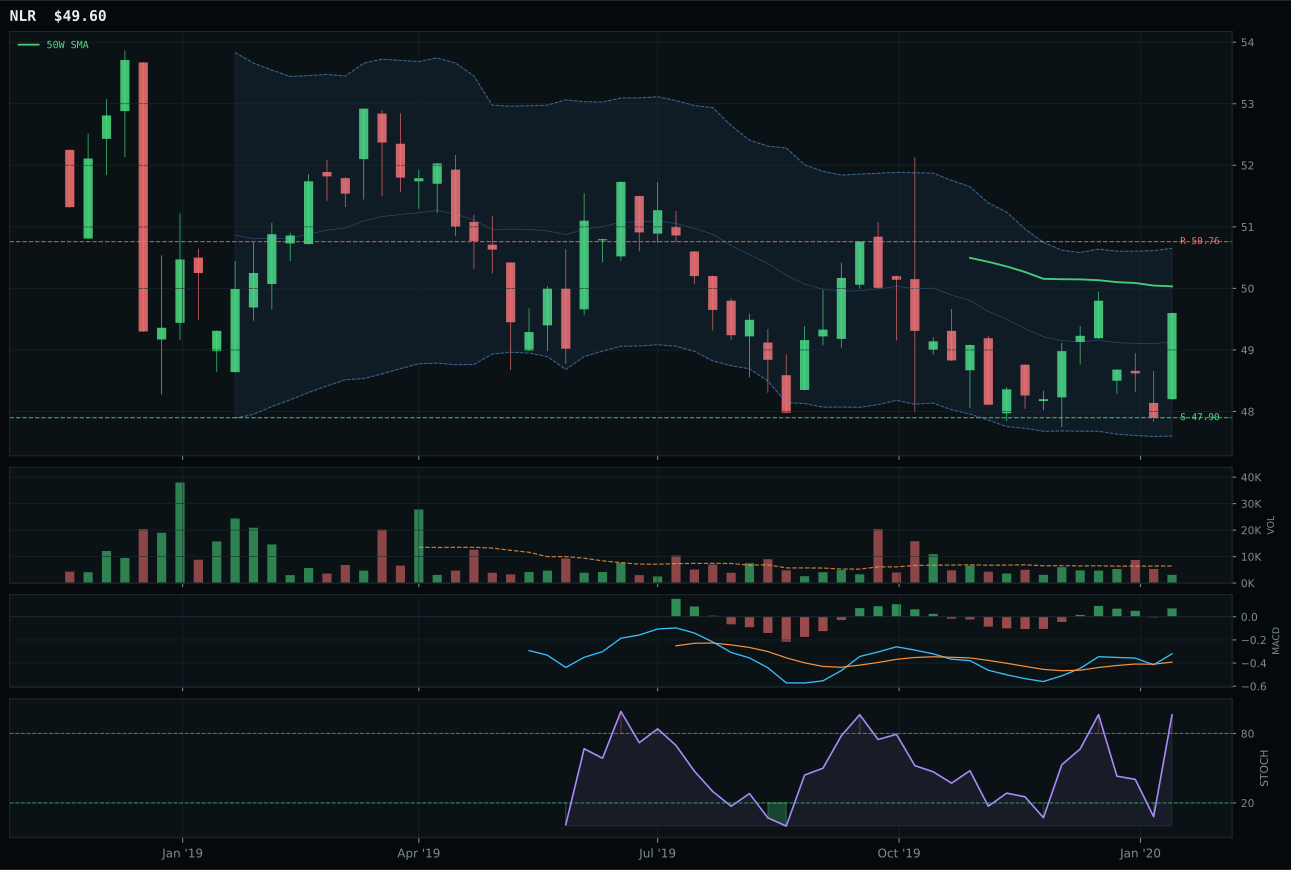
NLR has a pullback into support profile with -10.5% 13-week relative strength versus SPY.
A failed hold above support would weaken the setup.
Tracked, but not top-2 eligible because: .
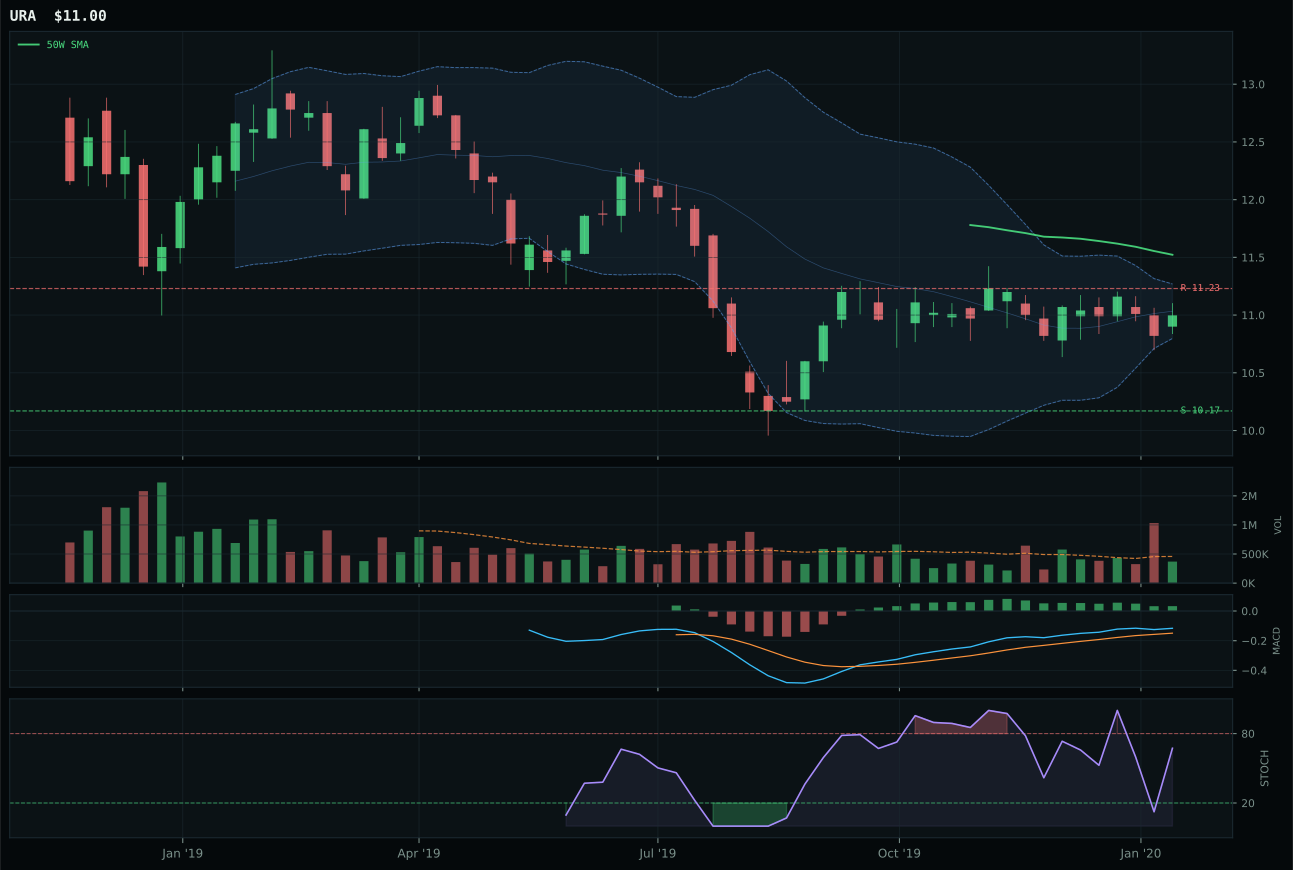
URA has a neutral structure profile with -11.6% 13-week relative strength versus SPY.
Extension and support failure are the main tactical risks.
Tracked, but not top-2 eligible because: structurally broken.
URA wins by the default of being the category representative, but this victory is purely technical and reflects only that URA has a marginally better setup than NLR—both names are structurally broken. Price sits 4.5% below the 50W in deep retracement near Fib 0.618 at 11.23 with MACD bullish but flattening and stochastic RSI falling to neutral at 0.69, exactly the setup that screams value trap to experienced traders. URA's thirteen-week return is flat at -0.2%, and SPY-relative underperformance reaches -11.6%, the worst in the category; volume is neutral at 0.81x the 20W baseline, meaning no accumulation is happening. NLR posts better thirteen-week returns at +0.9% and stronger category-relative strength at +0.6%, but its timing score of 95.0 versus URA's 85.0 reflects NLR sitting in pullback-into-support setup at 47.90, a technically inferior position when both names have broken below their 50W moving averages. The category-wide failure to produce any credible accumulation signal means the representative decision is immaterial—this is a category where buying any name at current prices means catching a falling knife into deeper value.
Nuclear Energy received 0% allocation, excluded from the portfolio because the category score of 31.8 failed eligibility filters and ranked as structurally broken. URA's technical evidence of 23.1/100 is the lowest in the portfolio outside Traditional Energy; price below the 50W and 200W moving averages with deteriorating MACD and falling stochastic RSI at 0.69 removes any case for near-term entry. The category-level macro fit of 57.0/100 includes real asset sponsorship at +7 and AI growth sponsorship at +5, but these micro themes cannot overcome a setup that is genuinely broken and shows zero accumulation. What would earn Nuclear Energy tier-2 allocation: a confirmed reversal above the 50W moving average at 48.50 with volume acceleration, followed by fresh accumulation with MACD moving into bullish-and-improving territory and stochastic RSI rising above 50. Until that catalyzes, treat Nuclear as an excluded category that may have long-term structural support but shows zero technical proof of accumulation right now. The 0% allocation is warranted.
Traditional Energy — XLE
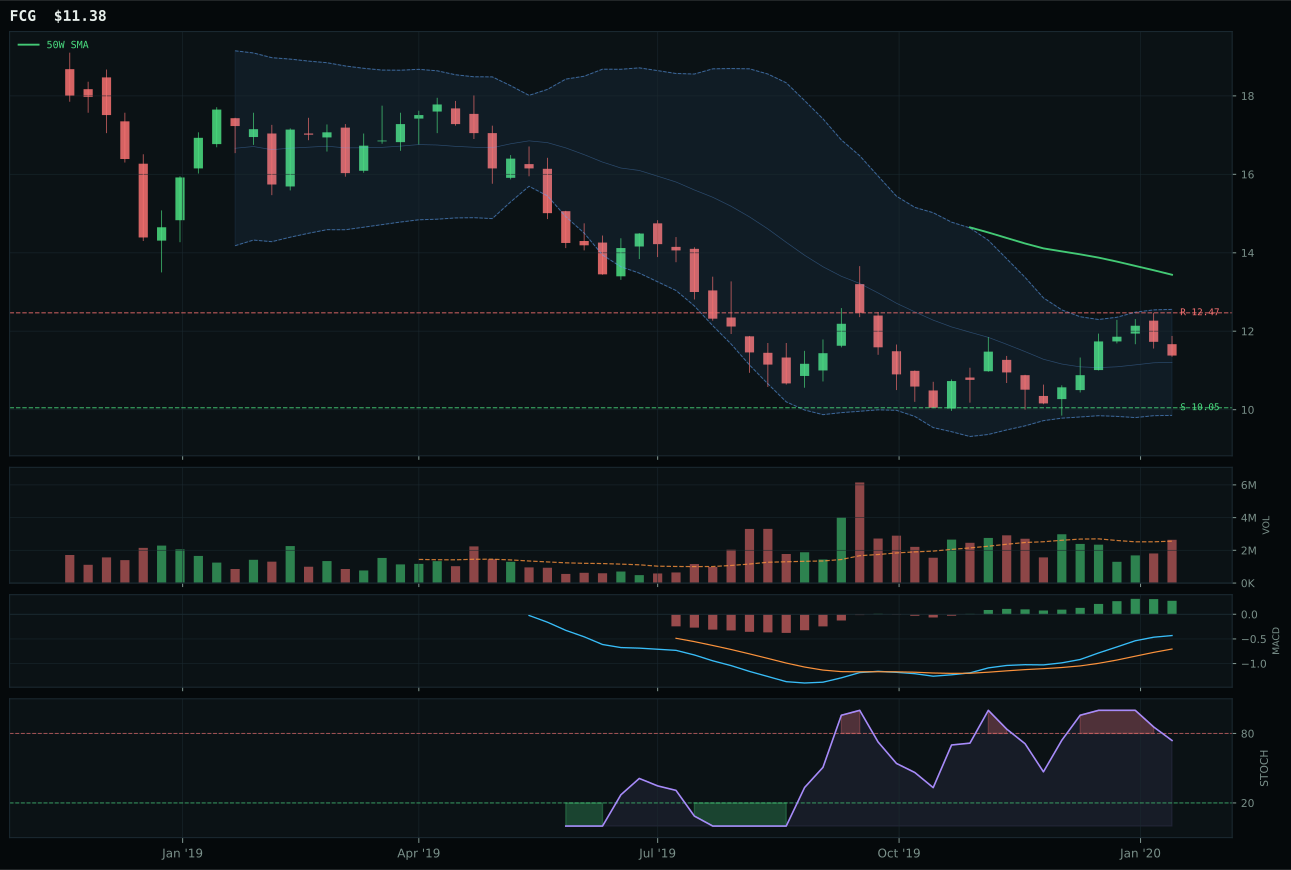
FCG has a neutral structure profile with 1.8% 13-week relative strength versus SPY.
Extension and support failure are the main tactical risks.
Tracked, but not top-2 eligible because: structurally broken.
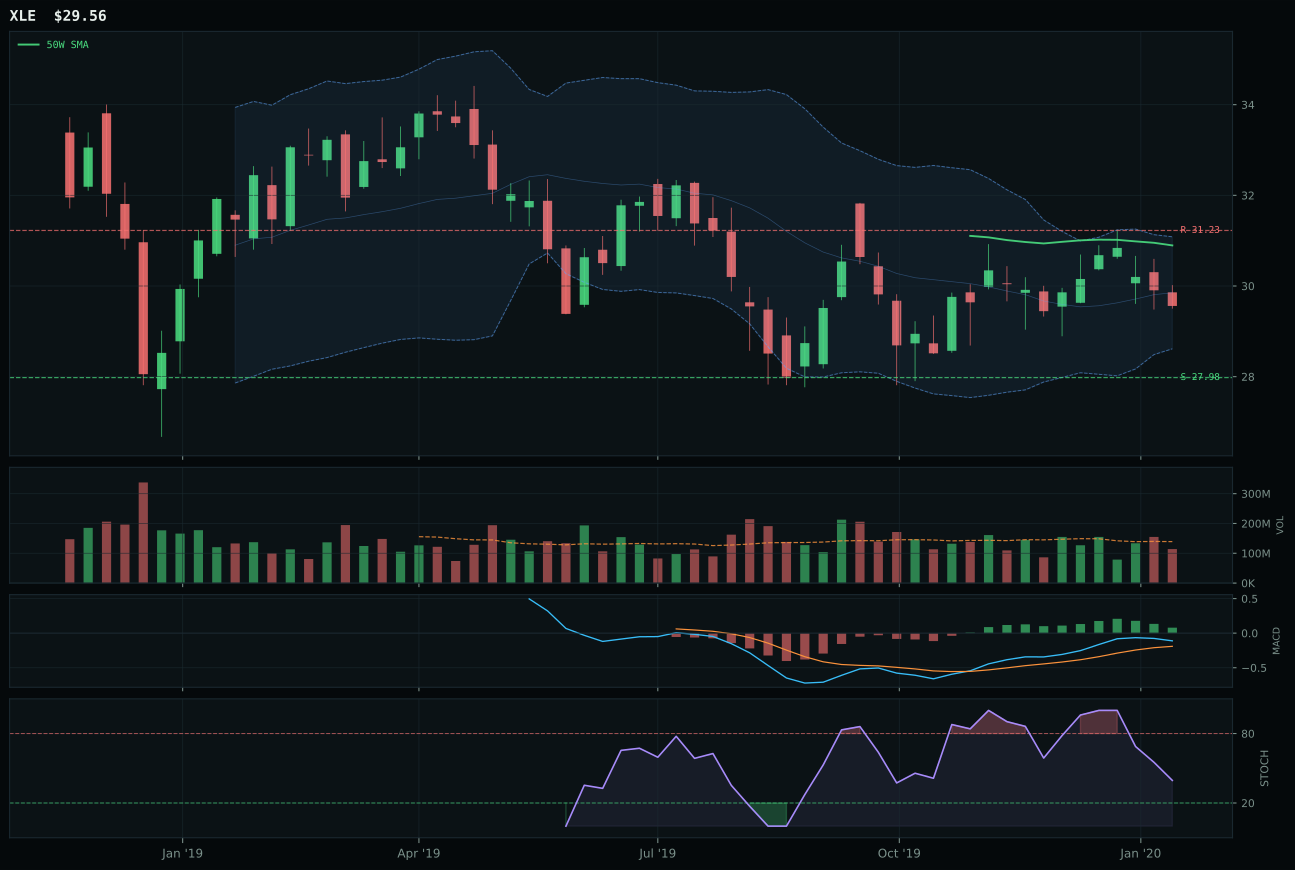
XLE has a neutral structure profile with -7.7% 13-week relative strength versus SPY.
Extension and support failure are the main tactical risks.
Tracked, but not top-2 eligible because: structurally broken.
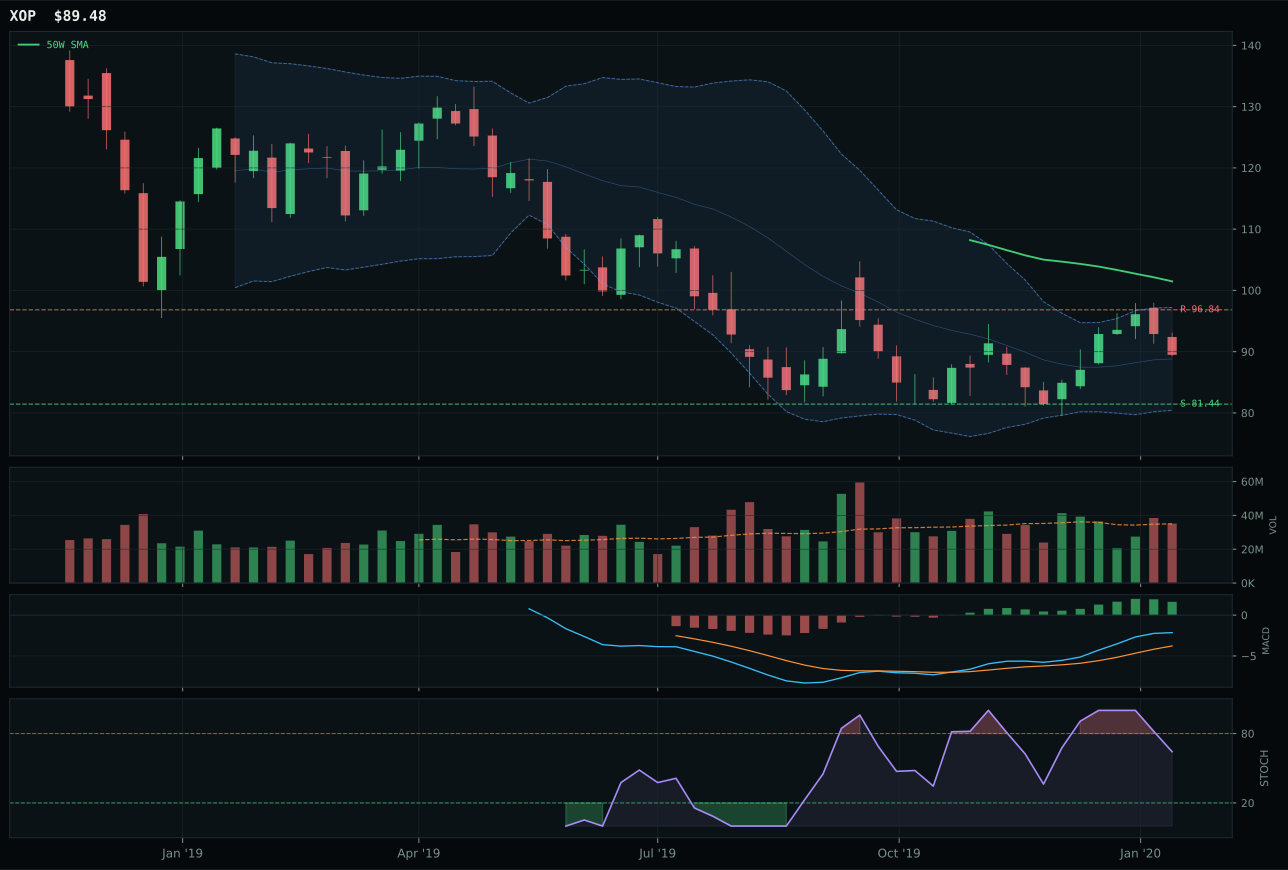
XOP has a neutral structure profile with -2.6% 13-week relative strength versus SPY.
Extension and support failure are the main tactical risks.
Tracked, but not top-2 eligible because: structurally broken.
XLE wins a structurally broken category by posting the highest timing score of 85.0/100 despite price sitting 4.3% below the 50W in the deep retracement zone near Fib 0.786—a classic value trap setup. MACD is bullish but flattening and stochastic RSI falling to neutral at 0.41, technical signals that contradict the bullish narrative; risk/reward reaches 70.0/100 because downside to support at 27.98 offers only 5.6% cushion while upside to resistance is -5.3%, meaning price must first recover through the 50W before any upside profit zone becomes available. The 13W return of only 3.7% and SPY-relative underperformance of -7.7% confirm that energy is not accumulating, and FCG's positive category-relative strength of +4.4% versus XLE's -5.1% would suggest FCG has better internals—but FCG's inferior timing score of 55.0 and weaker risk/reward of 56.9 reveal that strength is trapped in compression near 52W lows, a repair zone, not an accumulation signal. XLE wins by elimination in a category where all three ETFs are below their 50W and showing deteriorating MACD confirmation.
Traditional Energy received 0% allocation this week, excluded entirely because the category failed eligibility filters after posting a final score of 15.1, the lowest in the portfolio. XLE's status as the representative is hollow because the trend score of 29.4/100 and structure score of 39.9 reveal a category in structural repair rather than accumulation; price below both the 50W and 200W moving averages with negative SPY-relative strength of -7.7% means energy is losing capital flows, not gathering them. Credit stress active at -7 weighting creates macro headwind that real asset sponsorship at +7 cannot offset, leaving the category in neutral macro terrain. What would restore Traditional Energy to tier-2 allocation eligibility: a confirmed reversal above the 50W moving average with volume acceleration and MACD reacceleration into bullish-and-improving territory, followed by sustained closes above resistance at 31.23. The 0% allocation acknowledges that energy is out of favor in a transition regime where sentiment is mixed but credit remains stressed—a category to monitor for re-entry signals, not to hold.