
2020-01-10
Informational purposes only. The content in this report, including allocations, analysis, and commentary, is provided solely for informational and educational purposes. It does not constitute financial advice, investment advice, trading advice, or any other type of advice. Past performance does not guarantee future results. Always conduct your own research and consult a qualified financial professional before making investment decisions.
Some tracked tickers were excluded due to missing live weekly price data: SGOV: Historical cache SGOV has only 0 usable weekly bars; URNM: Historical cache URNM has only 6 usable weekly bars
Weekly Allocation
| Ticker | Category | Weight | Role |
|---|---|---|---|
| IGV | Technology | 20% | Top-2 (20%) |
| IEMG | Emerging Markets | 20% | Top-2 (20%) |
| GLD | Precious Metals | 10% | Tier-2 (10%) |
| SMH | AI | 10% | Tier-2 (10%) |
| XLU | Utilities & Infrastructure | 10% | Tier-2 (10%) |
| PICK | Industrial Metals | 10% | Tier-2 (10%) |
| MOO | Agriculture & Livestock | 10% | Tier-2 (10%) |
| XAR | Defense & Aerospace | 10% | Tier-2 (10%) |
Trade Instructions — Monday Open
Sell the tranche from 5 weeks ago (completing its 4-week hold). Buy the new tranche. Instructions show net portfolio changes — same-asset positions cancel, weight changes show the delta.
| Action | Ticker | Instruction |
|---|---|---|
| BUY | SMH | Buy SMH — 2.50% of freed cash (adds 2.50% to portfolio) |
| BUY | XAR | Buy XAR — 2.50% of freed cash (adds 2.50% to portfolio) |
| BUY | GLD | Buy GLD — 2.50% of freed cash (adds 2.50% to portfolio) |
| BUY | MOO | Buy MOO — 2.50% of freed cash (adds 2.50% to portfolio) |
| BUY | PICK | Buy PICK — 2.50% of freed cash (adds 2.50% to portfolio) |
| BUY | IGV | Buy IGV — 5.00% of freed cash (adds 5.00% to portfolio) |
| BUY | IEMG | Buy IEMG — 5.00% of freed cash (adds 5.00% to portfolio) |
| BUY | XLU | Buy XLU — 2.50% of freed cash (adds 2.50% to portfolio) |
Current Portfolio After Trade
Combined holdings across all 4 active tranches. Each tranche is 25% of the portfolio.
| Ticker | % of Portfolio | Weight Bar |
|---|---|---|
| ILF | 5.00% | |
| XLK | 5.00% | |
| SMH | 5.00% | |
| XAR | 5.00% | |
| GLD | 5.00% | |
| MOO | 5.00% | |
| PICK | 5.00% | |
| IGV | 5.00% | |
| IEMG | 5.00% | |
| IGF | 2.50% | |
| XLU | 2.50% |
Macro Regime — Transition / Mixed
Macro Evidence Charts
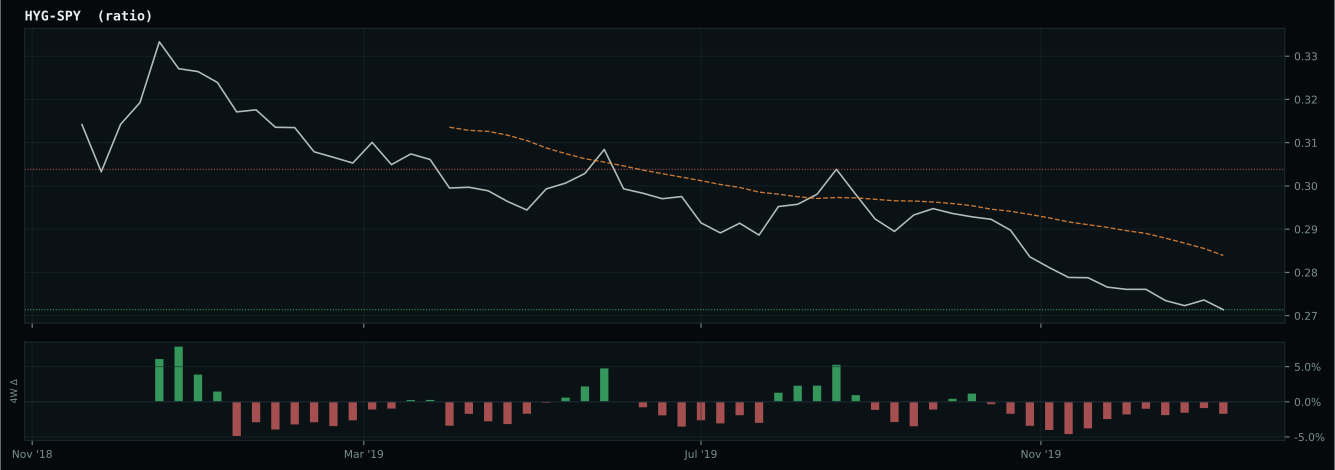
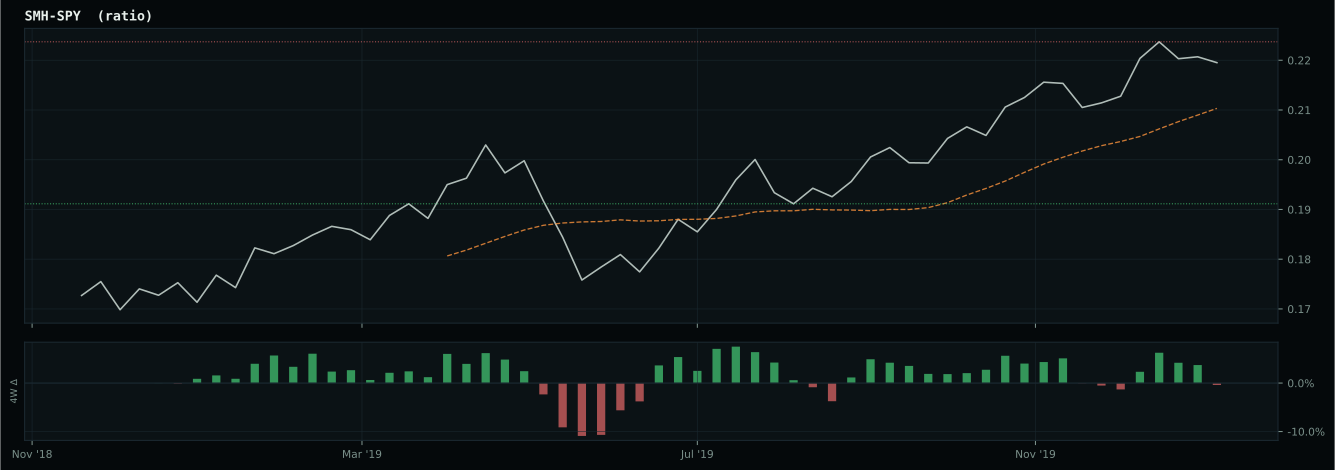
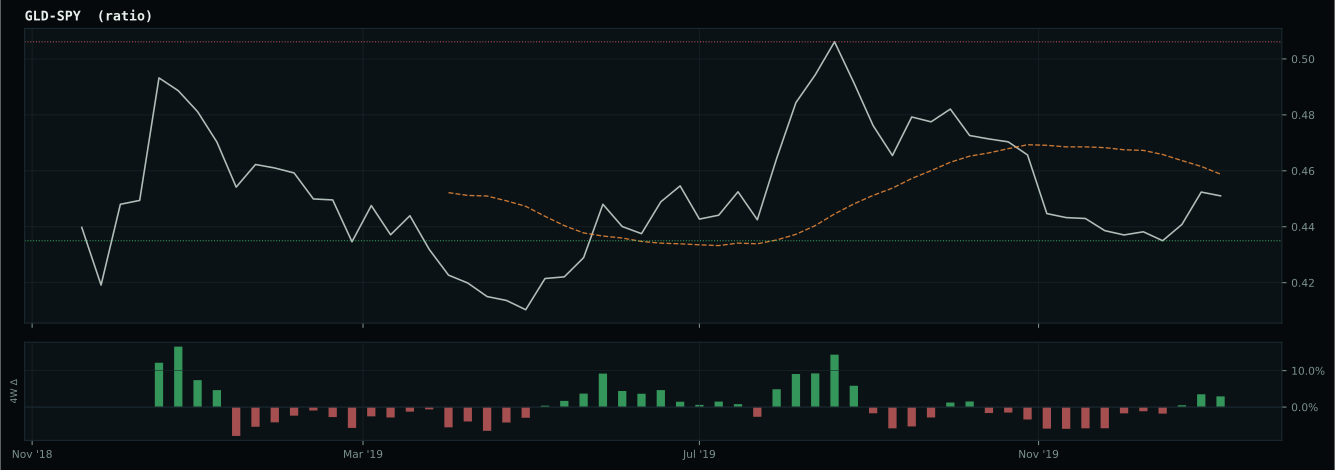
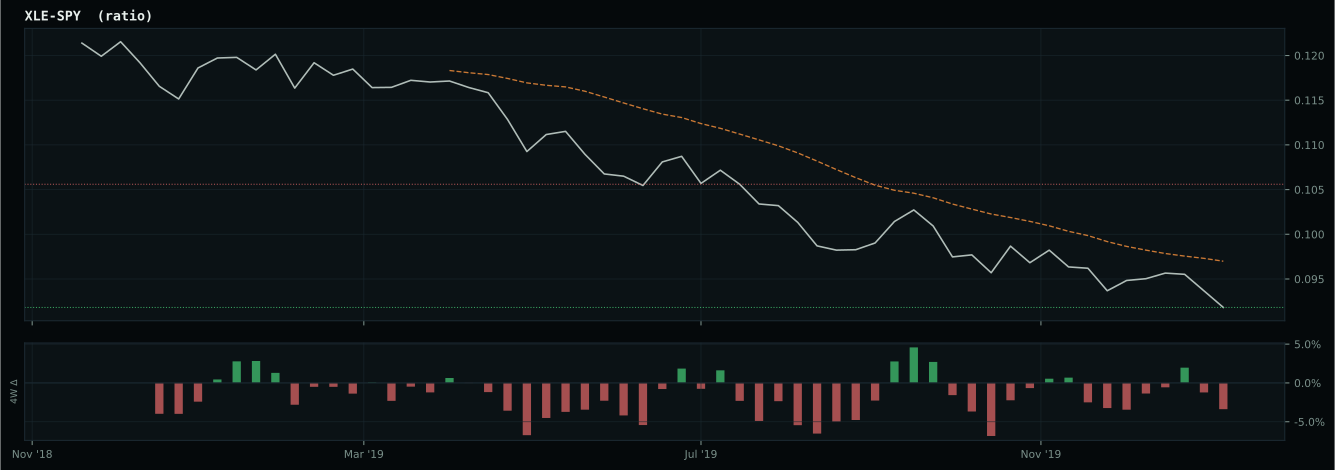
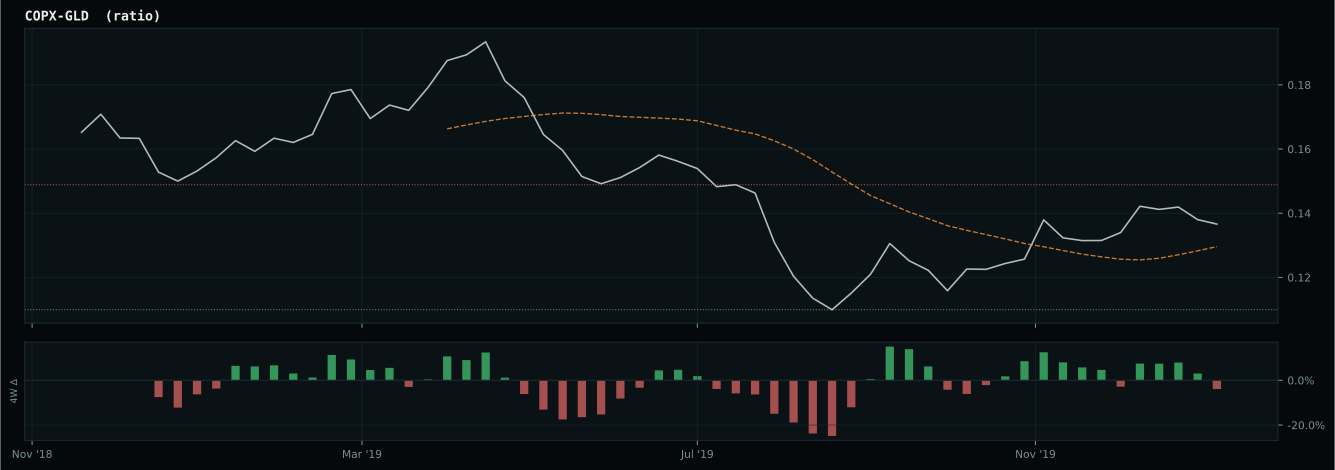
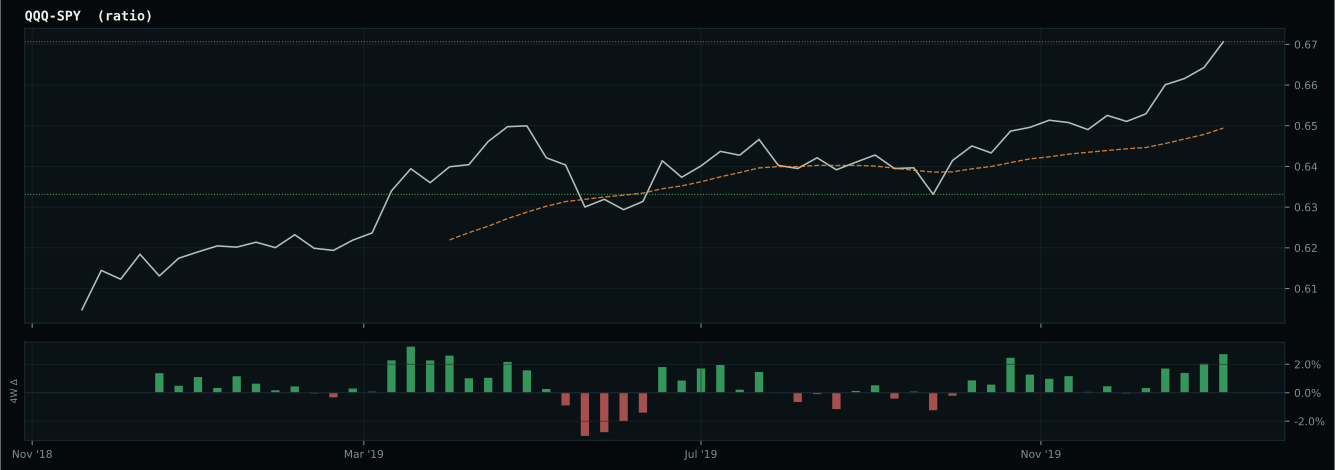
Market-implied signals behind the macro regime scores. Each ratio compares two assets; the direction and slope of the ratio is what the macro engine reads.
Crypto Regime — NoCrypto
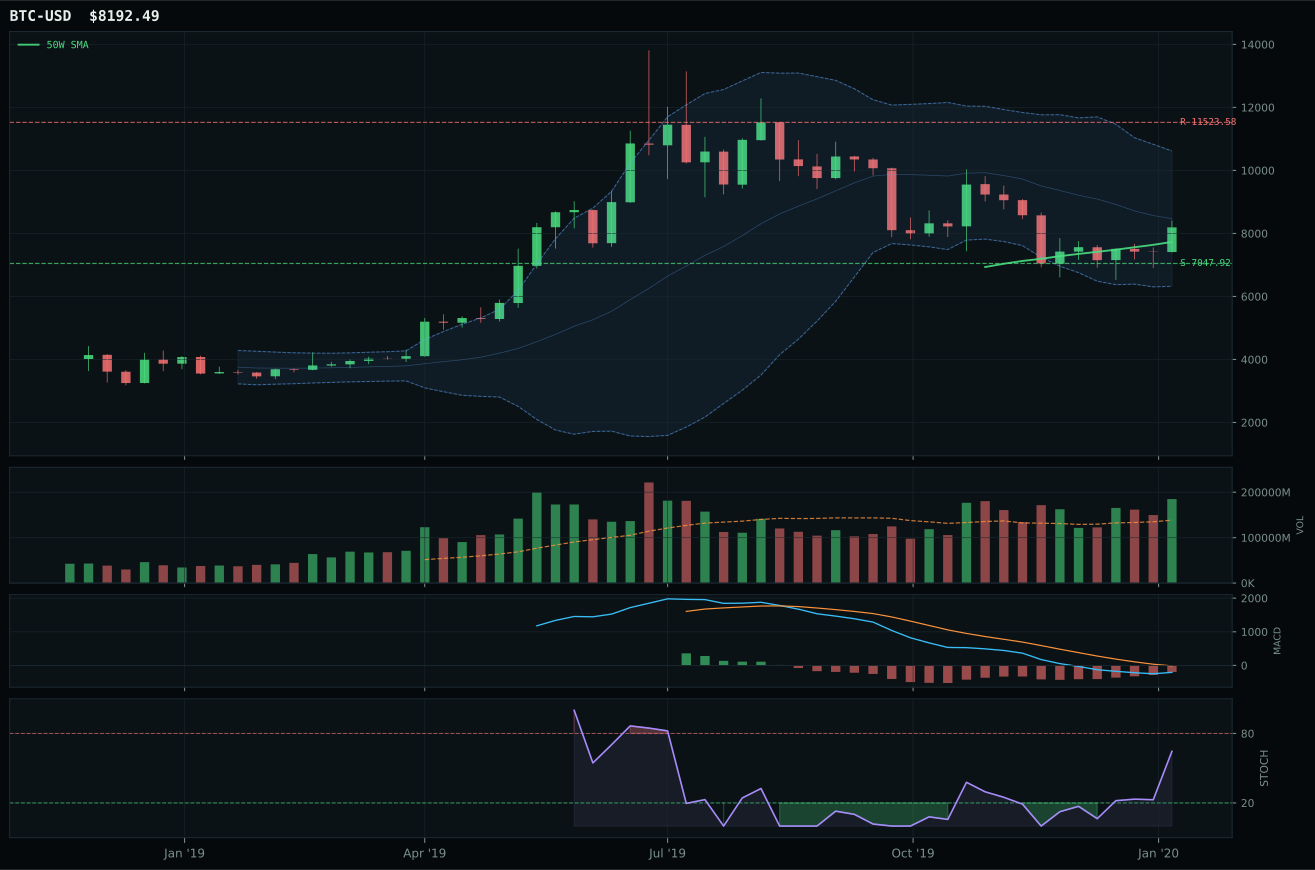
post-touch structure is too wide to count as a range; max/min close ratio is 3.54
TrendBTC not confirmed
one or more available conditions failed

Category Rankings
| Rank | Category | Winner | Score | Alloc | 4W Ret | Peers (4W) |
|---|---|---|---|---|---|---|
| 1 | Technology | IGV | 71.0 | 20% | +4.64% | XLK +4.6% · CIBR +2.1% |
| 2 | Emerging Markets | IEMG | 56.8 | 20% | -5.35% | ILF -6.1% · INDA -1.9% |
| 3 | Precious Metals | GLD | 56.7 | 10% | +1.27% | SLV -1.5% · GDX -0.5% |
| 4 | AI | SMH | 52.2 | 10% | -1.12% | BOTZ -0.8% · AIQ +2.4% |
| 5 | Utilities & Infrastructure | XLU | 49.0 | 10% | +6.71% | IGF +1.9% · PAVE -0.2% |
| 6 | Industrial Metals | PICK | 47.4 | 10% | -6.40% | REMX -12.0% · COPX -11.6% |
| 7 | Agriculture & Livestock | MOO | 41.6 | 10% | -3.57% | WEAT -1.7% · VEGI -2.9% |
| 8 | Defense & Aerospace | XAR | 40.9 | 10% | +2.51% | ROKT +0.2% · ITA +3.2% |
| 9 | Nuclear Energy | URA | 22.4 | 0% | -2.75% | NLR +5.4% |
| 10 | Traditional Energy | FCG | 22.3 | 0% | -18.68% | XOP -17.7% · XLE -10.1% |
Technology — IGV
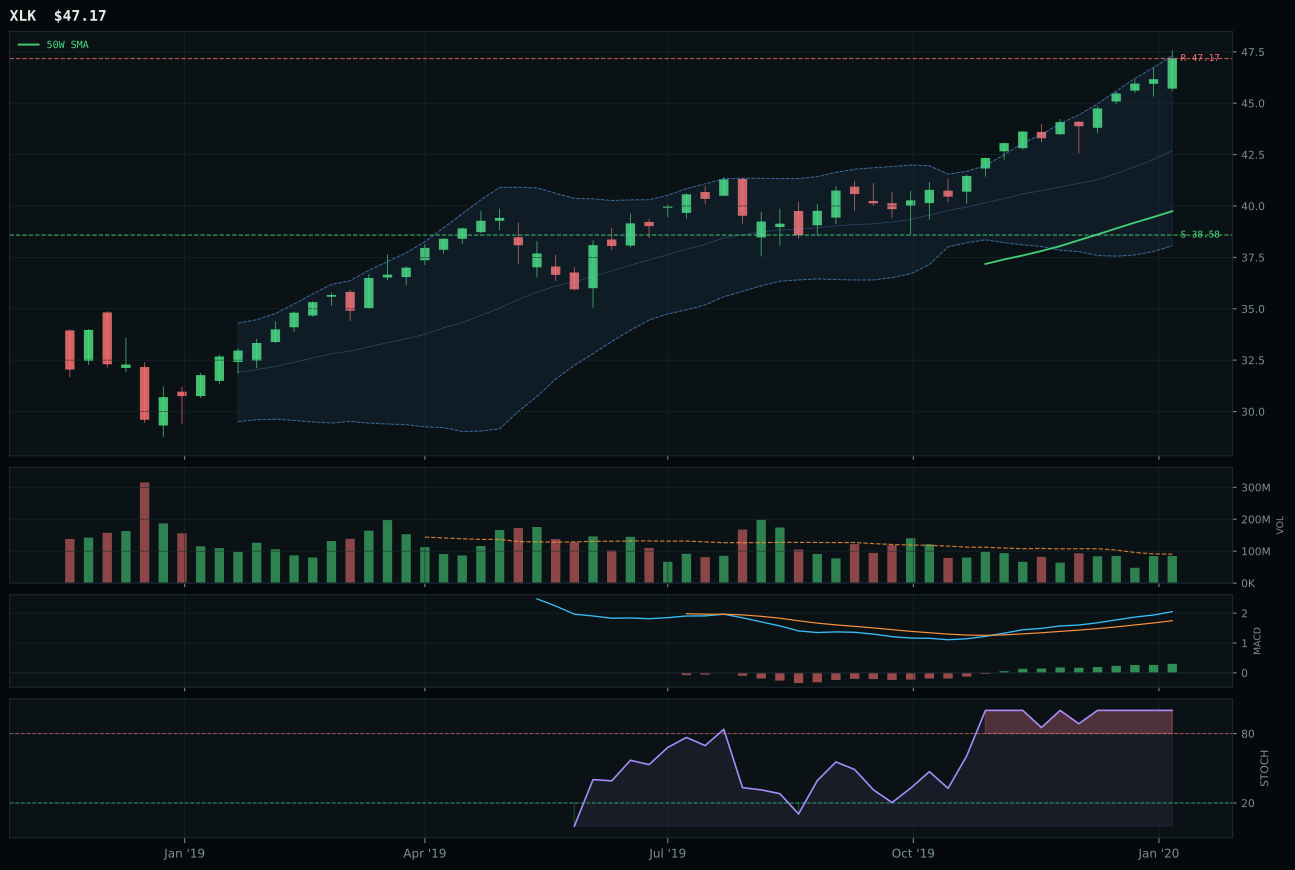
XLK has a vertical extension profile with 5.7% 13-week relative strength versus SPY.
A failed hold above support would weaken the setup.
Actionable but governed by invalidation levels.
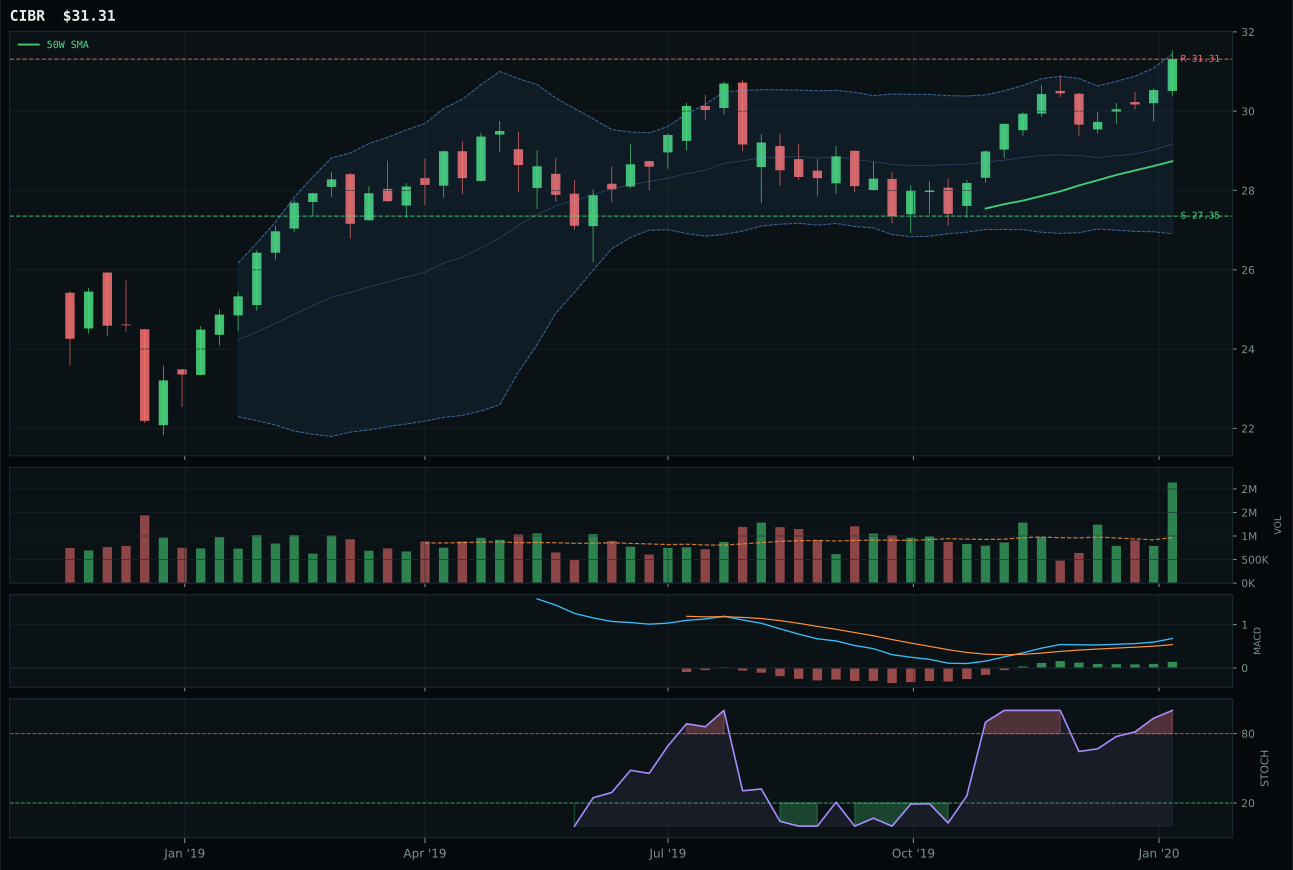
CIBR has a neutral structure profile with 1.8% 13-week relative strength versus SPY.
A failed hold above support would weaken the setup.
Actionable but governed by invalidation levels.
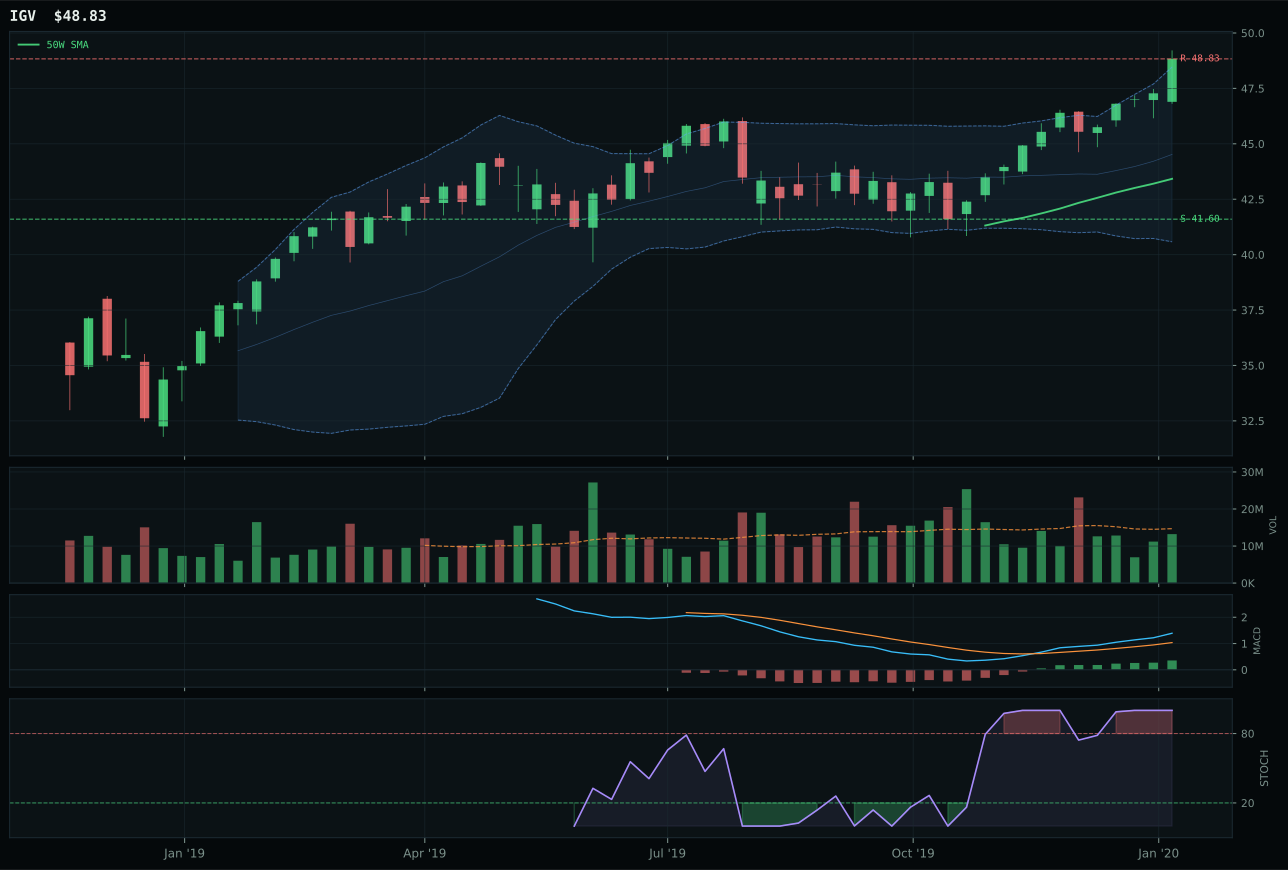
IGV has a neutral structure profile with 2.9% 13-week relative strength versus SPY.
A failed hold above support would weaken the setup.
Actionable but governed by invalidation levels.
IGV clinches the category by staying disciplined near the 50-week moving average at just 12.5% extension, where new capital faces real friction. The 2.9% relative strength versus SPY gives the setup credibility—this isn't just a bounce off support but active sponsorship pulling the price higher. MACD is bullish and improving with stochastic RSI showing overbought conditions at 1.00, and the neutral structure combined with 91.7 cleanliness confirms the move is orderly rather than panicked. XLK, the runner-up, stretches 18.7% above its 50W and suffers a weaker timing score (37.0 versus IGV's 59.0), which reflects the risk asymmetry: at such extension, every new buyer is chasing, and MACD flattening suggests momentum may not persist. The 8.2-point score gap is decisive.
Technology earns 20% allocation as one of the two highest-ranked categories this week because it combines the strongest technical evidence (81.2/100 in IGV's trend, relative strength, and volume-price confirmation) with active macro tailwinds from positive risk appetite and AI growth sponsorship. The transition/mixed macro regime is not hostile to growth, and both high-quality tech indices (CIBR at 85 composite, IGV at 81) show clean upside structure with bullish MACD confirmation—a rarity in choppy markets. The category isn't overextended on valuation; the setup is neutral structure with reasonable support-to-resistance risk, so conviction justifies equal weighting with Emerging Markets rather than leaving growth starved.
Emerging Markets — IEMG
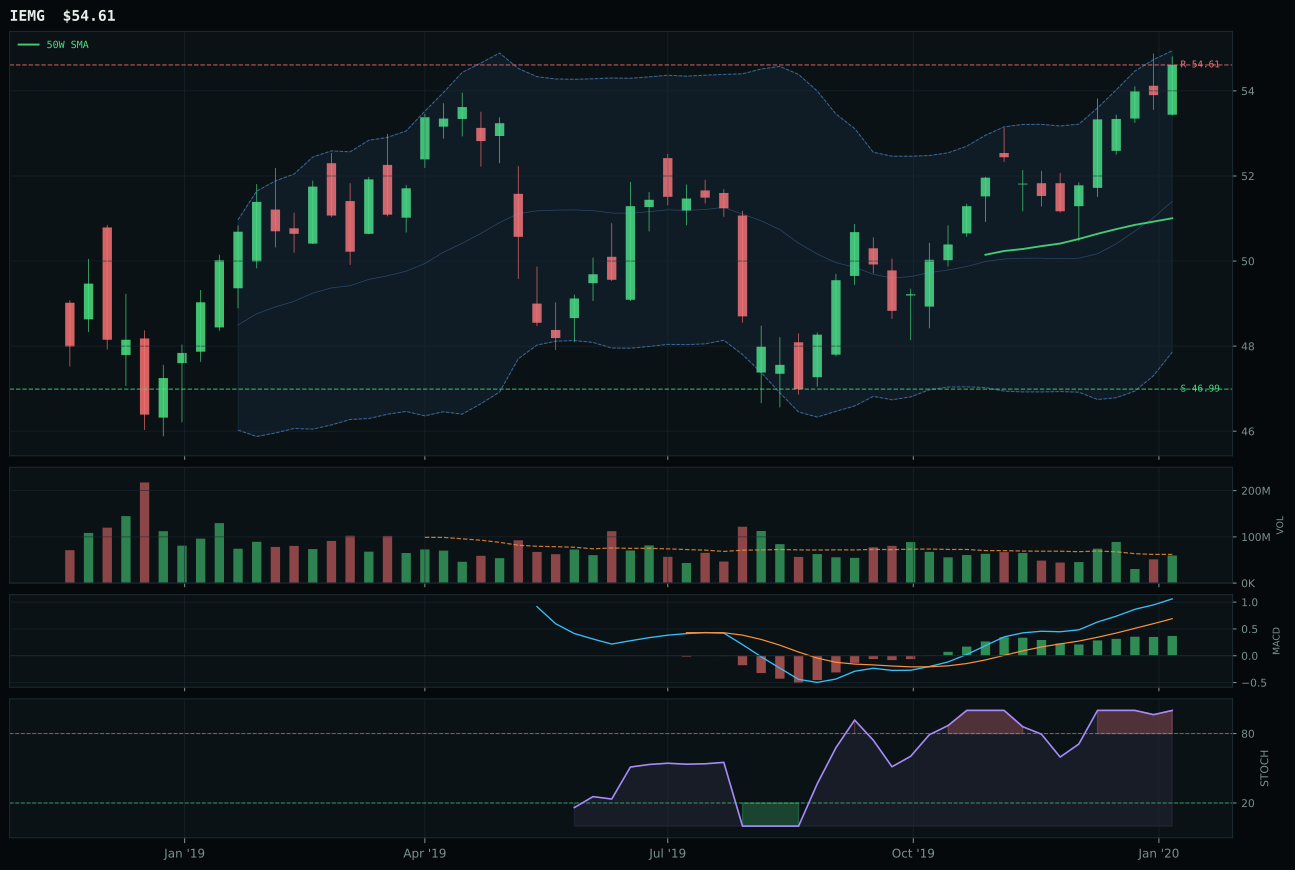
IEMG has a neutral structure profile with -0.8% 13-week relative strength versus SPY.
A failed hold above support would weaken the setup.
Actionable but governed by invalidation levels.
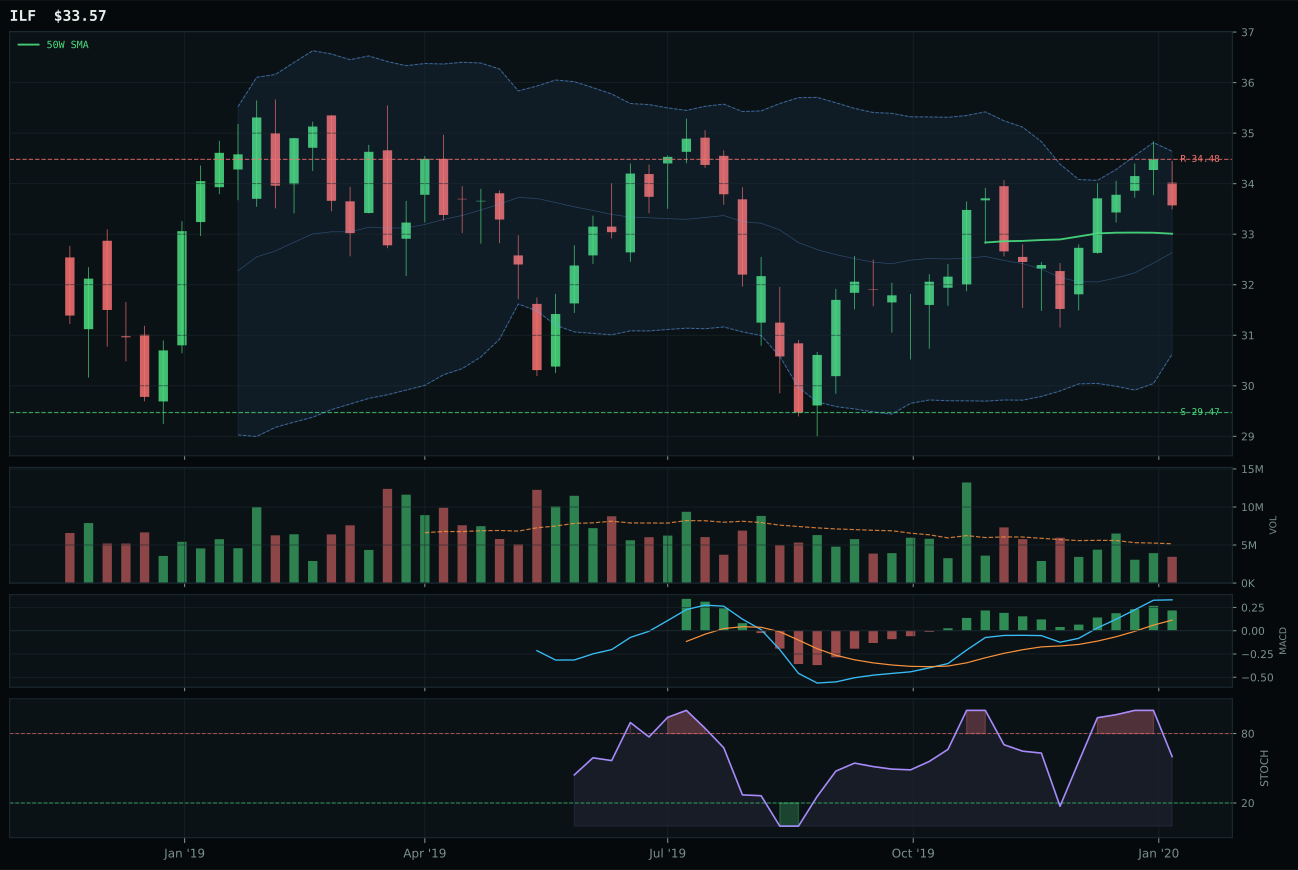
ILF has a compression near 50W profile with -5.2% 13-week relative strength versus SPY.
A failed hold above support would weaken the setup.
Actionable but governed by invalidation levels.
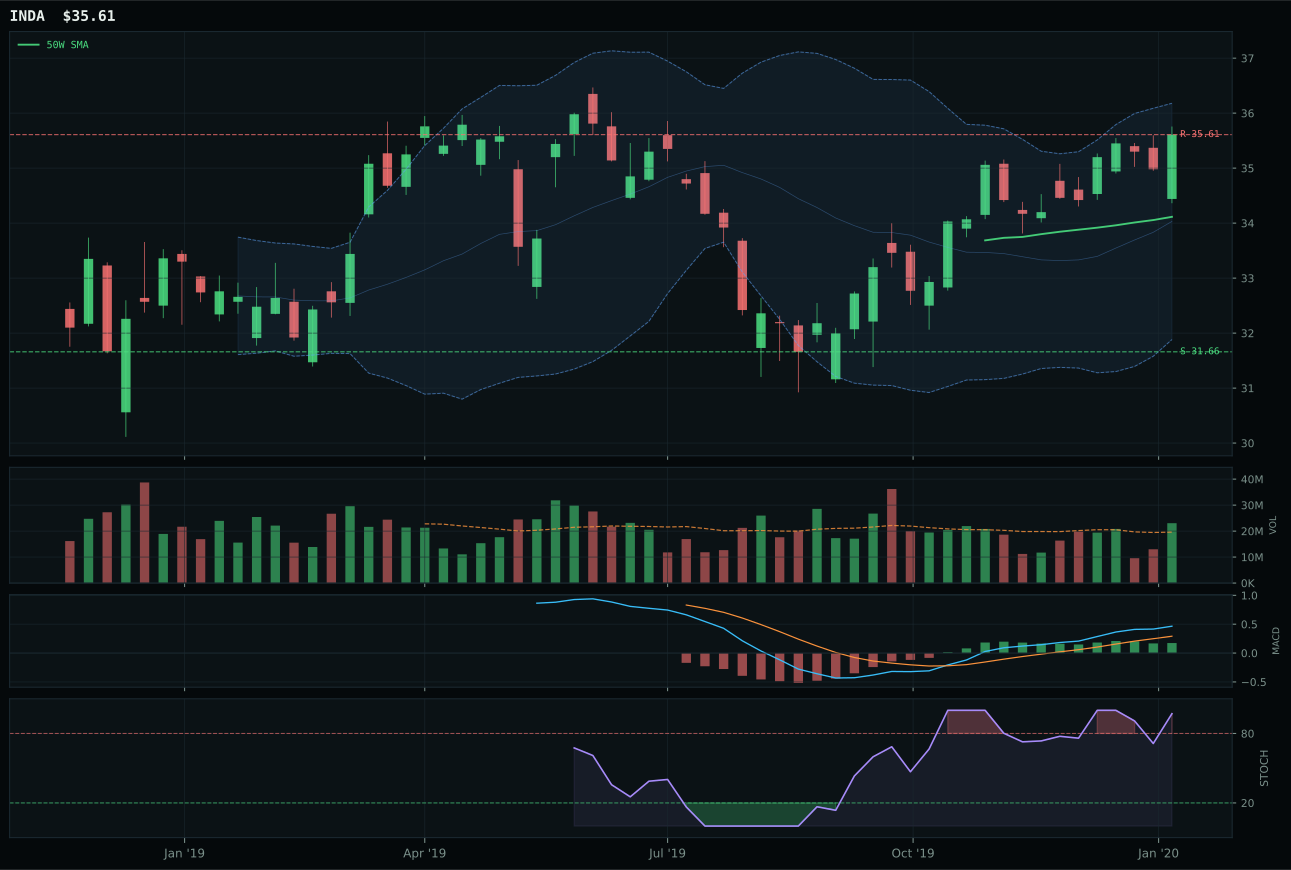
INDA has a neutral structure profile with -1.8% 13-week relative strength versus SPY.
A failed hold above support would weaken the setup.
Actionable but governed by invalidation levels.
IEMG captures Emerging Markets by combining the strongest category-level trend (98.8/100 from price above both key moving averages) with disciplined entry timing at just 7.1% above the 50W and perfect relative strength (1.0% category lead over ILF). The neutral structure cleanliness (66.7) is honest—the setup is not pristine but orderly—and MACD is unambiguously bullish and improving with stochastic RSI at overbought 1.00, yet volume remains neutral at 0.96x average, meaning the move is being walked up rather than chased violently. The near 52W high / extension Fib zone at 52.91 is a legitimate breakout signal, not a failed resistance. ILF loses on three fronts: structure less clean (72.9 versus 78.5), volume thin participation versus neutral, and category-relative strength a full 4.4 points lower at -3.4%, meaning Latin America value thesis is not resonating. The 2.5-point gap masks IEMG's cleaner breadth advantage.
Emerging Markets earns 20% allocation as a top-2 category because EM liquidity support is strongly active (+14 at category level, +12 at IEMG level) and risk appetite positive (+8 category-level) align to create genuine capital flows into emerging equity, not just mean-reversion hope. IEMG's 78.0 technical evidence is second only to Technology, and the timing score of 75.0 (versus Technology's 59.0) reflects that EM is actually accelerating rather than rolling over. The transition macro state is supportive of broad equity exposure when credit stress is muted, and IEMG's neutral volume profile means the move has backing without exhaustion signals. This is a true conviction allocation: EM is neither extended nor depleted, with active macro sponsorship and strong technical trend. Paired with Technology at 20%, it represents the portfolio's growth and rotation edge.
Precious Metals — GLD
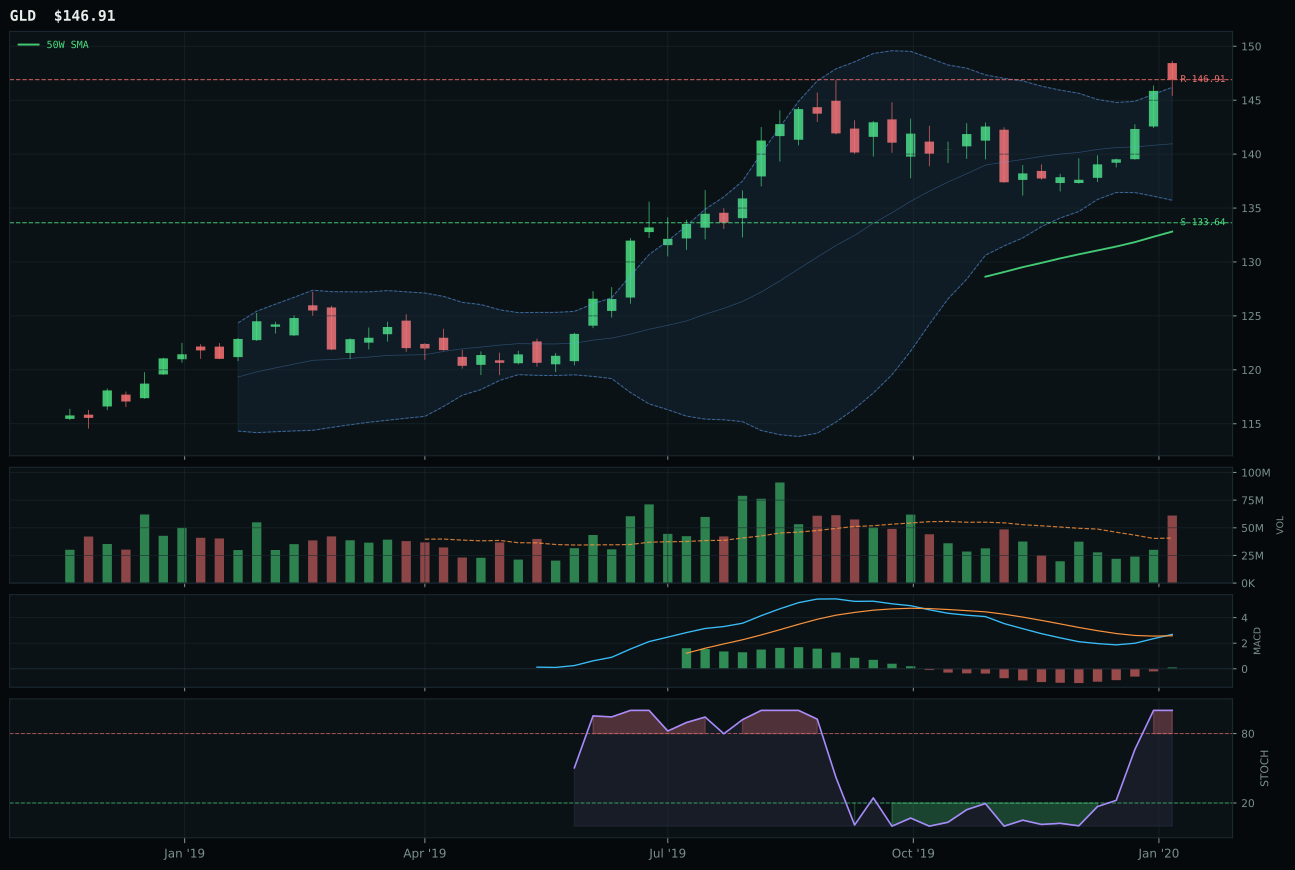
GLD has a neutral structure profile with -5.0% 13-week relative strength versus SPY.
A failed hold above support would weaken the setup.
Actionable but governed by invalidation levels.
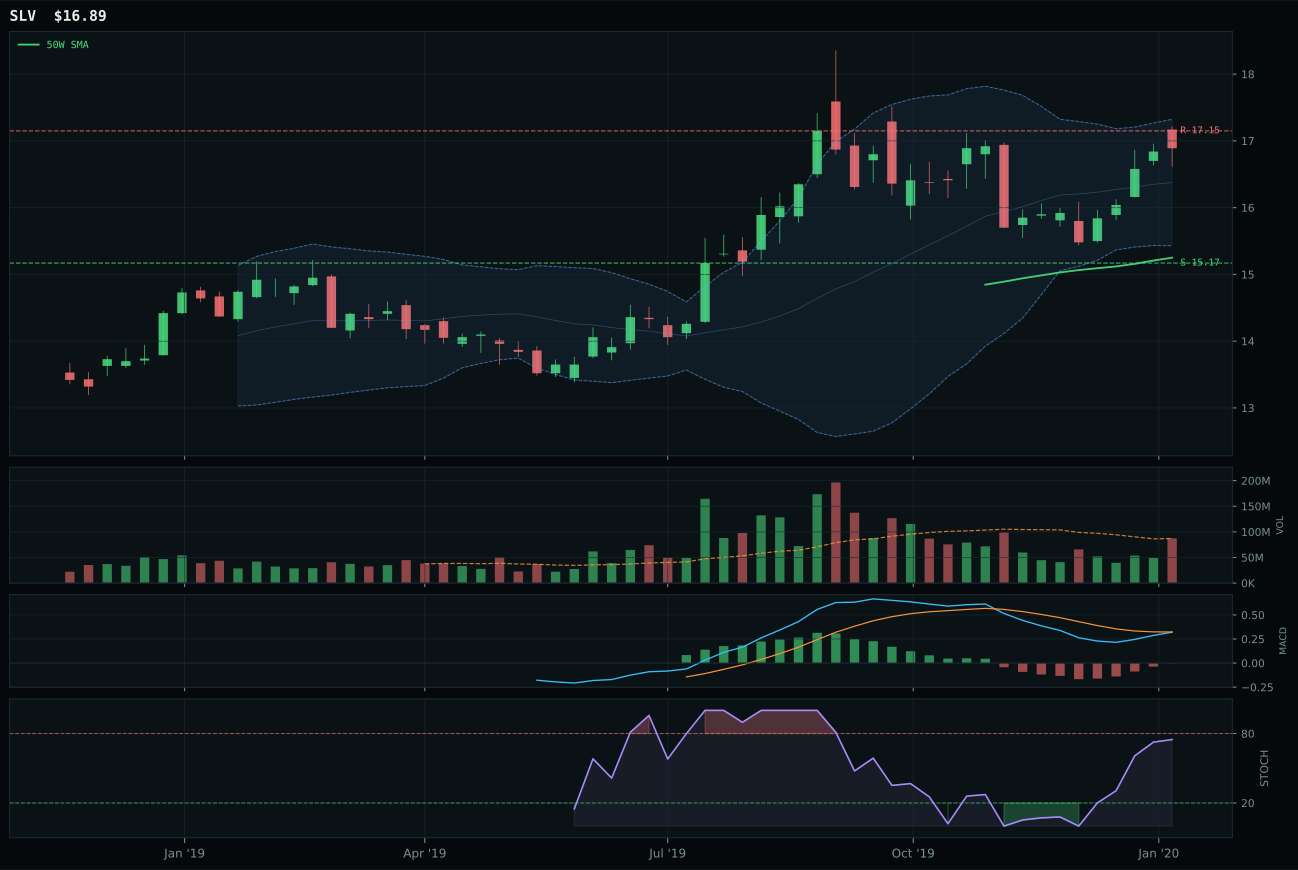
SLV has a neutral structure profile with -6.8% 13-week relative strength versus SPY.
A failed hold above support would weaken the setup.
Actionable but governed by invalidation levels.
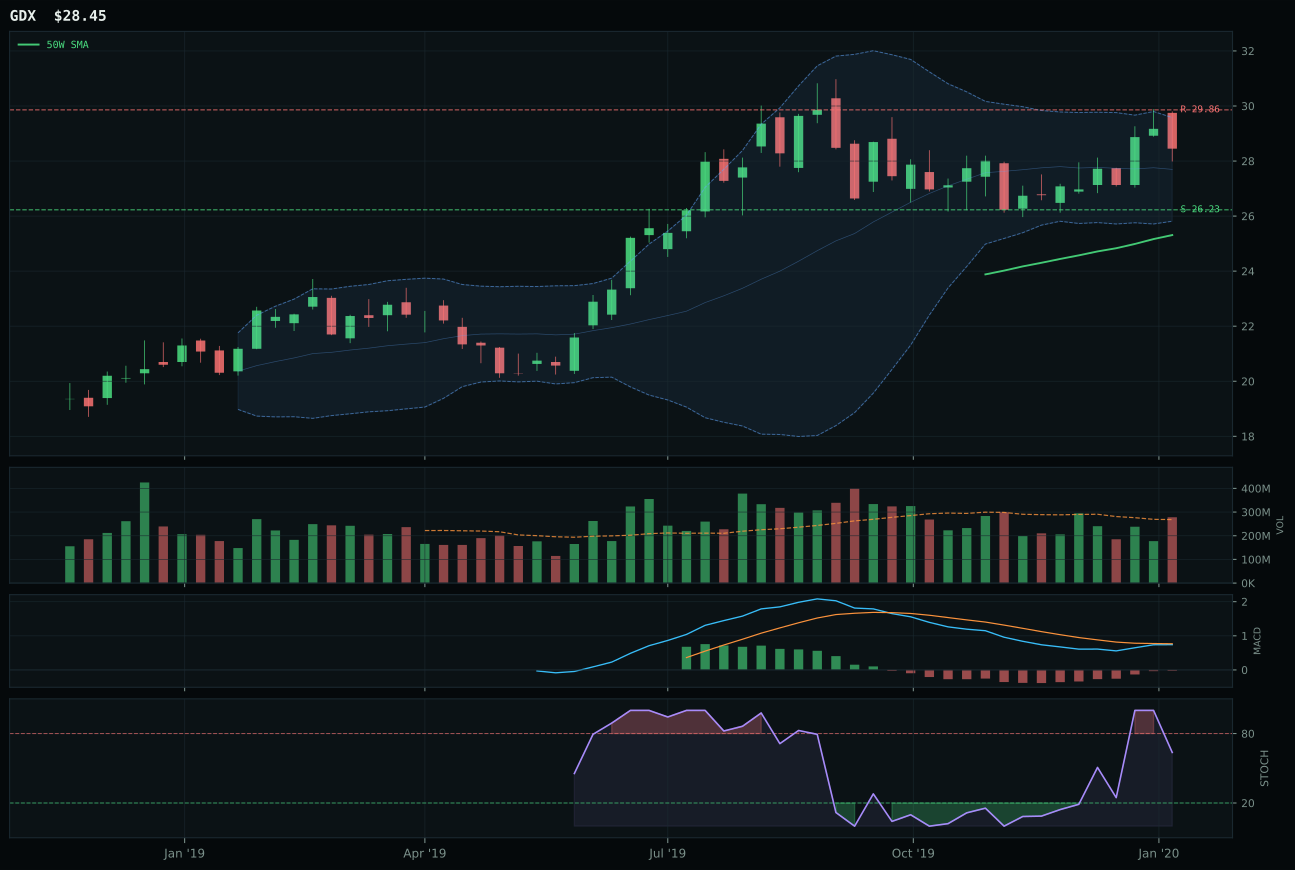
GDX has a neutral structure profile with -4.4% 13-week relative strength versus SPY.
A failed hold above support would weaken the setup.
Actionable but governed by invalidation levels.
GLD wins Precious Metals with 89.1 technical evidence driven by clean trend confirmation (92.5/100), solid structure (87.7/100 with 90.6 compression), and crucially, 1.50x volume accumulation/confirmation that proves institutional buyers are not front-running but actually deploying into the position. At 10.6% above the 50W, the extension is moderate, and the Fib 0.236 zone near 141.75 is classic breakout territory rather than exhaustion. MACD is bullish and improving with stochastic RSI at the overbought peak (1.00), yet the volume sponsorship confirms this is not a retail chase. SLV loses on every technical axis: MACD is bearish but improving (not bullish), structure is less clean (82.5), volume is neutral (no accumulation confirmation), and category-relative strength is -1.7% versus GLD's 0.0%. The 5.3-point gap understates GLD's quality advantage.
Precious Metals holds 10% as a defensive allocation because credit stress is still nominally active (-4 macro fit impact) and GLD's 89.1 technical evidence with accumulation-volume confirmation suggests smart money is hedging tail risk via physical gold rather than duration. The category-level macro fit is only 46.0/100, reflecting neutral positioning on metals scarcity and lukewarm risk appetite (positive but declining), yet GLD's own technical strength (89.1) outweighs the macro headwind. At a 10% weight, metals act as a ballast rather than a conviction bet; they protect against credit events or surprise inflation without demanding a major macro pivot. The position is justified on technicals and tail-hedge logic, not on macro tailwinds.
AI — SMH
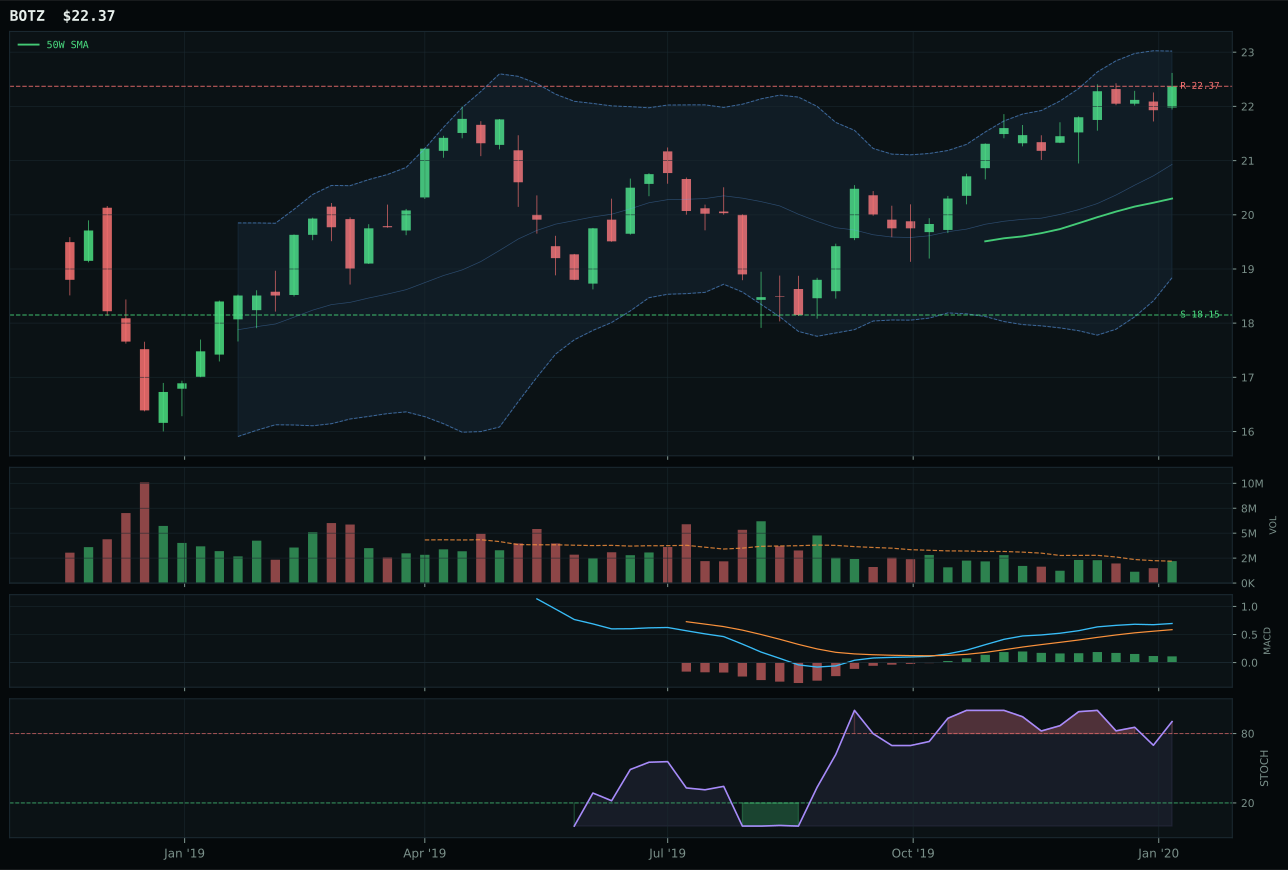
BOTZ has a neutral structure profile with 2.9% 13-week relative strength versus SPY.
A failed hold above support would weaken the setup.
Actionable but governed by invalidation levels.
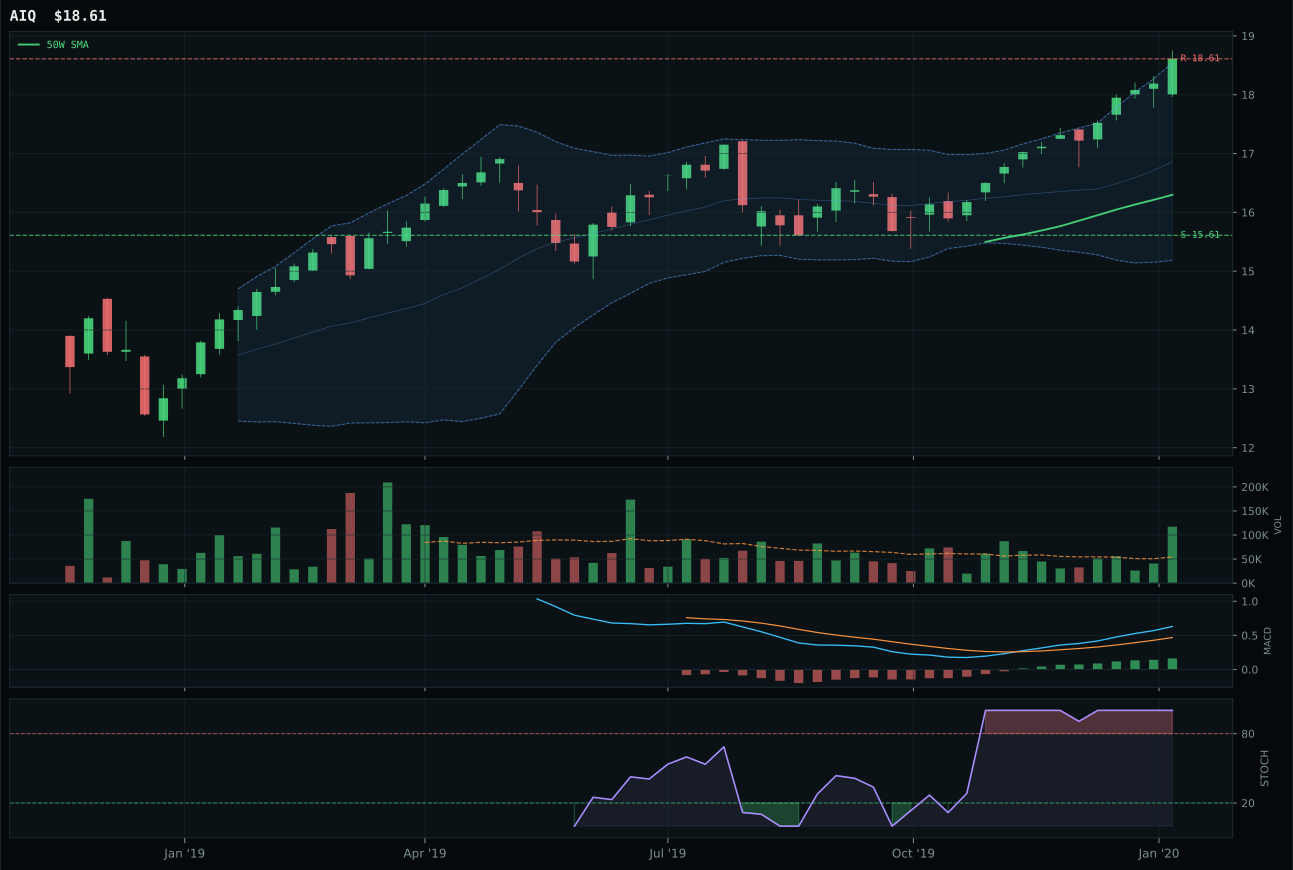
AIQ has a neutral structure profile with 5.4% 13-week relative strength versus SPY.
A failed hold above support would weaken the setup.
Tracked, but not top-2 eligible because: .
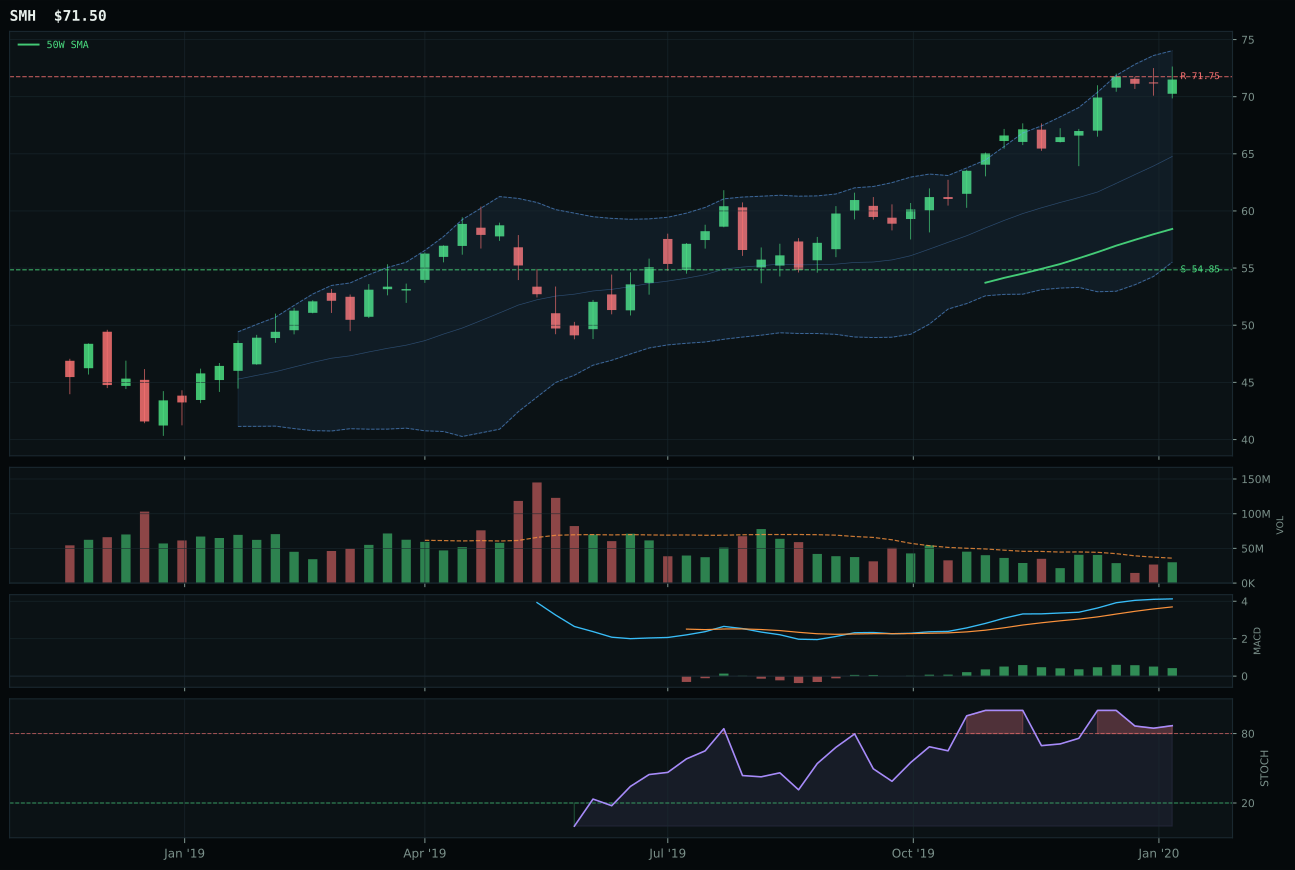
SMH has a vertical extension profile with 6.9% 13-week relative strength versus SPY.
A failed hold above support would weaken the setup.
Actionable but governed by invalidation levels.
SMH wins the AI category despite a harsh 22.0 timing score because its 6.9% relative strength versus SPY and 16.8% thirteen-week return command respect from the buy side—compute hardware and semiconductors are not bouncing on hope but accumulating on tangible AI capex flows. At 22.4% above the 50W with stochastic RSI rolling over from overbought (0.87), the setup is extended and vulnerable to mean reversion, yet the category-relative strength of 1.5% over BOTZ and the neutral volume environment keep it ahead. BOTZ loses because its structure is less clean (78.2 versus 82.2) and category relative strength actually turns negative at -2.5%, meaning the robotics AI thesis is lagging its silicon companion. The -2.0 point gap is slim, which correctly reflects an uncomfortable choice between two overbought setups in a transition regime.
AI holds 10% despite a 52.2 category score well below the top two because macro descriptors favor semiconductors and compute hardware strongly (AI growth sponsorship is active at +14 and +6 at the category level), and SMH's 6.9% SPY outperformance suggests capital is rotating forward into the most essential AI infrastructure. The near-term timing risk is real—MACD is flattening and price sits in the Fib 0.236 extension zone—but the risk appetite positive descriptor and EM liquidity support create an environment where even overbought AI trades can persist. Dropping below 10% would be premature when the macro setup explicitly names AI as a sponsorship driver and the category's technical evidence sits at 49.2/100, enough to hold the position if not to expand it.
Utilities & Infrastructure — XLU
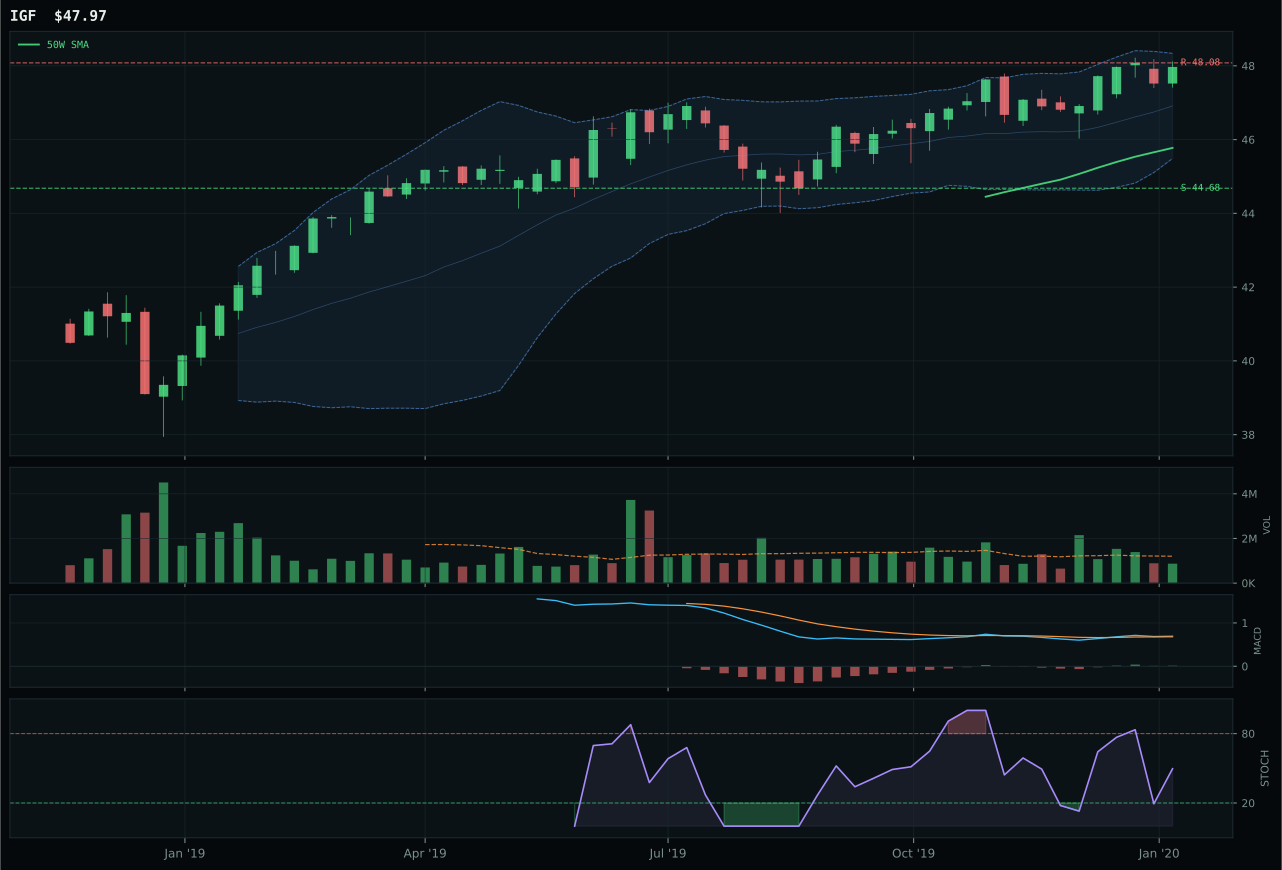
IGF has a neutral structure profile with -7.3% 13-week relative strength versus SPY.
A failed hold above support would weaken the setup.
Actionable but governed by invalidation levels.
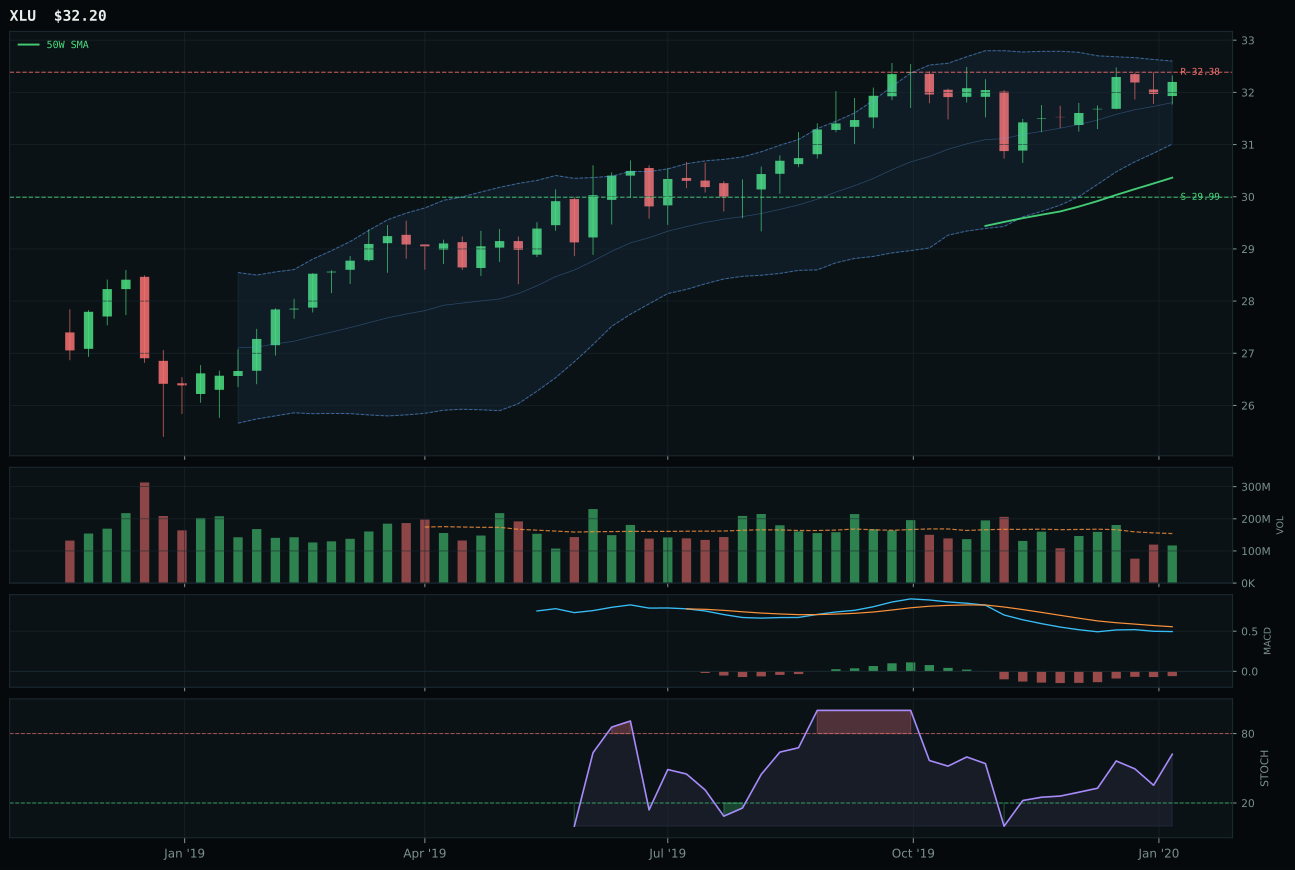
XLU has a neutral structure profile with -9.2% 13-week relative strength versus SPY.
A failed hold above support would weaken the setup.
Actionable but governed by invalidation levels.
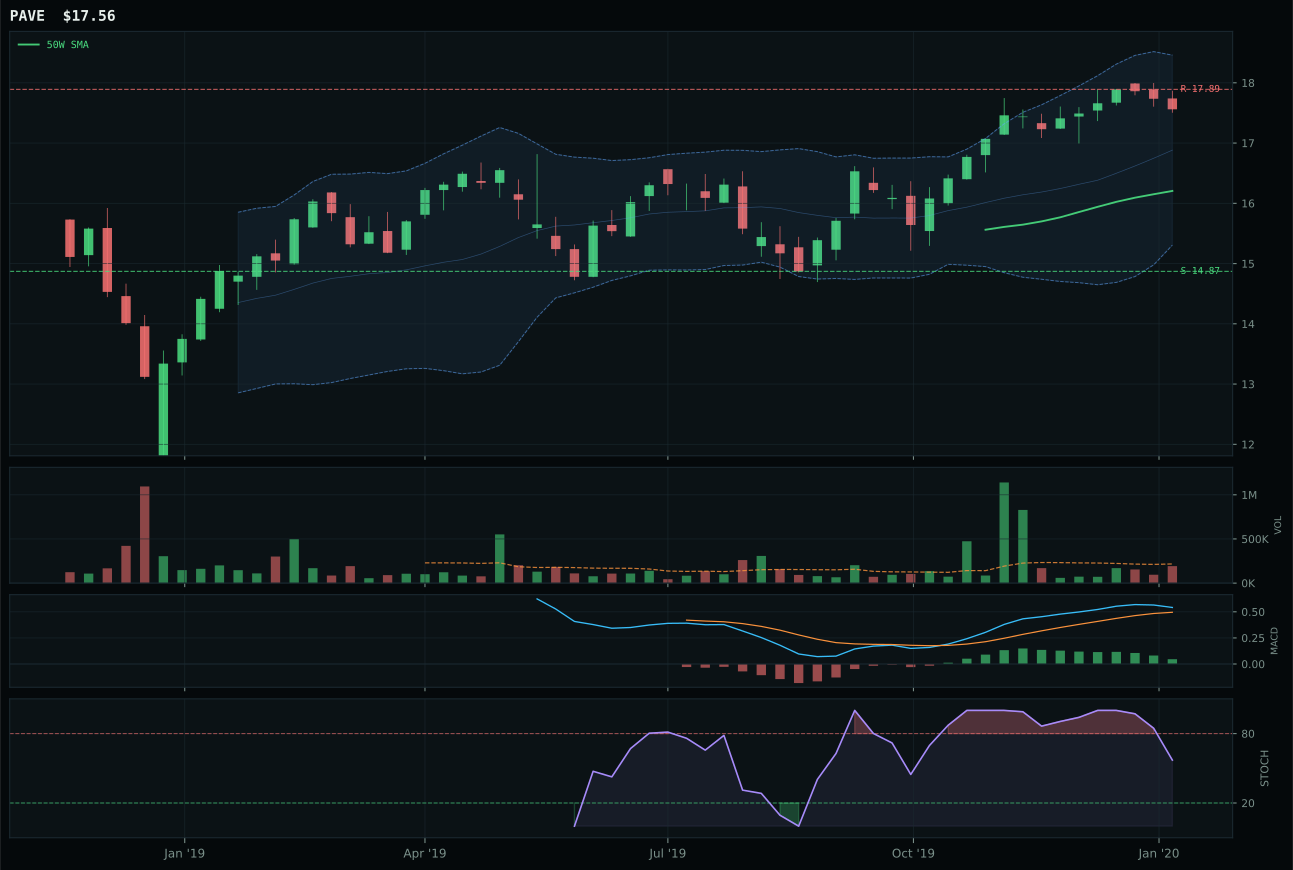
PAVE has a neutral structure profile with -0.7% 13-week relative strength versus SPY.
A failed hold above support would weaken the setup.
Tracked, but not top-2 eligible because: .
XLU claims Utilities by holding price above the 50W (79.2 trend score) while remaining only 6.0% extended, a disciplined structure that preserves upside room without punishing entry risk. The 83.0 timing score is its strongest suit: MACD is bearish but improving (not yet bullish), stochastic RSI is rising mid-zone (0.62), and the Fib 0.236 zone near 30.95 is exactly where early-cycle positions should be bought. The neutral volume at 0.76x average means this is not forced accumulation but steady sponsorship, and the support at 29.99 provides 7.4% downside protection. IGF loses because its stochastic RSI is falling/neutral (less favorably timed than XLU's rising mid-zone), structure is less clean (77.4 versus 78.8), volume is thin participation (not neutral), and risk-reward is fractionally weaker (37.6 versus 38.4). The -5.5 point gap is deceptive; it reflects IGF's superior timing composite being offset by XLU's cleaner structure and volume.
Utilities & Infrastructure holds 10% as a defensive rotation sleeve rather than a growth bet, with XLU's 59.7 technical evidence providing conviction that the setup is real despite a category score of 49.0. The macro regime (transition/mixed) is moderately supportive (+4 fit boost) when paired with risk appetite that is still nominally positive but no longer accelerating. XLU's most recent 13W return is a stalled 0.8%, which is precisely what utilities deliver in a regime shift—they hold capital without delivering alpha. The position is sized as a barbell anchor: when growth (Technology, AI, Emerging Markets) is extended, utilities provide a steady cash-generative alternative. The timing score of 83.0 with MACD improving means the sector has begun to reaccelerate, justifying 10% rather than a smaller defensive weight.
Industrial Metals — PICK
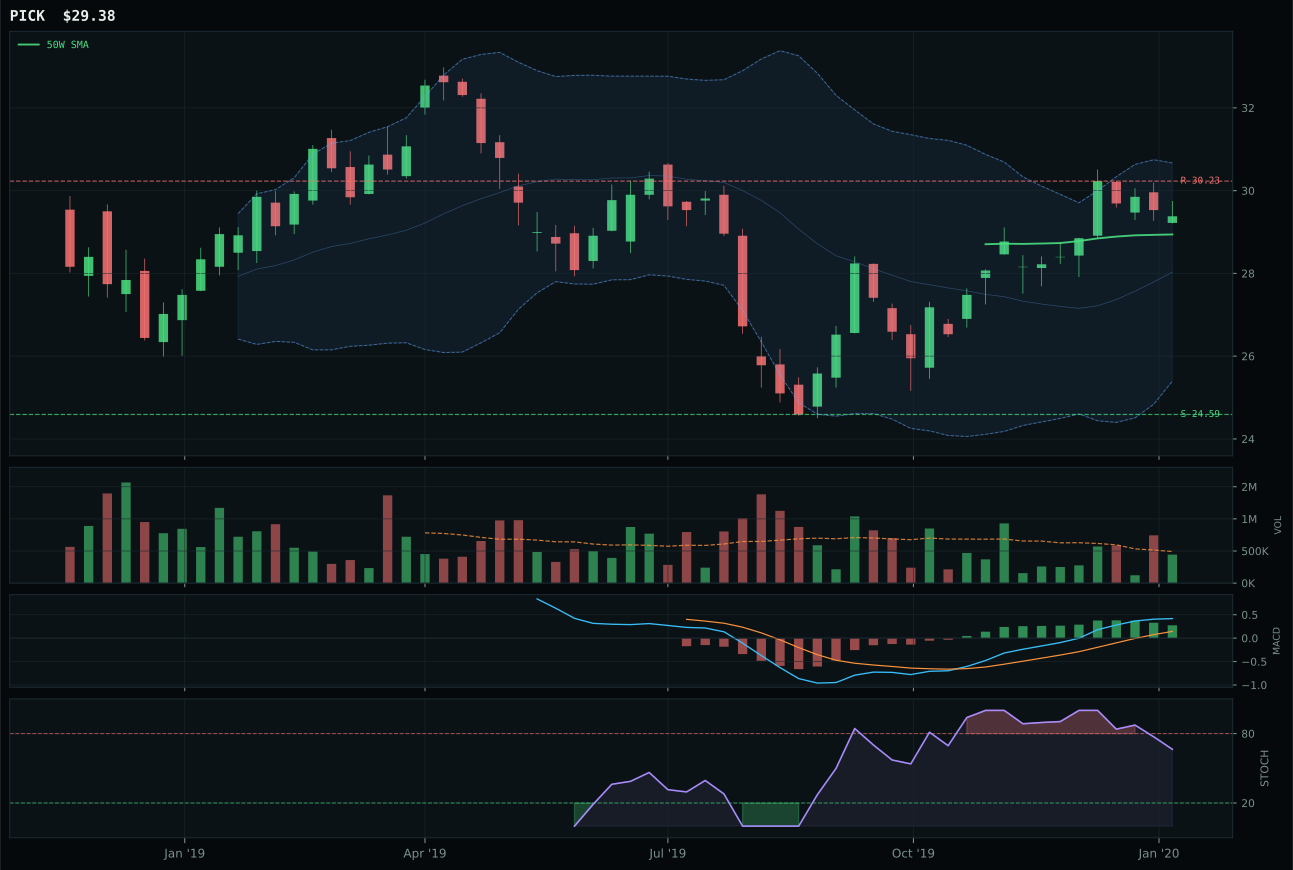
PICK has a compression near 50W profile with -1.8% 13-week relative strength versus SPY.
A failed hold above support would weaken the setup.
Actionable but governed by invalidation levels.
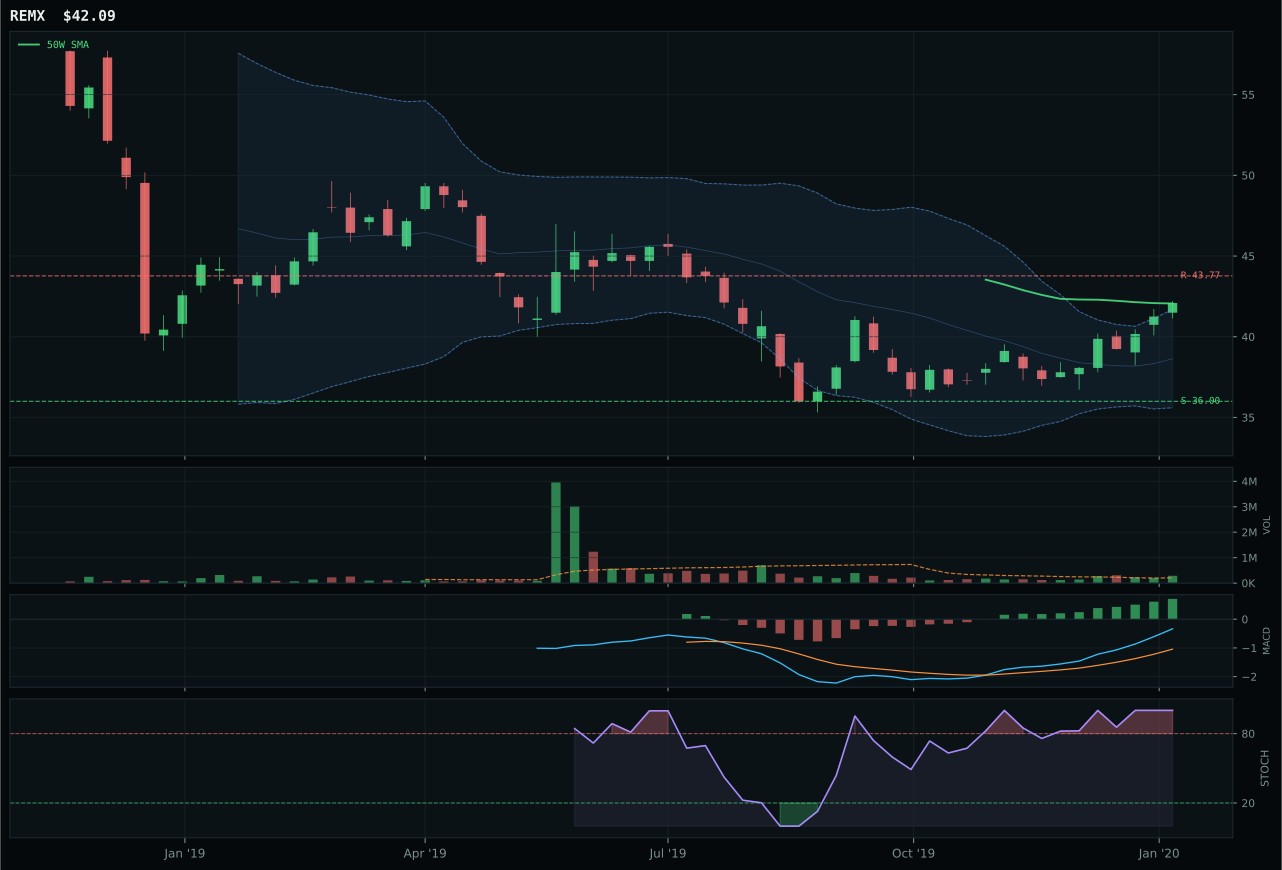
REMX has a compression near 50W profile with 1.0% 13-week relative strength versus SPY.
A failed hold above support would weaken the setup.
Tracked, but not top-2 eligible because: .
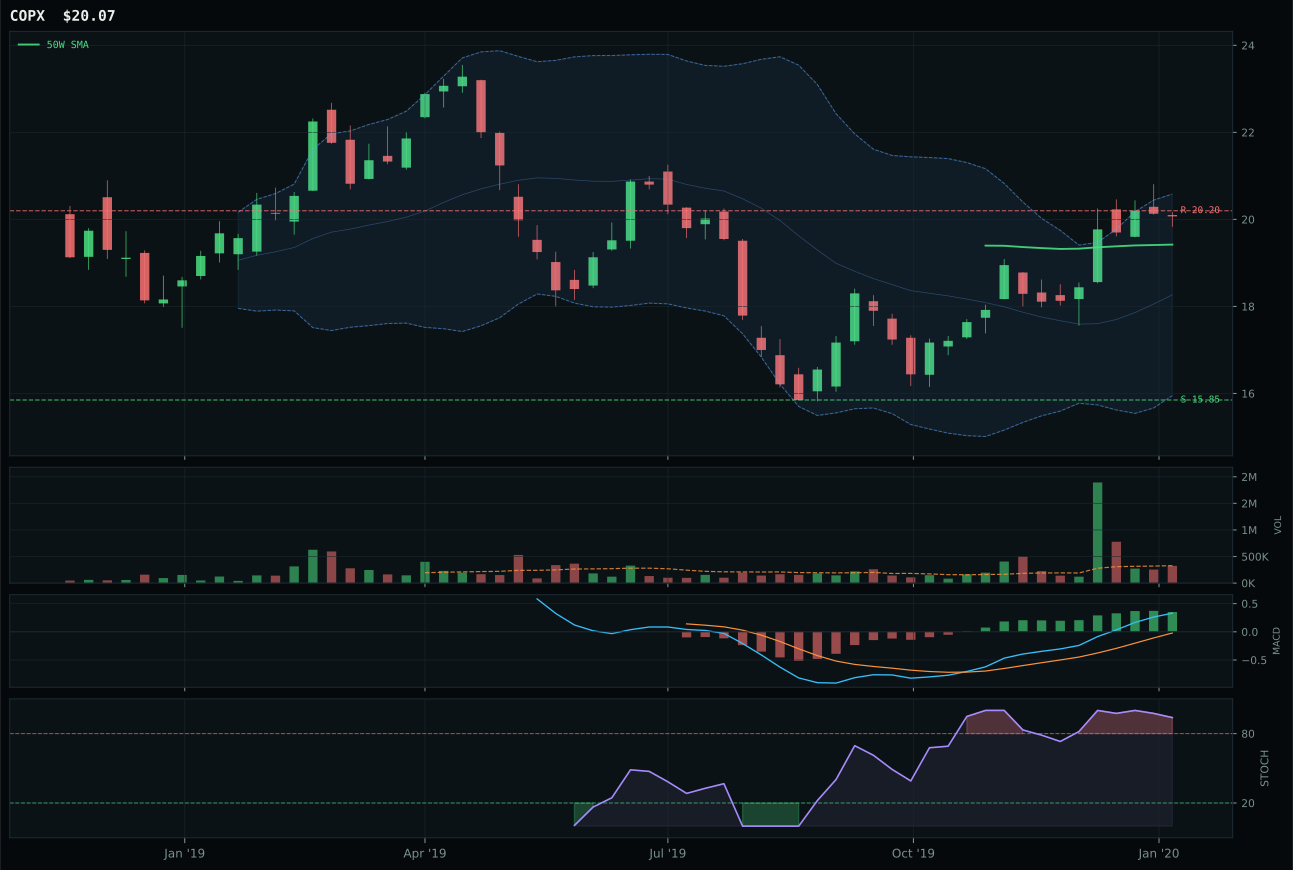
COPX has a neutral structure profile with 7.0% 13-week relative strength versus SPY.
A failed hold above support would weaken the setup.
Tracked, but not top-2 eligible because: .
PICK locks down Industrial Metals by occupying a sweet spot between coiled compression and perfect timing: price is just 1.5% from the 50W, and the setup is compression near support, which means buyers have defended the level and the next move is likely to be impulse-sized. The 100.0 timing score reflects that Fibonacci location at 0.382 (middle retracement / decision zone) is precisely where trending moves are born, and MACD bullish but flattening suggests momentum is present but not yet overheated. Stochastic RSI at 0.67 falling/neutral (not overbought) is permission to hold, and the 8.1% thirteen-week return proves accumulation has already happened quietly. REMX shows stronger momentum (10.9% 13W) and above-average volume participation, but its MACD confirmation is superior (bullish and improving) and it loses on structure cleanliness (unclear if the setup is actually compressed versus just choppy near the 50W). The 20.8-point gap reflects PICK's superior risk-reward framework.
Industrial Metals earns 10% because metals scarcity is strongly active (+14 macro fit score) and commodity breadth is positive (+10), creating a genuine macro environment where mining equity demand will be sustained rather than speculative. PICK's perfect 100.0 timing score and compression-near-support setup mean the category can begin to expand just as macro tailwinds are accelerating; this is not mean-reversion chasing but early-cycle participation. Real asset sponsorship is also active (+6), and the transition macro state is neutral to slightly positive for commodity equity when combined with positive risk appetite. At 10%, the position acts as a commodity leveraged hedge with better technical entry than precious metals and stronger macro sponsorship than energy.
Agriculture & Livestock — MOO
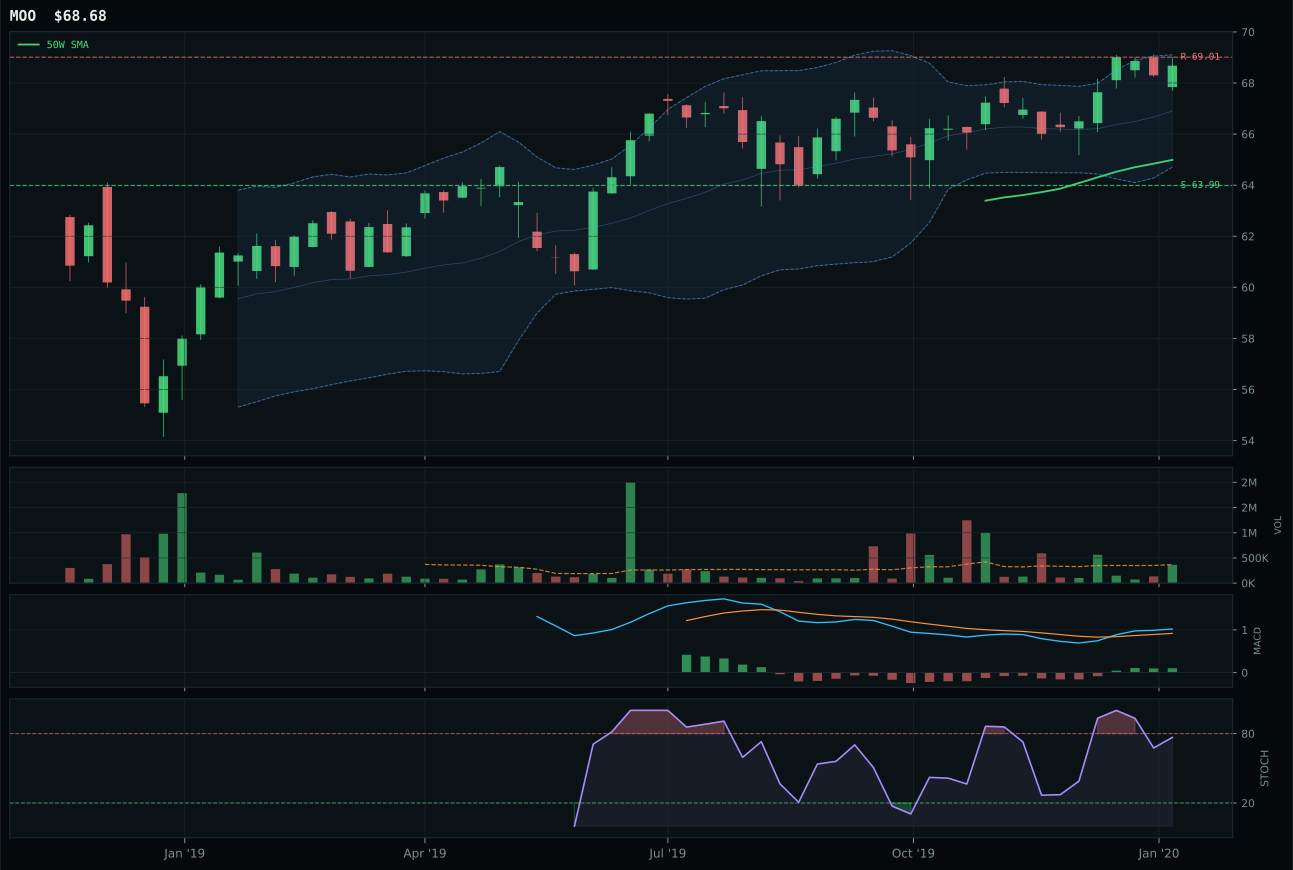
MOO has a neutral structure profile with -6.2% 13-week relative strength versus SPY.
A failed hold above support would weaken the setup.
Actionable but governed by invalidation levels.
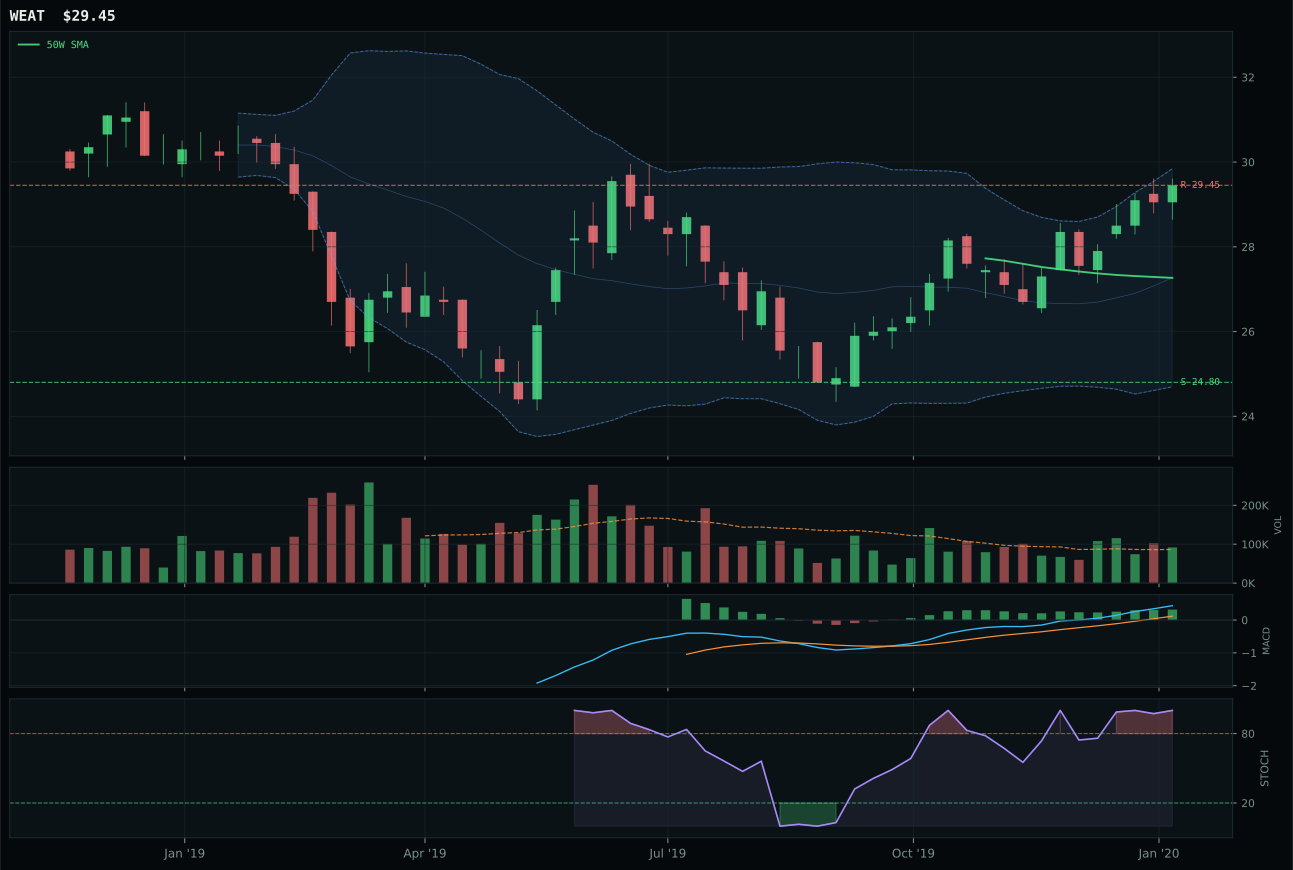
WEAT has a neutral structure profile with -1.5% 13-week relative strength versus SPY.
A failed hold above support would weaken the setup.
Tracked, but not top-2 eligible because: .
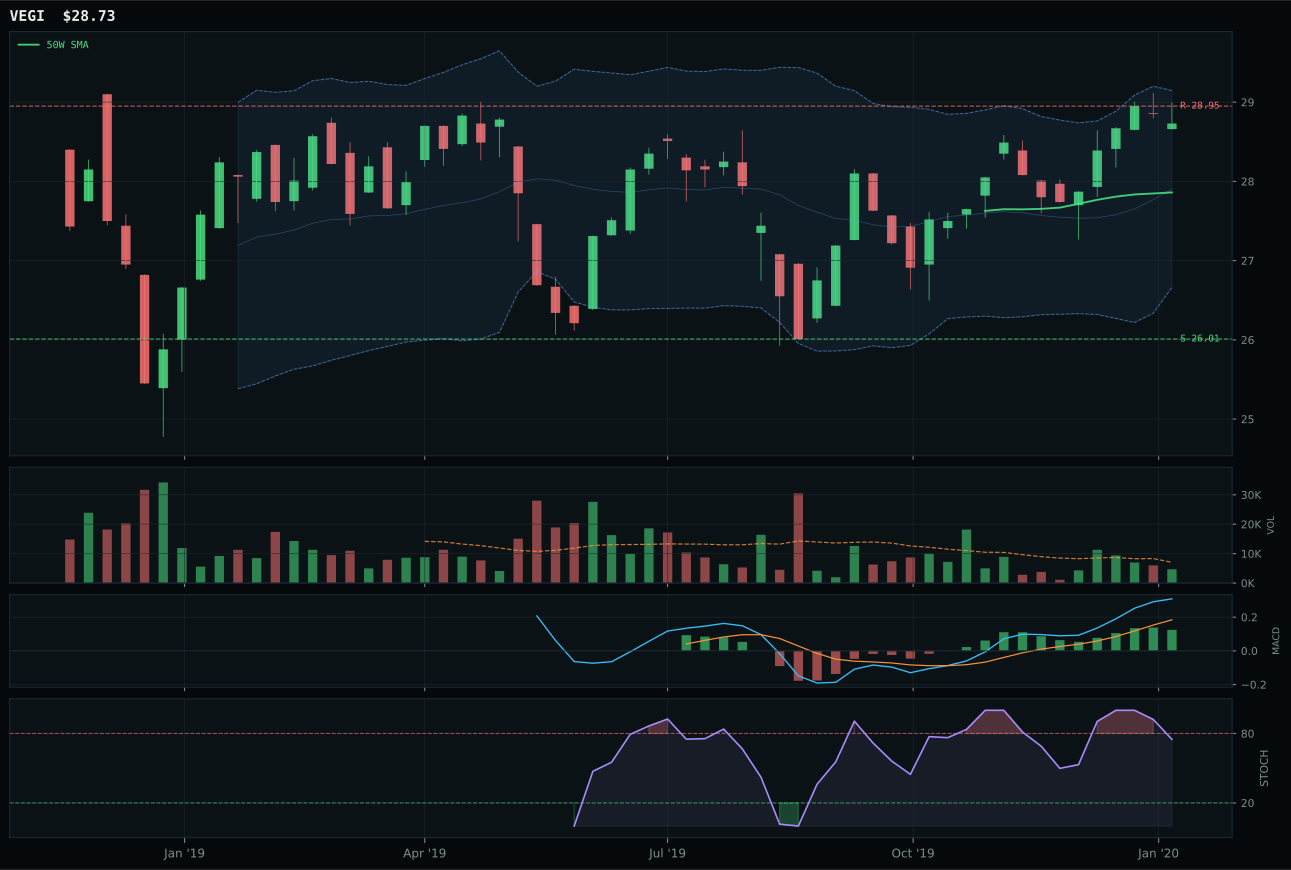
VEGI has a neutral structure profile with -5.5% 13-week relative strength versus SPY.
A failed hold above support would weaken the setup.
Tracked, but not top-2 eligible because: .
MOO captures leadership in Agriculture by merging a cleanly improving technical setup with macro winds that favor real assets. The 90.7 trend score reflects uptrends on both the 50W and 200W, yet the 5.7% distance from the 50W keeps the setup disciplined and avoids the chasing risk that plagues extended moves. Stochastic RSI at 0.77 is falling from neutral (not overbought), and compression is tight at 90.8, which means the prior range is being squeezed and price is coiled for an impulse move. MACD is bullish and improving with neutral volume, making this a genuine buildup rather than short-covering. WEAT loses due to slightly noisier structure (72.3 versus 74.0 cleanliness) despite a hotter 13W return at 8.5%; MOO's larger relative strength cushion within the category (-0.7% versus median) proves the margin of victory.
Agriculture earns 10% as a real-asset hedge to equity and credit risk, even though its 41.6 category score ranks outside the top two. Real asset sponsorship is active (+5 at category level) and commodity breadth positive hits +8, creating an environment where agricultural commodity equity demand is genuine rather than speculative. MOO's bullish MACD improvement and falling/neutral stochastic RSI (not yet overbought) mean the setup has room to run without requiring new all-time-highs to validate ownership. In a transition macro state with credit stress still active, owning positions that benefit from input inflation and supply constraints adds a portfolio diversifier that growth alone cannot provide. The 10% slot reflects this macro hedge value more than technical brilliance.
Defense & Aerospace — XAR
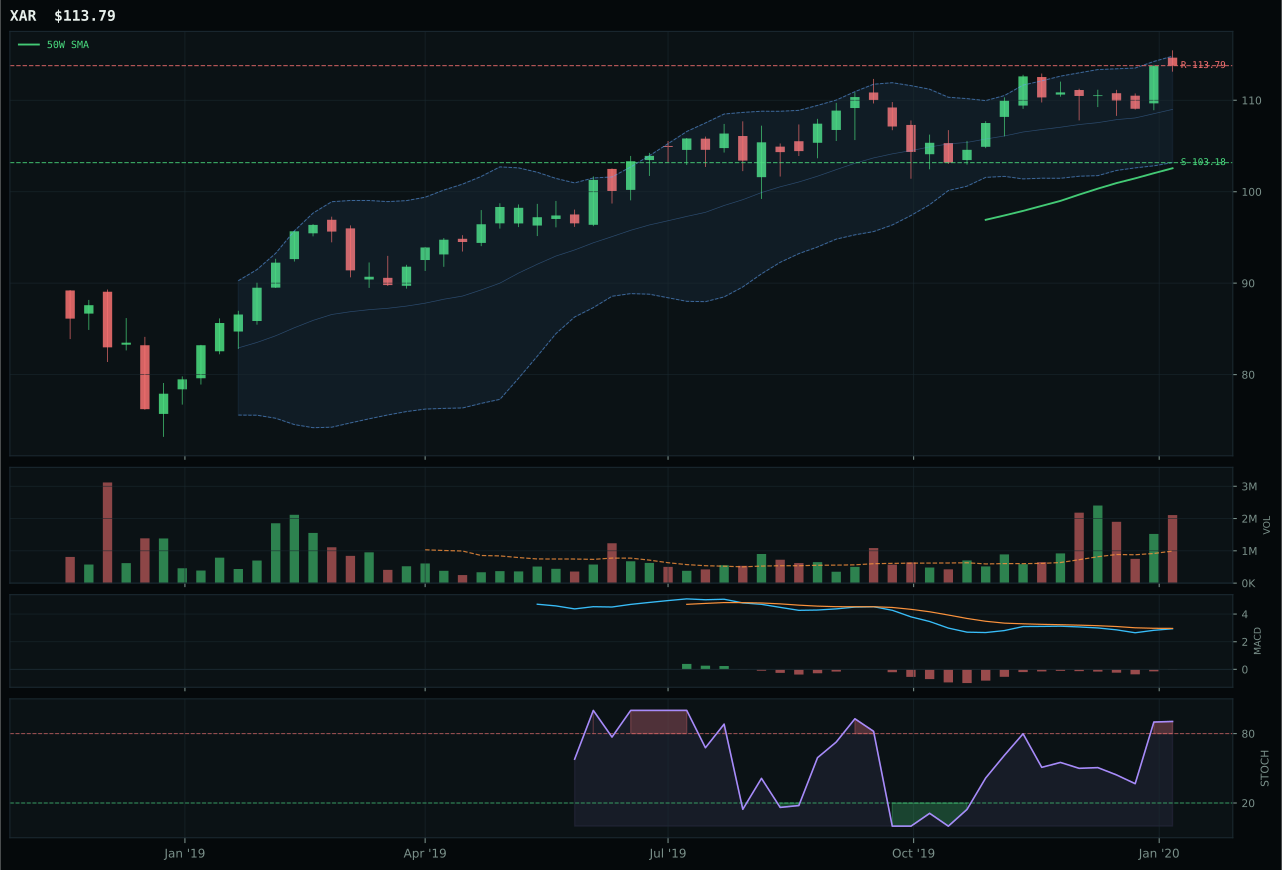
XAR has a neutral structure profile with -1.9% 13-week relative strength versus SPY.
A failed hold above support would weaken the setup.
Actionable but governed by invalidation levels.
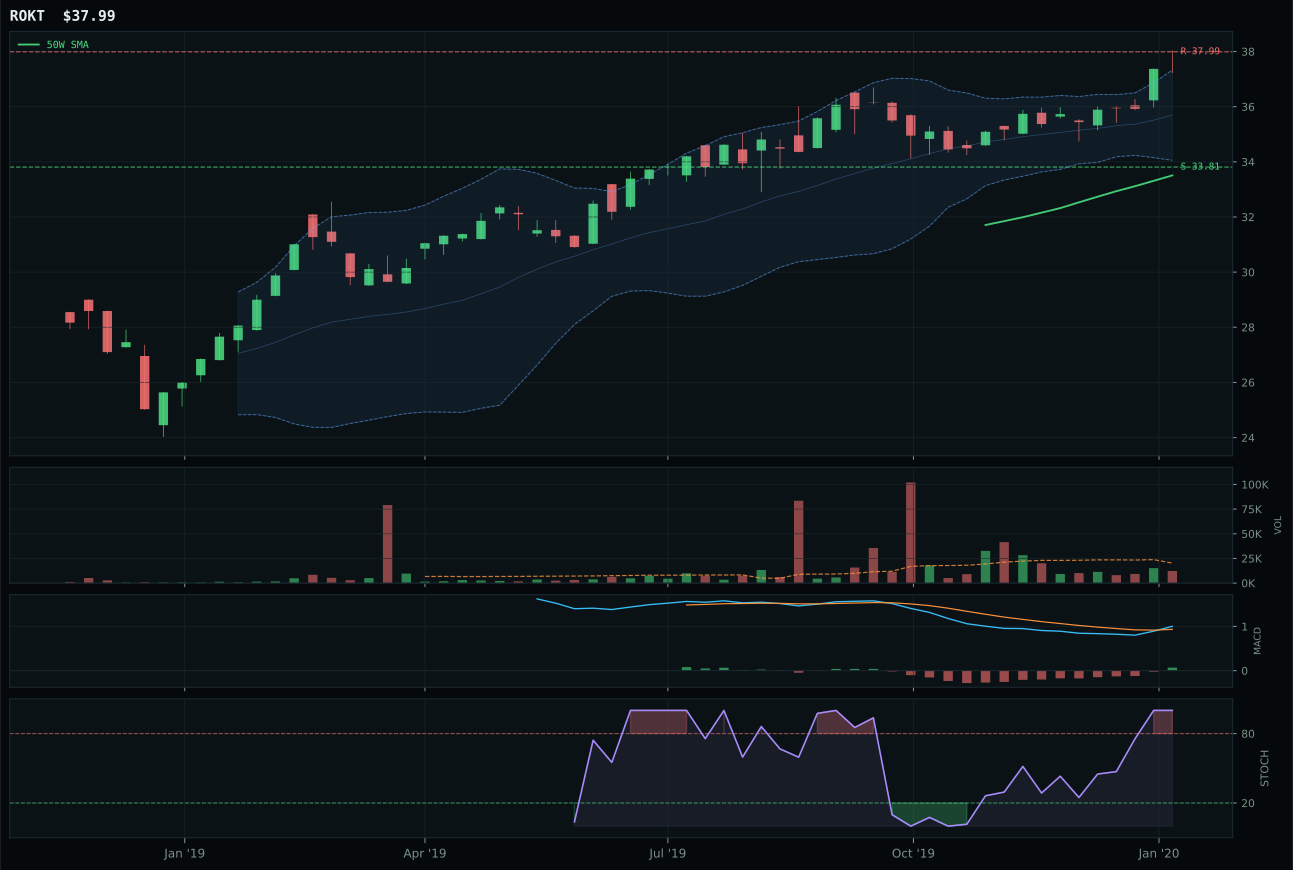
ROKT has a neutral structure profile with -1.7% 13-week relative strength versus SPY.
A failed hold above support would weaken the setup.
Tracked, but not top-2 eligible because: .
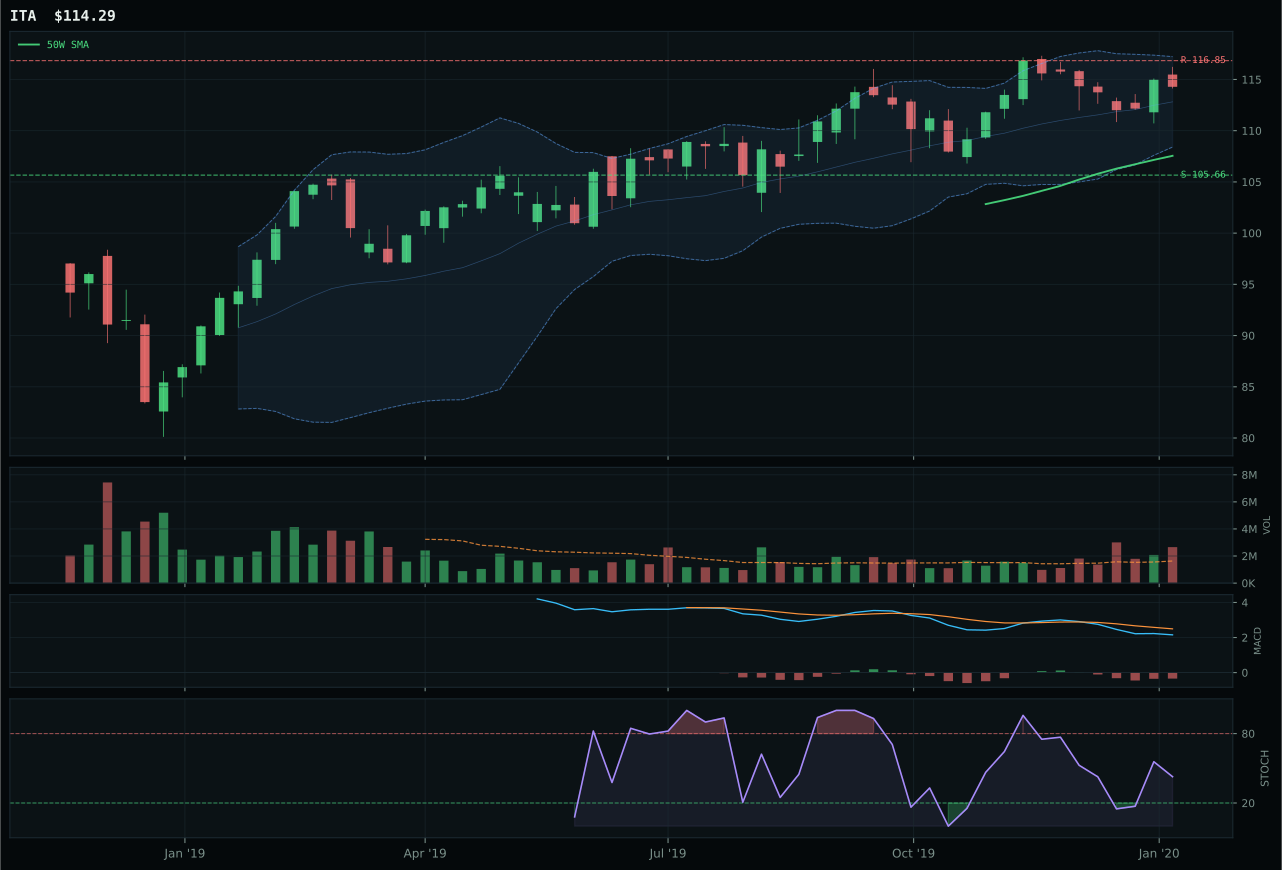
ITA has a neutral structure profile with -7.2% 13-week relative strength versus SPY.
A failed hold above support would weaken the setup.
Actionable but governed by invalidation levels.
XAR dominates its category with exceptionally clean fundamentals: a 97.1 trend score from price above both the 50W and 200W, combined with the strongest single-category relative strength advantage at 2.12x average volume confirming accumulation. The 10.9% distance from the 50W is measured and not extended, and with support sitting 10.3% below and resistance at the same level, the risk-reward framework (56.0/100) gives buyers protection without demanding they chase. MACD is bullish and improving with overbought stochastic RSI at 0.91, meaning momentum is hot but not rolling over yet. ROKT stumbles due to structure that is less crisp (79.5 versus 84.4), volume that shows only thin participation rather than accumulation/confirmation, and a weaker risk-reward (48.6 versus 56.0)—a 32.5-point score gap that reflects XAR's technical superiority.
Defense & Aerospace merits 10% allocation despite a 40.9 category score because XAR's 91.2 technical evidence score and strong volume sponsorship (accumulation/confirmation at 2.12x) provide a conviction-worthy foundation in a transition macro environment where credit stress is only mildly active (-7) and risk appetite remains positive. The category's macro fit sits at 55.0/100, bolstered by the fact that defense spending and geopolitical uncertainty tend to be orthogonal to growth rate shocks. With XAR showing a neutral structure setup and nearly perfect trend confirmation, the position acts as a hedge to equity downside without requiring a macro spike; it holds its ground on technicals alone. The allocation reflects the fact that this is not a growth story but a measured, quality-above-returns thesis.
Nuclear Energy — URA
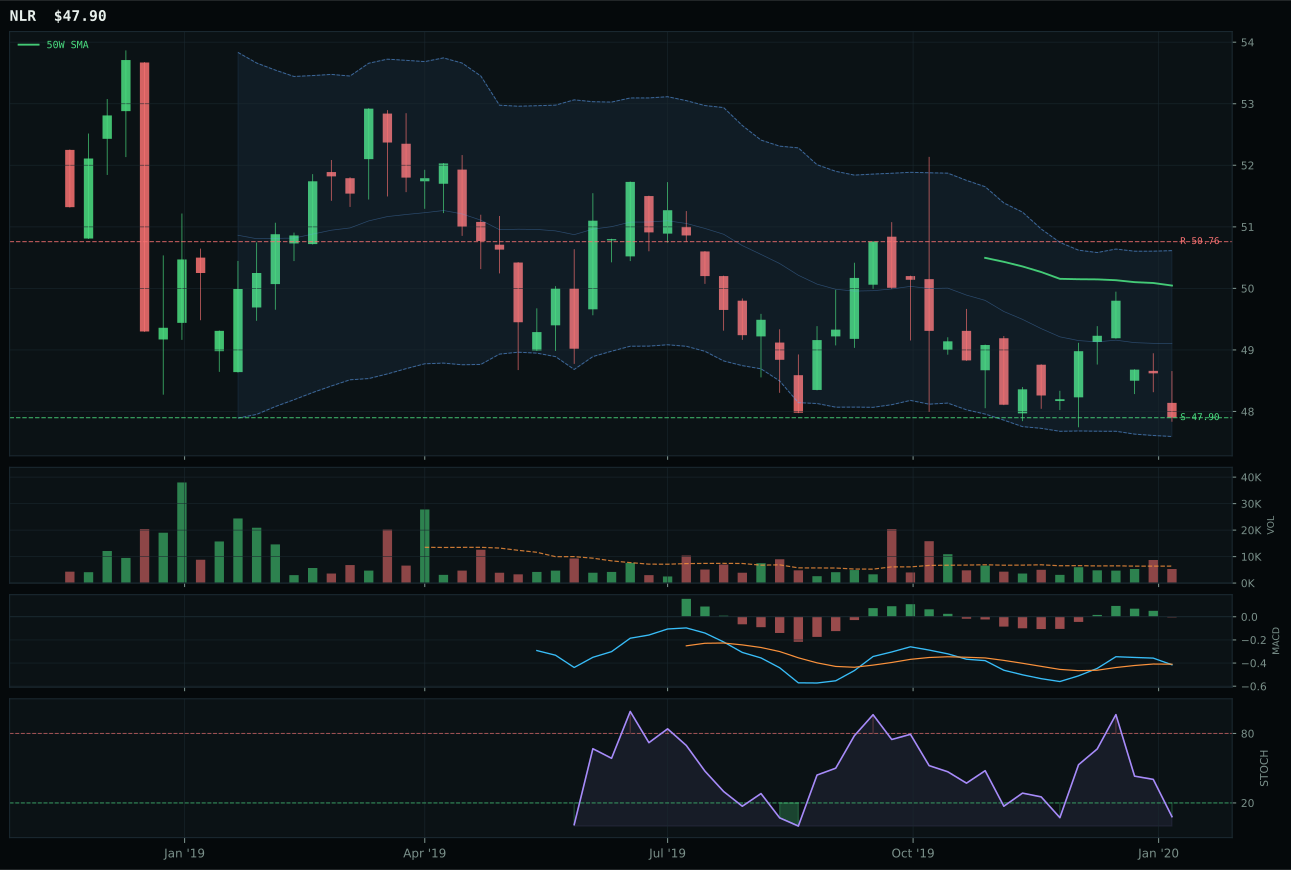
NLR has a pullback into support profile with -12.8% 13-week relative strength versus SPY.
A failed hold above support would weaken the setup.
Tracked, but not top-2 eligible because: .
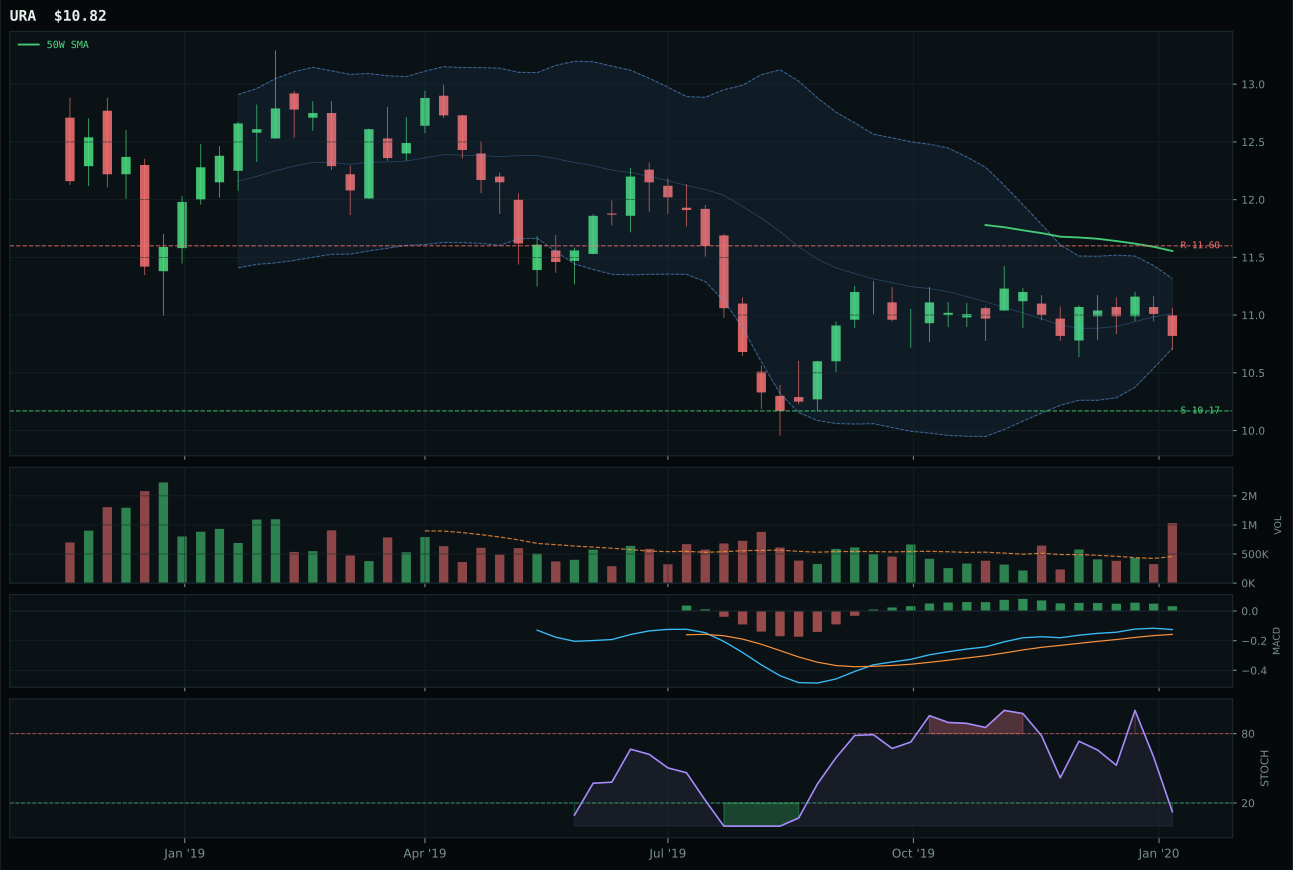
URA has a neutral structure profile with -12.5% 13-week relative strength versus SPY.
Extension and support failure are the main tactical risks.
Tracked, but not top-2 eligible because: structurally broken.
URA wins Nuclear Energy in a category so broken that neither candidate qualifies for portfolio inclusion: URA's 11.0 technical evidence and 0.4 composite score for NLR represent genuine structural damage. URA's sole advantage is a 63.9 risk-reward score (better than NLR's 57.7) and MACD bullish but flattening (versus NLR's bearish/weakening), yet both sit below their 50W and 200W with heavy distribution pressure (URA's 2.26x volume on a down move). The 13W returns are meaningfully negative (-2.6% for URA, -2.9% for NLR), and relative strength to SPY is damaged at -12.5% for URA and -12.8% for NLR. This is not a category setup; this is capitulation waiting to be absorbed. The -10.5 point gap reflects URA's marginally less severe technical deterioration, not any actual strength.
Nuclear Energy receives 0% allocation at 22.4 with explicit eligibility failure, ranked tenth and excluded from the selection entirely. URA's composite score of 0.0 and NLR's 10.0 composite reflect a category that failed all structural filters: both ETFs sit underwater relative to their fifty and two-hundred-week moving averages, volume confirms selling pressure rather than accumulation, and MACD shows either flattening or deterioration. The timing score of 70.0 for URA presents itself as respectable because stochastic is oversold and Fibonacci points to value, yet oversold in a bearish MACD context means weakness has more room to run rather than imminent reversal. The macro fit of 57.0 carries real-asset sponsorship (+7) and AI-growth positioning (+5), yet no amount of macro tailwind overcomes the technical exhaustion evident in the two-point-six-week return (down 2.6% in thirteen weeks) and distribution volume signature. This category remains closed until price reclaims 11.60 and MACD begins genuine uptrend confirmation.
Traditional Energy — FCG
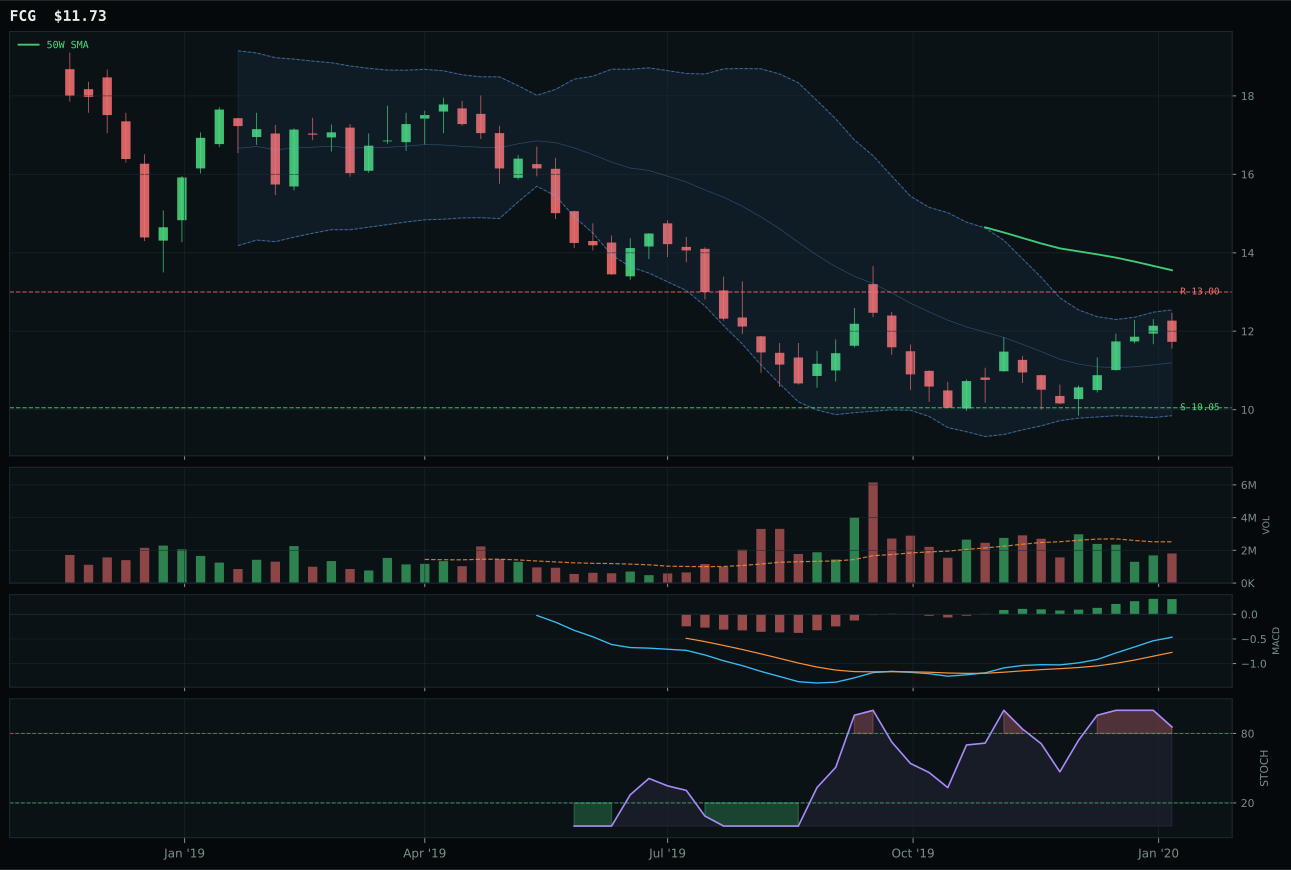
FCG has a neutral structure profile with 0.8% 13-week relative strength versus SPY.
Extension and support failure are the main tactical risks.
Tracked, but not top-2 eligible because: structurally broken.
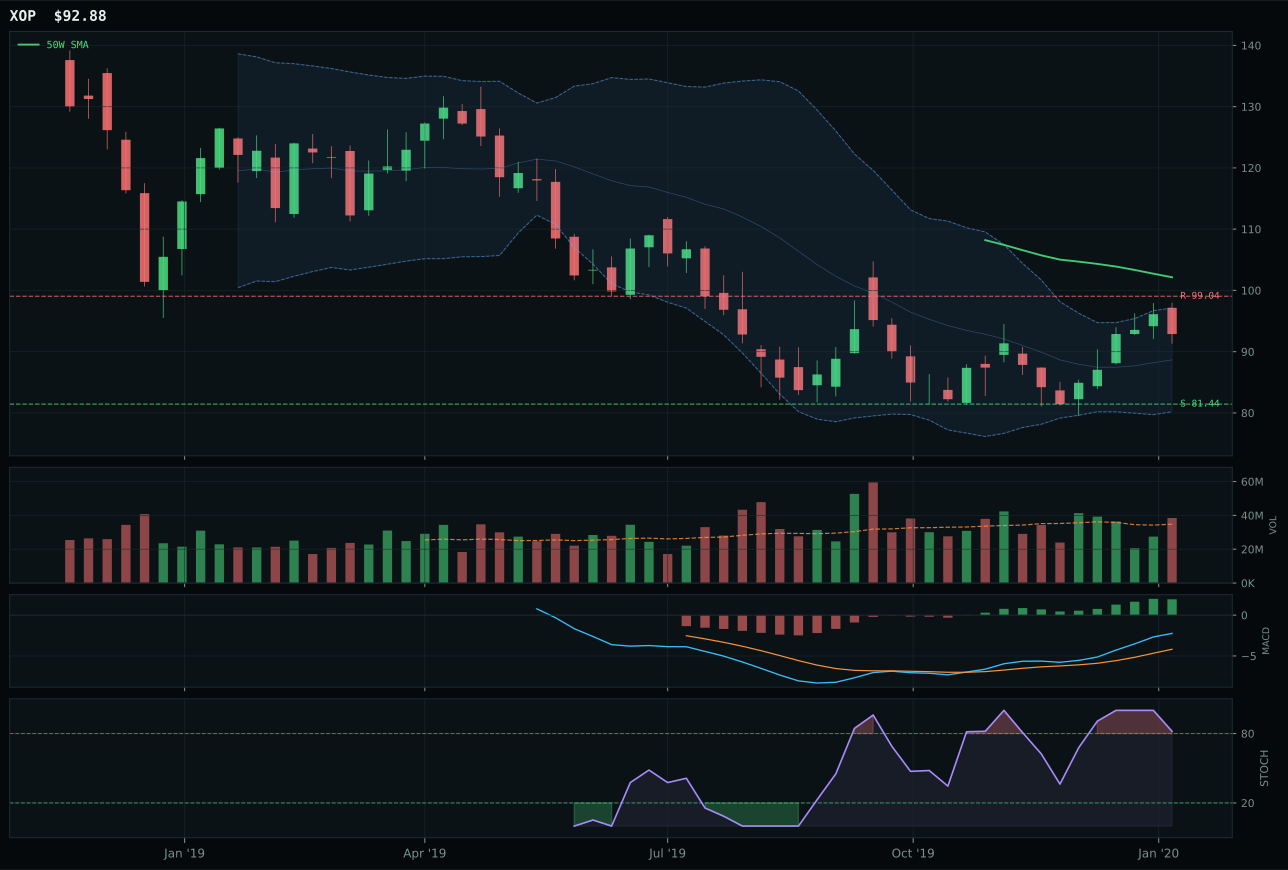
XOP has a neutral structure profile with -0.7% 13-week relative strength versus SPY.
Extension and support failure are the main tactical risks.
Tracked, but not top-2 eligible because: structurally broken.
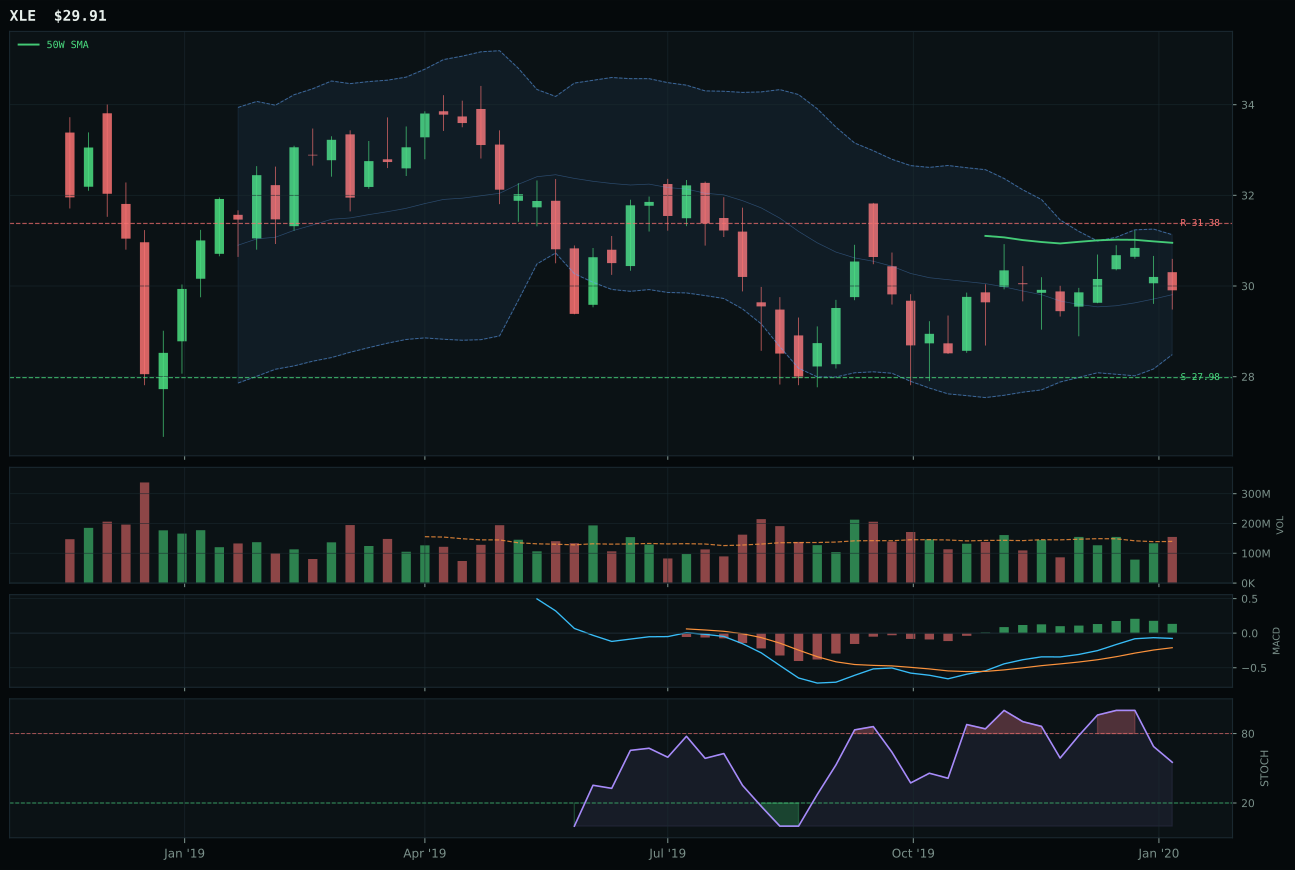
XLE has a neutral structure profile with -6.6% 13-week relative strength versus SPY.
Extension and support failure are the main tactical risks.
Tracked, but not top-2 eligible because: structurally broken.
FCG narrowly edges out XOP as the category representative despite both showing weak technical merit (FCG at 40.8 technical evidence, XOP at 42.0). The 13.5% gap below the 50W and bearish/below-average structure mean neither deserves conviction, yet FCG's 1.5% category-relative strength versus XOP's 0.0% provides a hair-thin margin in a category where absolute confidence is impossible. MACD is bullish and improving in both, but FCG's 10.8% thirteen-week return at least hints that short-term volatility could favor natural gas positioning. XOP's setup is deeper in the retracement zone (far from resistance at 99.04 versus price near 81), yet it shows above-average participation volume that XOP doesn't match. Neither setup qualifies for top-2 allocation; both are structurally broken below their 50W moving averages, making them defensive holds only.
Traditional Energy receives 0% allocation because it ranked below eligibility thresholds at 22.2 with a final composite technical score of 40.8 and explicit structural-break designation. The category failed filters due to price remaining materially below both the fifty and two-hundred-week moving averages, MACD flattening rather than improving at the point of putative reversal, and thin volume participation (0.72x) indicating no institutional stepping in during the repair zone. The macro fit of 50.0 is neutral; no descriptor tailwind supports energy specifically, and the risk-appetite positioning carries a minus-seven penalty that undermines any argument for defensive value. This allocation would activate only if FCG broke back above 13.00 on volume confirmation and reclaimed its fifty-week moving average; until then, the slot remains closed and the capital is deployed to categories with both technical merit and macro tailwind.