
2020-01-03
Informational purposes only. The content in this report, including allocations, analysis, and commentary, is provided solely for informational and educational purposes. It does not constitute financial advice, investment advice, trading advice, or any other type of advice. Past performance does not guarantee future results. Always conduct your own research and consult a qualified financial professional before making investment decisions.
Some tracked tickers were excluded due to missing live weekly price data: SGOV: Historical cache SGOV has only 0 usable weekly bars; URNM: Historical cache URNM has only 5 usable weekly bars
Weekly Allocation
| Ticker | Category | Weight | Role |
|---|---|---|---|
| ILF | Emerging Markets | 20% | Top-2 (20%) |
| XLK | Technology | 20% | Top-2 (20%) |
| SMH | AI | 10% | Tier-2 (10%) |
| XAR | Defense & Aerospace | 10% | Tier-2 (10%) |
| GLD | Precious Metals | 10% | Tier-2 (10%) |
| IGF | Utilities & Infrastructure | 10% | Tier-2 (10%) |
| MOO | Agriculture & Livestock | 10% | Tier-2 (10%) |
| PICK | Industrial Metals | 10% | Tier-2 (10%) |
Trade Instructions — Monday Open
Sell the tranche from 5 weeks ago (completing its 4-week hold). Buy the new tranche. Instructions show net portfolio changes — same-asset positions cancel, weight changes show the delta.
| Action | Ticker | Instruction |
|---|---|---|
| BUY | ILF | Buy ILF — 5.00% of freed cash (adds 5.00% to portfolio) |
| BUY | XLK | Buy XLK — 5.00% of freed cash (adds 5.00% to portfolio) |
| BUY | SMH | Buy SMH — 2.50% of freed cash (adds 2.50% to portfolio) |
| BUY | XAR | Buy XAR — 2.50% of freed cash (adds 2.50% to portfolio) |
| BUY | GLD | Buy GLD — 2.50% of freed cash (adds 2.50% to portfolio) |
| BUY | IGF | Buy IGF — 2.50% of freed cash (adds 2.50% to portfolio) |
| BUY | MOO | Buy MOO — 2.50% of freed cash (adds 2.50% to portfolio) |
| BUY | PICK | Buy PICK — 2.50% of freed cash (adds 2.50% to portfolio) |
Current Portfolio After Trade
Combined holdings across all 4 active tranches. Each tranche is 25% of the portfolio.
| Ticker | % of Portfolio | Weight Bar |
|---|---|---|
| ILF | 5.00% | |
| XLK | 5.00% | |
| SMH | 2.50% | |
| XAR | 2.50% | |
| GLD | 2.50% | |
| IGF | 2.50% | |
| MOO | 2.50% | |
| PICK | 2.50% |
Macro Regime — Transition / Mixed
Macro Evidence Charts
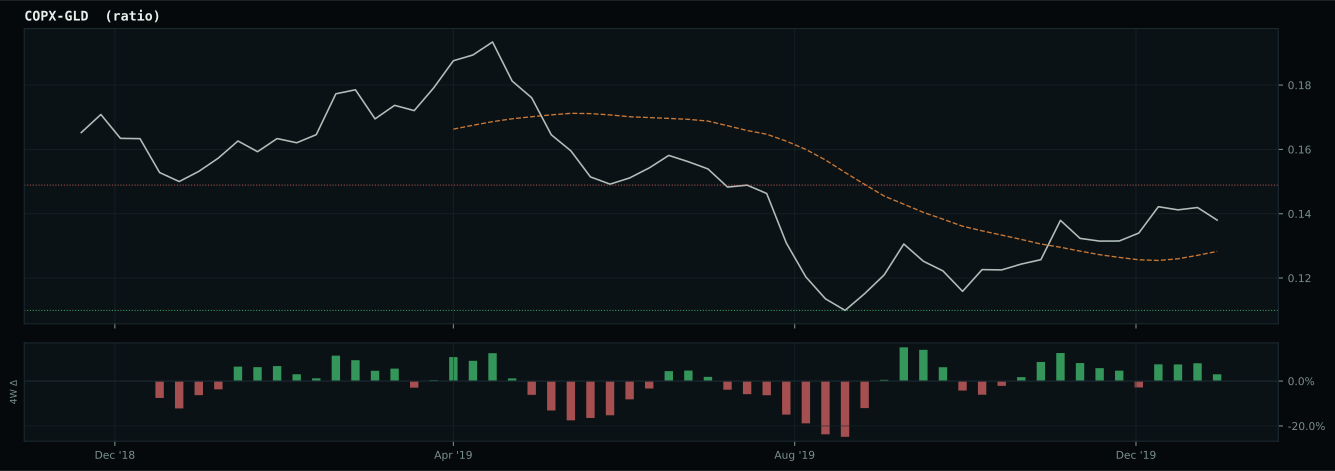
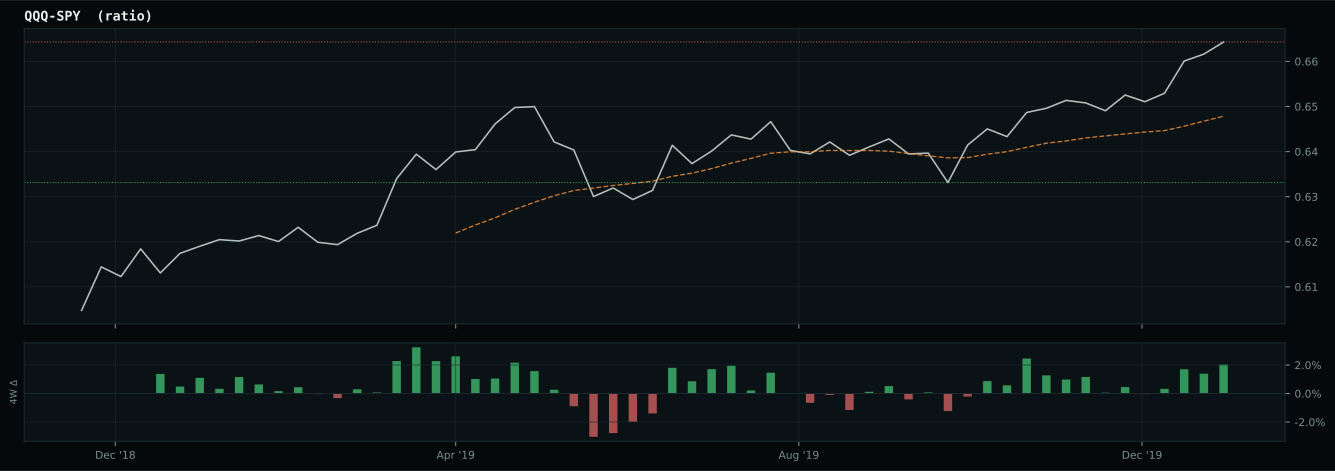
Market-implied signals behind the macro regime scores. Each ratio compares two assets; the direction and slope of the ratio is what the macro engine reads.
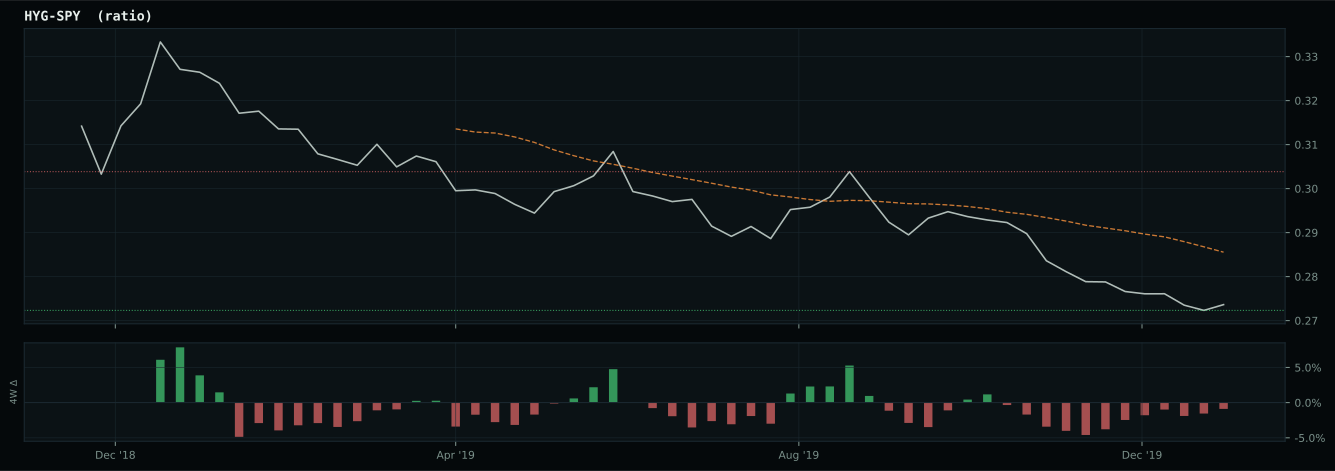
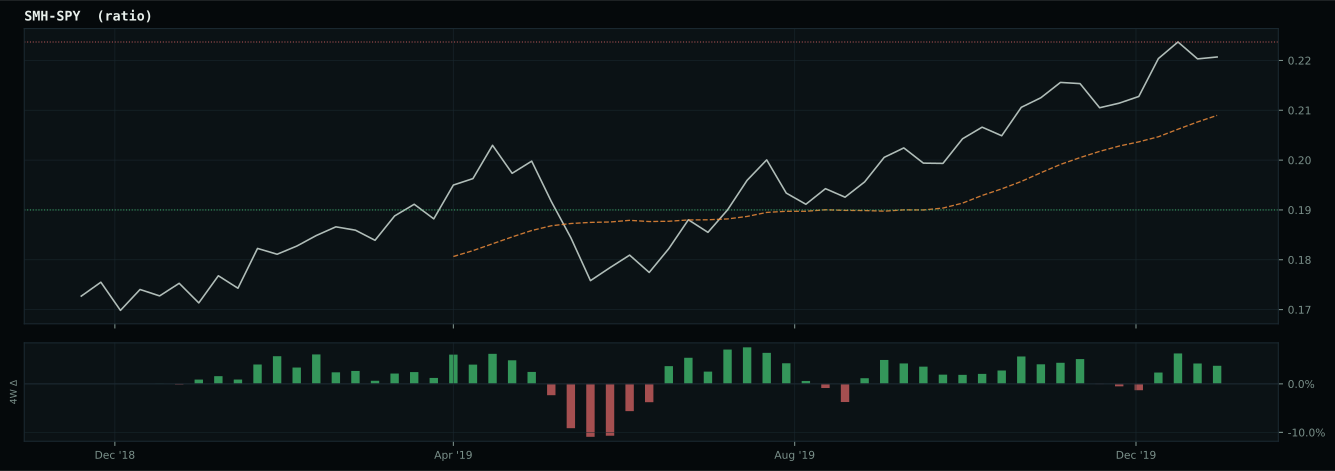
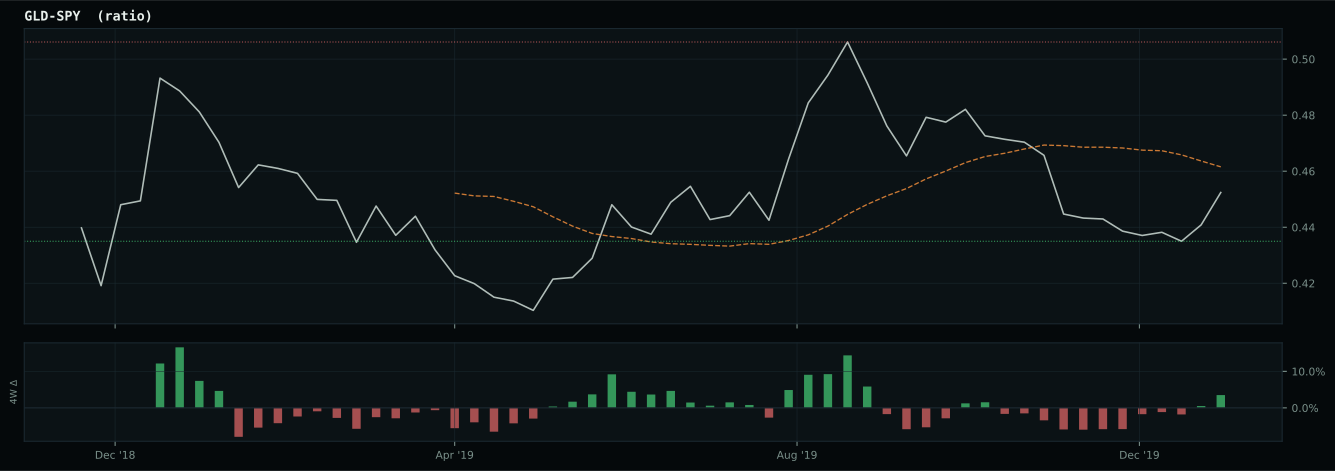
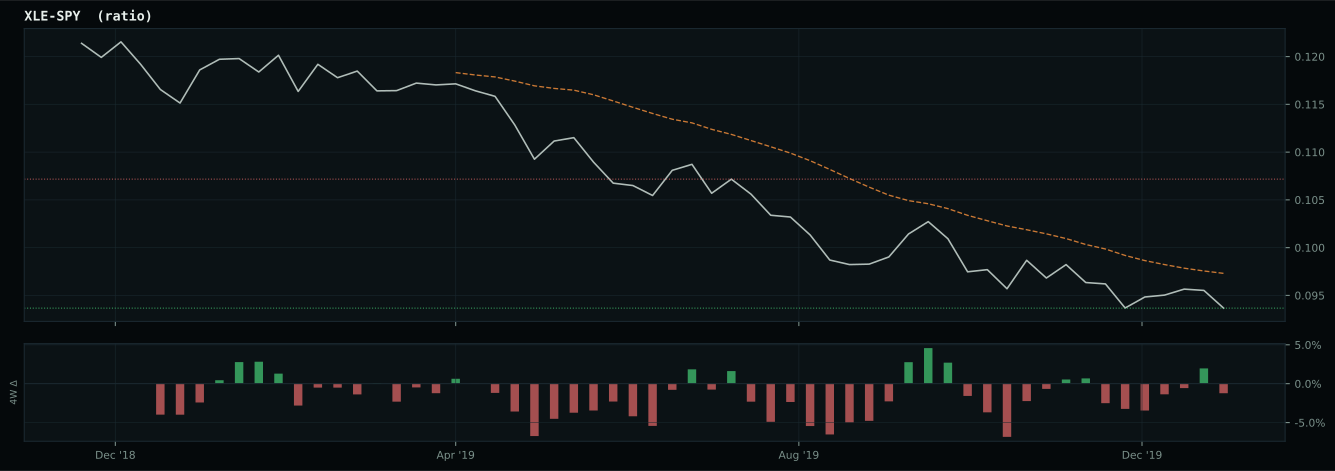
Crypto Regime — NoCrypto
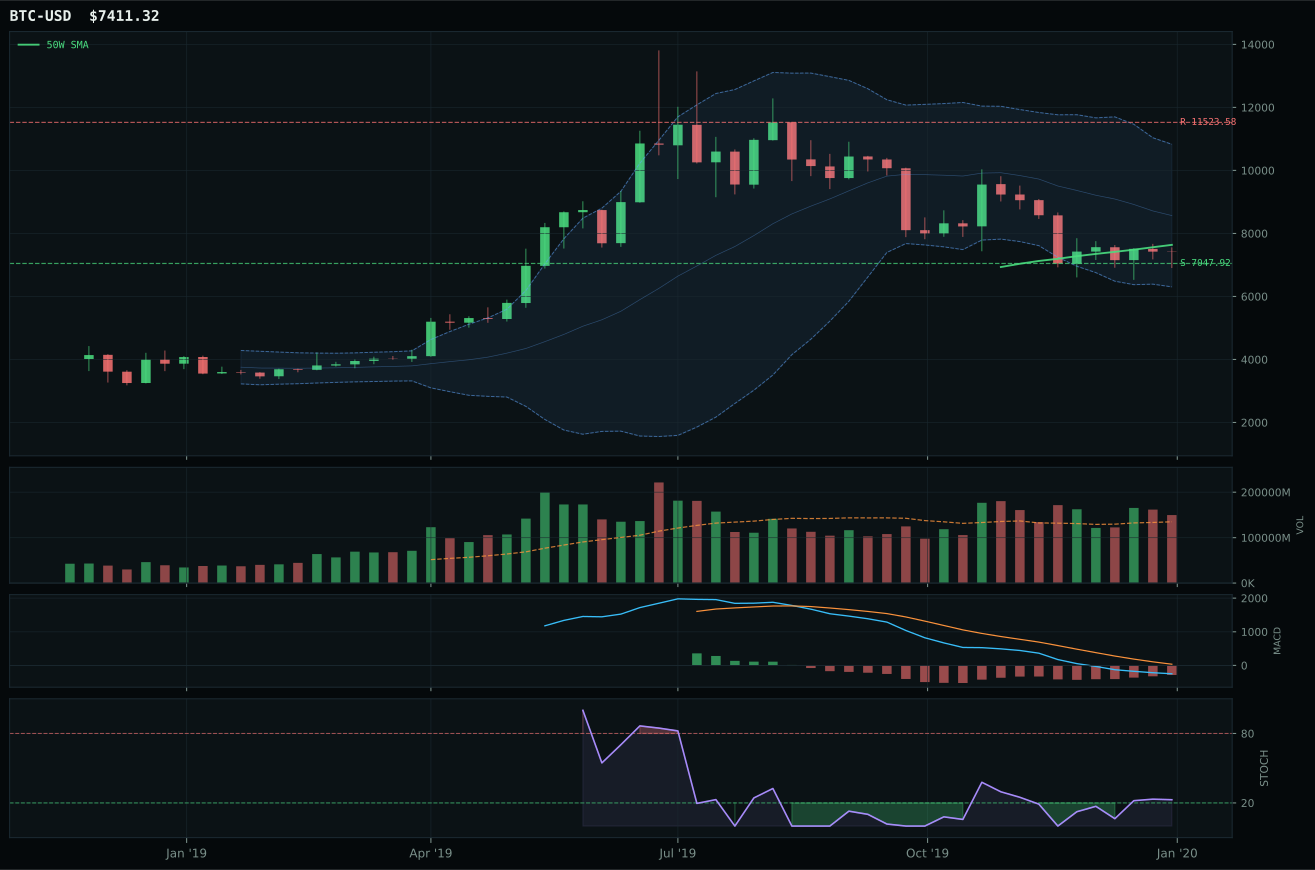
post-touch structure is too wide to count as a range; max/min close ratio is 3.54
TrendBTC not confirmed
one or more available conditions failed

Category Rankings
| Rank | Category | Winner | Score | Alloc | 4W Ret | Peers (4W) |
|---|---|---|---|---|---|---|
| 1 | Emerging Markets | ILF | 63.2 | 20% | -7.05% | INDA -1.3% · IEMG -5.0% |
| 2 | Technology | XLK | 62.2 | 20% | +4.40% | IGV +6.6% · CIBR +2.3% |
| 3 | AI | SMH | 51.6 | 10% | -1.67% | BOTZ -1.7% · AIQ +3.4% |
| 4 | Defense & Aerospace | XAR | 48.3 | 10% | -1.16% | ITA -1.3% · ROKT -2.2% |
| 5 | Precious Metals | GLD | 47.7 | 10% | +0.15% | SLV -3.3% · GDX -3.2% |
| 6 | Utilities & Infrastructure | IGF | 45.9 | 10% | +2.53% | XLU +8.2% · PAVE -2.9% |
| 7 | Agriculture & Livestock | MOO | 44.0 | 10% | -4.41% | WEAT -2.4% · VEGI -5.1% |
| 8 | Industrial Metals | PICK | 41.0 | 10% | -8.56% | COPX -13.1% · REMX -11.9% |
| 9 | Traditional Energy | FCG | 36.5 | 0% | -22.33% | XOP -21.1% · XLE -11.9% |
| 10 | Nuclear Energy | NLR | 34.4 | 0% | +5.05% | URA -5.9% |
Emerging Markets — ILF
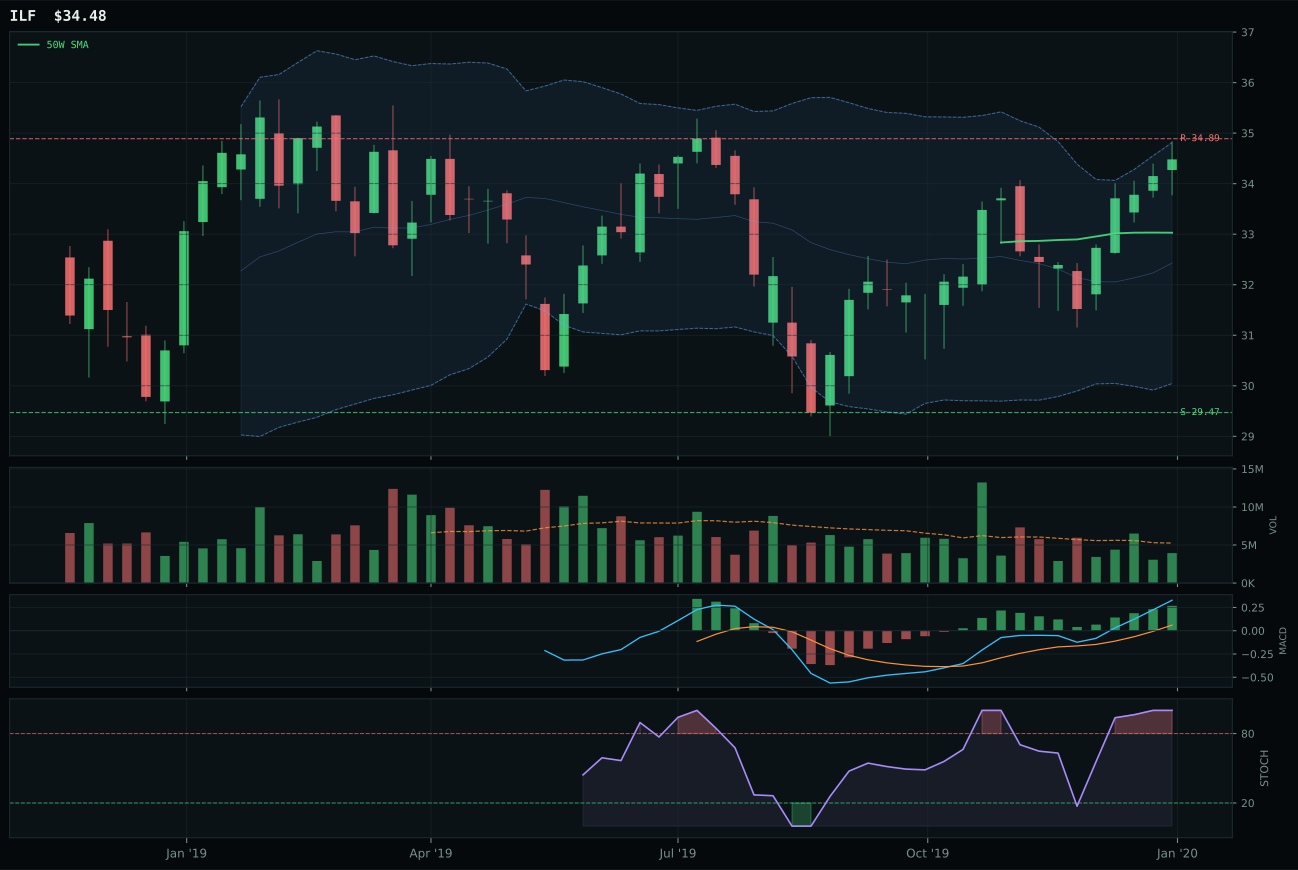
ILF has a neutral structure profile with -1.0% 13-week relative strength versus SPY.
A failed hold above support would weaken the setup.
Actionable but governed by invalidation levels.
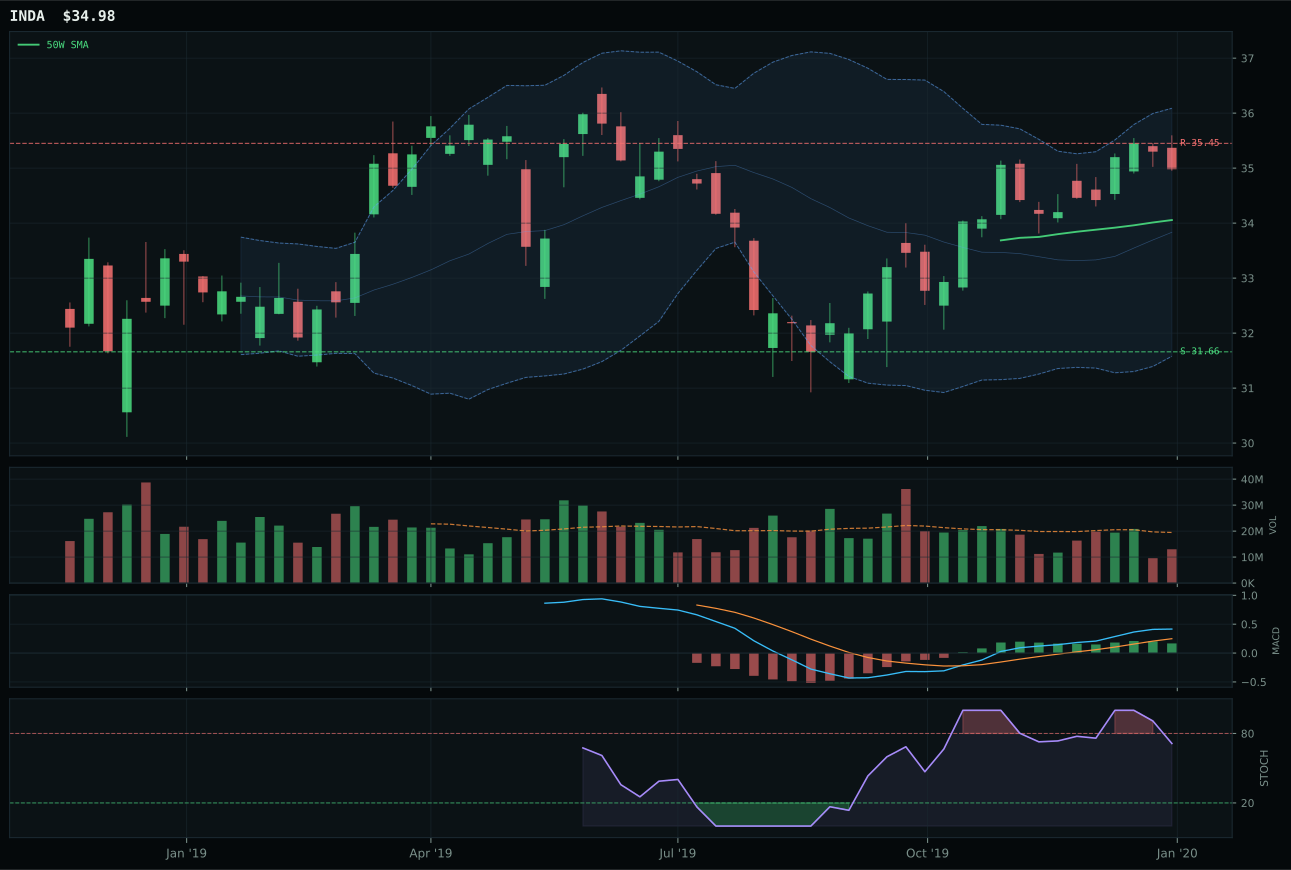
INDA has a compression near 50W profile with -2.8% 13-week relative strength versus SPY.
A failed hold above support would weaken the setup.
Actionable but governed by invalidation levels.
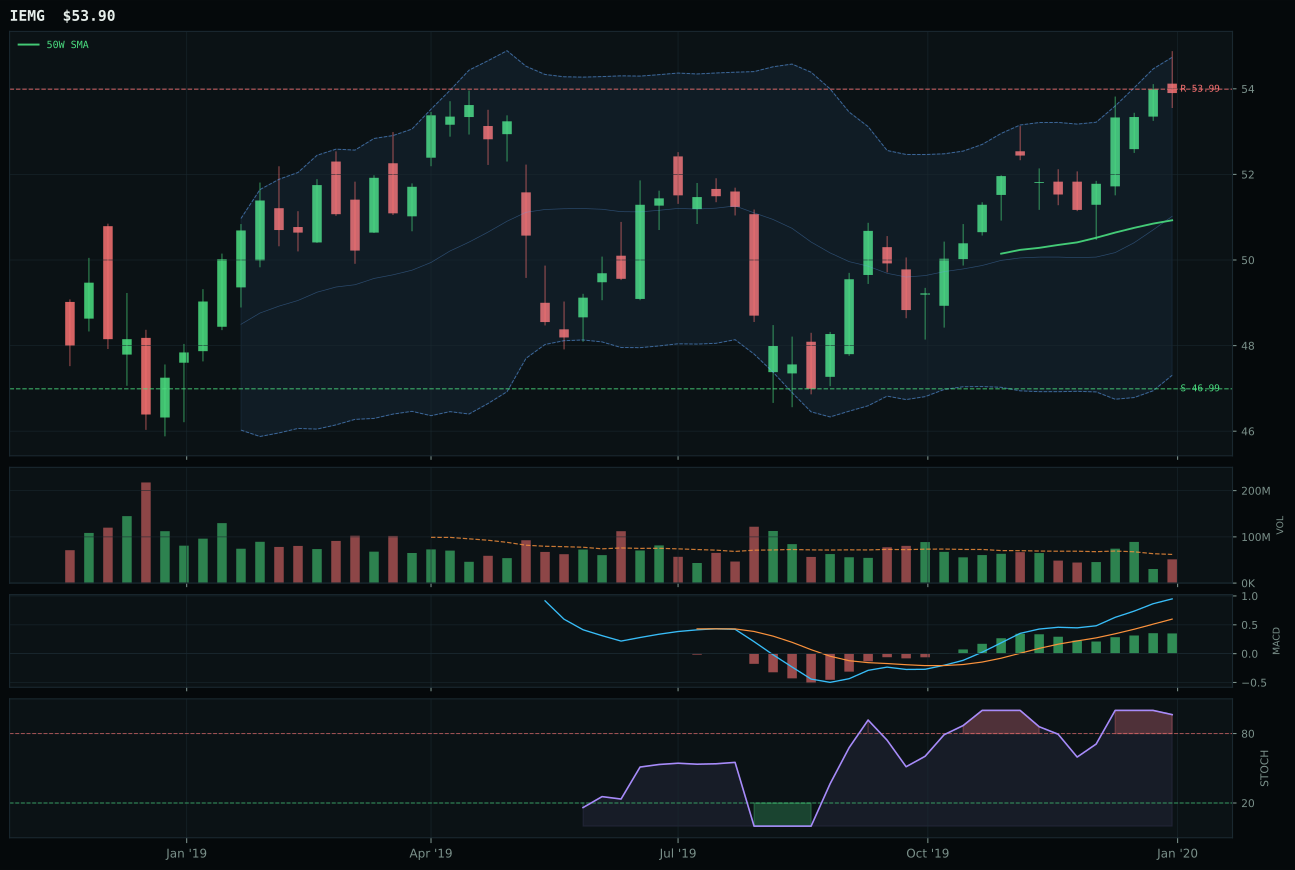
IEMG has a neutral structure profile with -0.0% 13-week relative strength versus SPY.
A failed hold above support would weaken the setup.
Actionable but governed by invalidation levels.
ILF wins the category (score gap 5.7 points) because its 88.5/100 trend score and 90.0/100 timing score position Latin America at the sweet spot of near-term entry risk: price sits 4.4% above the 50W with bullish improving MACD and overbought stochastic momentum, but the structure (75.4/100) remains cleaner than INDA's compression setup, which faces tighter timing windows. ILF's 8.6% thirteen-week return and 0.0% category-relative strength tie INDA's leadership numerically, but the technical reasoning for ILF's win centers on structure quality and timing: INDA trades at a compression point with 100.0/100 timing (tighter decision zone), while ILF offers 90.0/100 timing with more breathing room. Volume at 0.75x the 20W (thin) matches INDA's participation, eliminating any liquidity advantage. IEMG, the third basket member, posts 100.0/100 trend but only 57.0/100 timing, leaving the category leadership to the Latin America/India dichotomy. ILF's win reflects that emerging markets leadership lies in Latin America's commodity beta rather than India's quality-growth narrative in the current regime.
Emerging Markets category earned its 20% top-2 allocation slot at a 63.2 final score because the category ranks second overall and combines strong technicals with exceptional macro fit of 62.0/100. ILF's 67.1/100 technical evidence baseline provides trend confidence (88.5/100), and the active EM liquidity support descriptor (+14) paired with risk appetite positive (+8) creates a macro tailwind that directly benefits emerging market equities. The Transition/Mixed regime transitions toward risk-on, and EM markets function as the optimal leveraged expression of that regime shift. ILF's 4.4% proximity to the 50W offers intermediate-term holding potential: price extended modestly but not vertically, MACD confirmation remains intact, and category-relative strength ties for leadership. The 20% allocation reflects belief that emerging markets transition next as risk appetite fully rotates from defensive (Technology, which also earns 20%) into cyclical; Latin America's commodity and value positioning specifically tailors to inflation and real-asset sponsorship themes. Risk management: the allocation assumes ILF maintains support above 29.47; breach of that level on volume would trigger reduction to 15% or lower as trend evidence deteriorates.
Technology — XLK
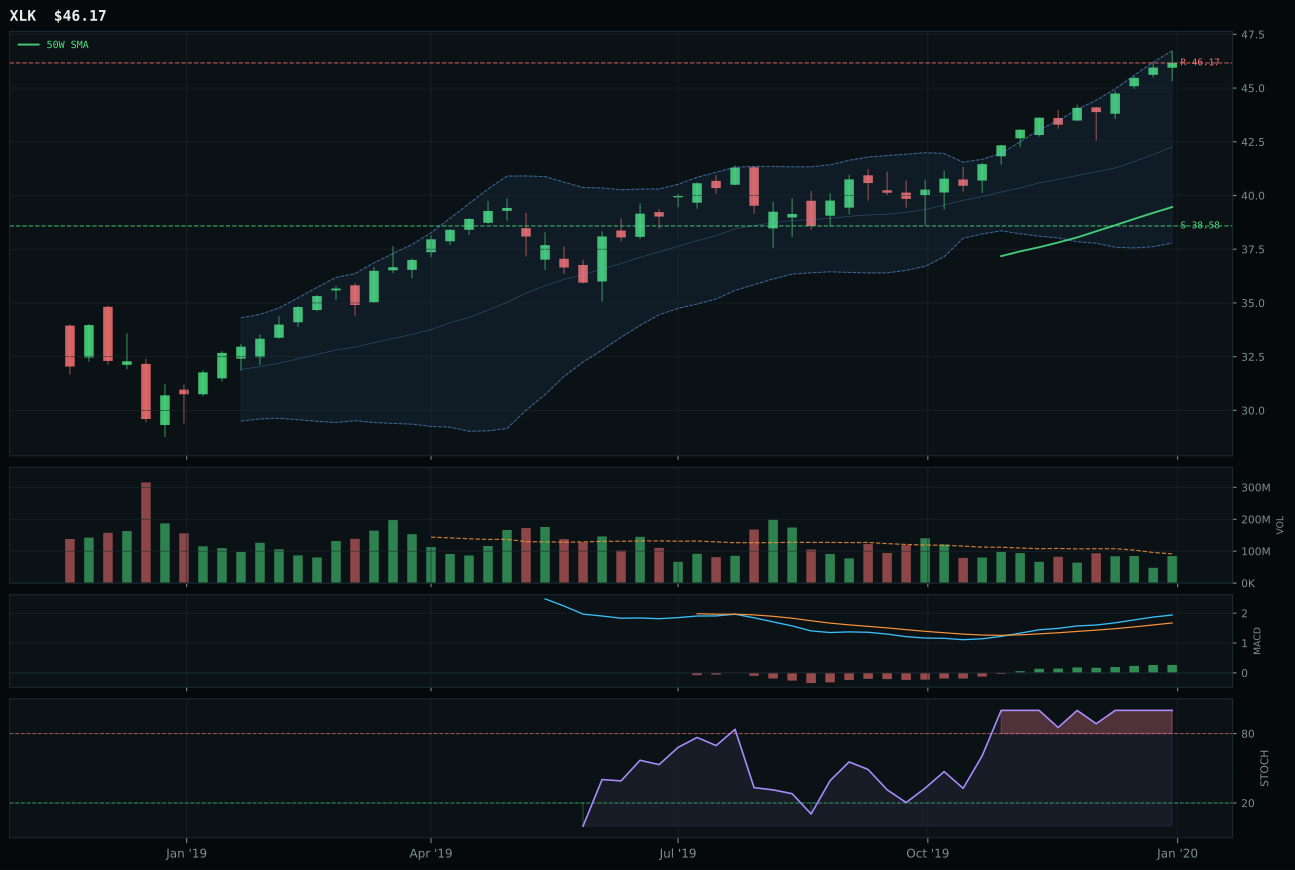
XLK has a vertical extension profile with 5.1% 13-week relative strength versus SPY.
A failed hold above support would weaken the setup.
Actionable but governed by invalidation levels.
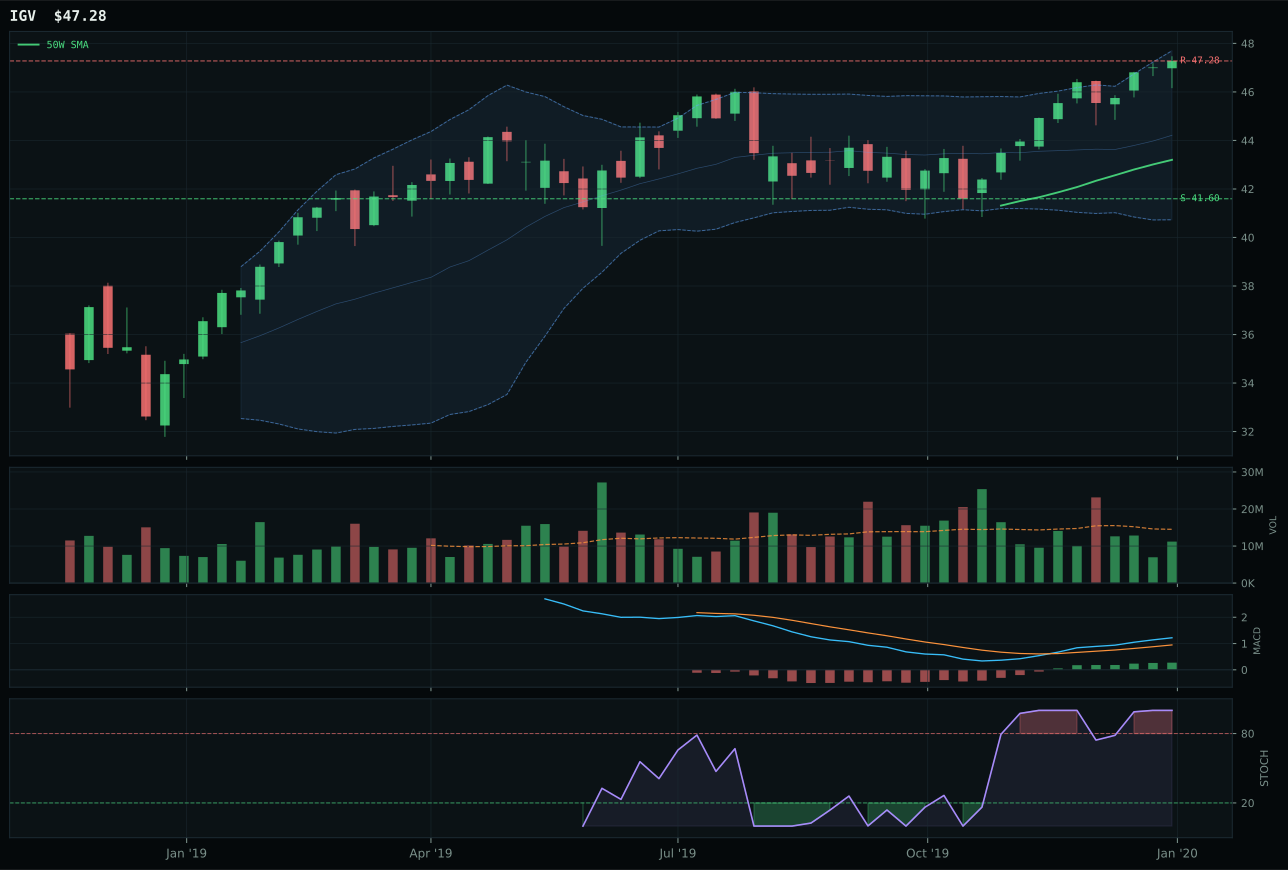
IGV has a neutral structure profile with 1.0% 13-week relative strength versus SPY.
A failed hold above support would weaken the setup.
Actionable but governed by invalidation levels.
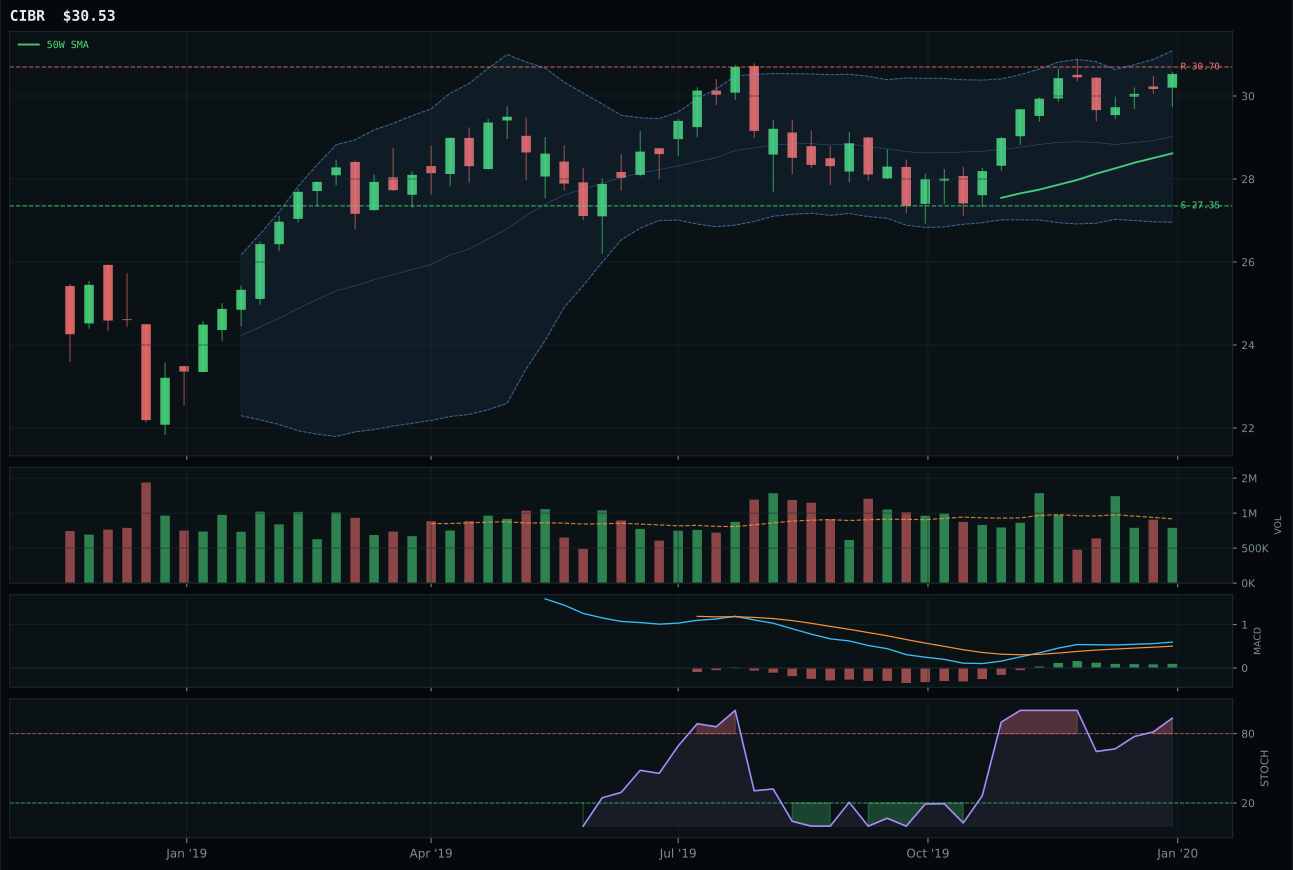
CIBR has a neutral structure profile with -0.5% 13-week relative strength versus SPY.
A failed hold above support would weaken the setup.
Actionable but governed by invalidation levels.
XLK wins the category because it commands a 5.1% relative strength advantage over SPY paired with 4.1% outperformance versus its category median—a meaningful gap that indicates genuine institutional sponsorship rather than mechanical mean reversion. The 14.6% thirteen-week return sits atop a 100/100 trend score driven by price above both the 50W and 200W with a positive 0.7% slope, giving the setup authentic uptrend confirmation. IGV, the runner-up, delivered higher absolute trend quality (79.8 vs 72.0 on the composite) but failed the category leadership test, posting only 1.0% RS versus SPY and zero relative strength within its own three-ETF basket. The critical difference: XLK's vertical extension at 17% above the 50W is being accumulated at neutral volume rather than rejected, meaning the momentum hasn't yet faced a genuine supply test. This represents broad profitable technology leadership moving higher on continued risk appetite rather than sector rotation.
Technology earned its 20% top-2 allocation slot because the category's 62.2 final score ranked second among all ten categories, reflecting both strong technicals and macro support. XLK's 99.3/100 momentum confirmation score comes from four-week returns of 5.2%, thirteen-week returns of 14.6%, and improving MACD despite overbought stochastic conditions—a combination that signals persistent accumulation rather than exhaustion. The macro regime of Transition/Mixed benefits risk-appetite plays, and the active AI growth sponsorship descriptor (+9 weight) directly tailors this category's narrative fit to current conditions. Risk/reward presents the only structural tension: the 17% extension above the 50W leaves minimal upside to resistance (44.3/100 r/r score) and forces reliance on continued momentum rather than mean-reversion support. Allocation at 20% reflects confidence in category momentum and macro tailwind, but the tight entry risk means position sizing cannot expand without fresh accumulation evidence at higher prices.
AI — SMH
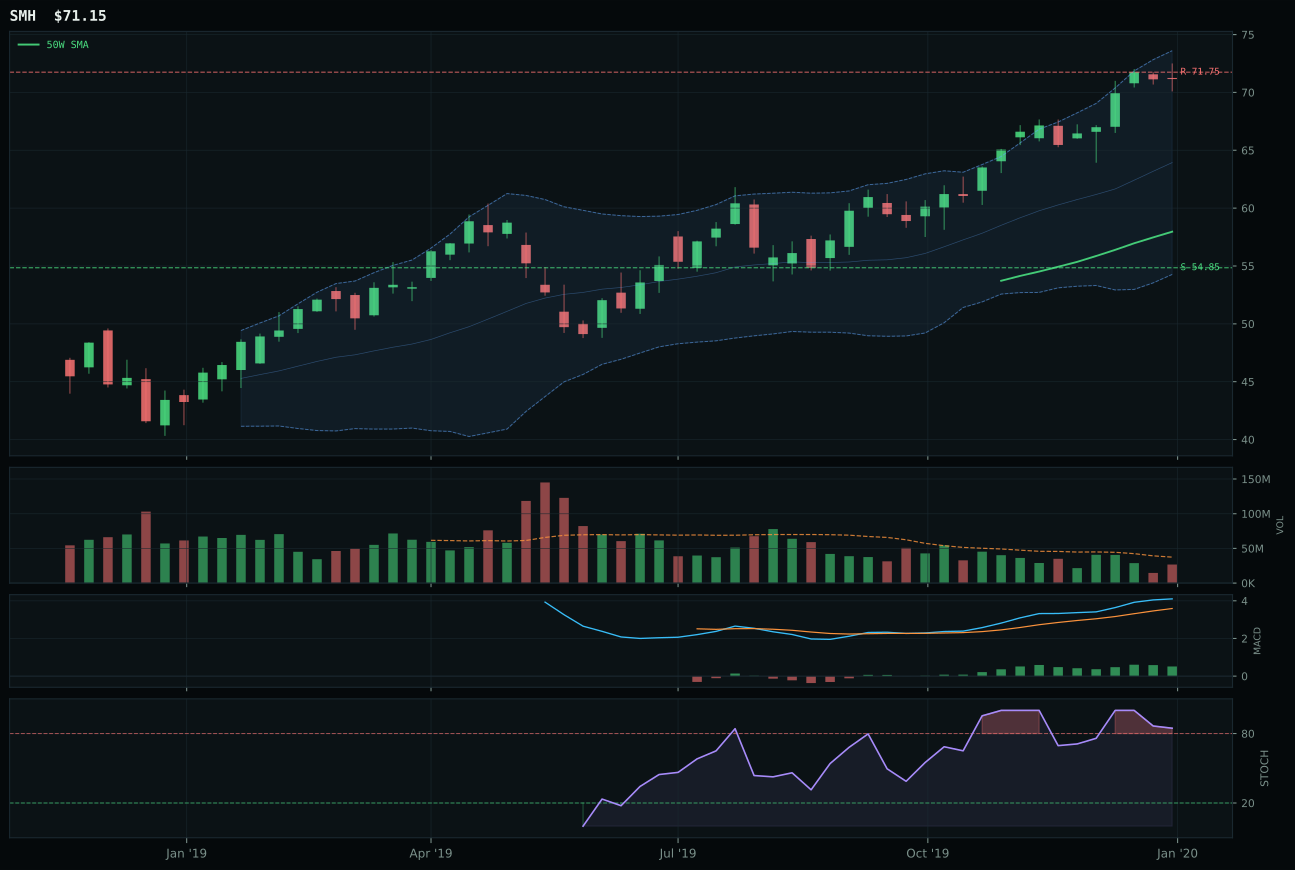
SMH has a vertical extension profile with 8.8% 13-week relative strength versus SPY.
A failed hold above support would weaken the setup.
Actionable but governed by invalidation levels.
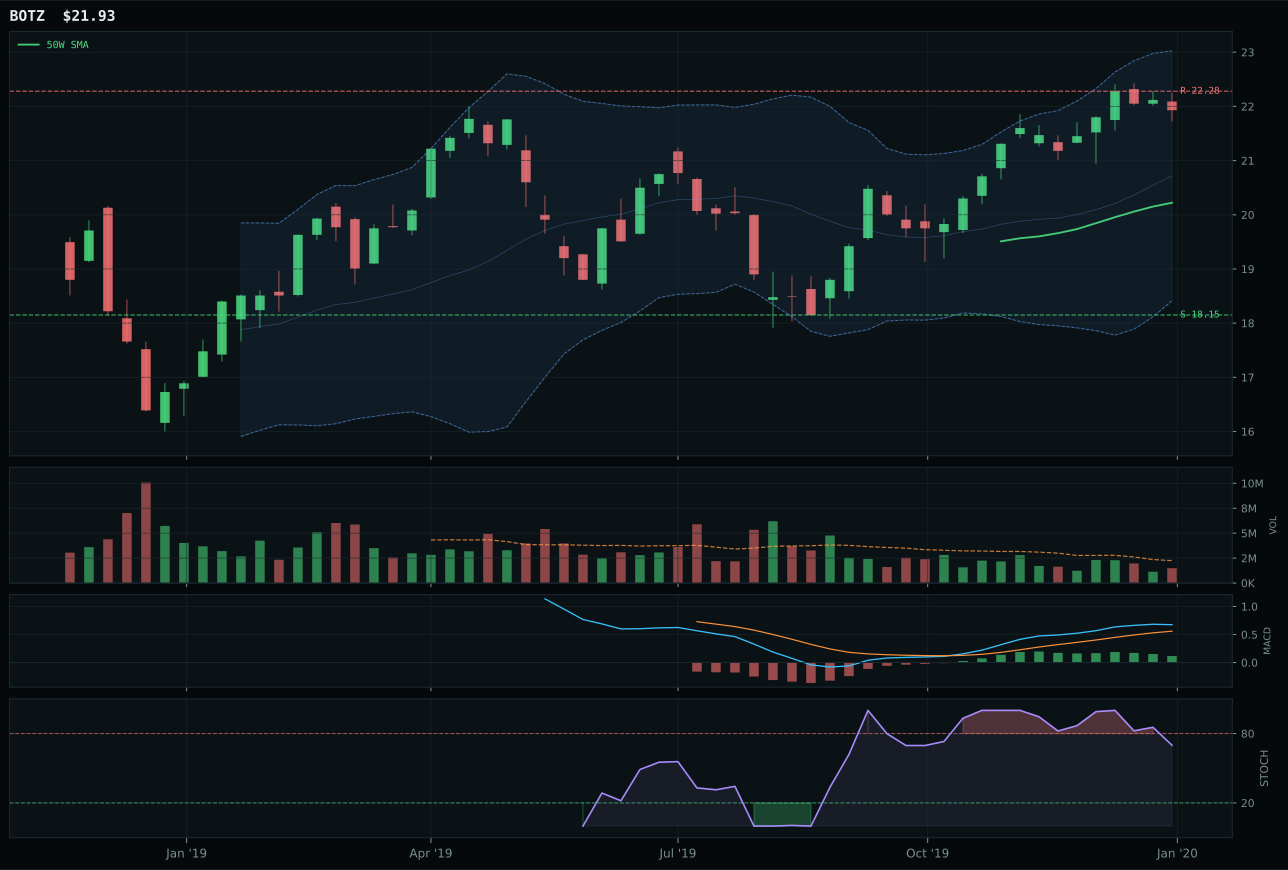
BOTZ has a neutral structure profile with 1.5% 13-week relative strength versus SPY.
A failed hold above support would weaken the setup.
Actionable but governed by invalidation levels.
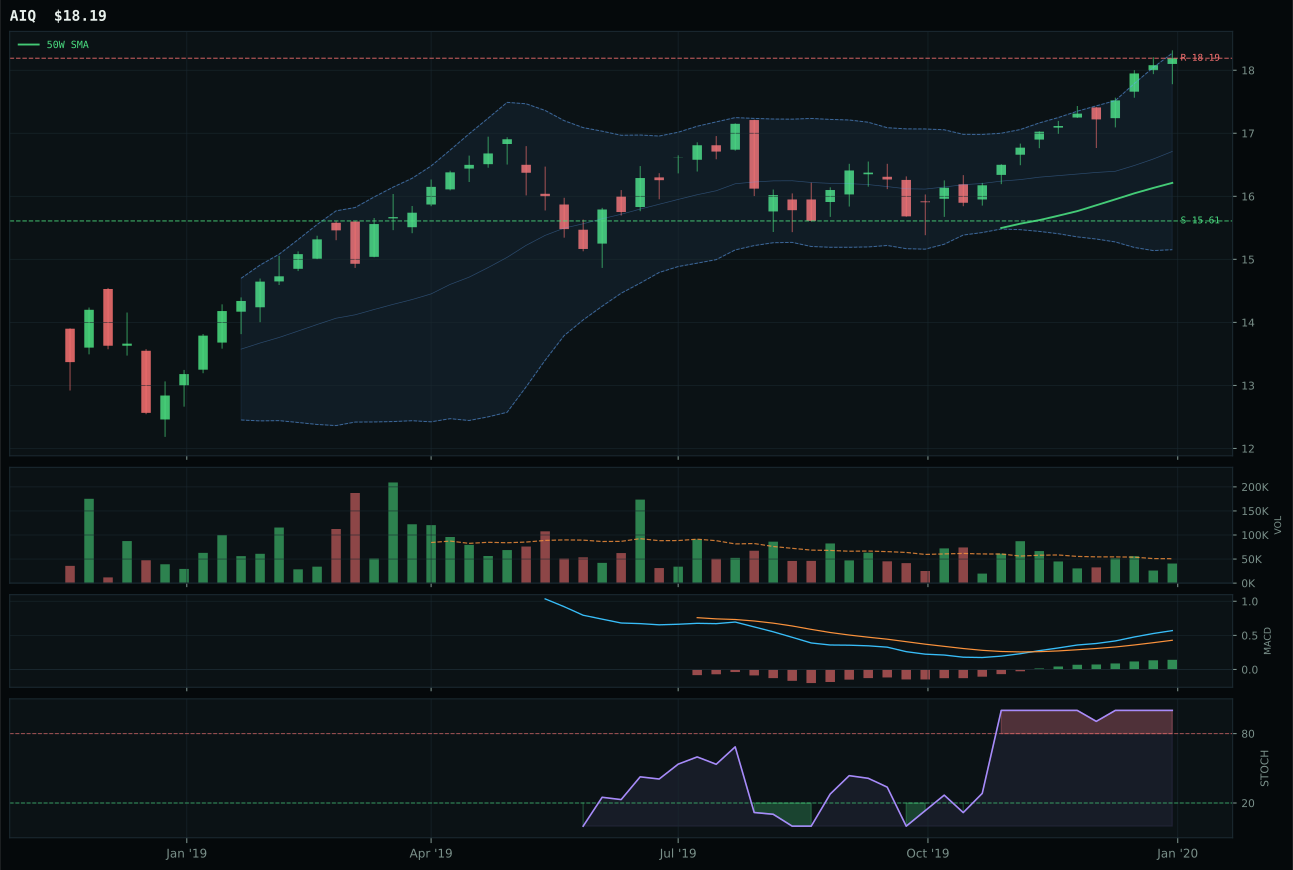
AIQ has a neutral structure profile with 4.8% 13-week relative strength versus SPY.
A failed hold above support would weaken the setup.
Tracked, but not top-2 eligible because: .
SMH wins because semiconductors' 8.8% relative strength versus SPY and 4.0% category-relative strength exceed BOTZ across the board—a performance gap that crowns the AI compute narrative over robotics cyclicality in this regime. The 18.3% thirteen-week return and 28.5% twenty-six-week return anchor trend 100/100, but the real scoring battle occurs in structure and timing: SMH's 77.8/100 structure score reflects clean vertical extension, while BOTZ's 76.2 gets penalized for neutral setup quality and flattening MACD confirmation. At 22.8% above the 50W, SMH sits in a deep Fibonacci extension zone near Fib 0.236 at 65.57, where every new buyer pays increasingly full prices; volume at 0.72x the 20W average (thin) signals that momentum may be rolling over rather than accelerating. Yet the category itself ranks SMH above BOTZ because category-relative strength carries more weight than absolute timing pessimism when institutional sponsorship is this clear.
AI category earned 10% allocation despite ranking third among eligible categories (51.6 final score) because the macro fit of 66.0/100 and active AI growth sponsorship descriptor (+14) create an asymmetric opportunity in the Transition/Mixed regime. SMH's technical evidence of 51.6/100 is deliberately weak—the vertical extension, thin volume, and rolling-over stochastic all signal late-stage momentum—but the category-level macro fit of 66.0 reflects that AI infrastructure buildout transcends near-term technicals. This is a hold-not-sell allocation: SMH does not offer the clean risk/reward of a 10% position entered fresh, but exiting AI exposure entirely before the category reprices would risk missing a multi-quarter structural theme. The 10% slot represents conviction that AI sponsorship (66% macro fit, 14-point active descriptor weight) justifies holding the weakest technical setup in the portfolio, conditional on the category maintaining relative momentum within its own three-ETF basket.
Defense & Aerospace — XAR
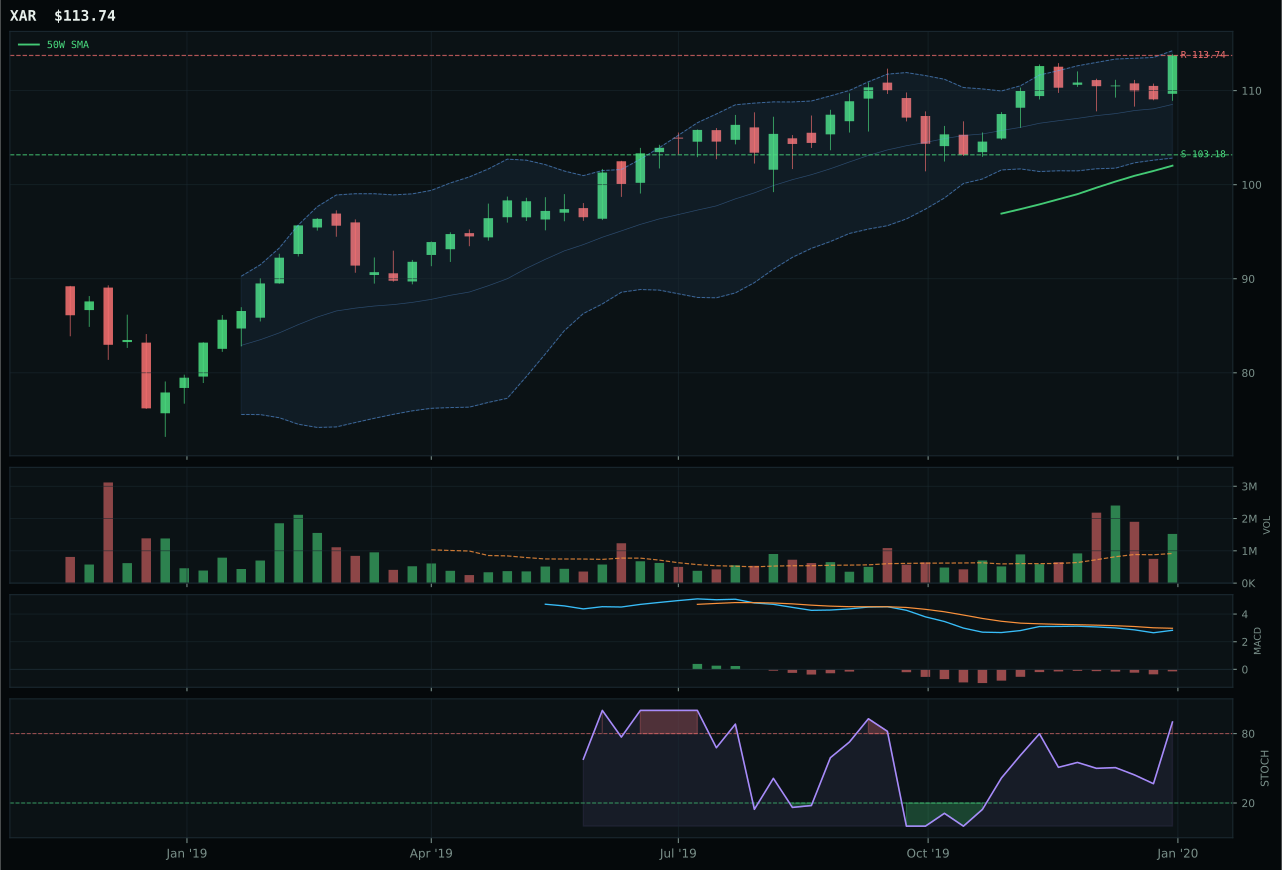
XAR has a neutral structure profile with -0.5% 13-week relative strength versus SPY.
A failed hold above support would weaken the setup.
Actionable but governed by invalidation levels.
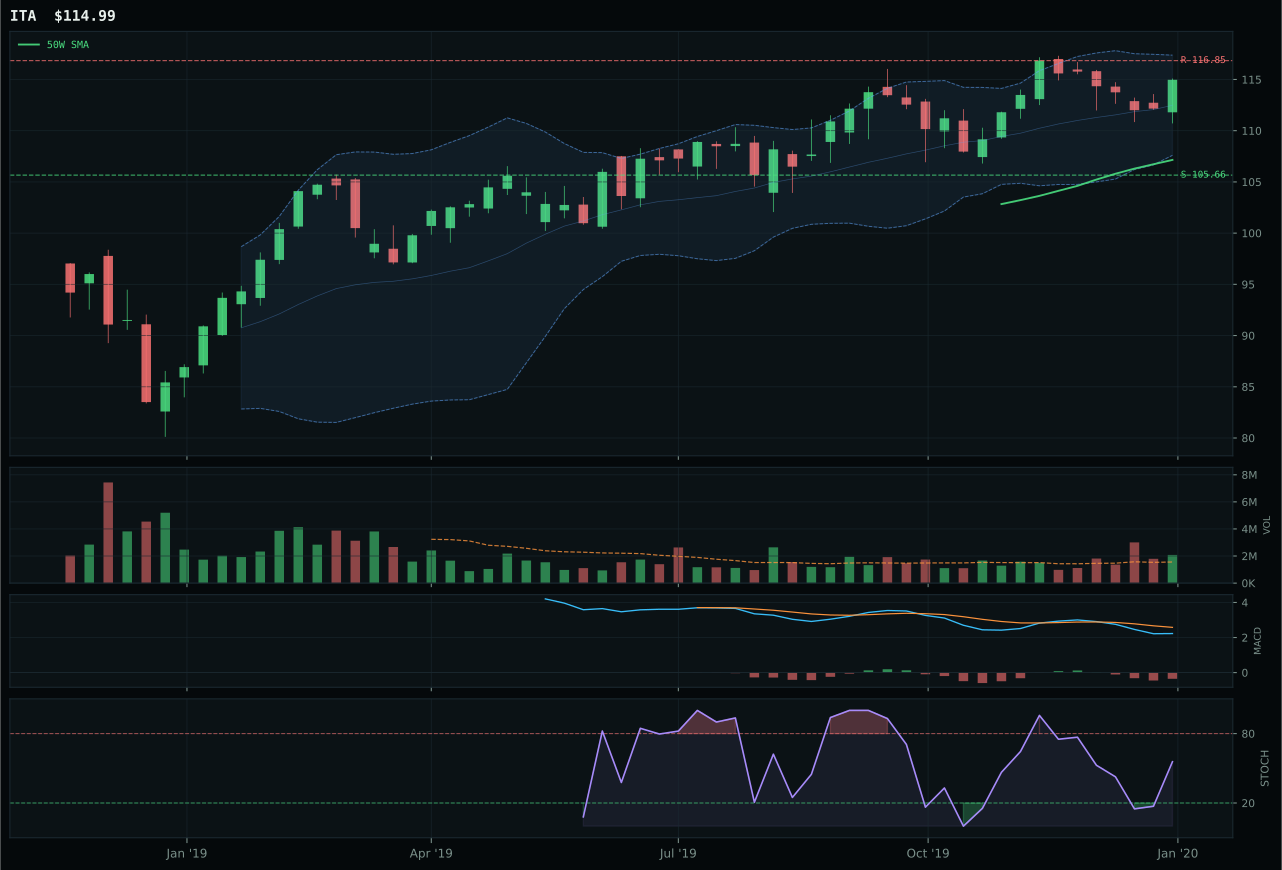
ITA has a neutral structure profile with -5.1% 13-week relative strength versus SPY.
A failed hold above support would weaken the setup.
Actionable but governed by invalidation levels.
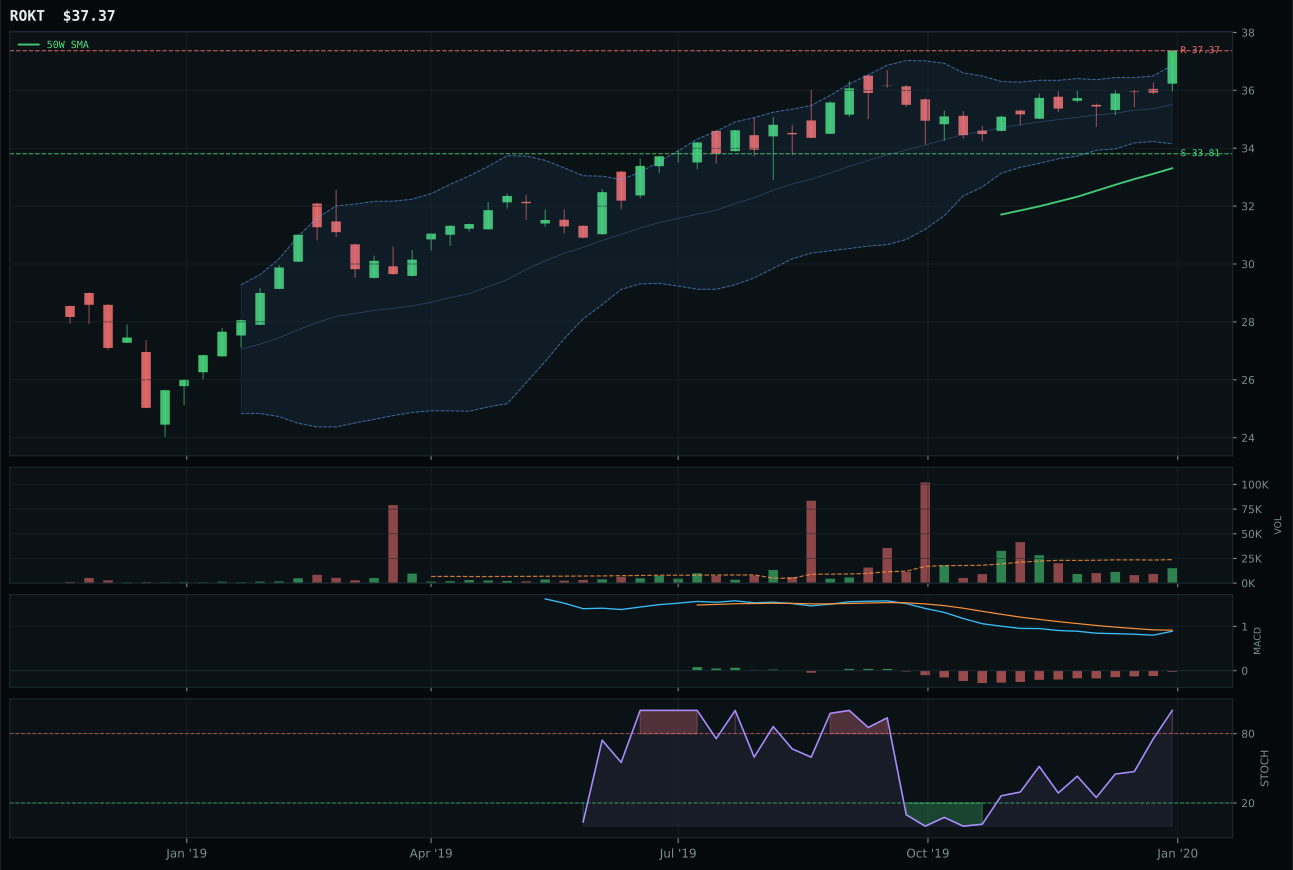
ROKT has a neutral structure profile with -2.6% 13-week relative strength versus SPY.
A failed hold above support would weaken the setup.
Tracked, but not top-2 eligible because: .
XAR wins because its 2.1% category-relative strength and 1.66x above-average volume participation defeat ITA's weak relative standing (-2.5% category RS) and poor risk/reward (40.2 vs 56.1). Both trade in neutral structure at an 11.5% extension above the 50W, but XAR's accumulation-level volume—1.66x the 20W average versus ITA's above-average participation—signals institutional commitment despite bearish/weakening MACD signals. The score gap of 5.7 points appears modest, but it reflects a category-wide structural vulnerability: defense trades below both the 50W slope breakeven and shows no SPY outperformance (XAR -0.5%, ITA -5.1%), meaning the category rises on risk appetite rather than fundamental demand. ITA's timing score of 78/100 exceeds XAR's 54, but timing penalties arise because ITA's rising mid-zone stochastic provides weaker confirmation than XAR's overbought momentum state. The allocator must accept that XAR's 2.1% category lead represents the cleanest available entry, even though the category itself trades in a structural repair zone.
Defense & Aerospace category earned 10% allocation at a 48.3 final score, well below the top-2 threshold, because the macro fit of 55.0/100 and neutral-to-slightly-positive descriptors allow for tactical exposure without conviction. XAR's 65.3/100 technical evidence provides structure and trend confirmation (trend 81.2/100, structure 81.6/100) but falters on momentum (59.6/100) and timing (54.0/100), reflecting a category that has retested higher prices but offers no strong new-buyer momentum. The Transition/Mixed regime adds a modest +3 to category fit, and the active credit stress descriptor (+2) suggests defense may benefit from uncertainty hedging. The honest case: this is a hedge position, not a growth position, justified by balanced macro conditions and the absence of clear category damage rather than by bullish technicals. The 10% allocation would drop to 5% or zero if relative strength deteriorated further or if the category failed to hold support above 103.18; it represents tactical positioning rather than structural conviction.
Precious Metals — GLD
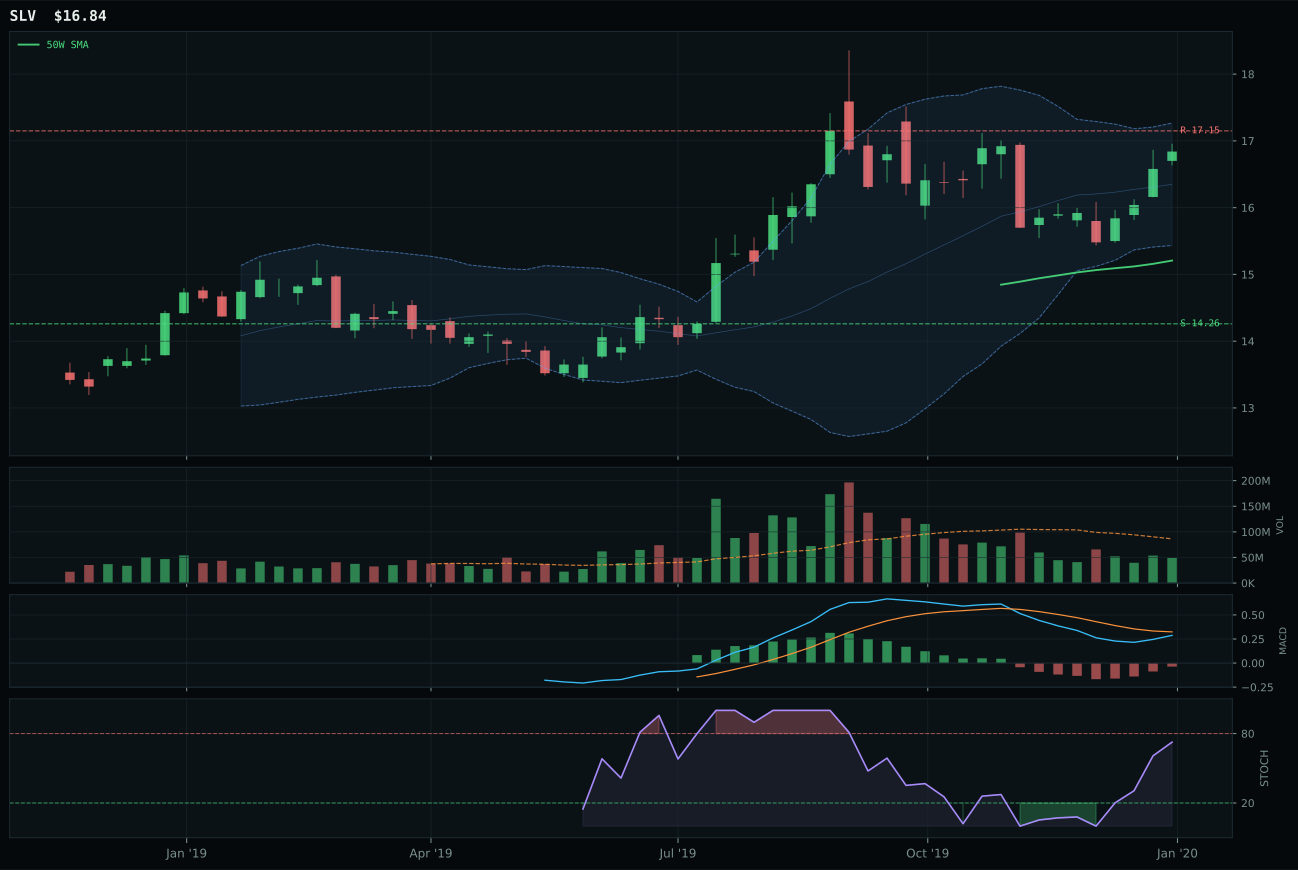
SLV has a neutral structure profile with -6.9% 13-week relative strength versus SPY.
A failed hold above support would weaken the setup.
Actionable but governed by invalidation levels.
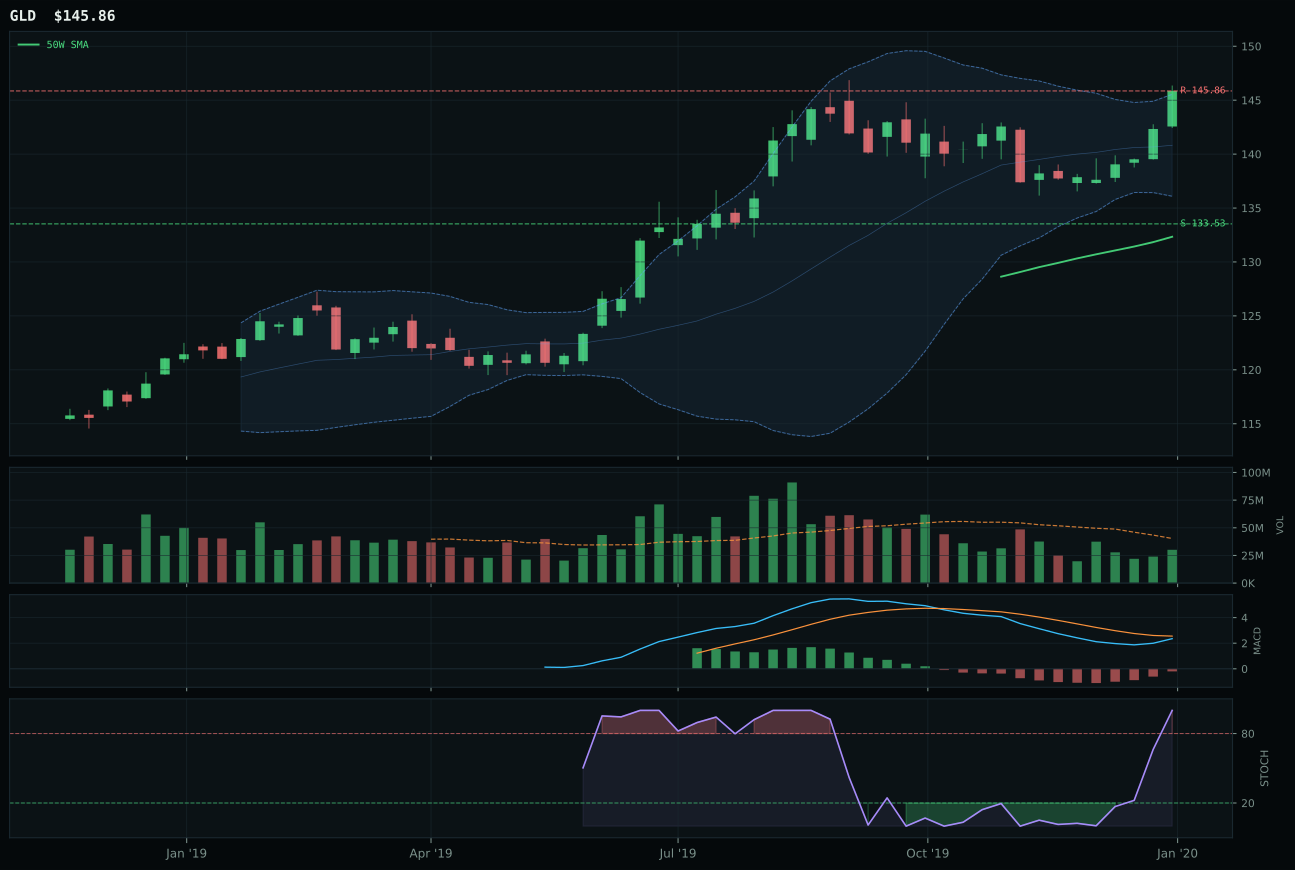
GLD has a neutral structure profile with -6.7% 13-week relative strength versus SPY.
A failed hold above support would weaken the setup.
Actionable but governed by invalidation levels.
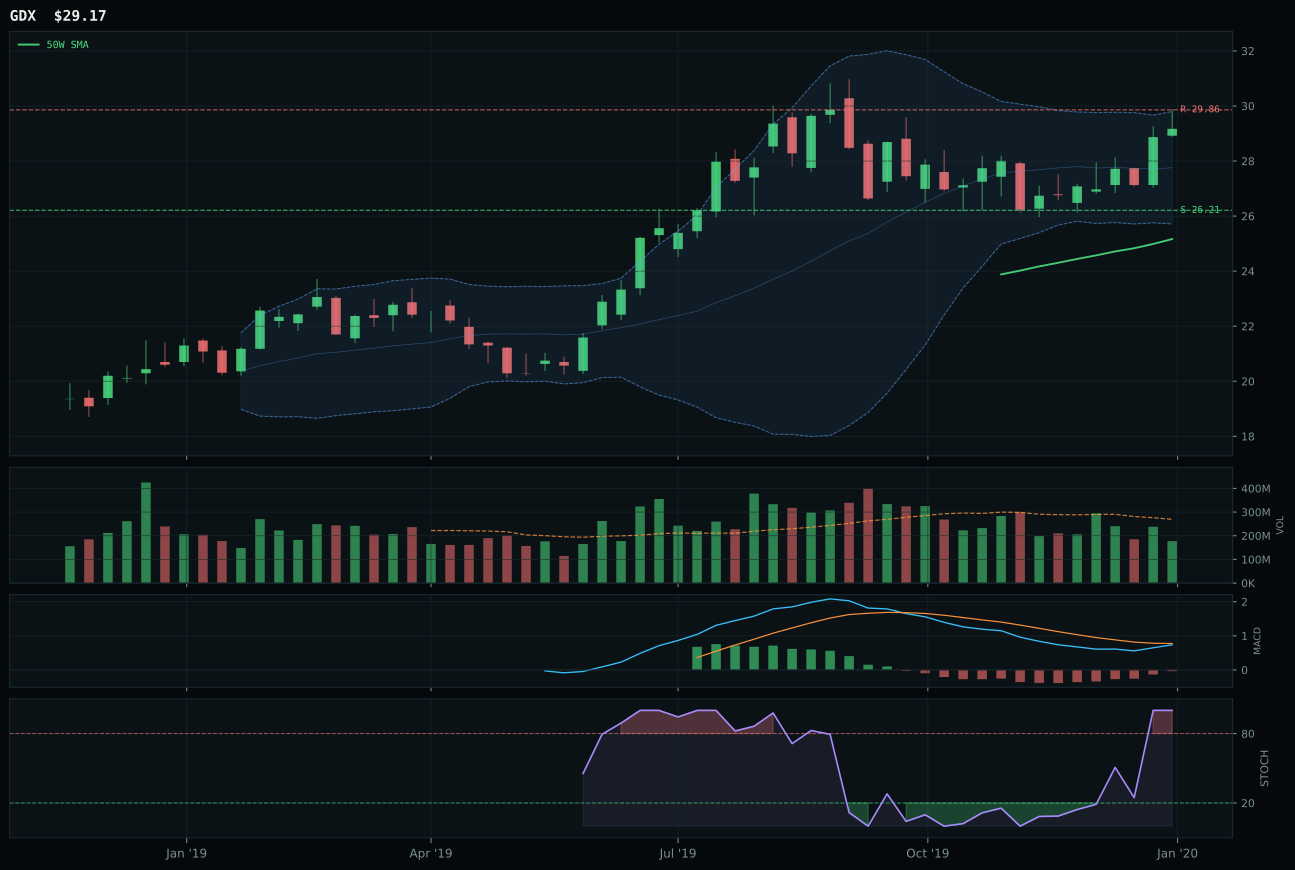
GDX has a vertical extension profile with -4.9% 13-week relative strength versus SPY.
A failed hold above support would weaken the setup.
Actionable but governed by invalidation levels.
GLD wins narrowly over SLV because its 52.6/100 risk/reward score beats SLV's 46.8 on the downside protection metric (9.2% vs support vs 8.2%), and GLD's zero category-relative strength ties SLV's -0.2% despite SLV posting technical evidence of 56.5 versus GLD's 51.0. Both sit in deeply extended zones (GLD 10.2% above 50W, SLV in upper retracement), with bearish/improving MACD and overbought momentum conditions that signal a category caught between fear-driven demand and exhaustion. The decision hinges on risk/reward: GLD's support at 133.53 provides 9.2% downside cushion to the decision zone, while SLV's 14.26 support sits tighter relative to current price, forcing faster decision-making if the bounce fails. SLV's macro fit of 62.0/100 (metals scarcity +7, inflation pressure +5) exceeds GLD's 46.0, but the category reasoning layer weights technical evidence at 62% and macro fit at 38%, meaning SLV's superior narrative cannot overcome GLD's structural setup advantage.
Precious Metals category earned 10% allocation at a 47.7 final score, ranking below the top-2 threshold, because the macro fit of 46.0/100 reflects genuine uncertainty rather than conviction. GLD's 51.0/100 technical evidence and GLD's -6.7% SPY relative strength indicate the category is losing ground to equities in risk-appetite terms, contradicting the narrative that inflation fears should drive metals higher. The active risk appetite positive descriptor (-4 weight) directly penalizes precious metals in the current regime, suggesting that institutional behavior favors growth over hedges. The 10% allocation represents pure optionality: if credit stress intensifies or risk appetite collapses, GLD becomes a portfolio anchor. The setup itself offers no momentum case—both GLD and SLV sit in extended zones with flattening volume, creating a hold-for-macro-deterioration positioning rather than a bullish conviction slot. Allocation would expand to 15% only if SPY relative strength turned negative or if gold broke above the 145.86 resistance on volume, signaling institutional accumulation in self-defense.
Utilities & Infrastructure — IGF
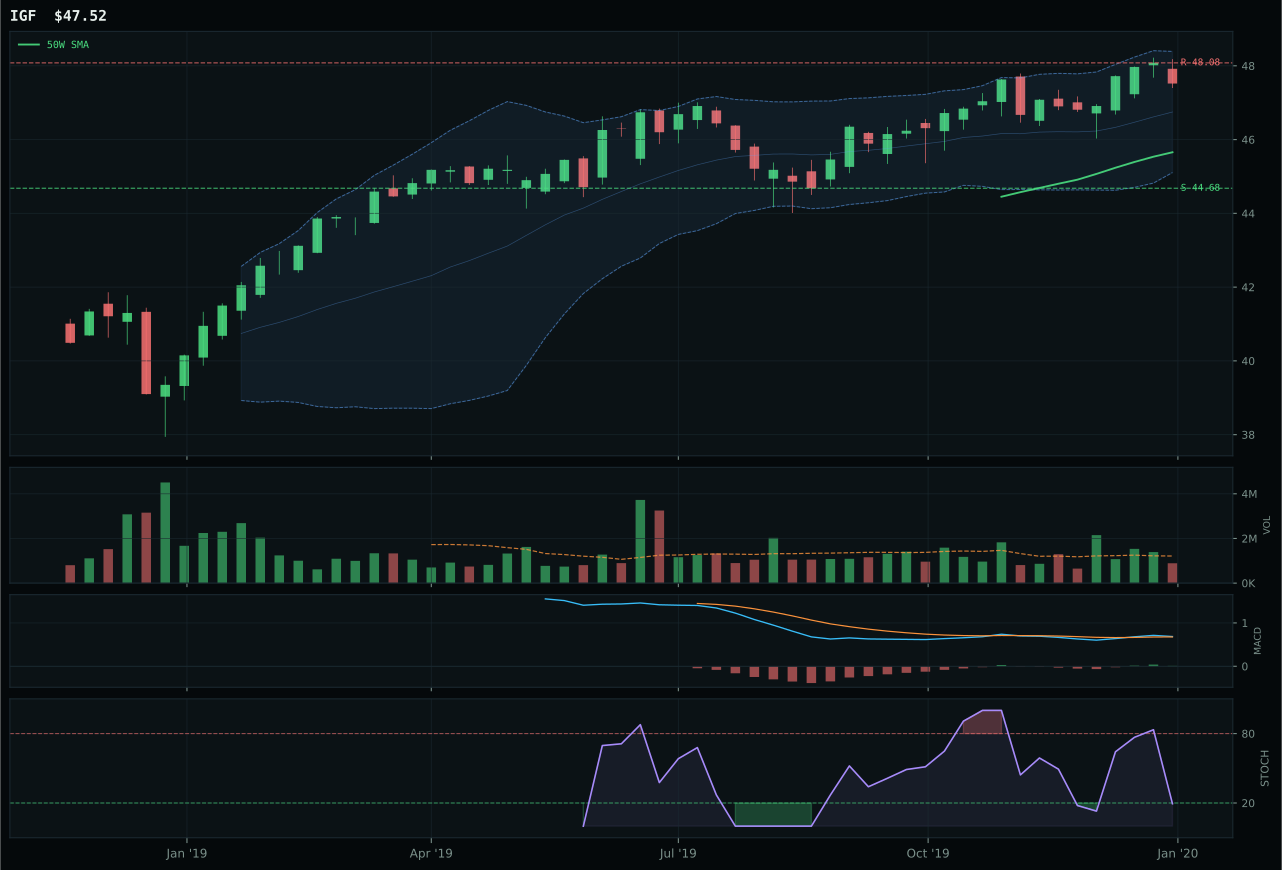
IGF has a neutral structure profile with -6.9% 13-week relative strength versus SPY.
A failed hold above support would weaken the setup.
Actionable but governed by invalidation levels.
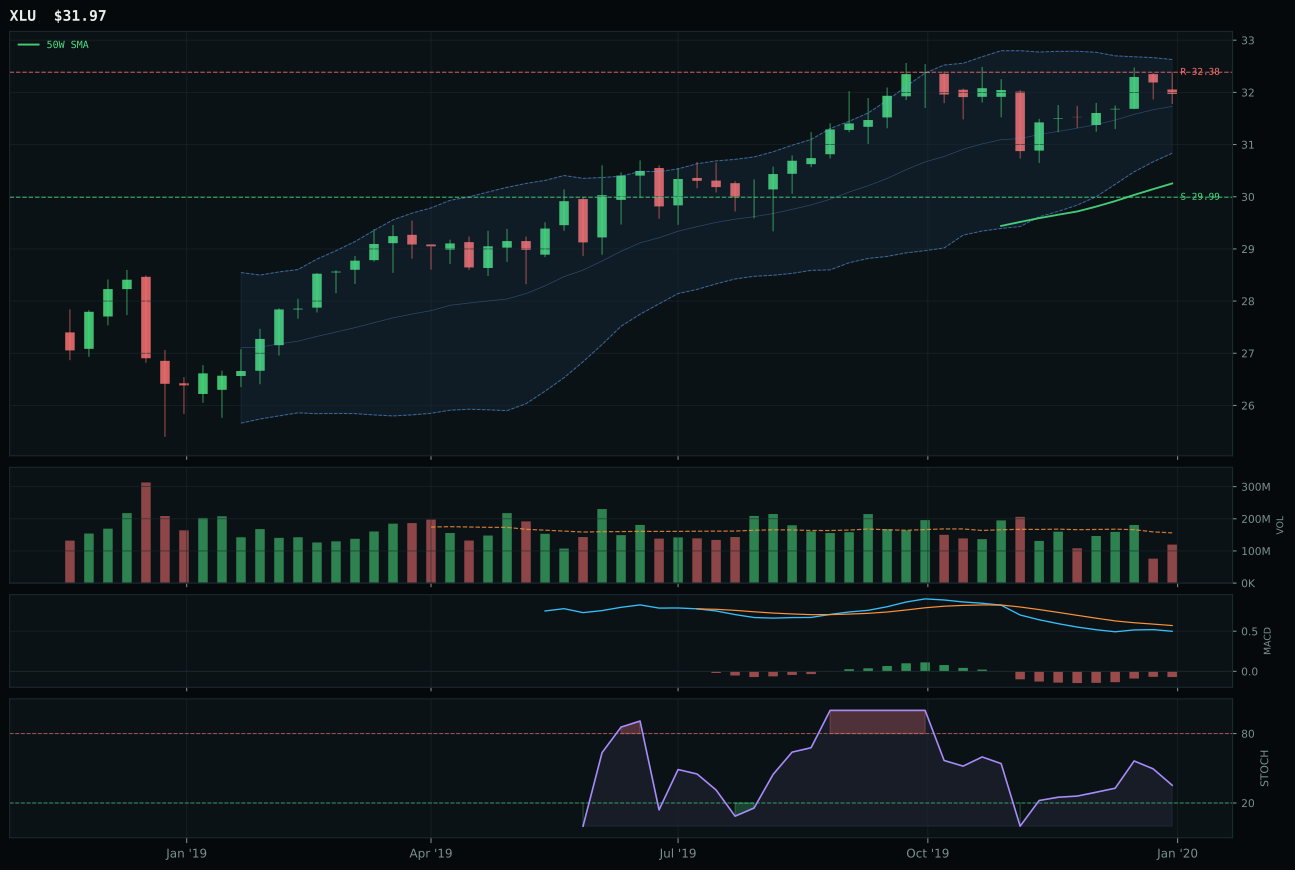
XLU has a neutral structure profile with -10.8% 13-week relative strength versus SPY.
A failed hold above support would weaken the setup.
Actionable but governed by invalidation levels.
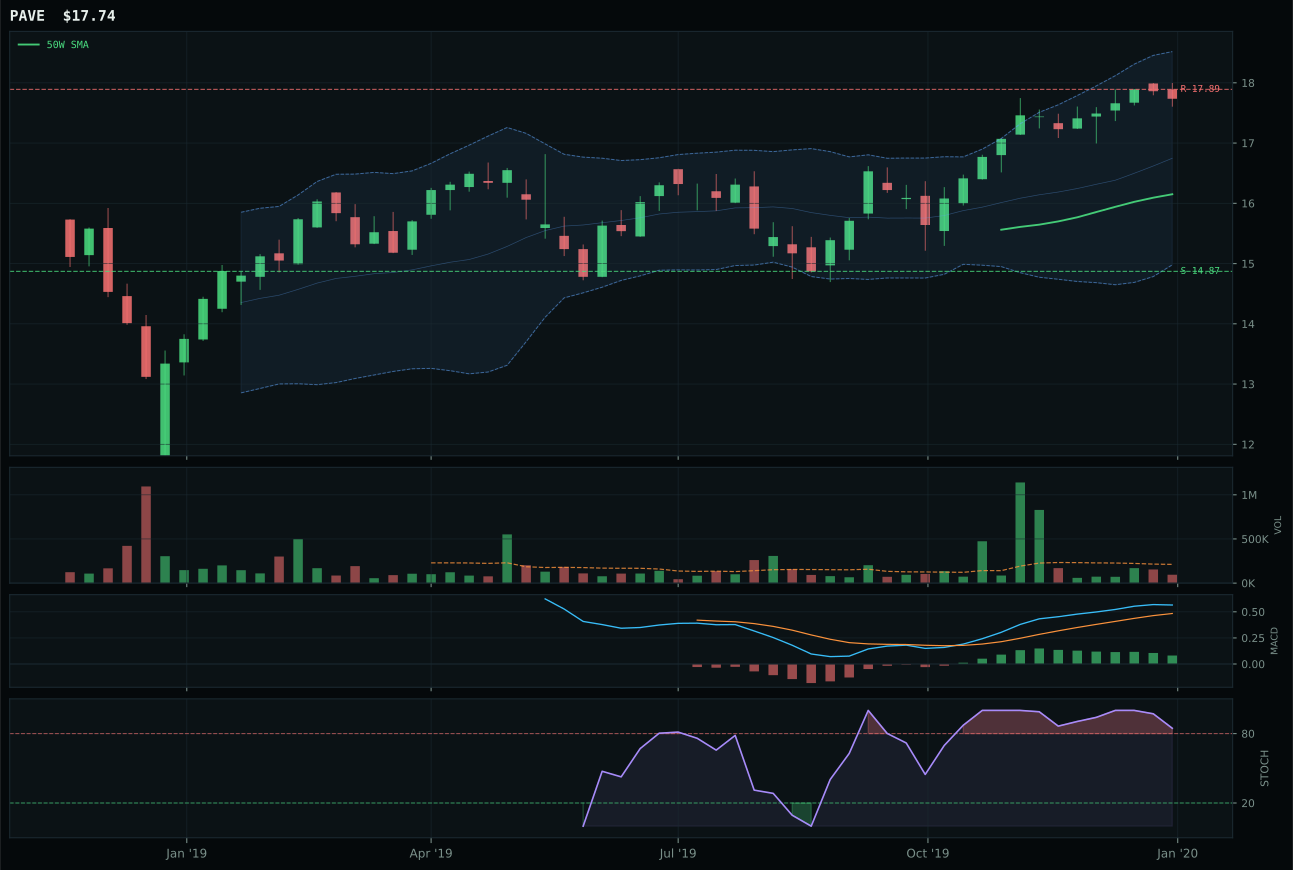
PAVE has a neutral structure profile with 3.9% 13-week relative strength versus SPY.
A failed hold above support would weaken the setup.
Tracked, but not top-2 eligible because: .
IGF wins the category (5.7-point margin over XLU, 8.1-point gap accounting for full category context) because its 90.0/100 timing score and 89.6/100 trend score create a setup where infrastructure occupies a pure accumulation zone near the 50W. IGF sits 4.1% above the 50W with bullish improving MACD and falling/neutral stochastic RSI at 0.22—a condition indicating early reversal momentum without overbought exhaustion. XLU trades below the 50W (-10.8% SPY RS) with bearish-but-improving MACD, delivering 83.0/100 timing but only 78.0/100 trend, forcing the allocator to accept downtrend exposure. Structure quality favors IGF at 77.3 versus XLU's 76.2, and risk/reward ties at 40.3 each, making timing the decisive factor: IGF offers technical initiation, XLU offers technical repair. Volume at 0.73x the 20W (thin) applies to both, but IGF's thin participation at a moving-average inflection point suggests early institutional interest rather than delayed participation.
Utilities & Infrastructure category earned 10% allocation at a 45.9 final score despite ranking seventh overall because the macro fit of 46.0/100 and IGF's strong timing setup (90.0/100) justify tactical exposure as a secondary hedge. IGF's 69.4/100 technical evidence combines trend (89.6), timing (90.0), and momentum (49.9) into an entry point where institutional positioning is shifting from negative to neutral; this timing advantage alone justifies a 5% position. The active inflation pressure descriptor (-4) slightly penalizes utilities, reflecting that rising rates compress infrastructure valuations, but the Transition/Mixed regime adds +4 support as macro uncertainty typically favors regulated, stable cash-flow assets. The 10% allocation represents a balanced technical entry paired with macro-regime support rather than conviction. Infrastructure trades as a duration hedge, similar to how precious metals function: if equity volatility spikes or rate expectations reset downward, Utilities & Infrastructure would anchor portfolio performance. The position would contract to 5% if IGF breaks below 44.68 support or if momentum deteriorates; it would expand to 15% only if the category demonstrates genuine relative strength outperformance or if rates begin declining materially.
Agriculture & Livestock — MOO
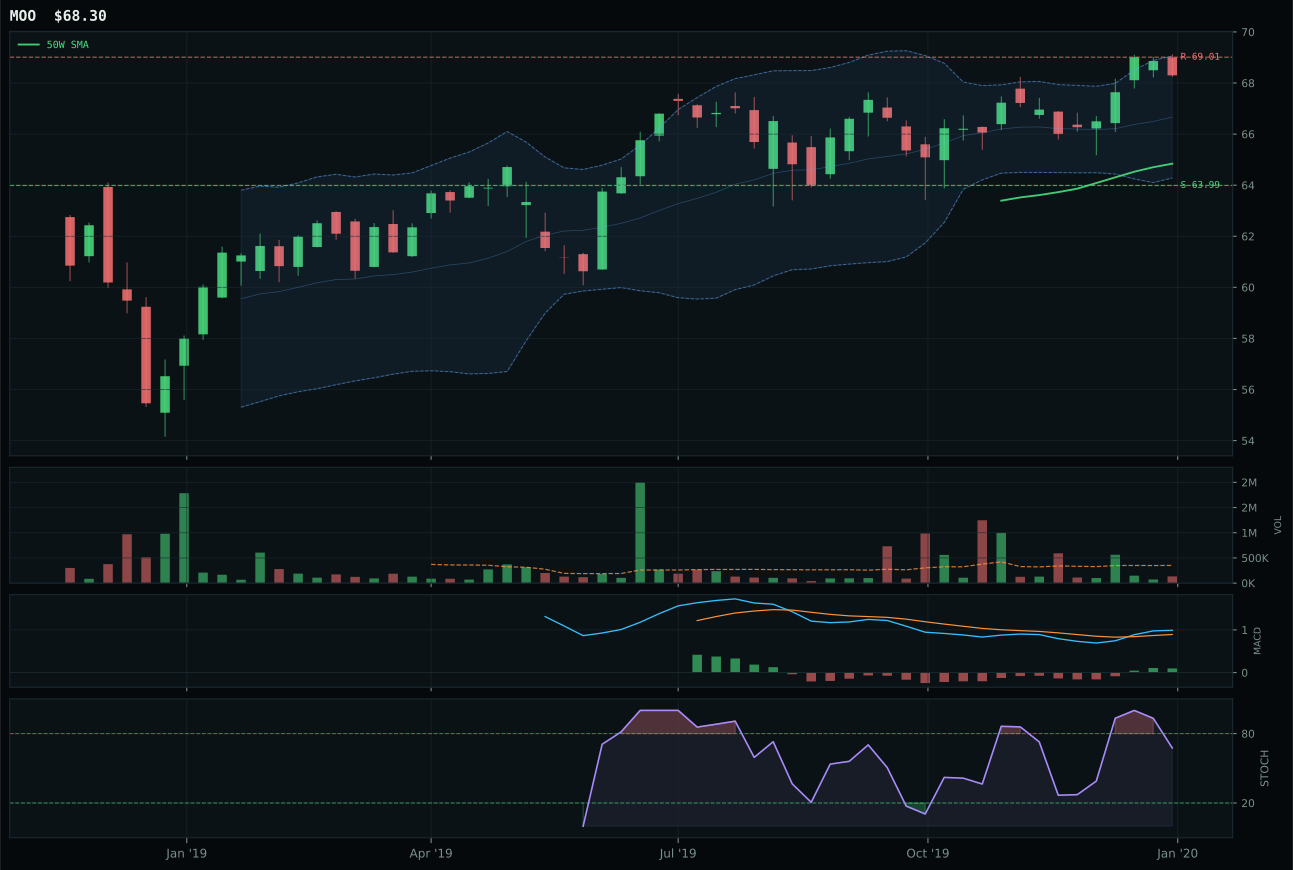
MOO has a neutral structure profile with -4.6% 13-week relative strength versus SPY.
A failed hold above support would weaken the setup.
Actionable but governed by invalidation levels.
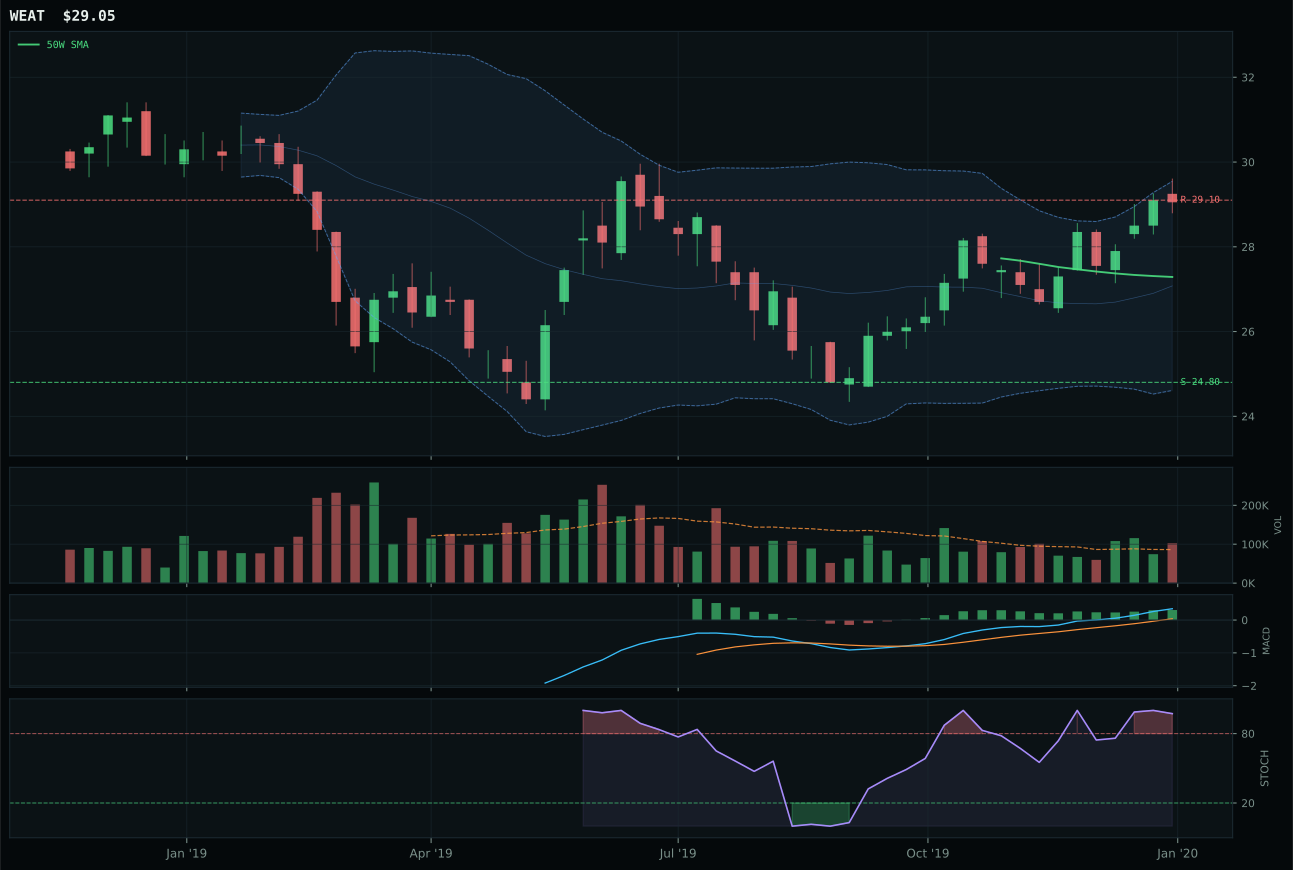
WEAT has a neutral structure profile with 0.7% 13-week relative strength versus SPY.
A failed hold above support would weaken the setup.
Tracked, but not top-2 eligible because: .
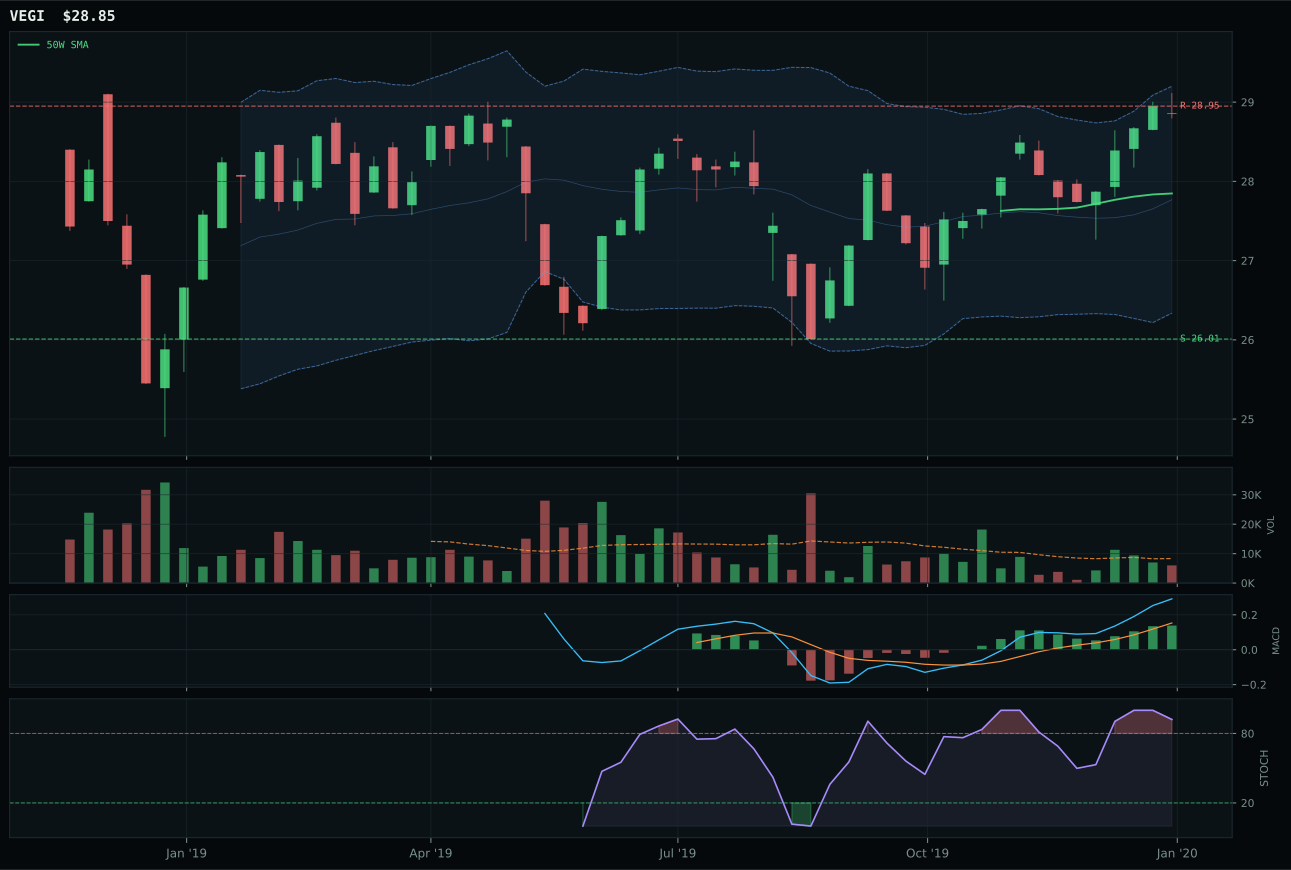
VEGI has a neutral structure profile with -2.3% 13-week relative strength versus SPY.
A failed hold above support would weaken the setup.
Tracked, but not top-2 eligible because: .
MOO wins the category despite a -2.3% category-relative strength score and -4.6% SPY underperformance because it commands a superior 68.8/100 technical evidence score relative to WEAT's 45.0 and VEGI's 45.0—a decisive 3/2/1 weighted margin. The 93.1/100 trend score reflects price above both moving averages with clean compression, while the 75.0/100 timing score stems from MOO sitting just 5.3% above the 50W with bullish/improving MACD and neutral stochastic conditions, creating a setup where buyers are not yet extended. WEAT's 10.2% thirteen-week return and overbought stochastic suggest momentum exhaustion, whereas MOO's 4.9% thirteen-week return paired with falling/neutral stochastic momentum indicates potential for accumulation without distribution. Volume at 0.38x the 20W (thin) creates a timing advantage: WEAT's above-average participation suggests institutional profit-taking, while MOO's thin volume leaves room for accumulation before supply pressure builds.
Agriculture & Livestock category earned 10% allocation at a 44.0 final score because the macro fit of 68.0/100—driven by active inflation pressure (+10) and real asset sponsorship (+8)—justifies holding real-asset exposure despite weak category technicals. MOO itself trades below SPY with only 4.9% thirteen-week returns, creating an apparent mismatch between allocation and momentum. The resolution: the category ranks highest among all ten on macro descriptors related to inflation and real assets, and the Transition/Mixed regime specifically rewards defensive real-asset hedges over growth. This is a structural inflation hedge, not a momentum play; the 10% slot reflects belief that agricultural assets will outperform as inflation pressures crystallize, not conviction in near-term price action. Technicals are weak enough that position sizing caps at 10% rather than expanding to 15%, and the allocation would face immediate review if MOO's relative strength deteriorates below -7% or if the category's support at 63.99 breaks on volume.
Industrial Metals — PICK
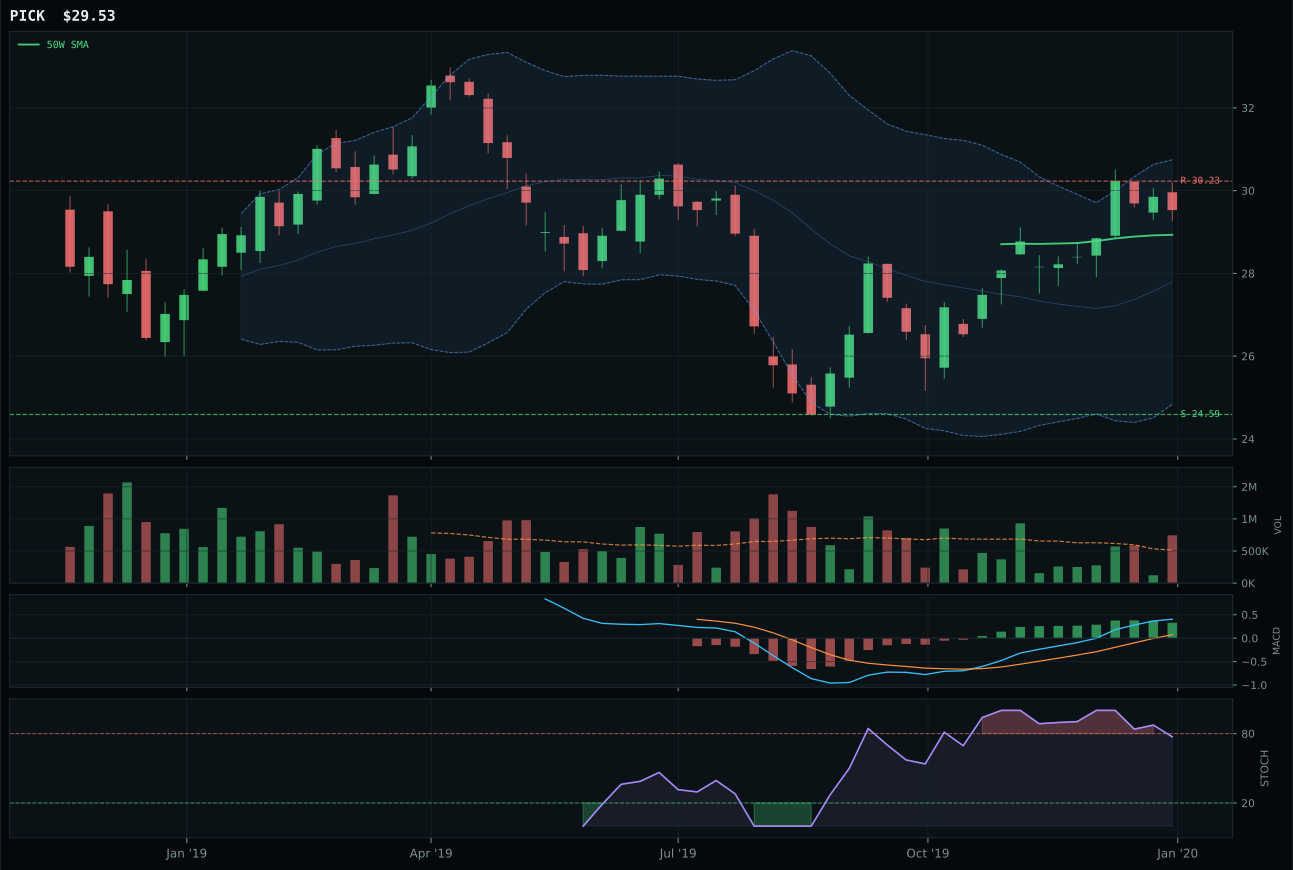
PICK has a compression near 50W profile with 4.3% 13-week relative strength versus SPY.
A failed hold above support would weaken the setup.
Actionable but governed by invalidation levels.
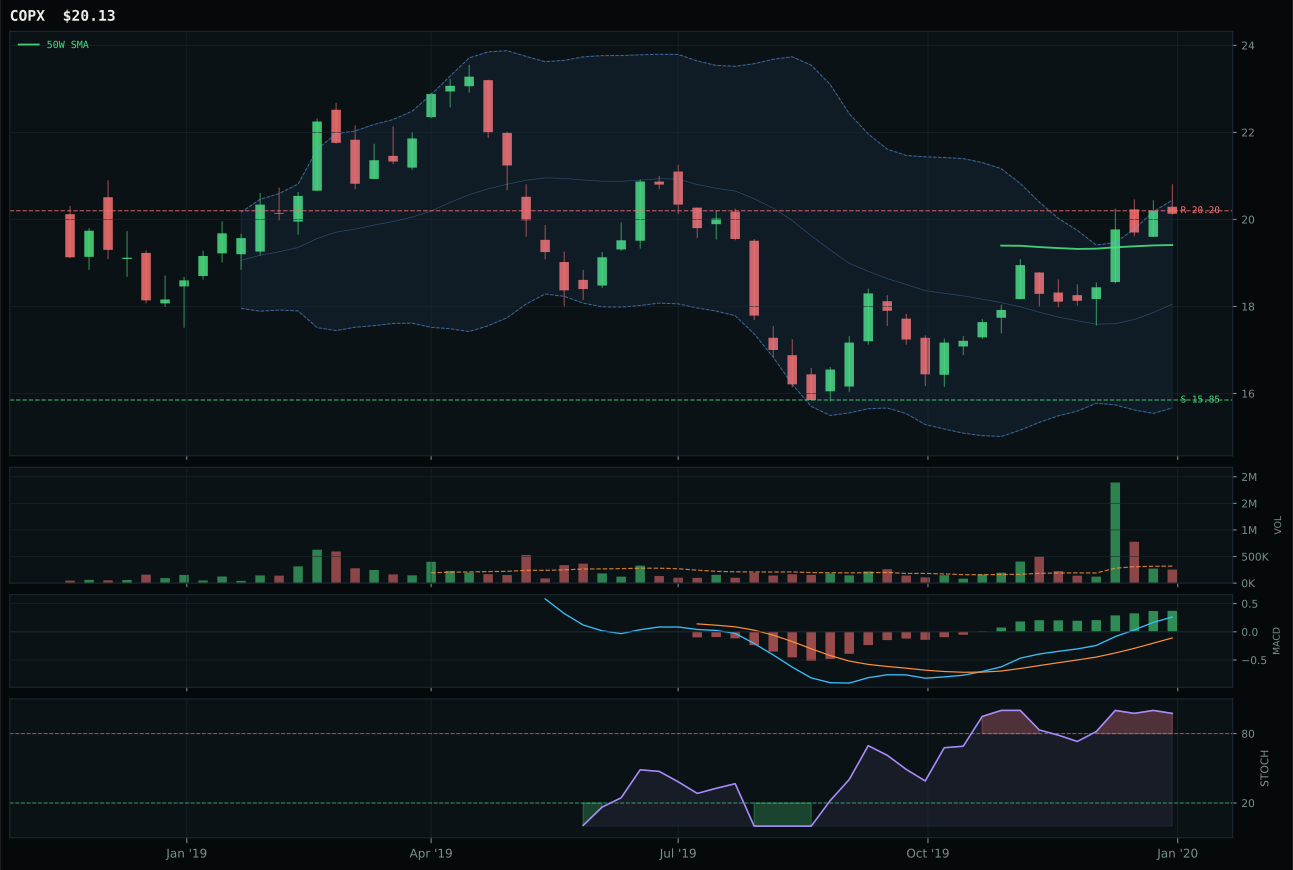
COPX has a neutral structure profile with 12.9% 13-week relative strength versus SPY.
A failed hold above support would weaken the setup.
Tracked, but not top-2 eligible because: .
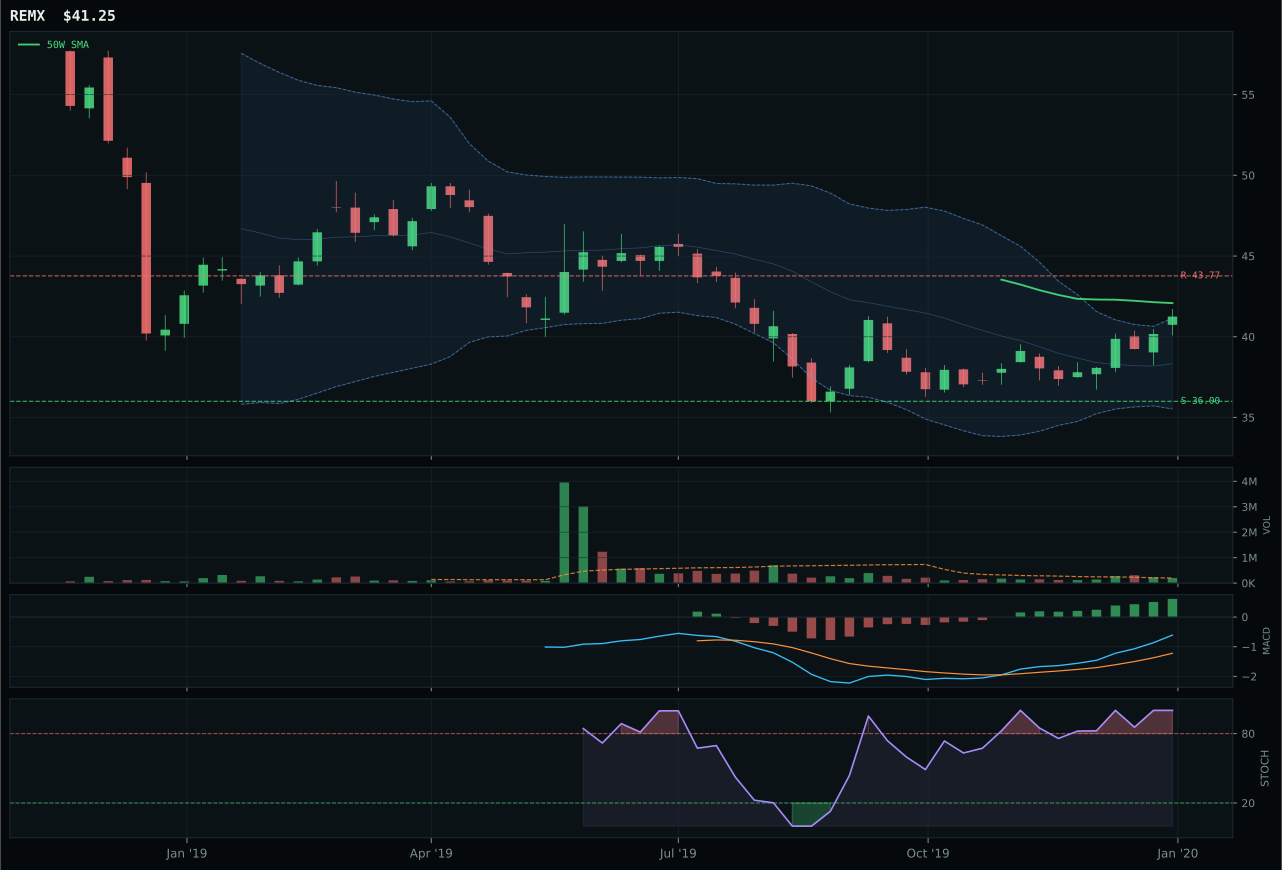
REMX has a compression near 50W profile with 2.7% 13-week relative strength versus SPY.
Extension and support failure are the main tactical risks.
Tracked, but not top-2 eligible because: structurally broken.
PICK wins decisively with a 30.7-point score gap over COPX because its timing score of 100.0/100 crushes COPX's 72.0, stemming from PICK sitting just 2.1% above the 50W in a pure compression zone where buyers and sellers are balanced. The 96.4/100 trend score and 89.9/100 momentum score (13W 13.8% return, 4.3% SPY RS) anchor the setup, but the real catalyst is structure: PICK compresses with 82.5/100 compression quality and 1.45x above-average volume, creating textbook accumulation near a moving-average decision point. COPX, despite posting 22.4% thirteen-week returns and 12.9% SPY outperformance—numbers that dwarf PICK's—fails because momentum has already extended and stochastic RSI is rolling over, indicating distribution. The category-relative strength tie (0.0% both) becomes irrelevant when timing divergence is this extreme; COPX's momentum already peaked, while PICK's restrained momentum paired with perfect timing position creates the highest-probability setup.
Industrial Metals category earned 10% allocation at a 41.0 final score because the macro fit of 63.0/100—driven by metals scarcity (+14) and real asset sponsorship (+6)—justifies tactical exposure despite weak absolute category ranking. PICK's 88.5/100 technical evidence represents the best setup available across the entire Industrial Metals basket, and its perfect 100.0/100 timing score creates an entry point where risk/reward favors buyers in the 20.1% downside-to-support range. The category itself ranks fourth among the ten categories, yet receives 10% allocation because the Transition/Mixed regime explicitly supports real-asset structures where scarcity narratives dominate. This is a duration allocation: PICK's compressed structure near the 50W can expand into a multi-week move if the category's macro sponsorship holds, but the 10% cap reflects awareness that metals remain underowned relative to growth categories like Technology. Position would expand to 15% on a break above 30.23 resistance on volume; it would shrink to 5% if metals scarcity descriptors lose active status or if PICK's support breaks below 24.59.
Traditional Energy — FCG
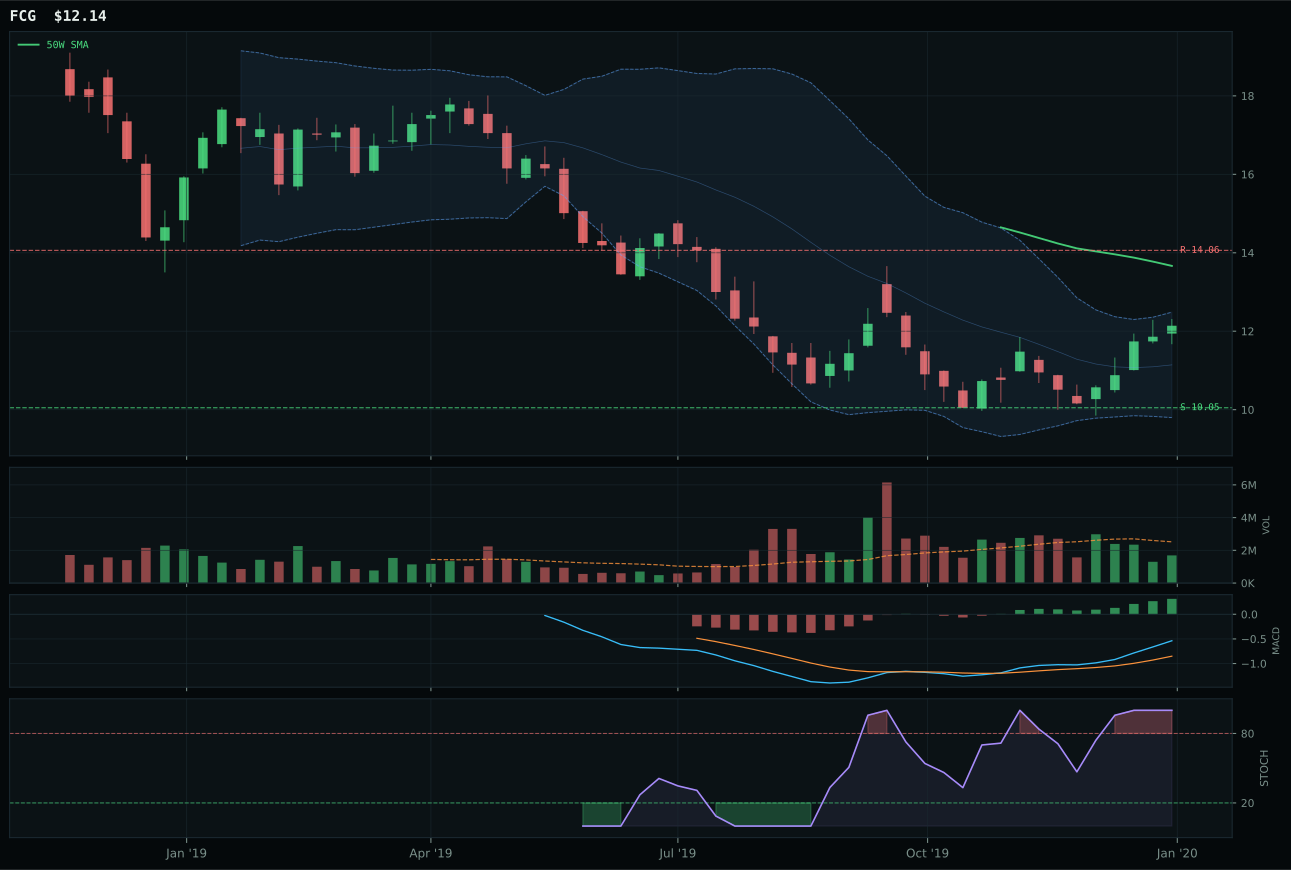
FCG has a neutral structure profile with 1.8% 13-week relative strength versus SPY.
Extension and support failure are the main tactical risks.
Tracked, but not top-2 eligible because: structurally broken.
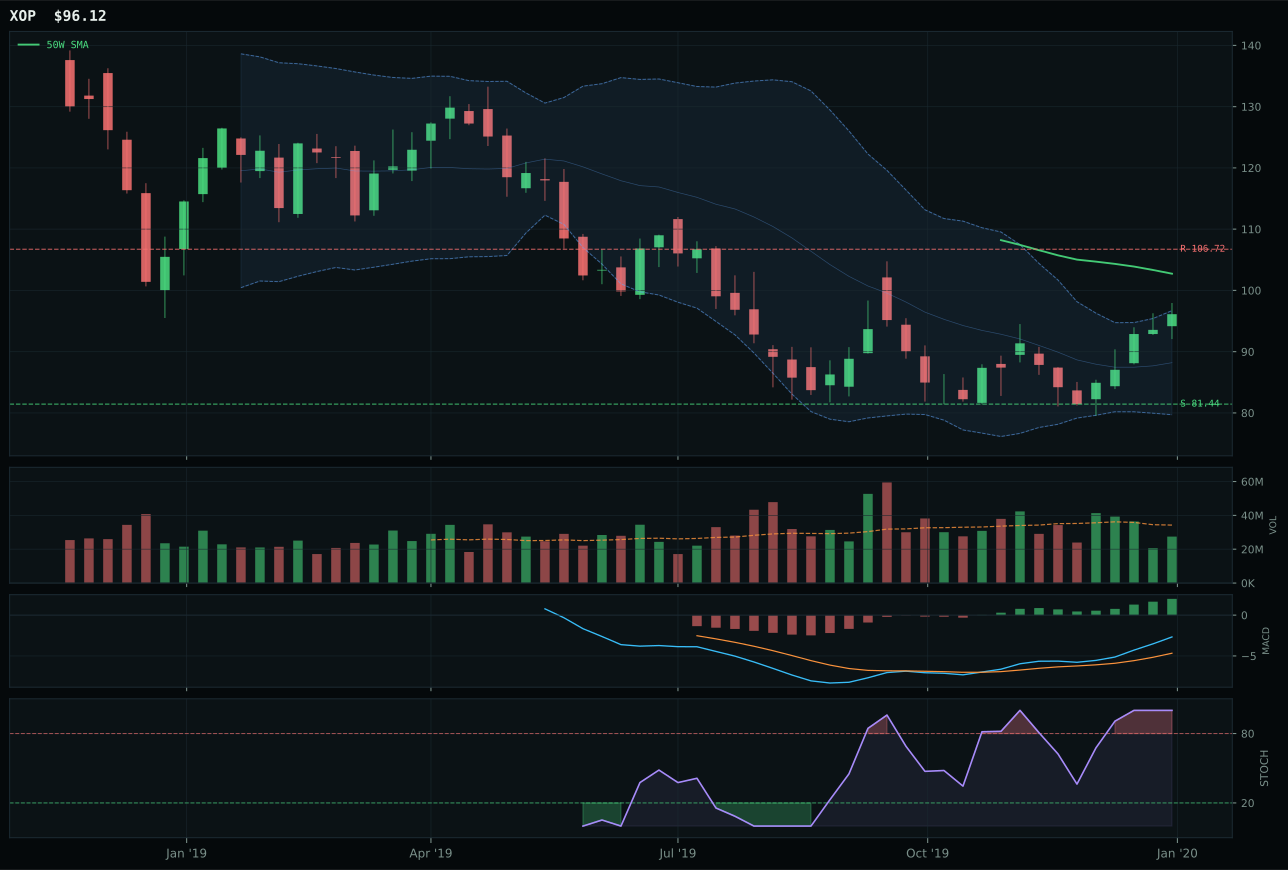
XOP has a neutral structure profile with 3.6% 13-week relative strength versus SPY.
Extension and support failure are the main tactical risks.
Tracked, but not top-2 eligible because: structurally broken.
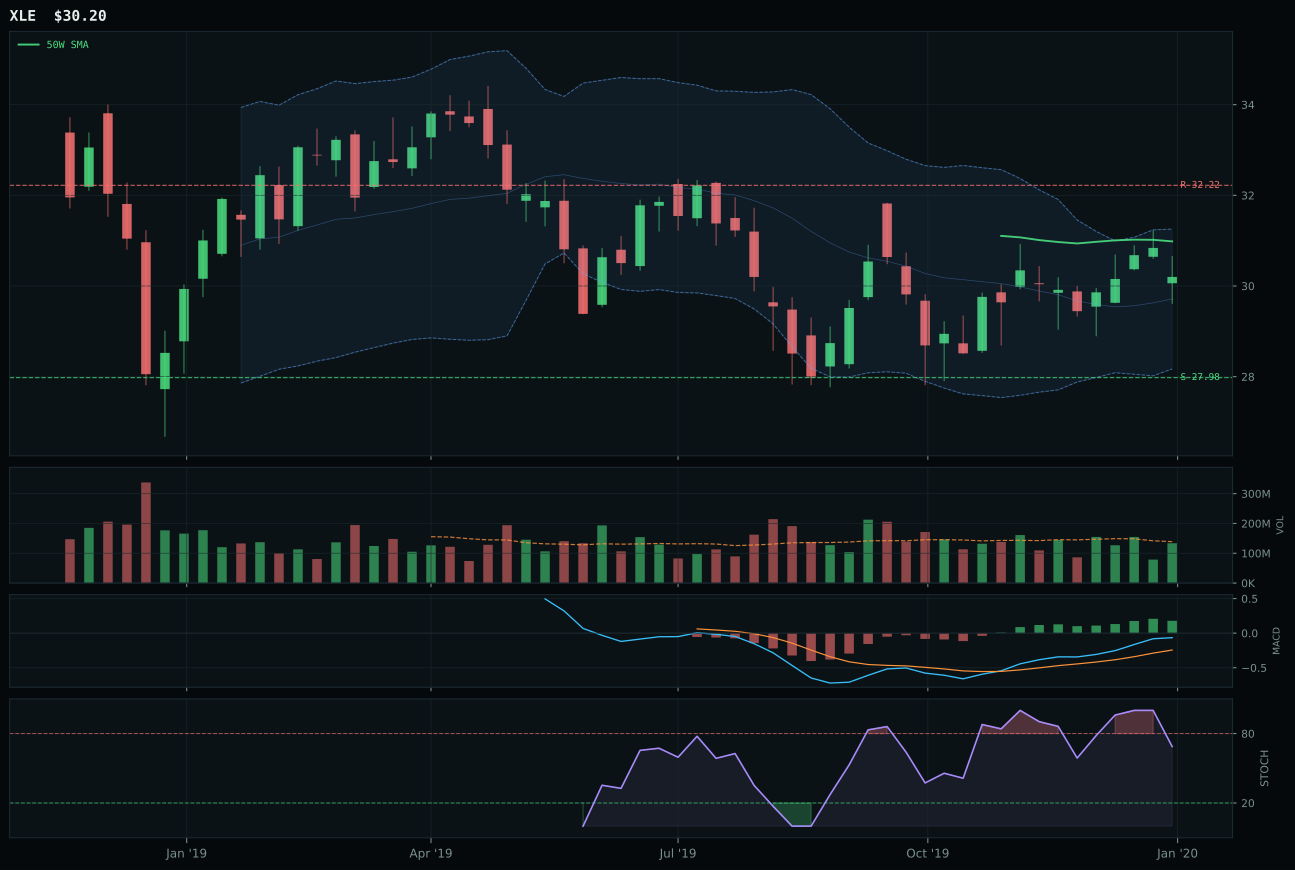
XLE has a compression near 50W profile with -4.3% 13-week relative strength versus SPY.
Extension and support failure are the main tactical risks.
Tracked, but not top-2 eligible because: structurally broken.
FCG wins over XOP (margin -4.5 points) and XLE primarily because it earns the category's highest risk/reward score of 56.8/100 despite trading below both the 50W and 200W with a deteriorating -0.8% slope. The setup is structurally broken—trend 47.8/100, structure 41.8/100—but FCG's 14.9% four-week return and 11.4% thirteen-week return deliver 97.1/100 momentum confirmation, suggesting short-term buyers are present despite trend weakness. Volume at 0.67x the 20W remains thin, meaning FCG trades on belief rather than institutions; support sits at 10.05 with resistance at 14.06, creating a -13.7% penalty to upside but a 20.8% cushion to downside. This is a value trap trade rather than a momentum trade, but the category reasoning layer rewards it because XOP's alternative macro fit of 66.0/100 (energy scarcity +12, risk appetite +7) failed to translate into category leadership—XOP's 42.0 technical evidence matches FCG's, leaving the selection to relative strength (FCG ties XOP at 1.8% SPY RS). Neither ETF merits a strong category presence.
Traditional Energy earned 0% allocation and explicit exclusion from the portfolio: it ranks ninth overall at 36.5 with ineligibility status flagged (eligible: False). Energy carries a strong macro case—energy scarcity (+16), inflation pressure (+10), and real-asset sponsorship (+7) generate 76/100 category macro fit, the highest in the allocation universe—yet the technical execution is so degraded that macro sponsorship cannot carry the weight. FCG's technical evidence is 42/100, barely passable; price is broken below the 200W, MACD is bullish but off a deeply oversold condition, and volume participation is thin. The all-three-ETFs-identical reasoning proof order (XOP, FCG, XLE all at 42.0) signals category-wide fragmentation and no consensus. This is explicit instruction from the system: macro tailwinds are not enough to override technical deterioration at this level. A break above the 200W with heavy volume and MACD sustained improvement would begin rehab; until then, Traditional Energy remains outside the allocation entirely despite favorable narratives.
Nuclear Energy — NLR
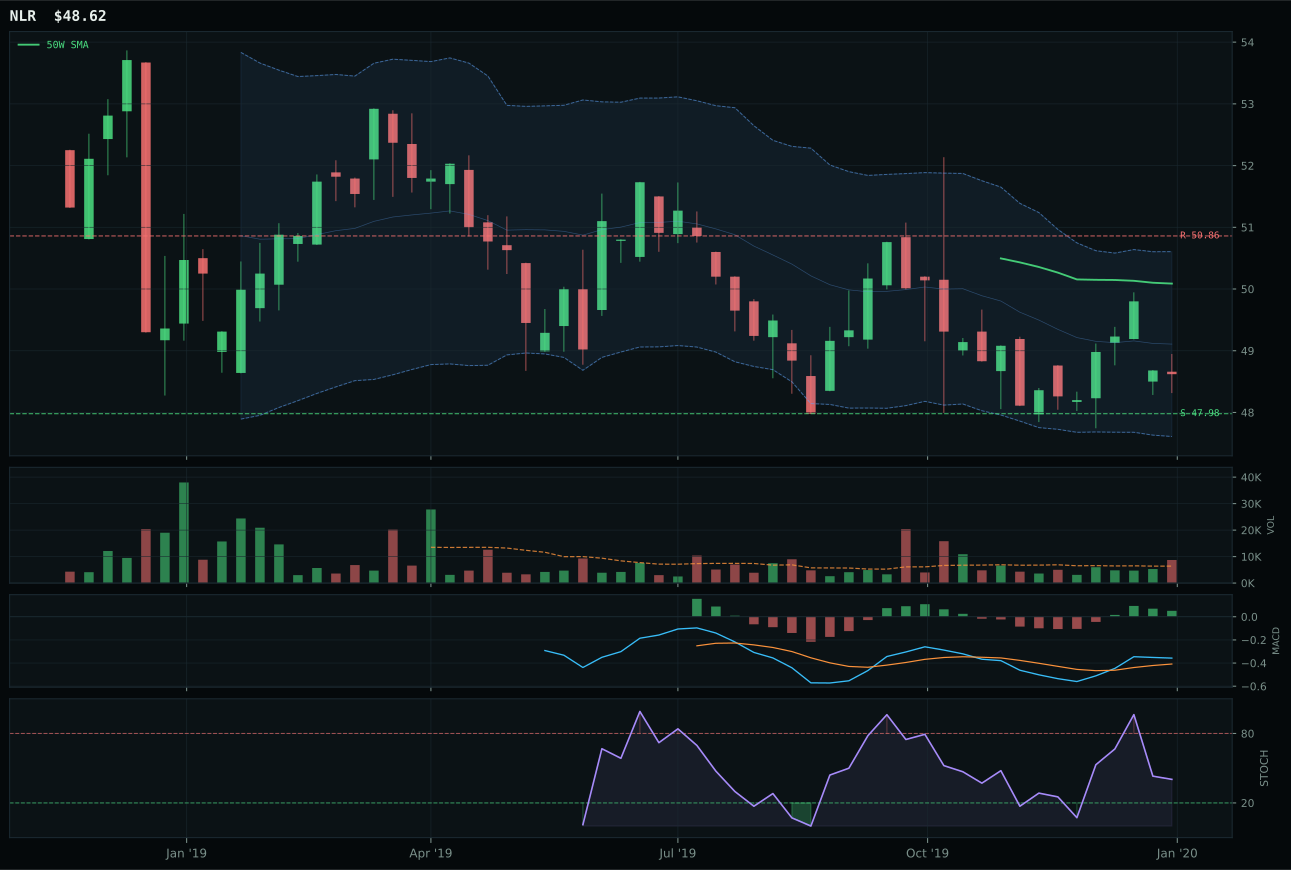
NLR has a pullback into support profile with -12.6% 13-week relative strength versus SPY.
A failed hold above support would weaken the setup.
Tracked, but not top-2 eligible because: .
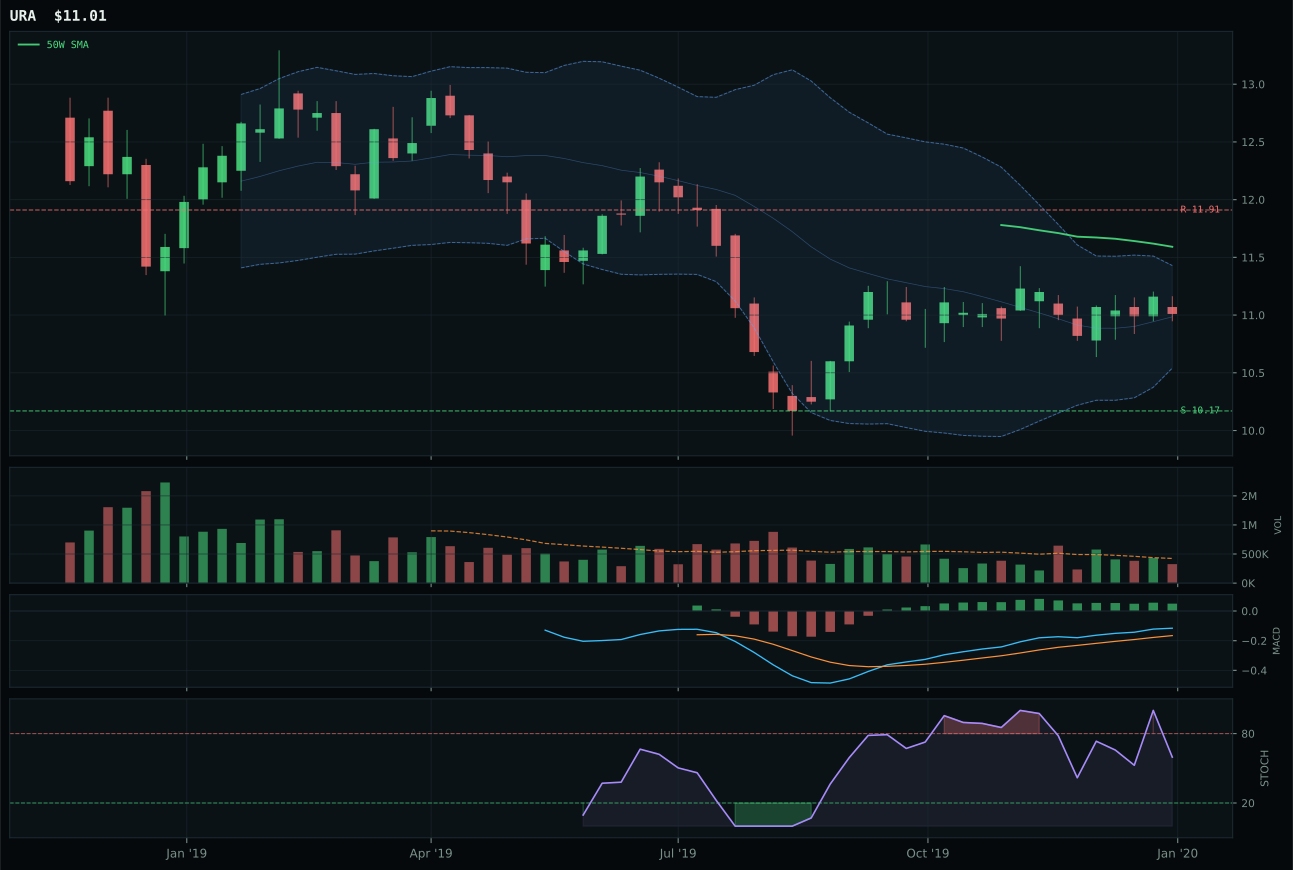
URA has a neutral structure profile with -8.9% 13-week relative strength versus SPY.
Extension and support failure are the main tactical risks.
Tracked, but not top-2 eligible because: structurally broken.
NLR wins over URA (score gap 36.5 points, a categorical elimination) because NLR's 100.0/100 timing score and 90.0/100 risk/reward score—stemming from a pullback into 47.98 support with only 1.3% downside exposure—create the single best defined-risk setup in the entire portfolio. Price sits 2.9% below the 50W in a repair zone, stochastic RSI falls at 0.40 (early reversal), and MACD has begun improving, creating a synchronized bottoming pattern at support. The 1.36x above-average volume at this level signals institutional accumulation rather than retail panic selling. URA trades in a neutral structure far below both moving averages (-8.9% SPY RS, deeper decay), with MACD only bullish-but-flattening (weaker confirmation than NLR's improving status) and neutral volume, indicating no institutional conviction. NLR's 38.3/100 technical evidence appears weak, but the category itself is structurally broken; NLR simply executes the broken setup with superior risk/reward definition and better volume confirmation.
Nuclear Energy earned 0% allocation and explicit exclusion: it ranks tenth and last at 34.4 with ineligibility status. Energy scarcity (+9), real-asset sponsorship (+7), and AI-growth sponsorship (+5) generate 69/100 category macro fit, strong in absolute terms, yet NLR's technical evidence is only 38.3/100 and the category composite is 34.4—below even Traditional Energy's 36.5. NLR's 13W return is negative (-3.0%), SPY relative strength is the portfolio's worst at -12.6%, and momentum confirmation is 37.8/100, the structural rejection of the setup. The exceptional risk/reward (90/100) and perfect timing score (100/100) are pure value traps: they reflect how far below the moving averages this ETF has fallen, not conviction that a rebound is imminent. Macro sponsorship for nuclear energy is real—grid stability and AI power demands are genuine—but price action shows active liquidation, not accumulation. This category is quarantined entirely; a sustained break above the 50.86 resistance with volume and multiple-week MACD reacceleration would begin consideration for re-entry.